


Responding to ACL Injury and its Treatments: Comparative Gene Expression between Articular Cartilage and Synovium


Abstract
1. Introduction
2. Materials and Methods
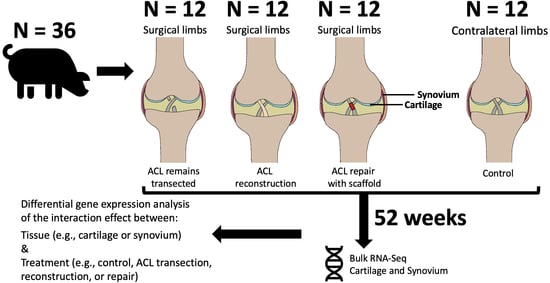
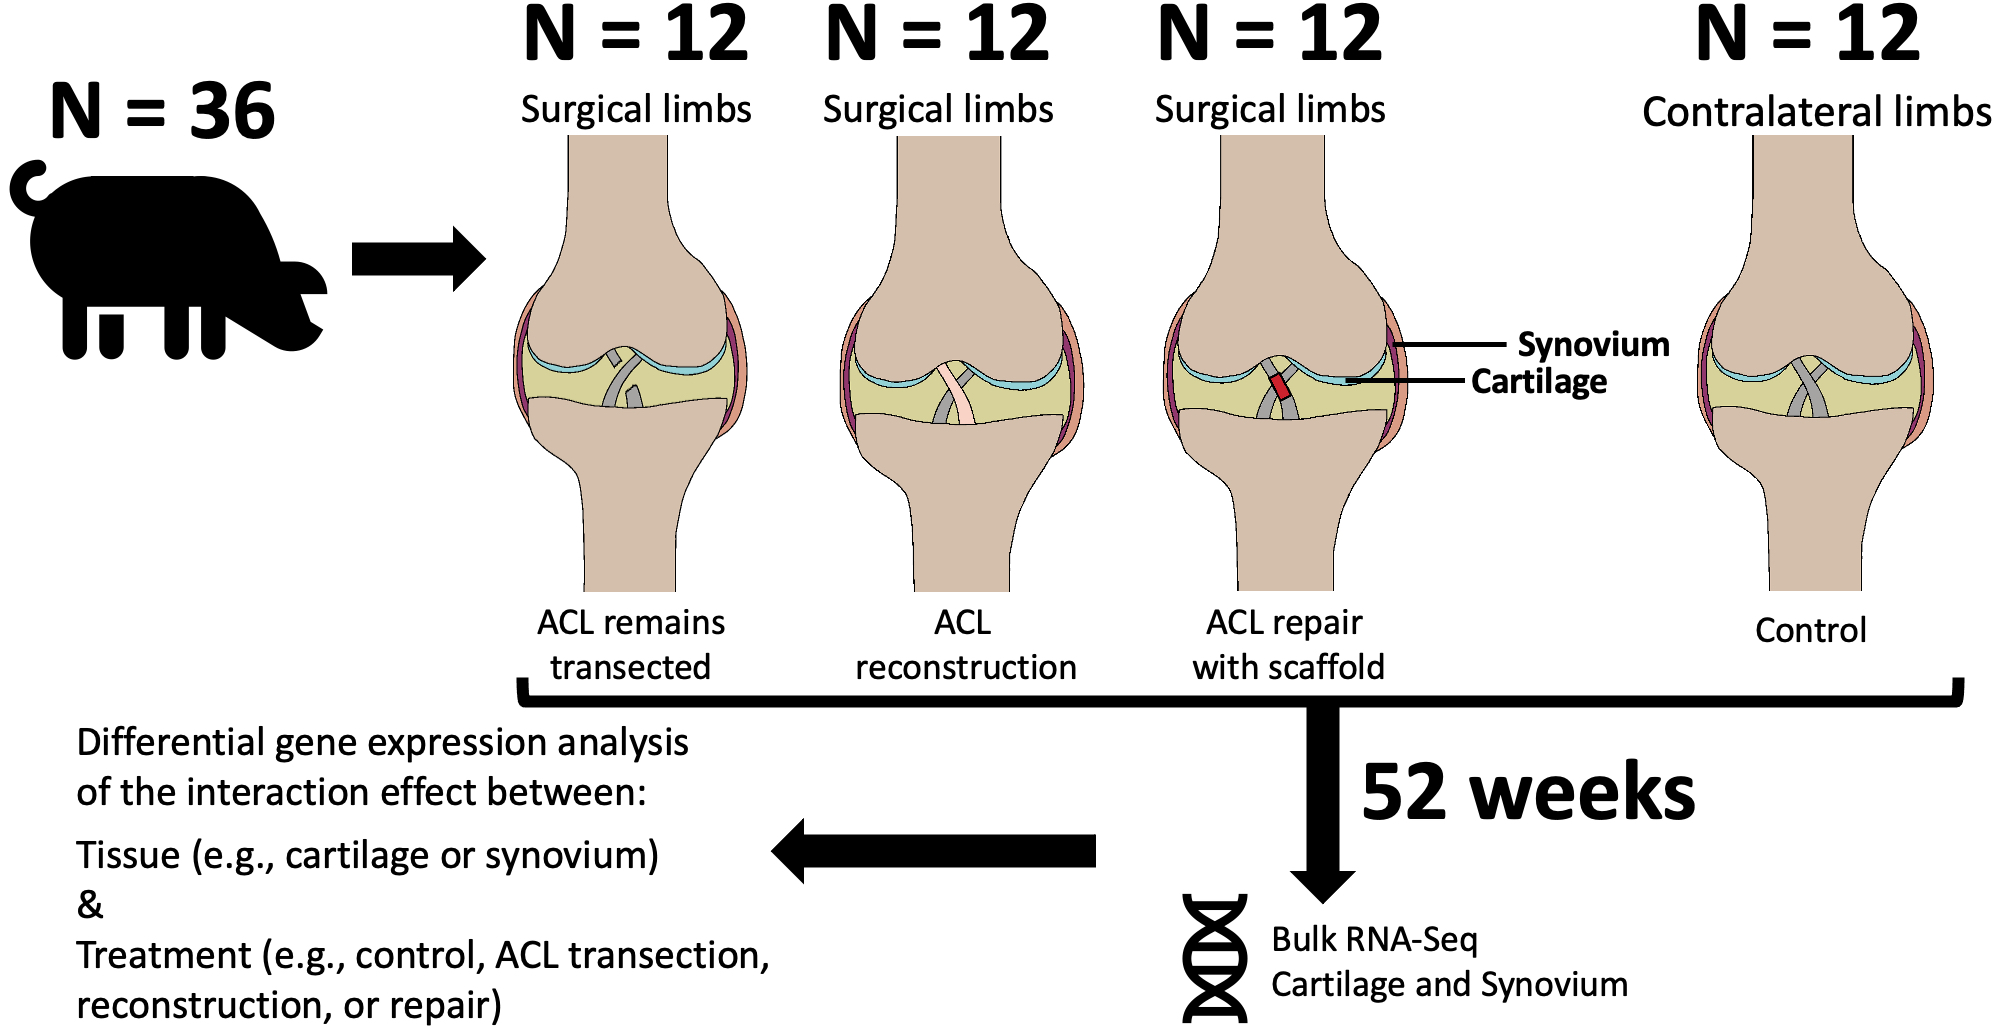
2.1. Study Design
2.2. Extraction of Articular Cartilage and Synovium
2.3. Articular Cartilage and Synovium RNA-Seq
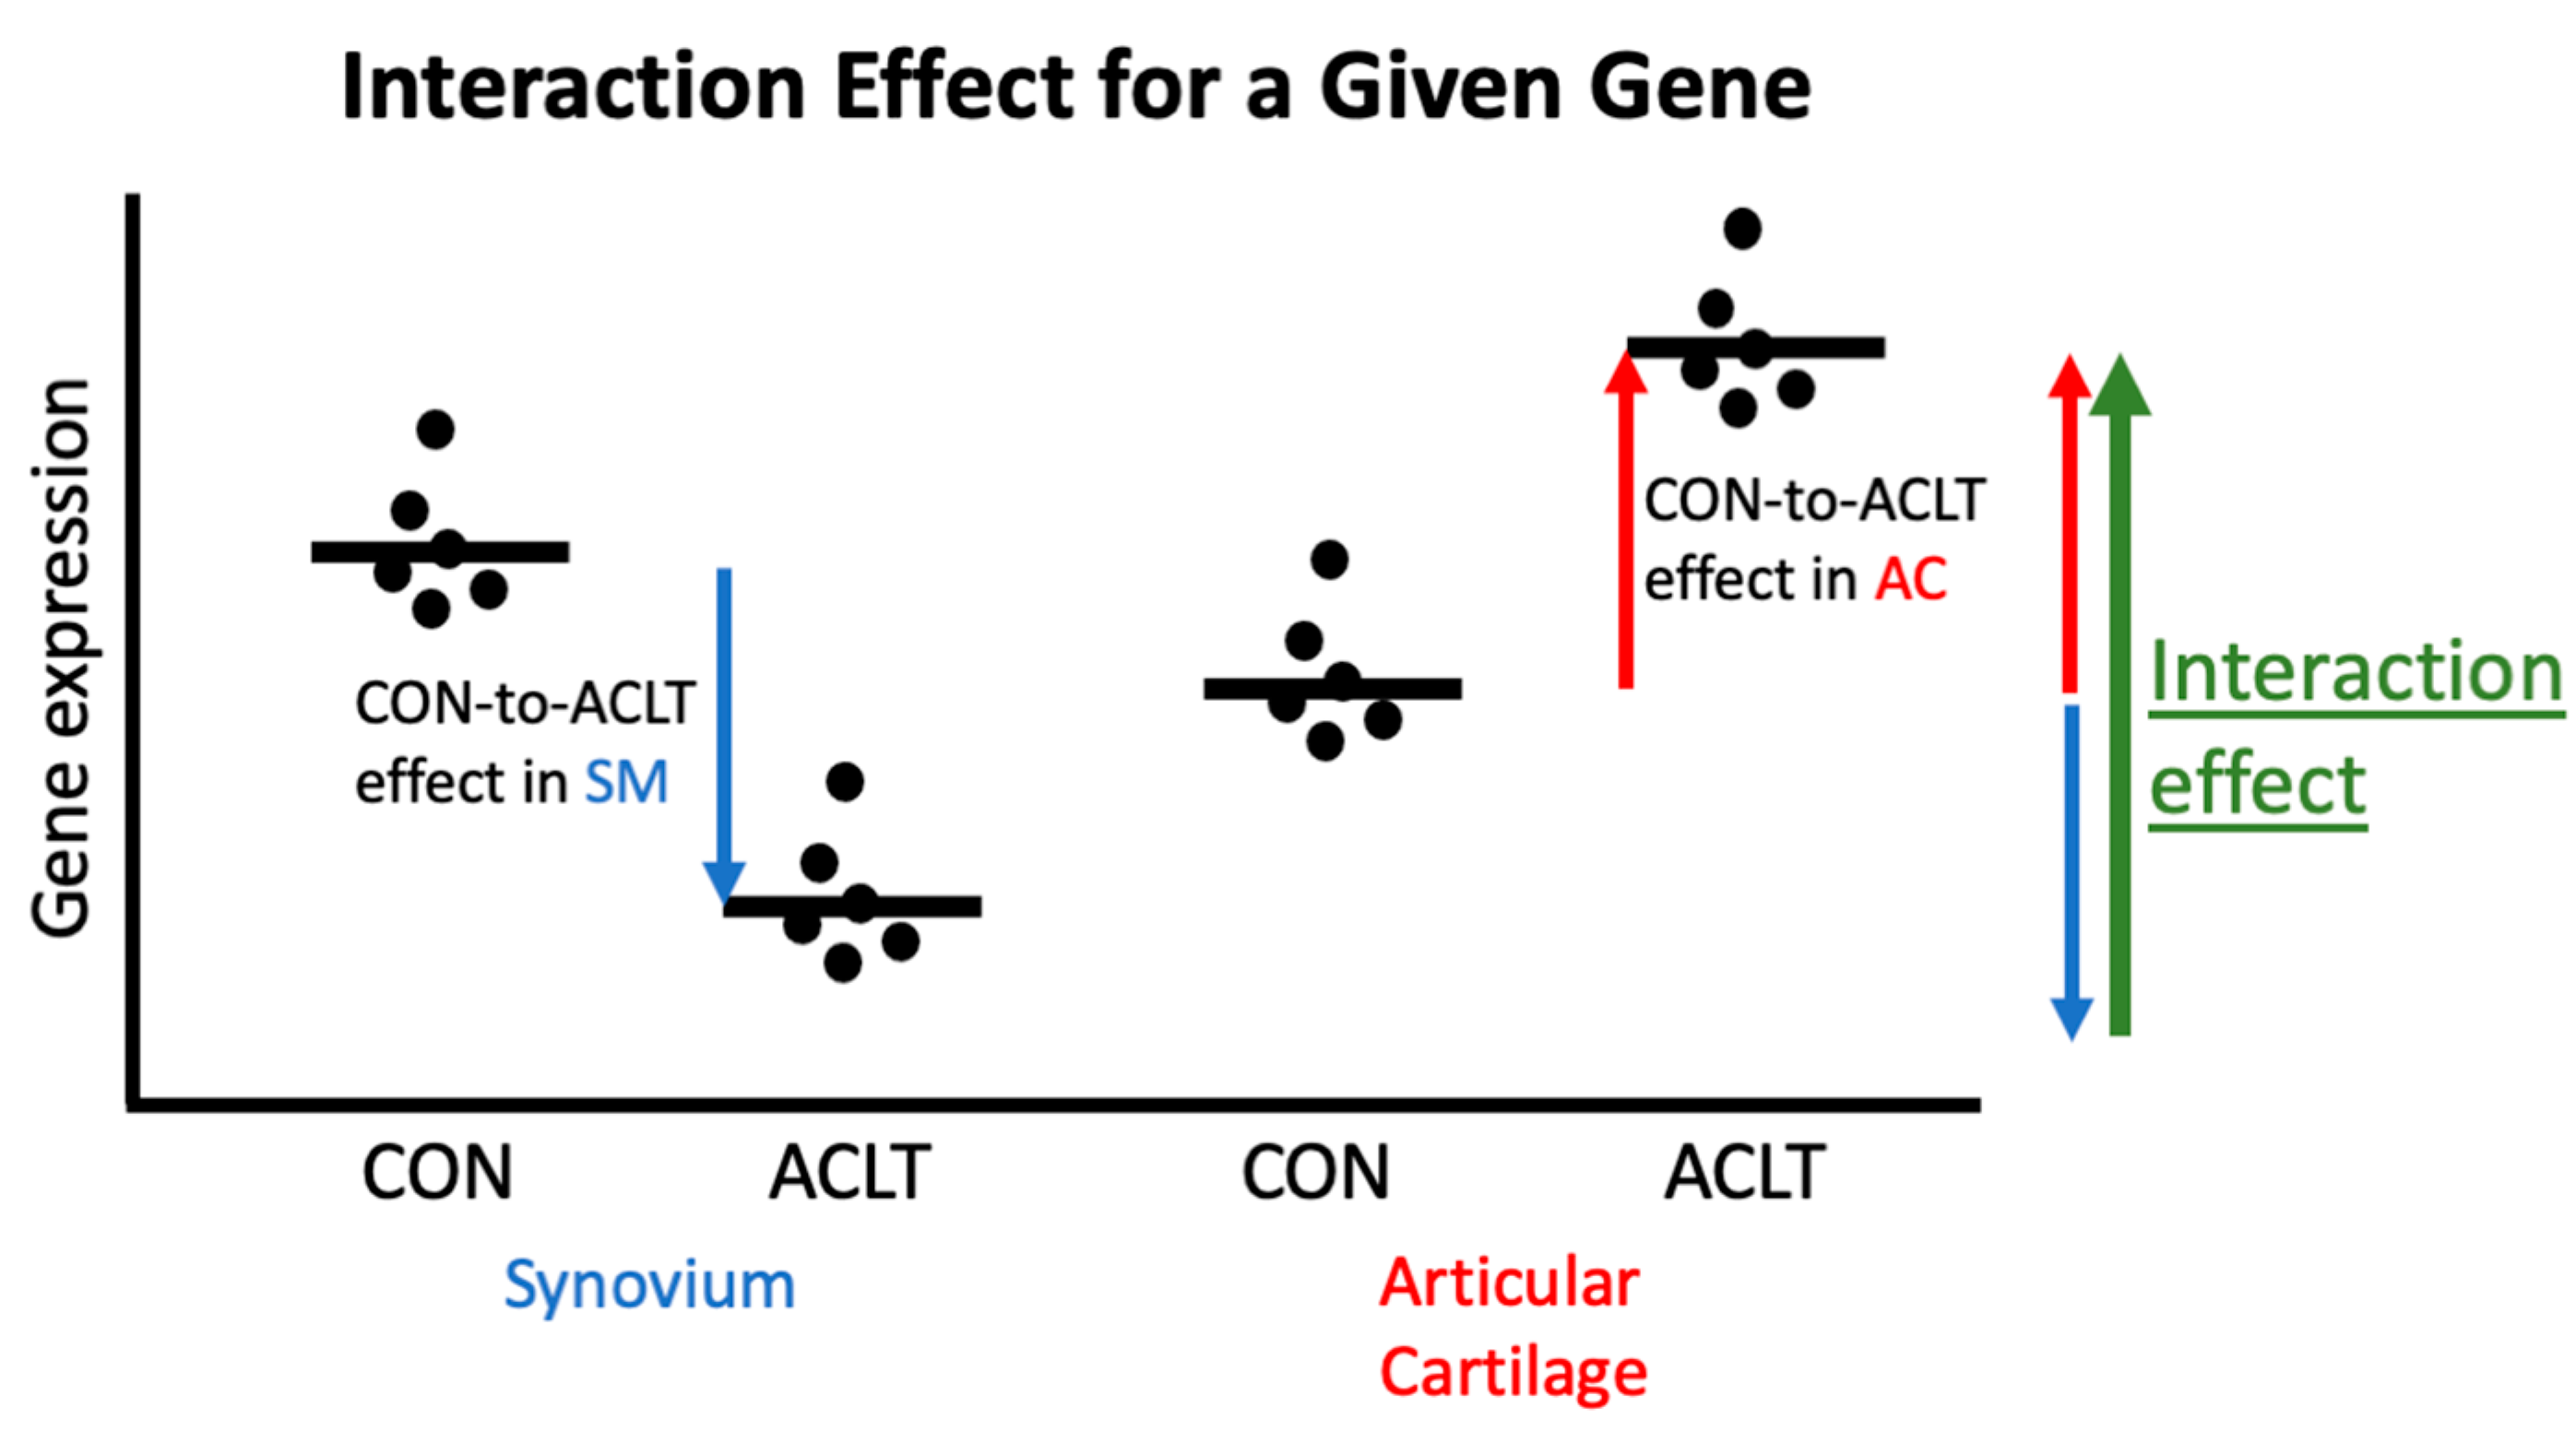
2.4. Statistical Analysis
2.5. Differential Gene Expression Analysis
2.6. Functional Pathway Analysis
3. Results
3.1. Differential Gene Expression Analysis by Experimental Group
3.2. Functional Pathway Analysis with Control Samples as Baseline
3.3. Functional Pathway Analysis with Experimental Groups as Baseline
4. Discussion
Supplementary Materials
Author Contributions
Funding
Institutional Review Board Statement
Informed Consent Statement
Data Availability Statement
Acknowledgments
Conflicts of Interest
References
- Hunter, D.J.; Schofield, D.; Callander, E. The individual and socioeconomic impact of osteoarthritis. Nat. Rev. Rheumatol. 2014, 10, 437–441. [Google Scholar] [CrossRef] [PubMed]
- Perruccio, A.V.; Power, J.D.; Badley, E.M. Revisiting arthritis prevalence projections—It’s more than just the aging of the population. J. Rheumatol. 2006, 33, 1856–1862. [Google Scholar] [PubMed]
- Agel, J.; Rockwood, T.; Klossner, D. Collegiate ACL Injury Rates Across 15 Sports: National Collegiate Athletic Association Injury Surveillance System Data Update (2004–2005 Through 2012–2013). Clin. J. Sport. Med. 2016, 26, 518–523. [Google Scholar] [CrossRef]
- Narez, G.E.; Fischenich, K.M.; Donahue, T.L.H. Experimental animal models of post-traumatic osteoarthritis of the knee. Orthop. Rev. 2020, 12, 8448. [Google Scholar] [CrossRef] [PubMed]
- Matyas, J.R.; Atley, L.; Ionescu, M.; Eyre, D.R.; Poole, A.R. Analysis of cartilage biomarkers in the early phases of canine experimental osteoarthritis. Arthritis Rheum. 2004, 50, 543–552. [Google Scholar] [CrossRef]
- Sandy, J.D.; Adams, M.E.; Billingham, M.E.; Plaas, A.; Muir, H. In vivo and in vitro stimulation of chondrocyte biosynthetic activity in early experimental osteoarthritis. Arthritis Rheum. 1984, 27, 388–397. [Google Scholar] [CrossRef]
- Killian, M.L.; Isaac, D.I.; Haut, R.C.; Déjardin, L.M.; Leetun, D.; Donahue, T.L. Traumatic anterior cruciate ligament tear and its implications on meniscal degradation: A preliminary novel lapine osteoarthritis model. J. Surg. Res. 2010, 164, 234–241. [Google Scholar] [CrossRef]
- Fischenich, K.M.; Button, K.D.; DeCamp, C.; Haut, R.C.; Donahue, T.L. Comparison of two models of post-traumatic osteoarthritis; temporal degradation of articular cartilage and menisci. J. Orthop. Res. 2017, 35, 486–495. [Google Scholar] [CrossRef]
- Tochigi, Y.; Vaseenon, T.; Heiner, A.D.; Fredericks, D.C.; Martin, J.A.; Rudert, M.J.; Hillis, S.L.; Brown, T.D.; McKinley, T.O. Instability dependency of osteoarthritis development in a rabbit model of graded anterior cruciate ligament transection. J. Bone Joint Surg. Am. 2011, 93, 640–647. [Google Scholar] [CrossRef]
- Sniekers, Y.H.; Intema, F.; Lafeber, F.P.; Van Osch, G.J.; Van Leeuwen, J.P.; Weinans, H.; Mastbergen, S.C. A role for subchondral bone changes in the process of osteoarthritis; a micro-CT study of two canine models. BMC Musculoskelet. Disord. 2008, 9, 20. [Google Scholar] [CrossRef]
- Karamchedu, N.P.; Murray, M.M.; Sieker, J.T.; Proffen, B.L.; Portilla, G.; Costa, M.Q.; Molino, J.; Fleming, B.C. Bridge-Enhanced Anterior Cruciate Ligament Repair Leads to Greater Limb Asymmetry and Less Cartilage Damage Than Untreated ACL Transection or ACL Reconstruction in the Porcine Model. Am. J. Sport. Med. 2021, 49, 667–674. [Google Scholar] [CrossRef] [PubMed]
- Murray, M.M.; Fleming, B.C. Use of a bioactive scaffold to stimulate anterior cruciate ligament healing also minimizes posttraumatic osteoarthritis after surgery. Am. J. Sport. Med. 2013, 41, 1762–1770. [Google Scholar] [CrossRef] [PubMed]
- Percie du Sert, N.; Hurst, V.; Ahluwalia, A.; Alam, S.; Avey, M.T.; Baker, M. The ARRIVE guidelines 2.0: Updated guidelines for reporting animal research. PLoS Biol. 2020, 18, e3000410. [Google Scholar] [CrossRef]
- Andrews, S. FastQC: A Quality Control Tool for High Throughput Sequence Data. 2010. Available online: http://www.bioinformatics.babraham.ac.uk/projects/fastqc (accessed on 20 February 2023).
- Ewels, P.; Magnusson, M.; Lundin, S.; Käller, M. MultiQC: Summarize analysis results for multiple tools and samples in a single report. Bioinformatics 2016, 32, 3047–3048. [Google Scholar] [CrossRef]
- Patro, R.; Duggal, G.; Love, M.I.; Irizarry, R.A.; Kingsford, C. Salmon provides fast and bias-aware quantification of transcript expression. Nat. Methods 2017, 14, 417–419. [Google Scholar] [CrossRef] [PubMed]
- Team RC. R: A Language and Environment for Statistical Computing; R Foundation for Statistical Computing: Vienna, Austria, 2020. [Google Scholar]
- Love, M.I.; Huber, W.; Anders, S. Moderated estimation of fold change and dispersion for RNA-seq data with DESeq2. Genome Biol. 2014, 15, 550. [Google Scholar] [CrossRef]
- Risso, D.; Ngai, J.; Speed, T.P.; Dudoit, S. Normalization of RNA-seq data using factor analysis of control genes or samples. Nat. Biotechnol. 2014, 32, 896–902. [Google Scholar] [CrossRef]
- Ashburner, M.; Ball, C.A.; Blake, J.A.; Botstein, D.; Butler, H.; Cherry, J.M.; Davis, A.P.; Dolinski, K.; Dwight, S.S.; Eppig, J.T.; et al. Gene ontology: Tool for the unification of biology. The Gene Ontology Consortium. Nat. Genet. 2000, 25, 25–29. [Google Scholar] [CrossRef]
- Wu, T.; Hu, E.; Xu, S.; Chen, M.; Guo, P.; Dai, Z.; Feng, T.; Zhou, L.; Tang, W.; Zhan, L.; et al. clusterProfiler 4.0: A universal enrichment tool for interpreting omics data. Innovation 2021, 2, 100141. [Google Scholar] [CrossRef]
- Sayols, S. Rrvgo: A Bioconductor Package to Reduce and Visualize Gene Ontology Terms. 2020. Available online: https://ssayols.github.io/rrvgo (accessed on 20 February 2023).
- Subramanian, A.; Tamayo, P.; Mootha, V.K.; Mukherjee, S.; Ebert, B.L.; Gillette, M.A.; Paulovich, A.; Pomeroy, S.L.; Golub, T.R.; Lander, E.S.; et al. Gene set enrichment analysis: A knowledge-based approach for interpreting genome-wide expression profiles. Proc. Natl. Acad. Sci. USA 2005, 102, 15545–15550. [Google Scholar] [CrossRef]
- Kanehisa, M.; Goto, S. KEGG: Kyoto encyclopedia of genes and genomes. Nucleic Acids Res. 2000, 28, 27–30. [Google Scholar] [CrossRef] [PubMed]
- Findlay, D.M.; Kuliwaba, J.S. Bone-cartilage crosstalk: A conversation for understanding osteoarthritis. Bone Res. 2016, 4, 16028. [Google Scholar] [CrossRef] [PubMed]
- Katsoula, G.; Kreitmaier, P.; Zeggini, E. Insights into the molecular landscape of osteoarthritis in human tissues. Curr. Opin. Rheumatol. 2022, 34, 79–90. [Google Scholar] [CrossRef] [PubMed]
- Steinberg, J.; Southam, L.; Roumeliotis, T.I.; Clark, M.J.; Jayasuriya, R.L.; Swift, D.; Shah, K.M.; Butterfield, N.C.; Brooks, R.A.; McCaskie, A.W.; et al. A molecular quantitative trait locus map for osteoarthritis. Nat. Commun. 2021, 12, 1309. [Google Scholar] [CrossRef]
- Yuan, C.; Pan, Z.; Zhao, K.; Li, J.; Sheng, Z.; Yao, X.; Liu, H.; Zhang, X.; Yang, Y.; Yu, D.; et al. Classification of four distinct osteoarthritis subtypes with a knee joint tissue transcriptome atlas. Bone Res. 2020, 8, 38. [Google Scholar] [CrossRef]
- Steinberg, J.; Southam, L.; Roumeliotis, T.I.; Clark, M.J.; Jayasuriya, R.L.; Swift, D.; Shah, K.M.; Butterfield, N.C.; Brooks, R.A.; McCaskie, A.W.; et al. Linking chondrocyte and synovial transcriptional profile to clinical phenotype in osteoarthritis. Ann. Rheum. Dis. 2021, 80, 1070–1074. [Google Scholar] [CrossRef]
- Yuan, C.; Pan, Z.; Zhao, K.; Li, J.; Sheng, Z.; Yao, X.; Liu, H.; Zhang, X.; Yang, Y.; Yu, D.; et al. Synovial cell cross-talk with cartilage plays a major role in the pathogenesis of osteoarthritis. Sci. Rep. 2020, 10, 10868. [Google Scholar] [CrossRef]
- Landén, N.X.; Li, D.; Ståhle, M. Transition from inflammation to proliferation: A critical step during wound healing. Cell. Mol. Life Sci. 2016, 73, 3861–3885. [Google Scholar] [CrossRef]
- Gieseck, R.L., 3rd; Wilson, M.S.; Wynn, T.A. Type 2 immunity in tissue repair and fibrosis. Nat. Rev. Immunol. 2018, 18, 62–76. [Google Scholar] [CrossRef]
- Fujii, T.; Wada, S.; Carballo, C.B.; Bell, R.D.; Morita, W.; Nakagawa, Y.; Liu, Y.; Chen, D.; Pannellini, T.; Sokhi, U.K.; et al. Distinct Inflammatory Macrophage Populations Sequentially Infiltrate Bone-to-Tendon Interface Tissue after Anterior Cruciate Ligament (ACL) Reconstruction Surgery in Mice. JBMR Plus. 2022, 6, e10635. [Google Scholar] [CrossRef]
- Liu, S.; Yang, H.; Hu, B.; Zhang, M. Sirt1 regulates apoptosis and extracellular matrix degradation in resveratrol-treated osteoarthritis chondrocytes via the Wnt/β-catenin signaling pathways. Exp. Ther. Med. 2017, 14, 5057–5062. [Google Scholar] [CrossRef] [PubMed]
- Zhu, M.; Tang, D.; Wu, Q.; Hao, S.; Chen, M.; Xie, C.; Rosier, R.N.; O’keefe, R.J.; Zuscik, M.; Chen, D. Activation of beta-catenin signaling in articular chondrocytes leads to osteoarthritis-like phenotype in adult beta-catenin conditional activation mice. J. Bone Miner. Res. 2009, 24, 12–21. [Google Scholar] [CrossRef] [PubMed]
- Zhu, M.; Chen, M.; Zuscik, M.; Wu, Q.; Wang, Y.; Rosier, R.N.; O’Keefe, R.J.; Chen, D. Inhibition of beta-catenin signaling in articular chondrocytes results in articular cartilage destruction. Arthritis Rheum. 2008, 58, 2053–2064. [Google Scholar] [CrossRef] [PubMed]
- Bosch, M.H.V.D.; Blom, A.B.; Sloetjes, A.W.; Koenders, M.I.; van de Loo, F.A.; Berg, W.B.V.D.; van Lent, P.L.; van der Kraan, P.M. Induction of Canonical Wnt Signaling by Synovial Overexpression of Selected Wnts Leads to Protease Activity and Early Osteoarthritis-Like Cartilage Damage. Am. J. Pathol. 2015, 185, 1970–1980. [Google Scholar] [CrossRef] [PubMed]
- Boer, C.G.; Yau, M.S.; Rice, S.J.; de Almeida, R.C.; Cheung, K.; Styrkarsdottir, U.; Southam, L.; Broer, L.; Wilkinson, J.M.; Uitterlinden, A.G.; et al. Genome-wide association of phenotypes based on clustering patterns of hand osteoarthritis identify WNT9A as novel osteoarthritis gene. Ann. Rheum. Dis. 2021, 80, 367–375. [Google Scholar] [CrossRef]
- Wang, Y.; Fan, X.; Xing, L.; Tian, F. Wnt signaling: A promising target for osteoarthritis therapy. Cell. Commun. Signal. 2019, 17, 97. [Google Scholar] [CrossRef]
- Glinka, A.; Dolde, C.; Kirsch, N.; Huang, Y.; Kazanskaya, O.; Ingelfinger, D.; Boutros, M.; Cruciat, C.; Niehrs, C. LGR4 and LGR5 are R-spondin receptors mediating Wnt/β-catenin and Wnt/PCP signalling. EMBO Rep. 2011, 12, 1055–1061. [Google Scholar] [CrossRef]
- Sieker, J.T.; Proffen, B.L.; Waller, K.A.; Chin, K.E.; Karamchedu, N.P.; Akelman, M.R.; Perrone, G.S.; Kiapour, A.M.; Konrad, J.; Murray, M.M.; et al. Transcriptional profiling of articular cartilage in a porcine model of early post-traumatic osteoarthritis. J. Orthop. Res. 2018, 36, 318–329. [Google Scholar] [CrossRef]
- Sieker, J.T.; Proffen, B.L.; Waller, K.A.; Chin, K.E.; Karamchedu, N.P.; Akelman, M.R.; Perrone, G.S.; Kiapour, A.M.; Konrad, J.; Fleming, B.C.; et al. Transcriptional profiling of synovium in a porcine model of early post-traumatic osteoarthritis. J. Orthop. Res. 2018, 36, 2128–2139. [Google Scholar] [CrossRef]
- Wang, K.; Esbensen, Q.; Karlsen, T.; Eftang, C.; Owesen, C.; Aroen, A.; Jakobsen, R. Low-Input RNA-Sequencing in Patients with Cartilage Lesions, Osteoarthritis, and Healthy Cartilage. Cartilage 2021, 13 (Suppl. S1), 550S–562S. [Google Scholar] [CrossRef]
- Klein-Wieringa, I.R.; De Lange-Brokaar, B.J.; Yusuf, E.; Andersen, S.N.; Kwekkeboom, J.C.; Kroon, H.M.; Van Osch, G.J.; Zuurmond, A.-M.; Stojanovic-Susulic, V.; Nelissen, R.; et al. Inflammatory Cells in Patients with Endstage Knee Osteoarthritis: A Comparison between the Synovium and the Infrapatellar Fat Pad. J. Rheumatol. 2016, 43, 771–778. [Google Scholar] [CrossRef] [PubMed]
- Yuan, W.-H.; Xie, Q.-Q.; Wang, K.-P.; Shen, W.; Feng, X.-F.; Liu, Z.; Shi, J.-T.; Zhang, X.-B.; Zhang, K.; Deng, Y.-J.; et al. Screening of osteoarthritis diagnostic markers based on immune-related genes and immune infiltration. Sci. Rep. 2021, 11, 7032. [Google Scholar] [CrossRef] [PubMed]
- Gibson, J.S.; Milner, P.I.; White, R.; Fairfax, T.P.; Wilkins, R.J. Oxygen and reactive oxygen species in articular cartilage: Modulators of ionic homeostasis. Pflugers Arch. 2008, 455, 563–573. [Google Scholar] [CrossRef] [PubMed]
- Nielsen, A.E.; Bohr, A.; Penkowa, M. The Balance between Life and Death of Cells: Roles of Metallothioneins. Biomark. Insights 2007, 1, 99–111. [Google Scholar] [CrossRef]
- Boileau, C.; Martel-Pelletier, J.; Brunet, J.; Schrier, D.; Flory, C.; Boily, M. PD-0200347, an alpha2delta ligand of the voltage gated calcium channel, inhibits in vivo activation of the Erk1/2 pathway in osteoarthritic chondrocytes: A PKCalpha dependent effect. Ann. Rheum. Dis. 2006, 65, 573–580. [Google Scholar] [CrossRef]
- Li, H.; Chen, C.; Chen, S. Posttraumatic knee osteoarthritis following anterior cruciate ligament injury: Potential biochemical mediators of degenerative alteration and specific biochemical markers. Biomed. Rep. 2015, 3, 147–151. [Google Scholar] [CrossRef]
- Shibakawa, A.; Aoki, H.; Masuko-Hongo, K.; Kato, T.; Tanaka, M.; Nishioka, K.; Nakamura, H. Presence of pannus-like tissue on osteoarthritic cartilage and its histological character. Osteoarthr. Cartil. 2003, 11, 133–140. [Google Scholar] [CrossRef]
- Furuzawa-Carballeda, J.; Macip-Rodríguez, P.M.; Cabral, A.R. Osteoarthritis and rheumatoid arthritis pannus have similar qualitative metabolic characteristics and pro-inflammatory cytokine response. Clin. Exp. Rheumatol. 2008, 26, 554–560. [Google Scholar]
- Donnenfield, J.I.; Karamchedu, N.P.; Fleming, B.C.; Molino, J.; Proffen, B.L.; Murray, M.M. Articular cartilage and synovium may be important sources of post-surgical synovial fluid inflammatory mediators. Am. J. Transl. Res. 2022, 14, 1640–1651. [Google Scholar]
- Loeser, R.F. The Role of Aging in the Development of Osteoarthritis. Trans. Am. Clin. Climatol. Assoc. 2017, 128, 44–54. [Google Scholar]
- Knäuper, V.; Will, H.; López-Otin, C.; Smith, B.; Atkinson, S.J.; Stanton, H.; Hembry, R.M.; Murphy, G. Cellular mechanisms for human procollagenase-3 (MMP-13) activation. Evidence that MT1-MMP (MMP-14) and gelatinase a (MMP-2) are able to generate active enzyme. J. Biol. Chem. 1996, 271, 17124–17131. [Google Scholar] [CrossRef] [PubMed]
- Brandt, K.D.; Myers, S.L.; Burr, D.; Albrecht, M. Osteoarthritic changes in canine articular cartilage, subchondral bone, and synovium fifty-four months after transection of the anterior cruciate ligament. Arthritis Rheum. 1991, 34, 1560–1570. [Google Scholar] [CrossRef] [PubMed]
- Proffen, B.L.; McElfresh, M.; Fleming, B.C.; Murray, M.M. A comparative anatomical study of the human knee and six animal species. Knee 2012, 19, 469–476. [Google Scholar] [CrossRef] [PubMed]
- Okafor, E.C.; Utturkar, G.M.; Widmyer, M.R.; Abebe, E.S.; Collins, A.T.; Taylor, D.C.; Spritzer, C.E.; Moorman, C.; Garrett, W.E.; DeFrate, L.E. The effects of femoral graft placement on cartilage thickness after anterior cruciate ligament reconstruction. J. Biomech. 2014, 47, 96–101. [Google Scholar] [CrossRef] [PubMed]
- Sieker, J.T.; Ayturk, U.M.; Proffen, B.L.; Weissenberger, M.H.; Kiapour, A.M.; Murray, M.M. Immediate administration of intraarticular triamcinolone acetonide after joint injury modulates molecular outcomes associated with early synovitis. Arthritis Rheumatol. 2016, 68, 1637–1647. [Google Scholar] [CrossRef]
- Wernersson, R.; Schierup, M.H.; Jørgensen, F.G.; Gorodkin, J.; Panitz, F.; Stærfeldt, H.-H.; Christensen, O.F.; Mailund, T.; Hornshøj, H.; Klein, A.; et al. Pigs in sequence space: A 0.66X coverage pig genome survey based on shotgun sequencing. BMC Genom. 2005, 6, 70. [Google Scholar] [CrossRef]
- Swindle, M.M.; Makin, A.; Herron, A.J.; Clubb, F.J.; Frazier, K.S., Jr. Swine as models in biomedical research and toxicology testing. Vet. Pathol. 2012, 49, 344–356. [Google Scholar] [CrossRef]


|
AC CON |
AC Pooled |
AC Pooled/CON |
SM CON | SM Pooled |
SM Pooled/CON | |
|---|---|---|---|---|---|---|
| Mean (Range) | Mean (Range) | p-value (95% CI) | Mean (Range) | Mean (Range) | p-value (95% CI) | |
| Demographics | ||||||
| Age (mo) | 15 (13, 17) | 15.3 (13, 18) | 0.42 (−1.0, 1.0) a | 15 (13, 17) | 15.3 (13, 18) | 0.42 (−1.0, 1.0) a |
| Weight (kg) | 50.8 (40, 60) | 51.9 (40, 60) | 0.65 (−5.0, 2.0) a | 50.8 (40, 60) | 51.9 (40, 60) | 0.65 (−5.0, 2.0) a |
| Sex (prop. female) | 0.5 | 0.5 | 1 b | 0.5 | 0.5 | 1 b |
| RNA quality | ||||||
| Conc. (ng/µL) | 17.2 (1.6, 33.8) | 26.0 (7.5, 53.2) | 0.05 (−16.7, 0.5) a | 112.9 (31.6, 377) | 146.8 (14.1, 558) | 0.31 (−86.1, 24.8) a |
| 260/280 | 1.7 (1.5, 1.9) | 1.8 (1.6, 1.9) | 0.03 (−0.2, −0.01) a | 2.0 (1.9, 2.1) | 2.0 (1.8, 2.1) | 0.95 (−0.02, 0.03) a |
| 260/230 | 1.2 (0.4, 1.8) | 1.5 (1.6, 1.9) | 0.17 (−0.5, 0.06) a | 1.9 (1.5, 2.2) | 1.9 (0.6, 2.2) | 0.57 (−0.2, 0.1) a |
| RIN | 6.1 (4.8, 7.3) | 5.6 (4.3, 7.0) | 0.06 (−5.2 × 10⁻⁵, 0.9) a | 6.2 (4.6, 7.3) | 5.5 (2.8, 7.2) | 0.03 (0.1, 1.4) a |
| Uniquely mapped reads in millions | 29.7 (25.3, 35.2) | 31.0 (15.9, 46.6) | 0.64 (−4.1, 2.3) a | 29.0 (19.8, 41.1) | 28.7 (16.8, 42.2) | 0.93 (−4.2, 4.3) a |
| Uniquely mapped reads % | 78.2 (69.0, 83.6) | 78.4 (70.6, 86.2) | 0.84 (−2.6, 2.6) a | 81.7 (78.8, 86.5) | 77.2 (62.1, 84.5) | 0.01 (0.6, 6.8) a |
| ACLT | RECON | REPAIR | POOLED | |
|---|---|---|---|---|
| CON | 329 | 1210 | 330 | 1227 |
| ACLT | 97 | 64 | ||
| RECON | 99 |
| Upregulated Biological Processes in Cartilage Relative to Synovium | Contributing Genes | Adj. p-Value | |
|---|---|---|---|
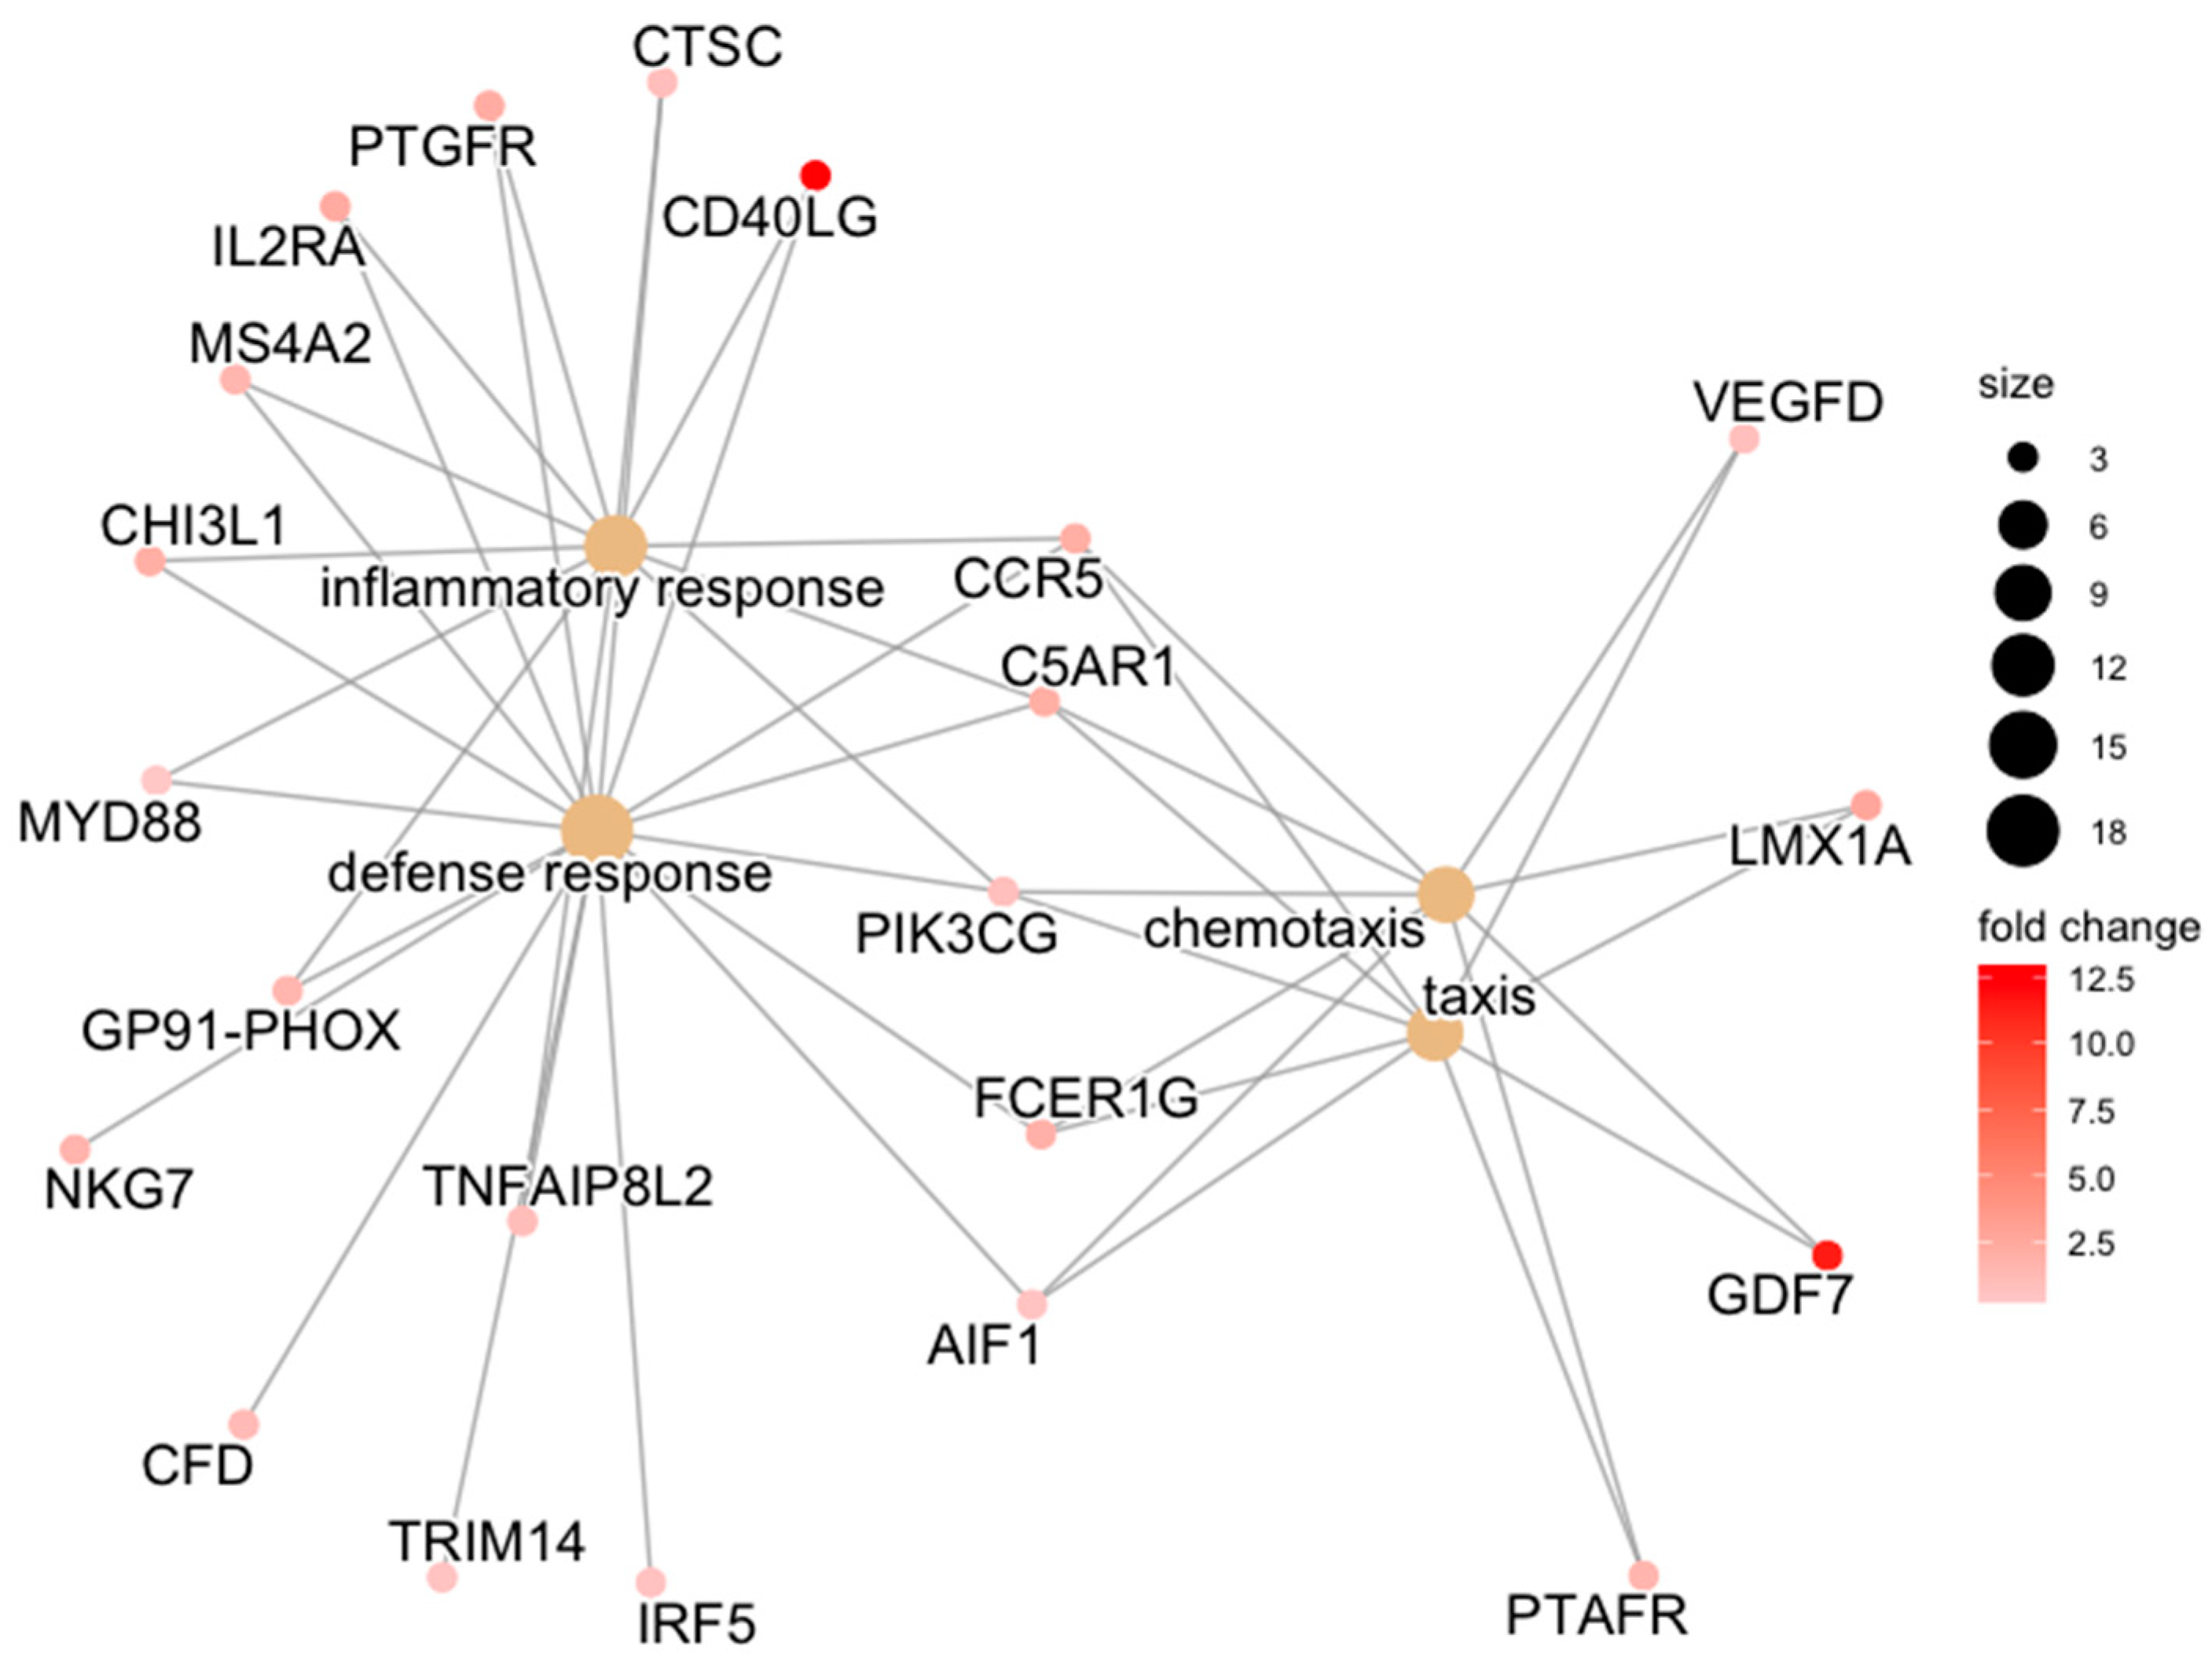
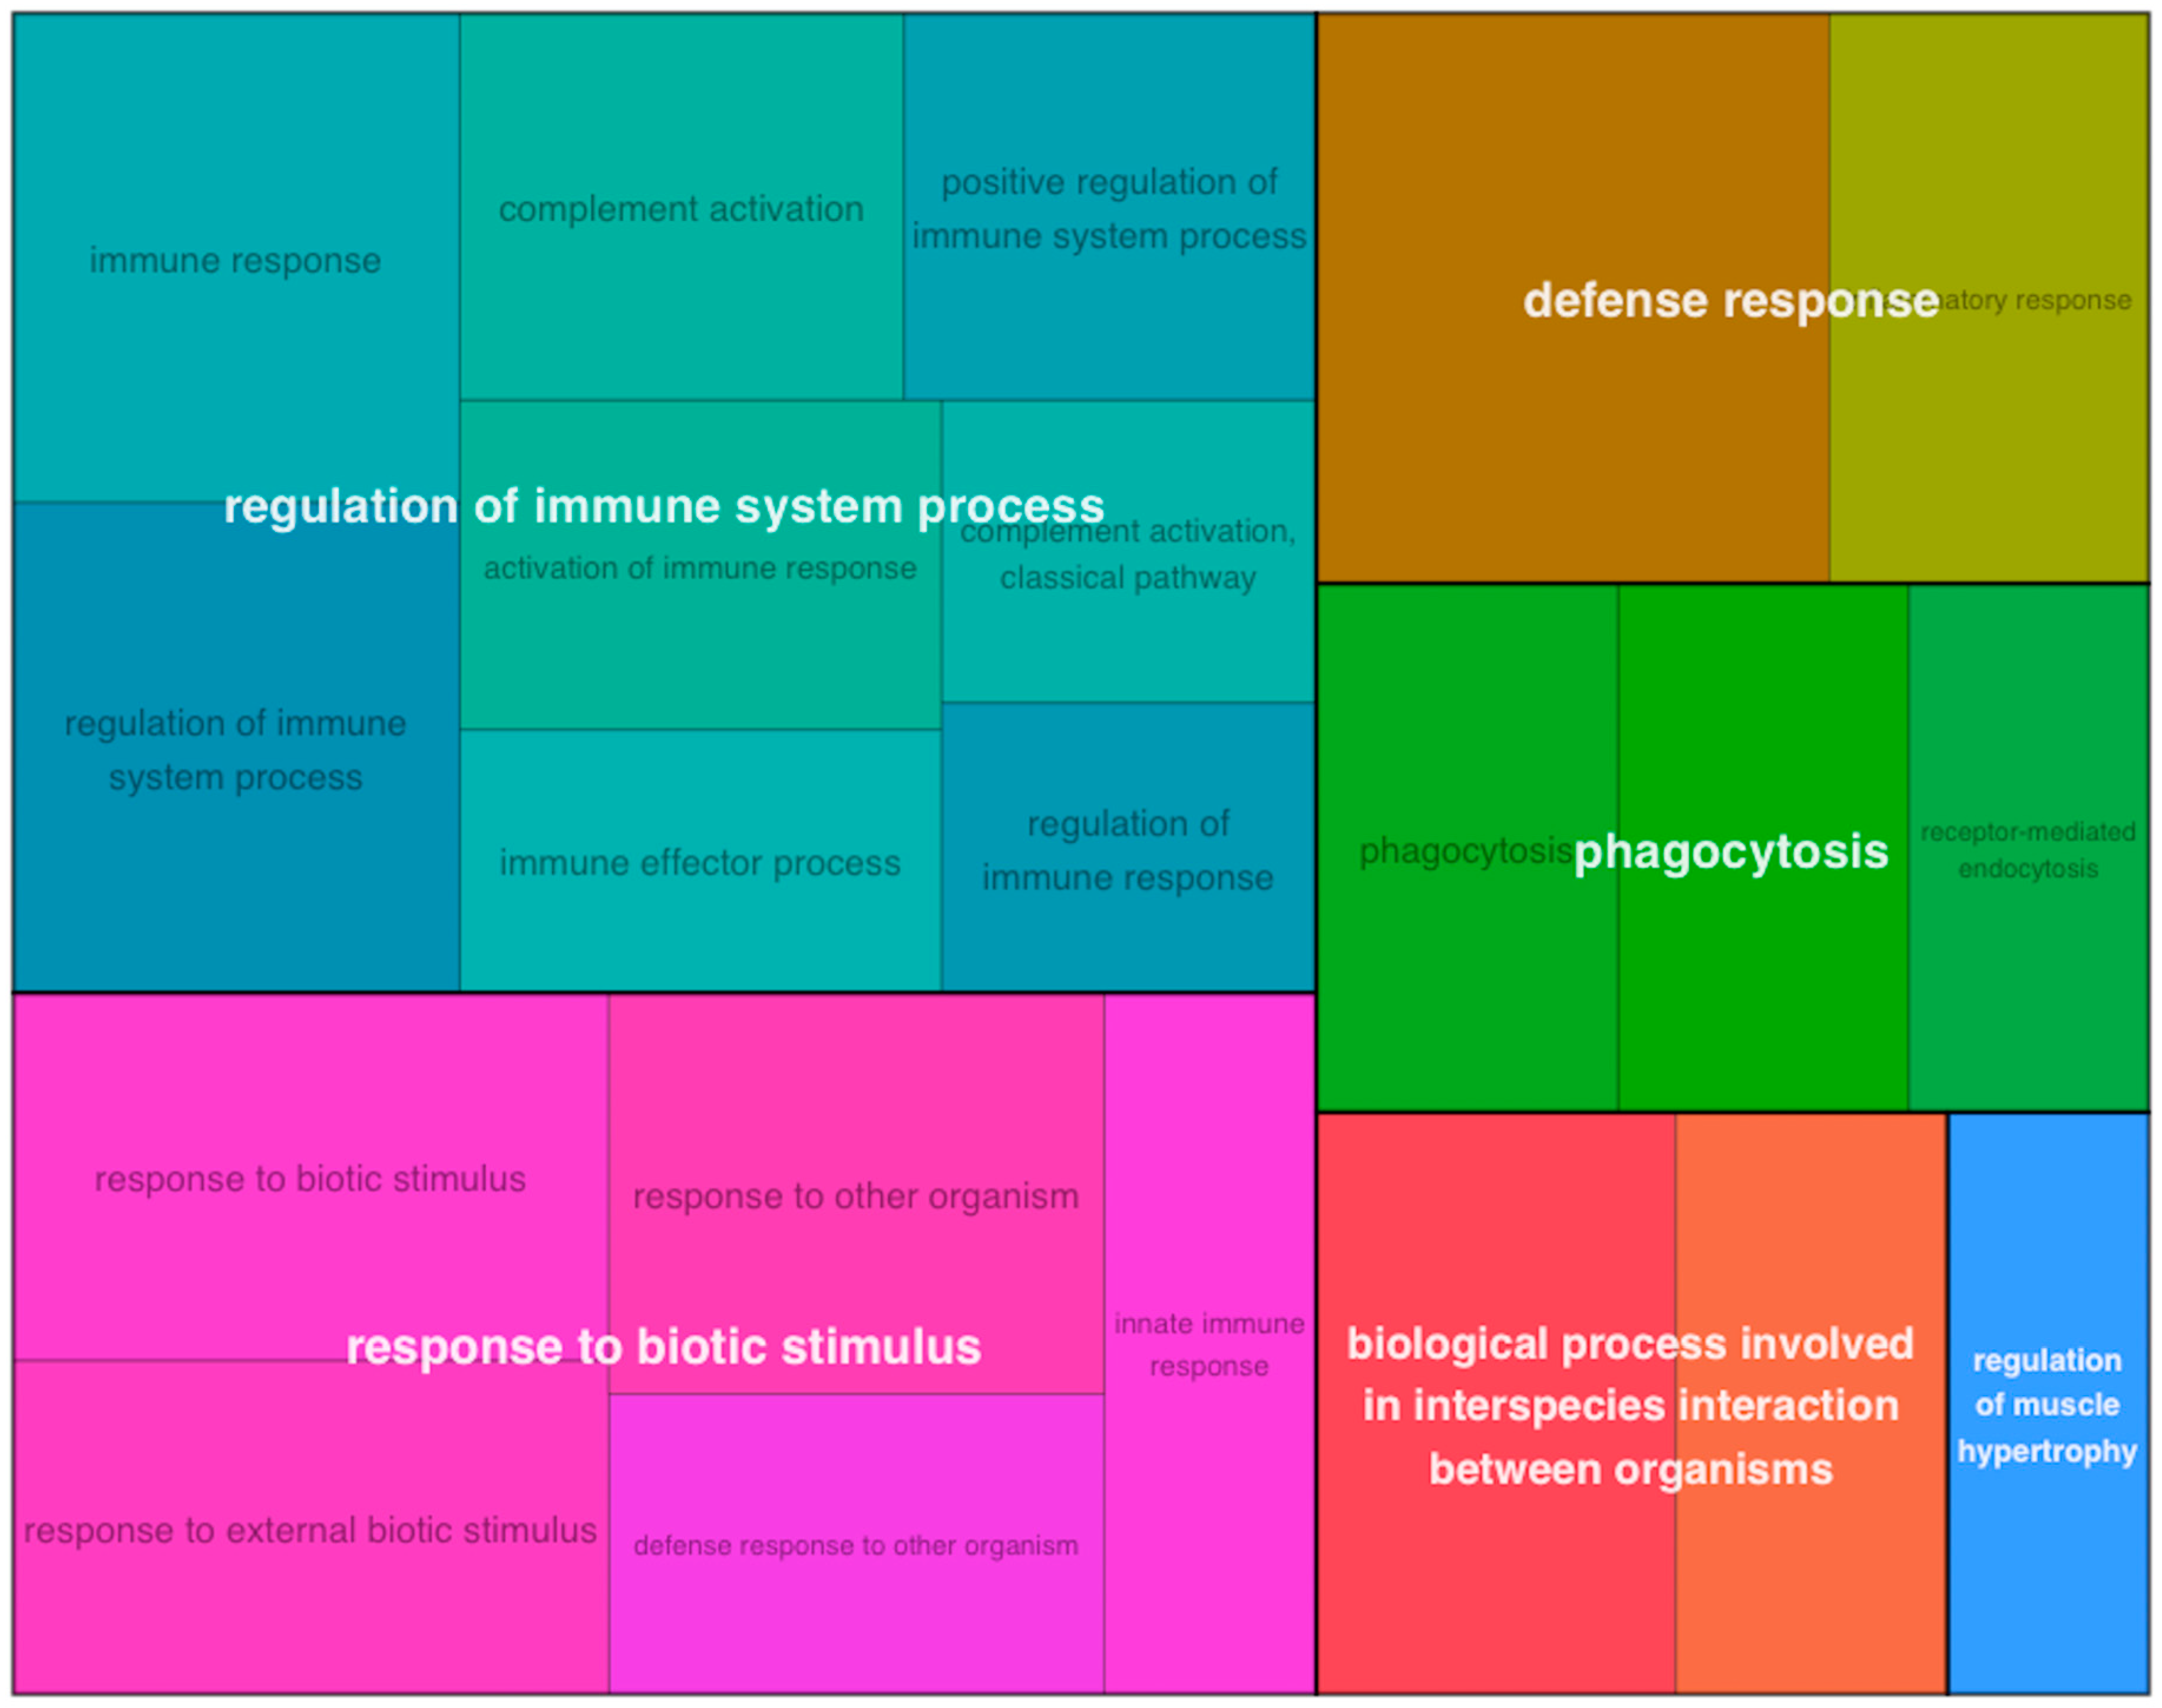
| ACLT | defense response | CD40LG/PTGFR/FCER1G/CTSC/C5AR1/CCR5/IL2RA/MS4A2/CHI3L1/NKG7/MYD88/GP91-PHOX/CFD/TRIM14/AIF1/IRF5/PIK3CG/TNFAIP8L2 | 0.007 |
| inflammatory response | CD40LG/PTGFR/CTSC/C5AR1/CCR5/IL2RA/MS4A2/CHI3L1/MYD88/GP91-PHOX/PIK3CG/TNFAIP8L2 | 0.007 | |
| chemotaxis | GDF7/FCER1G/C5AR1/CCR5/LMX1A/PTAFR/AIF1/PIK3CG/VEGFD | 0.046 | |
| taxis | GDF7/FCER1G/C5AR1/CCR5/LMX1A/PTAFR/AIF1/PIK3CG/VEGFD | 0.046 | |
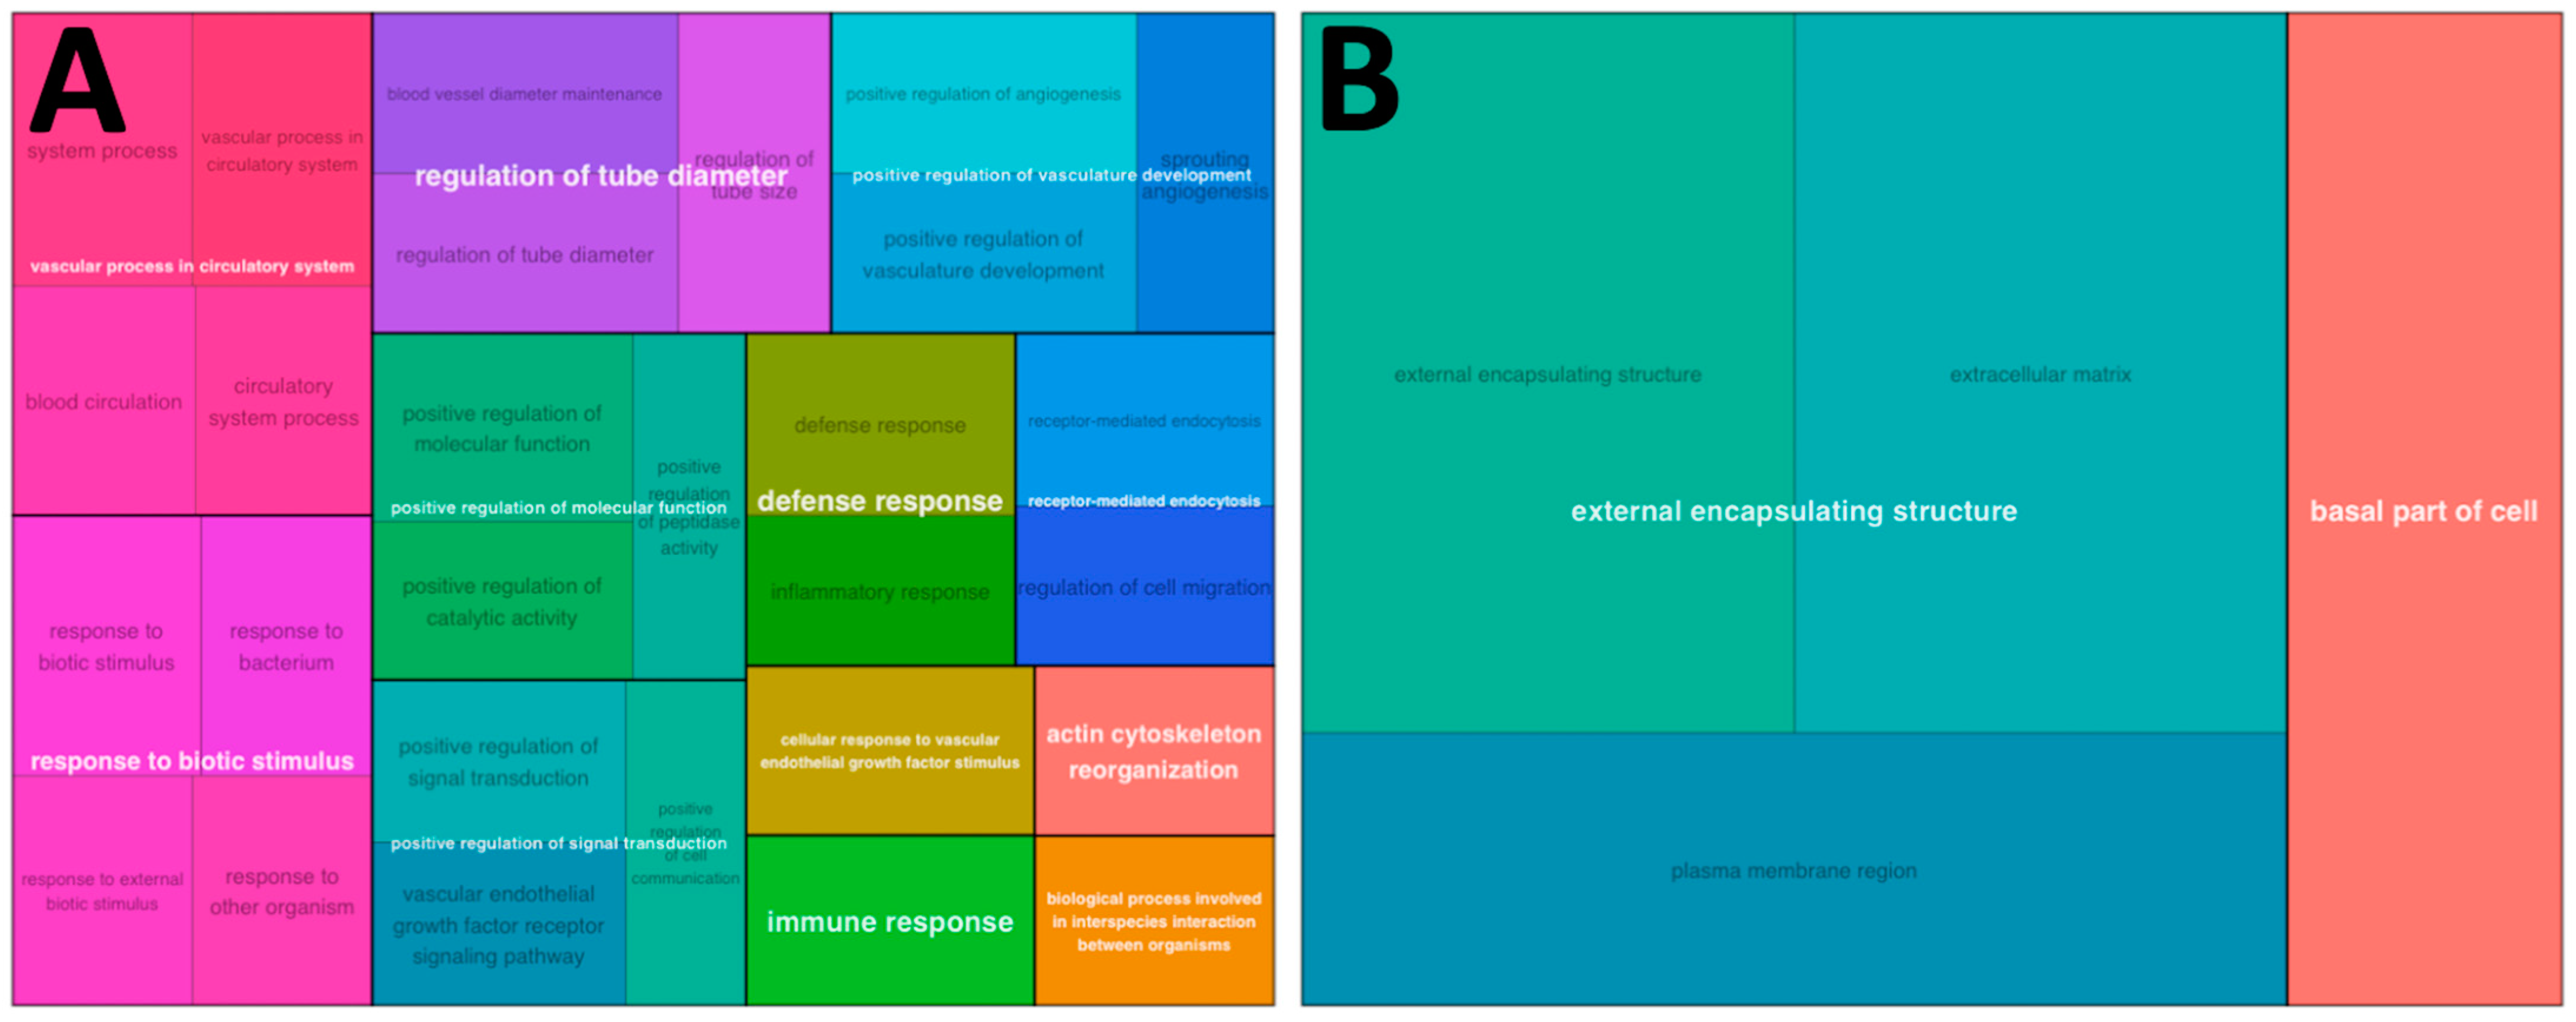
| RECON | system process | MYMK/CTSC/HTR7/PTPRZ1/AQP3/PTGES/C5AR1/GNAT1/NPY1R/NOS3/P2RY2/TBX20/RGS2/LOC100738836/LUM/HTR1B/NCSTN/LMX1A/CCL2/CNTN5/RAMP2/SMTNL2/SHOX2/F11R/EDNRA/ADRA2A/MYOM1/DRAM2/ADRB2/SCARB1/LHFPL5 | 0.023 |
| vascular process in circulatory system | HTR7/NOS3/P2RY2/RGS2/HTR1B/RAMP2/SMTNL2/EDNRA/ADRA2A/ADRB2 | 0.023 | |
| immune response | IL7/TNF/CD40LG/CTSC/TNFSF9/FCER1G/BPI/MYD88/TRIM14/CCR5/C5AR1/PTK2B/CYBA/MS4A2/TNFSF15/CCL3L1/C1S/CCL2/IFNAR1/CTSH/GP91-PHOX/SLA-DQB1/SCAP/SCIMP/SLA-DMB/CFD/CCL14/SAMHD1/CD14/POLR3D/MX1/C2/CD74 | 0.023 | |
| regulation of tube size | HTR7/NOS3/P2RY2/RGS2/HTR1B/SMTNL2/EDNRA/ADRA2A/ADRB2 | 0.023 | |
| regulation of tube diameter | HTR7/NOS3/P2RY2/RGS2/HTR1B/SMTNL2/EDNRA/ADRA2A/ADRB2 | 0.023 | |
| blood vessel diameter maintenance | HTR7/NOS3/P2RY2/RGS2/HTR1B/SMTNL2/EDNRA/ADRA2A/ADRB2 | 0.023 | |
| defense response | CD40LG/CHI3L1/CTSC/PTGFR/FCER1G/BPI/MYD88/TNFRSF1A/TRIM14/PIK3CG/CCR5/PTGES/C5AR1/PTK2B/CYBA/IL2RA/MS4A2/NR1H3/C1S/CCL2/IFNAR1/GP91-PHOX/IRF5/APOD/CFD/SAMHD1/CD14/POLR3D/LAPTM5/MX1/C2/CD74 | 0.023 | |
| positive regulation of molecular function | TNF/CD40LG/CHI3L1/TRIM14/PTK2B/SLC5A3/EGF/ARRDC4/NOS3/NLRP3/TNFSF15/ARHGAP45/ADAP2/NCSTN/CCL2/VEGFA/CTSH/EBF2/FAM162A/LAPTM5/RGS1/CAMK2A/ADRA2A/ADRB2/SCARB1/ACVR1C | 0.023 | |
| positive regulation of angiogenesis | CHI3L1/VEGFD/NRP1/C5AR1/PTK2B/VEGFA/CTSH/RAMP2 | 0.023 | |
| positive regulation of vasculature development | CHI3L1/VEGFD/NRP1/C5AR1/PTK2B/VEGFA/CTSH/RAMP2 | 0.023 | |
| cellular response to vascular endothelial growth factor stimulus | VEGFD/NRP1/DLL4/VEGFA/RAMP2 | 0.023 | |
| response to biotic stimulus | PTGFR/VEGFD/FCER1G/BPI/MYD88/TRIM14/C5AR1/PTK2B/CYBA/NOS3/C1S/CCL2/IFNAR1/GP91-PHOX/IRF5/THRSP/SCIMP/SLC11A1/CFD/SAMHD1/CD14/POLR3D/LAPTM5/RGS1/MX1/C2/SCARB1/SRPX | 0.023 | |
| receptor-mediated endocytosis | FCER1G/APLN/MSR1/VEGFA/RAMP2/CBL/MRC1/ITGB2/ADRB2 | 0.032 | |
| response to bacterium | PTGFR/VEGFD/FCER1G/BPI/MYD88/C5AR1/NOS3/CCL2/IFNAR1/THRSP/SCIMP/SLC11A1/CFD/RGS1/SCARB1 | 0.032 | |
| sprouting angiogenesis | VEGFD/NRP1/DLL4/PTK2B/VEGFA/RAMP2/ESM1 | 0.034 | |
| blood circulation | HTR7/NPY1R/NOS3/P2RY2/TBX20/RGS2/HTR1B/RAMP2/SMTNL2/SHOX2/EDNRA/ADRA2A/ADRB2 | 0.040 | |
| positive regulation of signal transduction | TNF/CHI3L1/CTSC/HHEX/IL10RA/MYD88/NRP1/S100A4/DLL4/C5AR1/PTK2B/TBX20/RASGRP4/LOC100738836/CCL2/VEGFA/CTSH/SHOX2/SCIMP/CBL/NR3C2/ESM1/ADRA2A/ADRB2/CD74/SRPX | 0.042 | |
| positive regulation of catalytic activity | CHI3L1/PTK2B/SLC5A3/ARRDC4/NOS3/NLRP3/TNFSF15/ARHGAP45/ADAP2/NCSTN/CCL2/VEGFA/CTSH/FAM162A/LAPTM5/RGS1/ADRA2A/ADRB2/SCARB1/ACVR1C | 0.042 | |
| regulation of cell migration | VEGFD/PHACTR1/NRP1/RAP2B/DLL4/C5AR1/PTK2B/ARHGDIB/LOC100738836/CCL2/VEGFA/CTSH/APOD/CAMK2A/ADRA2A/TMSB4X/ACVR1C | 0.042 | |
| response to other organism | PTGFR/VEGFD/FCER1G/BPI/MYD88/TRIM14/C5AR1/PTK2B/CYBA/NOS3/C1S/CCL2/IFNAR1/GP91-PHOX/IRF5/THRSP/SCIMP/SLC11A1/CFD/SAMHD1/CD14/POLR3D/RGS1/MX1/C2/SCARB1 | 0.042 | |
| vascular endothelial growth factor receptor signaling pathway | VEGFD/NRP1/PTK2B/VEGFA | 0.042 | |
| response to external biotic stimulus | PTGFR/VEGFD/FCER1G/BPI/MYD88/TRIM14/C5AR1/PTK2B/CYBA/NOS3/C1S/CCL2/IFNAR1/GP91-PHOX/IRF5/THRSP/SCIMP/SLC11A1/CFD/SAMHD1/CD14/POLR3D/RGS1/MX1/C2/SCARB1 | 0.042 | |
| actin cytoskeleton reorganization | PHACTR1/NRP1/RAP2B/ESAM/PTK2B/ARHGDIB | 0.043 | |
| inflammatory response | CD40LG/CHI3L1/CTSC/PTGFR/MYD88/TNFRSF1A/PIK3CG/CCR5/PTGES/C5AR1/IL2RA/MS4A2/NR1H3/CCL2/GP91-PHOX/APOD/CD14/CD74 | 0.044 | |
| circulatory system process | HTR7/NPY1R/NOS3/P2RY2/TBX20/RGS2/HTR1B/RAMP2/SMTNL2/SHOX2/EDNRA/ADRA2A/ADRB2 | 0.044 | |
| biological process involved in interspecies interaction between organisms | PTGFR/VEGFD/FCER1G/BPI/MYD88/NRP1/TRIM14/C5AR1/PTK2B/CYBA/NOS3/C1S/CCL2/IFNAR1/GP91-PHOX/IRF5/THRSP/SCIMP/SLC11A1/CFD/SAMHD1/CD14/POLR3D/RGS1/MX1/C2/SCARB1 | 0.044 | |
| positive regulation of cell communication | TNF/CHI3L1/CTSC/HHEX/IL10RA/MYD88/NRP1/S100A4/DLL4/C5AR1/PTK2B/TBX20/RASGRP4/LOC100738836/NCSTN/CCL2/VEGFA/CTSH/SHOX2/SCIMP/CBL/NR3C2/ESM1/ADRA2A/ADRB2/CD74/SRPX | 0.049 | |
| positive regulation of peptidase activity | NLRP3/TNFSF15/NCSTN/CTSH/FAM162A/LAPTM5/ACVR1C | 0.049 | |
| REPAIR |
| Upregulated Molecular Functions in Cartilage Relative to Synovium | Contributing Genes | Adj. p-Value | |
|---|---|---|---|
| ACLT | |||
| RECON | signaling receptor activity | NPY5R/PTGFR/EFEMP1/FCER1G/HTR7/IL10RA/TNFRSF1A/PRTG/NRP1/PECAM1/CCR5/C5AR1/NPY1R/IL2RA/P2RY2/NR1H3/NR5A2/LOC100737531/PTGDR2/HTR1B/IFNAR1/CTSH/GPR34/NOTCH4/RAMP2/FZD4/P2RY6/RORC/MRC1/P2RY12/ITGB2/CNTFR/EDNRA/ADRA2A/ADRB2/SCARB1/ACVR1C/PTAFR | 0.001 |
| molecular transducer activity | NPY5R/PTGFR/EFEMP1/FCER1G/HTR7/IL10RA/TNFRSF1A/PRTG/NRP1/PECAM1/CCR5/C5AR1/NPY1R/IL2RA/P2RY2/NR1H3/NR5A2/LOC100737531/PTGDR2/HTR1B/IFNAR1/CTSH/GPR34/NOTCH4/RAMP2/FZD4/P2RY6/RORC/MRC1/P2RY12/ITGB2/CNTFR/EDNRA/ADRA2A/ADRB2/SCARB1/ACVR1C/PTAFR | 0.001 | |
| enzyme activator activity | CD40LG/CTSC/PCOLCE/NRP1/GIT2/IGFBP3/SMAP2/NCF2/RGS2/ARHGAP45/ADAP2/CTSH/ARHGAP25/RGS1/NCF4/FGL2 | 0.001 | |
| transmembrane signaling receptor activity | NPY5R/PTGFR/EFEMP1/FCER1G/HTR7/IL10RA/TNFRSF1A/NRP1/PECAM1/CCR5/C5AR1/NPY1R/IL2RA/P2RY2/LOC100737531/PTGDR2/HTR1B/IFNAR1/CTSH/GPR34/RAMP2/FZD4/P2RY6/P2RY12/CNTFR/EDNRA/ADRA2A/ADRB2/ACVR1C/PTAFR | 0.010 | |
| GTPase activator activity | NRP1/GIT2/SMAP2/RGS2/ARHGAP45/ADAP2/ARHGAP25/RGS1 | 0.032 | |
| purinergic nucleotide receptor activity | P2RY2/GPR34/P2RY6/P2RY12 | 0.032 | |
| nucleotide receptor activity | P2RY2/GPR34/P2RY6/P2RY12 | 0.032 | |
| immune receptor activity | FCER1G/IL10RA/CCR5/C5AR1/IL2RA/IFNAR1/CTSH/CNTFR | 0.034 | |
| carbohydrate transmembrane transporter activity | AQP3/SLC5A3/TMEM144/AQP9 | 0.046 | |
| peptidase activator activity | CTSC/PCOLCE/CTSH/FGL2 | 0.046 | |
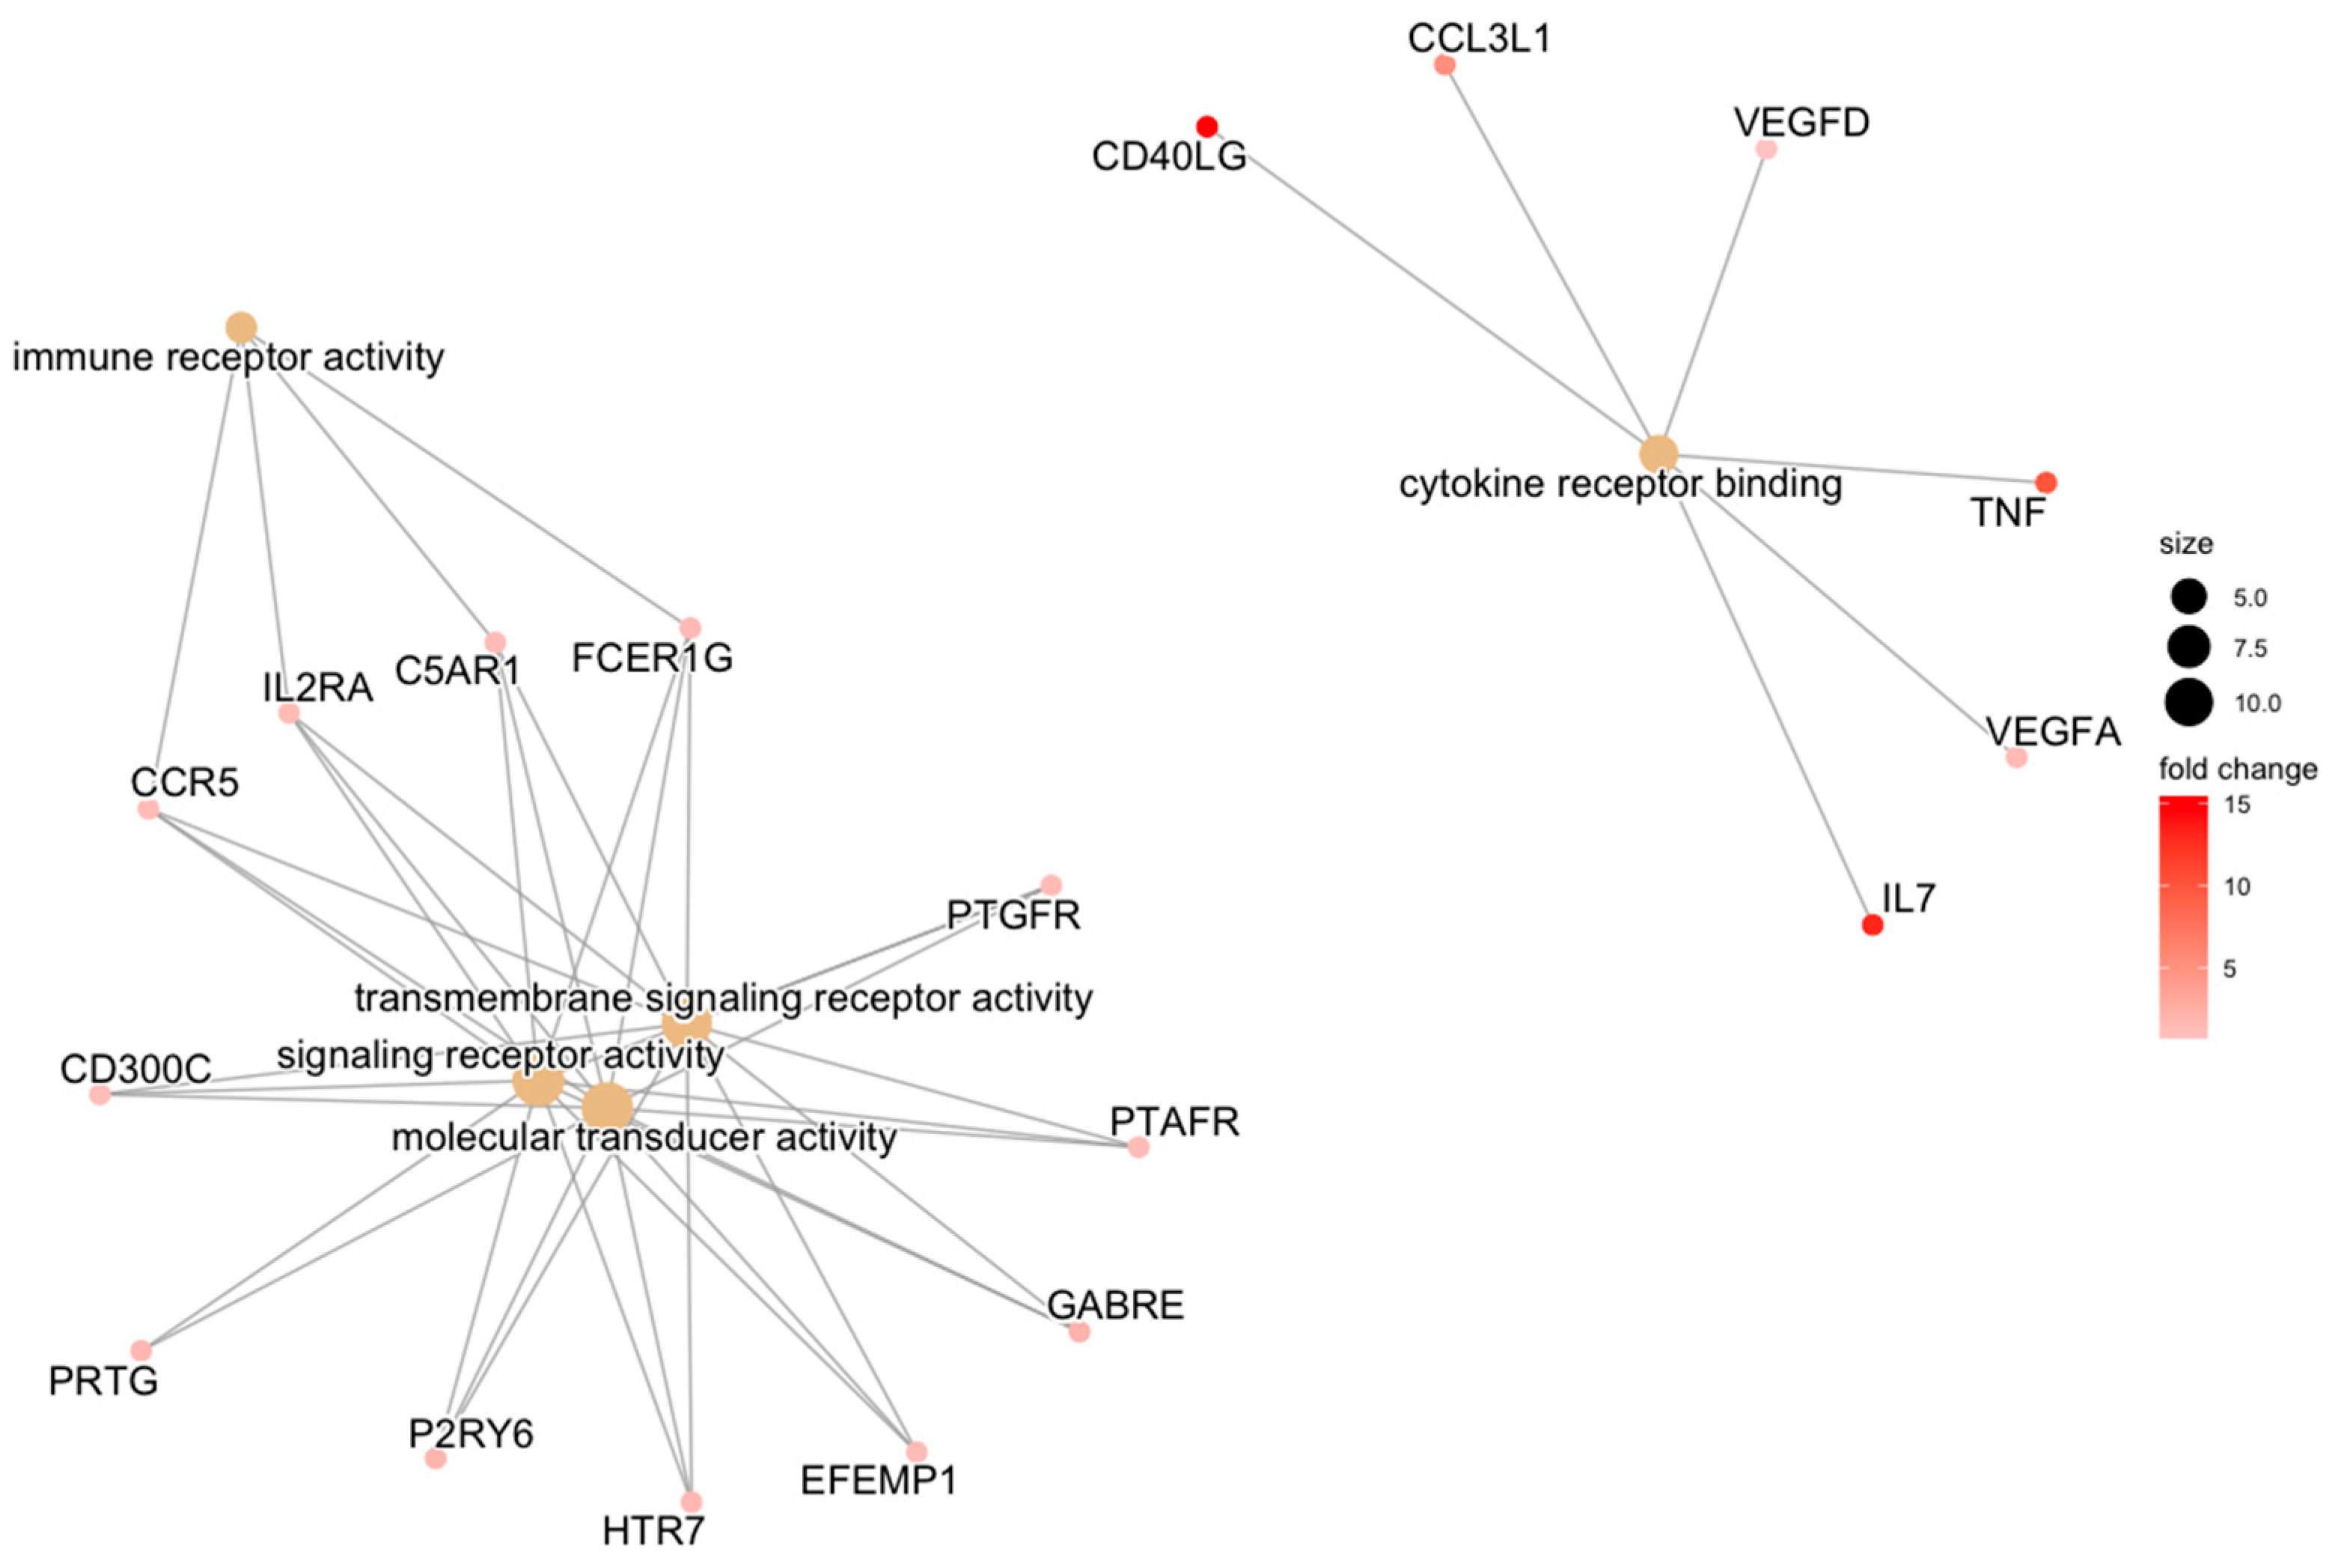
| REPAIR | transmembrane signaling receptor activity | HTR7/EFEMP1/GABRE/FCER1G/PTGFR/P2RY6/C5AR1/PTAFR/CCR5/IL2RA/CD300C | 0.034 |
| signaling receptor activity | PRTG/HTR7/EFEMP1/GABRE/FCER1G/PTGFR/P2RY6/C5AR1/PTAFR/CCR5/IL2RA/CD300C | 0.034 | |
| molecular transducer activity | PRTG/HTR7/EFEMP1/GABRE/FCER1G/PTGFR/P2RY6/C5AR1/PTAFR/CCR5/IL2RA/CD300C | 0.034 | |
| cytokine receptor binding | IL7/TNF/CD40LG/CCL3L1/VEGFA/VEGFD | 0.034 | |
| immune receptor activity | FCER1G/C5AR1/CCR5/IL2RA | 0.034 | |
| cytokine activity | IL7/GDF7/TNF/CD40LG/CCL3L1/VEGFA | 0.034 | |
| receptor ligand activity | IL7/GDF7/TNF/CD40LG/CCL3L1/VEGFA/APLN/VEGFD | 0.034 | |
| signaling receptor activator activity | IL7/GDF7/TNF/CD40LG/CCL3L1/VEGFA/APLN/VEGFD | 0.034 | |
| signaling receptor regulator activity | IL7/GDF7/TNF/CD40LG/CCL3L1/VEGFA/APLN/VEGFD | 0.037 |
Disclaimer/Publisher’s Note: The statements, opinions and data contained in all publications are solely those of the individual author(s) and contributor(s) and not of MDPI and/or the editor(s). MDPI and/or the editor(s) disclaim responsibility for any injury to people or property resulting from any ideas, methods, instructions or products referred to in the content. |
© 2023 by the authors. Licensee MDPI, Basel, Switzerland. This article is an open access article distributed under the terms and conditions of the Creative Commons Attribution (CC BY) license (https://creativecommons.org/licenses/by/4.0/).
Share and Cite
Donnenfield, J.I.; Proffen, B.L.; Fleming, B.C.; Murray, M.M. Responding to ACL Injury and its Treatments: Comparative Gene Expression between Articular Cartilage and Synovium. Bioengineering 2023, 10, 527. https://doi.org/10.3390/bioengineering10050527
Donnenfield JI, Proffen BL, Fleming BC, Murray MM. Responding to ACL Injury and its Treatments: Comparative Gene Expression between Articular Cartilage and Synovium. Bioengineering. 2023; 10(5):527. https://doi.org/10.3390/bioengineering10050527
Chicago/Turabian StyleDonnenfield, Jonah I., Benedikt L. Proffen, Braden C. Fleming, and Martha M. Murray. 2023. "Responding to ACL Injury and its Treatments: Comparative Gene Expression between Articular Cartilage and Synovium" Bioengineering 10, no. 5: 527. https://doi.org/10.3390/bioengineering10050527
APA StyleDonnenfield, J. I., Proffen, B. L., Fleming, B. C., & Murray, M. M. (2023). Responding to ACL Injury and its Treatments: Comparative Gene Expression between Articular Cartilage and Synovium. Bioengineering, 10(5), 527. https://doi.org/10.3390/bioengineering10050527