3.1. Qualitative Parameters of Silage
The quality of the individual silage variants was assessed by determining the following parameters: volatile solids content (VS), dry matter (DM), neutral detergent fiber (NDF), acid detergent fiber (ADF), crude fiber (CF), lignin, proteins, starch, sugars, lactic acid (LA), acetic acid (AA), titratable acidity (TA), and pH. The measured parameters are divided into three subsections that characterize the content or the state of selected indicators:
Section 3.1.1, DM, pH, VS, proteins, lipids, sugar;
Section 3.1.2, Starch, NDF, ADF, CF, lignin;
Section 3.1.3, LA, AA, LA/AA, TA, propionic acid, butyric acid. In general, measurement data show that contamination of the silages with molds leads to a deterioration in their qualitative indicators. The development of the measured indicators confirms the importance of adhering to the correct ensiling process [
53]: (a) appropriate harvest date (dry matter up to 35%); (b) quality of the chopped material—a length of 15–25 mm is sufficient at the optimal stage of maize maturity; (c) ensiling process—oxygen must be displaced from the harvested matter (shreddings), and then further access of oxygen into the silage must be prevented. An anaerobic environment has to be created in which no atmospheric oxygen is supplied. Only then can the respiration of cells stop and the fermentation of the lactic acid bacteria begin. A necessary factor that influences the quality of the resulting silage is also the supplementation of silage additives, most commonly lactic acid bacteria.
3.1.1. DM, pH, VS, Proteins, Lipids, and Sugar
The DM content in the silage ranged from 34.3% (MC variant) to 47.9% (HC variant). Differences between the variants were statistically significant (
Table 1). According to Wilkinson [
54], the ideal DM content in silage is 30–35%, with excessive DM content generally associated with susceptibility to molds. This indicates that all variants in our experiment with the exception of MC had a higher dry matter content than the value described as optimal by Wilkinson [
54], creating the conditions for the development of molds (particularly in HC).
The pH value in the aqueous solution (
Table 1) increased significantly with increasing optical contamination from 4.22 (LC) and reached 6.10 in the HC variant. Kung et al. [
55] state that a normal pH value for silage with a DM content of 30–40% is 3.7–4.0. The pH values of our test variants were higher, and significantly higher again in the HC variant. As the pH value is a physical factor that ensures the preservation of the silage, pH values above 6 indicate the probable development of molds and are evidence of poor silage management [
56].
The main cause of the drop in silage pH is the production of lactic acid (LA), a typical fermentation product during the ensiling of maize, the amount of which is significantly higher than the amount of other organic acids (acetic, propionic, and butyric acids) normally detected during ensiling [
57]. This is also confirmed by the results of our study, which showed a very strong negative correlation (R = −0.94) between the pH value and the concentration of LA in the silage (
Table A1).
Silage-degrading microorganisms are more effectively inhibited at lower pH values than at higher ones. In the past, silages with a pH value of more than 4.2 were considered of poor quality [
58]. Currently, silages with a high DM content are produced on a large scale and are stable even at relatively high pH values. Although pH remains one of the most important indicators of good fermentation in low-DM silages, it is not a reliable indicator in high-DM silage [
59]. This research also shows that DM content is very strongly correlated with pH (R = 0.95) and that the values of both parameters increase with increasing contamination of silage.
The VS content ranged from 92.05%
DM (MC) to 94.38%
DM (LC) and was significantly highest in the low contamination (LC) variant (
Table 1). According to Heuzé et al. [
60], the average VS content in maize silages with DM content of 35–40% ranges from 94.8 to 97.8%
DM. Wilkinson [
54] claims that an optimum VS content should be above 92%
DM.
The content of proteins, lipids, and sugars showed significant differences between the variants. The highest protein content was found in the HC variant, and the highest lipid and sugar contents were found in the LC variant (
Table 1). Heuzé et al. [
60] state that the average content of proteins and lipids in maize silage with 35–40% dry matter is approx. 6.8%
DM and 3.0%
DM, respectively. Therefore, we assume that the organic substances were degraded during the ensiling process and subsequently contaminated by molds. As microorganisms, molds first utilize readily available organic substances (sugars) and only then utilize the more complex forms such as lipids [
61]. Although this explains the reduced content of lipids and sugars, it does not explain the slightly increased content of proteins, which could have been caused by protein-based substances produced by molds [
62]. Kung et al. [
55] found that clostridial silages, for example, are often characterized by higher than normal pH and higher than normal soluble protein concentrations. The mycelial biomass of various fungi can be used as a rich source of mycoproteins [
63], and the production of microbial proteins by filamentous fungi is therefore a prospective bioprocess in the food and feed industry [
64]. In some fungal groups, the mycelium is able to convert the otherwise difficult-to-process lignocellulosic substrates into proteins and can therefore be used as a sustainable source [
65].
3.1.2. Starch, NDF, ADF, CF, and Lignin
The experimental variants did not differ statistically in their starch content. However, the fiber (NDF, ADF, CF,
Table 2) and lignin contents were significantly highest in the HC variant. Heuzé et al. [
60] claim that the average starch content in maize silage with 35–40% dry matter is approx. 31.6%
DM. Based on a meta-analysis, García-Chávez et al. [
66] give an average value for the starch content of 23.3%
DM.
3.1.3. LA, AA, LA/AA, TA, Propionic Acid, Butyric acid
The LA content ranged from 0.65%
DM (HC) to 1.44%
DM (LC), and the difference between LC and MC on the one hand and HC on the other was statistically significant (
Table 3). Kung and Shaver [
57] claim that the usual values of LA concentration in maize silages with 30–40% dry matter are between 4 and 7%
DM.
Similarly, the AA content decreased with increasing contamination, although the differences between the variants were statistically significant. According to Wilkinson [
54], the optimum AA content in maize silage is 2–3%
DM. In our experiment, the concentrations of both LA and AA were very low in all variants (
Table 3) and were below the values described as optimal.
According to Kung et al. [
55], lactic acid is one of the most important substances indicating the course of fermentation in silages with a low dry matter content. During the ensiling process, the LA produced by the lactic acid bacteria usually occurs in the highest concentration and is most strongly involved in lowering the pH value during fermentation, as it is about 10 to 12 times stronger than all other major acids [
55]. However, in silages with a high DM content, the LA content does not always indicate successful fermentation [
59]. Fermentation during which LA is produced leads to the lowest losses of dry matter and energy during storage [
57]. The LA/AA ratio is commonly used as an indicator of the quality of fermentation. During optimal silage fermentation, the ratio of these acids usually ranges from approximately 2.5 to 3.0 [
55]. An LA/AA ratio below 1 is usually an indication of abnormal fermentation. Low concentrations of AA may not be sufficient to inhibit lactate-assimilating yeast [
55,
57].
In our experiment, the LA/AA ratio ranged from 0.94 (MC variant) to 1.99 (HC variant) and was statistically significantly highest in the HC variant compared to the other two variants (
Table 3). This shows that the values of all three variants were below the interval considered to be optimal. One reason for this was the very low content of LA, which was far below the usual values in maize silage [
57]. The values of all parameters thus clearly indicate an increase in aerobic degradation, which correlates with the degree of silage contamination by molds. The aerobic phase can change the chemical composition of the silage after the silo has been opened. Increased pH (>6.0) caused by the growth of yeasts responsible for silage degradation leads to active growth of toxicogenic fungi during the feeding phase, especially in poorly treated silages [
56]. The presence of propionic acid and butyric acid was below the detection limit of 10 mol/L.
3.3. Effect of Mycotoxins on the Production of Biogas and Methane
The production of biogas and methane ranged from 0.4305 (MC variant) to 0.6178 m
3/kg
VS (LC variant) and from 0.2248 (MC variant) to 0.3792 m
3/kg
VS (LC variant), respectively. The measured values are summarized in
Table 7. The LC variant exhibited a statistically significantly higher biogas and methane yield than the MC and HC variants.
In particular, the methane concentration in the biogas showed no statistically significant differences between the respective variants. The final concentration of methane in the biogas ranged from 63%
vol to 64%
vol (
Table 8).
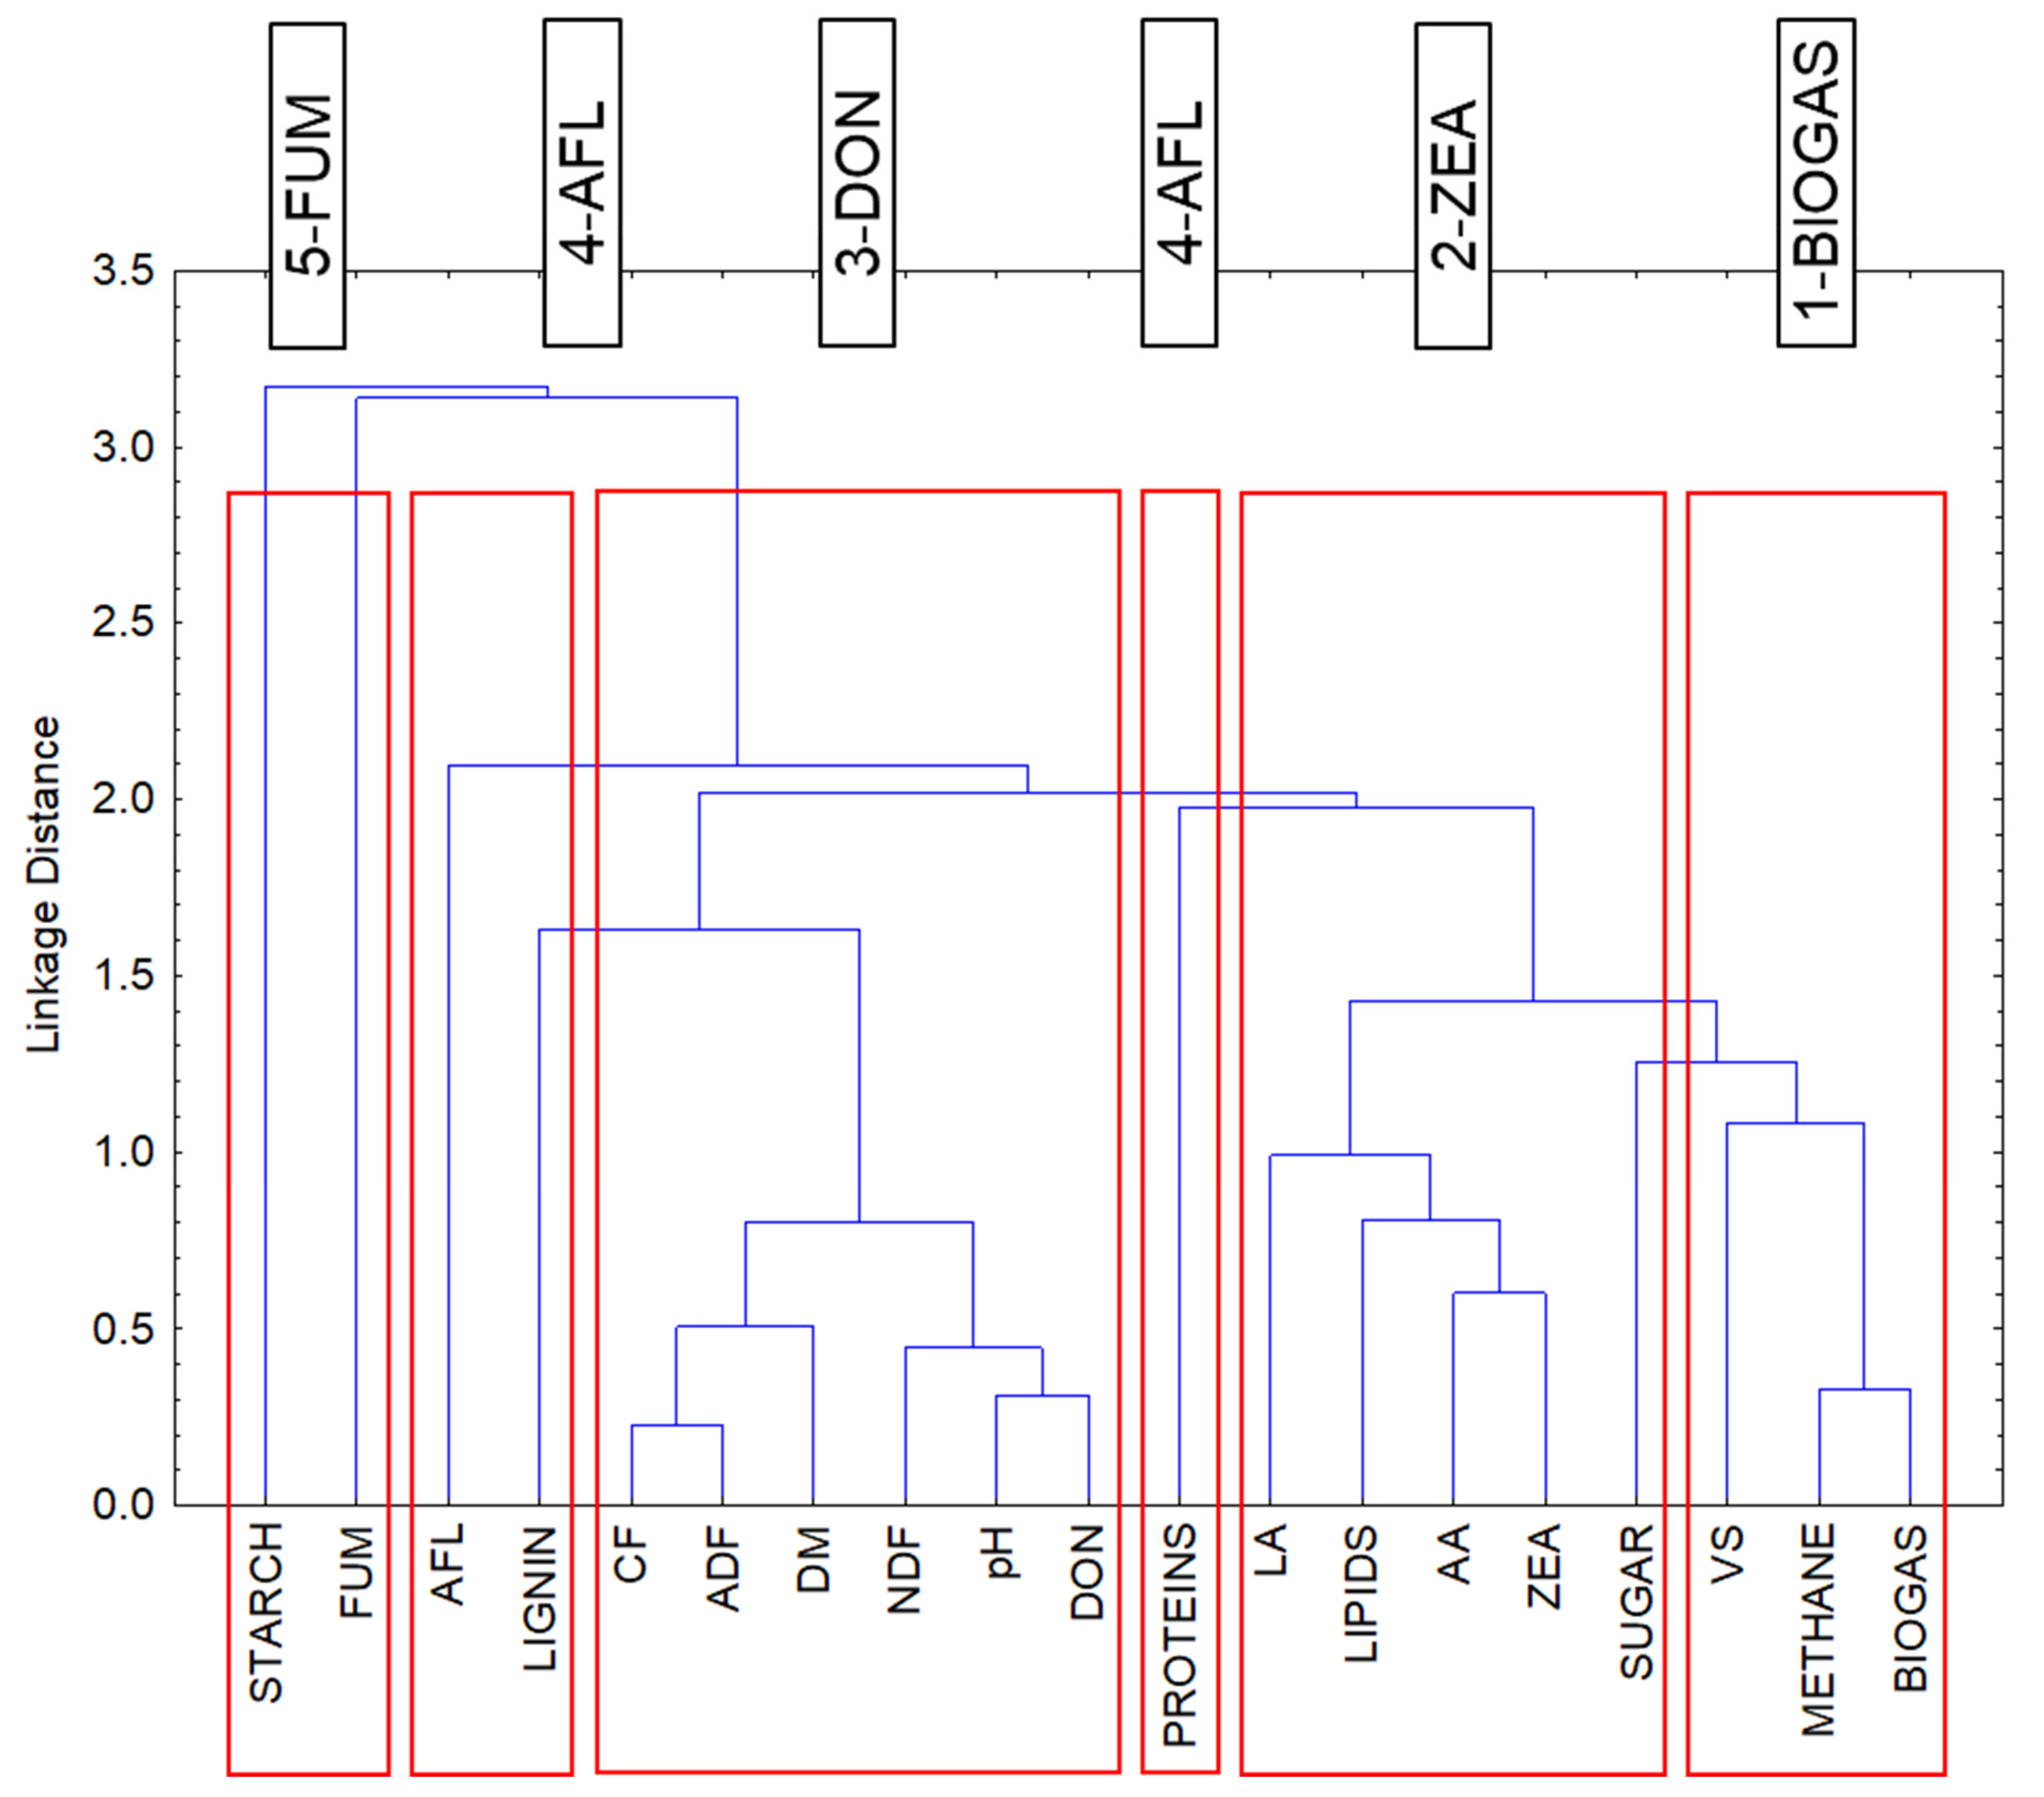
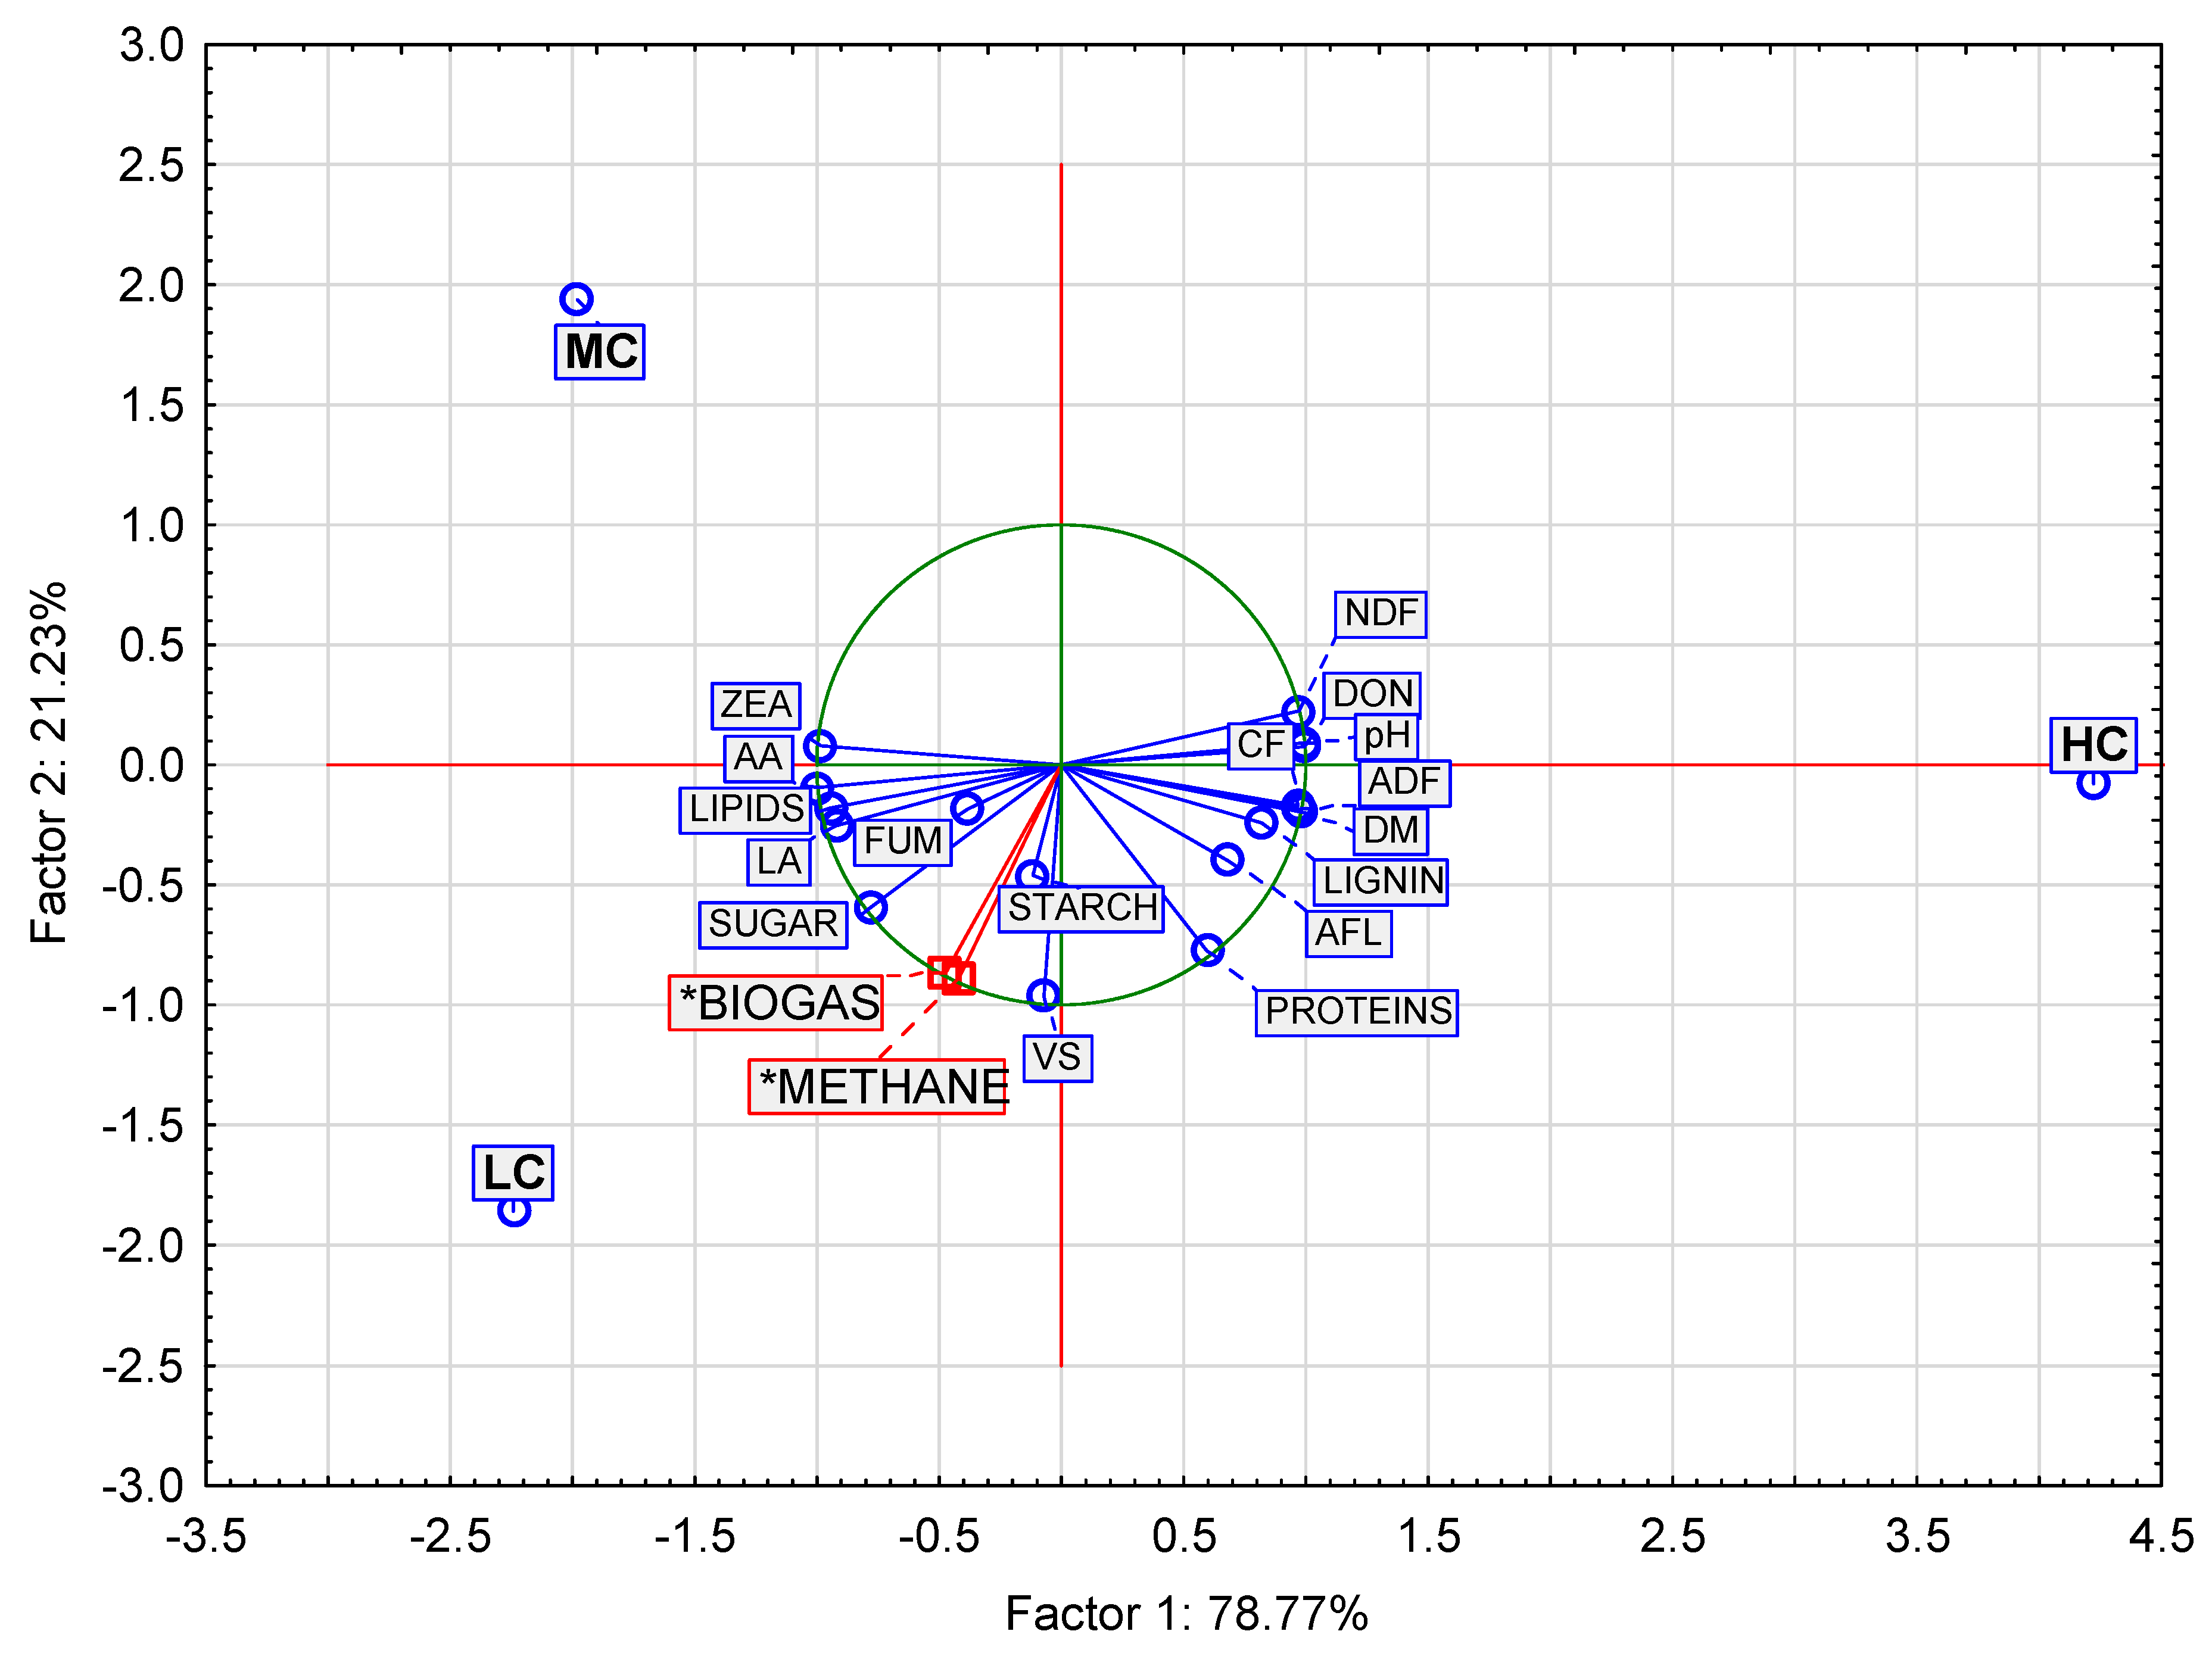
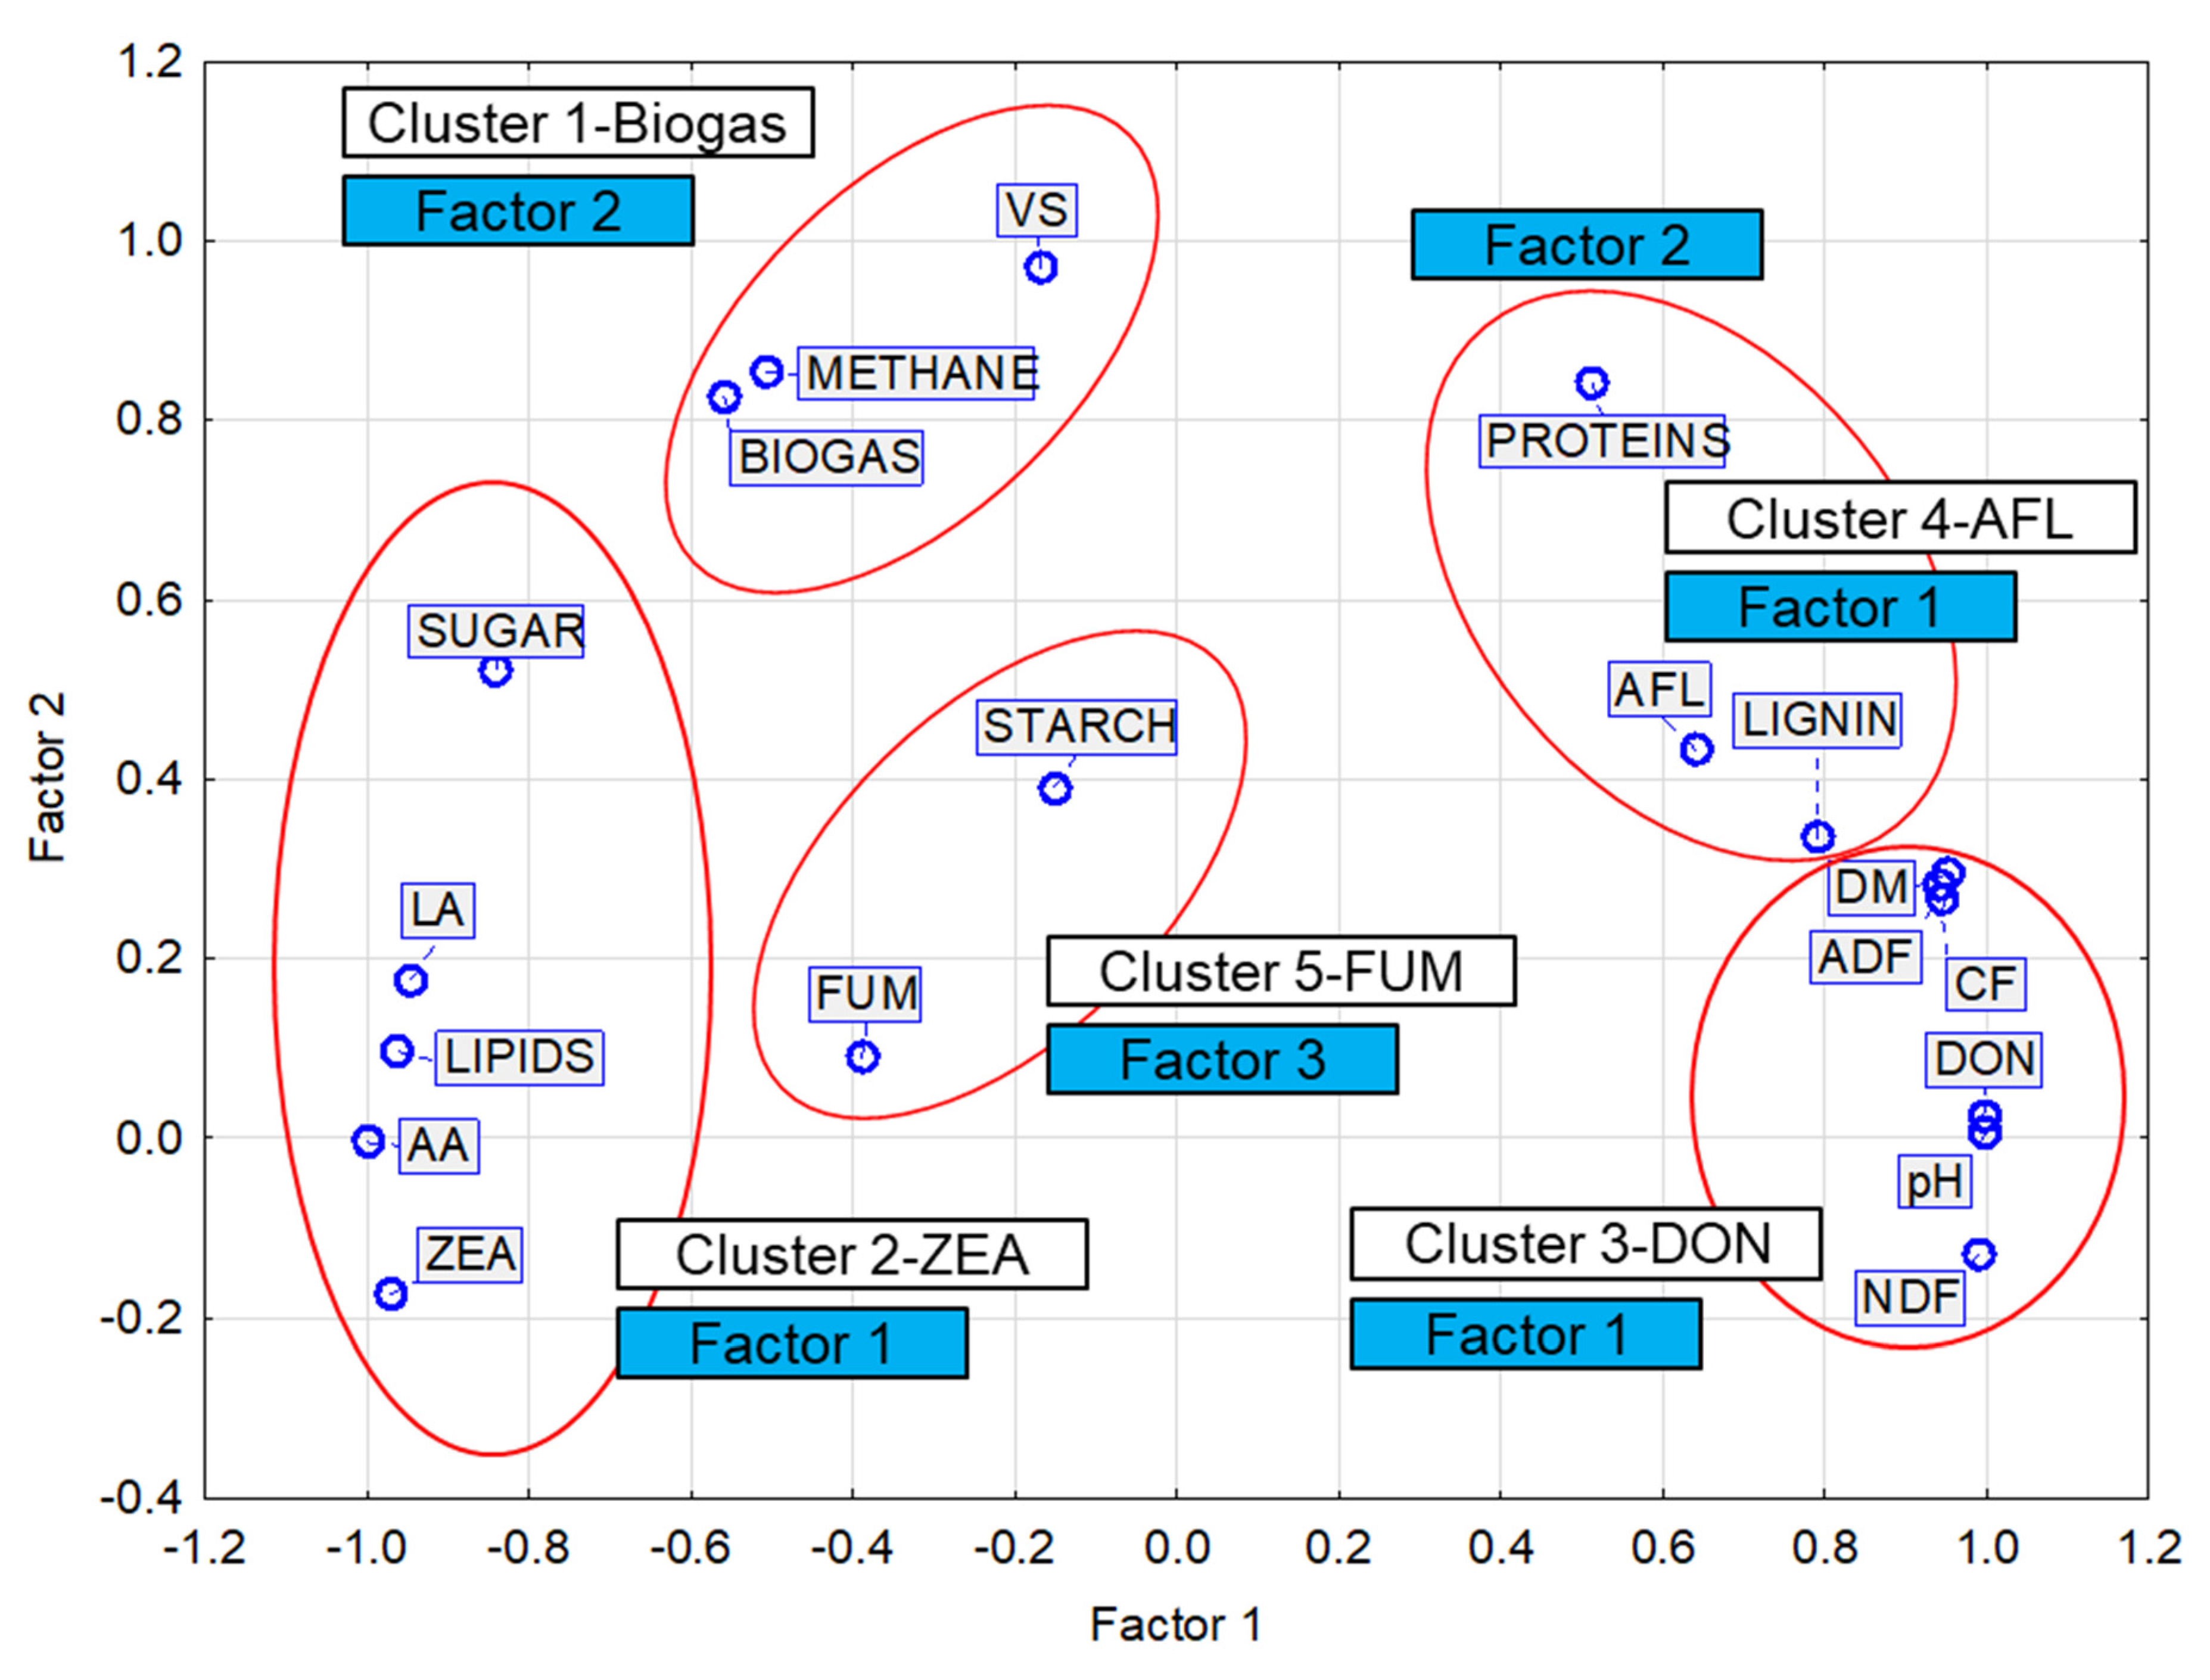
The resulting categorization into five clusters (
Table 9) is consistent with the results of the factor analysis with three factors of which Factor 1 represents the members of three clusters: Clusters 2, 3 and 4. Cluster 2 includes variables with the negative factor loadings of Factor 1, while Clusters 3 and 4 have positive factor loadings (except proteins) (
Table 9). The results of the correlation analysis (
Table 9 and
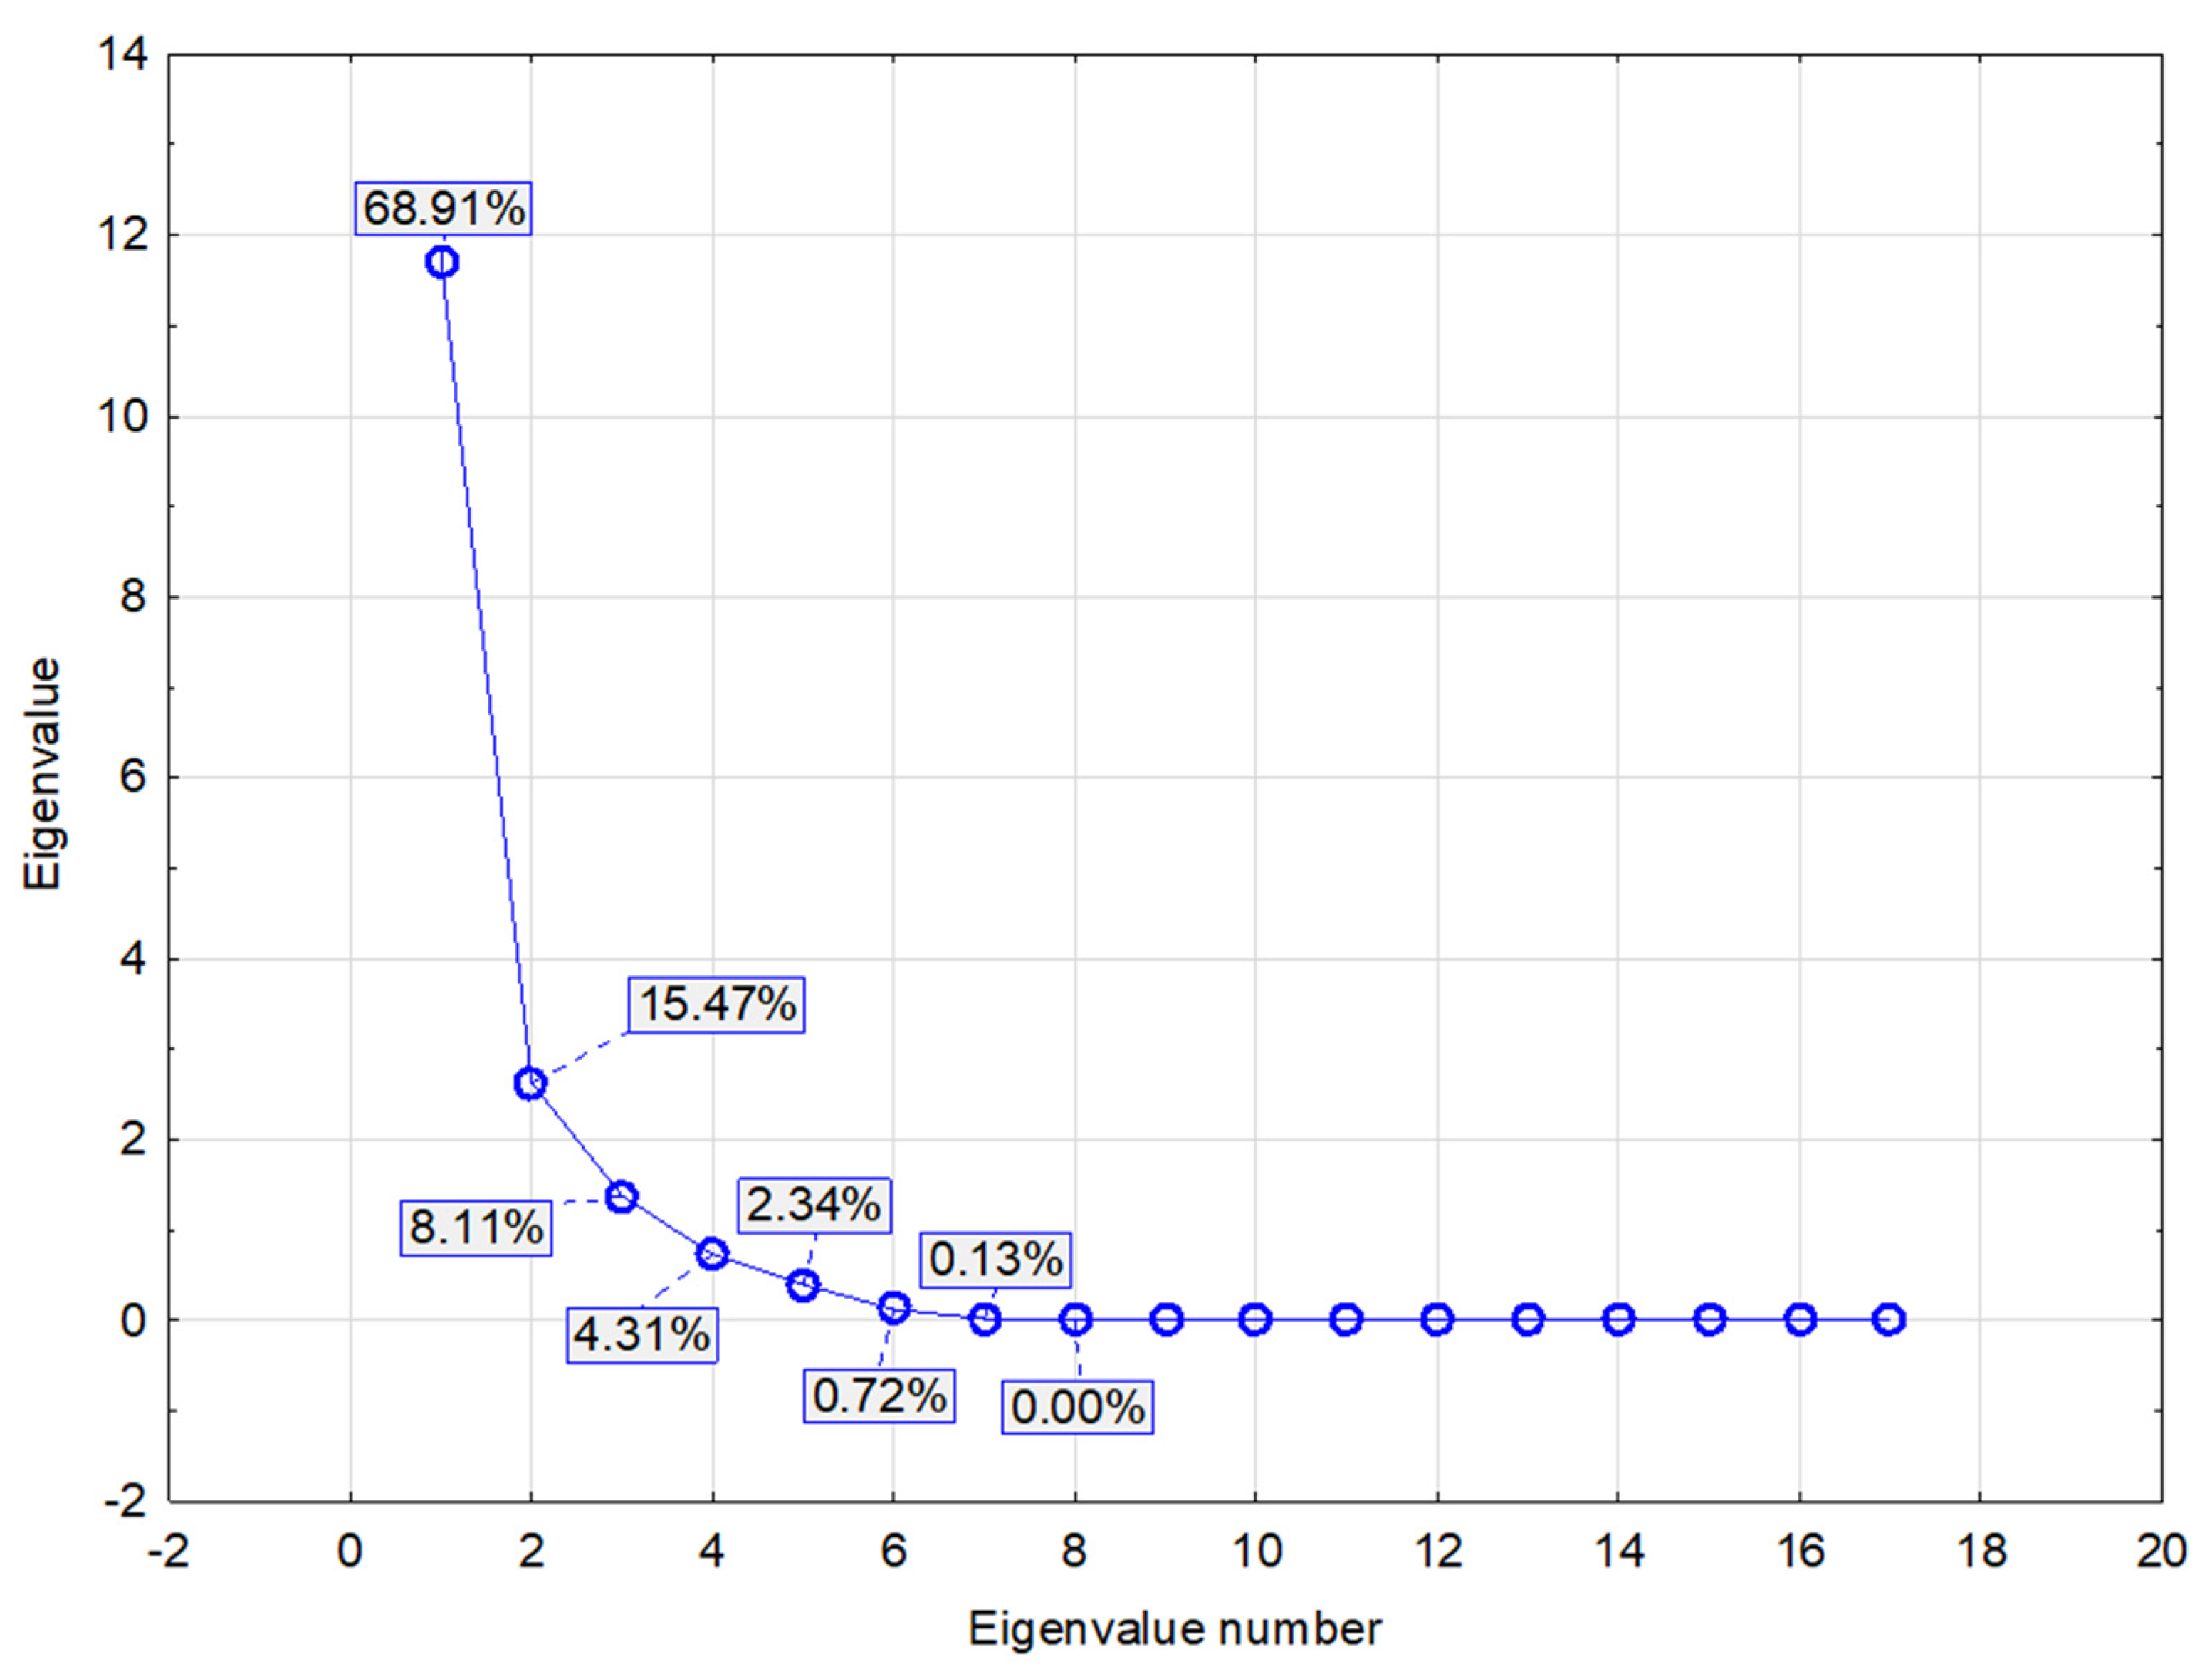
Table A1) show that none of the four mycotoxins has a significant correlation with the production of biogas or methane. As mentioned in the above subsection, Factor 1 explained the influence of the mycotoxin concentration in the silage, and Factor 2 explained the type of mycotoxin.
Although a moderately strong negative, statistically non-significant correlation was found between biogas and methane production and DON content (R = −0.54 and R = −0.48, respectively), this dependence can be considered secondary, as much stronger significant positive correlations were found between biogas and methane production and parameters belonging to Cluster 1 (VS) and Cluster 2 (sugars, lipids, and LA). In contrast, the DON content had a strong negative correlation with the members of Cluster 2 (
Table A1). This result is consistent with the conclusions of Ferrara et al. [
1], according to which the high content of mycotoxins had no influence on the overall production of biogas, especially methane. The same conclusions were reached by De Gelder et al. [
24].
According to Merrettig-Bruns and Sayder [
22], the fermentation of moldy maize silage as the only substrate led to a lower biogas yield compared to the fermentation of maize silage without molds. The authors also report that an extended analysis of subgroups revealed a significantly lower content of easily digestible carbohydrates in silages made from moldy maize.
The comparison of the LC and HC variants shows that the biogas and methane yield was primarily reduced by the statistically significant decrease in the contents of VS, sugars, lipids, LA, and AA (members of Cluster 1 and Cluster 2) and at the same time by an associated statistically significant increase in the contents of NDF, ADF, and CF (members of Cluster 3) in the HC variant. However. The content of ADF, CF, and lignin was lower in the MC variant (by 8–11%) than in the LC variant, and the content of NDF was higher (by 9%) than that in the LC variant. The comparison of the LC and MC samples also showed only a slight difference in the content of lipids, LA, and AC and in the value of LA/AA. This process was accompanied by increased values for DM, pH, and LA/AA and a reduced value for TA.
Obviously, there were technological errors in the silage treatment, which led to changes in the substrate composition, resulting in reduced production of LA and thus insufficient preservation of the silage and its devaluation. This is also indicated by the titratable acidity (TA) values, which decreased in statistically significant proportion to the degree of contamination (
Table 3).
The primary factor that reduced the production of biogas and methane is therefore the aerobic degradation of the silage in correlation with the changes in its composition expressed by contents of VS, sugars, LA, and AA and their ratios. The ratios showed a moderately strong to strong positive correlation, increasing the production of both gases. In contrast, the biogas and methane yield decreased with increasing content of NDF, ADF, CF, and lignin. The secondary factor related to the changes in substrate composition was the development of undesirable microorganisms that further contributed to substrate degradation and mycotoxin production. According to McDonald et al. [
82], yeasts can oxidize lactic acid and thus increase the pH of the silage, which favors the growth of other microorganisms.
The division of mycotoxins (DON, ZEA, FUM, AFL) into four clusters (Clusters 2, 3, 4, 5) could be related to the conditions under which microorganisms producing the respective toxins can develop successfully (
Figure 5,
Table A1).
ZEA has a strong positive correlation with the contents of lipids, sugar, LA, and AA and a negative correlation with the values of pH; DM; and the content of NDF, ADF, CF, and lignin.
- 2.
Cluster 3—DON
DON has a strong positive correlation with the values of pH; DM; and the content of NDF, ADF, CF, and lignin and a negative correlation with the contents of lipids, sugar, LA, and AA.
- 3.
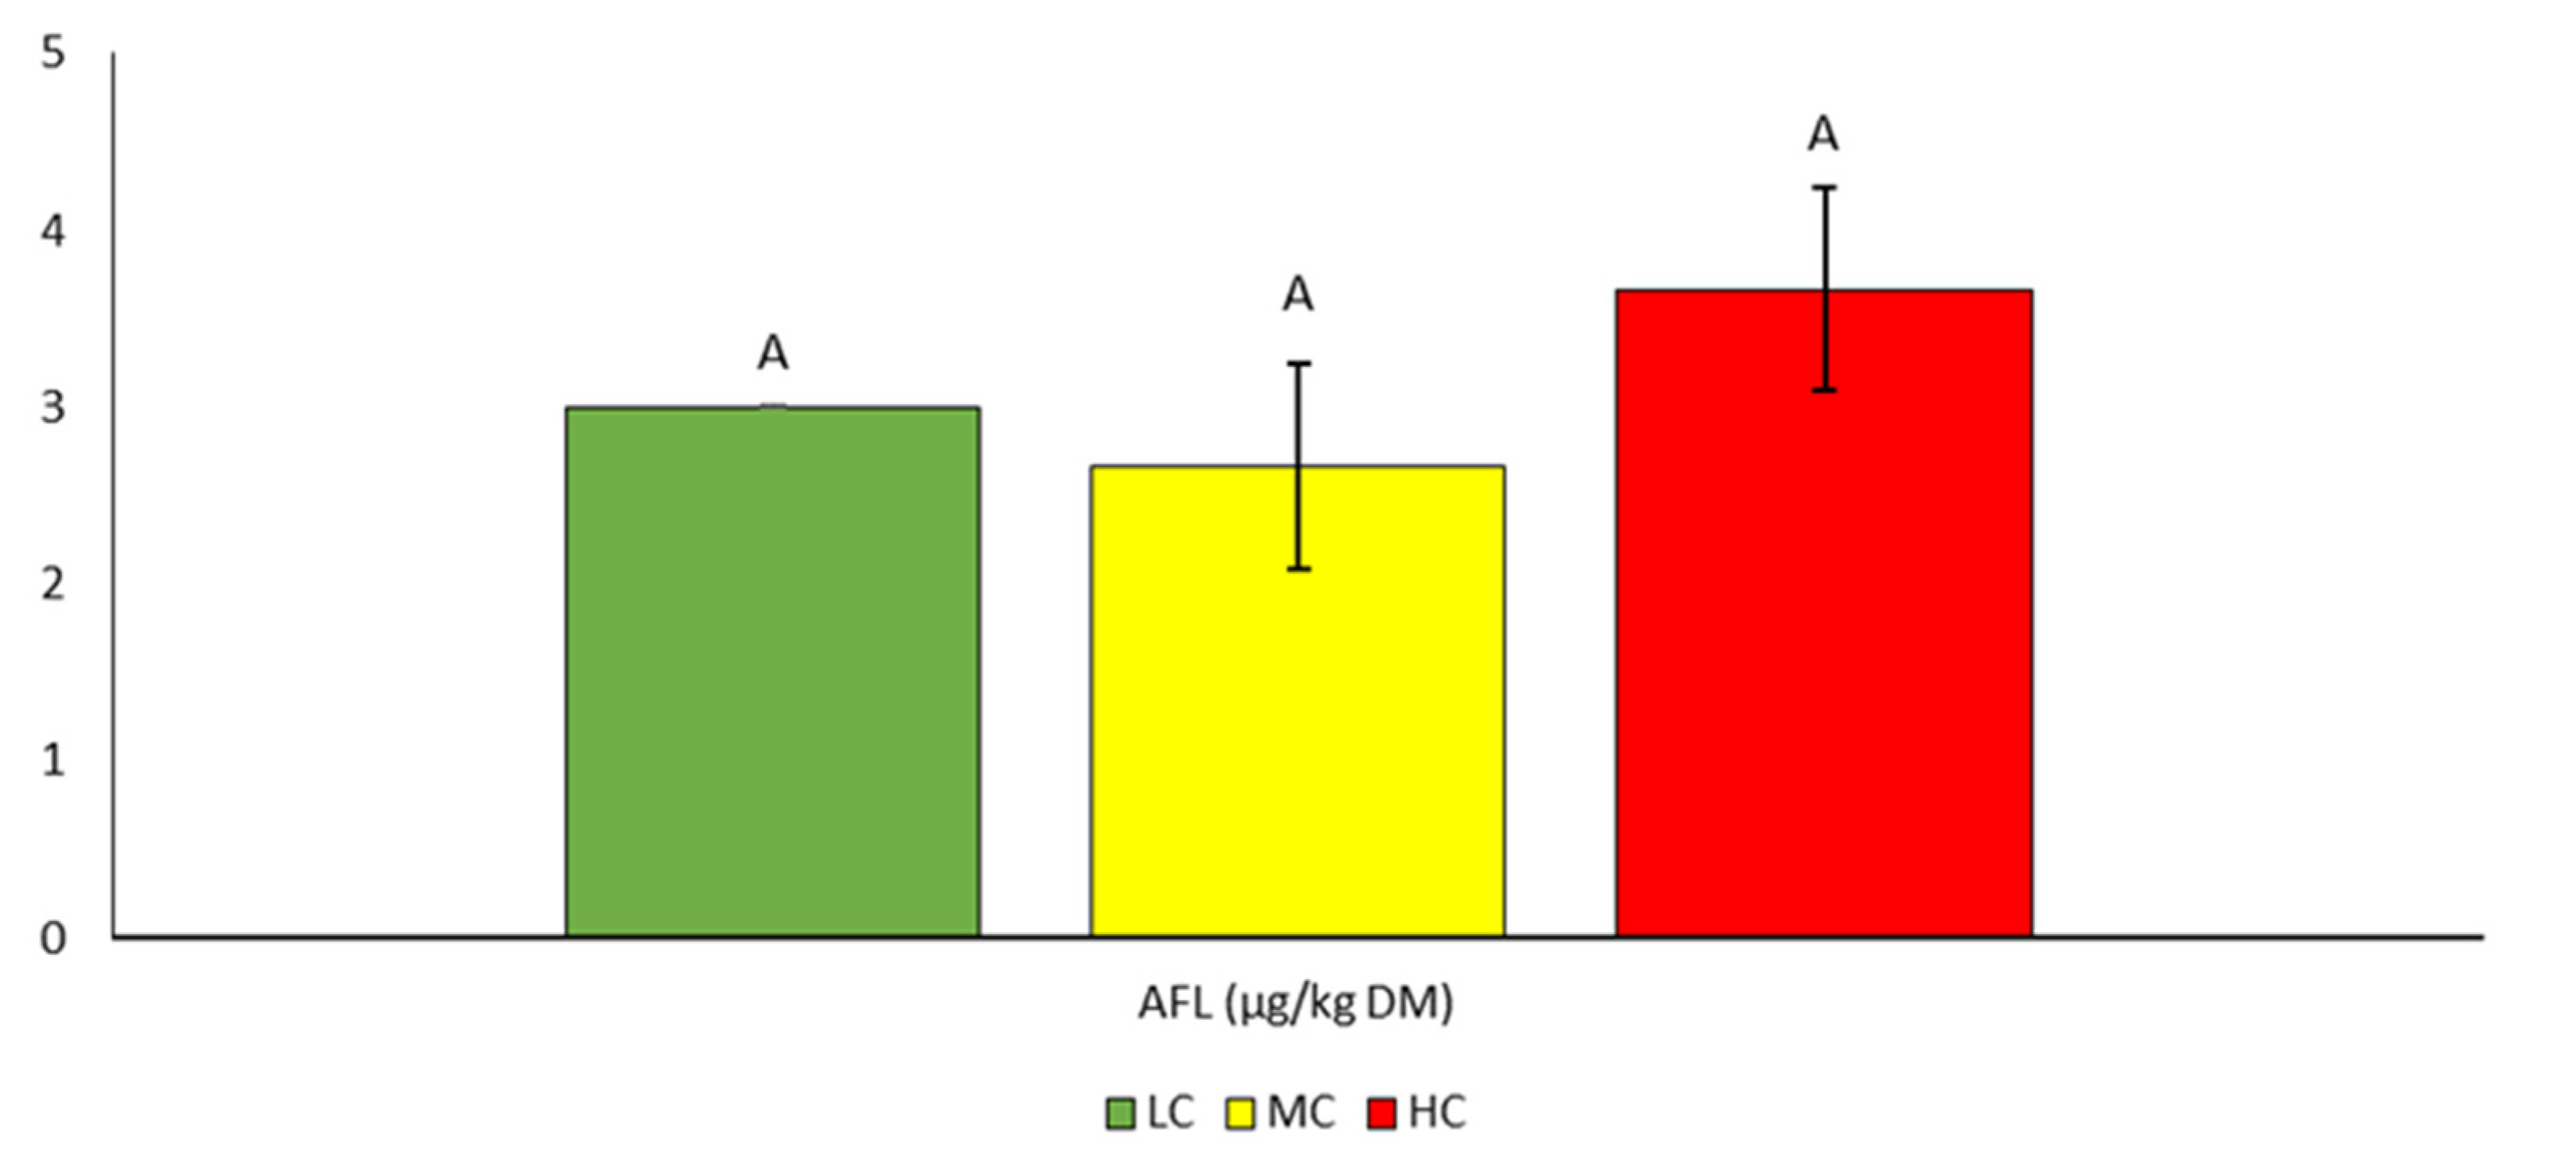
Cluster 4—AFL
With respect to the mutual proximity of Cluster 3 (DON) and Cluster 4 (AFL) (
Figure 5), the AFL content has a moderately strong positive correlation with the values of DM; pH; and lignin, NDF, ADF, and CF content and, similar to the DON content, a negative correlation with members of Cluster 2 (ZEA) (LA, AA, lipids).
- 4.
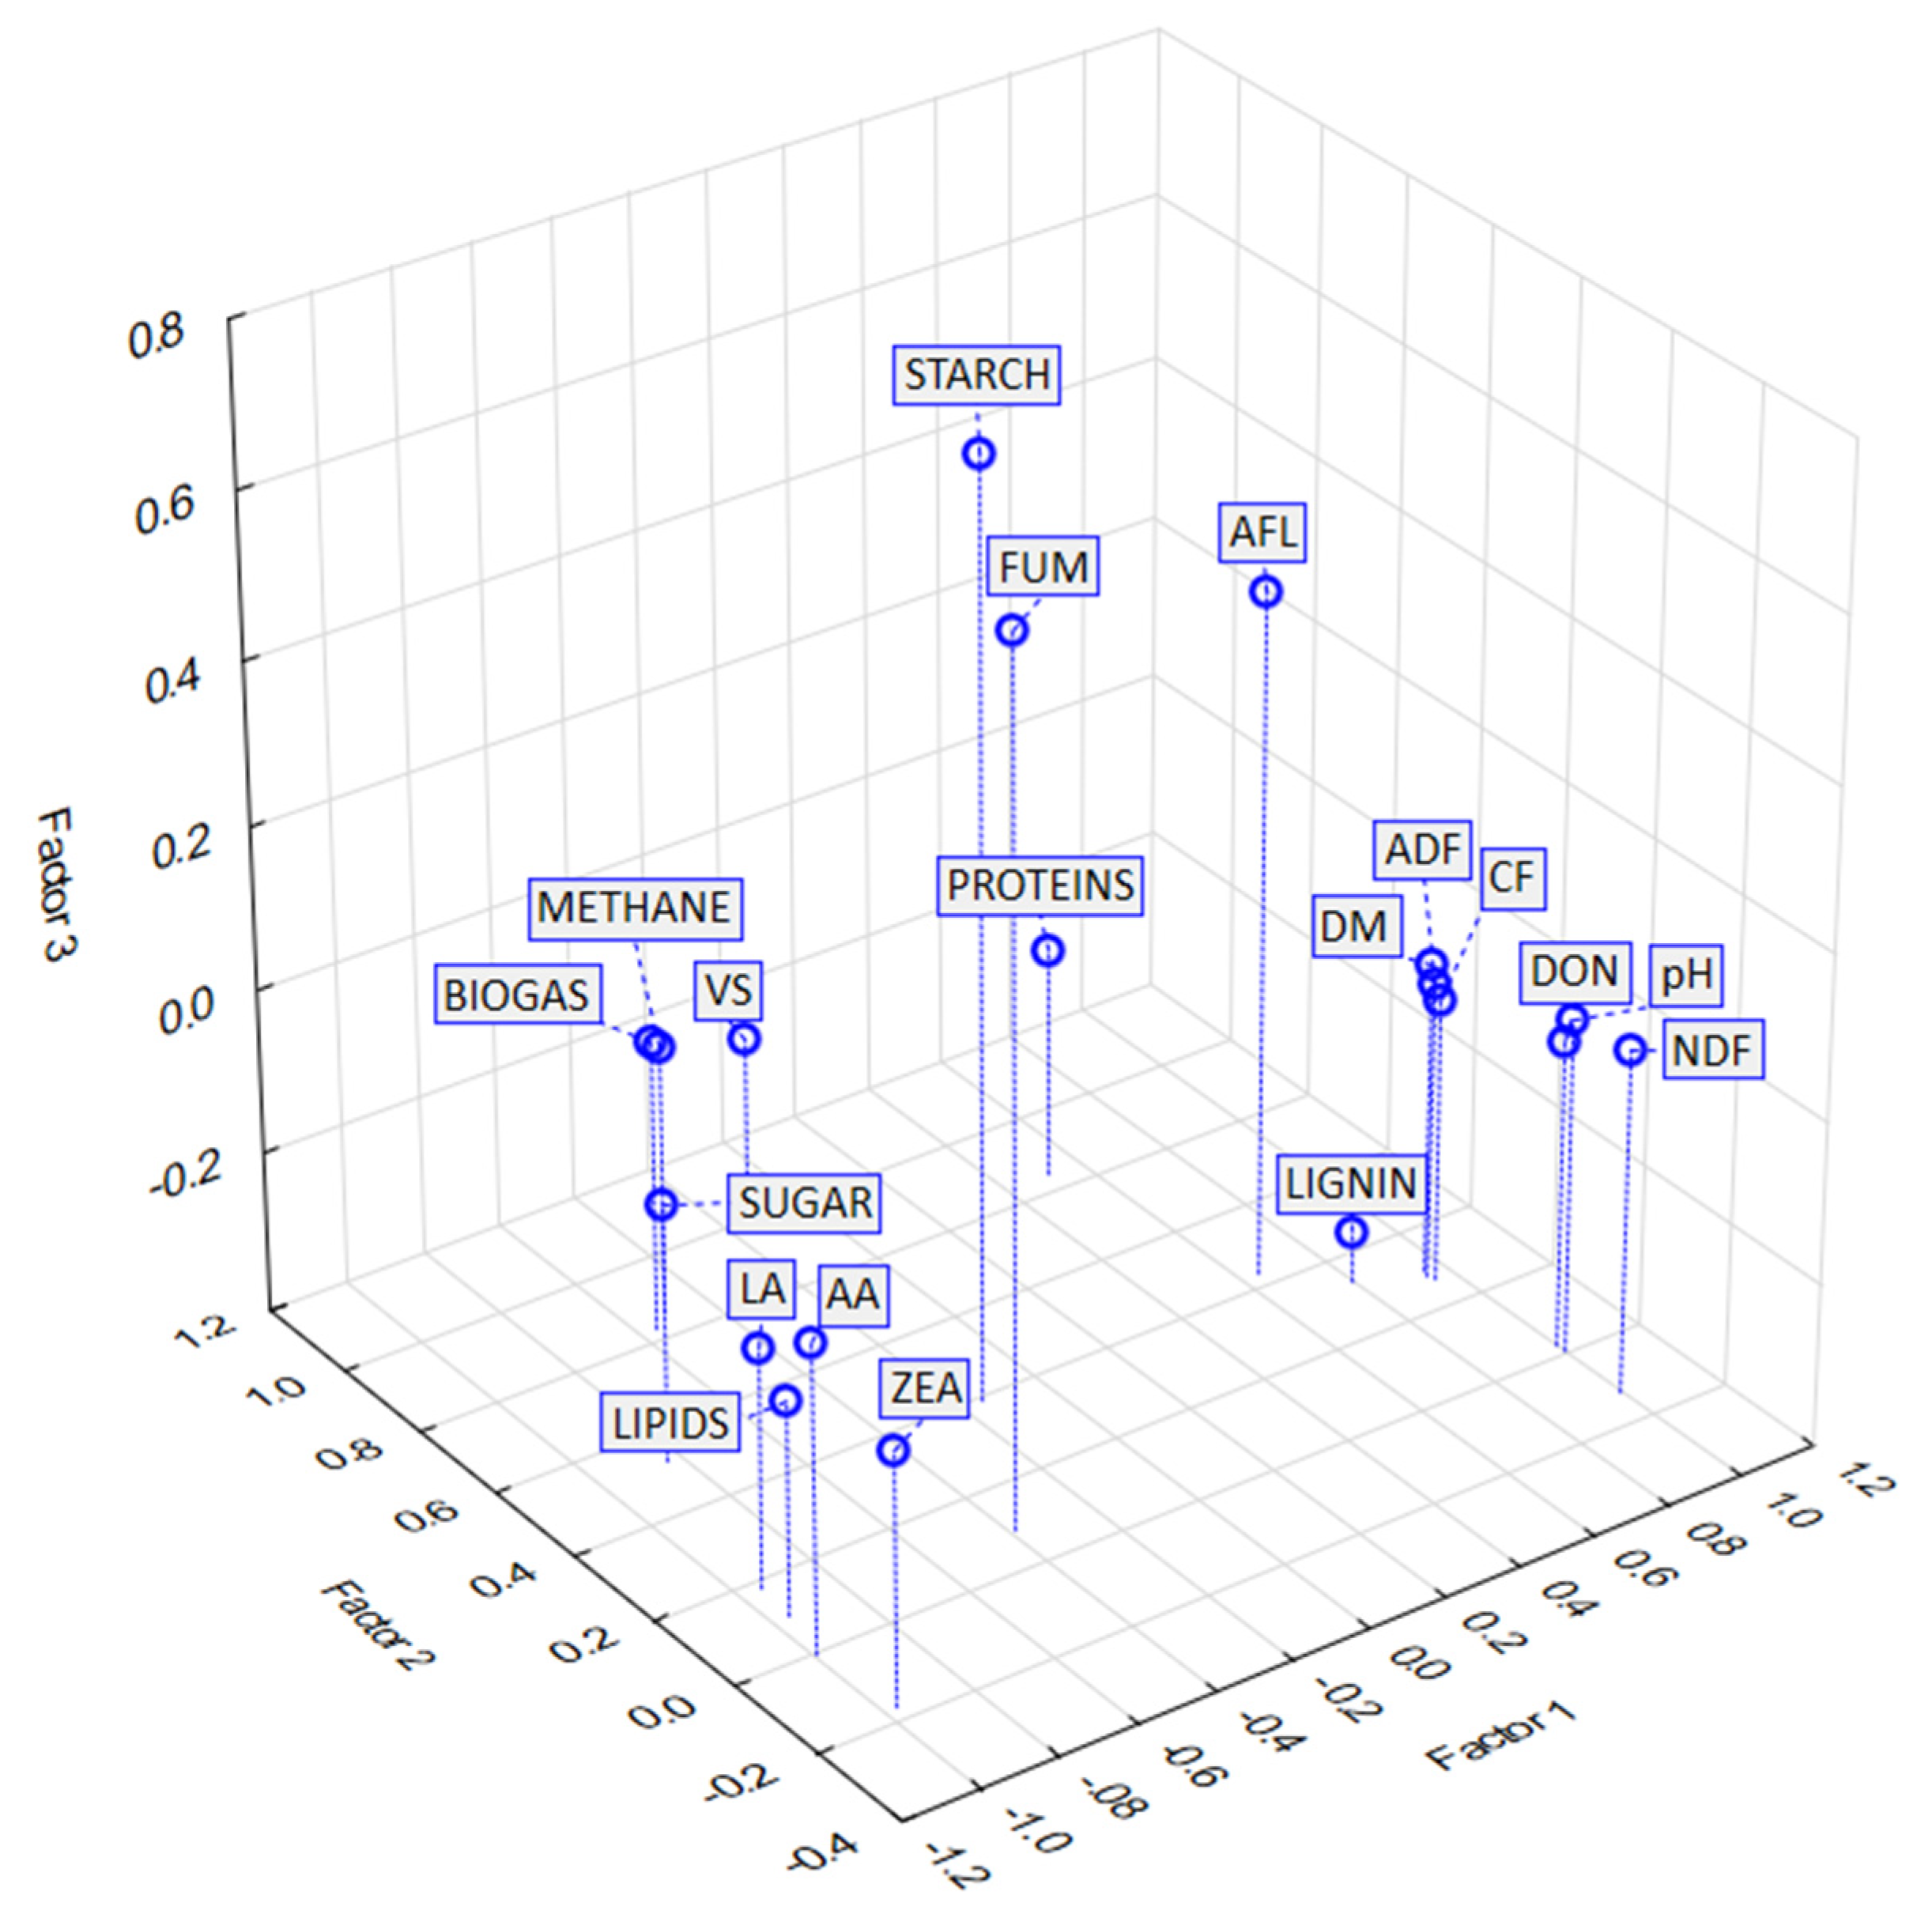
Cluster 5—FUM
This cluster contains only FUM and starch. The contents of both FUM and starch show only a weak or slight dependence on the variables in the other clusters and also on each other. These two variables are the only ones represented by Factor 3 (
Table 9). It can therefore be assumed that the levels of FUM and starch are related to parameters that were not considered in this study. This fact is illustrated in
Figure A3.
Silages may contain a mixture of mycotoxins resulting from both pre-harvest contamination with
Fusarium spp. and
Aspergillus spp. [
72,
83] and post-harvest contamination by molds which commonly occur in silages, such as
Penicillium spp. or
Aspergillus spp. [
84,
85]. According to Zain [
86], there are many common molds that do not produce mycotoxins. The presence of molds in silage does not have to always indicate the presence of mycotoxins, and the absence of molds does not indicate the absence of mycotoxins. Conditions for the growth of molds and for the development of mycotoxins do not have to be always the same [
76]. Molds of
Fusarium spp. for example can grow intensively at temperatures ranging from 25 to 30 °C without producing mycotoxins, while at temperatures below the freezing point, they produce large quantities of mycotoxins with minimal growth [
76,
87].
3.4. Content of Mycotoxins in Digestate
The comparison of the contents of mycotoxins DON, ZEA, FUM, and AFL in the silage and in the digestate (
Table 10) shows that the mycotoxins were degraded during the anaerobic fermentation process, and their content was reduced by 27–100%. The only exception is the LC variant in which the concentration of DON increased by 27.8%. This can be explained by the fact that the sample contained the lowest initial concentration of DON which was not metabolized by the microorganisms. During the process of anaerobic digestion, the mass of the initial feedstock was reduced, which could have led to the higher concentration of DON in the digestate.
Similar results were also published by Ferrara et al. [
1], who reported in their study that the degradation of mycotoxins was approx. 54% for aflatoxin B1 and 60% for fumonisins. De Gelder et al. [
24] report that in batch tests with mycotoxins, aflatoxin B1, ochratoxin A, deoxynivalenol, zearalenone, and T-2 toxin were degraded by more than 90%. According to Richter et al. [
88], the ensiling of DON-contaminated maize groats showed a significantly reduced DON content; the DON content was also reduced during the fermentation of whole-grain maize. These facts show that the use of mycotoxin-contaminated substrates for biogas production is a good way for their processing, although some studies conducted with mycotoxins in contaminated raw materials for biogas production indicated that the toxins are degraded at different rates during the anaerobic fermentation process [
23,
24,
28]. However, further investigation of the effect of mycotoxins on the methanogenic archaea in the fermenter and the transfer of mycotoxin residues from the digestate to arable land and thus to crops is a necessary prerequisite.
The measured levels of mycotoxins in silage and the influence of these mycotoxins on the process of biogas production and possibly on the quality of digestate confirm that appropriate attention should be paid to the ensiling process. According to Rada and Vlková [
89], the ensiling process requires quality control and strict organization. Compaction of the ensiled material (either maize biomass or biomass of forage plants) is elementary, and the air must be pressed out. The addition of silage inoculants (lactic acid bacteria) is also necessary. As far as the compaction of the silage and its covering are concerned, there are not too many alternative technologies that would differ significantly. With silage inoculants, however, you have the choice between a large number of homofermentative and heterofermentative lactic acid bacteria [
90,
91,
92]. Homofermentative bacteria produce lactic acid, while heterofermentative bacteria are also able to produce acetic acid [
90]. Heterofermentative inoculants in particular open the way for innovations in the ensiling process, as these bacteria can also produce enzymes, in addition to lactic and acetic acids, which contribute to better stability of the ensiling process and to the quality of the silage. According to Rada and Vlková [
89], however, it is necessary to distinguish between the type of plant biomass to be ensiled (different inoculants for maize biomass and for crops difficult to ensile such as alfalfa) and the type of preparation (length of the chopped material). Therefore, the choice of an ensiling agent is an important part of the ensiling process, influencing not only the quality of the resulting silage, but also its durability.

 ,
, 