Article

Genomic Insights on the Carbon-Negative Workhorse: Systematical Comparative Genomic Analysis on 56 Synechococcus Strains

School of Life Sciences and Biotechnology, Shanghai Jiao Tong University, Shanghai 200240, China
*
Author to whom correspondence should be addressed.
Bioengineering 2023, 10(11), 1329; https://doi.org/10.3390/bioengineering10111329
Submission received: 30 September 2023 / Revised: 31 October 2023 / Accepted: 9 November 2023 / Published: 18 November 2023
(This article belongs to the Section Biochemical Engineering)

Abstract

:
Synechococcus, a type of ancient photosynthetic cyanobacteria, is crucial in modern carbon-negative synthetic biology due to its potential for producing bioenergy and high-value products. With its high biomass, fast growth rate, and established genetic manipulation tools, Synechococcus has become a research focus in recent years. Abundant germplasm resources have been accumulated from various habitats, including temperature and salinity conditions relevant to industrialization. In this study, a comprehensive analysis of complete genomes of the 56 Synechococcus strains currently available in public databases was performed, clarifying genetic relationships, the adaptability of Synechococcus to the environment, and its reflection at the genomic level. This was carried out via pan-genome analysis and a detailed comparison of the functional gene groups. The results revealed an open-genome pattern, with 275 core genes and variable genome sizes within these strains. The KEGG annotation and orthology composition comparisons unveiled that the cold and thermophile strains have 32 and 84 unique KO functional units in their shared core gene functional units, respectively. Each KO functional unit reflects unique gene families and pathways. In terms of salt tolerance and comparative genomics, there are 65 unique KO functional units in freshwater-adapted strains and 154 in strictly marine strains. By delving into these aspects, our understanding of the metabolic potential of Synechococcus was deepened, promoting the development and industrial application of cyanobacterial biotechnology.

1. Introduction

The oxygen-producing photosynthesis of cyanobacteria is one of the most profound physiological roles of microorganisms within the Earth’s environment and evolution of life. Synechococcus and Prochlorococcus are the two most dominant groups of cyanobacteria [1,2]. Compared to the latter, Synechococcus is a more versatile responder and widely distributed species, with diverse metabolic forms [3], playing a pivotal role in resource utilization and environmental protection, such as wastewater treatment, high-value product extraction, and biomass transformation [4], thus contributing to a dual harvest of economic and ecological benefits.
Synechococcus is a genus of cyanobacteria defined by its morphological characteristics [5]. Its size ranges from 0.2 to 2 μm. In 1979, Paul W. Johnson officially recognized it as “small unicellular cyanobacteria with ovoid-to-cylindrical cells that reproduce through binary traverse fission in a single plane and lack sheaths” [6]. Synechococcus exhibits extensive diversity in ecological habitats and can be found in various ecosystems, including some of the most extreme environments such as hot springs, the equator, and polar regions [7]. Many Synechococcus species have key advantages such as high biomass, fast growth rate, genetic editing capability, and potential for conversion into biofuels [8], making them ideal model organisms for promoting the development of new synthetic biology chassis. Synechococcus strain UTEX 2973 is a fast-growing cyanobacteria strain with good resistance to high temperature and huge potentials for the production of carbohydrate feedstocks, accumulating glycogen contents as high as 50% of dry cell weight independent of nitrogen depletion [9]. It represents a promising candidate for use as a synthetic biology chassis. Previously, Synechococcus was tested and optimized as chassis for PHB production [10]. Furthermore, Synechococcus elongatus PCC 7942 was genetically modified to include the heterologous pathway for PLA production, making it a suitable chassis for bioplastic synthesis [2]. Of note, synthetic biology provides powerful technical support for the industrialization of Synechococcus. Emerging synthetic biology tools, such as regularly interspaced, clustered, short palindromic repeats (CRISPR)/cpf1, riboswitches, and metabolic network reprogramming circuits, have accelerated the industrial applications of these tools [11]. By improving the host characteristics, researching and implementing pathway engineering strategies, and enhancing target products, synthetic biology technology is expected to push the industrialization of Synechococcus to a new level [12].
Since the sequencing of the first strain of Synechococcus sp. WH 8102 in 2003 [13], complete genomic sequences and annotation information of this genus have been emerging. In 2009, scientists successfully assembled the first complete Synechococcus strain CC9902, with a genomic size of 2.24 Mb. In 2020, the sequencing of the strain CBW1006 was completed; this strain had the largest genome at 3.86 Mb among the sequenced strains. Synechococcus comprises relatively small genome sizes and complexities [14], consisting of a single circular chromosome without plasmids, with genes necessary for survival and photosynthesis, allowing for adaptive advantages for survival [15].
However, due to the complexity and instability of their growing environments, industrial production faces many challenges. Synthetic biology attempts to achieve design goals by reconstructing metabolic networks, but the complexity of metabolic networks increases the uncertainty of this process. Comparative genomic analysis can identify key nodes and regulatory factors in metabolic networks, guiding the rational reconstruction of metabolic networks and providing theoretical support for improving the environmental adaptability of Synechococcus.
Based on comprehensive genomic sequence analysis, 56 Synechococcus strains were compared in this study on the premise of clarifying genetic relationships, the adaptability of Synechococcus to the environment, its reflection at the genomic level in terms of the pan-genome, and a comparison of functional genes was explored. Moreover, six representative strains with different temperature and salinity preferences were selected, and some relevant key metabolic pathways and genes were identified, laying the foundation for research on salt and temperature adaptation mechanisms.

2. Materials and Methods

2.1. Synechococcus Strains and Database Accession Numbers

A total of 56 Synechococcus strains with complete assembly were accessed using the accession numbers listed in Table 1 for their genome characteristics.

2.2. Construction of Phylogenetic Trees

The phylogenetic analysis was conducted using the complete genome sequences of 56 Synechococcus strains as operational taxonomic units and established on GTDB (https://gtdb.ecogenomic.org/ accessed on 18 August 2023).
The relative evolutionary tree was constructed using MAFFT V7 (https://mafft.cbrc.jp/alignment/software/ accessed on 18 August 2023) with 16S rRNA, peroxiredoxin, and cytochrome C oxidase subunit I as evolutionary markers. During the alignment process, the “automated1” parameter option was selected, and the software automatically calculated and selected the optimal evolutionary distance model to obtain a tree file. The tree file format was visualized using the IQ-TREE web server (http://iqtree.cibiv.univie.ac.at/ accessed on 18 August 2023), and modified using the online tree aesthetic tool iTOL (https://itol.emnl.de/ accessed on 23 August 2023).

2.3. Pan-Core Genomes Analysis

The pan-genomic analysis was performed using the BPGA (Bacterial Pan Genome Analysis tool) software on selected strain genomes. Additionally, gnulpot was installed using USEARCH to perform power law regression analysis and generate a pan-core gene trend plot. The functional annotation module of BPGA was then utilized to visualize the COG functional annotation results by inputting genome sequences and COG data into GenBank format files, with specific parameters set such as an E-value threshold of 10−5 and the USEARCH clustering algorithm with an identity value of 0.5.

2.4. Analysis of Genes Exclusively Related to Temperature and Salinity

Six strains have been selected for comparative analysis that are representative, highly studied, and well-characterized in terms of temperature and salinity. These strains exhibit exceptional performance and robust tolerance, providing strong support for further research and applications. After enrichment and KEGG pathway analyses, the sequence information of the core genome was extracted and annotated in the KEGG database. The KO identifiers for common gene functional units were obtained and mapped to the KEGG pathway database to find metabolic pathways and the key genes related to environmental adaptation. These KO identifiers for temperature and salinity preference strains were organized into a text document format and uploaded to the online tool Venny (https://bioinfogp.cnb.csic.es/tools/venny/ accessed on 24 August 2023). This tool displays the intersection and difference set of multiple sets of data in a visual and concise manner, with the difference set representing unique gene functional units of temperature- and salinity-adaptive types of strains, predicting the possible association with environmental adaptation.

3. Results

3.1. General Features of 56 Synechococcus Strains

The genome size of these strains ranges from 2.11 to 3.86 Mb, as shown in Table 1. They have various G + C contents, ranging from 40.6% in PCC 7502 to 68% in RSCF101, suggesting a higher diversity of genomes. The number of marine strain genomes sequenced is much greater than that of the freshwater strains. Compared with marine isolates (≈2.63 Mb, 57.57%), freshwater isolates (≈3.1 Mb, 50.25%) have relatively larger genomes, but a lower GC content. The size of protein coding sequences (CDS) ranges from 2288 (Synechococcus sp. WH8109) to 3654 (Synechococcus sp. BMK-MC-1), and there is a positive linear relationship between CDS and genome sizes (Figure 1). Compared to other genera in cyanobacteria, the genome size of Synechococcus is relatively small but the gene density is relatively high.

3.2. Phylogenetic and Comparative Genome Analyses

The information of 56 Synechococcus strains, including their name, geographical origin, and collection depth, is shown in Table 2. These strains can be divided into subclusters, with different species having distinct geographical distribution patterns (Table S1).
Upon constructing evolutionary trees using different molecular markers, the findings showed that there is a certain geographical environmental correlation between different strains, with those sharing the same habitat tending to cluster together (Figure 2). All confidence levels were very high, and when comparing mutual verification, it was observed that the genetic relationships were consistent, indicating the reliability of using conservative markers for evolutionary analysis. Among them, the evolutionary tree based on peroxidase construction highlighted the decisive role of intrinsic features in the protein sequence [16]. These trees depicted different aspects of the influence of the environment and genetic factors on the evolution process of the strains and specific enzymes, revealing the complex evolutionary history of Synechococcus.

3.3. Core and Pan Genomic Analyses of the 56 Synechococcus Strains

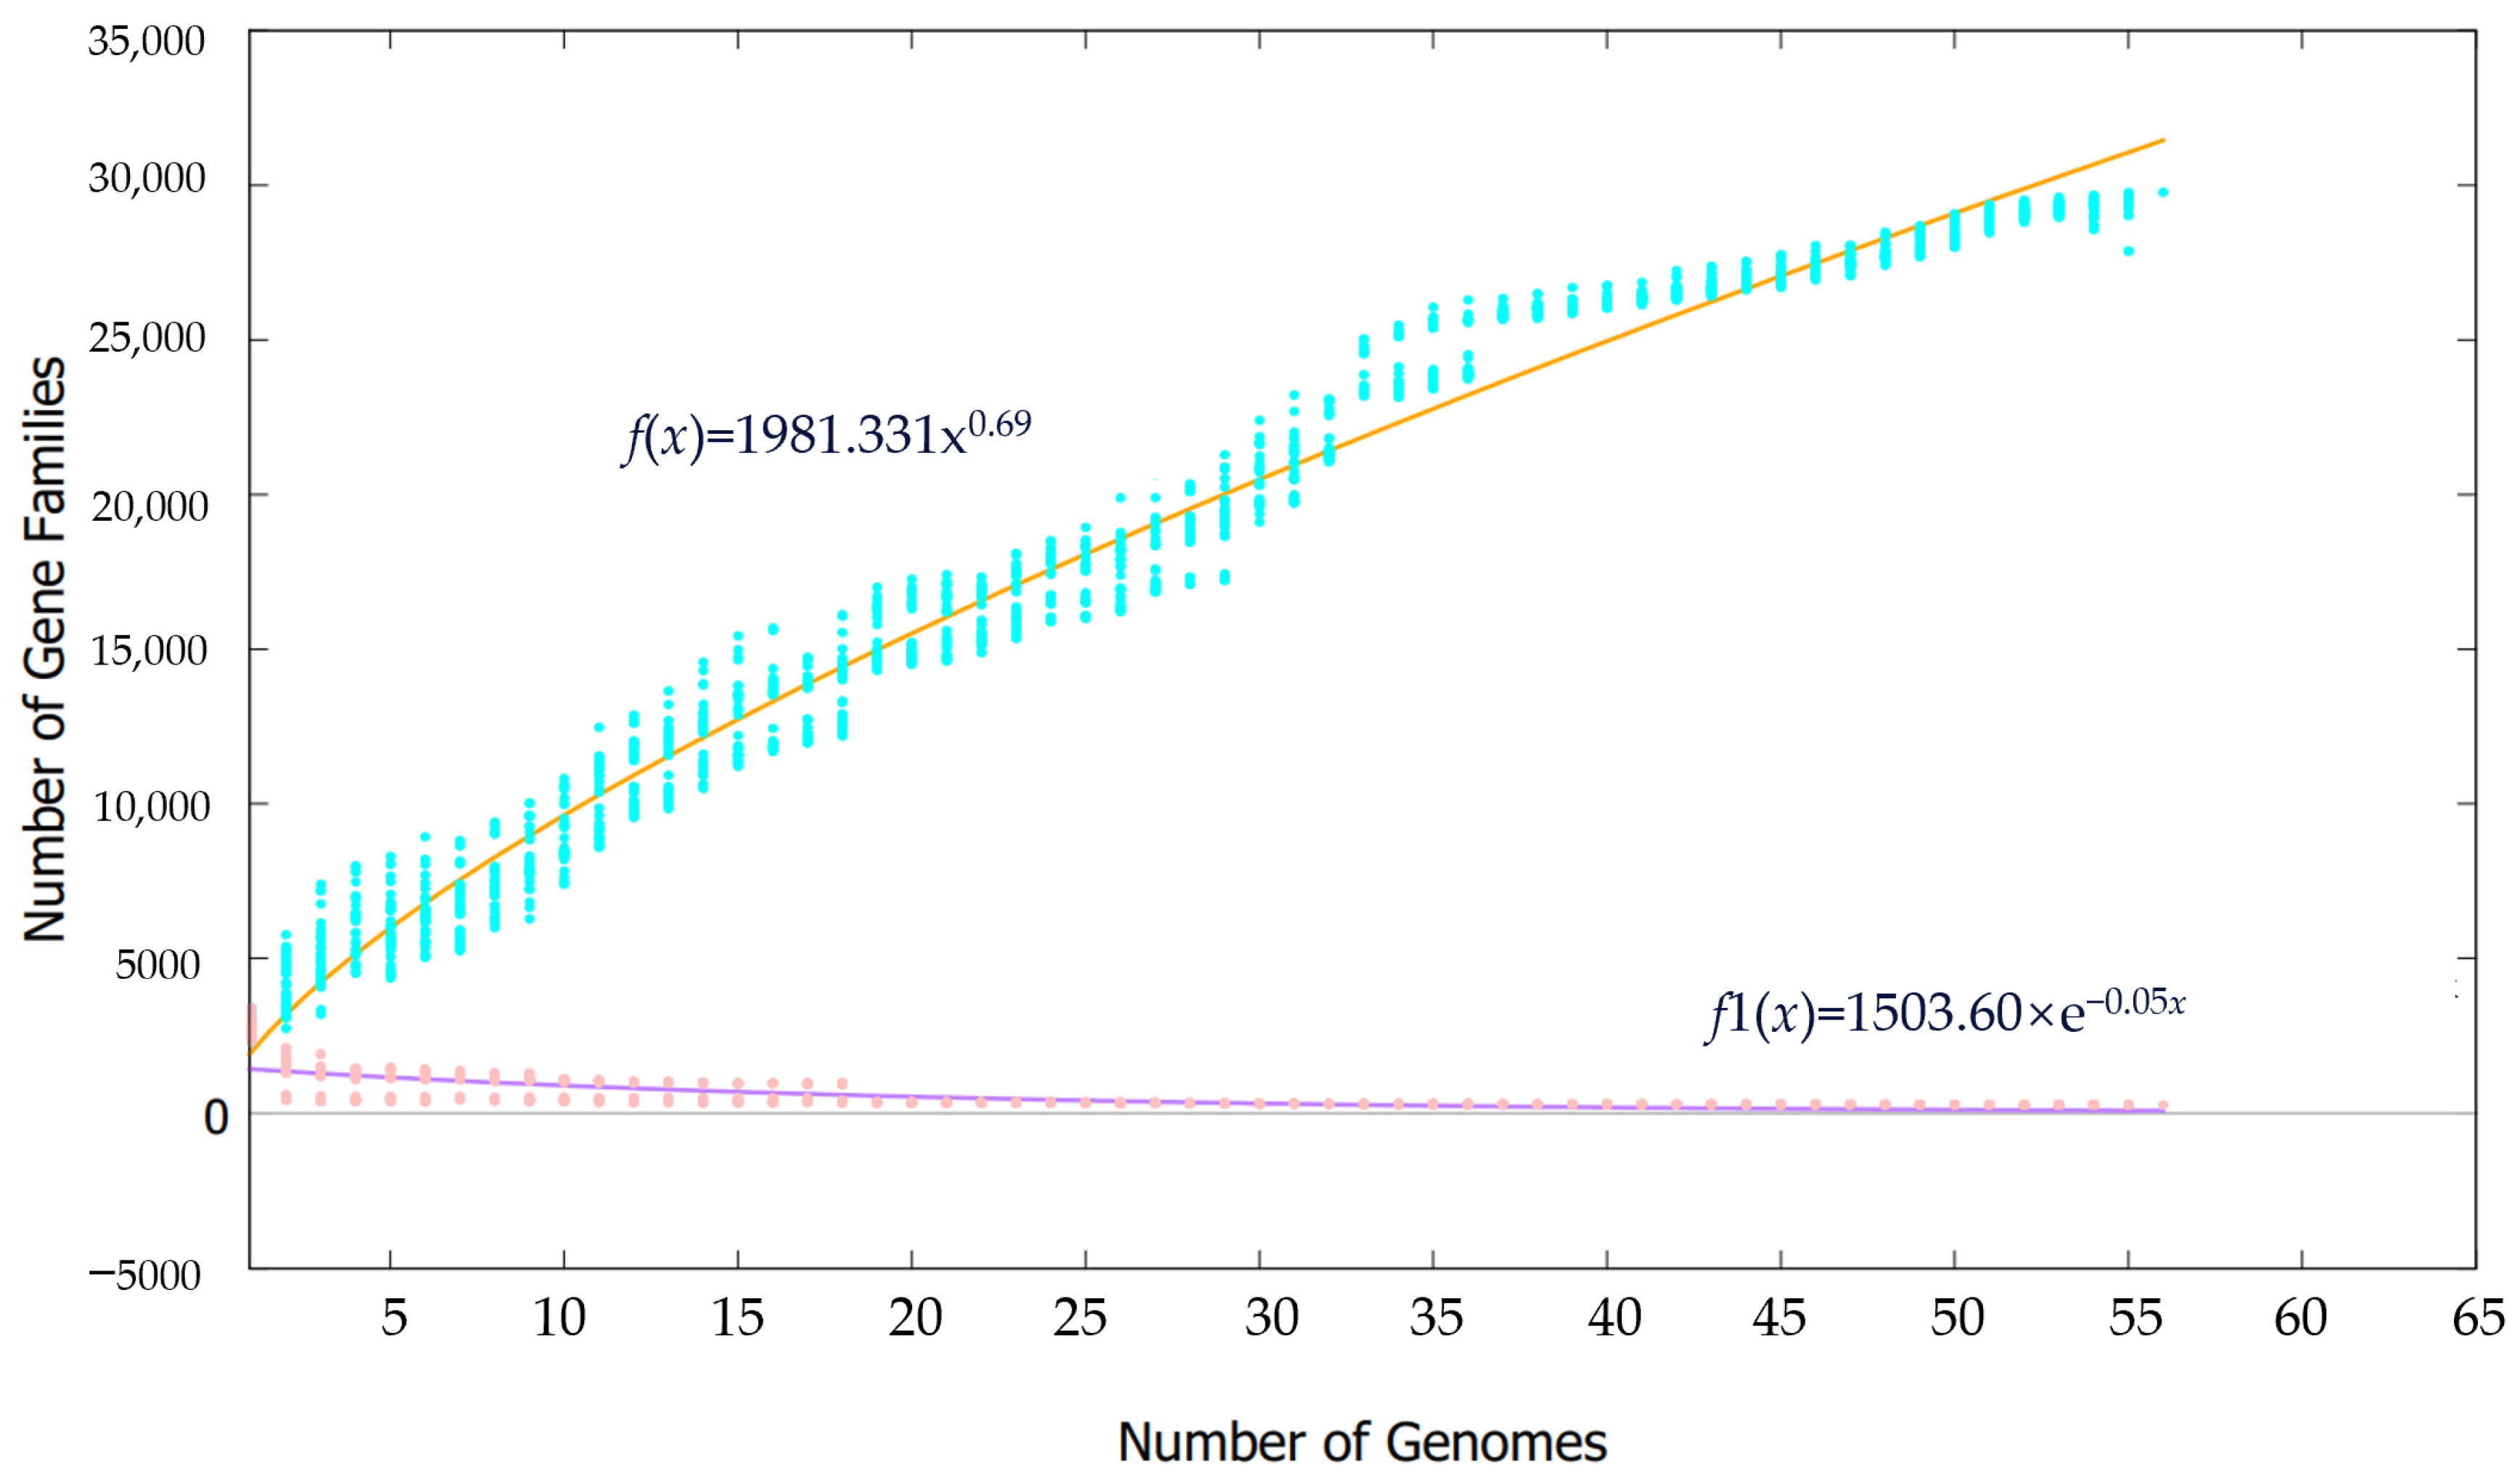
In pan-genomic studies, the power law model [19] can be used to determine whether a strain’s genomic data belong to a conservative pan-genome or an open pan-genome. The power law regression analysis of 56 Synechococcus strains performed in Figure 3 showed that the functional adaptability value of the 56 strains was 0.69 (<1), indicating that the pan-genome is still open. This indicates that the genomes of Synechococcus strains are highly plastic and may acquire new genes more easily, making them more adaptable to various complex environments and leading to a wider distribution. Their core genomes, on the other hand, are relatively conservative: as the number of analyzed genomes increases, more gene acquisition and loss events occur among different strains, resulting in a gradually decreasing number of core genes. When the number of analyzed strains increases to 56, the total number of gene families reaches around 30,000, and the final number of core gene families stabilizes at around 275 (Table S2). The COG functional annotation of the specific genomes displayed in Figure 4 showed that the most common functions in the core genome of Synechococcus are related to the metabolism (52.8%), and information storage and processing (34.1%), while the distribution of accessory and unique gene functions was similar, with metabolic and information-processing functions accounting for 32.46% and 26.49%, respectively. Intracellular biological processes and signaling mechanisms accounted for 15.81% and 19.14%, respectively. When poorly characterized, these two accounted for 27.61% and 27.41%, respectively.

3.4. Temperature Adaptation Mechanism of Synechococcus and Comparative Genomics

3.4.1. Growth Temperature and Structural Characteristics of the Synechococcus Genome

Based on their minimum tolerance for growth temperature, these strains could be further classified into cold-adapted, warm-adapted, and thermophilic strains (Table 3).
The growth temperature range and optimal growth temperature of warm-adapted strains are moderate; they cannot survive at temperatures below 10 °C and the optimal growth temperature is generally around 30–40 °C. The lowest growth temperature of cold-adapted strains is below 16 °C. Compared to warm-adapted strains (3.4 Mb, GC 49%), the genome sizes of 3.0 Mb for thermophilic strains and 2.6 Mb for cold-adapted strains are relatively small, but the GC contents (about 60% for thermophilic strains and about 58% for cold-adapted strains) are higher. Almost all cold-adapted strains can survive or culture at around 20 °C, indicating that all Synechococcus strains should have certain heat resistance.

3.4.2. Temperature Adaptation Mechanisms

The total number of core KO identifiers is 2305 for thermophilic strains, 2704 for warm-adapted strains, and 1383 for cold-adapted strains, as displayed in Figure 5. After further comparison of the core KO identifiers of different temperature-type strains, we concluded that the gene functional units found only in cold-adapted and thermophilic bacterial strains contain 32 and 84, respectively.

3.4.3. Thermal Adaptation Strategies

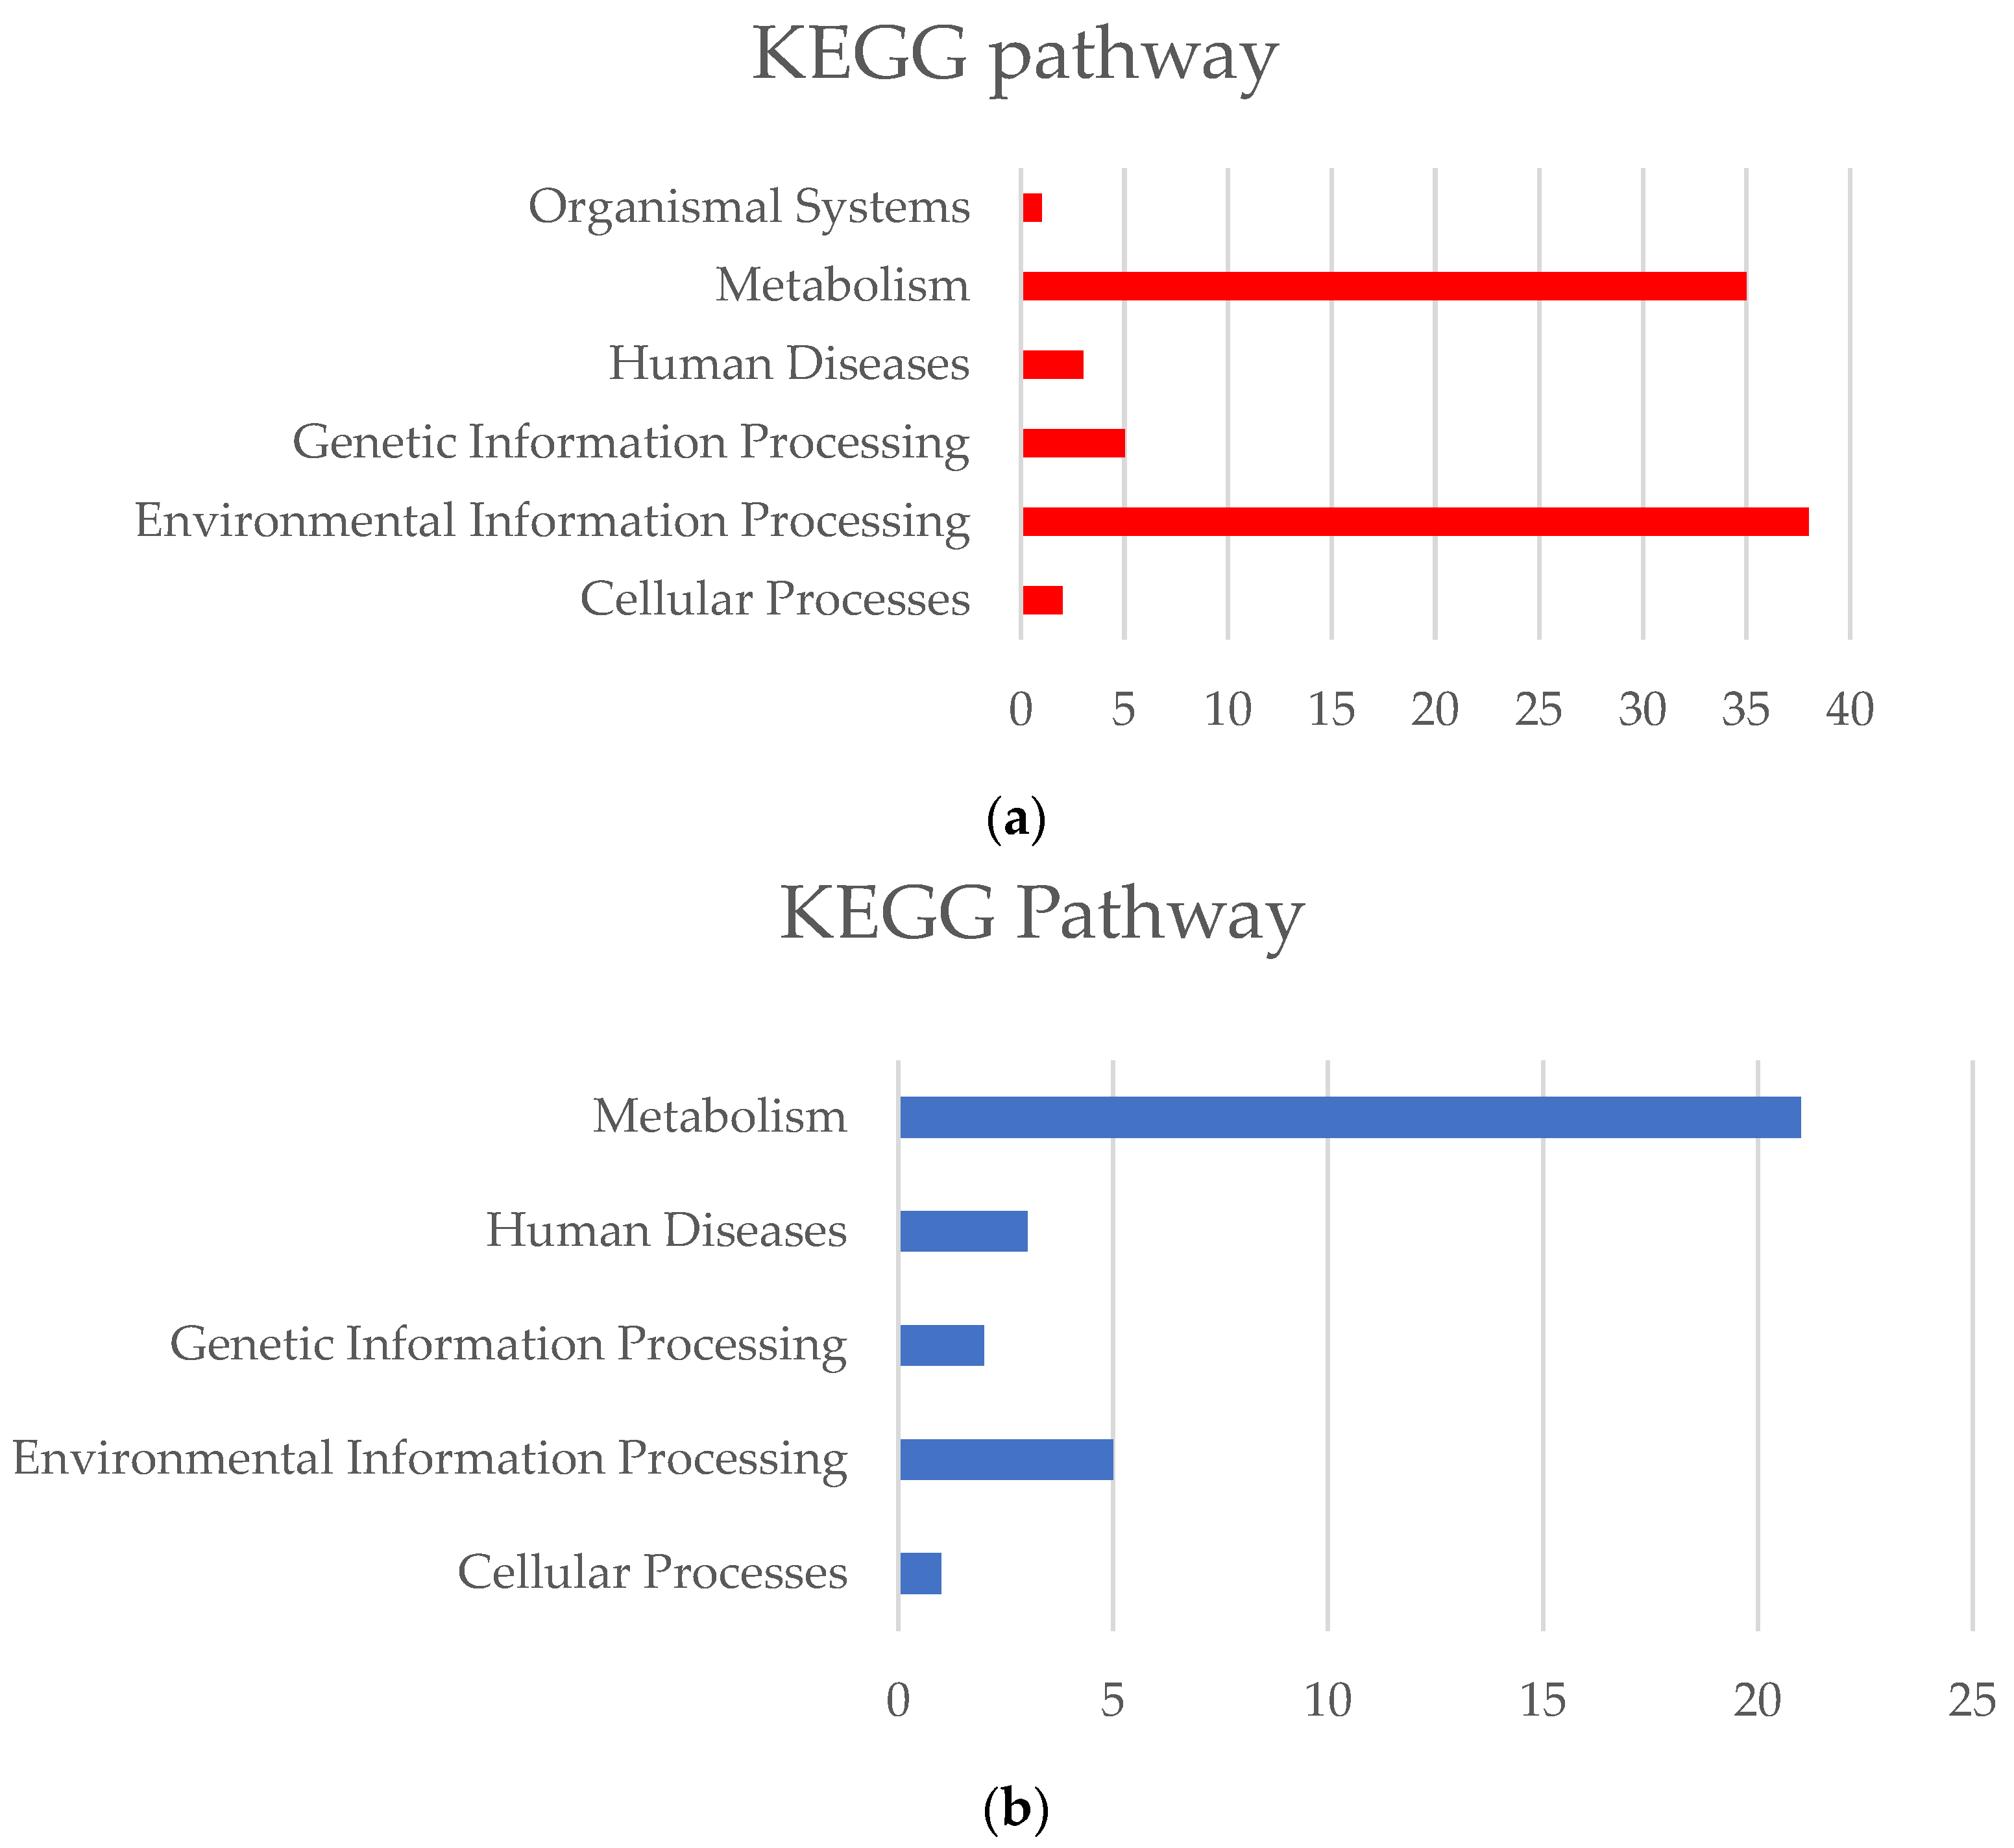
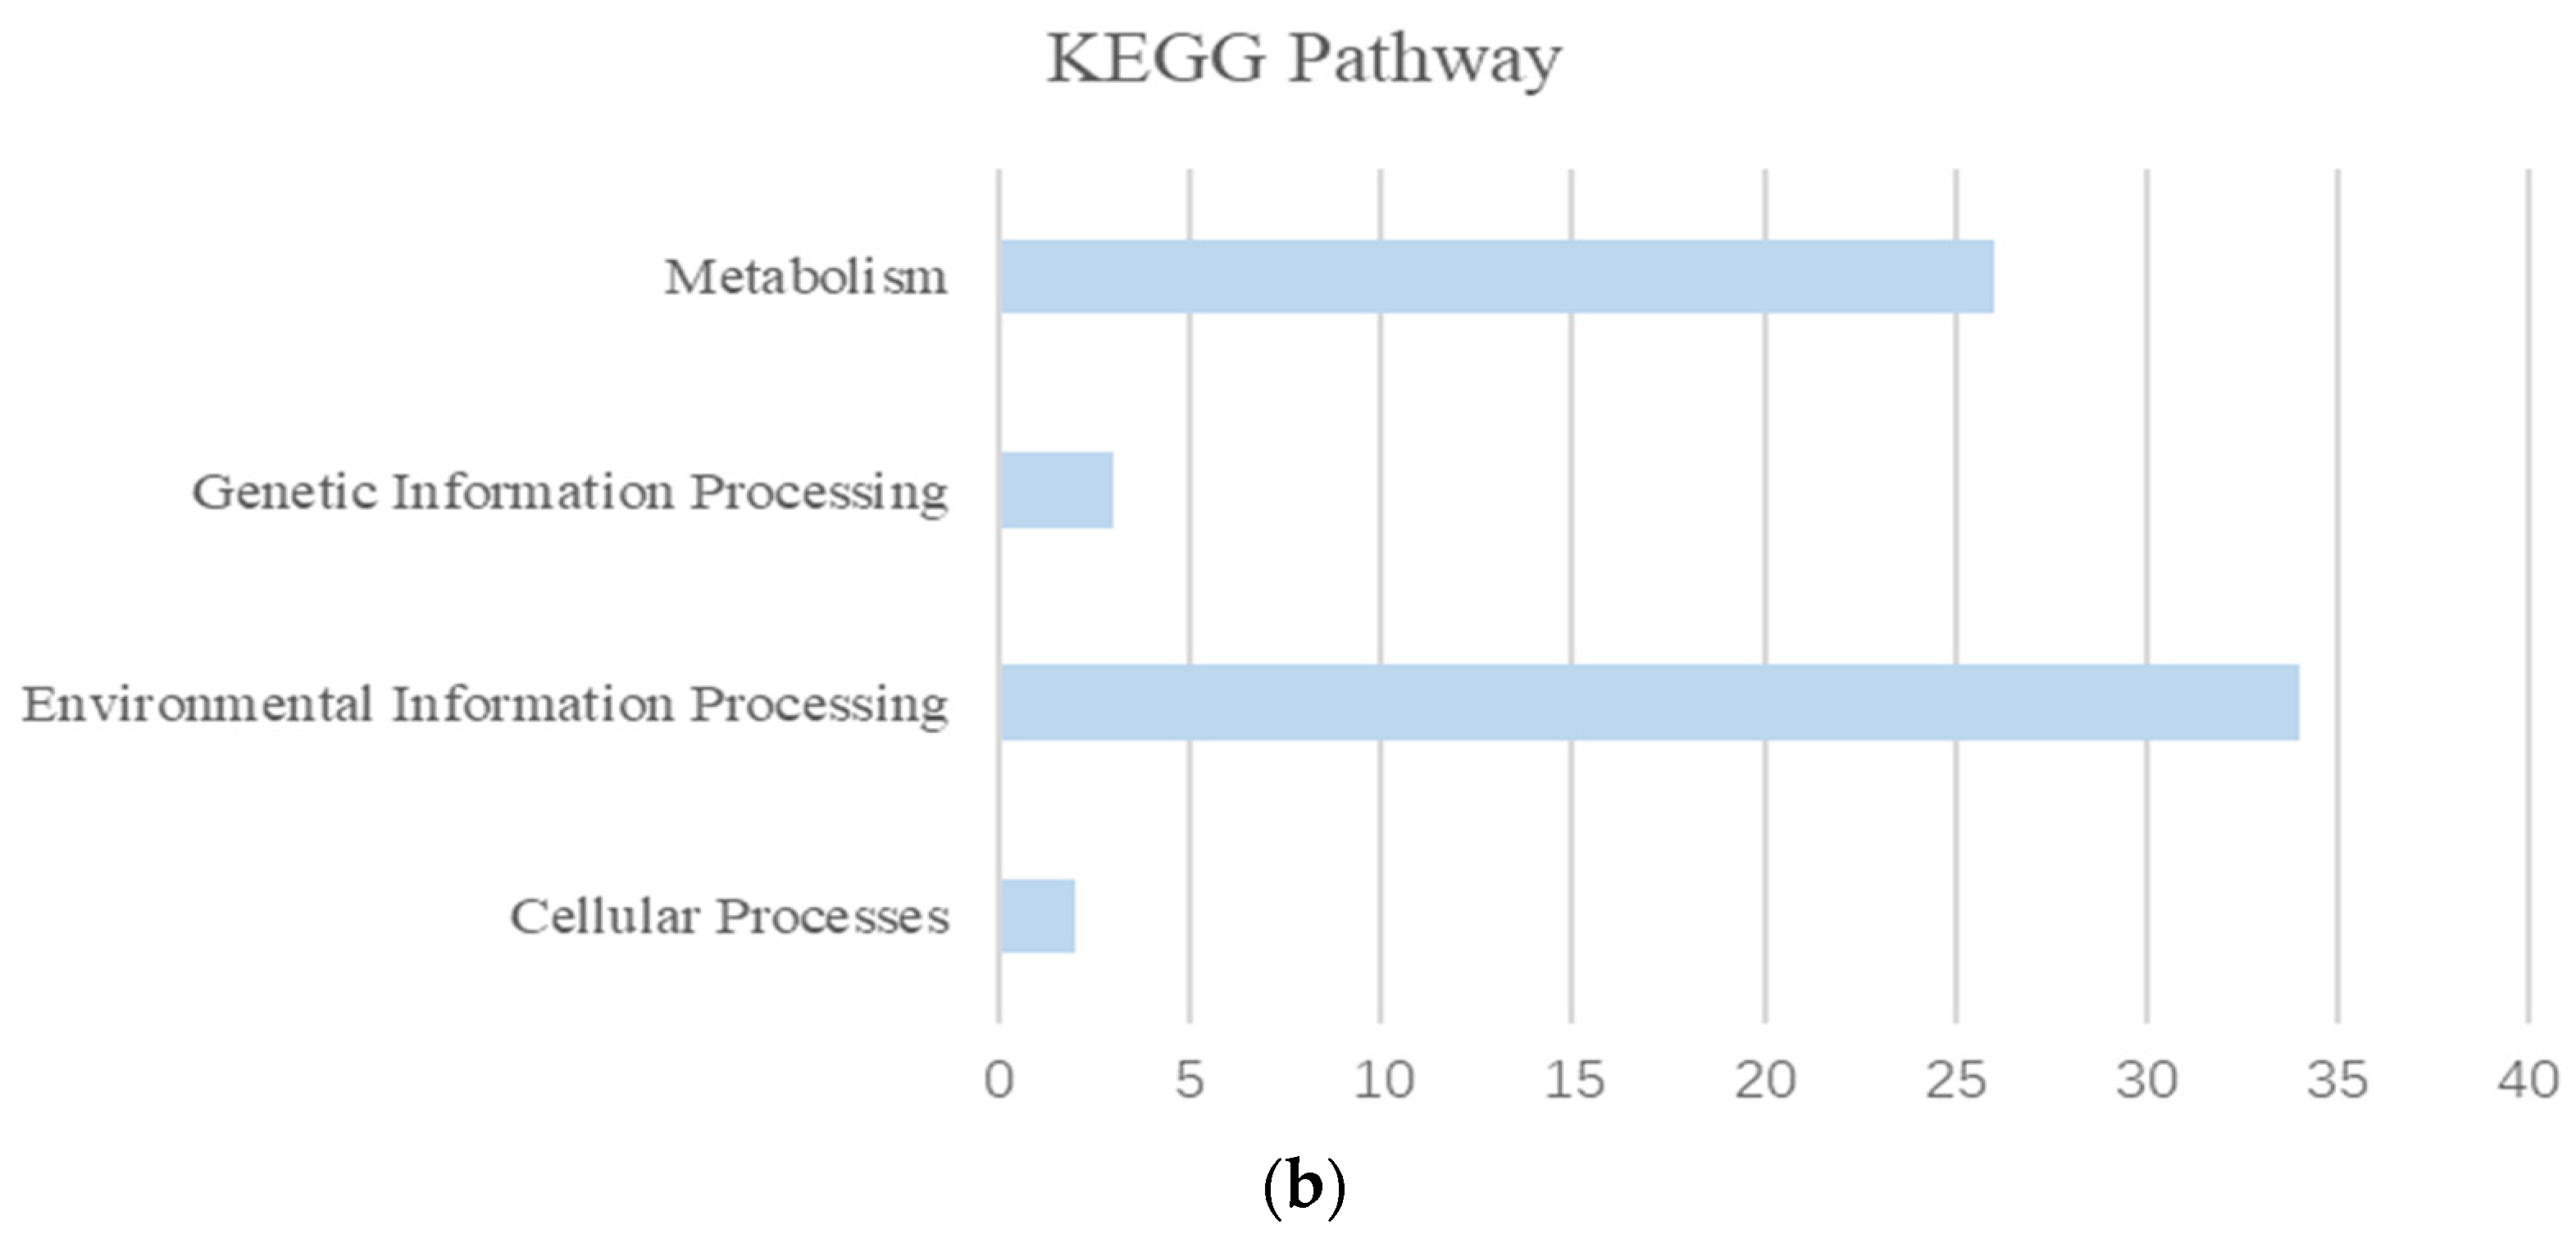
The thermophilic strains possess 84 specific core gene functional units (Table S3), which involve various metabolic and disease pathways, such as cancer and bacterial resistance. The core metabolic functions of cold-adapted strains contain 32 unique gene functional units (Table S4), with the most abundant being the core metabolic pathway (Figure 6). Each KO functional unit contains one or more key genes related to thermal adaptation, and their unique key genes can be regulated through the following strategies: (1) Heat shock protein expression. In response to high temperature environments, the primary adaptive response of all organisms is a heat shock response [20]. An increased expression of SEC63 in response to high temperatures can help correct misfolding errors caused by high temperatures [21]. (2) Molecular repair mechanisms. CDC48 utilizes ATPase activity to facilitate the assembly and disassembly of protein complexes, thereby clearing misfolded proteins in various organelles such as the nucleus, cytoplasm, endoplasmic reticulum, and mitochondria [22]. An MPG protein initiates base excision repair by cutting off the glycosyl bonds of numerous damaged bases, thus repairing DNA damage caused by high temperatures [23]. (3) Accumulation of solutes for protection. Under high-temperature conditions, bacteria accumulate solutes to balance the water loss caused by high temperatures and help cells maintain osmotic balance, thus increasing their survival rate [24]. TreY, TreZ, and MTTase possess thermotolerance properties and can maintain stable structures and catalytic activities at high temperatures, helping bacteria adapt to glucose metabolism and energy utilization within high temperature environments. The cysA-encoded sulfate transport system provides sulfur sources for the synthesis of hydrogen sulfide and helps thermophilic bacteria aggregate compatible sulfate solutes, improving the stability of cells in high-temperature environments [25]. The specific OpuA, OpuB, OpuC, and OpuD transport systems in thermophilic bacteria have been extensively studied for their stress protection functions. The uptake of OpuA transporter mediates the high-affinity uptake of glycine betaine and proline betaine [26]. The substrate-binding protein of OpuC [27] can recognize a wide range of compatible solutes such as choline, botulinum toxin, and glycine betaine.

3.4.4. Cold Adaptation Strategies

Typically, organisms adapt to low-temperature environments by regulating the expression of cold shock proteins. However, no common cold-shock-protein-encoding genes were detected in the genome of the cold-adapted Synechococcus strains studied, such as cspA, cspB, cspC, or cspG. This indicates that Synechococcus does not rely on cold shock proteins for survival under low temperatures and employs alternative pathways and molecular mechanisms to achieve low temperature adaptation. For instance, it involves fatty acid synthesis and unsaturation modulation related to membrane fluidity, solute accumulation, and the stabilization of protein structures.
The increase in unsaturated fatty acid concentration enhances membrane fluidity at low temperatures. LcyB can convert lycopene to carotene, enhancing the tolerance of strain due to salt, drought, and oxidative stress [28]. LcyB also catalyzes the cyclization of lycopene to produce desaturated carotenoids such as aromelin and naranjine, which can be converted into precursors of unsaturated fatty acids in cell membranes [29].
The rational regulation of glycogen synthesis and breakdown is one of the crucial mechanisms for spirulina to adapt to low-temperature conditions. GlgX and GlgP proteins degrade glycogen; the absence of glgX leads to excessive glycogen accumulation [30]. Under low-temperature conditions, glycogen acts as a storage carbon source and energy source. The upregulation of glycogen synthesis pathways allows excess glucose to be stored temporarily to prevent excessive solutes from inhibiting metabolic enzyme activity. Increasing glycogen accumulation also helps balance water entry due to low temperature, while inhibiting glycogen-decomposition-related enzyme activities to reduce glycogen consumption [31].
Stabilizing protein structure is among the strategies employed by cold-adapted Synechococcus strains to respond to low-temperature stresses. Pex5 plays a critical role in targeting proteins to the peroxisome for degradation. Even under low-temperature conditions, Pex5 retains its transport and import functions to help correctly fold and localize enzymes within the peroxisome [32]. RhlE1, an example of this family, can still participate in protein folding under suboptimal growth temperatures [33]. DNAJC3 is a molecular chaperone localized to the endoplasmic reticulum that transiently binds to newly synthesized proteins, especially the regions with unstable structures, helping maintain proper protein synthesis and prevent the incorrect folding of susceptible domains [34].

3.5. Salt Tolerance and Comparative Genomics in Synechococcus

3.5.1. Genome Features of Synechococcus with Different Salinity Growth Conditions

Among the 56 strains, salt tolerance ranges, optimal salt levels, and salt tolerance categories were studied in 27 Synechococcus strain genomes, as listed in Table 4. The genome size of freshwater strains was between 2.67 and 3.72 Mb (average of 3.06 Mb); for euryhaline strains, it was between 2.44 and 3.86 Mb (average of 3.28 Mb); and that of strictly marine strains was between 2.22 and 3.35 Mb (average of 2.58 Mb). The GC content of freshwater strains was between 40.6% and 55.5%, while that of salt-tolerant strains was between 62.6% and 67.1%. These values indicate that of euryhaline strains tend to have larger genome sizes, beneficial for encoding more salt resistance-related proteins. Strictly saline strains have relatively higher GC contents, which helps maintain the stability of their genomes.

3.5.2. Salinity Adaptation Mechanisms

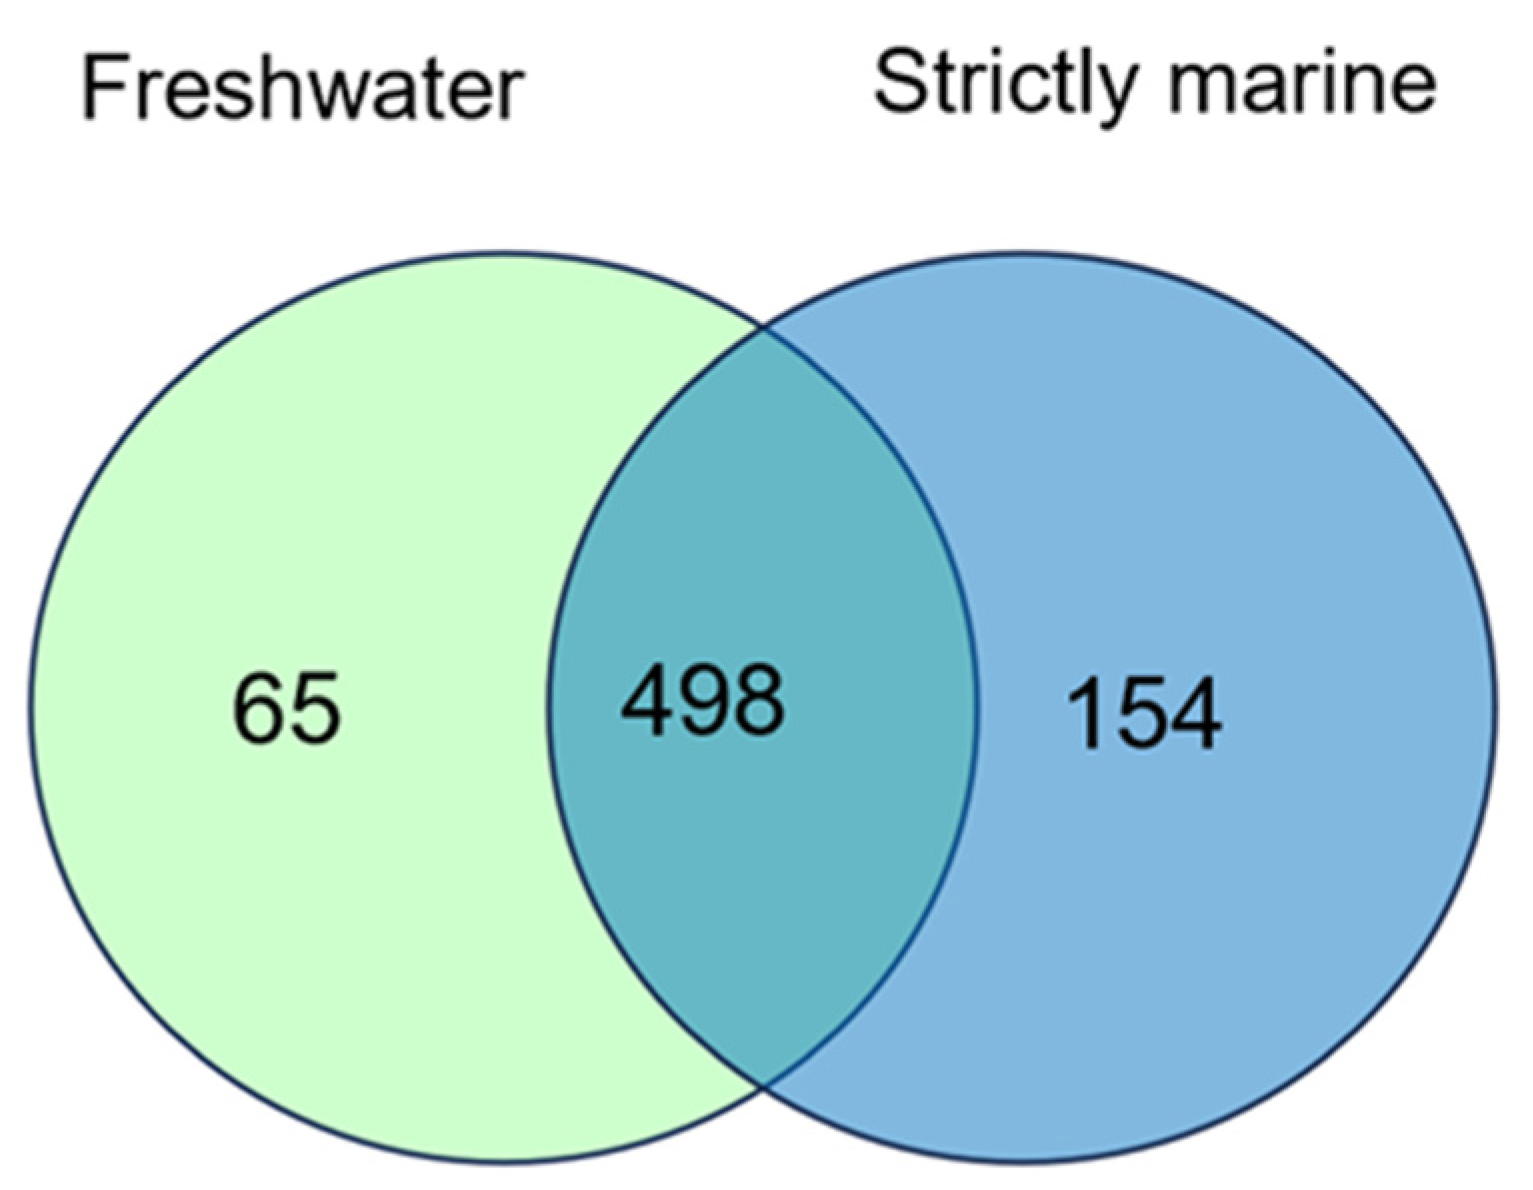
Compared with the functional units of the core genes of salt-loving bacteria, 65 KO functional units were specific to freshwater stains, and 154 KO functional units were specific to strictly marine strains (Figure 7). More KO units were identified in the core and specific units, which may be related to the fact that strictly marine stains require more genes to support their adaptation to high-salinity environments.
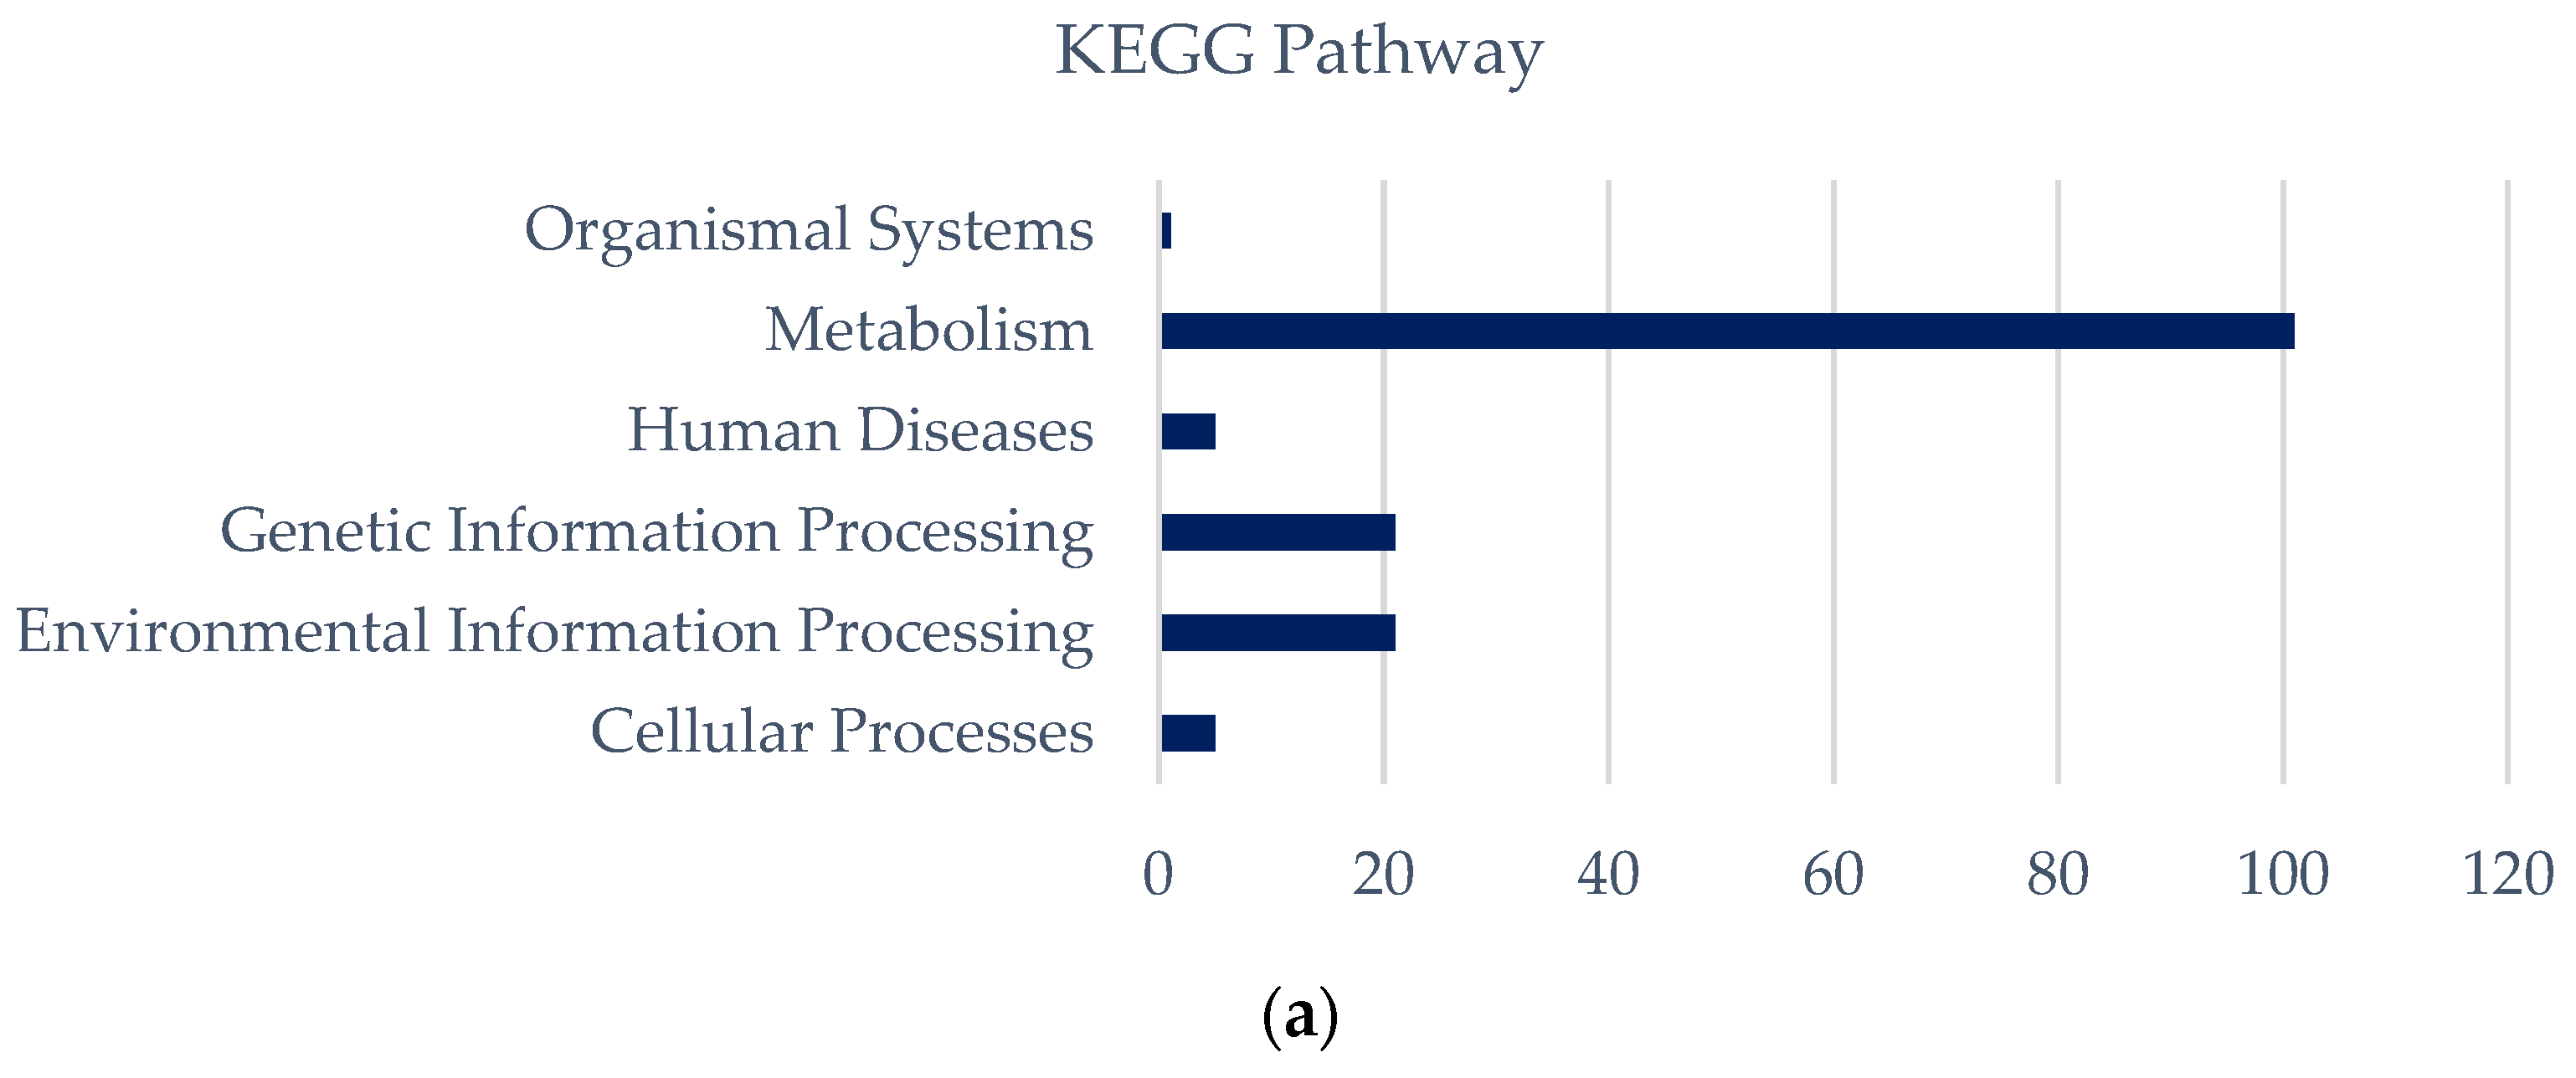
According to the list of unique 154 KEGG pathways of strict marine strains (Table S5), the highest number of pathways belongs to the ABC transporter pathway of metabolism pathway. The relatively higher number of pathways is related to the synthesis and accumulation of solutes such as glycogen and lipids. The freshwater strains have 65 unique keg core identifiers (Table S6), which represent different pathways, including the majority of the core and sugar metabolic pathways. This demonstrates strong environmental adaptability by regulating energy metabolism, nutrient absorption mechanisms, and oxidative redox homeostasis (Figure 8); freshwater strains adapt to low-salt or salt-free environments.

3.5.3. High-Salt Adaptation Strategies

Analyzing the key genes involved in specific functional units of obligate aerobes, strictly saline strains can adapt to high salinity via the following strategies:
  • Synthesis of compatible solutes
The accumulation of compatible solutes is a common defense measure used by bacteria to resist harmful effects caused by high salinity and tolerate high-salinity environments. On one hand, this method can alleviate high salinity pressure, and on the other hand, these compatible solutes can be quickly synthesized and degraded [35]. The CodA gene can convert choline into betaine glycine, providing tolerance to salt stress [36]. Amt is an important enzyme in the betaine metabolism pathway. It catalyzes the conversion of betaine from methionine to betaine glycine, which is a compatible solute that can resist salt stress [37]. Glycerol acts as a compatible solute and enhances tolerance to various non-biotic stresses. Glycerol metabolism is mediated by glp genes. Under conditions of glycerol phospholipid metabolism, the encoding glpA gene is highly upregulated, leading to an increased accumulation of glycerol in cells [38].
2.
Antioxidant defense
Salinity induces changes in osmotic potential in cells by reducing the water potential. Subsequently, the accumulation of ions in cells disturbs ion homeostasis and leads to changes in membrane permeability, affecting essential ion absorption. These disturbances caused by salinity lead to a series of metabolic disorders followed by reactive oxygen species (ROS) generation [39]. Glutathione peroxidase (GPX) is an antioxidant enzyme that exhibits high expression under different types of environmental stressors such as bacterial infection, contact with heavy metals, or high concentrations of salt [40]. Under salt-stress conditions, genetically modified strains show better anti-salinity than non-genetically modified individuals, indicating that overexpression of the GPX gene can effectively protect the strain from harm caused by salinity and promptly eliminate excess hydrogen peroxide and lipid peroxides. Overexpression of the GPX gene does not affect normal growth of the strain, but enhances its anti-salinity ability [41].
3.
Ion transport and distribution
Ion transport is a crucial step in controlling cellular uptake and subsequent storage, reduction or export that is essential for the growth of strictly marine strains. Phosphate is a basic nutrient required for all living organisms. All genes responsible for using phosphorus are located in the phosphorus transport system (phnC) [42]. Under high-salinity conditions, increasing Na+ intake leads to an elevated osmotic potential, which helps balance the osmotic energy required for cell growth via an addition phosphorus [43]. Under salt stress conditions, PstA can act as a sensor for monitoring changes in intracellular phosphorus concentration due to changes in its expression and activity [44]. The transport process of nitrate and nitrite mainly involves MFS (facilitated diffusion superfamily) transporters [45]. To avoid toxicity caused by nitrate, it undergoes assimilatory reduction and active transport processing [46].

3.5.4. Freshwater Adaptation Strategies

In terms of energy metabolism, Synechococcus utilizes methane and other organic substances in freshwater to generate energy. For example, it participates in methane metabolism through the beta subunit of the hydrogenase enzyme coded by frhB [47], and the two subunits coded by cofG and cofH form a methane monooxygenase that participates in the pathway [48]. Furthermore, the key enzymes in the glycolysis pathway, such as 3-phosphoglycerate dehydrogenase (GAPDH) and fructose-1,6-bisphosphate aldolase (FBPase), contribute to energy production [49].
In terms of nutrient absorption, the alga utilizes phosphorus transport systems regulated by pstS [50], sulfate transport systems composed of CysP, CysU, and CysW [51], branched amino acid transport systems regulated by livF, livG, livH, and livM genes [52], and carbonic bicarbonate transport system including cmpA, cmpB, and cmpC genes [53] to uptake scarce nutrients. These systems help cells absorb essential amino acids, sulfates, and bicarbonates to meet their freshwater survival needs.
Regarding oxidative redox regulation, the alga protects cells from high salt or oxidative stress through enzymes with antioxidant functions encoded by the katE and CAT genes [54] and superoxide dismutase SOD2 [55]. These mechanisms help maintain a stable redox state within cells, resisting external environmental pressures.

4. Discussion

This study compared and analyzed the genome sequence of Synechococcus, elucidating the genomic features and relationship with environmental adaptability from multiple perspectives. The Synechococcus genome is highly diverse, with different strains forming specific genomic compositions, key genes, and metabolic pathways based on temperature and salinity environments. A systematic phylogenetic and pan-genome analysis was conducted on 56 strains at the whole-genome level. The results showed that these strains have an open-genome pattern, with 275 core genomes and variable genomes of varying sizes. The phylogenetic relationships of different strains are related to their survival environment.
By isolating only a single variable (either temperature or salinity), a complete picture of the fitness of Synechococcus populations with different genotypes relative to natural variations in both of these conditions might not have been obtained. Furthermore, environmental parameters other than temperature and salinity (e.g., nutrient availability, pH, etc.) may influence the overall fitness of these organisms and thus affect their distribution. The gene families and pathways found in this study may reveal further evidence of adaptation to temperature (and salinity) and could give insight into other environmental factors affecting the adaptations of Synechococcus.
The growth of Synechococcus strains is related to temperature, which is a major environmental factor controlling photosynthetic rate and biogeography [56]. The high genetic diversity in Synechococcus leads to their ability to tolerate a wide range of temperatures [57]. Temperature plays a crucial role in many industrial processes and chemical reactions. Thermophilic Synechococcus can reduce dependence on low-temperature environments in industrial fermentation processes, decrease industrial fermentation costs, and increase production efficiency. From the perspective of temperature adaptability, the genomic sequences of different types of strains were analyzed. The results showed that compared with warm-adapted strains, the genomes of cold-adapted and thermophilic strains underwent reduction. Through KEGG annotation and orthology (KO) composition comparisons, it was concluded that there are 32 and 154 unique KO functional units within the shared core gene functional units of the two types of strains, respectively, which rely on metabolic pathways such as the regulation of heat shock protein expression and membrane fatty acid composition for temperature adaptation. Extreme thermophilic or cold-adapted bacteria are highly interesting from an industrial processing perspective. The ability to grow at high or cold temperatures in bioreactors reduces the costs of cooling and prevents contamination by mesophilic spoilage bacteria [58]. Synechococcus can be used as a platform to introduce heat and cold adaptive genes identified in this study, enhancing its heat and cold tolerance. Additionally, utilizing Synechococcus as a chassis facilitates the production of cell factories after introducing these genes, offering innovative solutions for bioenergy, biologic medicine, environmental protection, and other fields.
An attractive strategy for controlling biological contamination is to increase the salinity of the growth media. Salt-tolerant Synechococcus is capable of adapting to seawater fermentation, and can be used to reduce production costs and simplify the process. Under different salinities, enriched populations are clearly different [59]. Most Synechococcus strains have adapted to long-term relatively stable salinity levels and cannot tolerate drastic changes in salinity [60]. Compared with freshwater host strains, most Synechococcus strains colonize marine environments and have greater resource utilization advantages. For example, PCC7002 and PCC11901 are not only rapidly growing, salt-tolerant, and heat-resistant [61,62], but also good chassis strains for industrial applications. From the perspective of salinity adaptability, among the freshwater-adapted strains, there are 65 unique KO functional units in the shared core genome that rely on energy metabolism, nutrient absorption, and osmotic pressure regulation for freshwater adaptation. For saline-tolerant strains, there are 154 unique KO functional units in the shared core genome that adapt to high-salinity environments through antioxidation, nutrient absorption, and transport regulation.
This study provides genomic-scale insights into the genetic basis of Synechococcus’ adaptation to different temperatures and salinities, offering a new perspective and abundant gene targets for understanding the environmental adaptability of cyanobacteria. Future research can expand upon several aspects by: (1) expanding the sample size by collecting more complete genome sequences of Synechococcus, hence enhancing our understanding of its diversity and evolutionary relationships; (2) deeply analyzing the predicted key genes and their metabolism regulation in temperature and salt stress responses, experimentally verifying their contribution to improving environmental adaptability, and aiding application development; (3) investigating the effects of different environments on Synechococcus phenotypes and genotypes, expanding our knowledge of microbial adaptability theory; and (4) attempting to modify relevant genes and optimize Synechococcus’ environmental adaptability. Genome size information helps clarify the metabolic characteristics of chassis cells and guide the design of synthetic biology based on their features.
The research prospects in the field of Synechococcus are vast. It not only deepens our understanding of the rules governing microbial environmental adaptability but also actively promotes their applications in environmental remediation, high-value product biosynthesis, and other areas, fully exploring and utilizing its potential value.

5. Conclusions

In this research, the complete genome sequences of 56 Synechococcus strains were selected as the analysis targets for conducting the comprehensive genomic investigation. Bioinformatics tools were employed to analyze and compare the genomic features of various strains from a comparative genomics perspective, while considering temperature- and salinity-related environmental data. This effectively clarified the inherent connection between genome structural variations and environmental adaptability. Additionally, this study constructed a systemic evolutionary tree using multiple marker genes and analyzed the ecological adaptability of Synechococcus to temperature and salinity from multiple dimensions. Moreover, it proposed a molecular mechanism for explaining how Synechococcus responds to environmental changes at the genomic level. At the same time, it identified several key genes and metabolic pathways that may be related to salt and temperature adaptation, providing theoretical guidance for the targeted optimization and large-scale application of Synechococcus.

Supplementary Materials

The following supporting information can be downloaded at: https://www.mdpi.com/article/10.3390/bioengineering10111329/s1, Table S1: Dominant ecological conditions for Synechococcus clades; Table S2: Status of pan-genome comparative analysis; Table S3: Gene families association with thermal adaptation; Table S4: Gene families association with cold adaptation; Table S5: Gene families association with halotolerance; Table S6: Gene families association with freshwater adaptation.

Author Contributions

Conceptualization, F.T., M.Q. and P.X.; methodology, F.T., M.Q. and X.H.; software, F.T. and M.Q.; validation, F.T., X.H. and J.L.; formal analysis, F.T. and M.Q.; investigation, M.Q., X.H. and J.L.; resources, F.T. and P.X.; data curation, M.Q., X.H. and J.L.; writing—original draft preparation, M.Q.; writing—review and editing, X.H. and J.L.; visualization, X.H. and J.L.; supervision, F.T. and P.X.; project administration, F.T. and P.X.; funding acquisition, F.T. and P.X. All authors have read and agreed to the published version of the manuscript.

Funding

National Key Research and Development Program of China (No. 2018YFA0903600).

Institutional Review Board Statement

Not applicable.

Informed Consent Statement

Not applicable.

Data Availability Statement

Data are available from the corresponding authors upon reasonable request.

Conflicts of Interest

The authors declare no conflict of interest.

References

  1. Huang, S.; Wilhelm, S.W. Novel lineages of Prochlorococcus and Synechococcus in the global oceans. ISME J. 2012, 6, 285–297. [Google Scholar] [CrossRef] [PubMed]
  2. Tan, C.; Tao, F. Direct carbon capture for the production of high-performance biodegradable plastics by cyanobacterial cell factories. Green Chem. 2022, 24, 4470–4483. [Google Scholar] [CrossRef]
  3. Salazar, V.W.; Tschoeke, D.A. A new genomic taxonomy system for the Synechococcus collective. Environ. Microbiol. 2020, 22, 4557–4570. [Google Scholar] [CrossRef] [PubMed]
  4. Deviram, G.; Mathimani, T. Applications of microalgal and cyanobacterial biomass on a way to safe, cleaner and a sustainable environment. J. Clean. Prod. 2020, 253, 119770. [Google Scholar] [CrossRef]
  5. Komárek, J.; Johansen, J.R. Phylogeny and taxonomy of Synechococcus-like cyanobacteria. Fottea 2020, 20, 171–191. [Google Scholar] [CrossRef]
  6. Johnson, P.W.; Sieburth, J.M. Chroococcoid cyanobacteria in the sea: A ubiquitous and diverse phototrophic biomass1. Limnol. Oceanogr. 1979, 24, 928–935. [Google Scholar] [CrossRef]
  7. Stanier, R.Y.; Cohen-Bazire, G. Phototrophic prokaryotes: The cyanobacteria. Annu. Rev. Microbiol. 1977, 31, 225–274. [Google Scholar] [CrossRef] [PubMed]
  8. Yadav, I.; Rautela, A. Approaches in the photosynthetic production of sustainable fuels by cyanobacteria using tools of synthetic biology. World J. Microbiol. Biotechnol. 2021, 37, 201. [Google Scholar] [CrossRef]
  9. Luan, G.; Lu, X. Tailoring cyanobacterial cell factory for improved industrial properties. Biotechnol. Adv. 2018, 36, 430–442. [Google Scholar] [CrossRef]
  10. Roh, H.; Lee, J.S. Improved CO-derived polyhydroxybutyrate (PHB) production by engineering fast-growing cyanobacterium Synechococcus elongatus UTEX 2973 for potential utilization of flue gas. Bioresour. Technol. 2021, 327, 124789. [Google Scholar] [CrossRef]
  11. Tan, C.; Xu, P. Carbon-negative synthetic biology: Challenges and emerging trends of cyanobacterial technology. Trends Biotechnol. 2022, 40, 1488–1502. [Google Scholar] [CrossRef]
  12. Sini, P.; Dang, T.B.C. Cyanobacteria, cyanotoxins, and neurodegenerative diseases: Dangerous liaisons. Int. J. Mol. Sci. 2021, 22, 8726. [Google Scholar] [CrossRef]
  13. Palenik, B.; Brahamsha, B. The genome of a motile marine Synechococcus. Nature 2003, 424, 1037–1042. [Google Scholar] [CrossRef]
  14. Sun, Z.; Blanchard, J.L. Strong genome-wide selection early in the evolution of Prochlorococcus resulted in a reduced genome through the loss of a large number of small effect genes. PLoS ONE 2014, 9, e88837. [Google Scholar] [CrossRef]
  15. Swan, B.K.; Tupper, B. Prevalent genome streamlining and latitudinal divergence of planktonic bacteria in the surface ocean. Proc. Natl. Acad. Sci. USA 2013, 110, 11463–11468. [Google Scholar] [CrossRef]
  16. Cui, H.; Wang, Y. Genome-wide analysis of putative peroxiredoxin in unicellular and filamentous cyanobacteria. BMC Evol. Biol. 2012, 12, 220. [Google Scholar] [CrossRef] [PubMed]
  17. Grébert, T.; Garczarek, L. Diversity and evolution of pigment types in marine Synechococcus cyanobacteria. Genome Biol. Evol. 2022, 14, 1–19. [Google Scholar] [CrossRef] [PubMed]
  18. Herdman, H. Form-genus XIII. Synechococcus. In Bergey’s Manual of Systematic Bacteriology; Springer: Berlin/Heidelberg, Germany, 2001; Volume 1, pp. 508–512. [Google Scholar]
  19. Tettelin, H.; Riley, D. Comparative genomics: The bacterial pan-genome. Curr. Opin. Microbiol. 2008, 11, 472–477. [Google Scholar] [CrossRef]
  20. Dzaman-Serafin, S.; Telatyńska-Mieszek, B. Heat shock proteins and their characteristics. Pol. Merkur. Lek. 2005, 19, 215–219. [Google Scholar]
  21. Jung, S.J.; Jung, Y. Proper insertion and topogenesis of membrane proteins in the ER depend on Sec63. Biochim. Biophys. Acta Gen. Subj. 2019, 1863, 1371–1380. [Google Scholar] [CrossRef]
  22. Thoms, S. Cdc48 can distinguish between native and non-native proteins in the absence of cofactors. FEBS Lett. 2002, 520, 107–110. [Google Scholar] [CrossRef]
  23. Miao, F.; Bouziane, M. 3-Methyladenine-DNA glycosylase (MPG potein) interacts with human RAD23 proteins. J. Biol. Chem. 2000, 275, 28433–28438. [Google Scholar] [CrossRef]
  24. Chen, C.; Su, L. Enhanced the catalytic efficiency and thermostability of maltooligosyltrehalose synthase from Arthrobacter ramosus by directed evolution. Biochem. Eng. J. 2020, 162, 107724. [Google Scholar] [CrossRef]
  25. Laudenbach, D.E.; Grossman, A.R. Characterization and mutagenesis of sulfur-regulated genes in a cyanobacterium: Evidence for function in sulfate transport. J. Bacteriol. 1991, 173, 2739–2750. [Google Scholar] [CrossRef] [PubMed]
  26. Horn, C.; Jenewein, S. Biochemical and structural analysis of the Bacillus subtilis ABC transporter OpuA and its isolated subunits. J. Mol. Microbiol. Biotechnol. 2005, 10, 76–91. [Google Scholar] [CrossRef] [PubMed]
  27. Du, Y.; Shi, W.W. Structures of the substrate-binding protein provide insights into the multiple compatible solute binding specificities of the Bacillus subtilis ABC transporter OpuC. Biochem. J. 2011, 436, 283–289. [Google Scholar] [CrossRef] [PubMed]
  28. Kang, C.; Zhai, H. A lycopene β-cyclase gene, IbLCYB2, enhances carotenoid contents and abiotic stress tolerance in transgenic sweetpotato. Plant Sci. 2018, 272, 243–254. [Google Scholar] [CrossRef] [PubMed]
  29. Moreno, J.C.; Pizarro, L. Levels of lycopene β-cyclase 1 modulate carotenoid gene expression and accumulation in Daucus carota. PLoS ONE 2013, 8, e58144. [Google Scholar] [CrossRef]
  30. Dauvillée, D.; Kinderf, I.S. Role of the Escherichia coli glgX gene in glycogen metabolism. J. Bacteriol. 2005, 187, 1465–1473. [Google Scholar] [CrossRef]
  31. LeBlanc, J.; Labrie, A. Glycogen and nonspecific adaptation to cold. J. Appl. Physiol. 1981, 51, 1428–1432. [Google Scholar] [CrossRef]
  32. Williams, C.P.; Stanley, W.A. Peroxin 5: A cycling receptor for protein translocation into peroxisomes. Int. J. Biochem. Cell B 2010, 42, 1771–1774. [Google Scholar] [CrossRef] [PubMed]
  33. Aguirre, A.A.; Vicente, A.M. Association of the cold shock DEAD-box RNA helicase RhlE to the RNA degradosome in Caulobacter crescentus. J. Bacteriol. 2017, 199, 10–1128. [Google Scholar] [CrossRef]
  34. Jennings, M.J.; Hathazi, D. Intracellular lipid accumulation and mitochondrial dysfunction accompanies endoplasmic reticulum stress caused by loss of the co-chaperone DNAJC3. Front. Cell Dev. Biol. 2021, 9, 710247. [Google Scholar] [CrossRef] [PubMed]
  35. Zeng, F.; Zhu, Y. Metagenomic analysis of the soil microbial composition and salt tolerance mechanism in Yuncheng Salt Lake, Shanxi Province. Front. Microbiol. 2022, 13, 1004556. [Google Scholar] [CrossRef] [PubMed]
  36. Deshnium, P.; Los, D.A. Transformation of Synechococcus with a gene for choline oxidase enhances tolerance to salt stress. Plant Mol. Biol. 1995, 29, 897–907. [Google Scholar] [CrossRef] [PubMed]
  37. Backofen, B.; Leeb, T. Genomic organization of the murine aminomethyltransferase gene (Amt). DNA Seq. 2002, 13, 179–183. [Google Scholar] [CrossRef] [PubMed]
  38. Pan, J.; Wang, J. IrrE, a global regulator of extreme radiation resistance in Deinococcus radiodurans, enhances salt tolerance in Escherichia coli and Brassica napus. PLoS ONE 2009, 4, e4422. [Google Scholar] [CrossRef]
  39. Swapnil, P.; Rai, A.K. Physiological responses to salt stress of salt-adapted and directly salt (NaCl and NaCl + Na2SO4 mixture)-stressed cyanobacterium Anabaena fertilissima. Protoplasma 2018, 255, 963–976. [Google Scholar] [CrossRef]
  40. Diao, Y.; Xu, H. Cloning a glutathione peroxidase gene from Nelumbo nucifera and enhanced salt tolerance by overexpressing in rice. Mol. Biol. Rep. 2014, 41, 4919–4927. [Google Scholar] [CrossRef]
  41. Upadhyay, V.A.; Brunner, A.M. Isocitrate dehydrogenase (IDH) inhibition as treatment of myeloid malignancies: Progress and future directions. Pharmacol. Ther. 2017, 177, 123–128. [Google Scholar] [CrossRef] [PubMed]
  42. Webb, D.C.; Rosenberg, H. Mutational analysis of the Escherichia coli phosphate-specific transport system, a member of the traffic ATPase (or ABC) family of membrane transporters. A role for proline residues in transmembrane helices. J. Biol. Chem. 1992, 267, 24661–24668. [Google Scholar] [CrossRef] [PubMed]
  43. Long, Q.; Shen, L. Synthesis and application of organic phosphonate salts as draw solutes in forward osmosis for oil-water separation. Environ. Sci. Technol. 2016, 50, 12022–12029. [Google Scholar] [CrossRef]
  44. Rao, N.N.; Torriani, A. Molecular aspects of phosphate transport in Escherichia coli. Mol. Microbiol. 1990, 4, 1083–1090. [Google Scholar] [CrossRef] [PubMed]
  45. Alvarez, L.; Sanchez-Hevia, D. A new family of nitrate/nitrite transporters involved in denitrification. Int. Microbiol. 2019, 22, 19–28. [Google Scholar] [CrossRef]
  46. Ramírez, S.; Moreno, R. Two nitrate/nitrite transporters are encoded within the mobilizable plasmid for nitrate respiration of Thermus thermophilus HB8. J. Bacteriol. 2000, 182, 2179–2183. [Google Scholar] [CrossRef] [PubMed]
  47. Vitt, S.; Ma, K. The F420-reducing [NiFe]-hydrogenase complex from Methanothermobacter marburgensis, the first X-ray structure of a group 3 family member. J. Mol. Biol. 2014, 426, 2813–2826. [Google Scholar] [CrossRef]
  48. Graham, D.E.; Xu, H. Identification of the 7, 8-didemethyl-8-hydroxy-5-deazariboflavin synthase required for coenzyme F 420 biosynthesis. Arch. Microbiol. 2003, 180, 455–464. [Google Scholar] [CrossRef]
  49. El Kadmiri, N.; Slassi, I. Glyceraldehyde-3-phosphate dehydrogenase (GAPDH) and Alzheimer’s disease. Pathol. Biol. 2014, 62, 333–336. [Google Scholar] [CrossRef] [PubMed]
  50. Neznansky, A.; Opatowsky, Y. Expression, purification and crystallization of the phosphate-binding PstS protein from Pseudomonas aeruginosa. Acta Crystallogr. F Struct. Biol. Commun. 2014, 70, 906–910. [Google Scholar] [CrossRef]
  51. Aguilar-Barajas, E.; Díaz-Pérez, C. Bacterial transport of sulfate, molybdate, and related oxyanions. Biometals 2011, 24, 687–707. [Google Scholar] [CrossRef]
  52. Hosie, A.H.F.; Allaway, D. Rhizobium leguminosarum has a second general amino acid permease with unusually broad substrate specificity and high similarity to branched-chain amino acid transporters (Bra/LIV) of the ABC Fam. J. Bacteriol. 2002, 184, 4071–4080. [Google Scholar] [CrossRef] [PubMed]
  53. Omata, T.; Gohta, S. Involvement of a CbbR homolog in low CO2-induced activation of the bicarbonate transporter operon in cyanobacteria. J. Bacteriol. 2001, 183, 1891–1898. [Google Scholar] [CrossRef]
  54. Kaku, N.; Hibino, T. Effects of overexpression of Escherichia coli katE and bet genes on the tolerance for salt stress in a freshwater cyanobacterium Synechococcus sp. PCC 7942. Plant Sci. 2000, 159, 281–288. [Google Scholar] [CrossRef]
  55. Schäfer, G.; Kardinahl, S. Iron superoxide dismutases: Structure and function of an archaic enzyme. Biochem. Soc. Trans. 2003, 31, 1330–1334. [Google Scholar] [CrossRef]
  56. Kees, E.D.; Murugapiran, S.K. Distribution and genomic variation of thermophilic cyanobacteria in diverse microbial mats at the upper temperature limits of photosynthesis. mSystems 2022, 7, e0031722. [Google Scholar] [CrossRef]
  57. Pedersen, D.; Miller, S.R. Photosynthetic temperature adaptation during niche diversification of the thermophilic cyanobacterium Synechococcus A/B clade. Isme J. 2017, 11, 1053–1057. [Google Scholar] [CrossRef]
  58. Adalsteinsson, B.T.; Kristjansdottir, T. Efficient genome editing of an extreme thermophile, Thermus thermophilus, using a thermostable Cas9 variant. Sci. Rep. 2021, 11, 9586. [Google Scholar] [CrossRef]
  59. Kim, Y.; Jeon, J. Photosynthetic functions of Synechococcus in the ocean microbiomes of diverse salinity and seasons. PLoS ONE 2018, 13, e0190266. [Google Scholar] [CrossRef]
  60. Hebert, P.D.; Ratnasingham, S. Barcoding animal life: Cytochrome c oxidase subunit 1 divergences among closely related species. Proc. Biol. Sci. 2003, 270 (Suppl. S1), 96–99. [Google Scholar] [CrossRef]
  61. Ruffing, A.M.; Jensen, T.J. Genetic tools for advancement of Synechococcus sp. PCC 7002 as a cyanobacterial chassis. Microb. Cell Fact. 2016, 15, 190. [Google Scholar] [CrossRef]
  62. Włodarczyk, A.; Selão, T.T. Newly discovered Synechococcus sp. PCC 11901 is a robust cyanobacterial strain for high biomass production. Commun. Biol. 2020, 3, 215. [Google Scholar] [CrossRef] [PubMed]
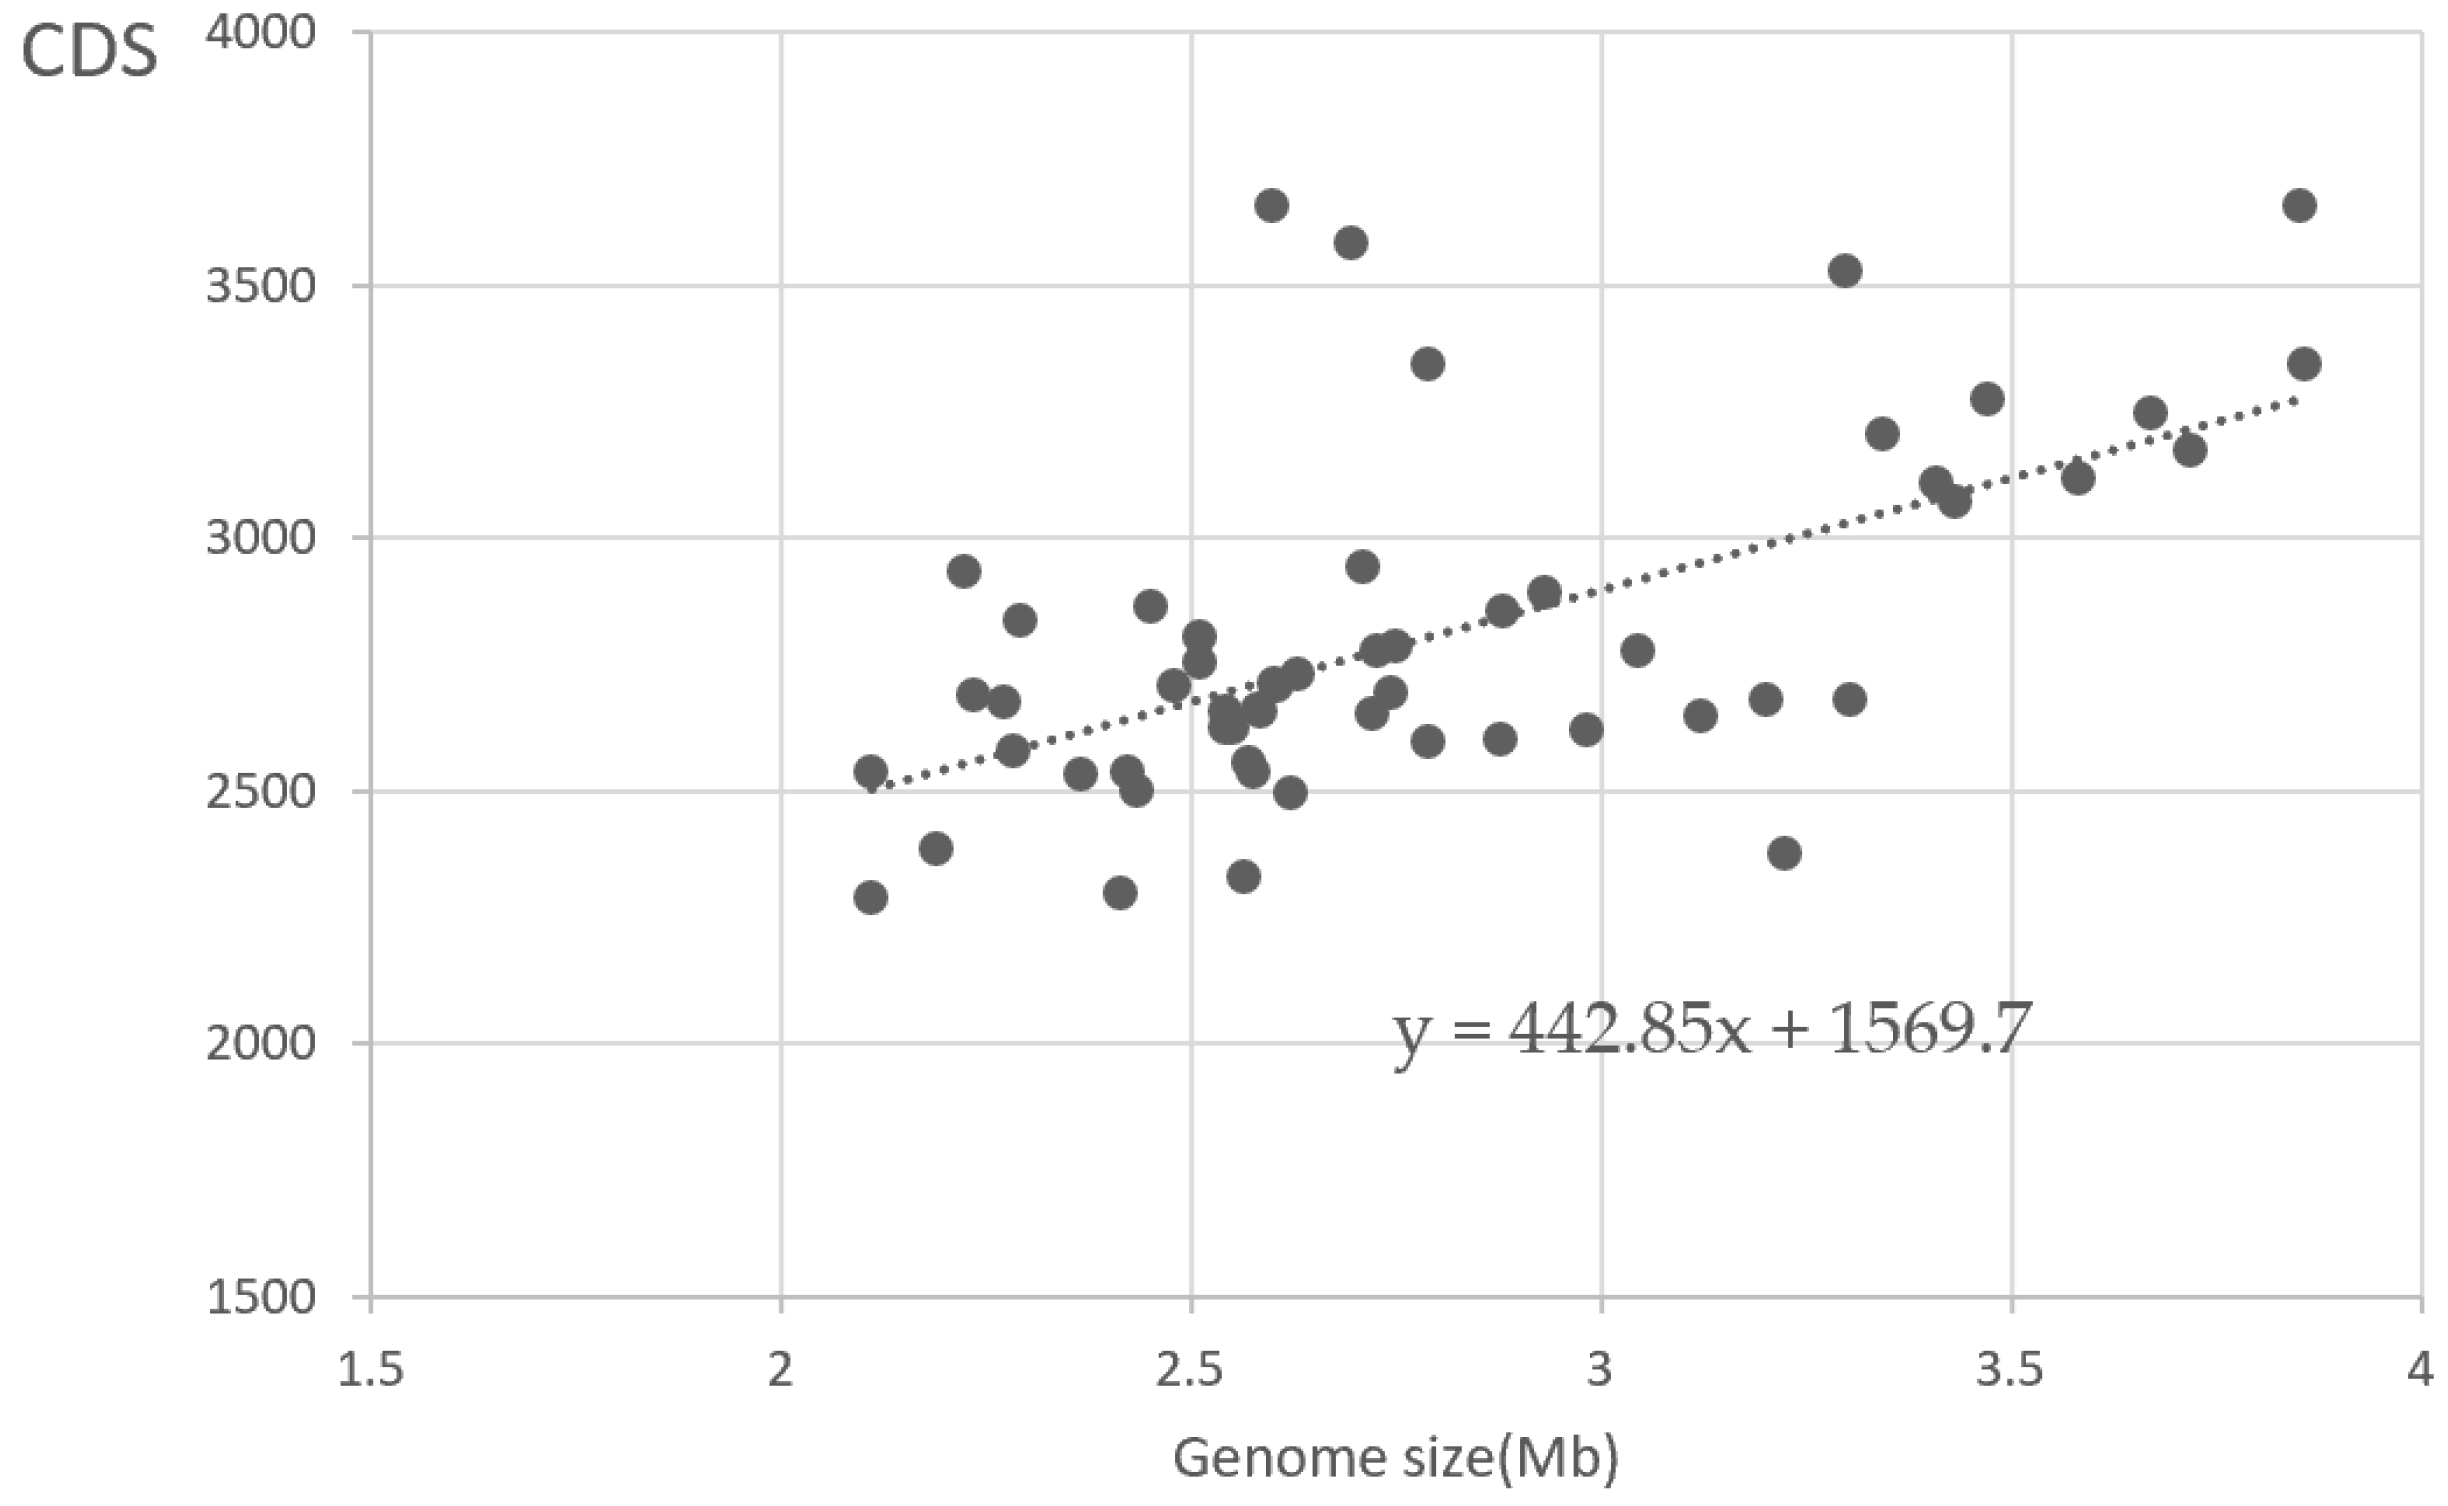
Figure 1. Linear regression diagram of CDS and genome size. The grey dots represent individual Synechococcus genomes, while the line represents the overall trend in the data.
Bioengineering 10 01329 g001
Figure 2. Systematic evolutionary diversity. Phylogenomic analysis with previously available marine Synechococcus reference genomes placed these within several clades, including 5.1, 5.2, 5.3 [17], Marine cluster C [18], thermophile, and freshwater. (a) Circular phylogenetic tree based on the complete genome sequence. The phylogenetic tree is from GTDB, with branch lengths reflecting phylogenetic information as inferred from the concatenation of 120 marker genes; (b) circular phylogenetic tree based on 16S rRNA; (c) unrooted circular phylogenetic tree based on peroxiredoxin, where the blue color represents the phylogenetic group to which the strain belongs; (d) circular phylogenetic tree analysis of cytochrome C oxidase subunit I sequences.
Bioengineering 10 01329 g002
Figure 3. Pan and core plot of the 56 Synechococcus with complete genomes. The purple and orange curves represent the core genome number plot and pan-genome number plot, respectively. Equations used to fit the curves are shown above the plot, respectively.
Bioengineering 10 01329 g003
Figure 4. COG distribution of core, accessory, and unique genes.
Bioengineering 10 01329 g004
Figure 5. Unique KO identifiers within core identifiers. Venn diagram showing the KO identifier numbers of (a) thermophilic strains; (b) warm-adapted strains; (c) cold-adapted; and (d) three different temperature types.
Bioengineering 10 01329 g005
Figure 6. Distribution of the KEGG pathway. The red and blue bar graphs represent the quantity of KEGG pathways. (a) Thermophilic Synechococcus specific core metabolic pathway distributions; and (b) cold-adapted Synechococcus specific core metabolic pathway distributions.
Bioengineering 10 01329 g006
Figure 7. Venn diagram of pangenomes of strictly marine and freshwater strains using KEGG core KO identifiers.
Bioengineering 10 01329 g007
Figure 8. Distribution of the KEGG pathway. The deep blue and light blue bar graphs represent the quantity of KEGG pathways. (a) Strictly marine Synechococcus specific core metabolic pathway distributions; and (b) freshwater Synechococcus specific core metabolic pathway distributions.
Bioengineering 10 01329 g008aBioengineering 10 01329 g008b
Table 1. Genomic characteristics of 56 Synechococcus strains.
Organism NameAccessionEcosystemSize (Mb)GC%CDS
Synechococcus sp. A15-127NZ_CP047948.1Marine2.5460.62653
Synechococcus sp. A15-44NZ_CP047938.1Marine2.6260.82496
Synechococcus sp. A15-60NZ_CP047933.1Marine2.5458.22623
Synechococcus sp. A15-62NZ_CP047950.1Marine2.2959.92837
Synechococcus sp. A18-25cNZ_CP047957.1Marine2.5158.22803
Synechococcus sp. BIOS-U3-1NZ_CP047936.1Marine2.71552943
Synechococcus sp. BMK-MC-1NZ_CP047939.1Marine2.6060.43654
Synechococcus sp. CB0101NZ_CP039373.1Marine2.7964.13343
Synechococcus sp. CBW1002NZ_CP060398.1Marine3.8564.63653
Synechococcus sp. CBW1004NZ_CP060397.1Marine3.6767.13247
Synechococcus sp. CBW1006NZ_CP060396.1Marine3.8664.63340
Synechococcus sp. CBW1107NZ_CP064908.1Marine3.266.32678
Synechococcus sp. CBW1108NZ_CP060395.1Marine3.2263.72373
Synechococcus sp. CC9311NC_008319.1Marine2.6052.42707
Synechococcus sp. CC9605NC_007516.1Marine2.5159.22753
Synechococcus sp. CC9902NC_007513.1Marine2.2354.22689
Synechococcus sp. JA-2-3B′a(2-13)NC_007776.1Thermal springs3.0558.52774
Synechococcus sp. JA-3-3AbNC_007775.1Thermal springs2.9360.22890
Synechococcus sp. KORDI-100NZ_CP006269.1Marine2.8057.52594
Synechococcus sp. KORDI-49NZ_CP006270.1Marine2.5961.42654
Synechococcus sp. KORDI-52NZ_CP006271.1Marine2.5759.12555
Synechococcus sp. LTW-RNZ_CP059060.1Marine2.4162.62297
Synechococcus sp. M16.1NZ_CP047954.1Marine2.1161.42537
Synechococcus sp. MEDNS5NZ_CP047952.1Marine2.4459.12500
Synechococcus sp. Minos11NZ_CP047953.1Marine2.2860.52577
Synechococcus sp. MIT S9220NZ_CP047958.1Marine2.4256.42537
Synechococcus sp. MVIR-18-1NZ_CP047942.1Marine2.4553.42864
Synechococcus sp. NIES-970NZ_AP017959.1Marine3.1249.42648
Synechococcus sp. NOUM97013NZ_CP047941.1Marine2.5558.82625
Synechococcus sp. PCC 11901NZ_CP040360.1Marine3.4749.13272
Synechococcus elongatus PCC 6301NC_006576.1Freshwater2.7055.53581
Synechococcus sp. PCC 6312NC_019680.1Freshwater3.7248.53171
Synechococcus sp. PCC 7002NC_010475.1Marine3.4149.23109
Synechococcus sp. PCC 7003NZ_CP016474.1Marine3.3549.33204
Synechococcus sp. PCC 7117NZ_CP016477.1Marine3.449.13071
Synechococcus sp. PCC 73109NZ_CP013998.1Marine3.3049.33524
Synechococcus sp. PCC 7502NC_019702.1Freshwater3.5840.63118
Synechococcus elongatus PCC 7942NC_007604.1Freshwater2.7246.32649
Synechococcus sp. PCC 8807NZ_CP016483.1Marine3.3049.32679
Synechococcus sp. PROS-7-1NZ_CP047945.1Marine2.5759.32328
Synechococcus sp. PROS-9-1NZ_CP047961.1Marine2.2753.92675
Synechococcus sp. PROS-U-1NZ_CP047951.1Marine2.5758.42535
Synechococcus sp. RCC307CT978603.1Marine2.2260.82931
Synechococcus sp. ROS8604NZ_CP047946.1Marine2.88542600
Synechococcus sp. RS9902NZ_CP047949.1Marine2.4859.82706
Synechococcus sp. RS9907NZ_CP047944.1Marine2.5860.42659
Synechococcus sp. RS9909NZ_CP047943.1Marine2.6064.42711
Synechococcus sp. RSCCF101NZ_CP035632.1Marine2.98682618
Synechococcus sp. SYN20NZ_CP047959.1Marine2.7253.42773
Synechococcus sp. SynAce01NZ_CP018091.1Marine2.7563.92784
Synechococcus sp. TAK9802NZ_CP047937.1Marine2.1960.82382
Synechococcus sp. UTEX 2973NZ_CP006471.1Freshwater2.7455.52691
Synechococcus elongatus UTEX 3055NZ_CP033061.1Freshwater2.8855.12853
Synechococcus sp. WH 7803CT971583.1Marine2.3660.22533
Synechococcus sp. WH 8101NZ_CP035914.1Marine2.6363.32730
Synechococcus sp. WH 8109NZ_CP006882.1Marine2.1160.12288
Table 2. List of geographical isolation information of Synechococcus.
Strain NameGeographic OriginIsolation LatitudeIsolation LongitudeDepth (m)Isolation Date
A15-127North Atlantic Ocean−31.12−3.924524 October 2004
A15-44North Atlantic Ocean21.68−17.83201 October 2004
A15-60North Atlantic Ocean17.62−20.95104 October 2004
A15-62North Atlantic Ocean17.62−20.95154 October 2004
A18-25cPacific Ocean27.63−37.037414 September 2008
BIOS-U3-1Pacific Ocean−33.86−73.34528 November 2004
BMK-MC-1Mediterranean Sea40.814.152313 October 2009
CB0101Chesapeake Bay39.28−76.6017 July 2004
CBW1002Chesapeake Bay39.28−76.6021 December 2010
CBW1004Chesapeake Bay39.28−76.6028 December 2010
CBW1006Chesapeake Bay39.28−76.6028 December 2010
CBW1107Chesapeake Bay39.28−76.601 February 2011
CBW1108Chesapeake Bay39.28−76.601 February 2011
CC9311North Pacific, California31.91−124.17958 April 1993
CC9605North Pacific, California30.42−124511 January 1993
CC9902North Pacific, California32.87−117.2651 January 1996
JA-2-3B′a(2-13)Octopus Spring22.45−15840010 July 2002
JA-3-3AbOctopus Spring44.55−110.8240025 July 2002
KORDI-100Pacific Ocean9.15158.40September 2007
KORDI-49Pacific Ocean32.3126201 March 2004
KORDI-52Pacific Ocean32126.45301 May 2005
LTW-RPearl river, China22.22114.129-July 2014
M16.1North Atlantic Ocean27.7−91.32759 February 2004
MEDNS5Mediterranean Sea416801 July 1993
MINOS11Mediterranean Sea3418202 November 2010
MIT S9220Pacific Ocean0−14001 October 1992
MVIR-18-1North Atlantic Ocean611.592523 July 2007
NIES-970Rikuhama Beach, Japan---28 August 1998
NOUM97013Pacific Ocean−22.33166.33019 November 1996
PCC 11901Singapore1.25103.57206 May 2017
PCC 6301Austin, Texas, USA30.41−97.76-1 January 1952
PCC 6312California, USA---1 January 1963
PCC 7002Magueyes, Puerto Rico17.96−67.04-1 January 1961
PCC 7003Greenwich, USA---1 January 1960
PCC 7117Port Hedland, Australia---1 January 1971
PCC 73109City Island, New York---1 January 1961
PCC 7502Lake, Switzerland---1 January 1972
PCC 7942California, USA---1 January 1973
PCC 8807Lagoon, Gabon---1 January 1979
PROS-7-1Mediterranean Sea37.415.62526 September 1999
PROS-9-1Mediterranean Sea41.910.433028 September 1999
PROS-U-1North Atlantic Ocean71.22−136.72512 September 1999
RCC307Mediterranean Sea39.176.181525 May 1996
ROS8604North Atlantic48.73−3.98124 November 1986
RS9902Indian ocean, Red Sea29.4734.92123 March 1999
RS9907Indian ocean, Red Sea29.4734.921029 August 1999
RS9909Indian ocean, Red Sea29.4734.92107 September 1999
RSCCF101Indian ocean, Red Sea29.4734.9220July 2014
SYN20North Atlantic Ocean60.275.2121 June 2004
SynAce01Ace Lake, Antarctica−65.3178.5151992
TAK9802South Pacific Ocean34.9234.9276 February 1998
UTEX 2973Austin, Texas, USA--07 December 2011
UTEX 3055Austin, Texas, USA30.17−97.44-13 December 2013
WH7803North Atlantic Ocean33.75−67.5253 July 1978
WH8101North Atlantic Ocean41.52−70.6701 January 1981
WH8109North Atlantic Ocean39.28−70.46-1 June 1981
Table 3. Growth temperature characteristics of different strains of Synechococcus.
Strain NameCulture Collection NumberCulture MediumCulture Temperature
(°C)
Growth Temperature
(°C)
Optimum Temperature
(°C)
Ecotype
A15-127RCC 2378PCR-S1122---
A15-44RCC 2527PCR-S112225–4030Warm
A15-60RCC 2554PCR-S1122---
A15-62RCC 2374PCR-S112216–3230Warm
A18-25c-PCR-S1122---
BIOS-U3-1RCC 2533PCR-S112212–2925Cold
BMK-MC-1-PCR-S1122---
CB0101-SN254–3025Cold
CBW1002 SN15234–106.5Cold
CBW1004-SN15234–106.2Cold
CBW1006-SN15234–106.2Cold
CBW1107-SN15234–102.5Cold
CBW1108-SN15234–102.5Cold
CC9311RCC 1086SN3523--Warm
CC9605RCC 753PCR-S1122---
CC9902RCC 2673SN2210–3024Cold
JA-2-3B′a(2-13)-BG112545–6551–61Thermophile
JA-3-3Ab-BG112545–7058–65Thermophile
KORDI-100-BG1128-29.5-
KORDI-49-ASN III20-13.5-
KORDI-52-BG1125-14.5-
LTW-R-BG1125---
M16.1RCC 791PCR-S112218–3532Warm
MEDNS5RCC 2368PCR-S1122---
MINOS11RCC 2319PCR-S1122---
MIT S9220RCC 2571PCR-S112216–3130Warm
MVIR-18-1RCC 2385PCR-S11154–2522Cold
NIES-970NIES 970ESM20---
NOUM97013RCC 2433PCR-S1122---
PCC 11901PCC 1190115363020–4338–41Warm
PCC 6301PCC 630115402220–4038Warm
PCC 6312PCC 631215392220–4038Warm
PCC 7002PCC 700215502220–4038Warm
PCC 7003PCC 7003153622---
PCC 7117PCC 7117153622---
PCC 73109PCC73109153522---
PCC 7502PCC 7502153922---
PCC 7942PCC 794215392220–4538Warm
PCC 8807PCC 8807154622---
PROS-7-1RCC 2381PCR-S1122---
PROS-9-1RCC 328PCR-S1122---
PROS-U-1RCC 2369PCR-S1122---
RCC307RCC 307PCR-S112010–4030Cold
ROS8604RCC 2380PCR-S112016–3026Warm
RS9902RCC 2376PCR-S1122---
RS9907RCC 2382PCR-S112218–3530–32Warm
RS9909RCC 2383PCR-S1122---
RSCCF101-PCR-S1130–3825–3830Warm
SYN20RCC 2035PCR-S112210–4030Cold
SynAce01-PCR-S1110−17–29.520Cold
TAK9802RCC 2528PCR-S1122---
UTEX 29732973BG112015–4138–41Warm
UTEX 30553055BG112010–4230Warm
WH7803RCC 752PCR-S112016–3433Warm
WH8101RCC 2555PCR-S112216–3525Warm
WH8109RCC 2033PCR-S112216–3528Warm
Table 4. Salinity growth conditions of the researched Synechococcus.
Strain NameSize
(Mb)
GC
(%)
Salinity Tolerance
(ppt)
Optimal Salinity
(ppt)
Category
CB01012.7896564.10–3515euryhaline
CBW10023.8541264.65–2217euryhaline
CBW10043.6723267.15–2219euryhaline
CBW10063.8601364.65–2219euryhaline
CBW11073.2020966.35–228euryhaline
CBW11083.2262263.75–228euryhaline
CC93112.6067552.424–4433.3strictly marine
CC96052.5106659.224–4434strictly marine
CC99022.2348354.230–4435strictly marine
KORDI-1002.78957.5-34.2strictly marine
KORDI-492.5858161.4-34.2strictly marine
KORDI-522.5720759.1-33.8strictly marine
LTW-R2.4155362.614–4424–34euryhaline
PCC 119013.4718149.10–10025euryhaline
PCC 63012.6962555.5--freshwater
PCC 63123.720548.5--freshwater
PCC 70023.4099349.20–900–25euryhaline
PCC 70033.3450949.3--strictly marine
PCC 71173.432149.1--euryhaline
PCC 731093.2986849.3--euryhaline
PCC 75023.5837340.6--freshwater
PCC 79422.7215546.30–2923freshwater
RCC3072.2249160.8-37strictly marine
SynAce012.7506363.910–5020–30euryhaline
UTEX 29732.7446355.56–129freshwater
UTEX 30552.8812255.1--freshwater
WH78032.3669860.224–4434strictly marine
Disclaimer/Publisher’s Note: The statements, opinions and data contained in all publications are solely those of the individual author(s) and contributor(s) and not of MDPI and/or the editor(s). MDPI and/or the editor(s) disclaim responsibility for any injury to people or property resulting from any ideas, methods, instructions or products referred to in the content.