
Time-Dependent Fluid-Structure Interaction Simulations of a Simplified Human Soft Palate


Abstract
1. Introduction
2. Methods
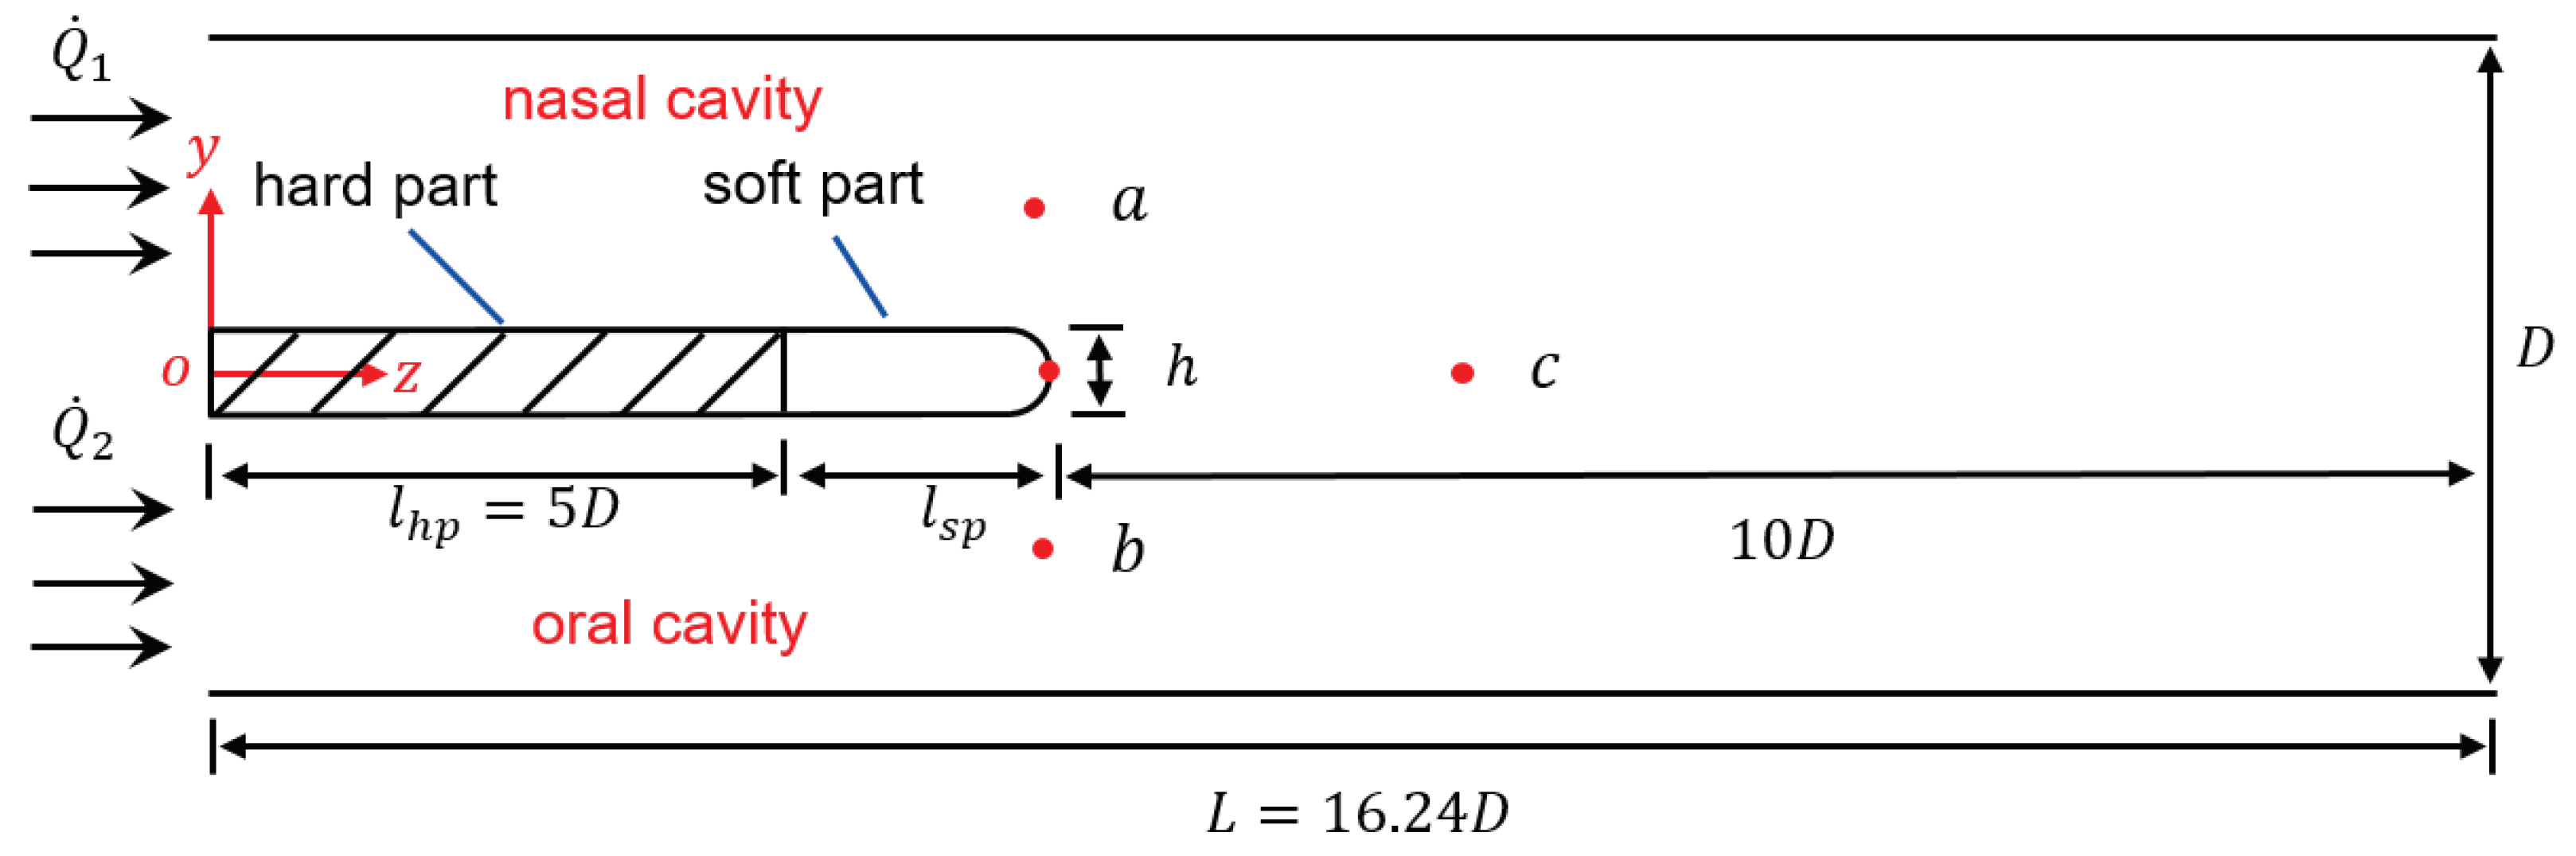
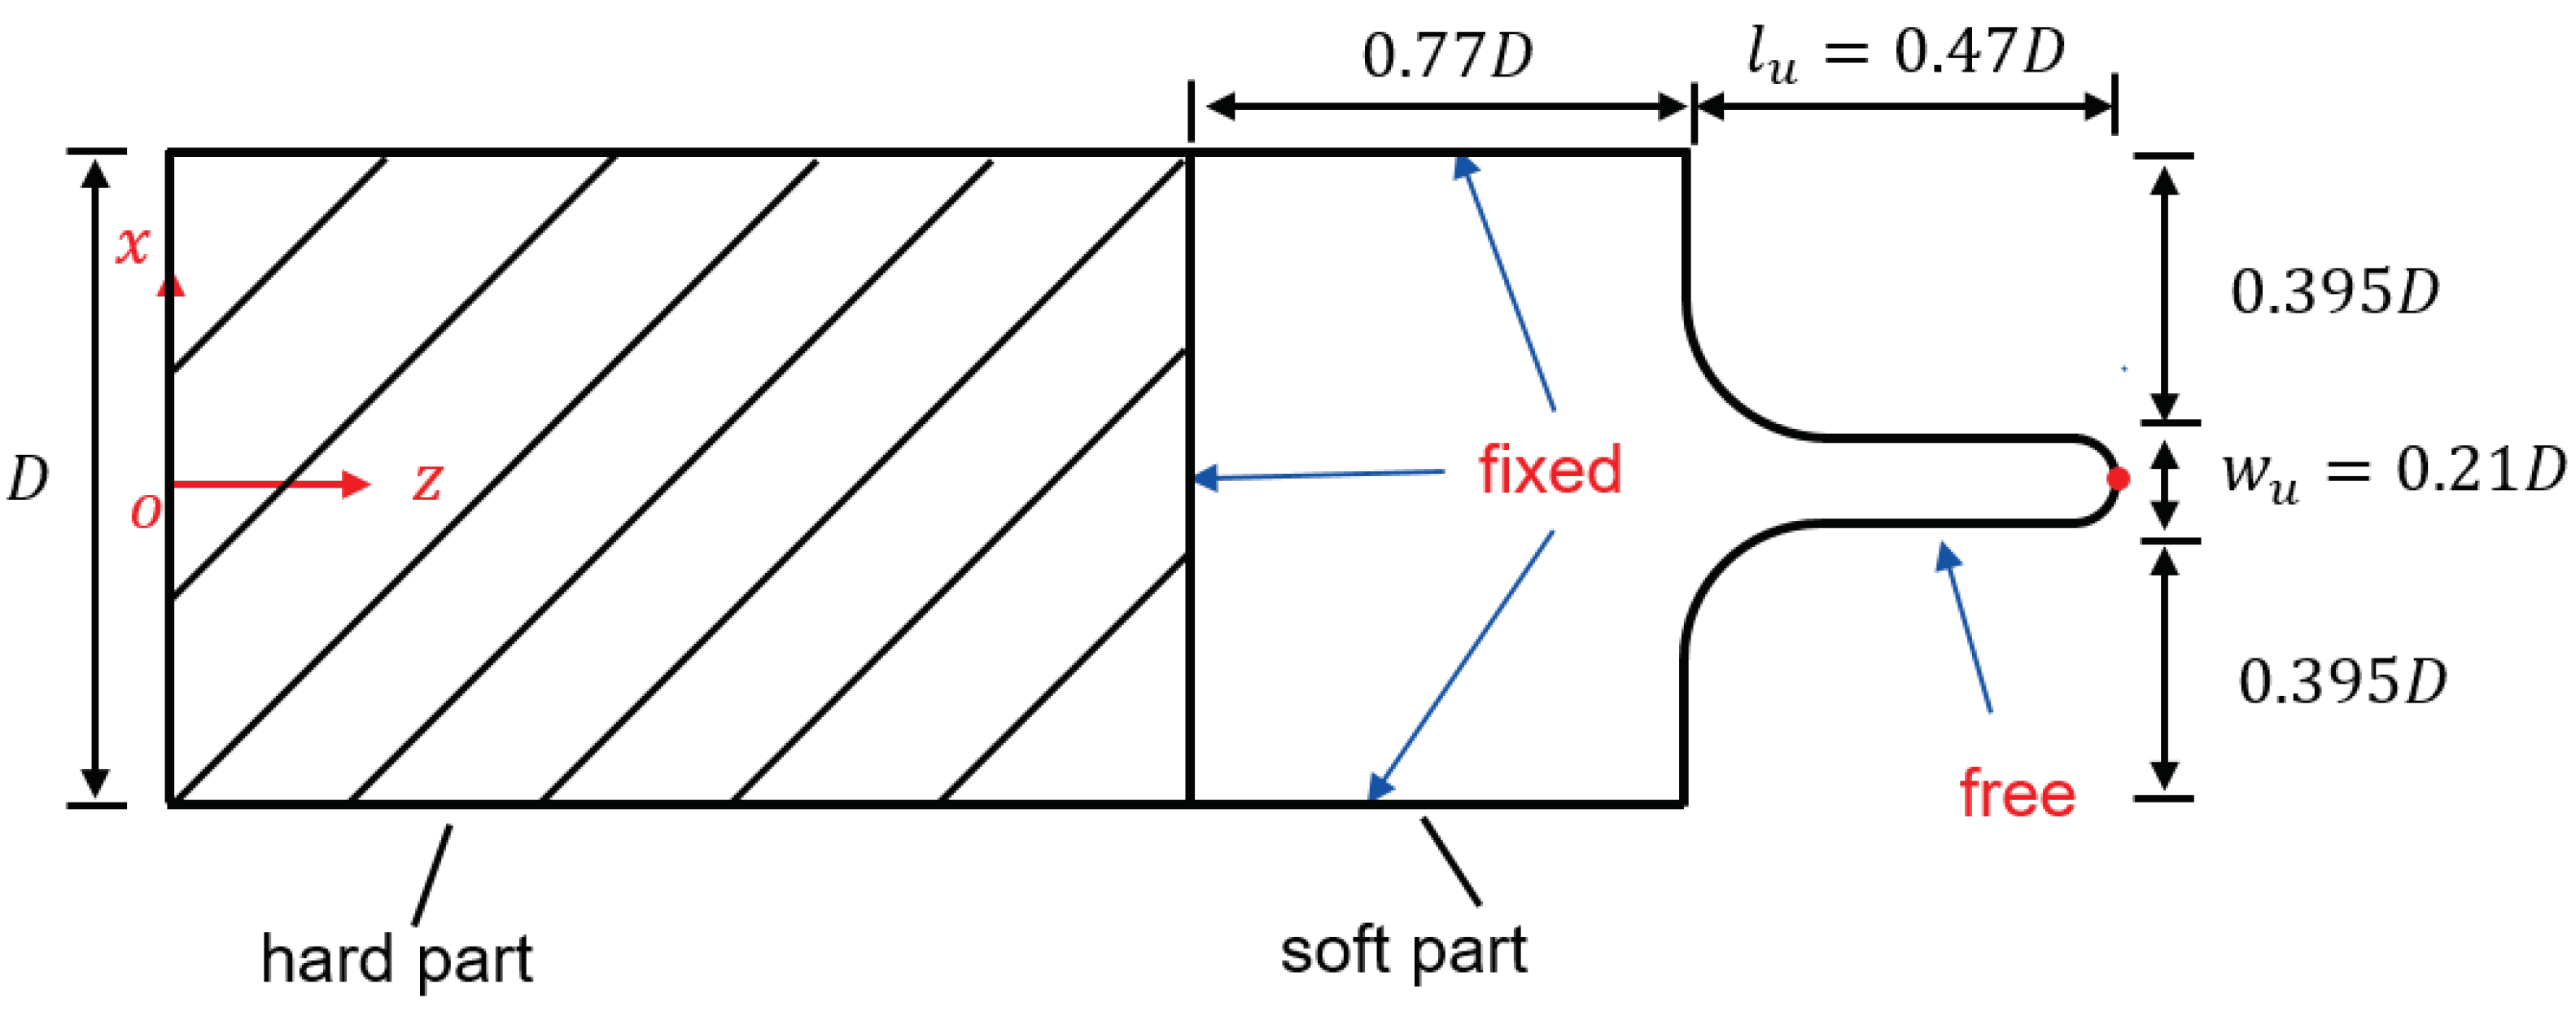
2.1. Simplified 3D Model for Palatal System
2.2. Fluid Domain
2.3. Solid Domain
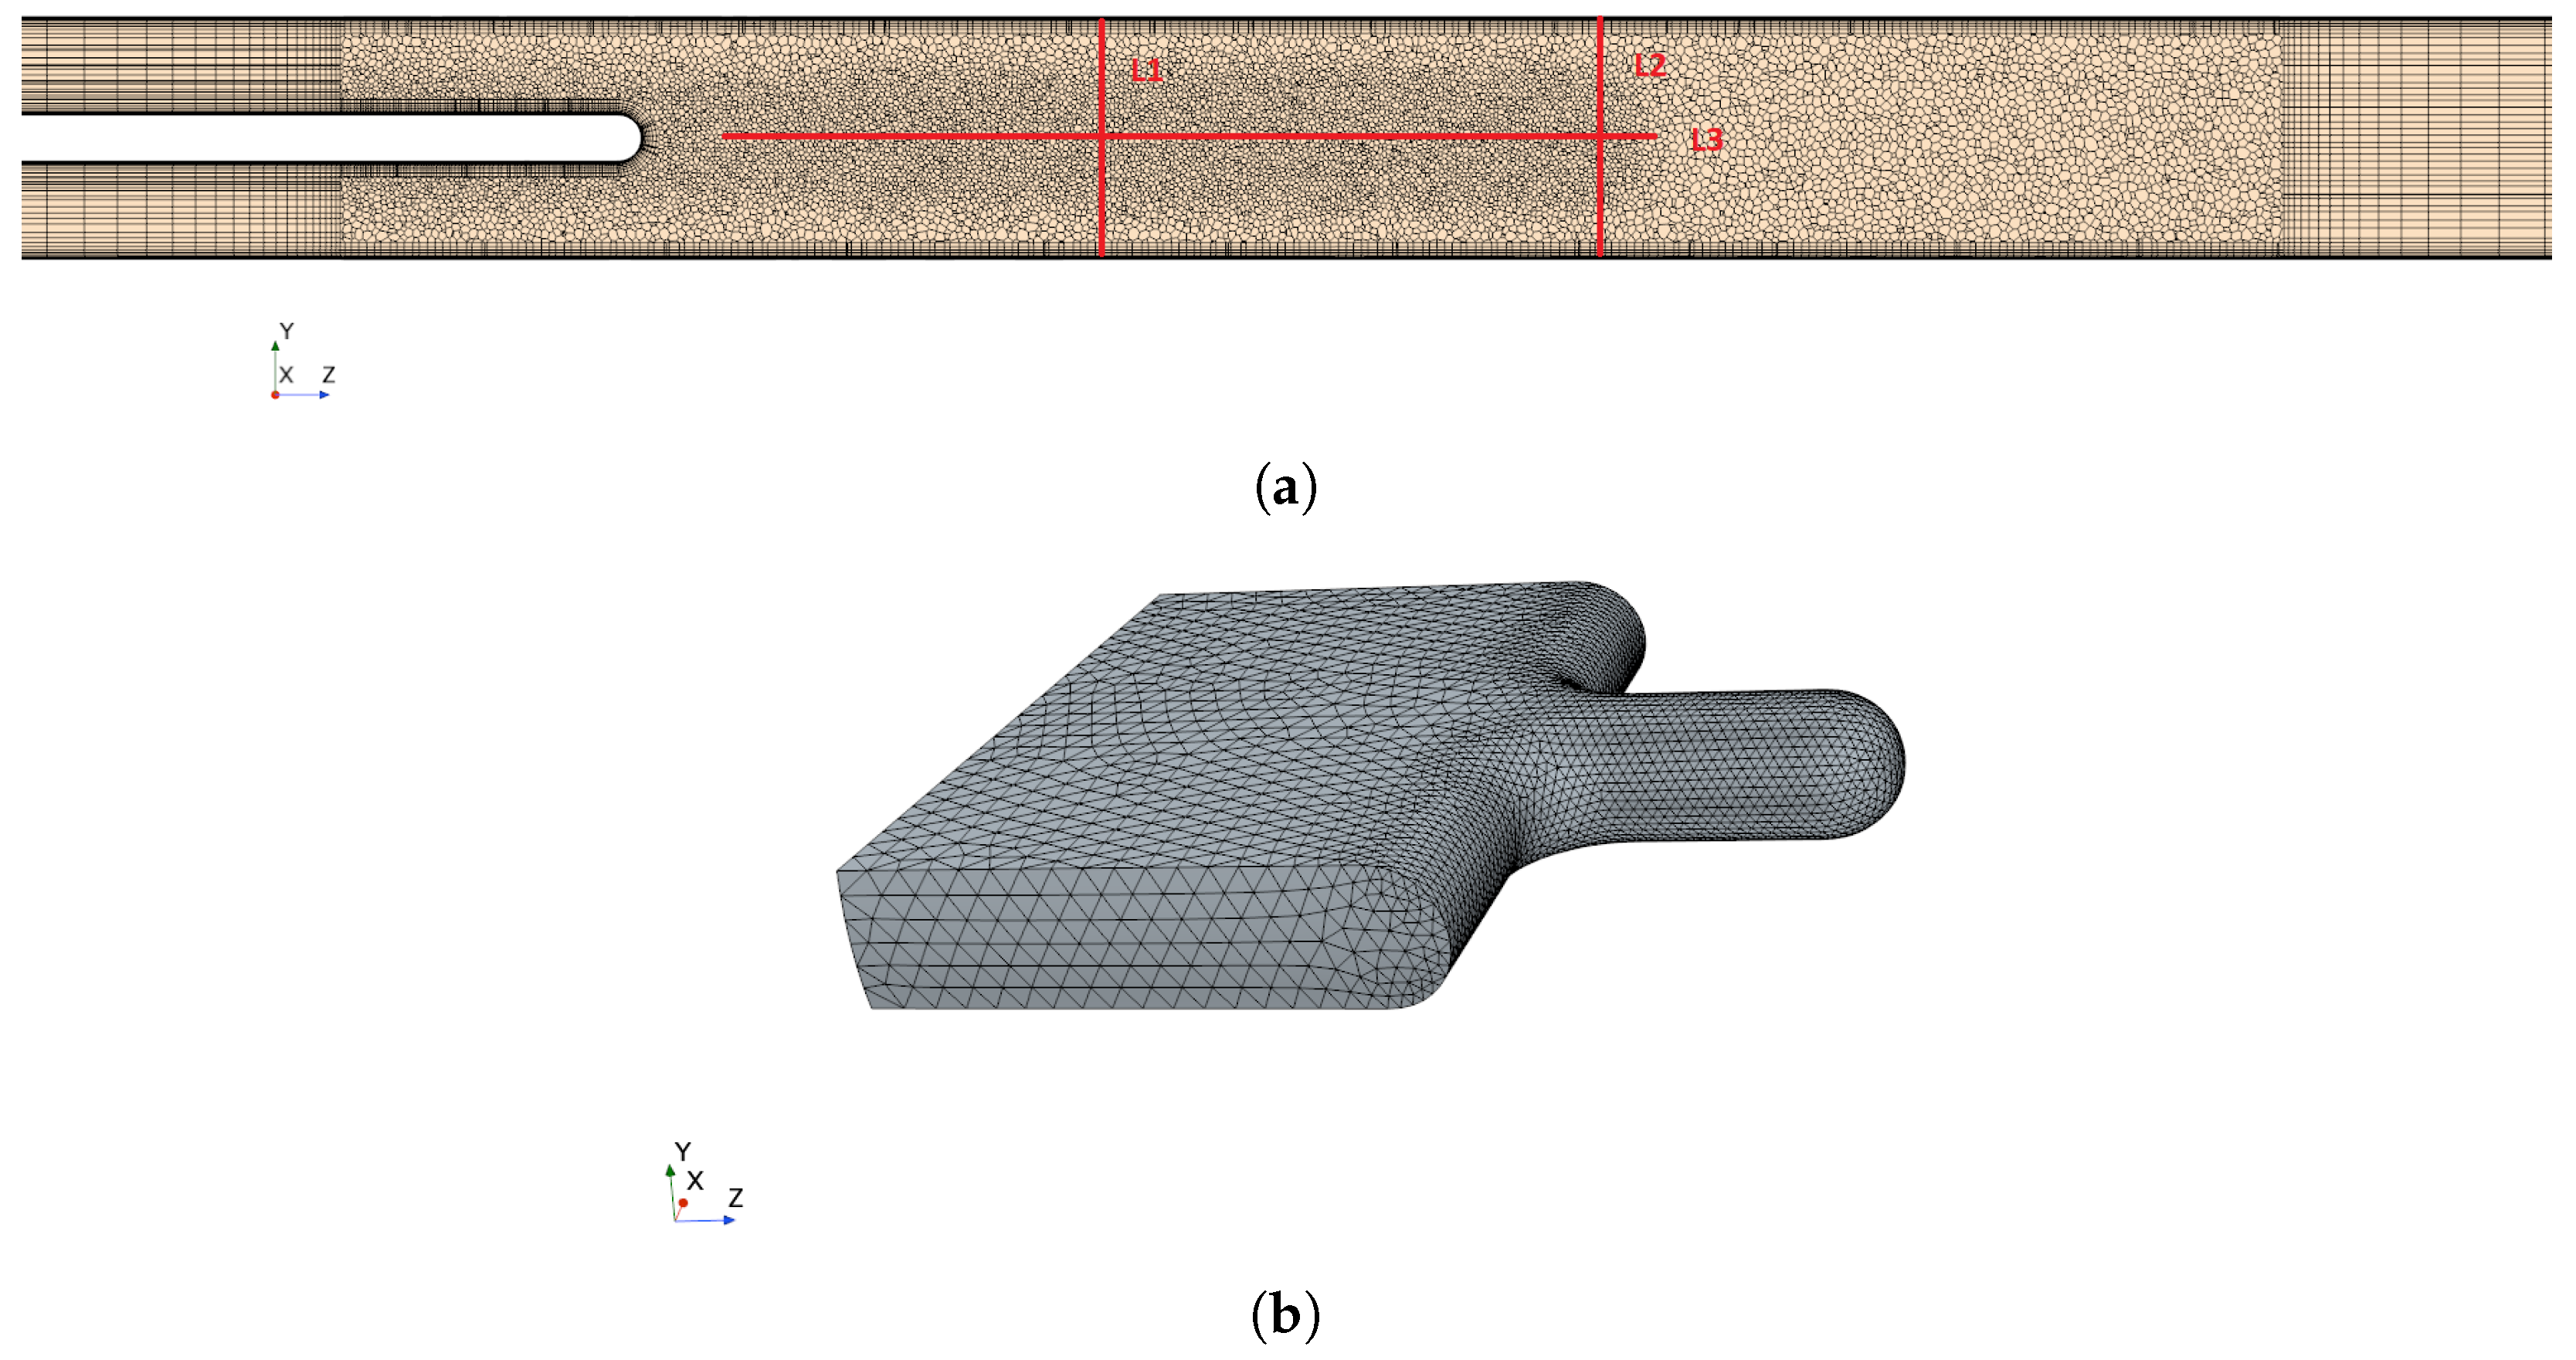
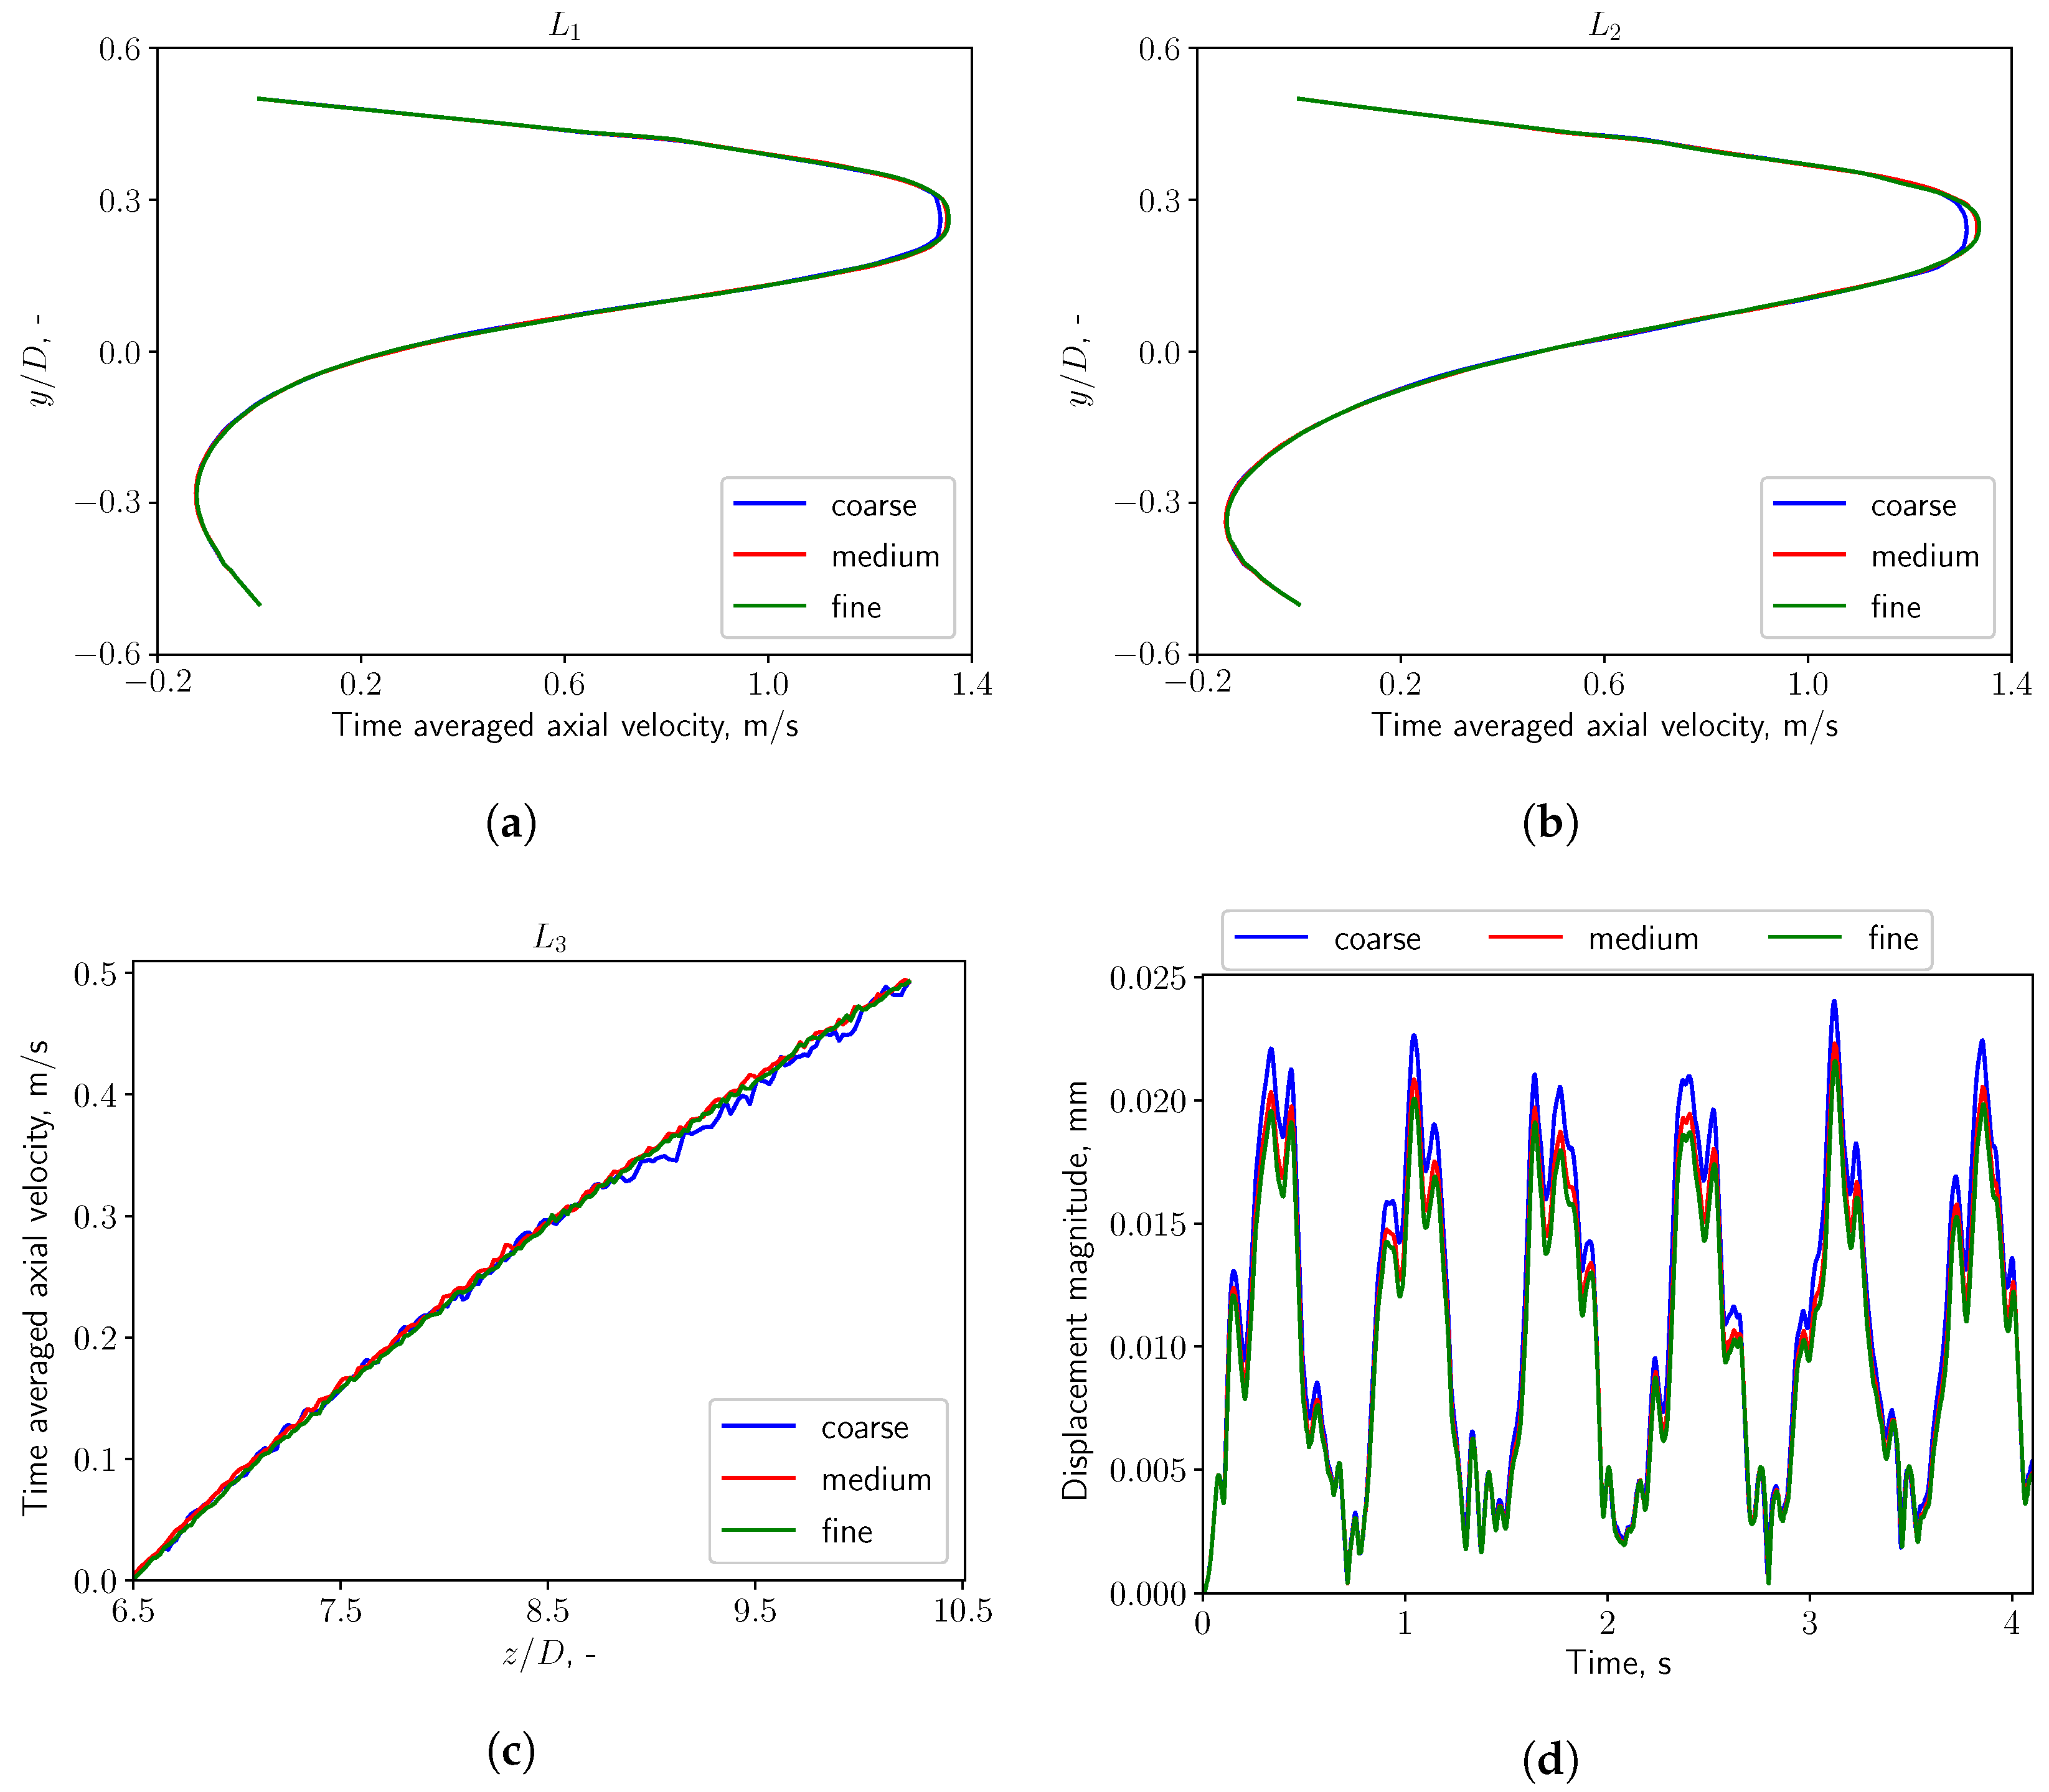
2.4. Mesh Sensitivity Study
3. Results
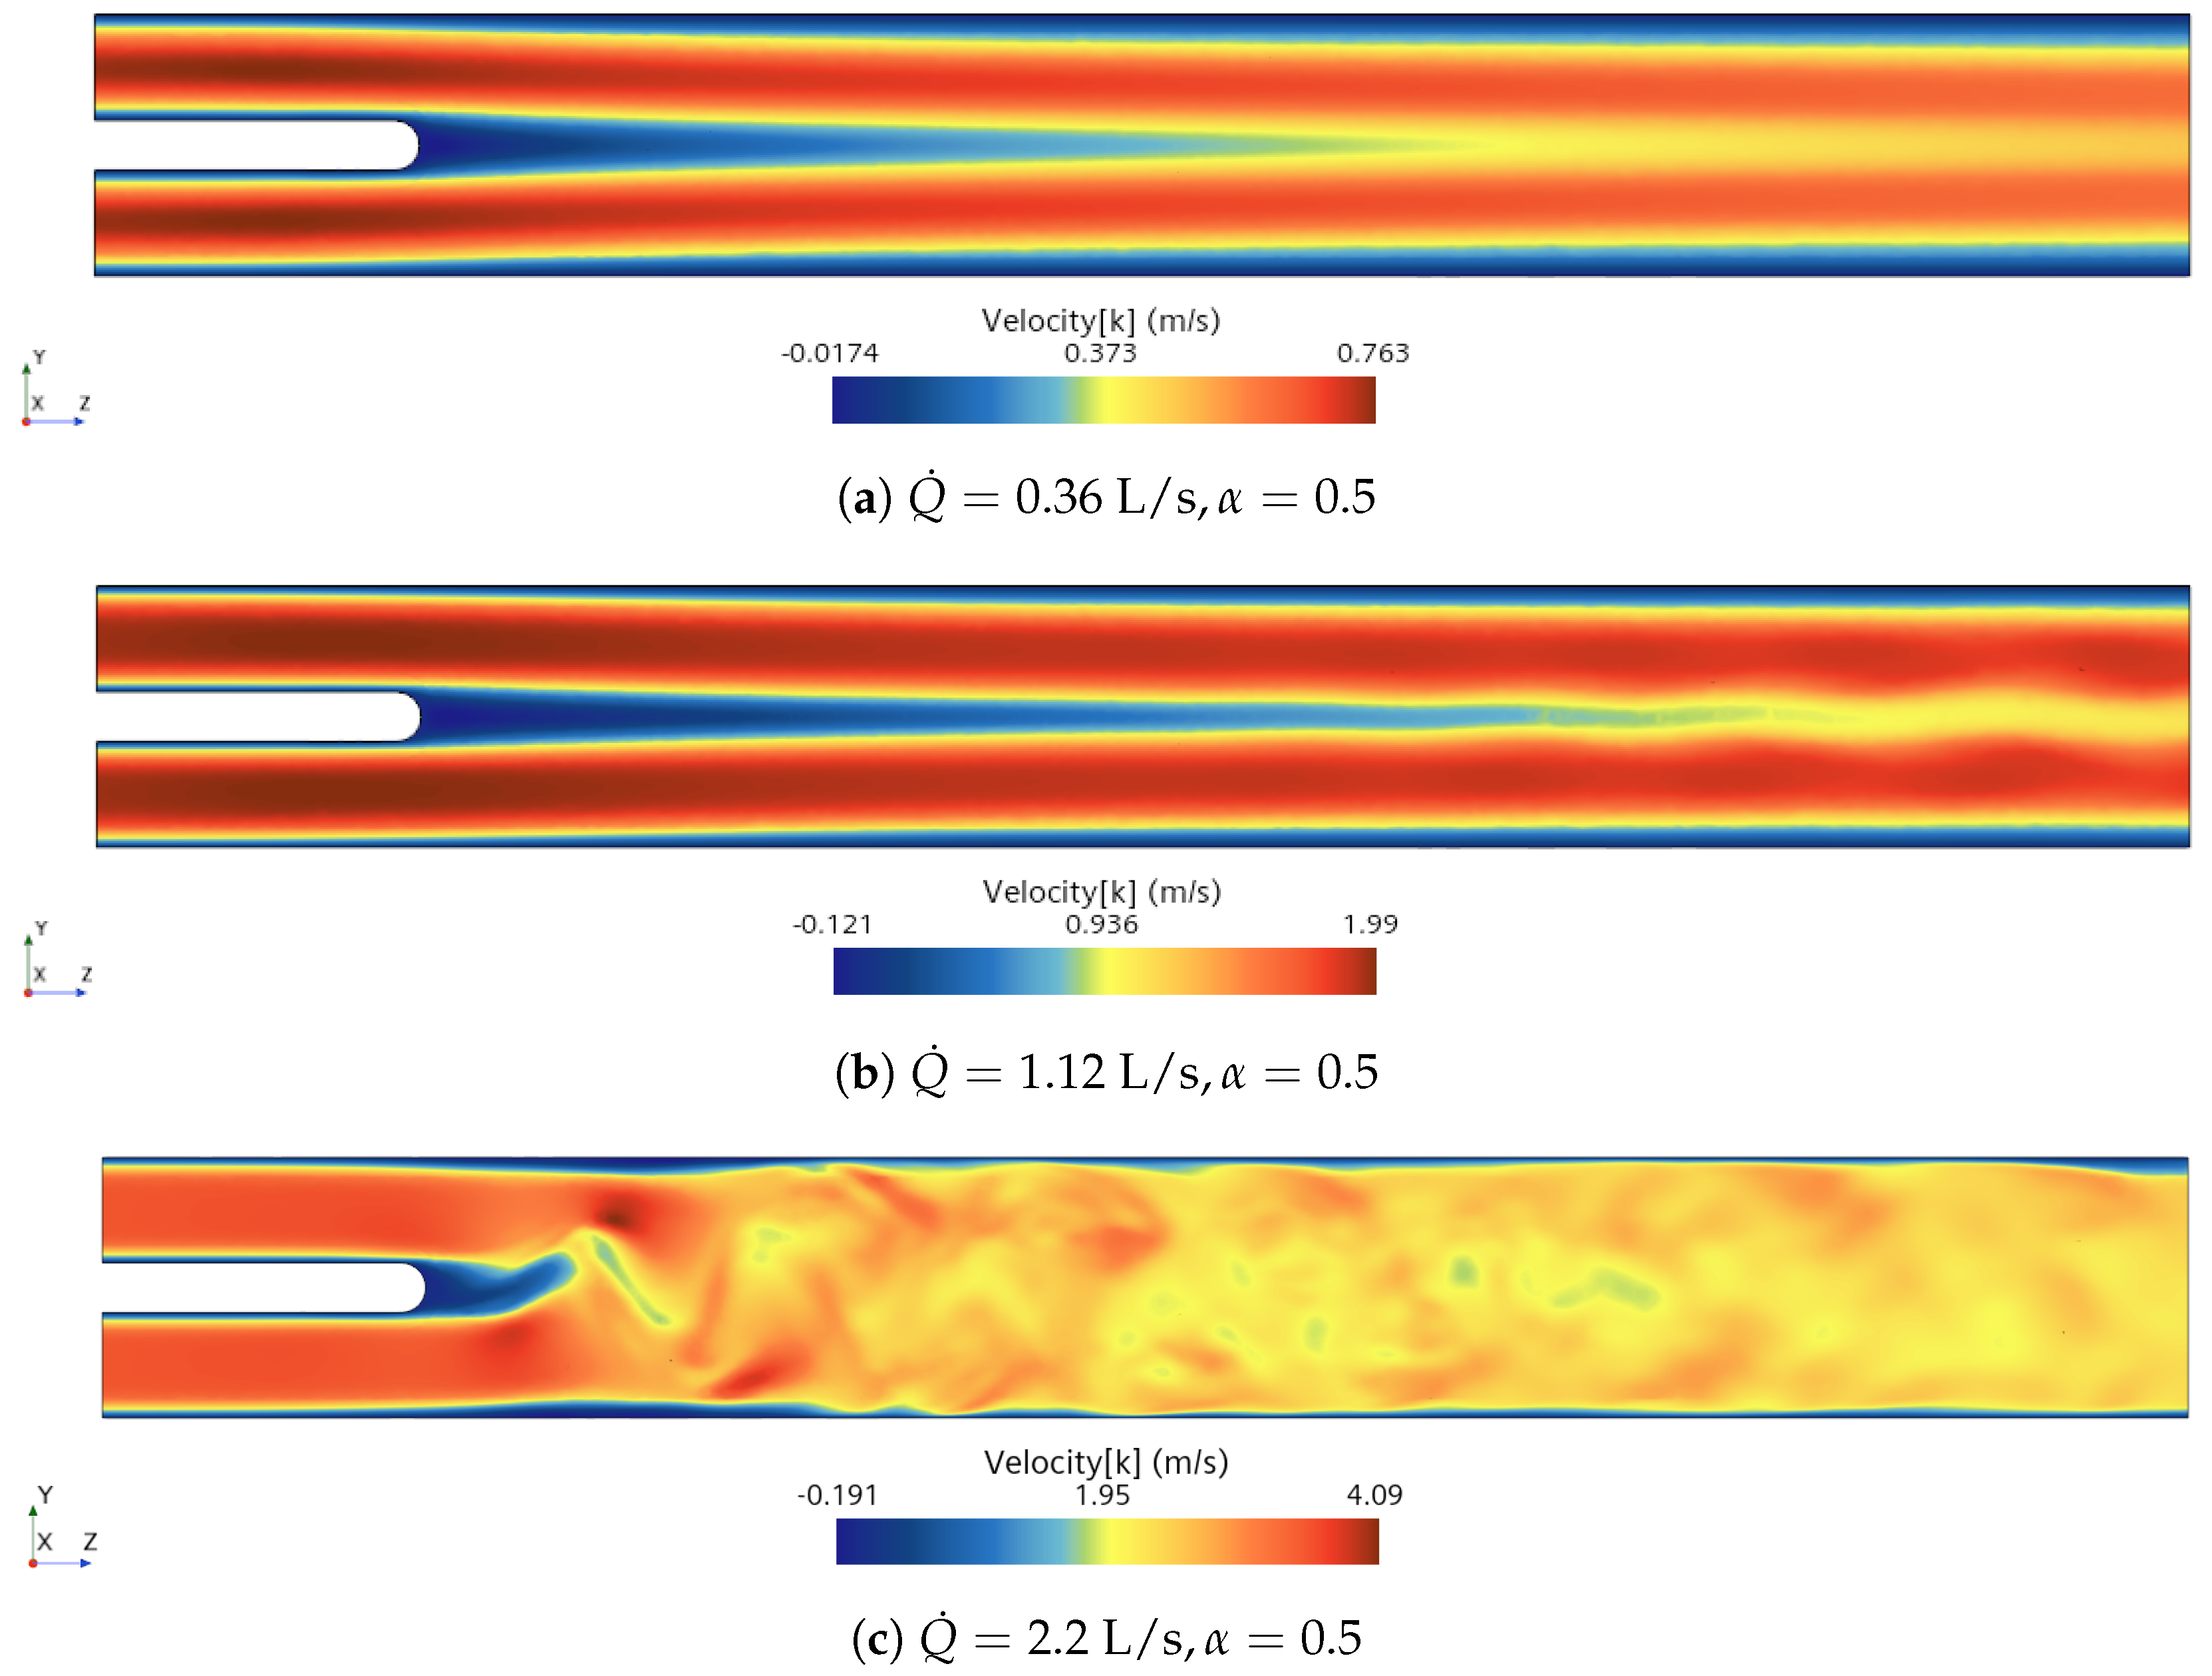
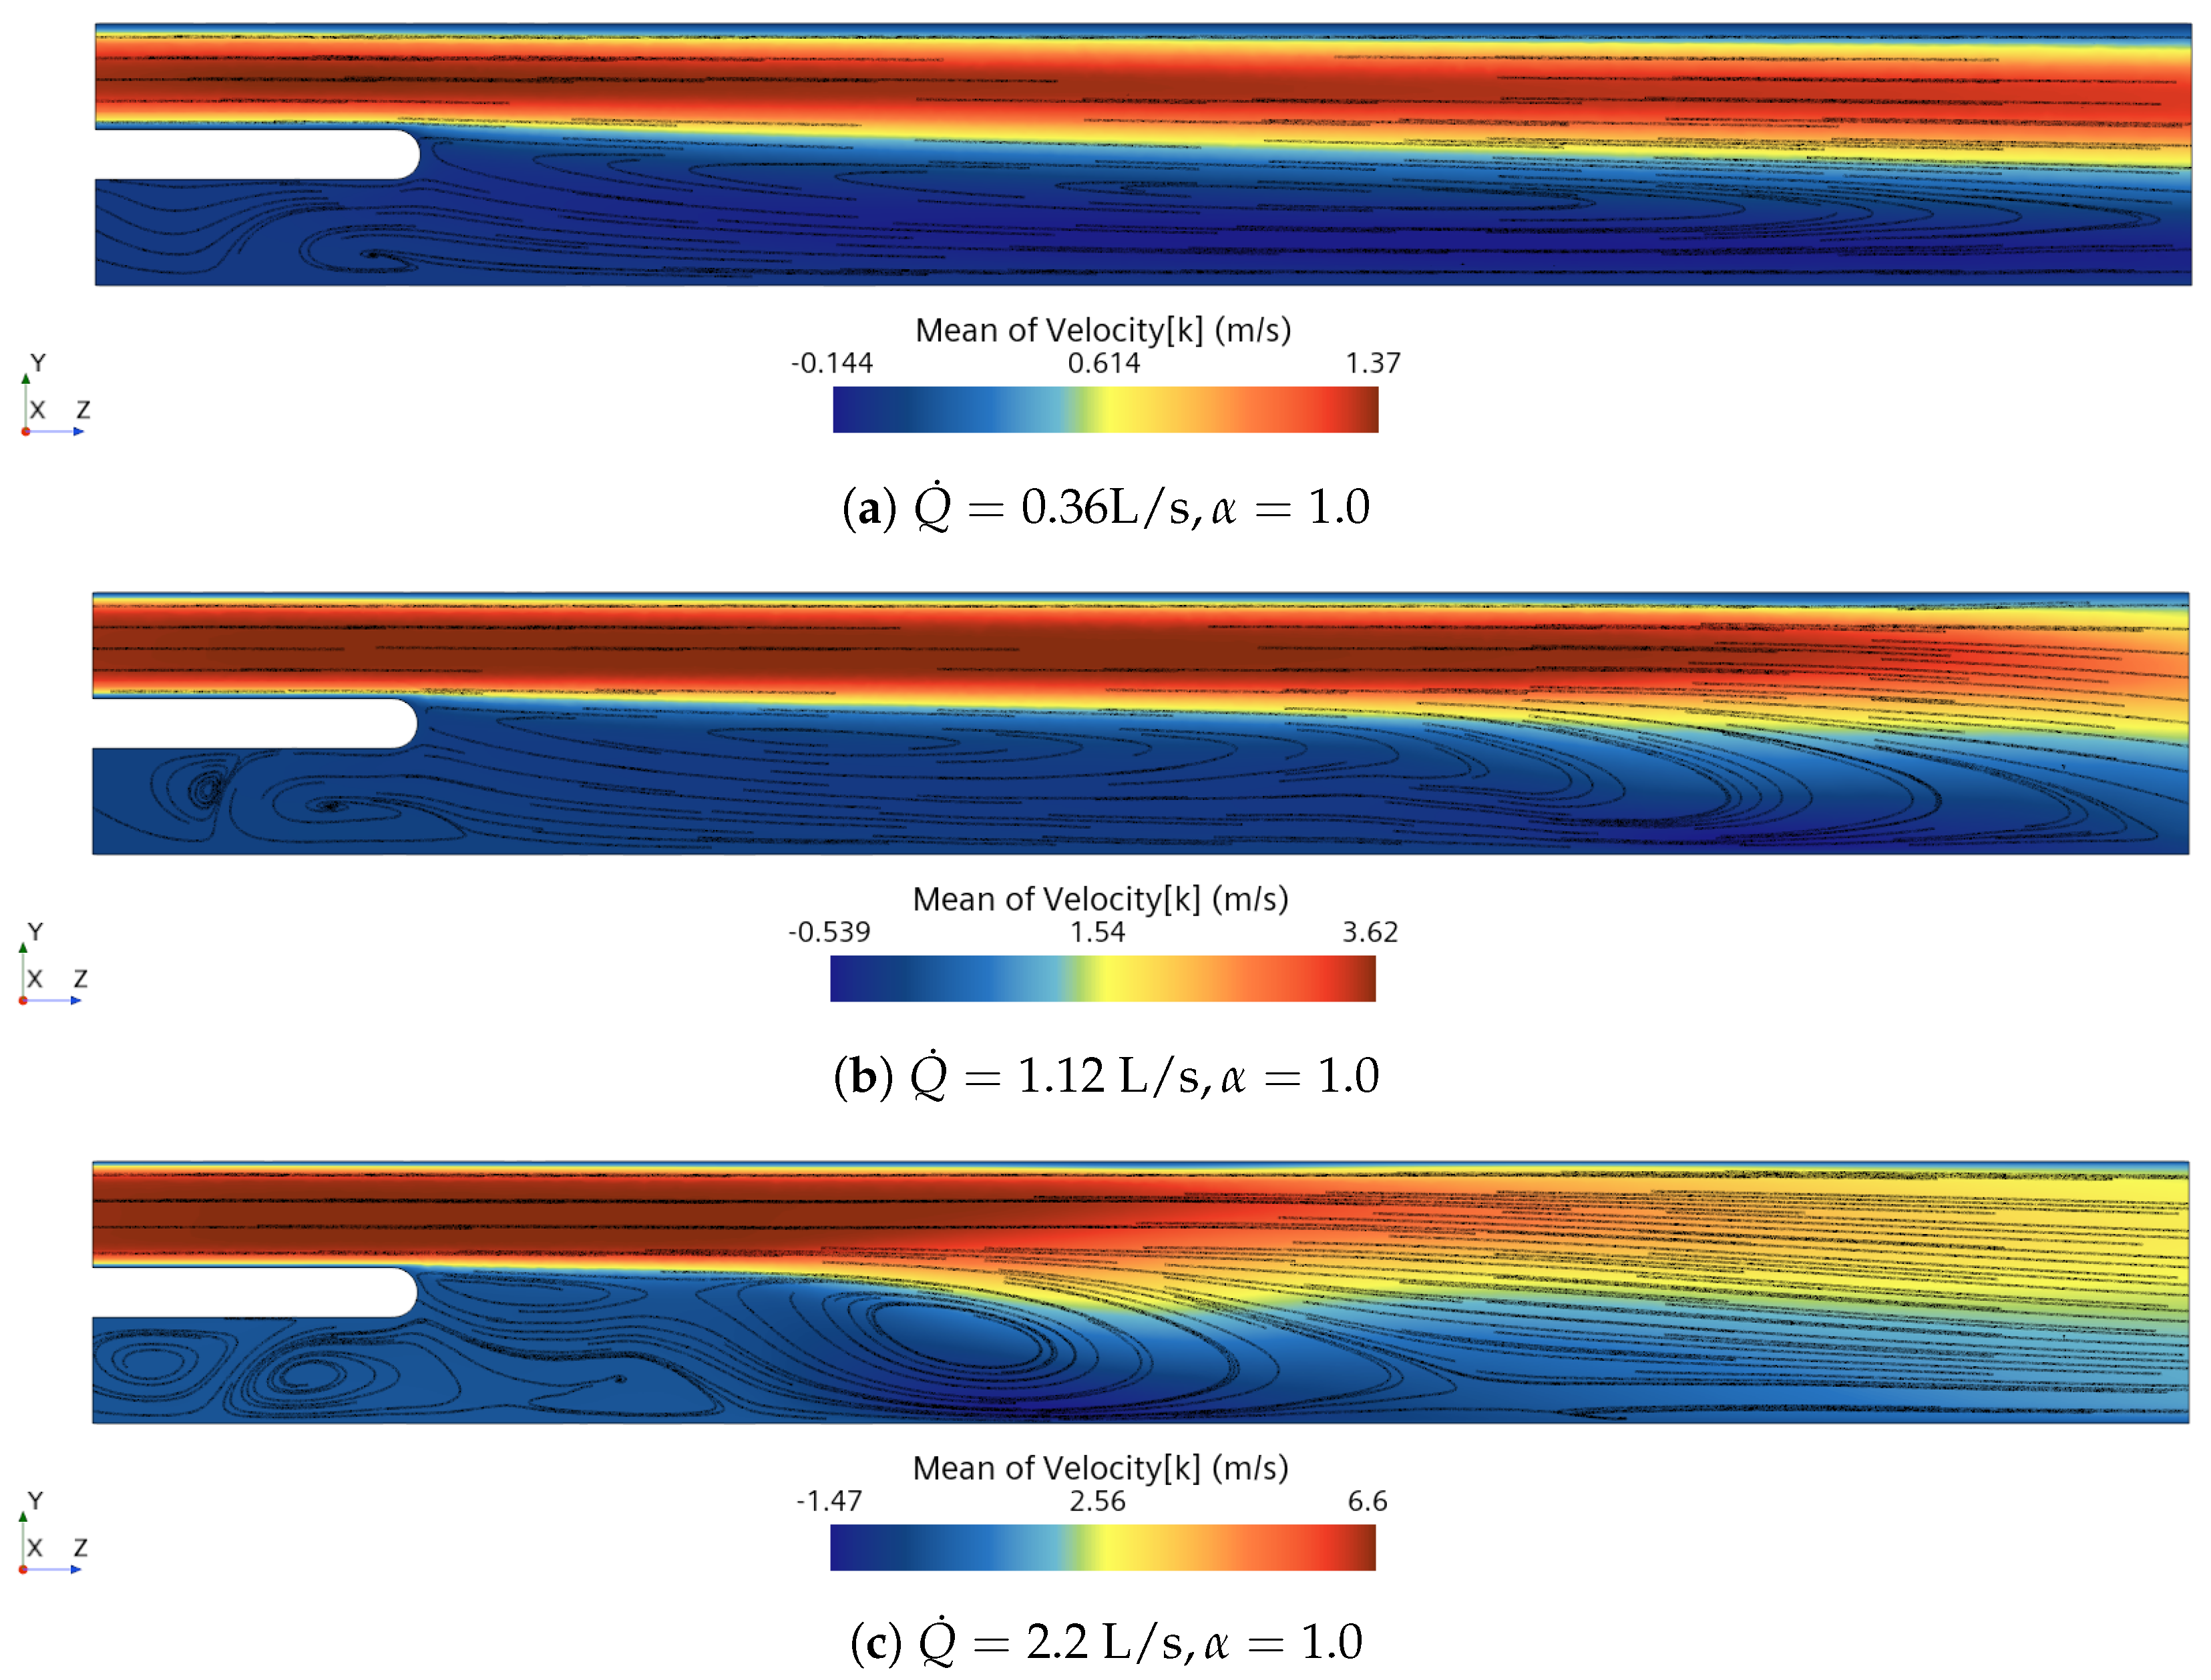
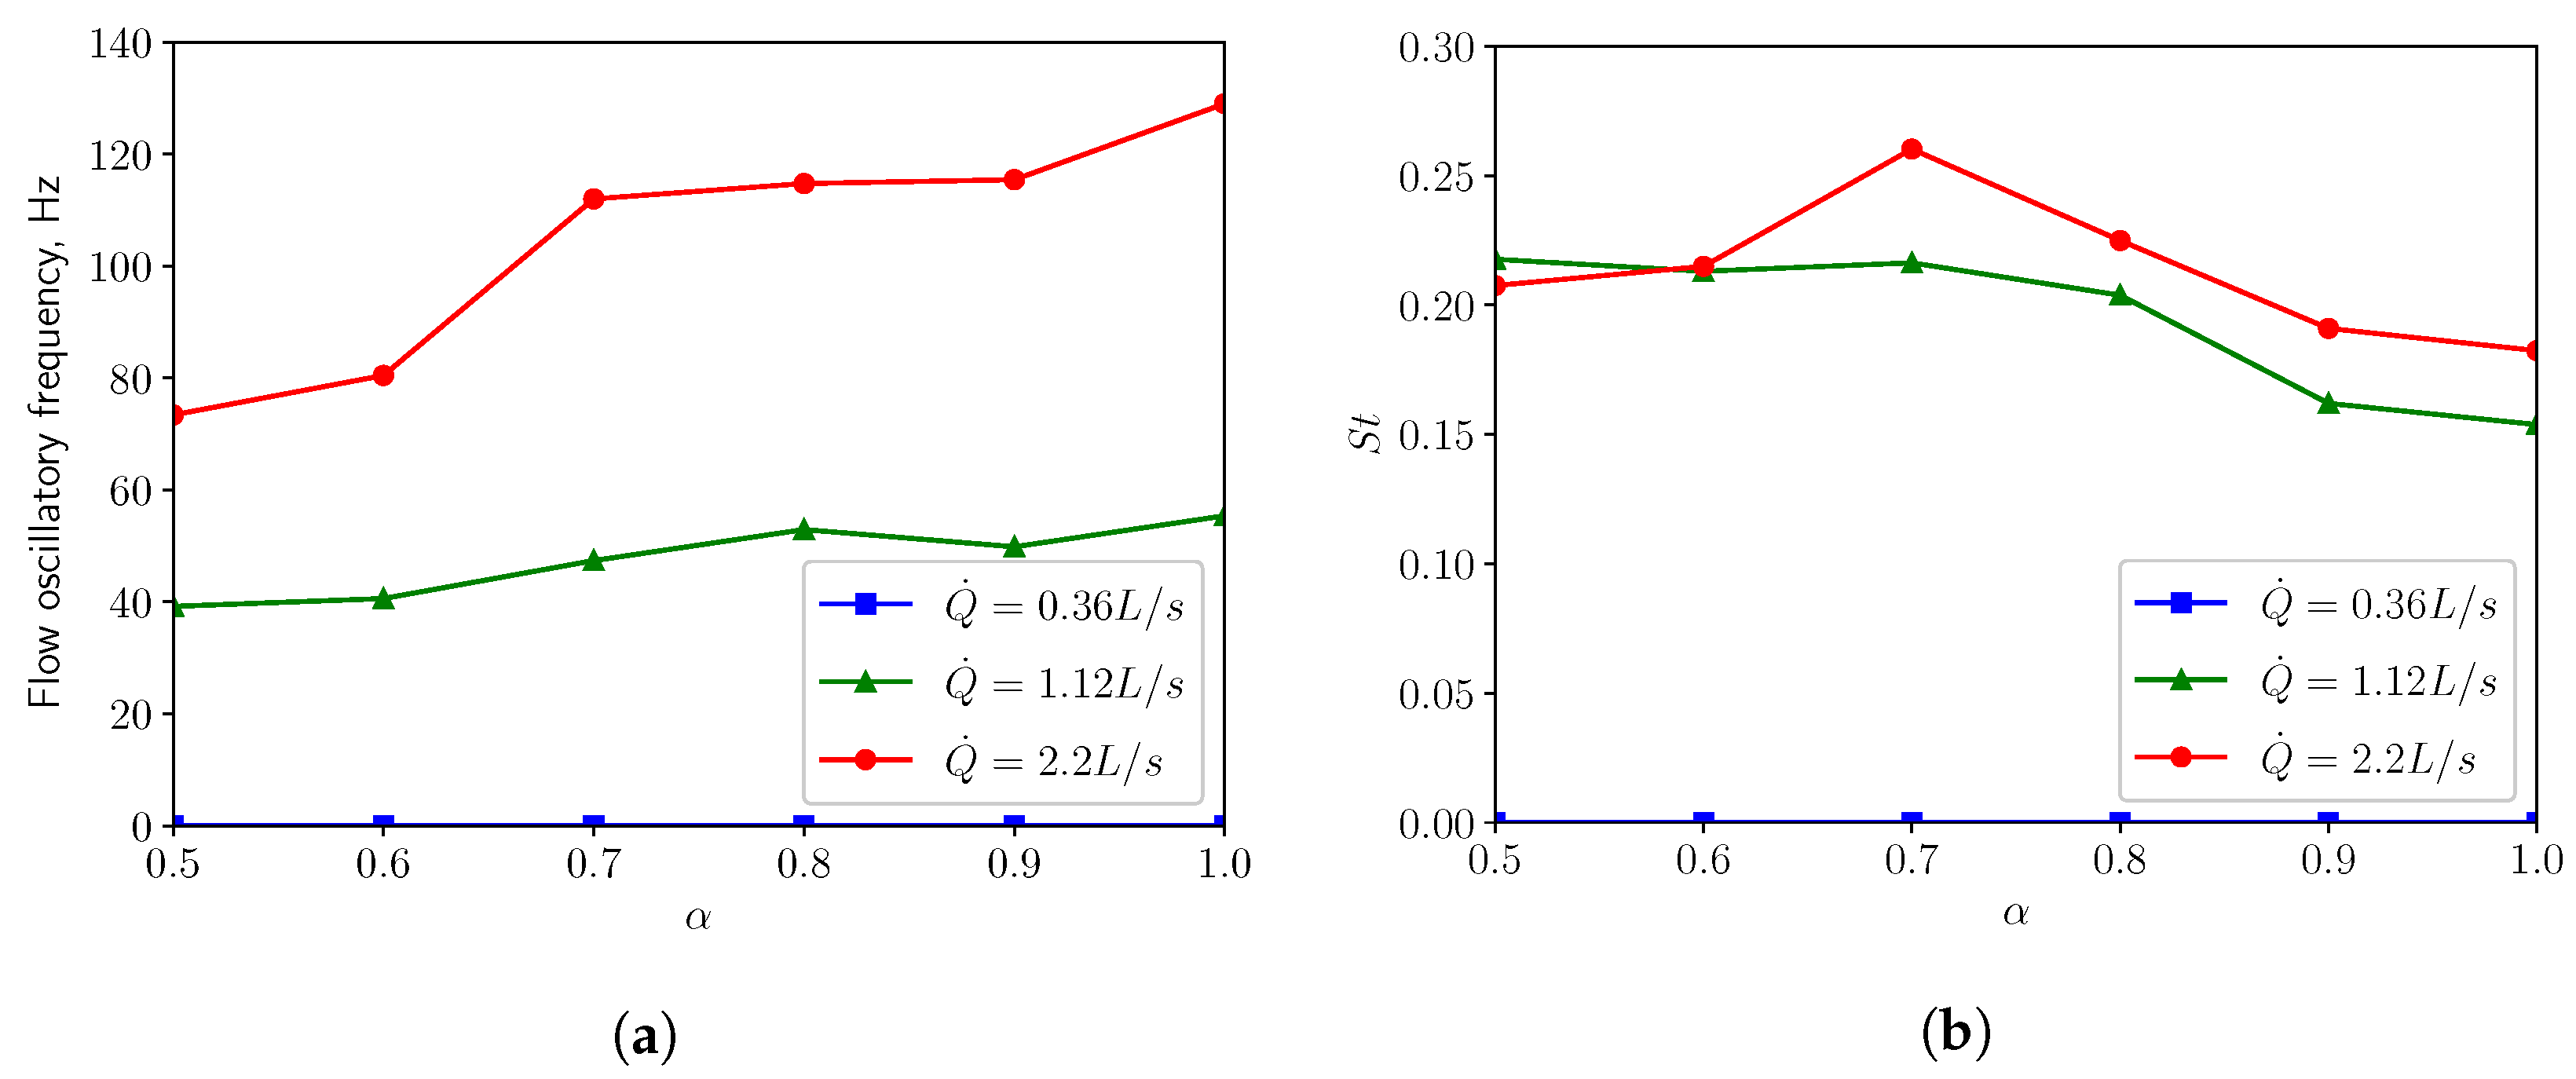
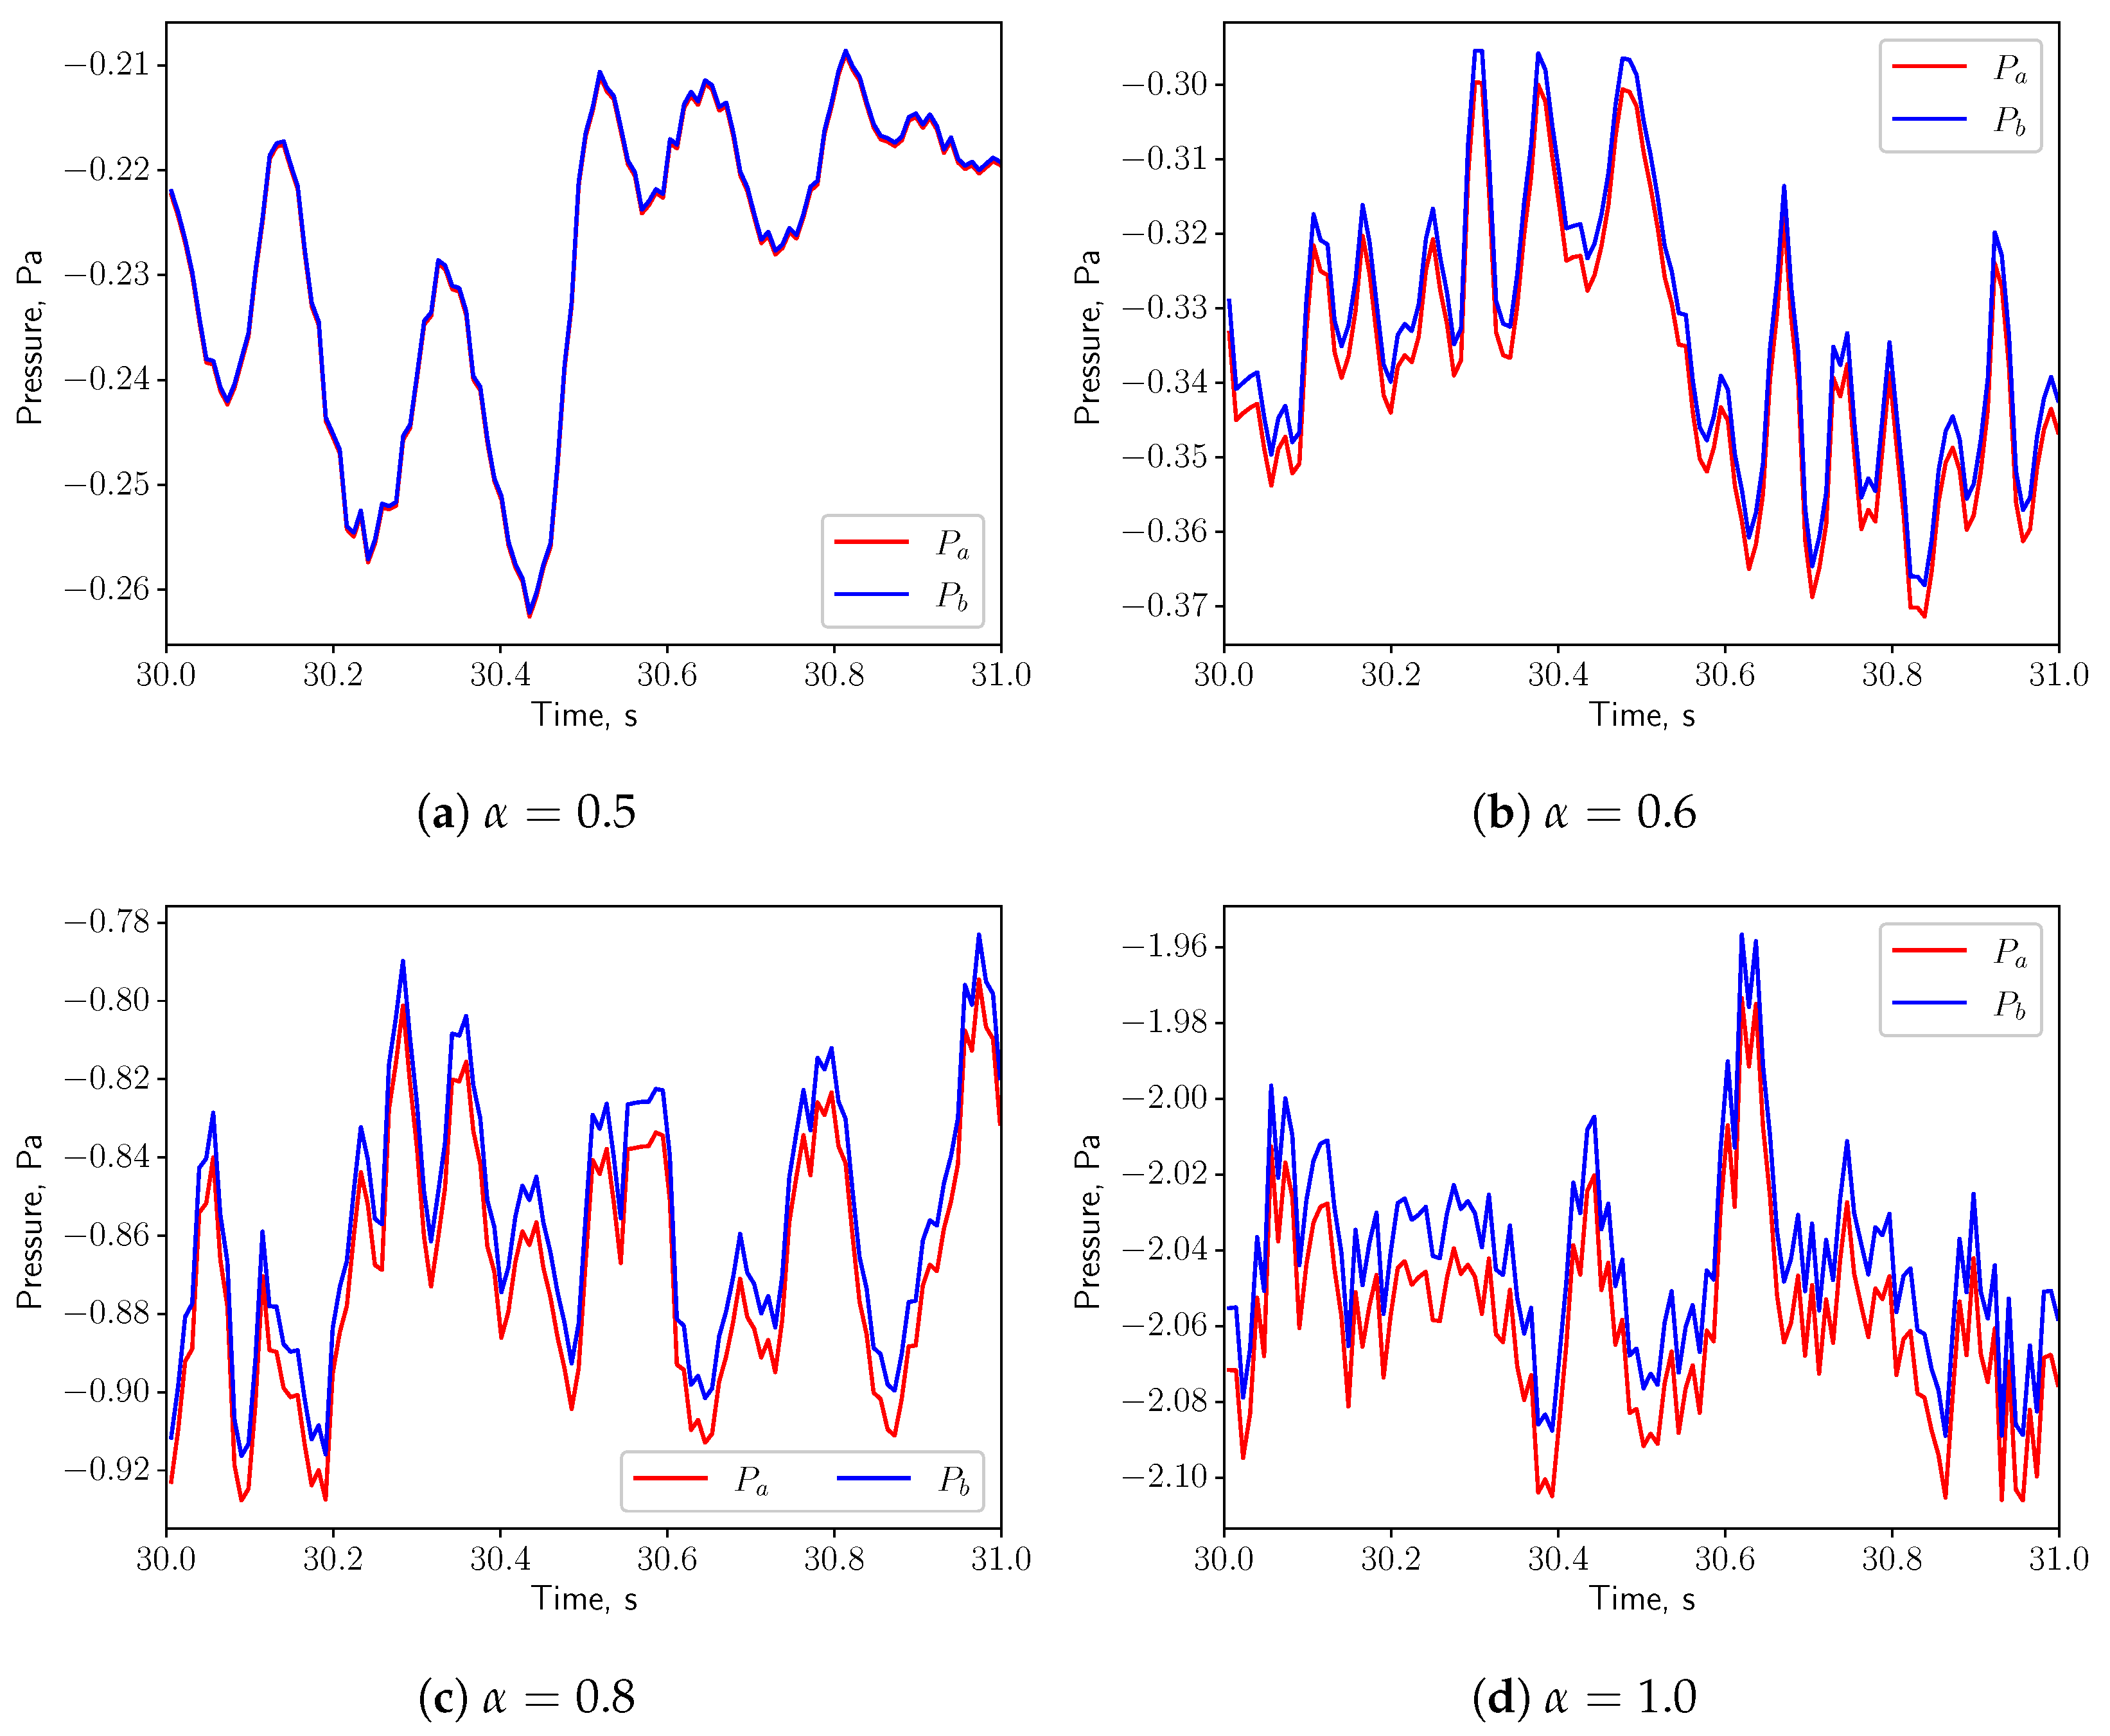
3.1. Analysis of Fluid Domain
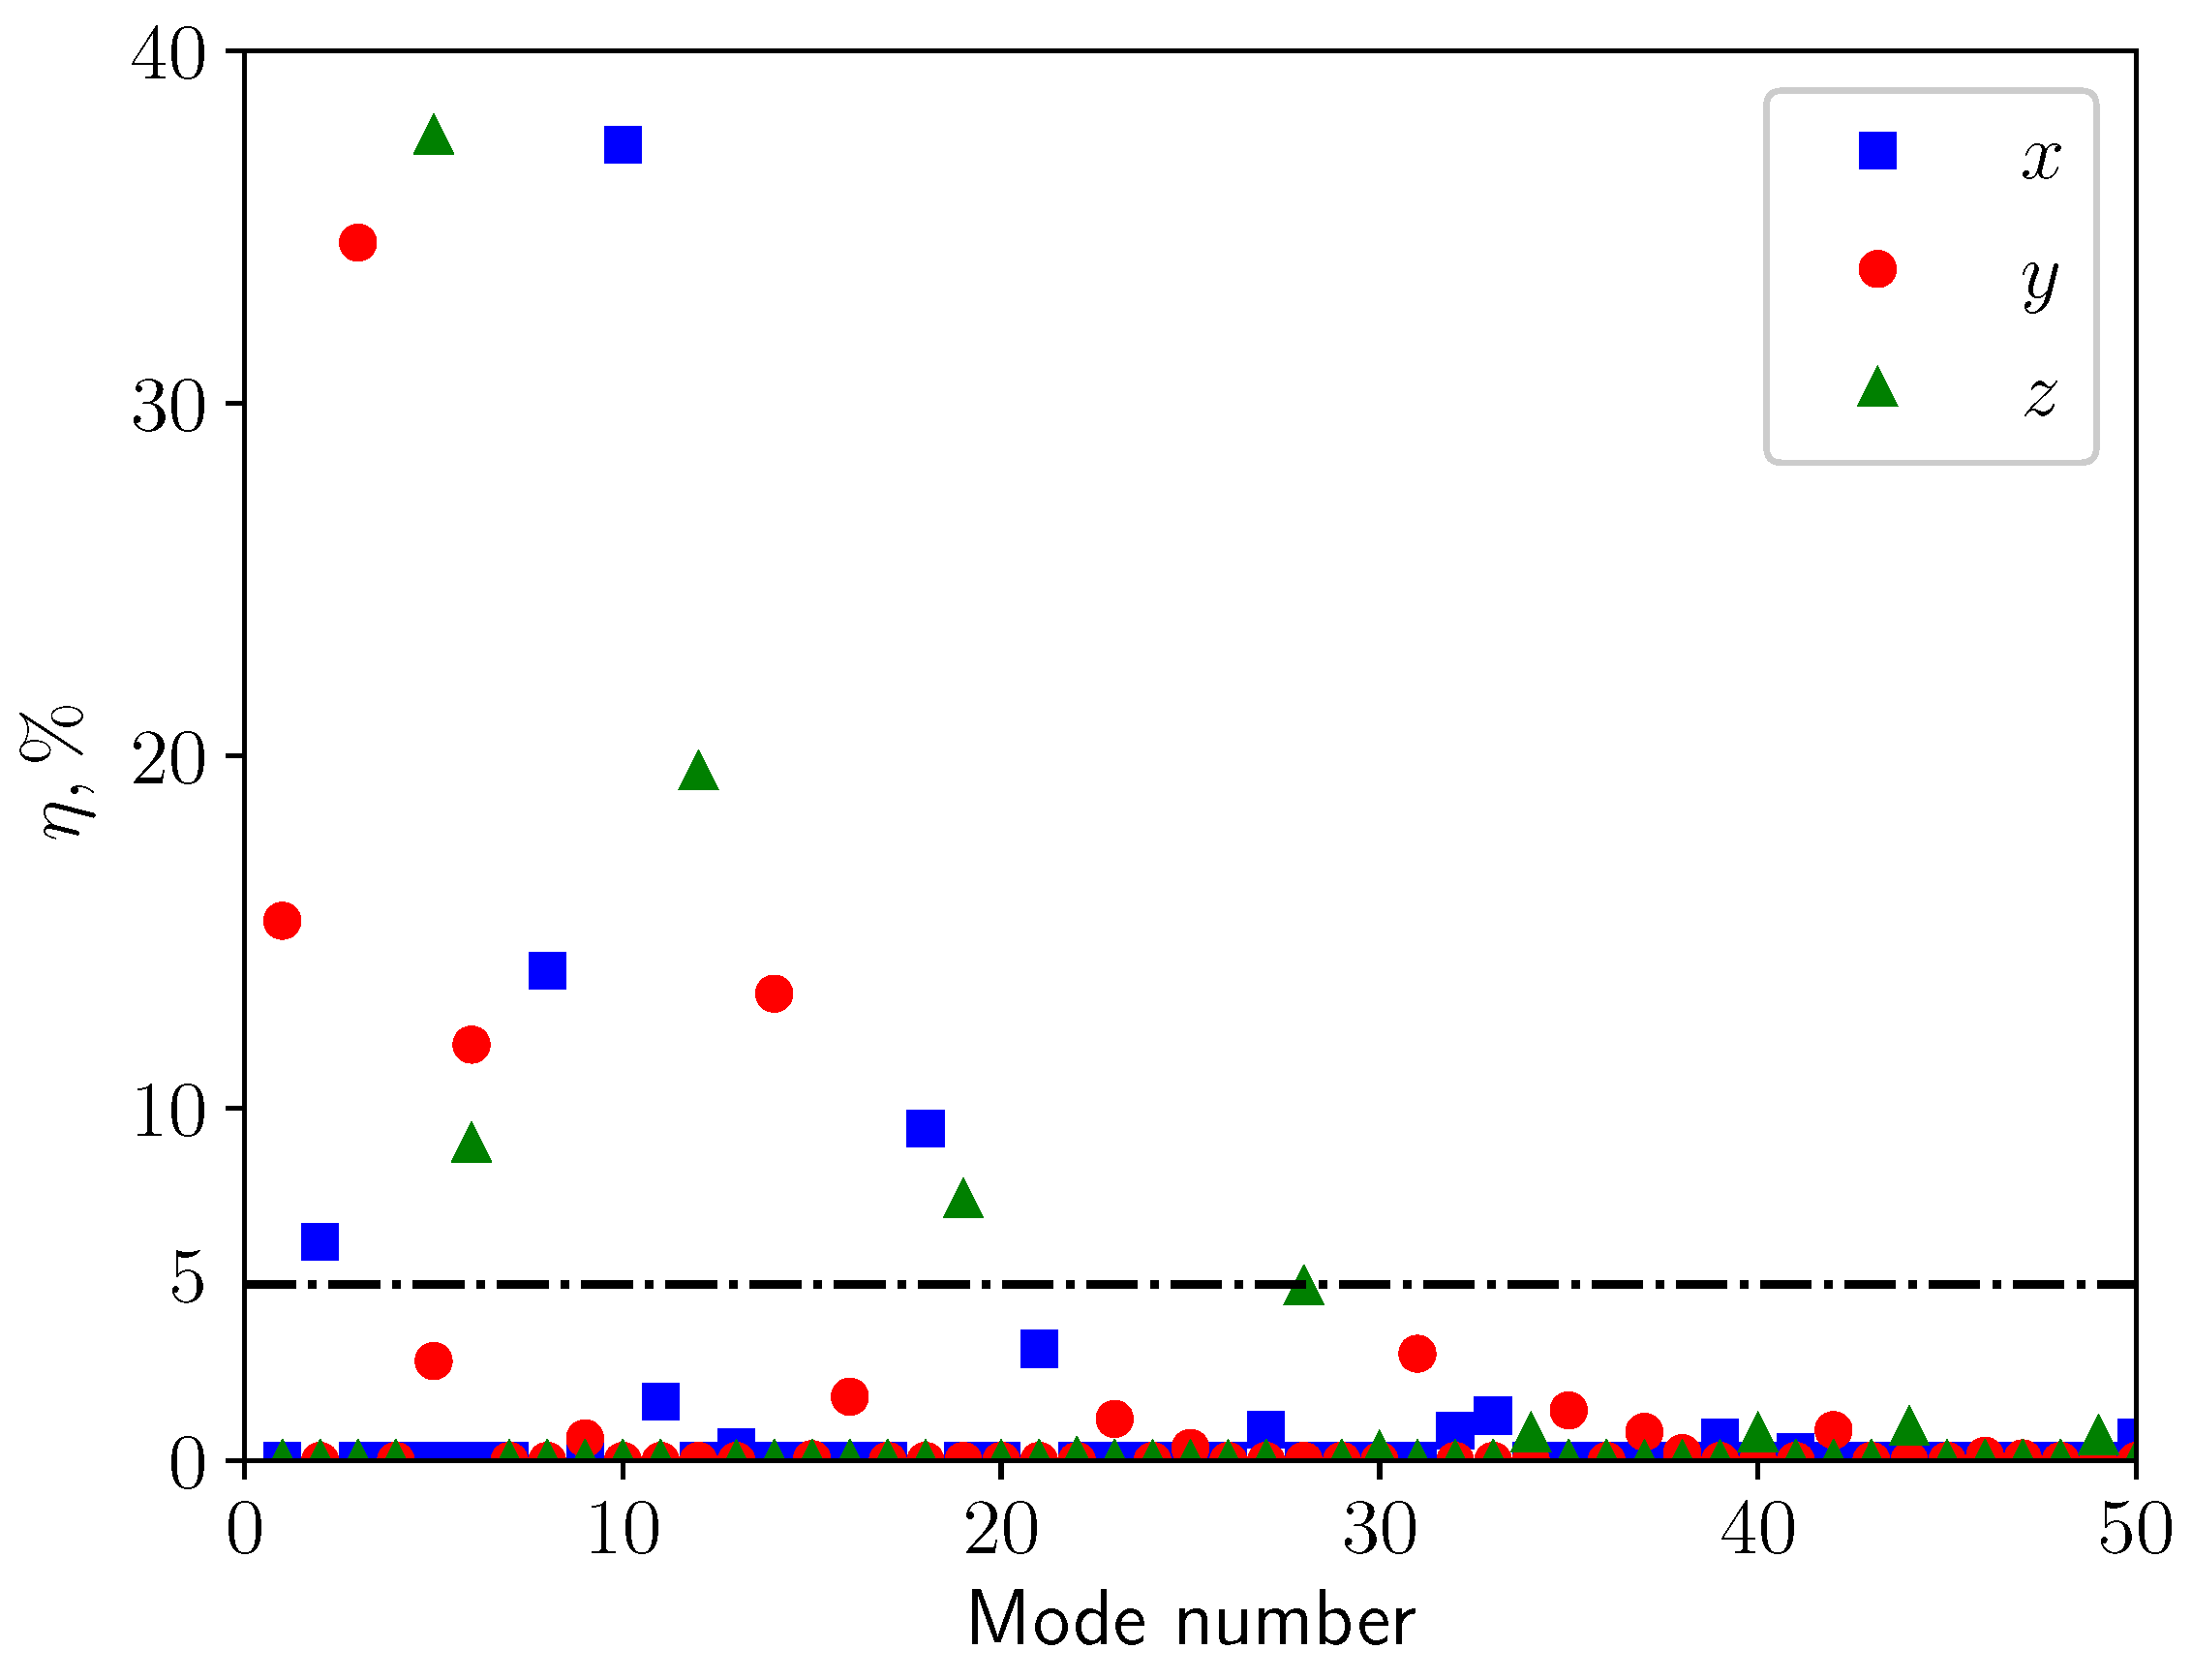
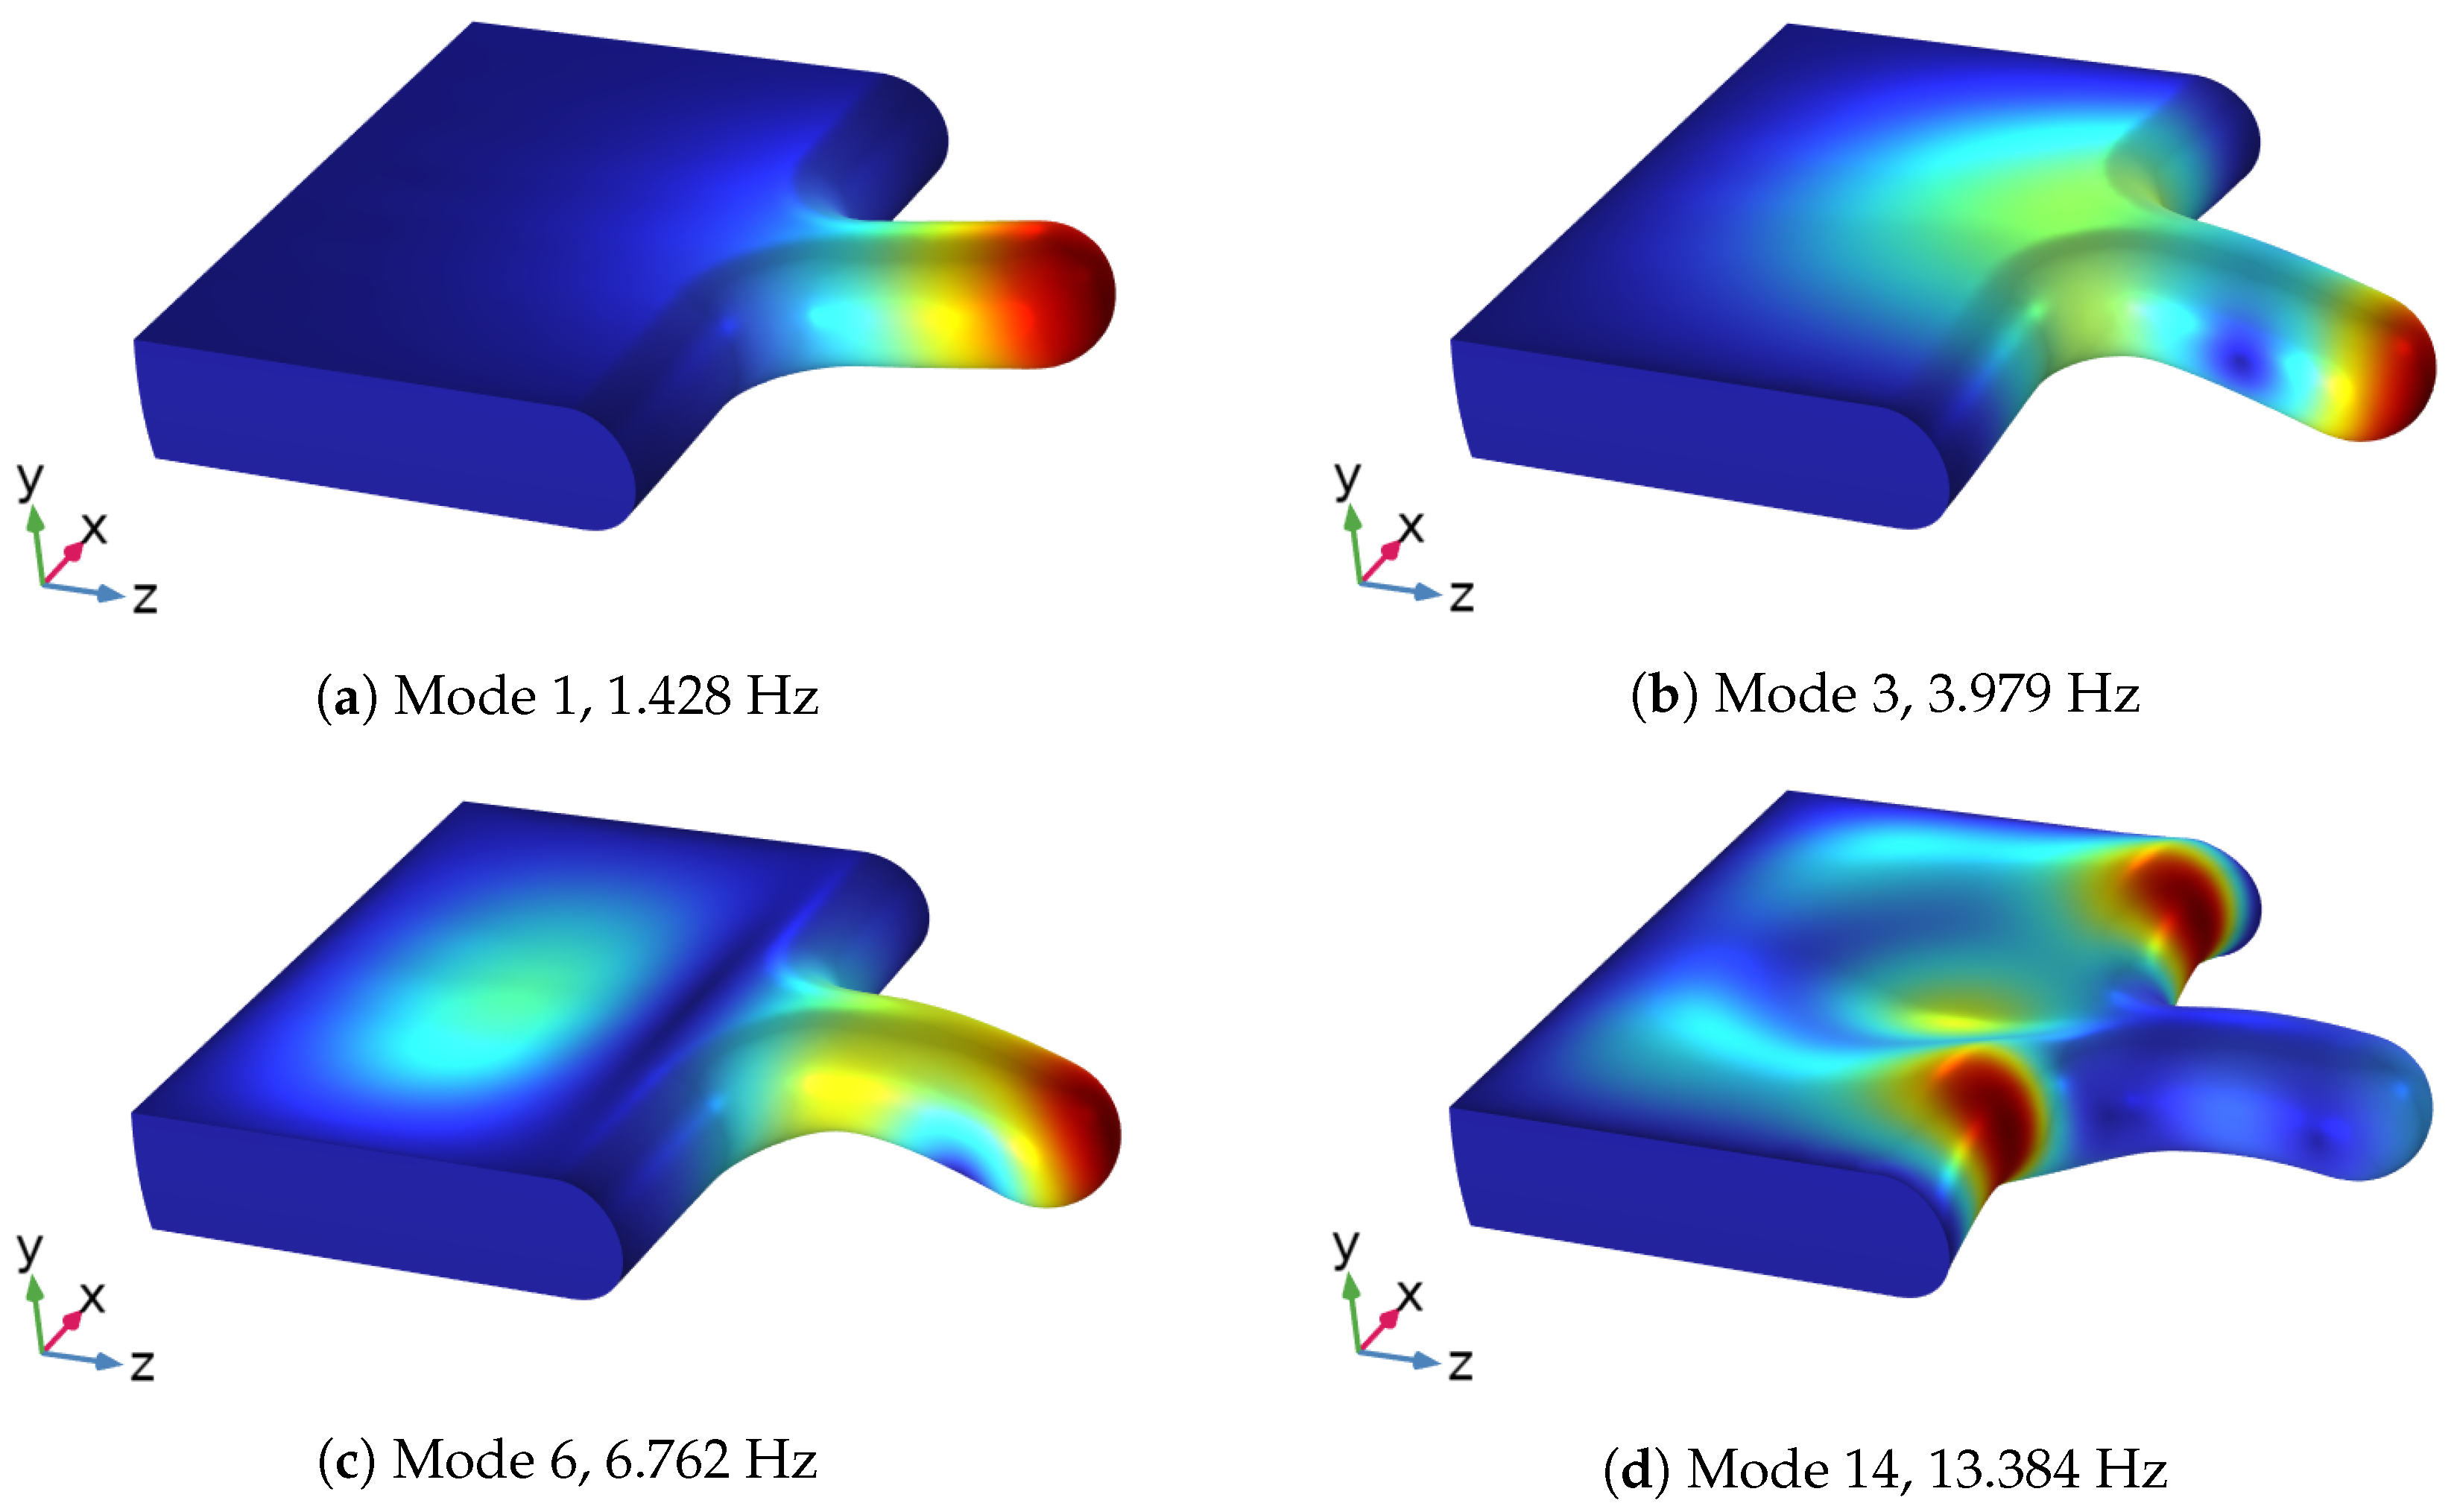
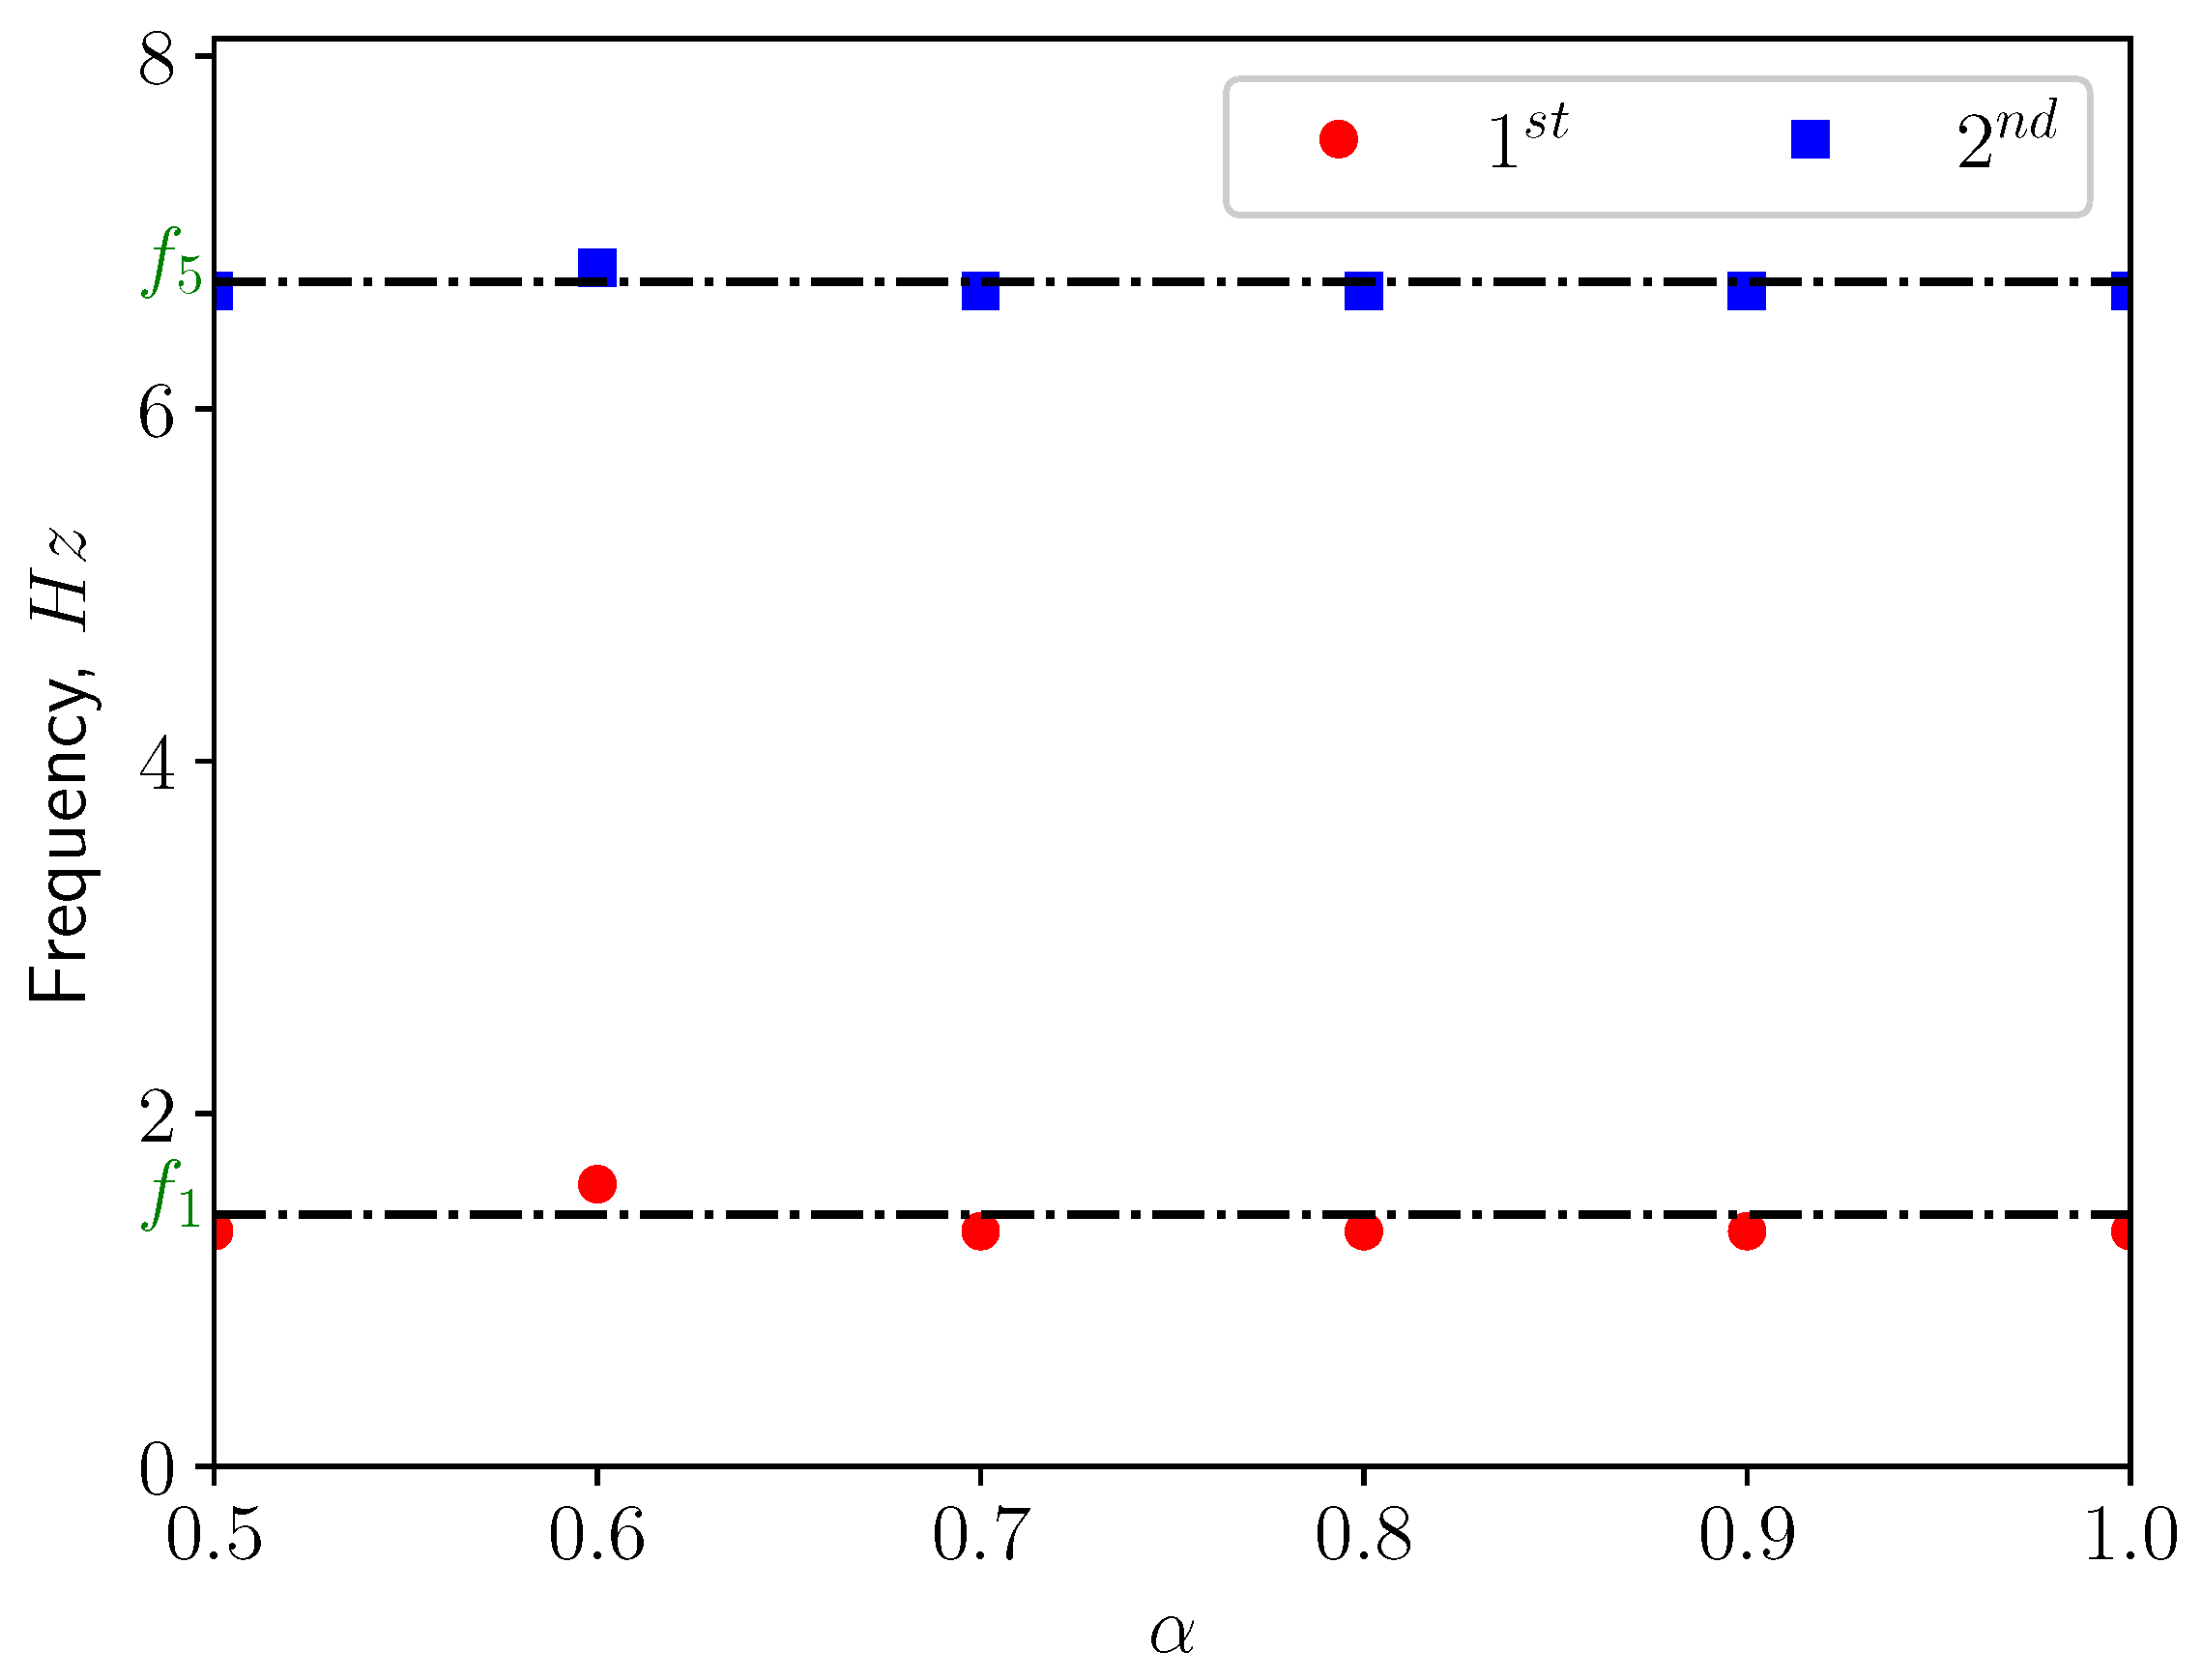
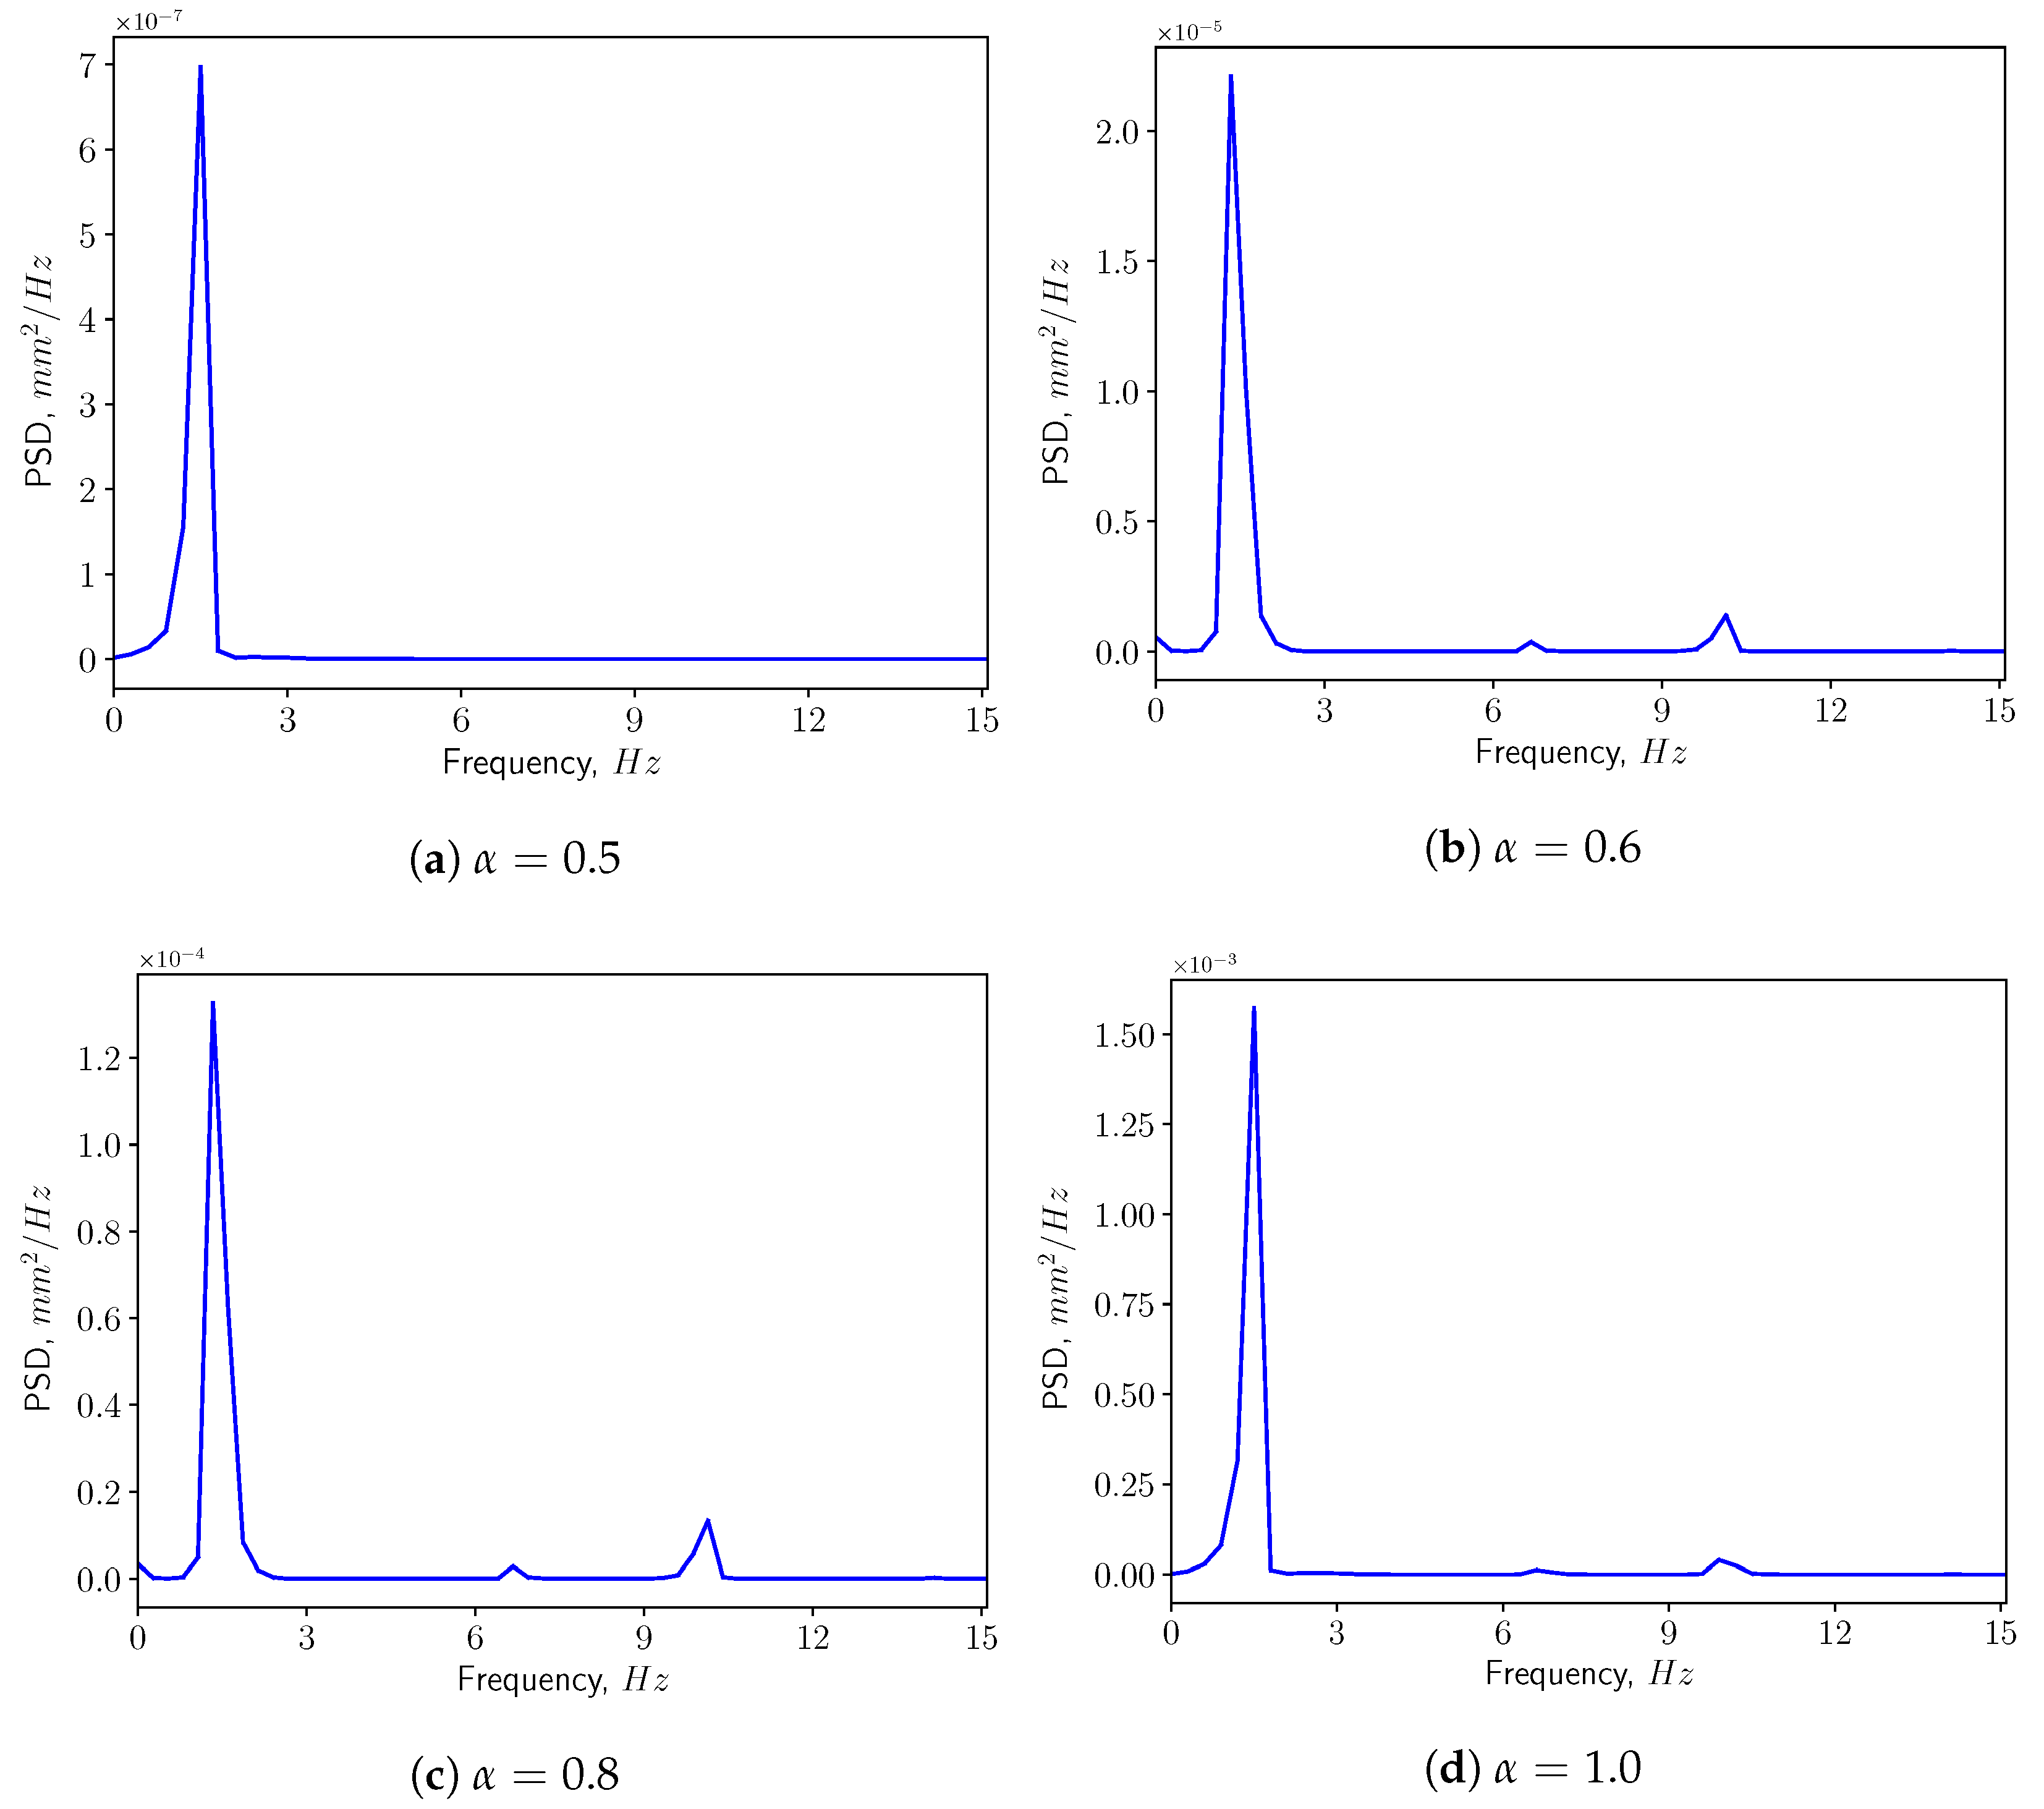
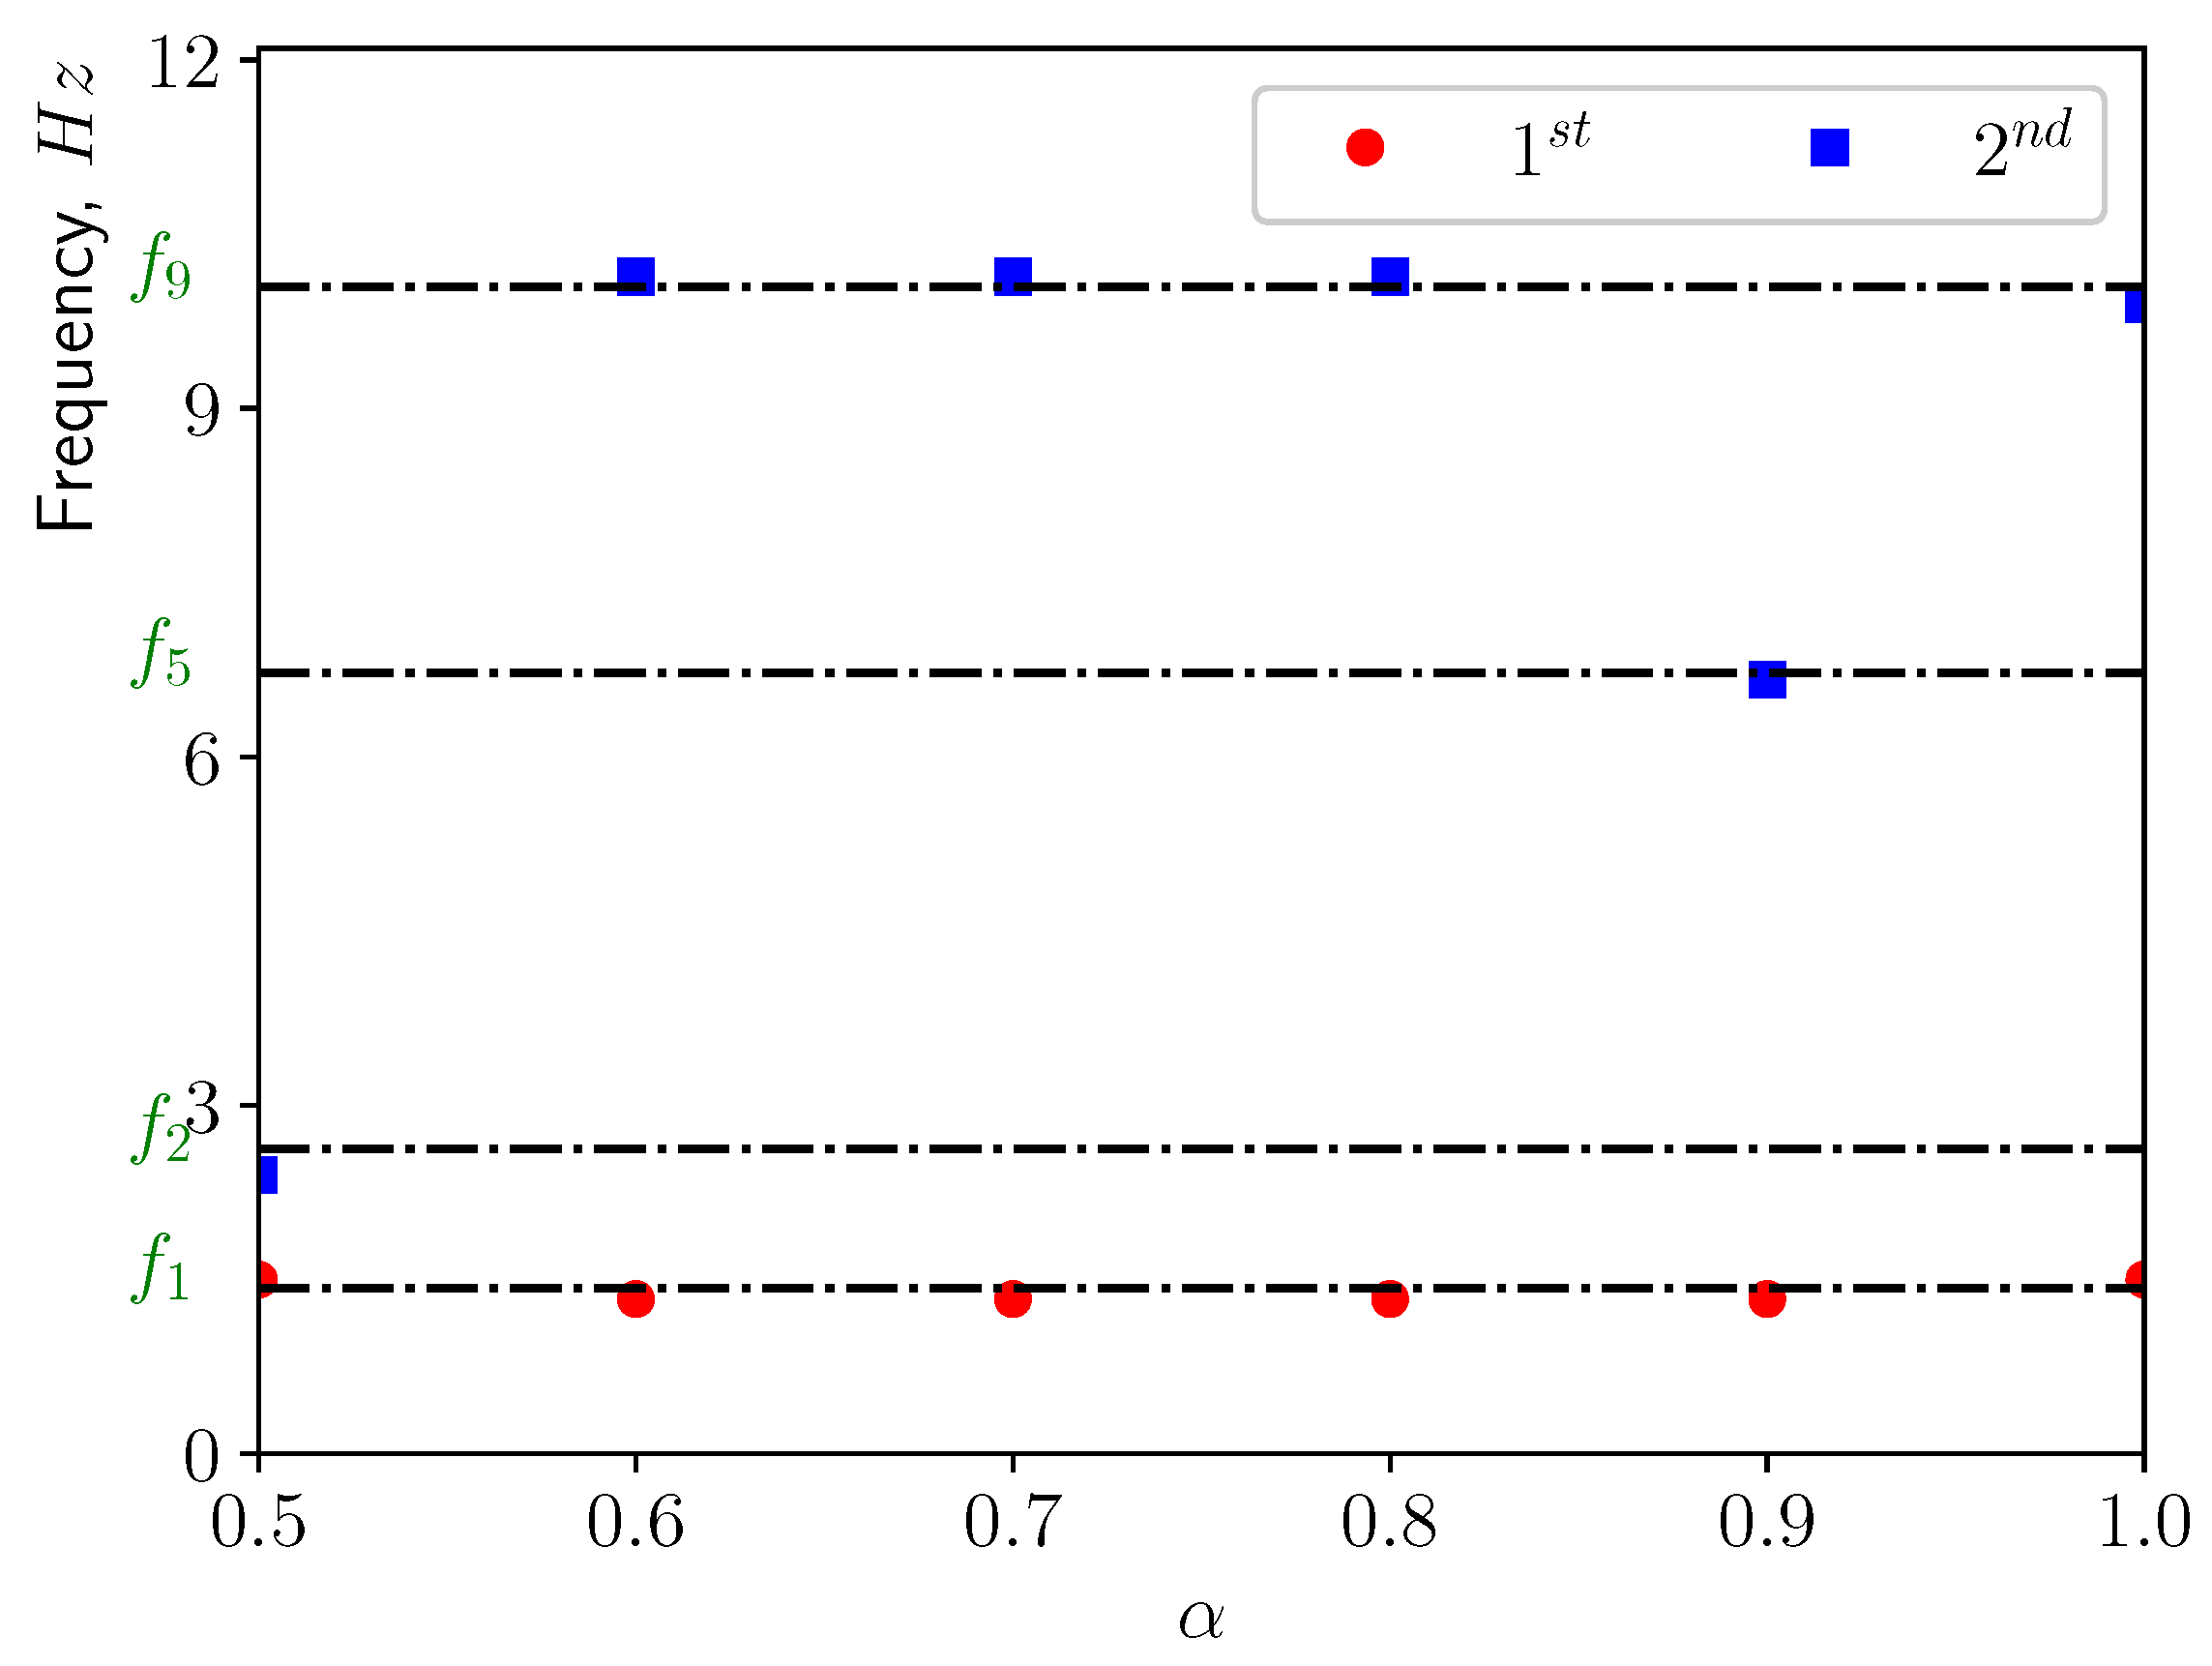
3.2. Modal Analysis of Solid Structure
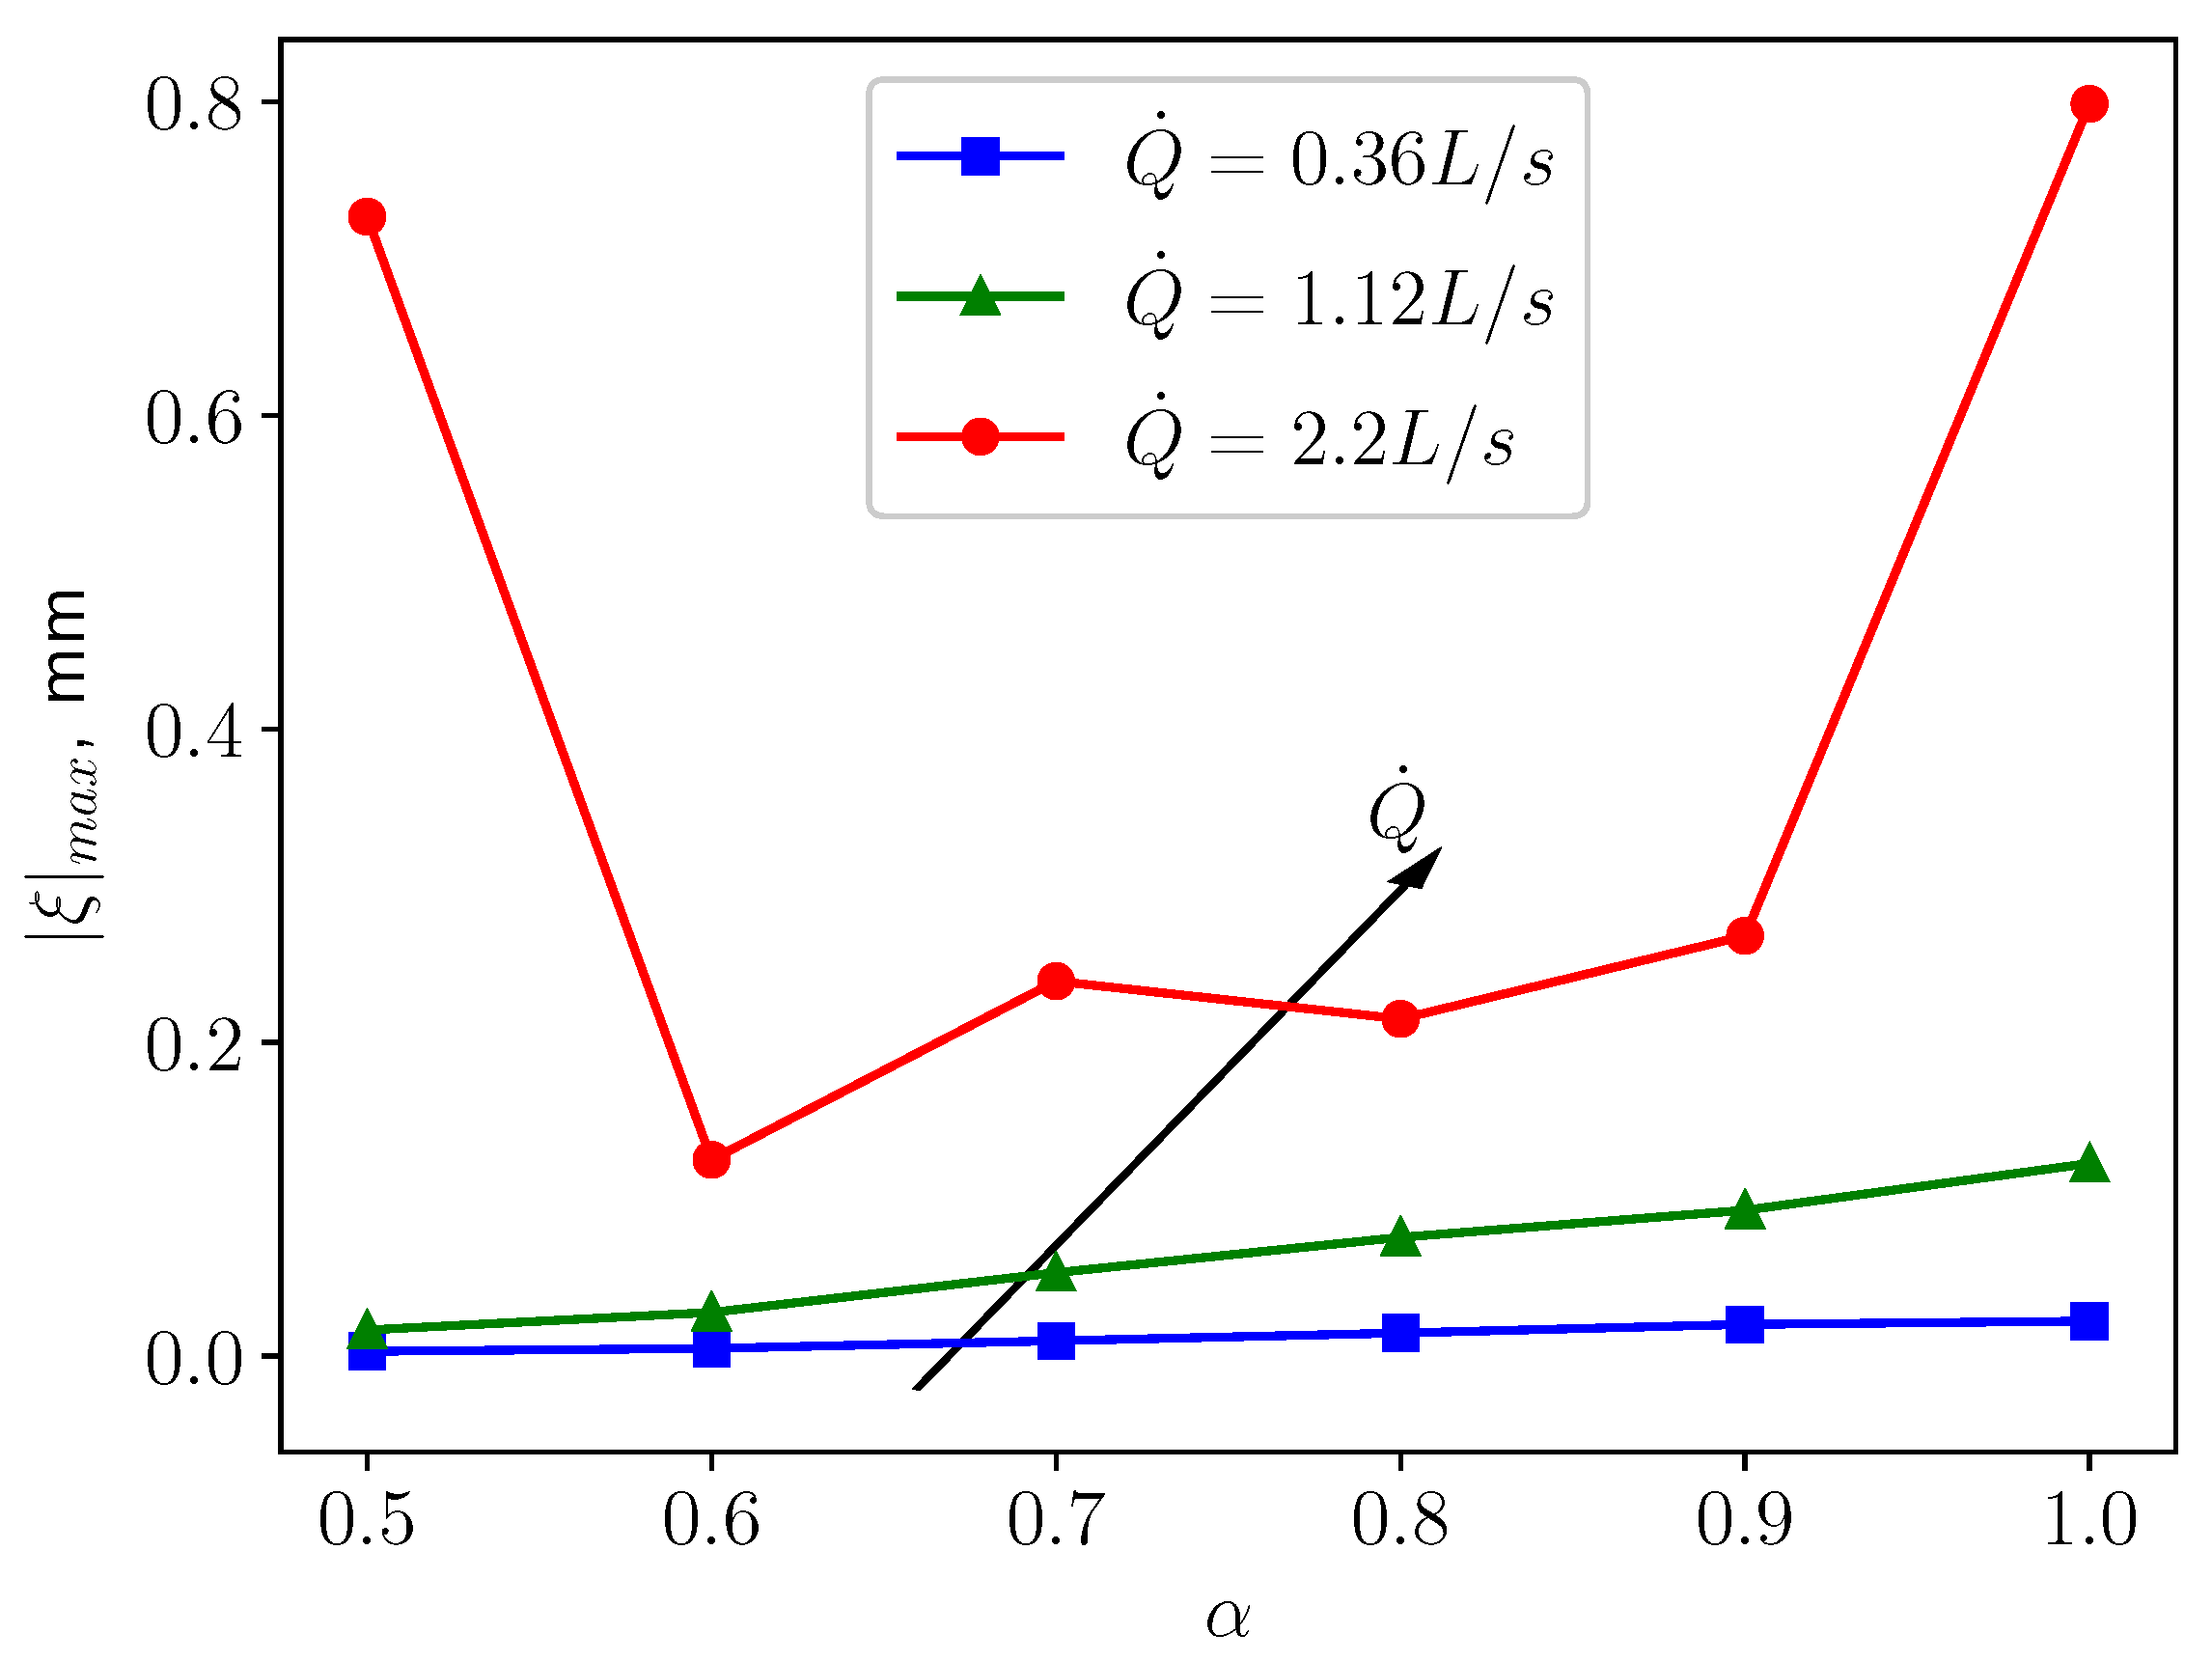
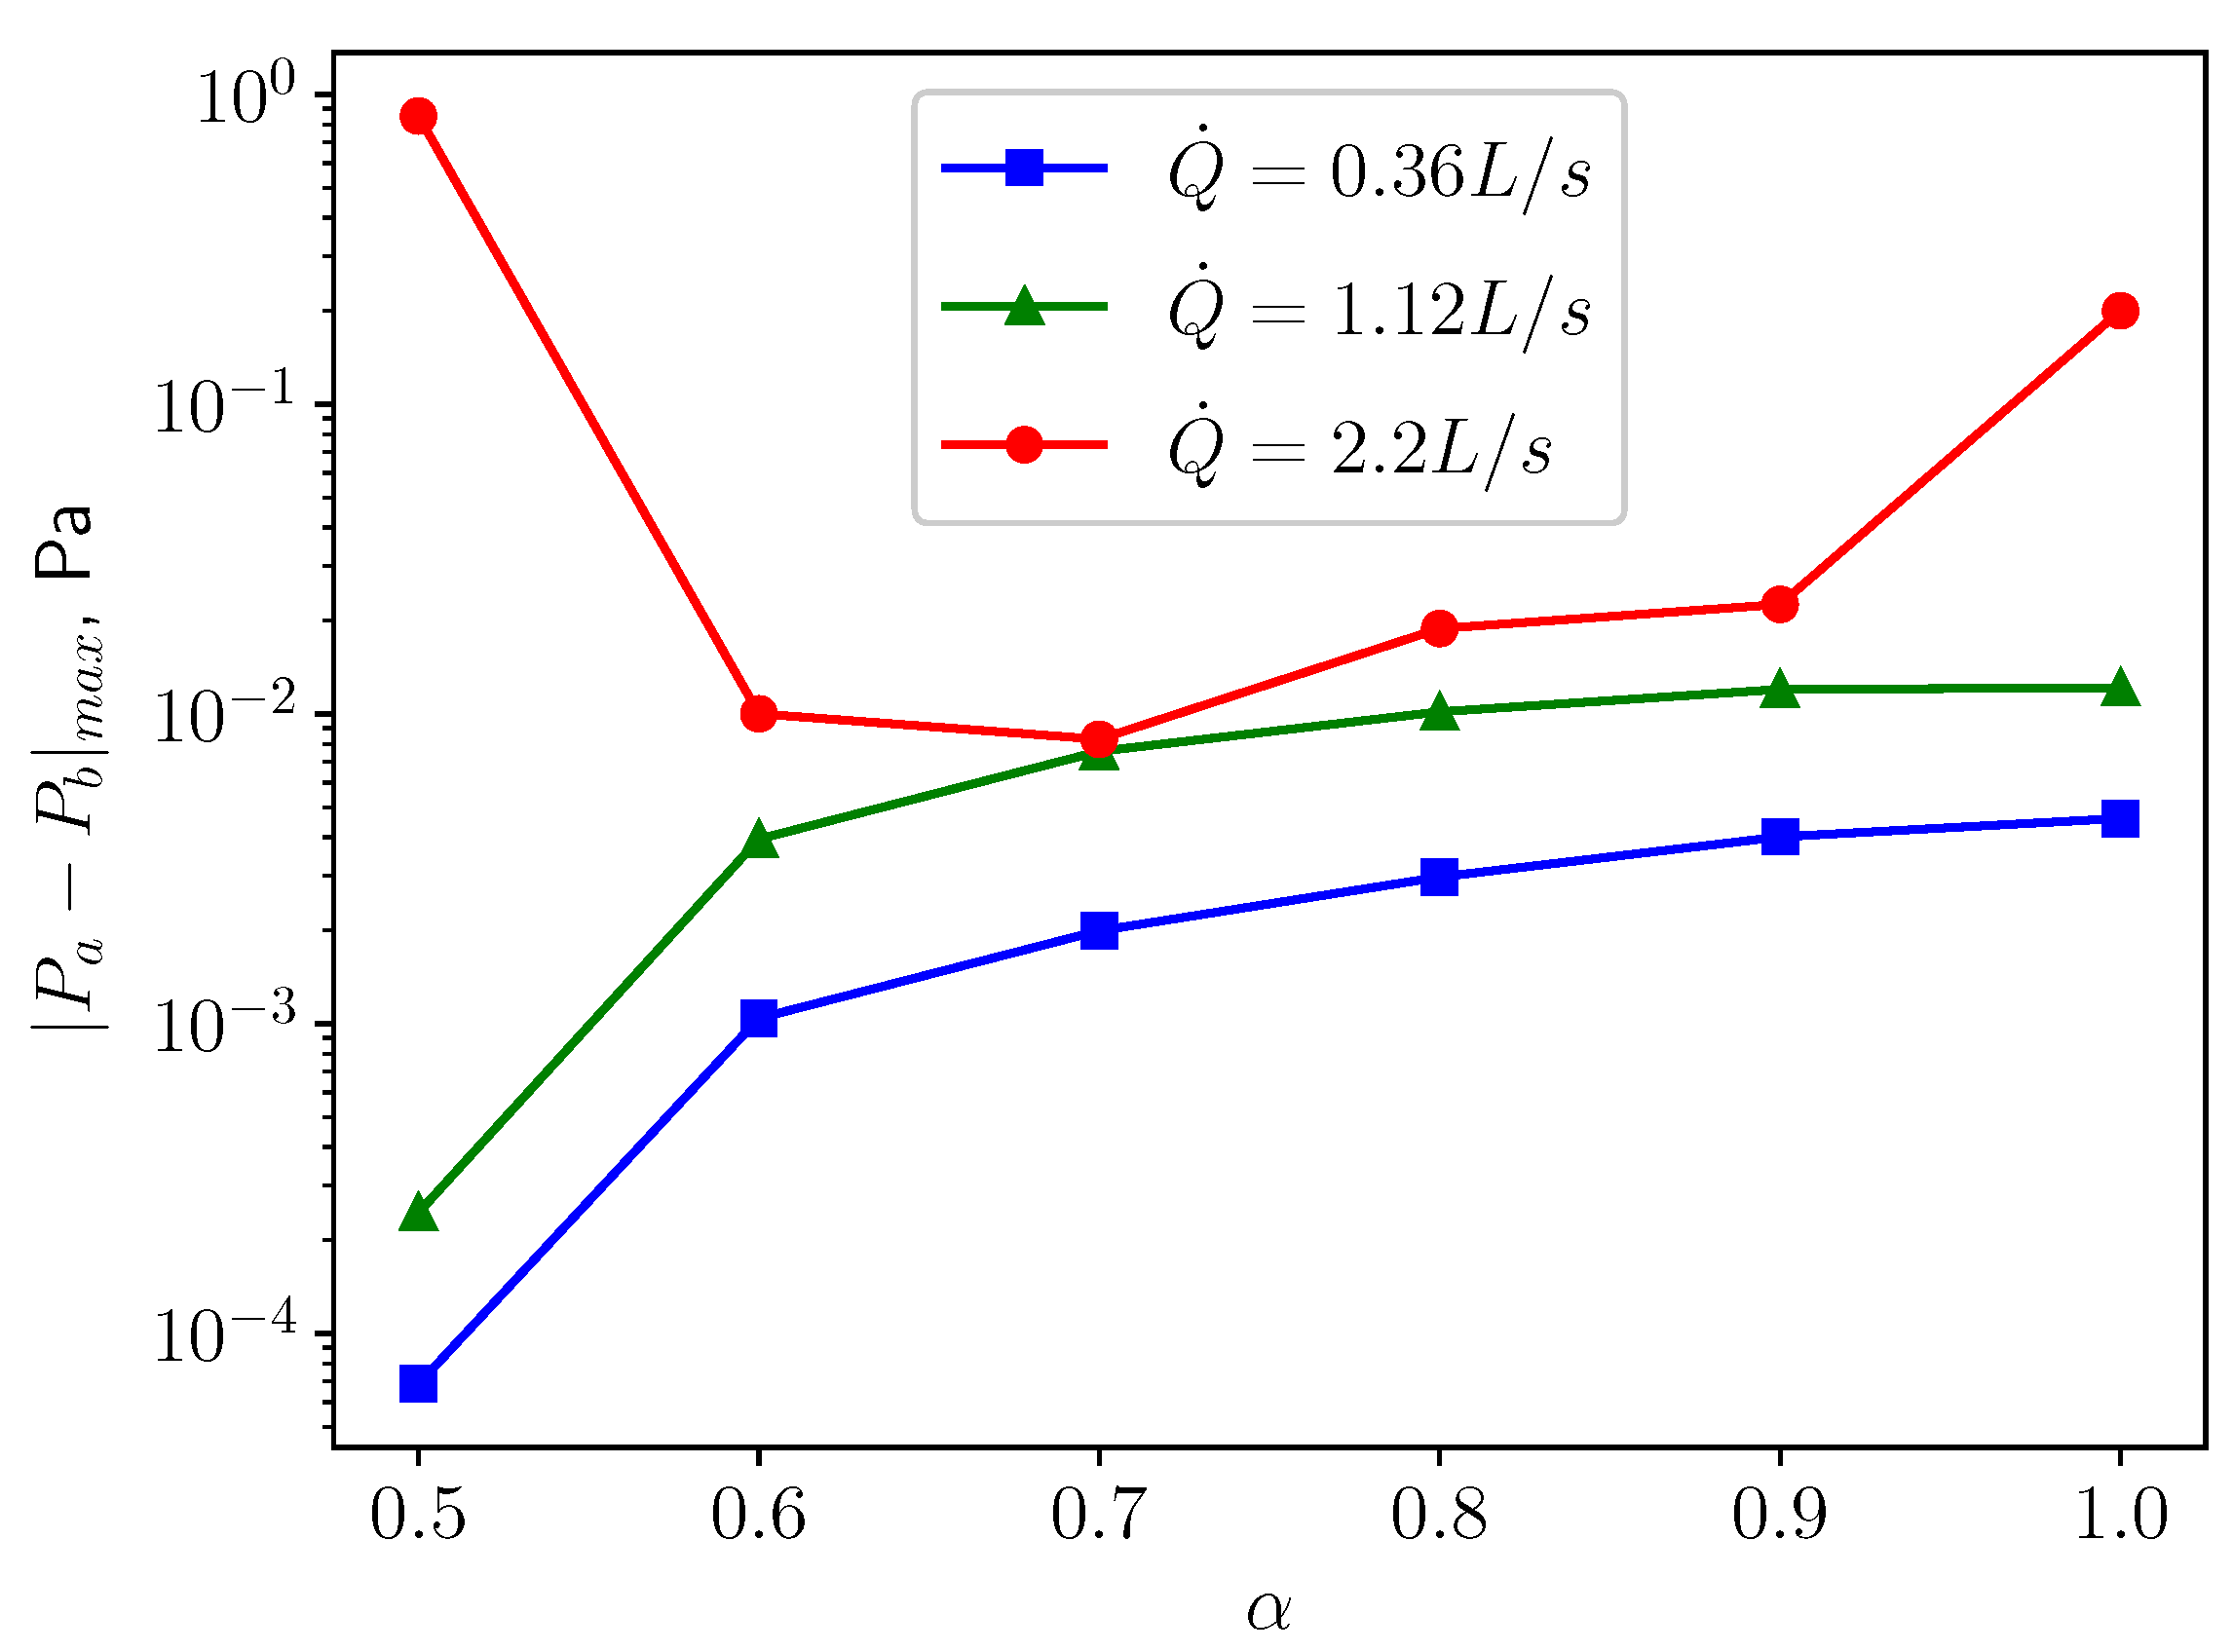
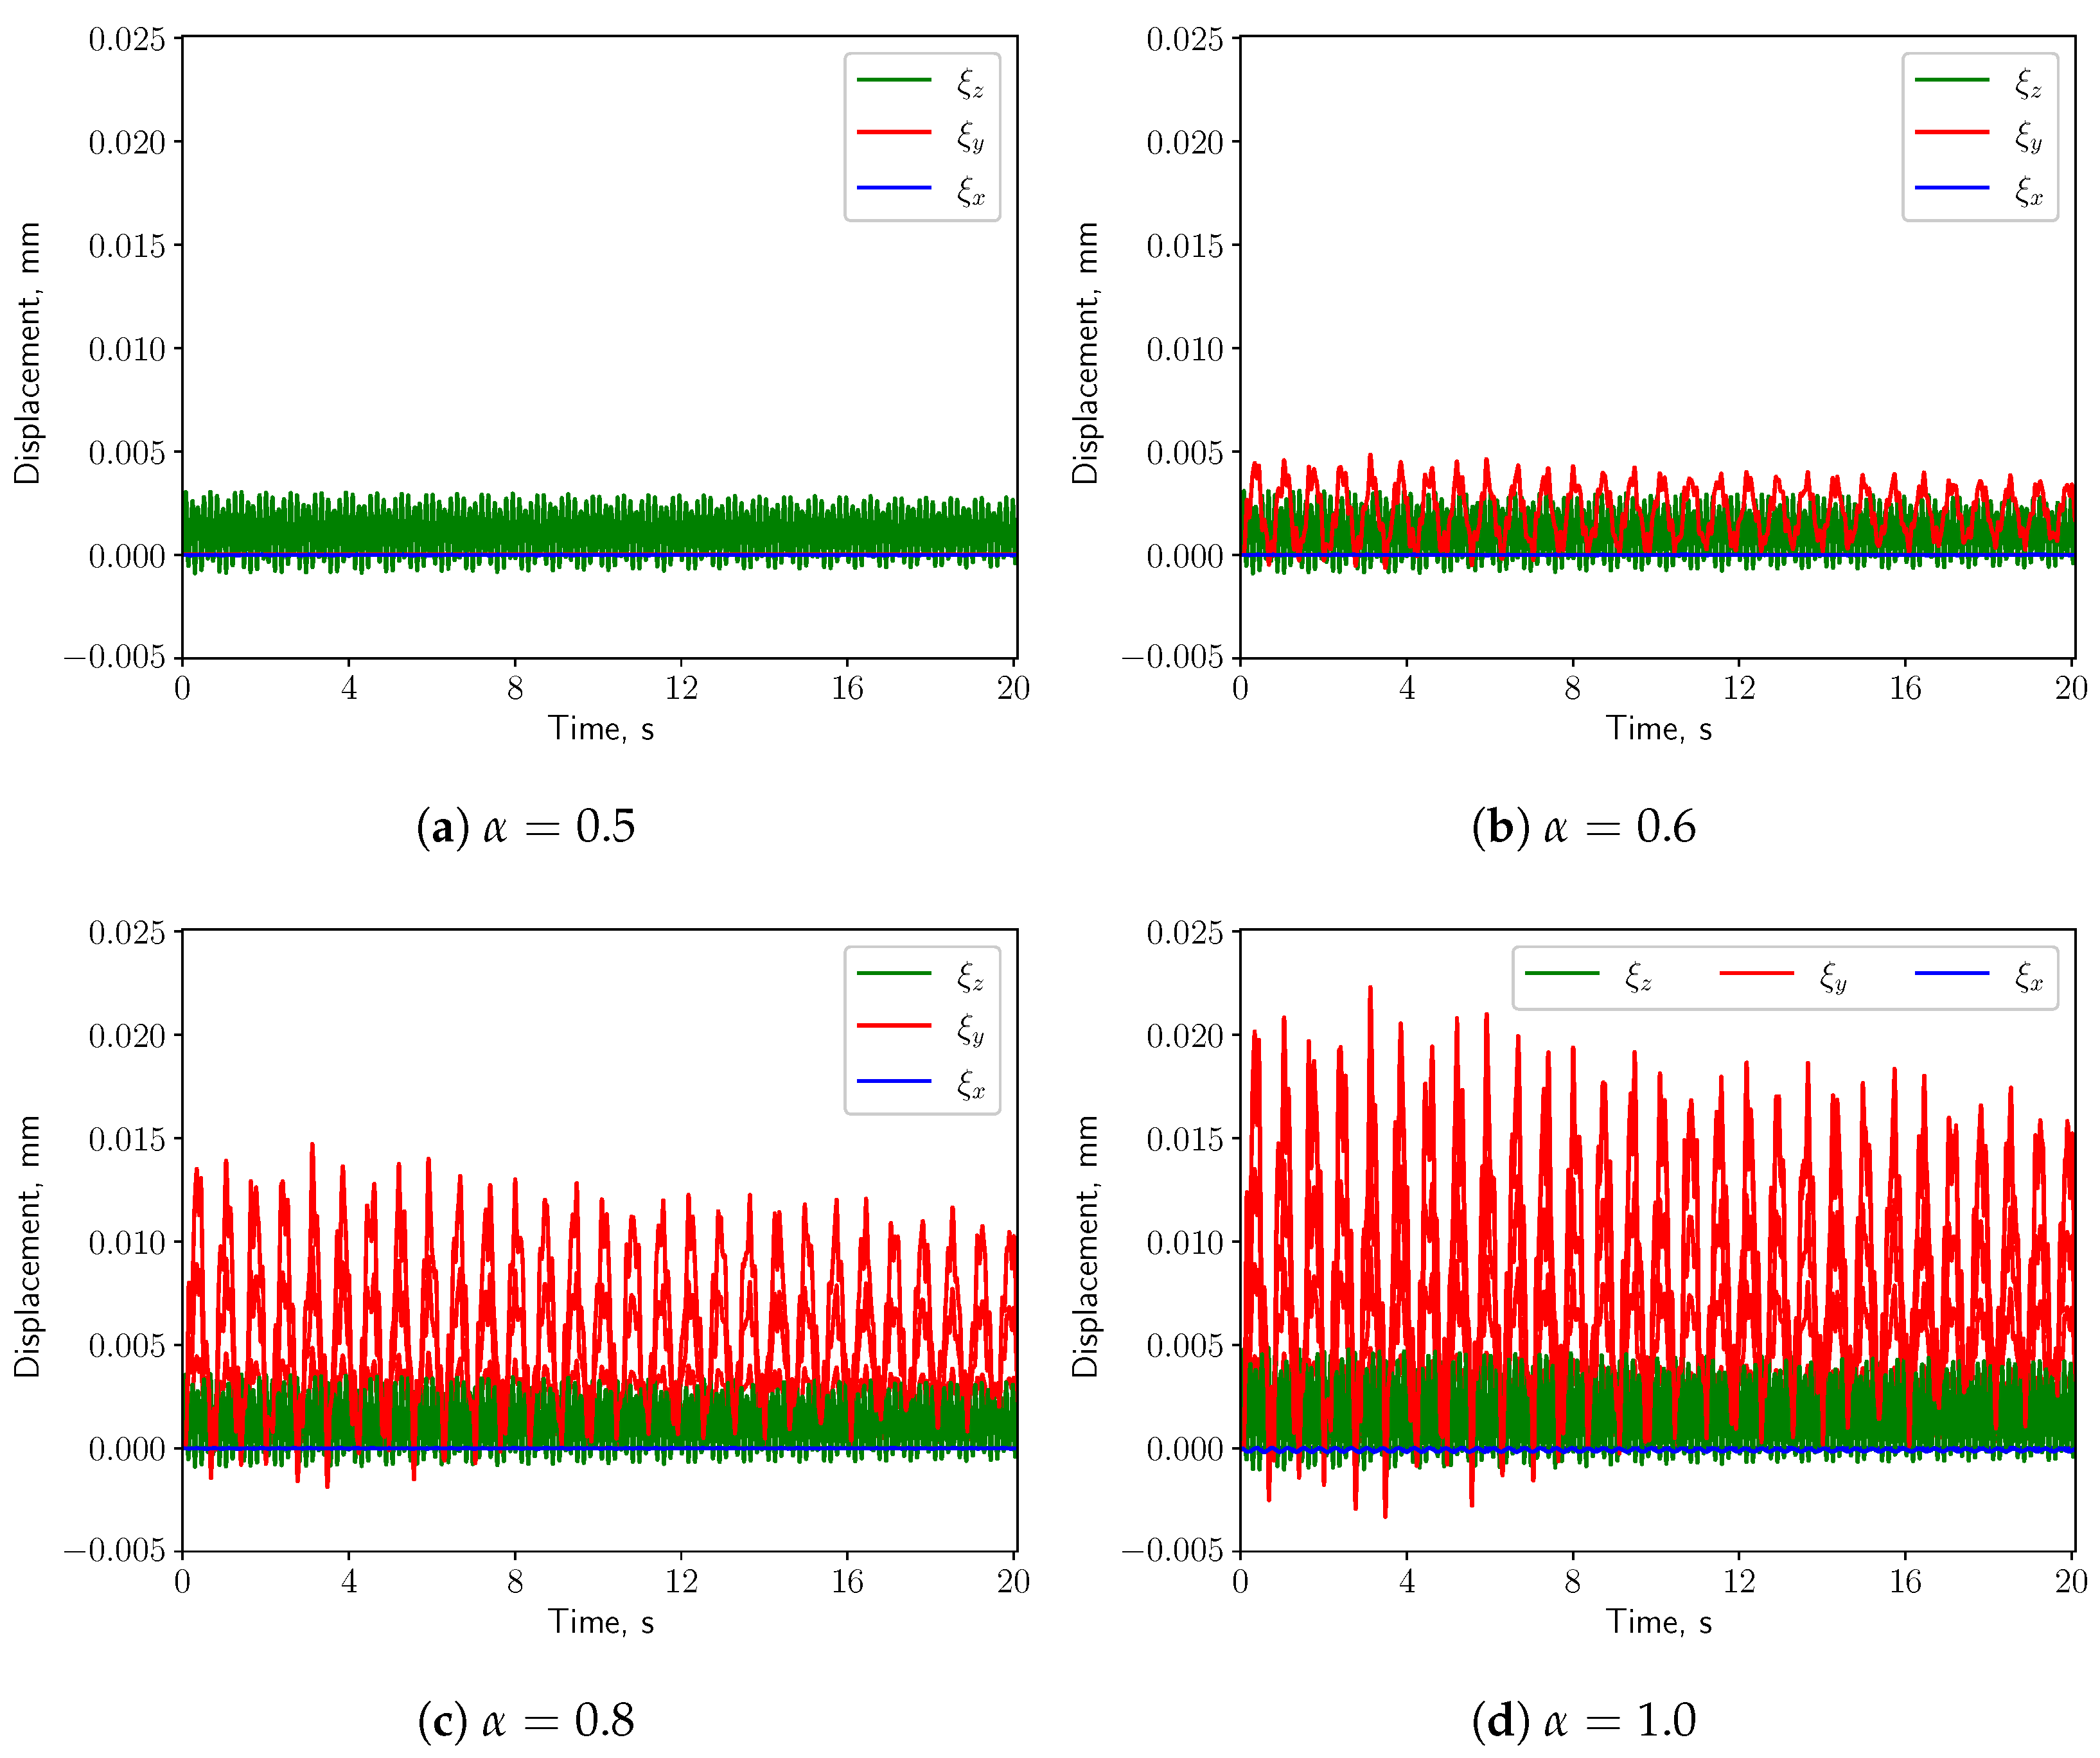
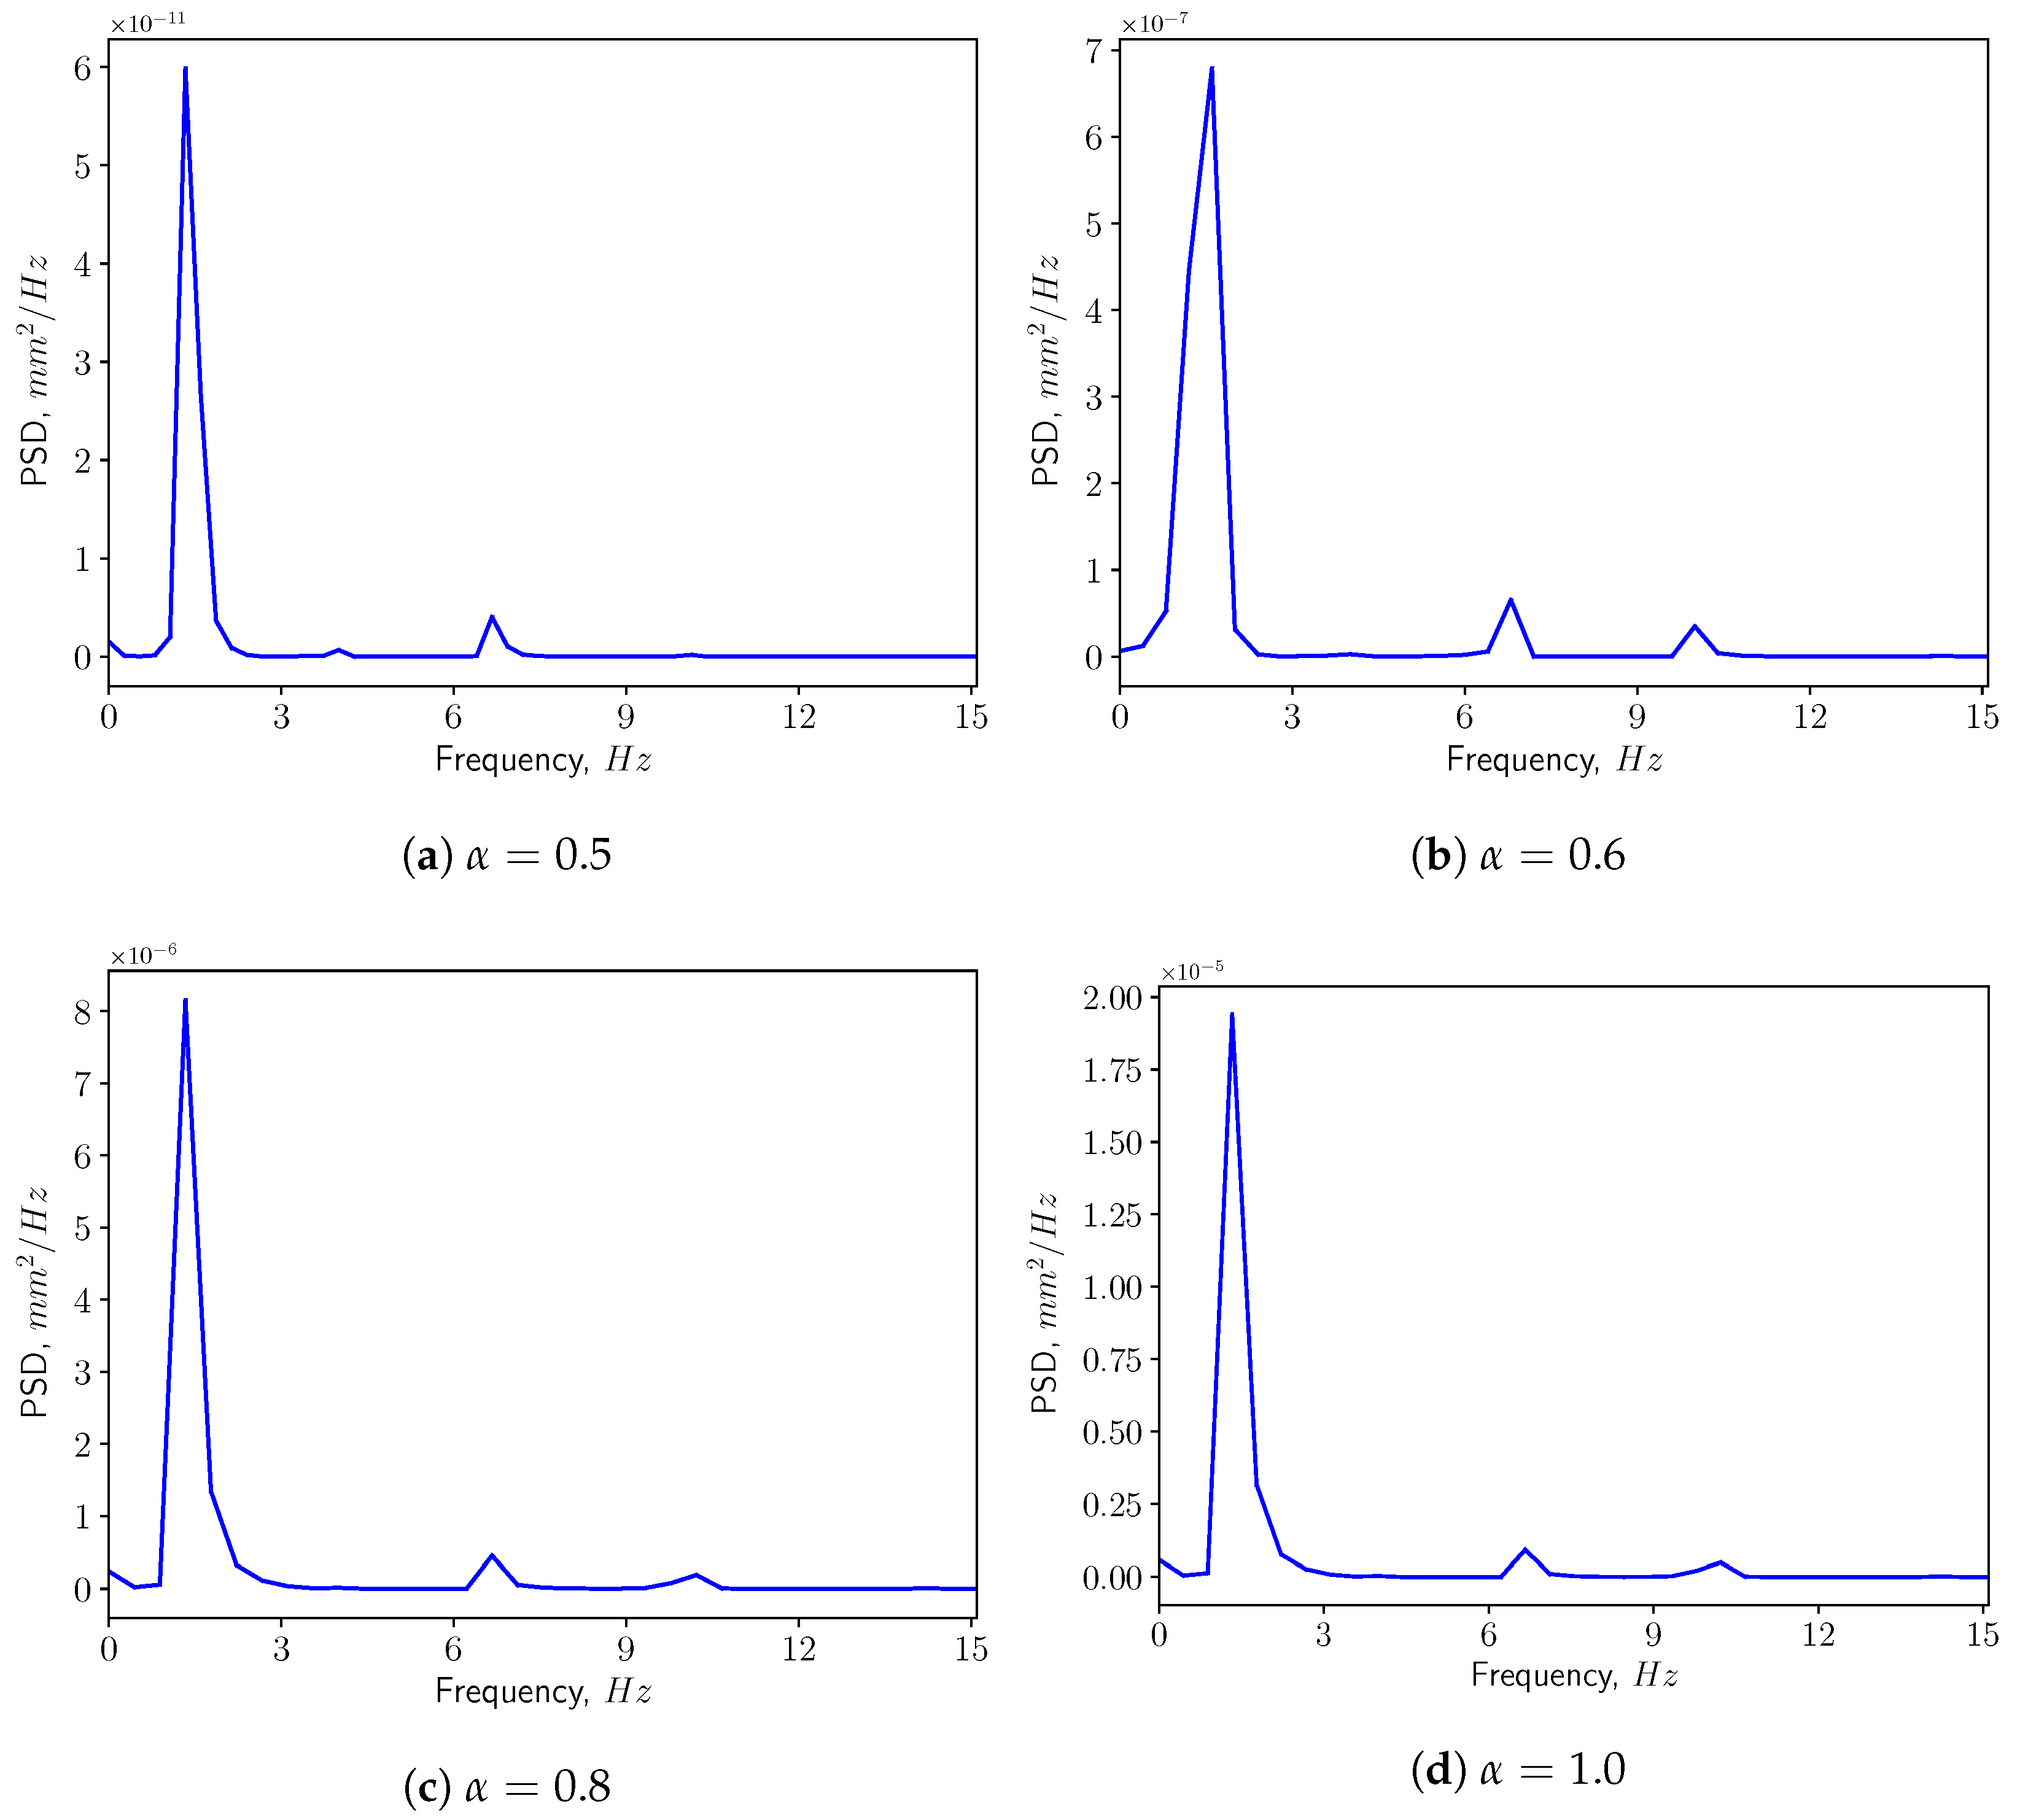
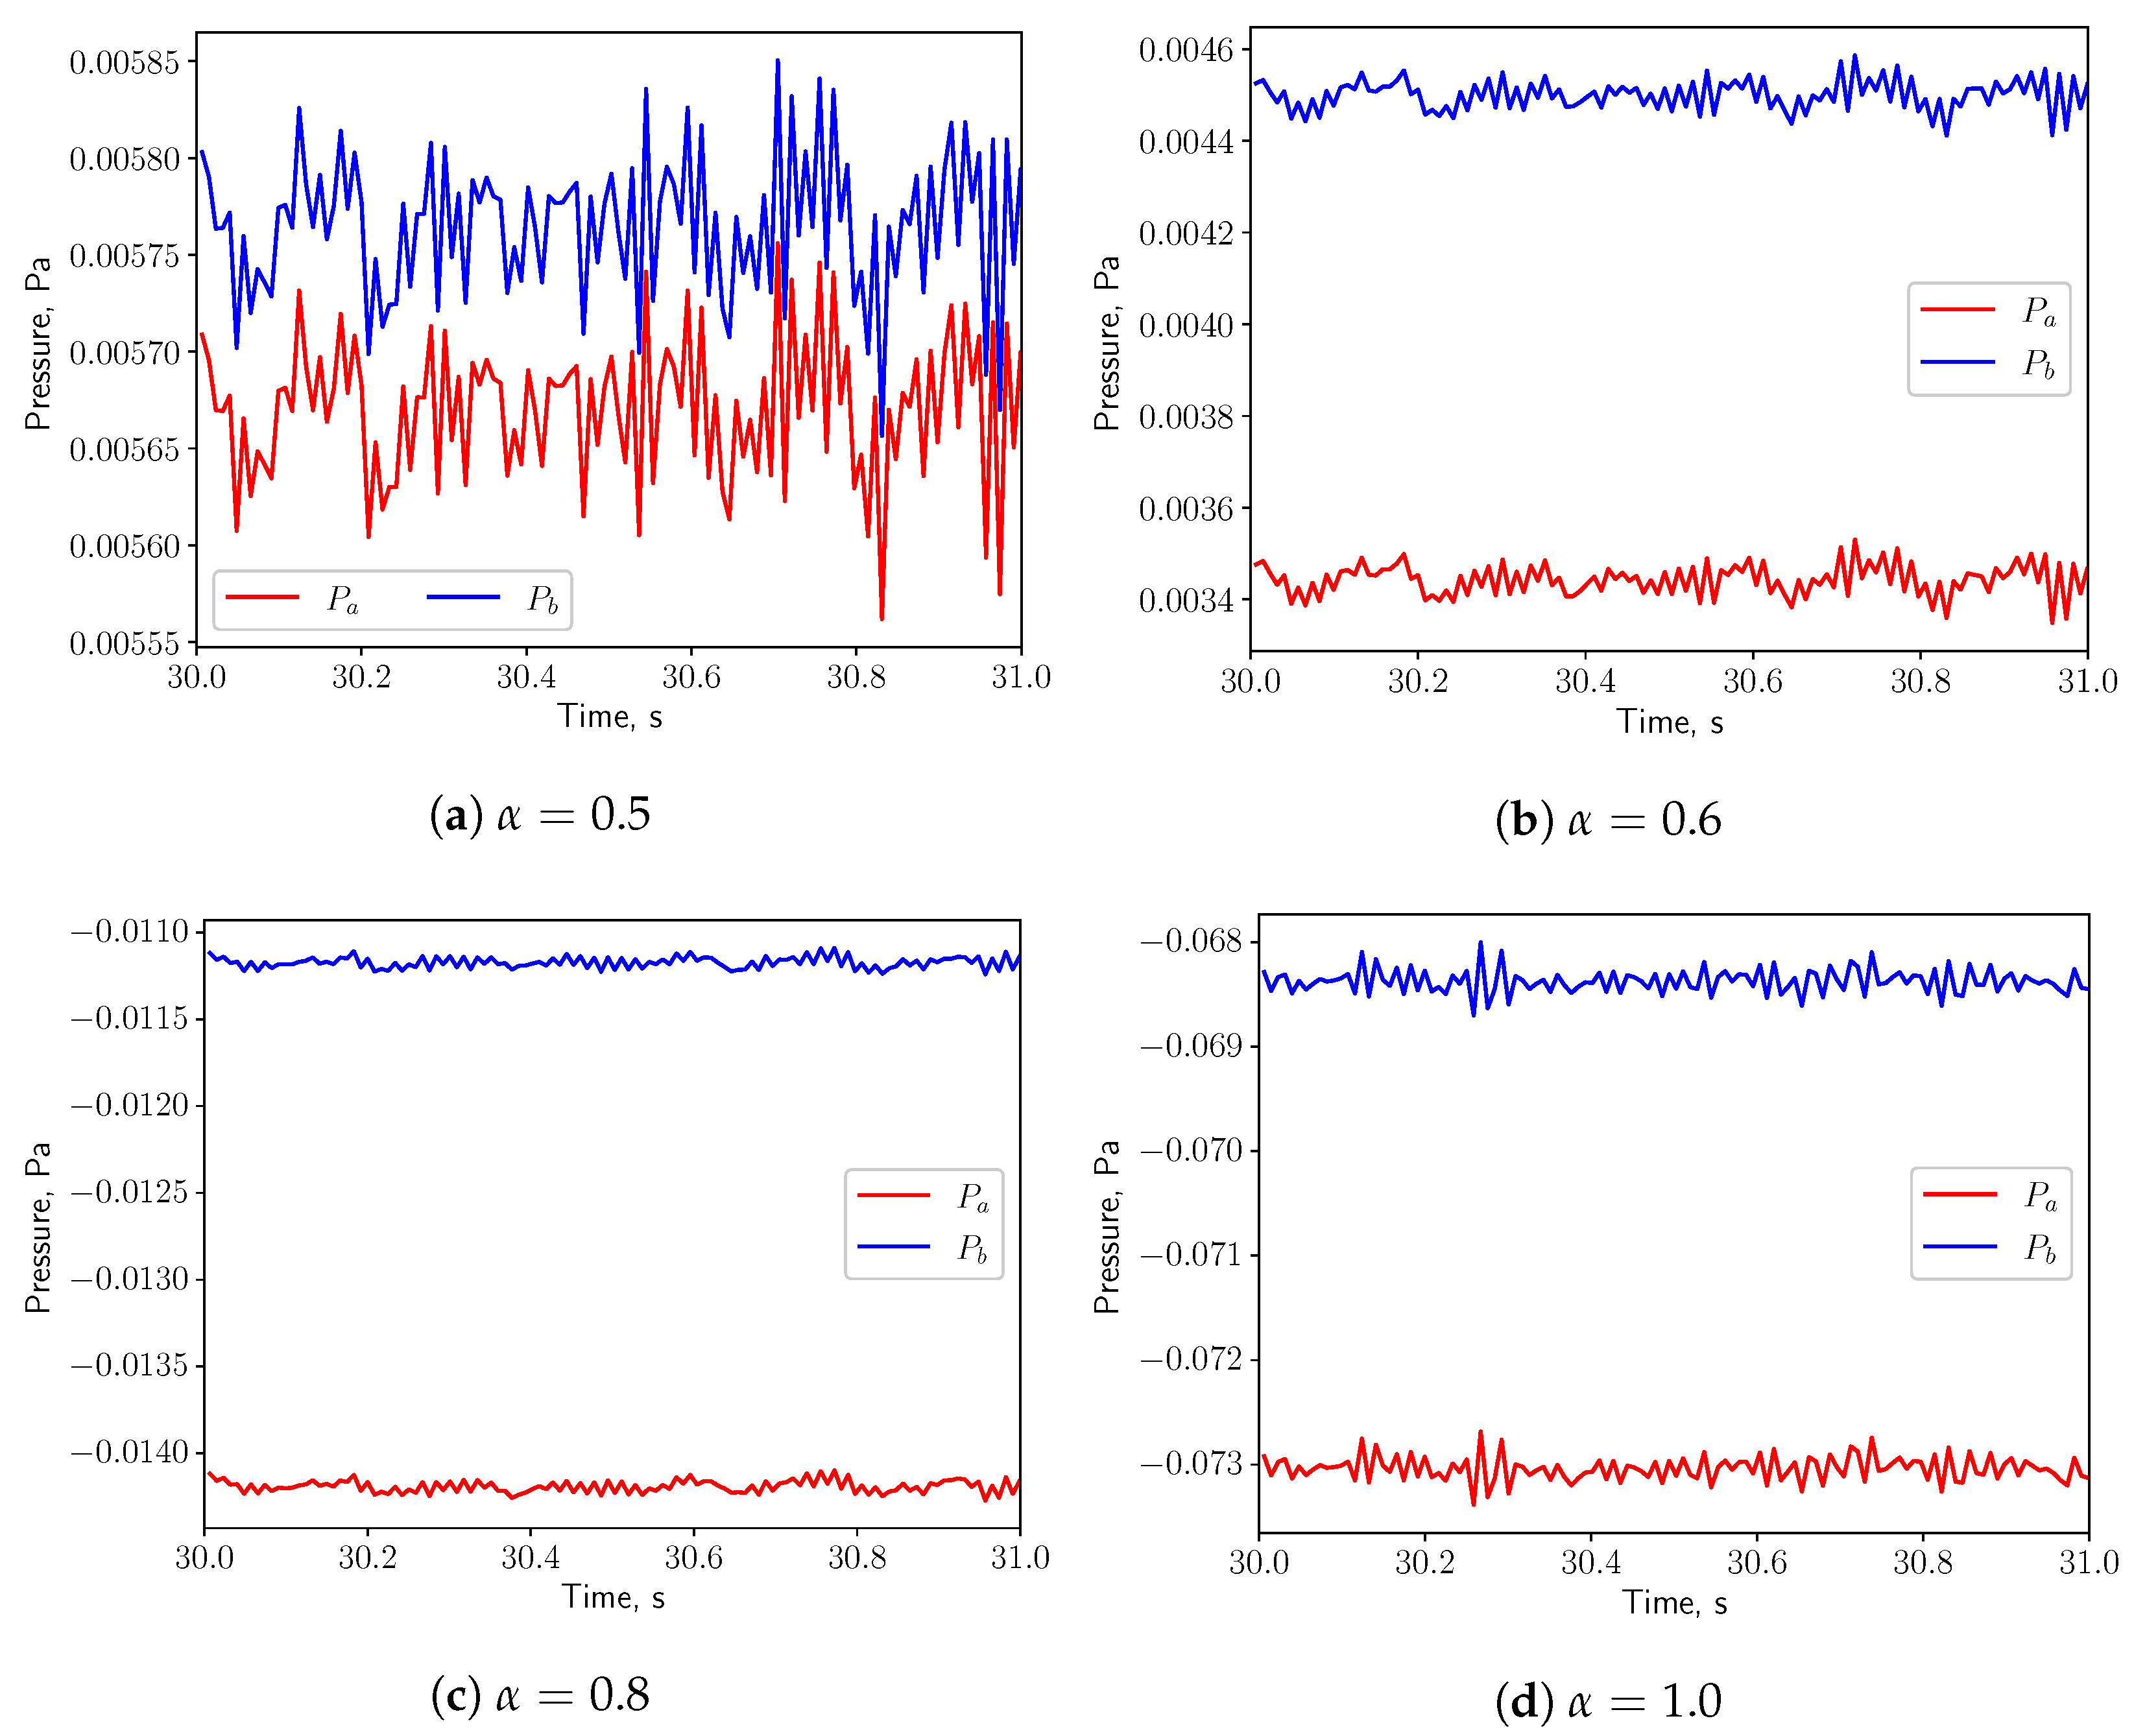
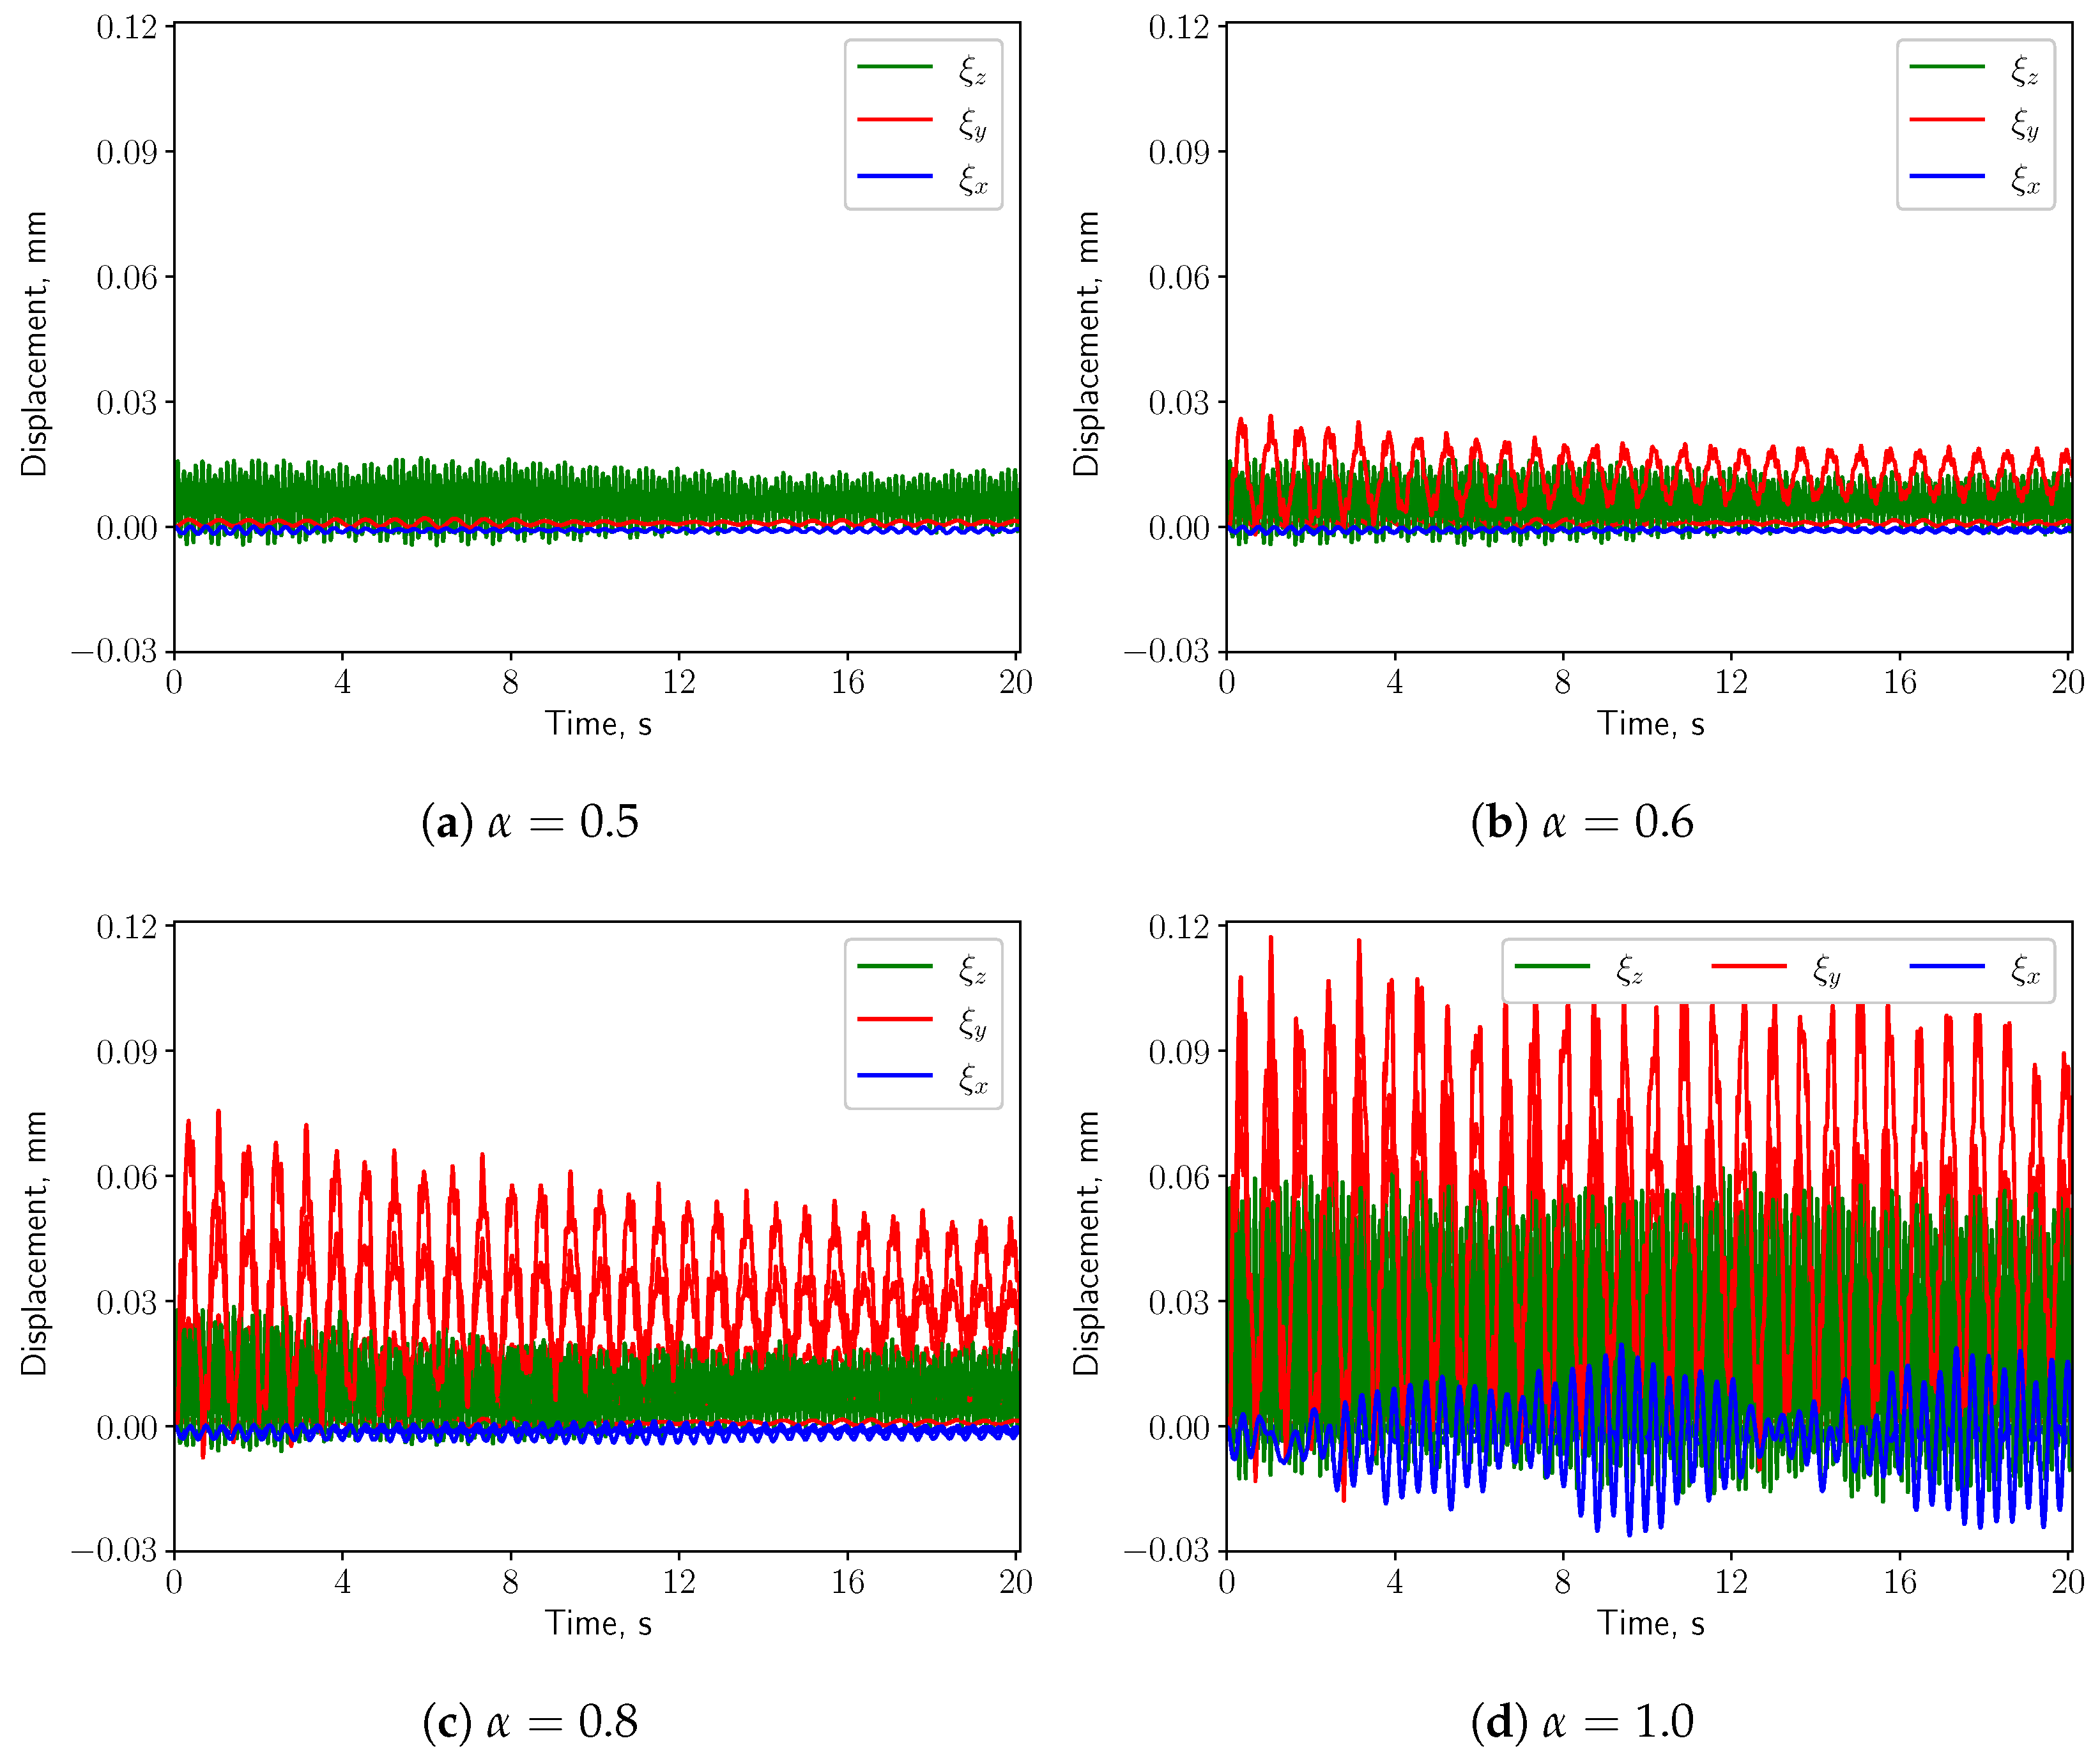
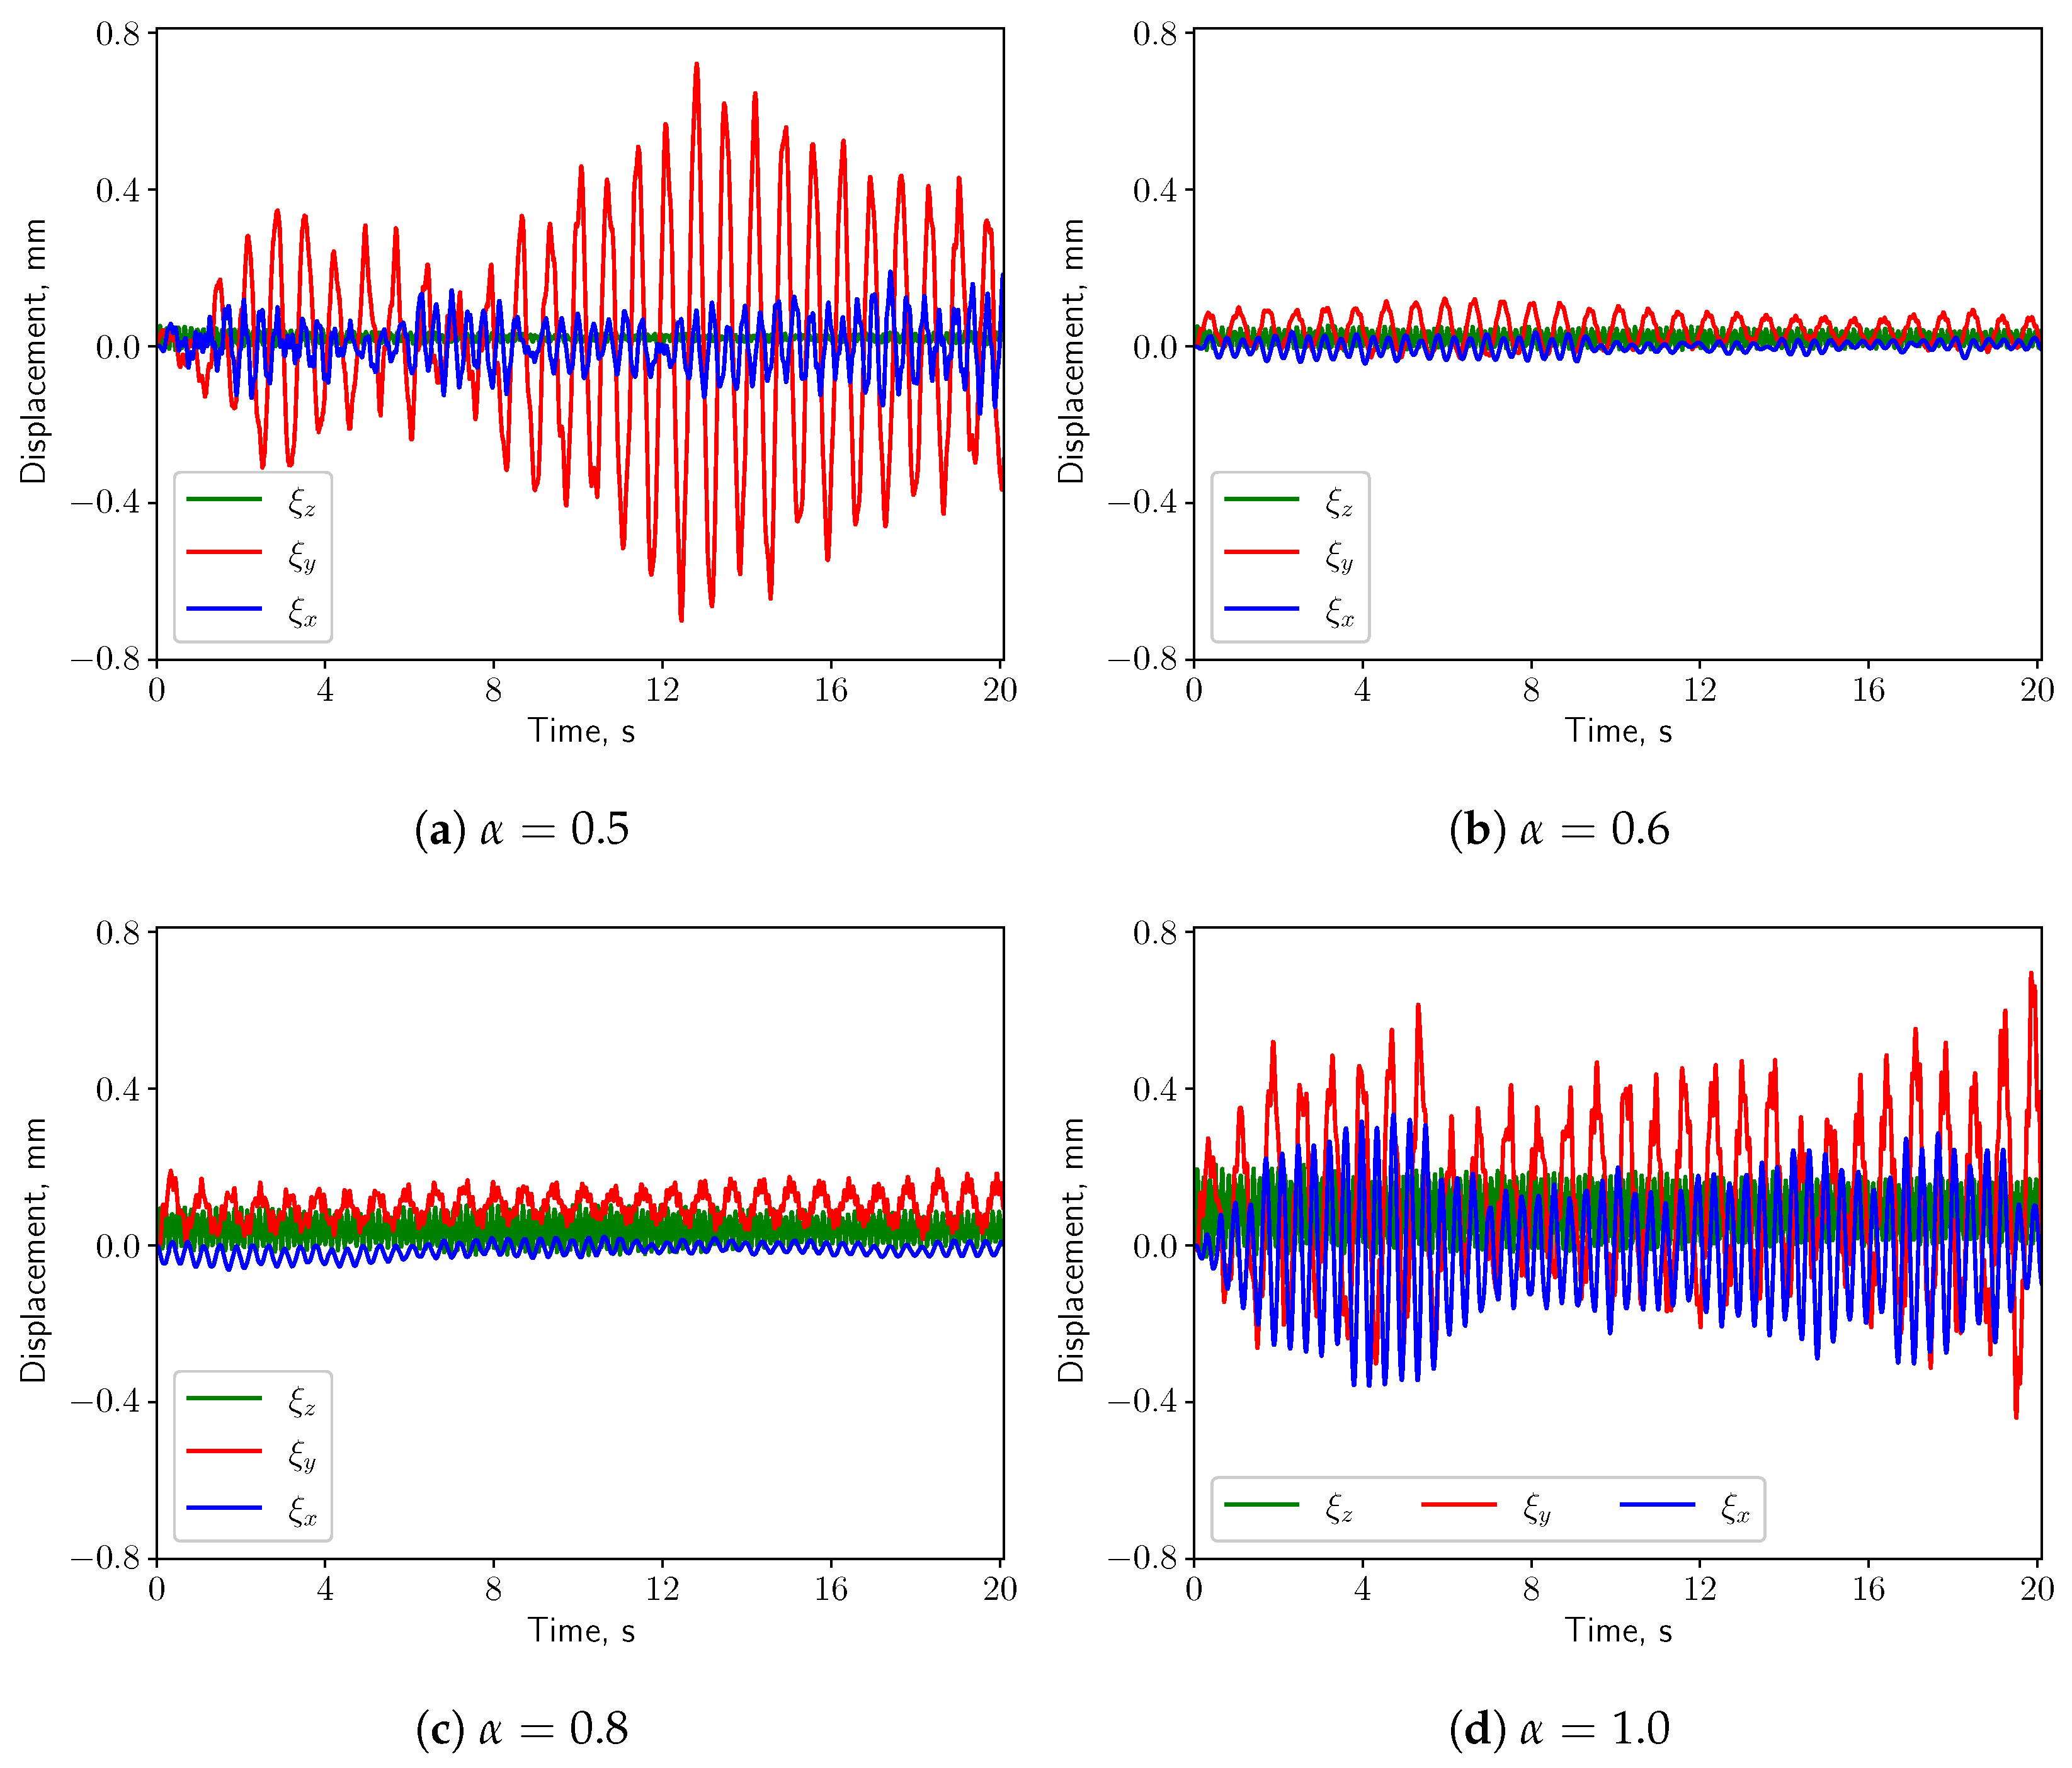
3.3. FSI Simulations
3.3.1. Calm Breathing: L/s
3.3.2. Medium Breathing: L/s
3.3.3. Intensive Breathing: L/s
4. Discussion & Conclusions
Author Contributions
Funding
Institutional Review Board Statement
Informed Consent Statement
Data Availability Statement
Acknowledgments
Conflicts of Interest
Abbreviations
| OSA | Obstructive Sleep Apnea |
| OSAS | Obstructive Sleep Apnea Syndrome |
| FSI | Fluid Structure Interaction |
| CFD | Computational Fluid Dynamics |
| FEM | Finite Element Method |
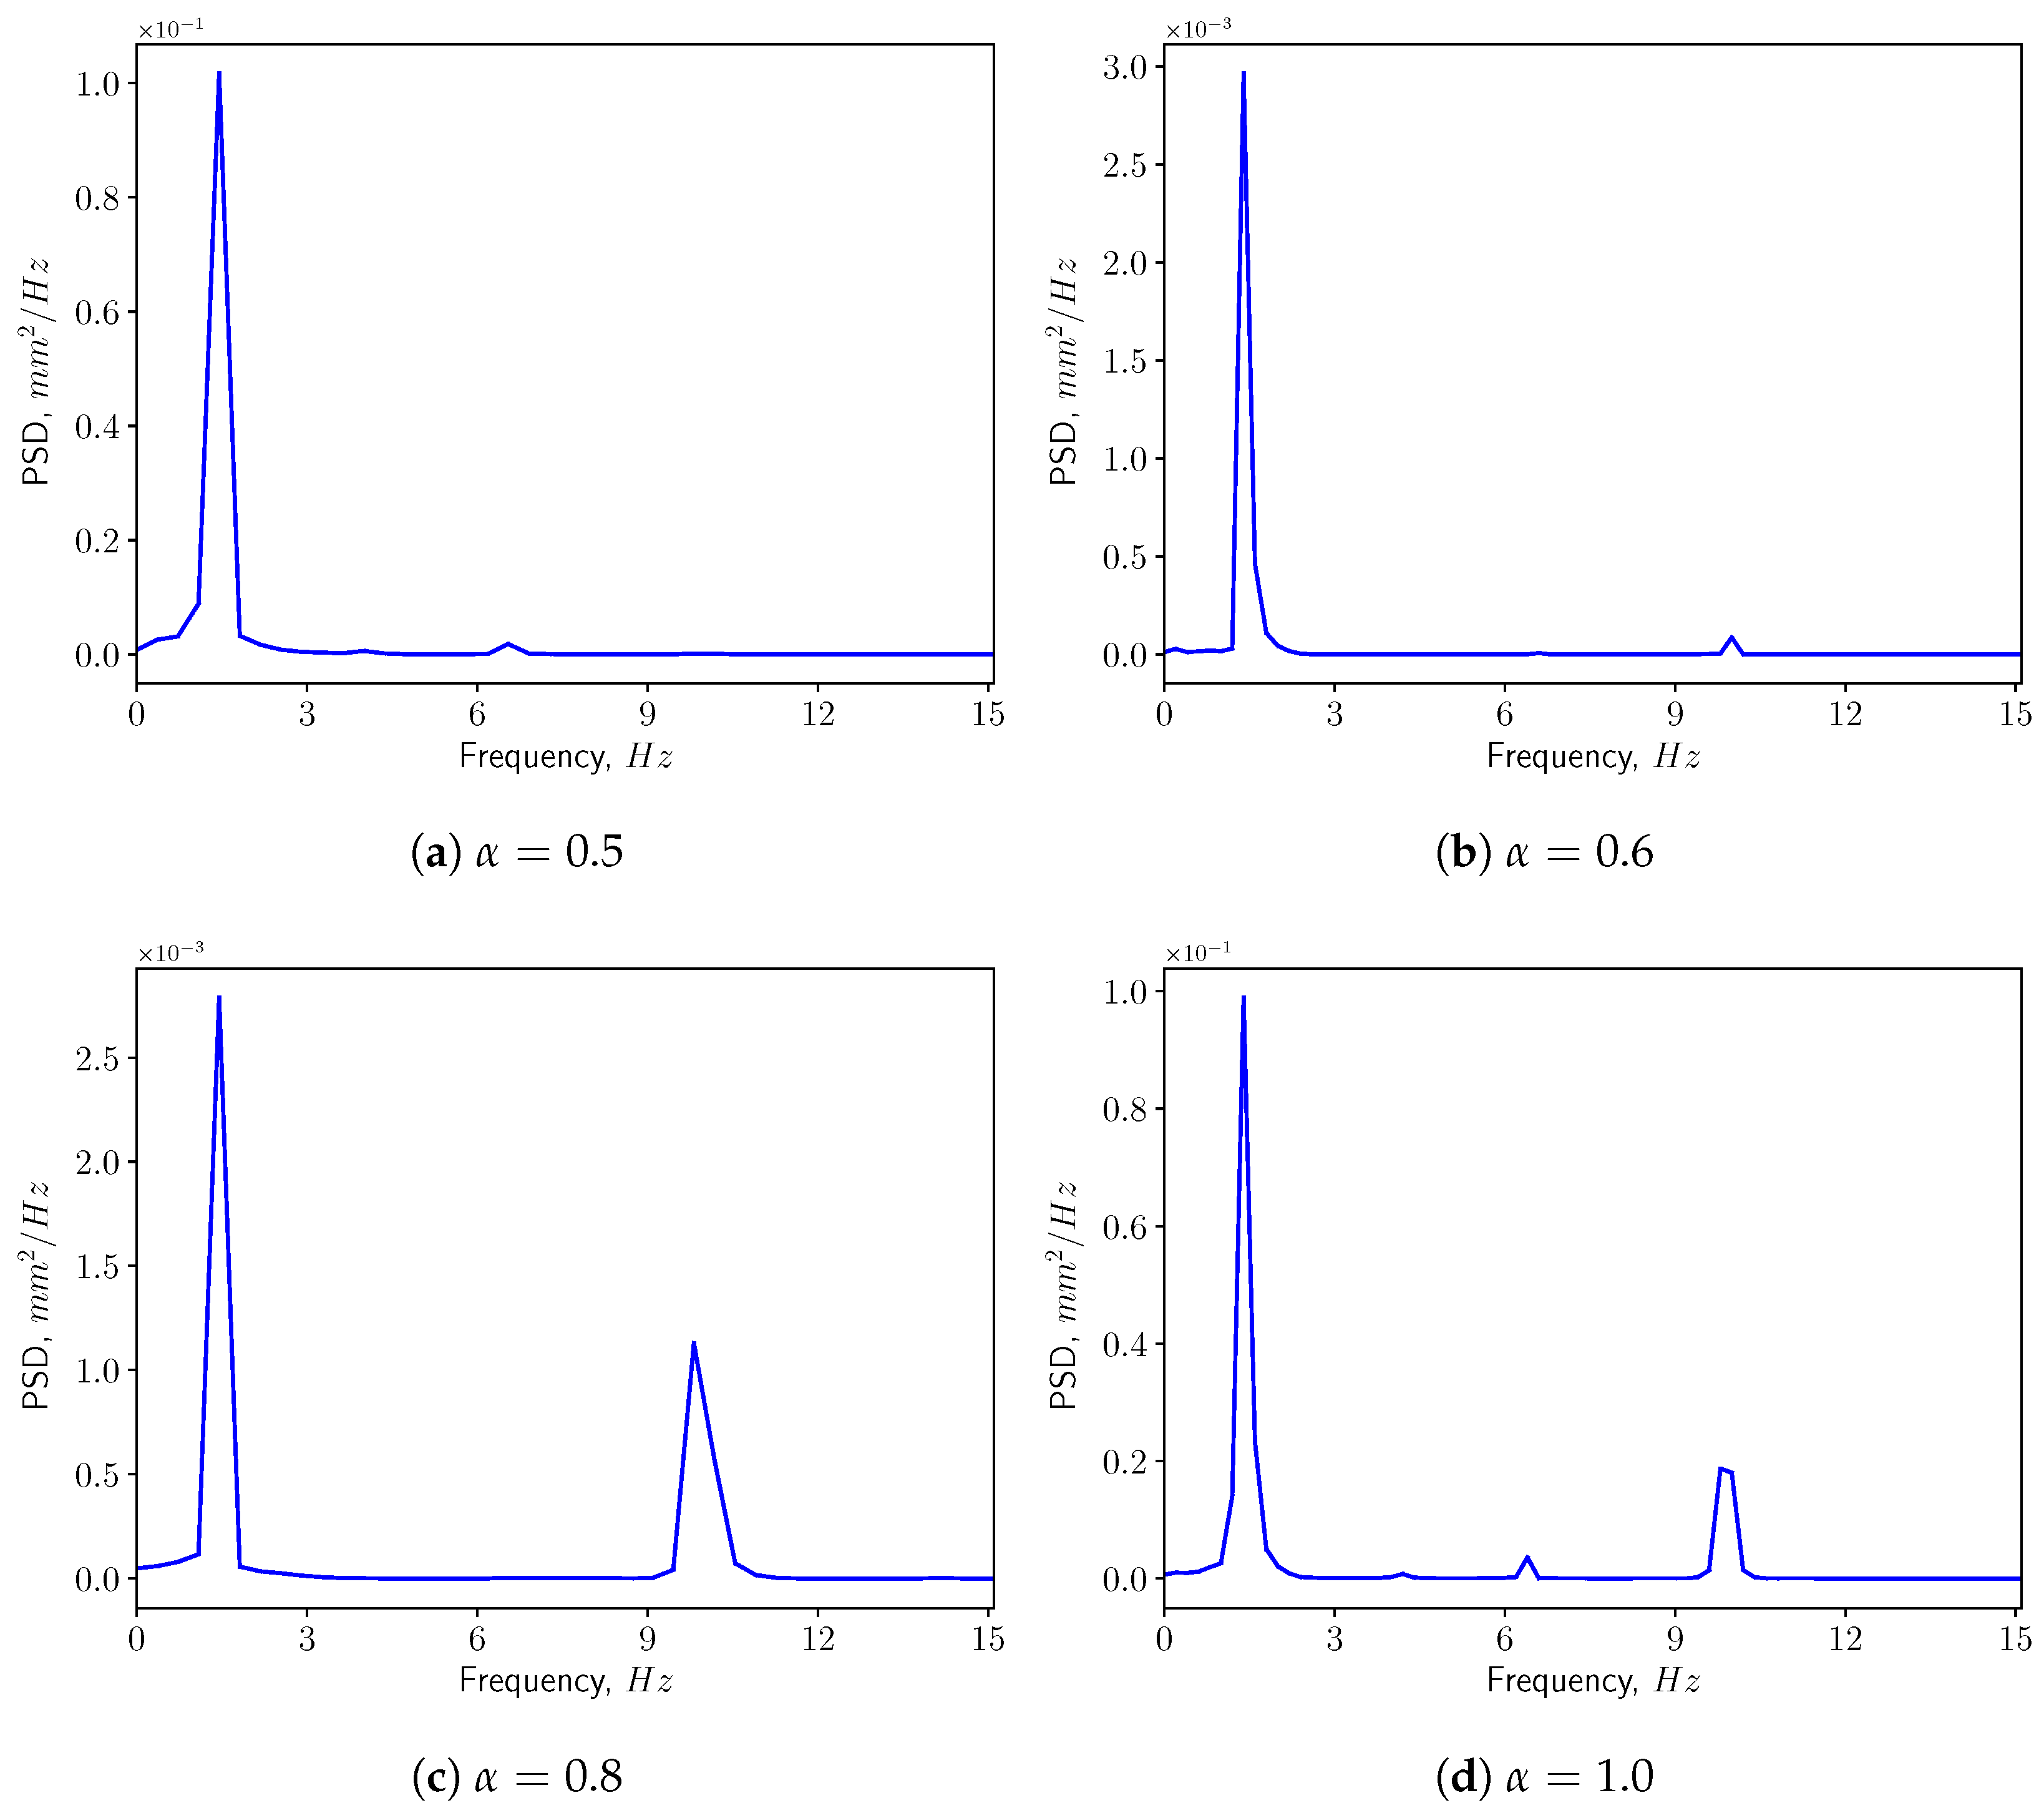
| PSD | Power Spectrum Density |
| MRI | Magnetic Resonance Imaging |
| CT | Computer Tomography |
References
- Peppard, P.E.; Young, T.; Barnet, J.H.; Palta, M.; Hagen, E.W.; Hla, K.M. Increased prevalence of sleep-disordered breathing in adults. Am. J. Epidemiol. 2013, 177, 1006–1014. [Google Scholar] [CrossRef] [PubMed]
- Romero, E.; Krakow, B.; Haynes, P.; Ulibarri, V. Nocturia and snoring: Predictive symptoms for obstructive sleep apnea. Sleep Breath. 2010, 14, 337–343. [Google Scholar] [CrossRef] [PubMed]
- Lechat, B.; Naik, G.; Reynolds, A.; Aishah, A.; Scott, H.; Loffler, K.A.; Vakulin, A.; Escourrou, P.; McEvoy, R.D.; Adams, R.J.; et al. Multinight prevalence, variability, and diagnostic misclassification of obstructive sleep apnea. Am. J. Respir. Crit. Care Med. 2022, 205, 563–569. [Google Scholar] [CrossRef] [PubMed]
- Young, T.; Palta, M.; Dempsey, J.; Skatrud, J.; Weber, S.; Badr, S. The occurrence of sleep-disordered breathing among middle-aged adults. N. Engl. J. Med. 1993, 328, 1230–1235. [Google Scholar] [CrossRef]
- Patel, J.A.; Ray, B.J.; Fernandez-Salvador, C.; Gouveia, C.; Zaghi, S.; Camacho, M. Neuromuscular function of the soft palate and uvula in snoring and obstructive sleep apnea: A systematic review. Am. J. Otolaryngol. 2018, 39, 327–337. [Google Scholar] [CrossRef] [PubMed]
- Osman, A.M.; Carter, S.G.; Carberry, J.C.; Eckert, D.J. Obstructive sleep apnea: Current perspectives. Nat. Sci. Sleep 2018, 10, 21–34. [Google Scholar] [CrossRef]
- Malhotra, A.; White, D.P. Obstructive sleep apnoea. Lancet 2002, 360, 237–245. [Google Scholar] [CrossRef]
- Huang, L.; Quinn, S.J.; Ellis, P.D.; Williams, J.E.F. Biomechanics of snoring. Endeavour 1995, 19, 96–100. [Google Scholar] [CrossRef]
- Blausen Medical. Medical gallery of Blausen medical. Wiki J. Med. 2014, 1, 1–79. [Google Scholar]
- Ambekar, A.A.; Saksena, S.G.; Bapat, J.S.; Butani, M.T. Correlation of bedside airway screening tests with airway obstruction during drug-induced sleep endoscopy. Asian J. Anesthesiol. 2019, 57, 117–124. [Google Scholar]
- Zhao, M.; Barber, T.; Cistulli, P.A.; Sutherl, K.; Rosengarten, G. Simulation of upper airway occlusion without and with mandibular advancement in obstructive sleep apnea using fluid-structure interaction. J. Biomech. 2013, 46, 2586–2592. [Google Scholar] [CrossRef] [PubMed]
- Mylavarapu, G.; Gutmark, E.; Shott, S.; Fleck, R.; Mahmoud, M.; McConnell, K.; Szczesniak, R.; Hossain, M.M.; Huang, G.; Tadesse, D.G.; et al. Predicting critical closing pressure in children with obstructive sleep apnea using fluid-structure interaction. J. Appl. Physiol. 2021, 131, 1629–1639. [Google Scholar] [CrossRef] [PubMed]
- Pirnar, J.; Dolenc-Grošelj, L.; Fajdiga, I.; Žun, I. Computational fluid-structure interaction simulation of airflow in the human upper airway. J. Biomech. 2015, 48, 3685–3691. [Google Scholar] [CrossRef] [PubMed]
- Huang, R.; Li, X.; Rong, Q. Control mechanism for the upper airway collapse in patients with obstructive sleep apnea syndrome: A finite element study. Sci. China Life Sci. 2013, 56, 366–372. [Google Scholar] [CrossRef]
- Chen, Y.; Feng, X.; Shi, X.Q.; Cai, W.; Li, B.; Zhao, Y. Computational fluid–structure interaction analysis of flapping uvula on aerodynamics and pharyngeal vibration in a pediatric airway. Sci. Rep. 2023, 13, 2013. [Google Scholar] [CrossRef]
- Laudato, M.; Mosca, R.; Mihaescu, M. Buckling critical pressures in collapsible tubes relevant for biomedical flows. Sci. Rep. 2023, 13, 9298. [Google Scholar] [CrossRef]
- Gregory, A.L.; Agarwal, A.; Lasenby, J. An experimental investigation to model wheezing in lungs. R. Soc. Open Sci. 2021, 8, 201951. [Google Scholar] [CrossRef]
- Tetlow, G.A.; Lucey, A.D. Motions of an offset plate in Viscous channel flow: A model for flutter of the soft palate. World Congr. Med. Phys. Biomed. Eng. 2006, 14, 3457–3460. [Google Scholar]
- Khalili, M.; Larsson, M.; Müller, B. Interaction between a simplified soft palate and compressible viscous flow. J. Fluids Struct. 2016, 67, 85–105. [Google Scholar] [CrossRef]
- Cisonni, J.; Lucey, A.D.; Elliott, N.S.J. Tapered-Cantilever Based Fluid-Structure Interaction Modelling of the Human Soft Palate. In Fluid-Structure-Sound Interactions and Control: Proceedings of the 5th Symposium on Fluid-Structure-Sound Interactions and Control; Springer: Singapore, 2021; Volume 5, pp. 45–49. [Google Scholar]
- Benra, F.K.; Dohmen, H.J.; Pei, J.; Schuster, S.; Wan, B. A comparison of one-way and two-way coupling methods for numerical analysis of fluid-structure interactions. J. Appl. Math. 2011, 2011, 853560. [Google Scholar] [CrossRef]
- Alkhader, M.; Alrashdan, M.S.; Abdo, N.; Abbas, R. Usefulness of Hard Palate Measurements in Predicting Airway Dimensions in Patients Referred for Cone Beam CT. Open Dent. J. 2021, 15, 505–511. [Google Scholar] [CrossRef]
- Rodenstein, D.O.; Dooms, G.; Thomas, Y.; Liistro, G.; Stanescu, D.C.; Culee, C.; Aubert-Tulkens, G. Pharyngeal shape and dimensions in healthy subjects, snorers, and patients with obstructive sleep apnoea. Thorax 1990, 45, 722–727. [Google Scholar] [CrossRef] [PubMed]
- Abu Allhaija, E.S.; Al-Khateeb, S.N. Uvulo-glosso-pharyngeal dimensions in different anteroposterior skeletal patterns. Angle Orthod. 2005, 75, 1012–1018. [Google Scholar] [PubMed]
- Stauffer, J.L.; Buick, M.K.; Bixler, E.O.; Sharkey, F.E.; Abt, A.B.; Manders, E.K.; Kales, A.; Cadieux, R.J.; Barry, J.D.; Zwillich, C.W. Morphology of the uvula in obstructive sleep apnea1-3. Am. Rev. Respir. Dis. 1989, 140, 724. [Google Scholar] [CrossRef] [PubMed]
- Birch, M.J.; Srodon, P.D. Biomechanical properties of the human soft palate. Cleft-Palate-Craniofacial J. 2009, 46, 268–274. [Google Scholar] [CrossRef]
- Uvulectomy, If It Sticks Out, Cut It Off? Available online: http://www.circumstitions.com/uvulectomy.html (accessed on 1 July 2023).
- Mihaescu, M.; Mylavarapu, G.; Gutmark, E.J.; Powell, N.B. Large eddy simulation of the pharyngeal airflow associated with obstructive sleep apnea syndrome at pre and post-surgical treatment. J. Biomech. 2011, 44, 2221–2228. [Google Scholar] [CrossRef]
- Chen, J.; Gutmark, E. Numerical investigation of airflow in an idealized human extra-thoracic airway: A comparison study. Biomech. Model. Mechanobiol. 2014, 13, 205–214. [Google Scholar] [CrossRef]
- Nicoud, F.; Ducros, F. Subgrid-scale stress modelling based on the square of the velocity gradient tensor. Flow Turbul. Combust. 1999, 62, 183–200. [Google Scholar] [CrossRef]
- Menter, F.R. Two-equation eddy-viscosity turbulence models for engineering applications. AIAA J. 1994, 3, 1598–1605. [Google Scholar] [CrossRef]
- Schickhofer, L.; Malinen, J.; Mihaescu, M. Compressible flow simulations of voiced speech using rigid vocal tract geometries acquired by MRI. J. Acoust. Soc. Am. 2019, 145, 2049–2061. [Google Scholar] [CrossRef]
- Hahn, I.; Scherer, P.W.; Mozell, M.M. Velocity profiles measured for airflow through a large-scale model of the human nasal cavity. J. Appl. Physiol. 1993, 75, 2273–2287. [Google Scholar] [CrossRef] [PubMed]
- Brietzke, S.E.; Mair, E.A. Acoustical analysis of snoring: Can the probability of success be predicted? Otolaryngol.—Head Neck Surg. 2006, 135, 417–420. [Google Scholar] [CrossRef] [PubMed]
- Agrawal, S.; Stone, P.; Mcguinness, K.; Morris, J.; Camilleri, A.E. Sound frequency analysis and the site of snoring in natural and induced sleep. Clin. Otolaryngol. Allied Sci. 2002, 27, 162–166. [Google Scholar] [CrossRef]
- Schickhofer, L.; Mihaescu, M. Analysis of the aerodynamic sound of speech through static vocal tract models of various glottal shapes. J. Biomech. 2020, 99, 109484. [Google Scholar] [CrossRef] [PubMed]
- Hamdia, K.M.; Ghasemi, H. Quantifying the uncertainties in modeling soft composites via a multiscale approach. Int. J. Solids Struct. 2022, 256, 111959. [Google Scholar] [CrossRef]


| Values from Literature | Values Employed in This Study | |
|---|---|---|
| Pharyngeal radius, D (cm) | 3.8 [22] | 3.8 |
| Soft palate length, (cm) | 4.7 ± 0.7 [23] | 4.7 (=1.24D) |
| Palate thickness, h (cm) | 0.74 ± 0.14 [24] | 0.74 (=0.19D) |
| Uvula length, (cm) | 1.8 ± 0.1 [25] | 1.8 (=0.47D) |
| Uvula width, (cm) | 0.8 ± 0.04 [25] | 0.8 (=0.21D) |
| Values from Literature | Values Employed in This Study | |
|---|---|---|
| Young’s modulus, E (Pa) | 585–1410 [26] | 600 |
| Poisson’s ratio, (-) | 0.22–0.54 [26] | 0.45 |
| Density, (kg/m) | 1022–1116 [26] | 1060 |
| Breathing Condition | Calm | Medium | Intensive |
|---|---|---|---|
| Flow rate, (L/s) | 0.36 | 1.12 | 2.2 |
| Mode | Natural Frequency (Hz) | Effective Mass Ratio, (%) |
|---|---|---|
| 1 | 1.428 | 15.32 |
| 2 | 2.623 | 7.22 |
| 3 | 3.979 | 34.56 |
| 4 | 6.122 | 2.07 |
| 5 | 6.726 | 2.83 |
| 6 | 6.762 | 11.81 |
| 7 | 8.515 | 3.95 |
| 8 | 8.712 | 5.75 |
| 9 | 10.061 | 0.64 |
| 10 | 11.086 | 4.20 |
| 11 | 11.090 | 5.47 |
| 12 | 11.943 | 9.74 |
| 13 | 13.348 | 1.00 |
| 14 | 13.384 | 13.26 |
| 15 | 14.221 | 0.05 |
Disclaimer/Publisher’s Note: The statements, opinions and data contained in all publications are solely those of the individual author(s) and contributor(s) and not of MDPI and/or the editor(s). MDPI and/or the editor(s) disclaim responsibility for any injury to people or property resulting from any ideas, methods, instructions or products referred to in the content. |
© 2023 by the authors. Licensee MDPI, Basel, Switzerland. This article is an open access article distributed under the terms and conditions of the Creative Commons Attribution (CC BY) license (https://creativecommons.org/licenses/by/4.0/).
Share and Cite
Li, P.; Laudato, M.; Mihaescu, M. Time-Dependent Fluid-Structure Interaction Simulations of a Simplified Human Soft Palate. Bioengineering 2023, 10, 1313. https://doi.org/10.3390/bioengineering10111313
Li P, Laudato M, Mihaescu M. Time-Dependent Fluid-Structure Interaction Simulations of a Simplified Human Soft Palate. Bioengineering. 2023; 10(11):1313. https://doi.org/10.3390/bioengineering10111313
Chicago/Turabian StyleLi, Peng, Marco Laudato, and Mihai Mihaescu. 2023. "Time-Dependent Fluid-Structure Interaction Simulations of a Simplified Human Soft Palate" Bioengineering 10, no. 11: 1313. https://doi.org/10.3390/bioengineering10111313
APA StyleLi, P., Laudato, M., & Mihaescu, M. (2023). Time-Dependent Fluid-Structure Interaction Simulations of a Simplified Human Soft Palate. Bioengineering, 10(11), 1313. https://doi.org/10.3390/bioengineering10111313