
Combining Sea Level Rise Inundation Impacts, Tidal Flooding and Extreme Wind Events along the Abu Dhabi Coastline


Abstract
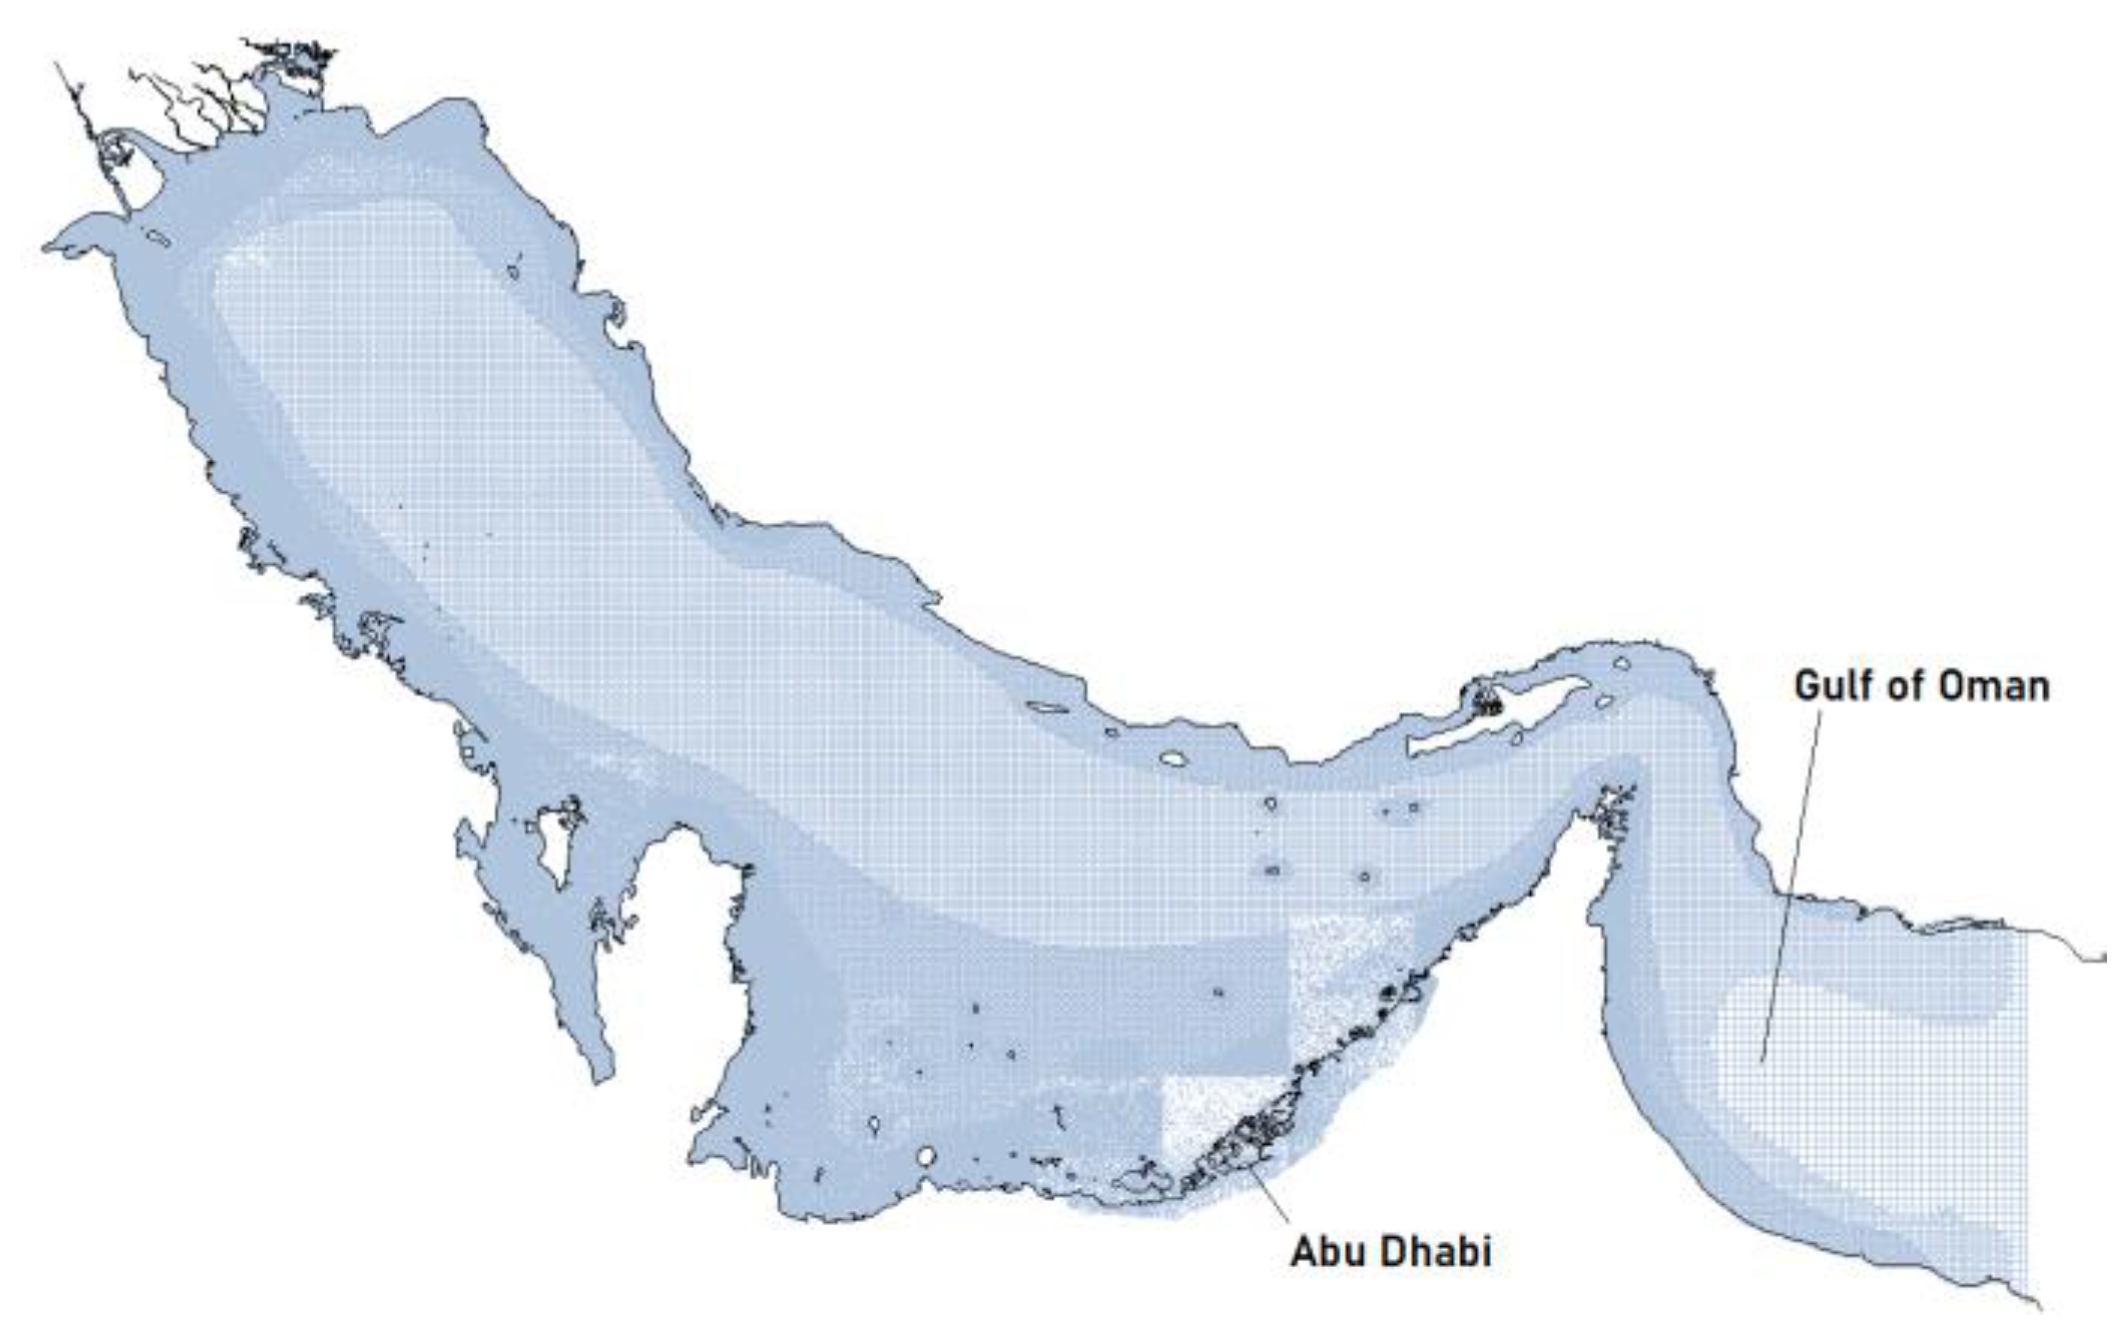
:1. Introduction
2. Materials and Methods
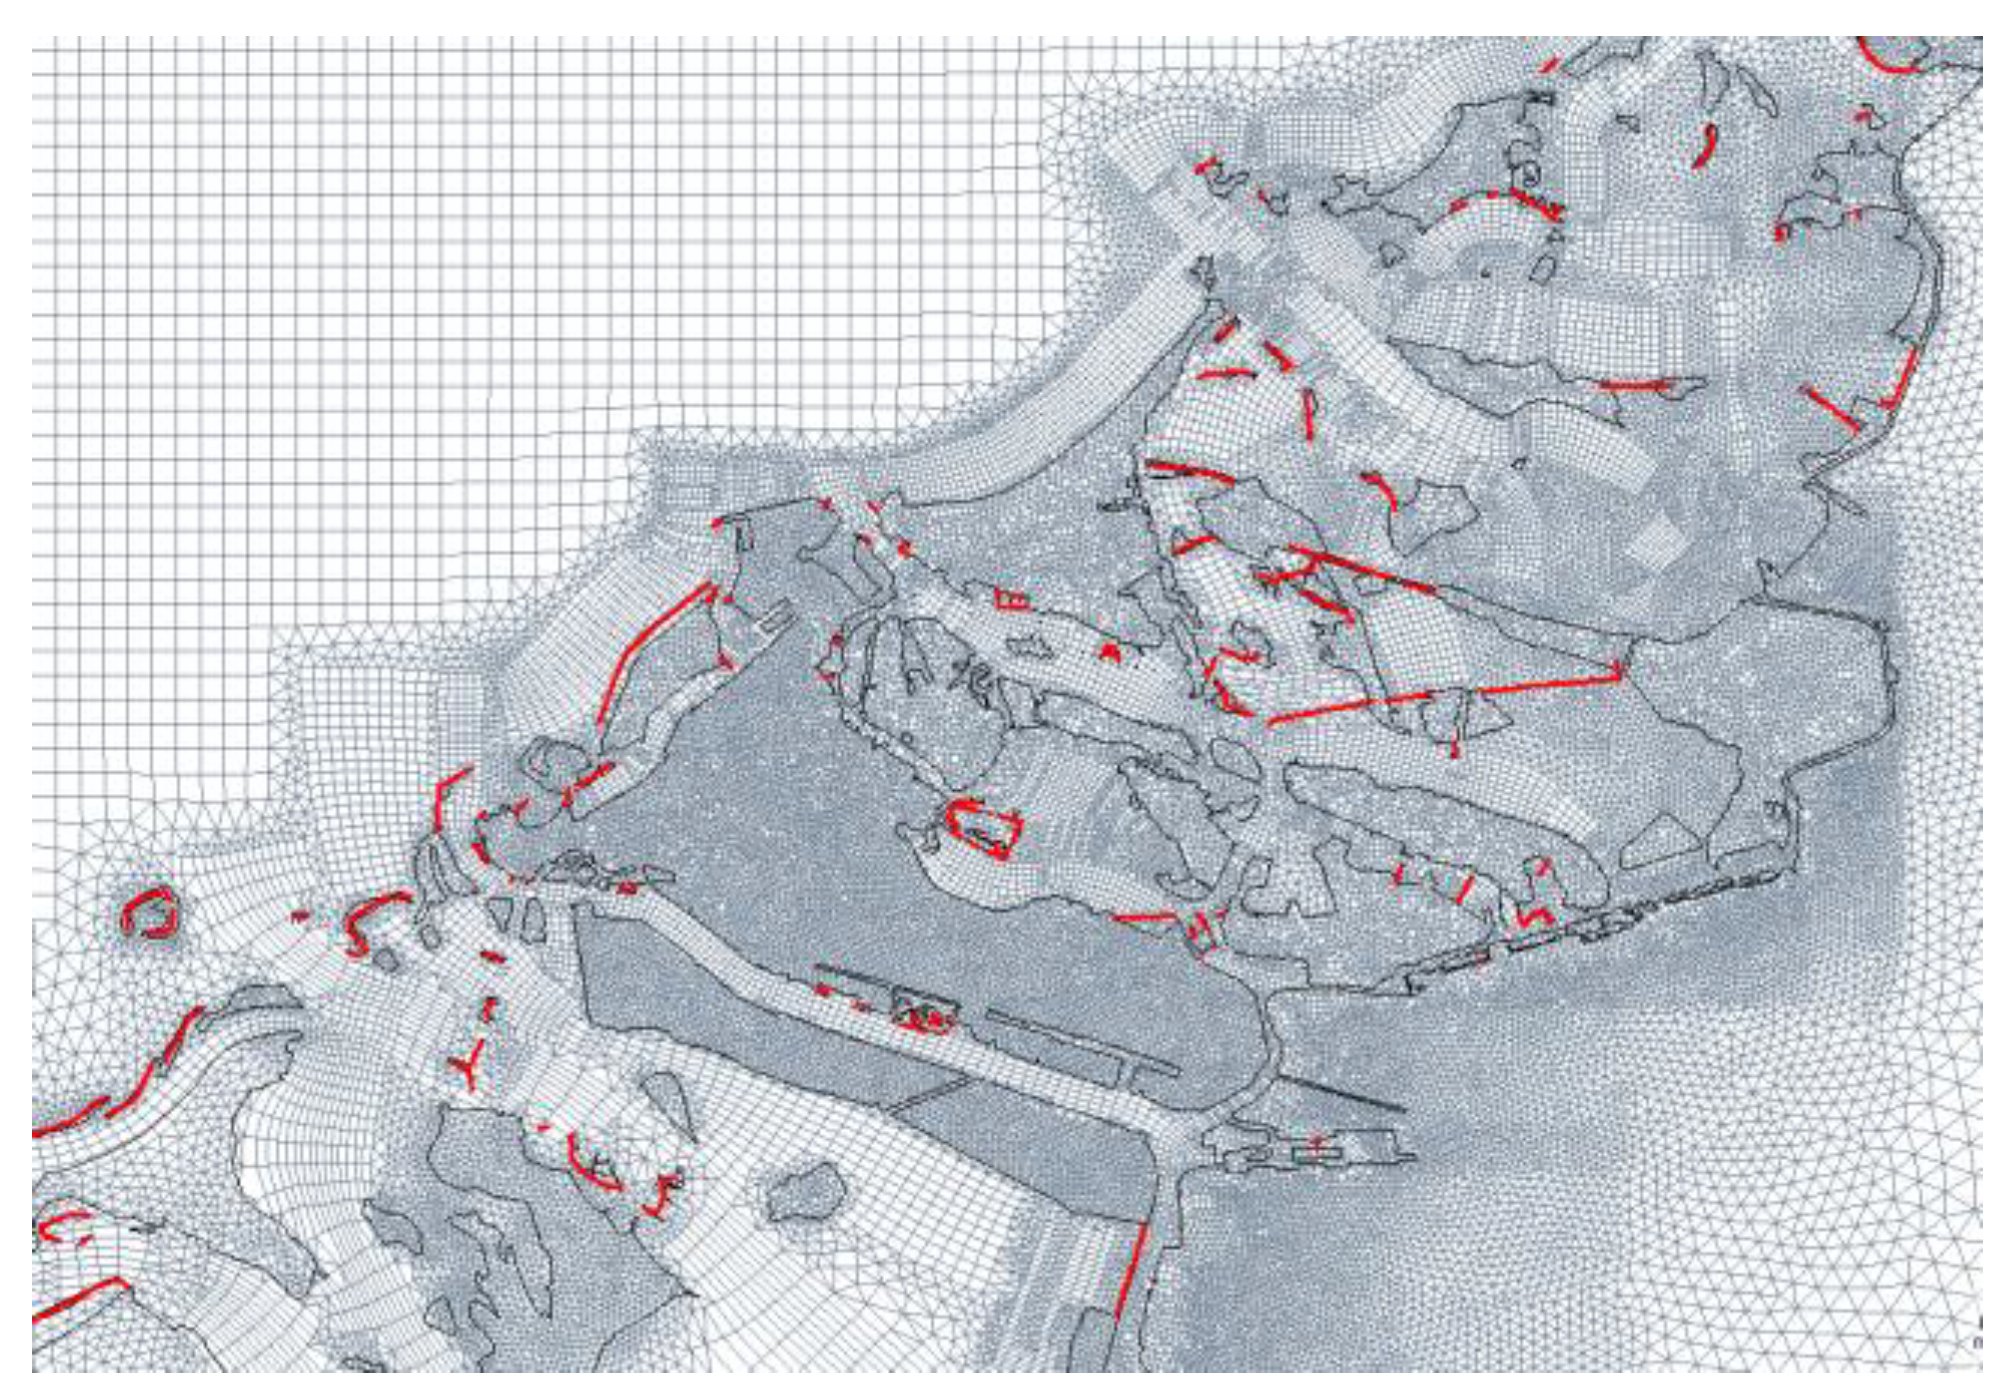
2.1. Hydrodynamic Model
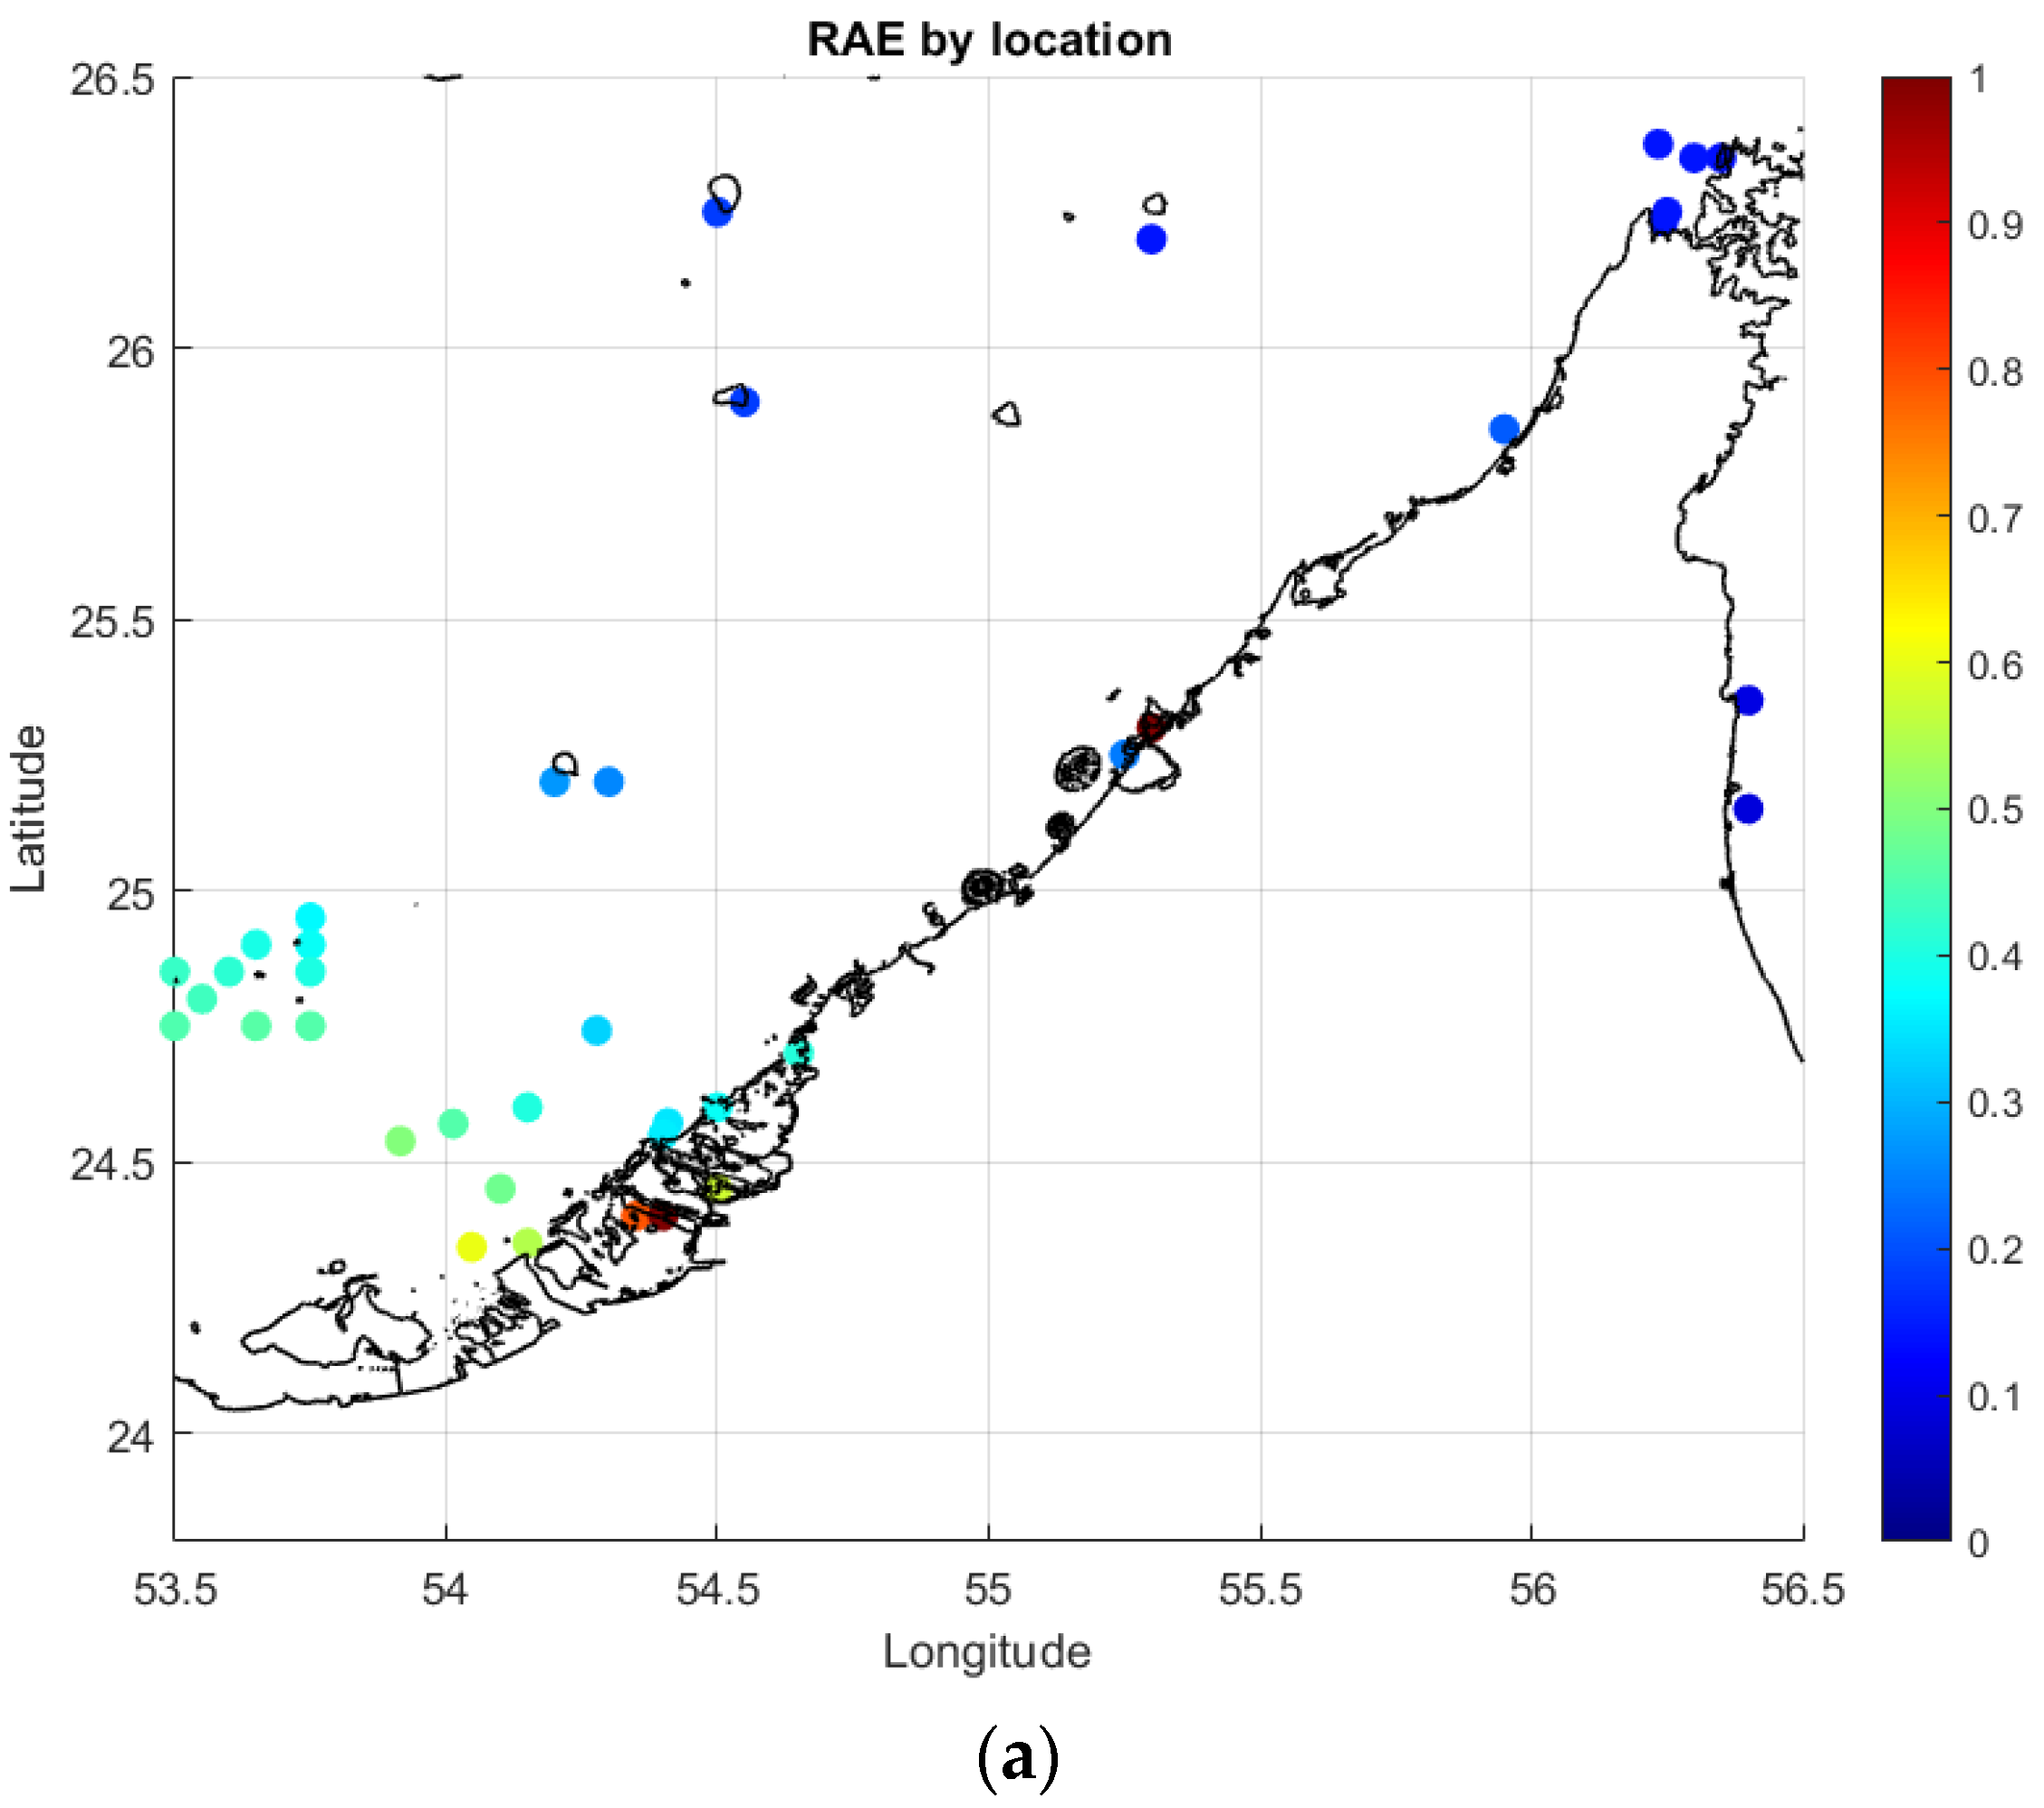
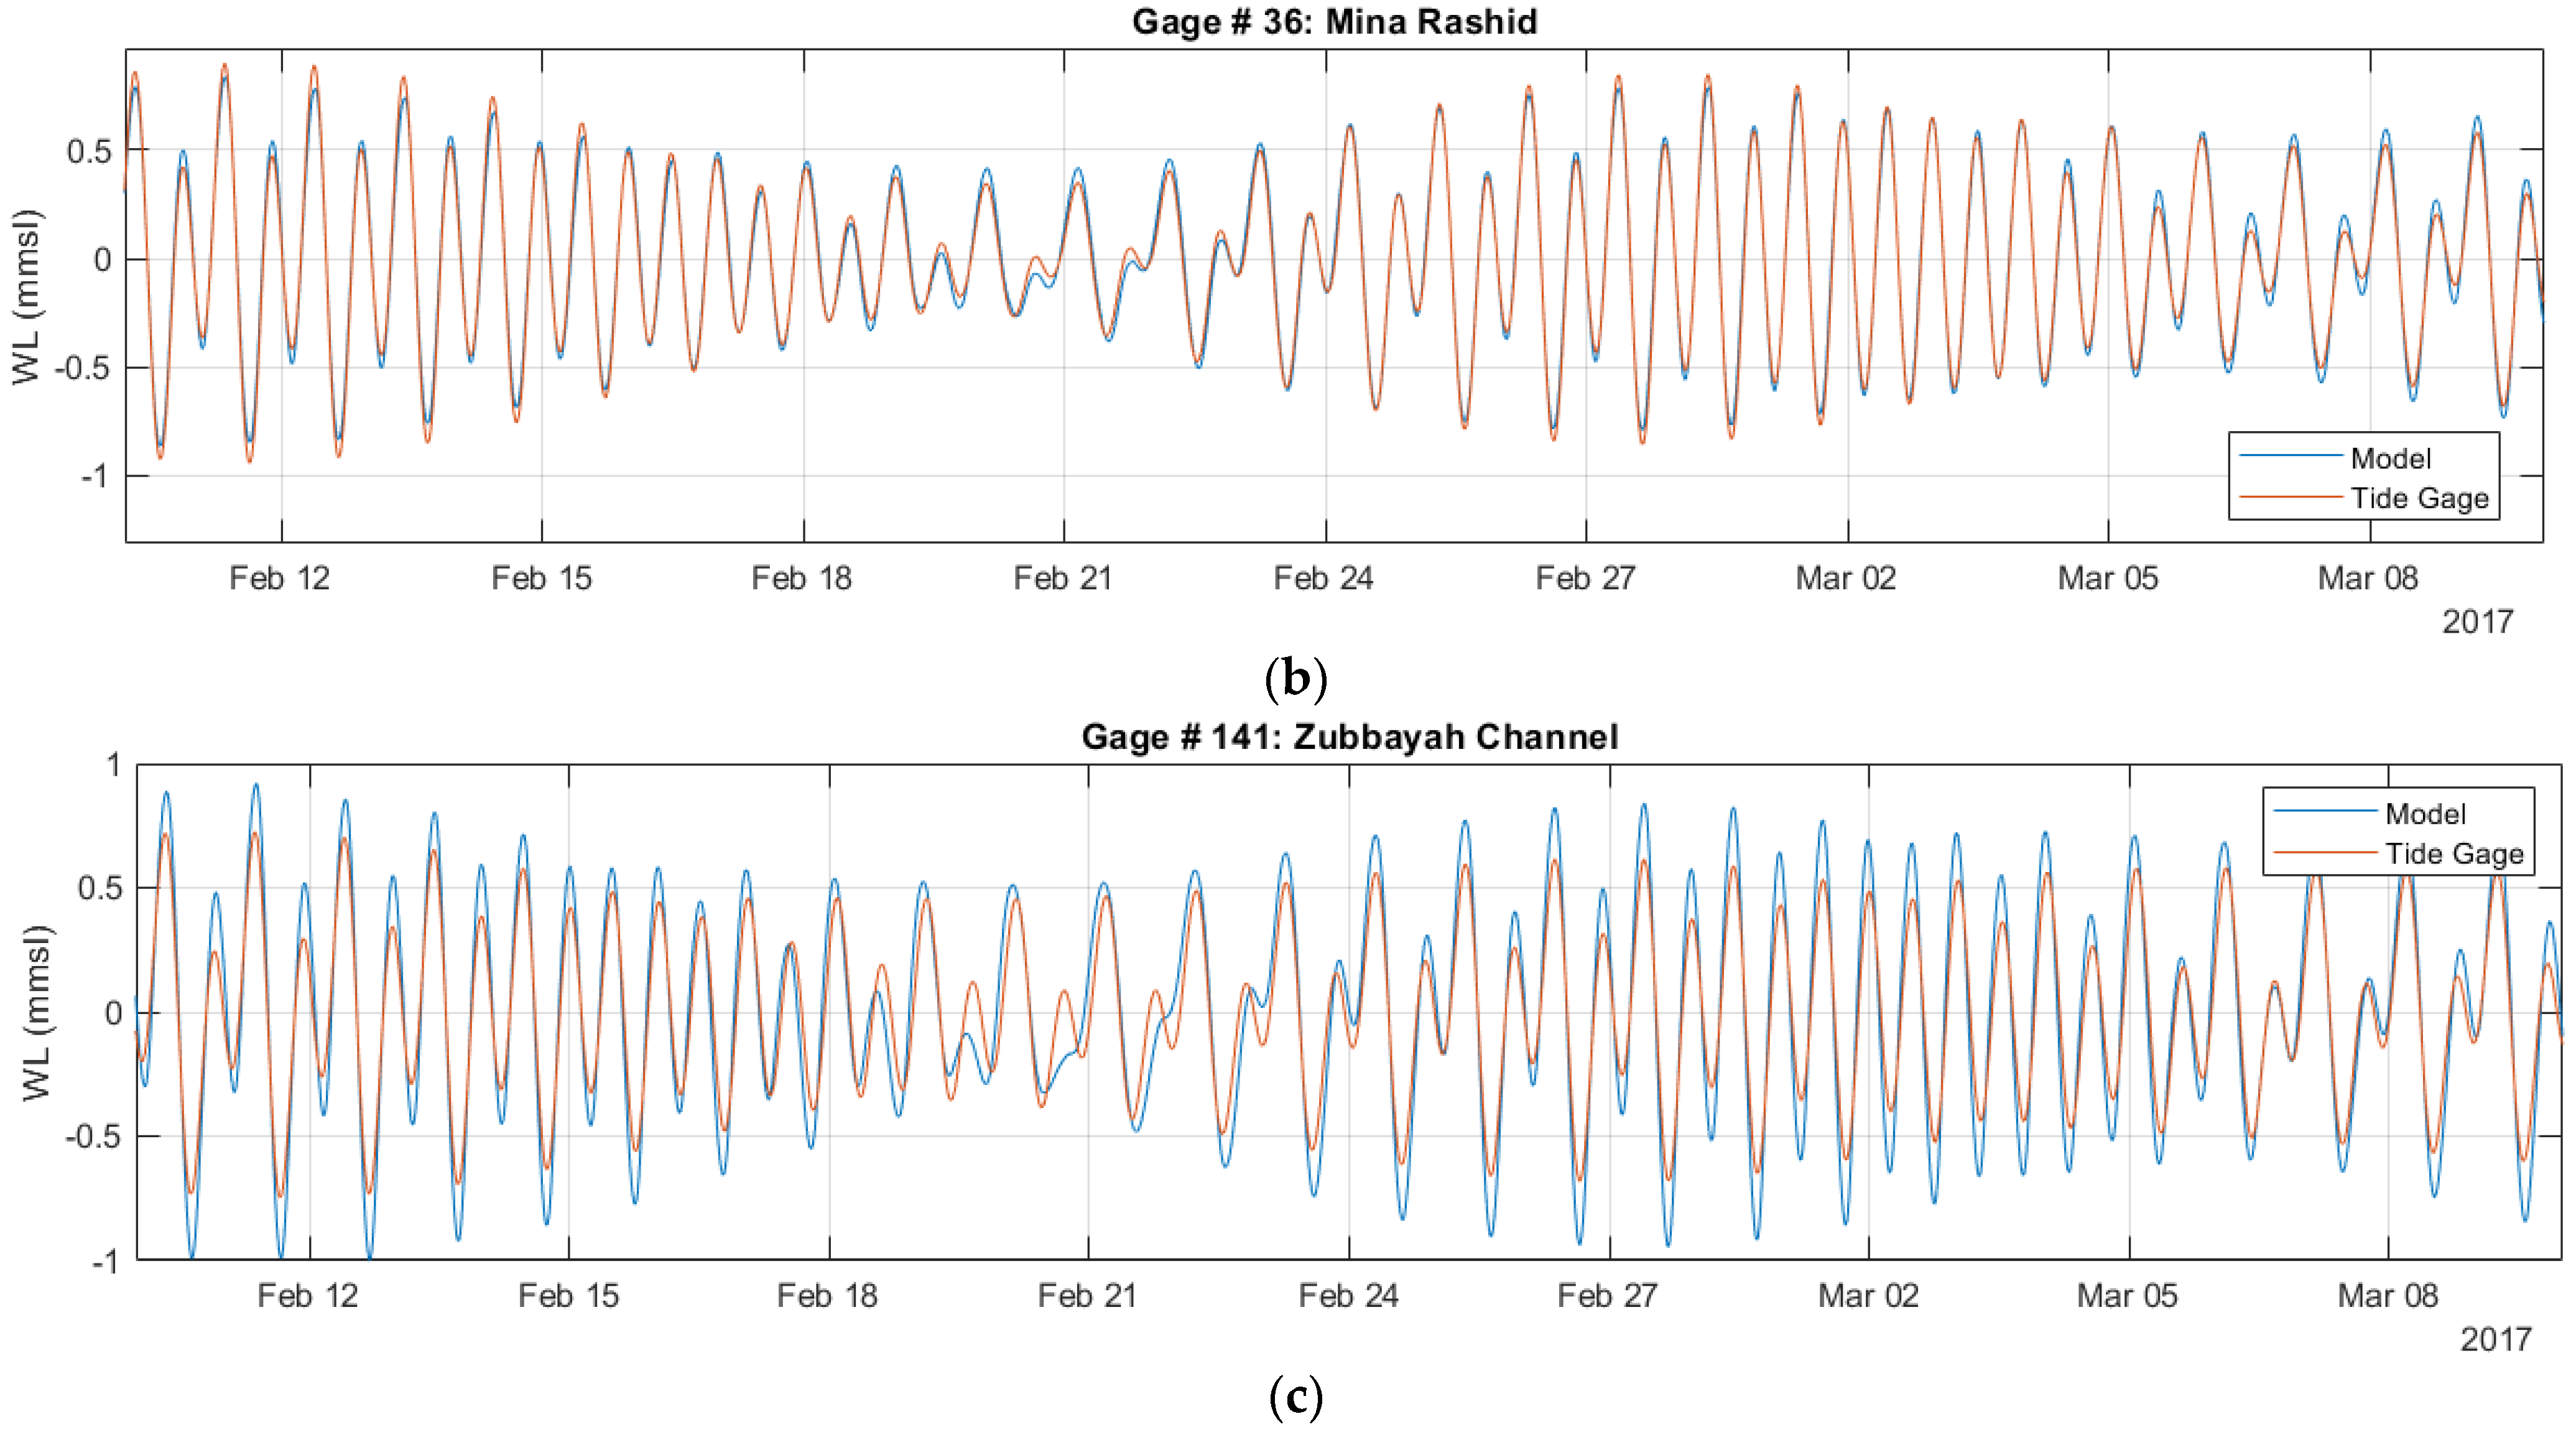
2.2. Validation of Hydrodynamic Model
2.3. SWAN Wave Model
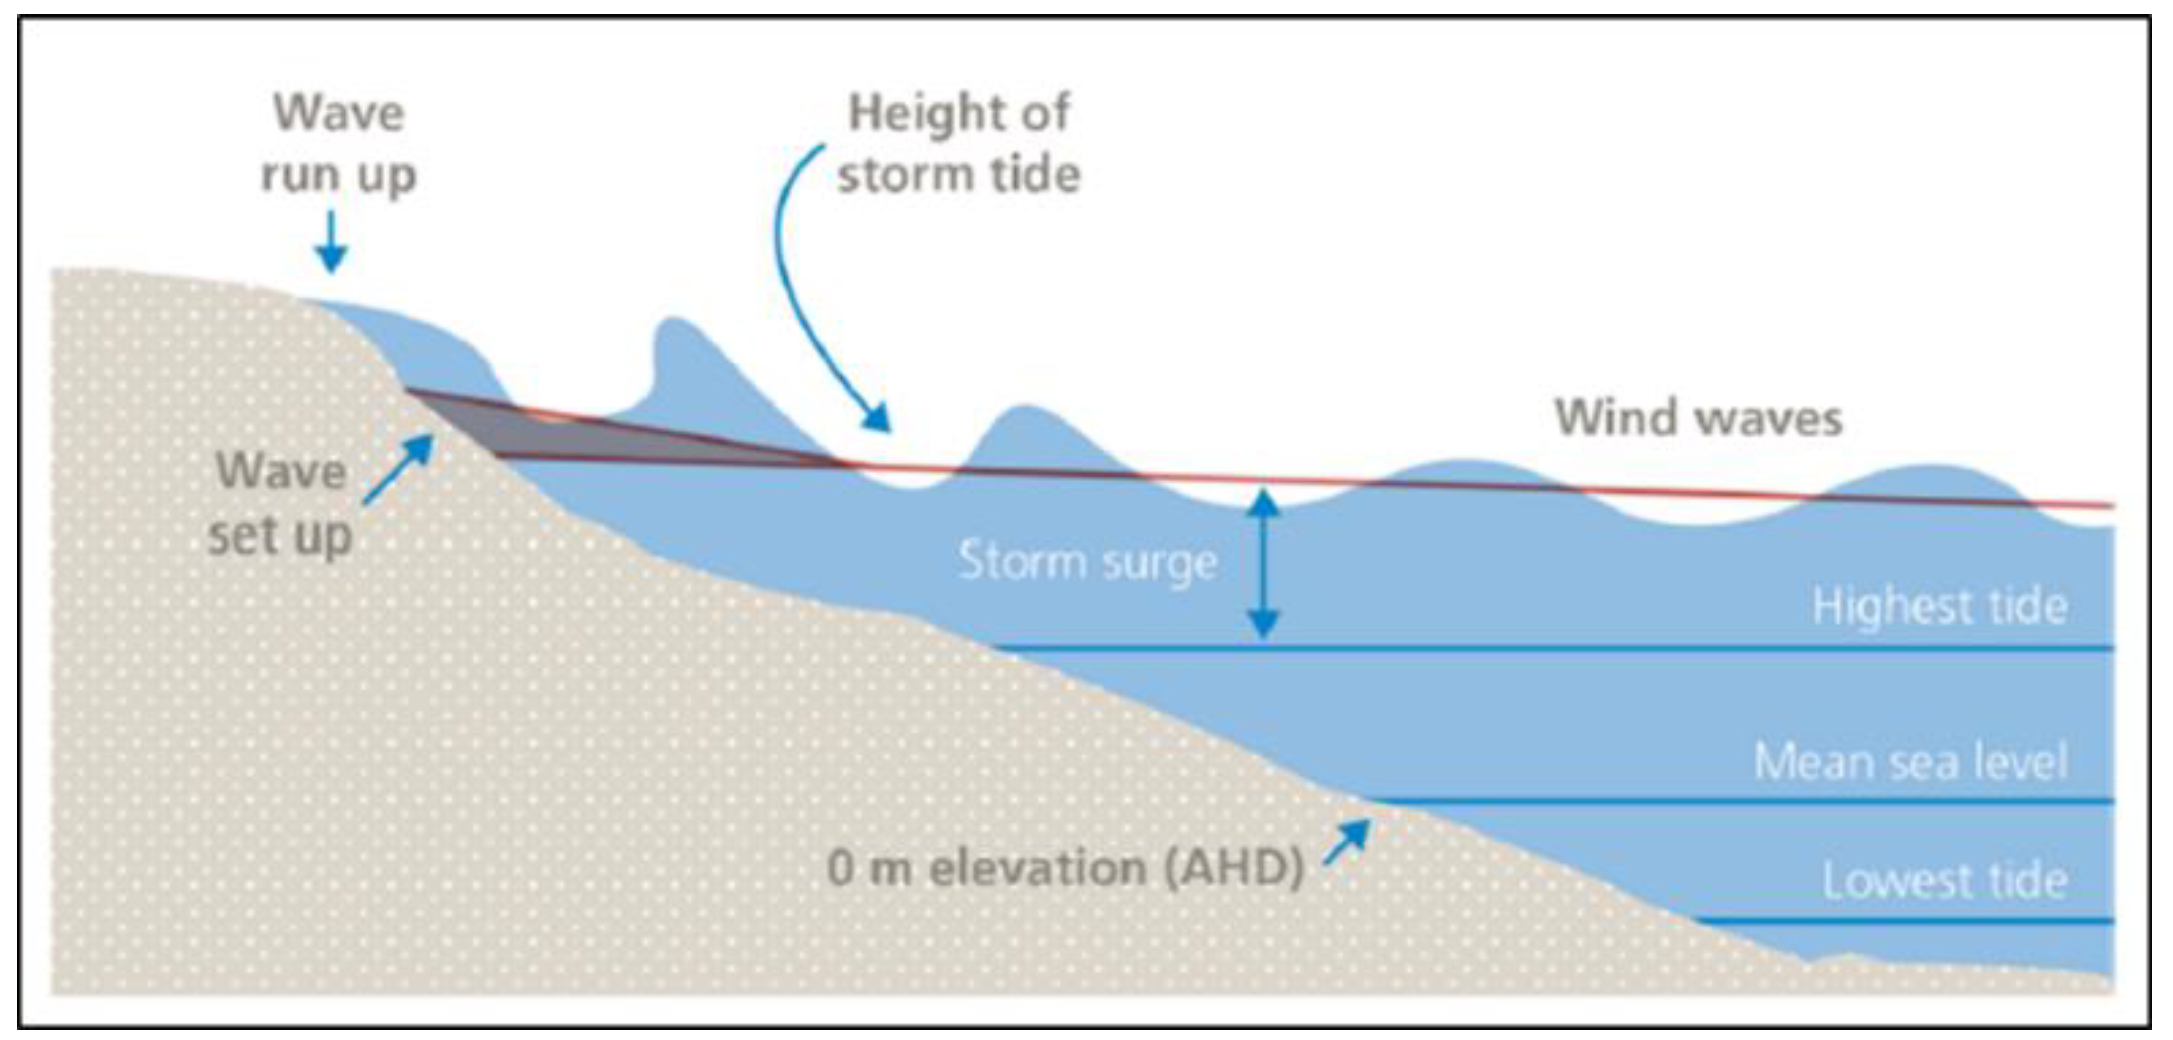
2.4. Run-Up Model
2.5. Determination of Inundation Extent
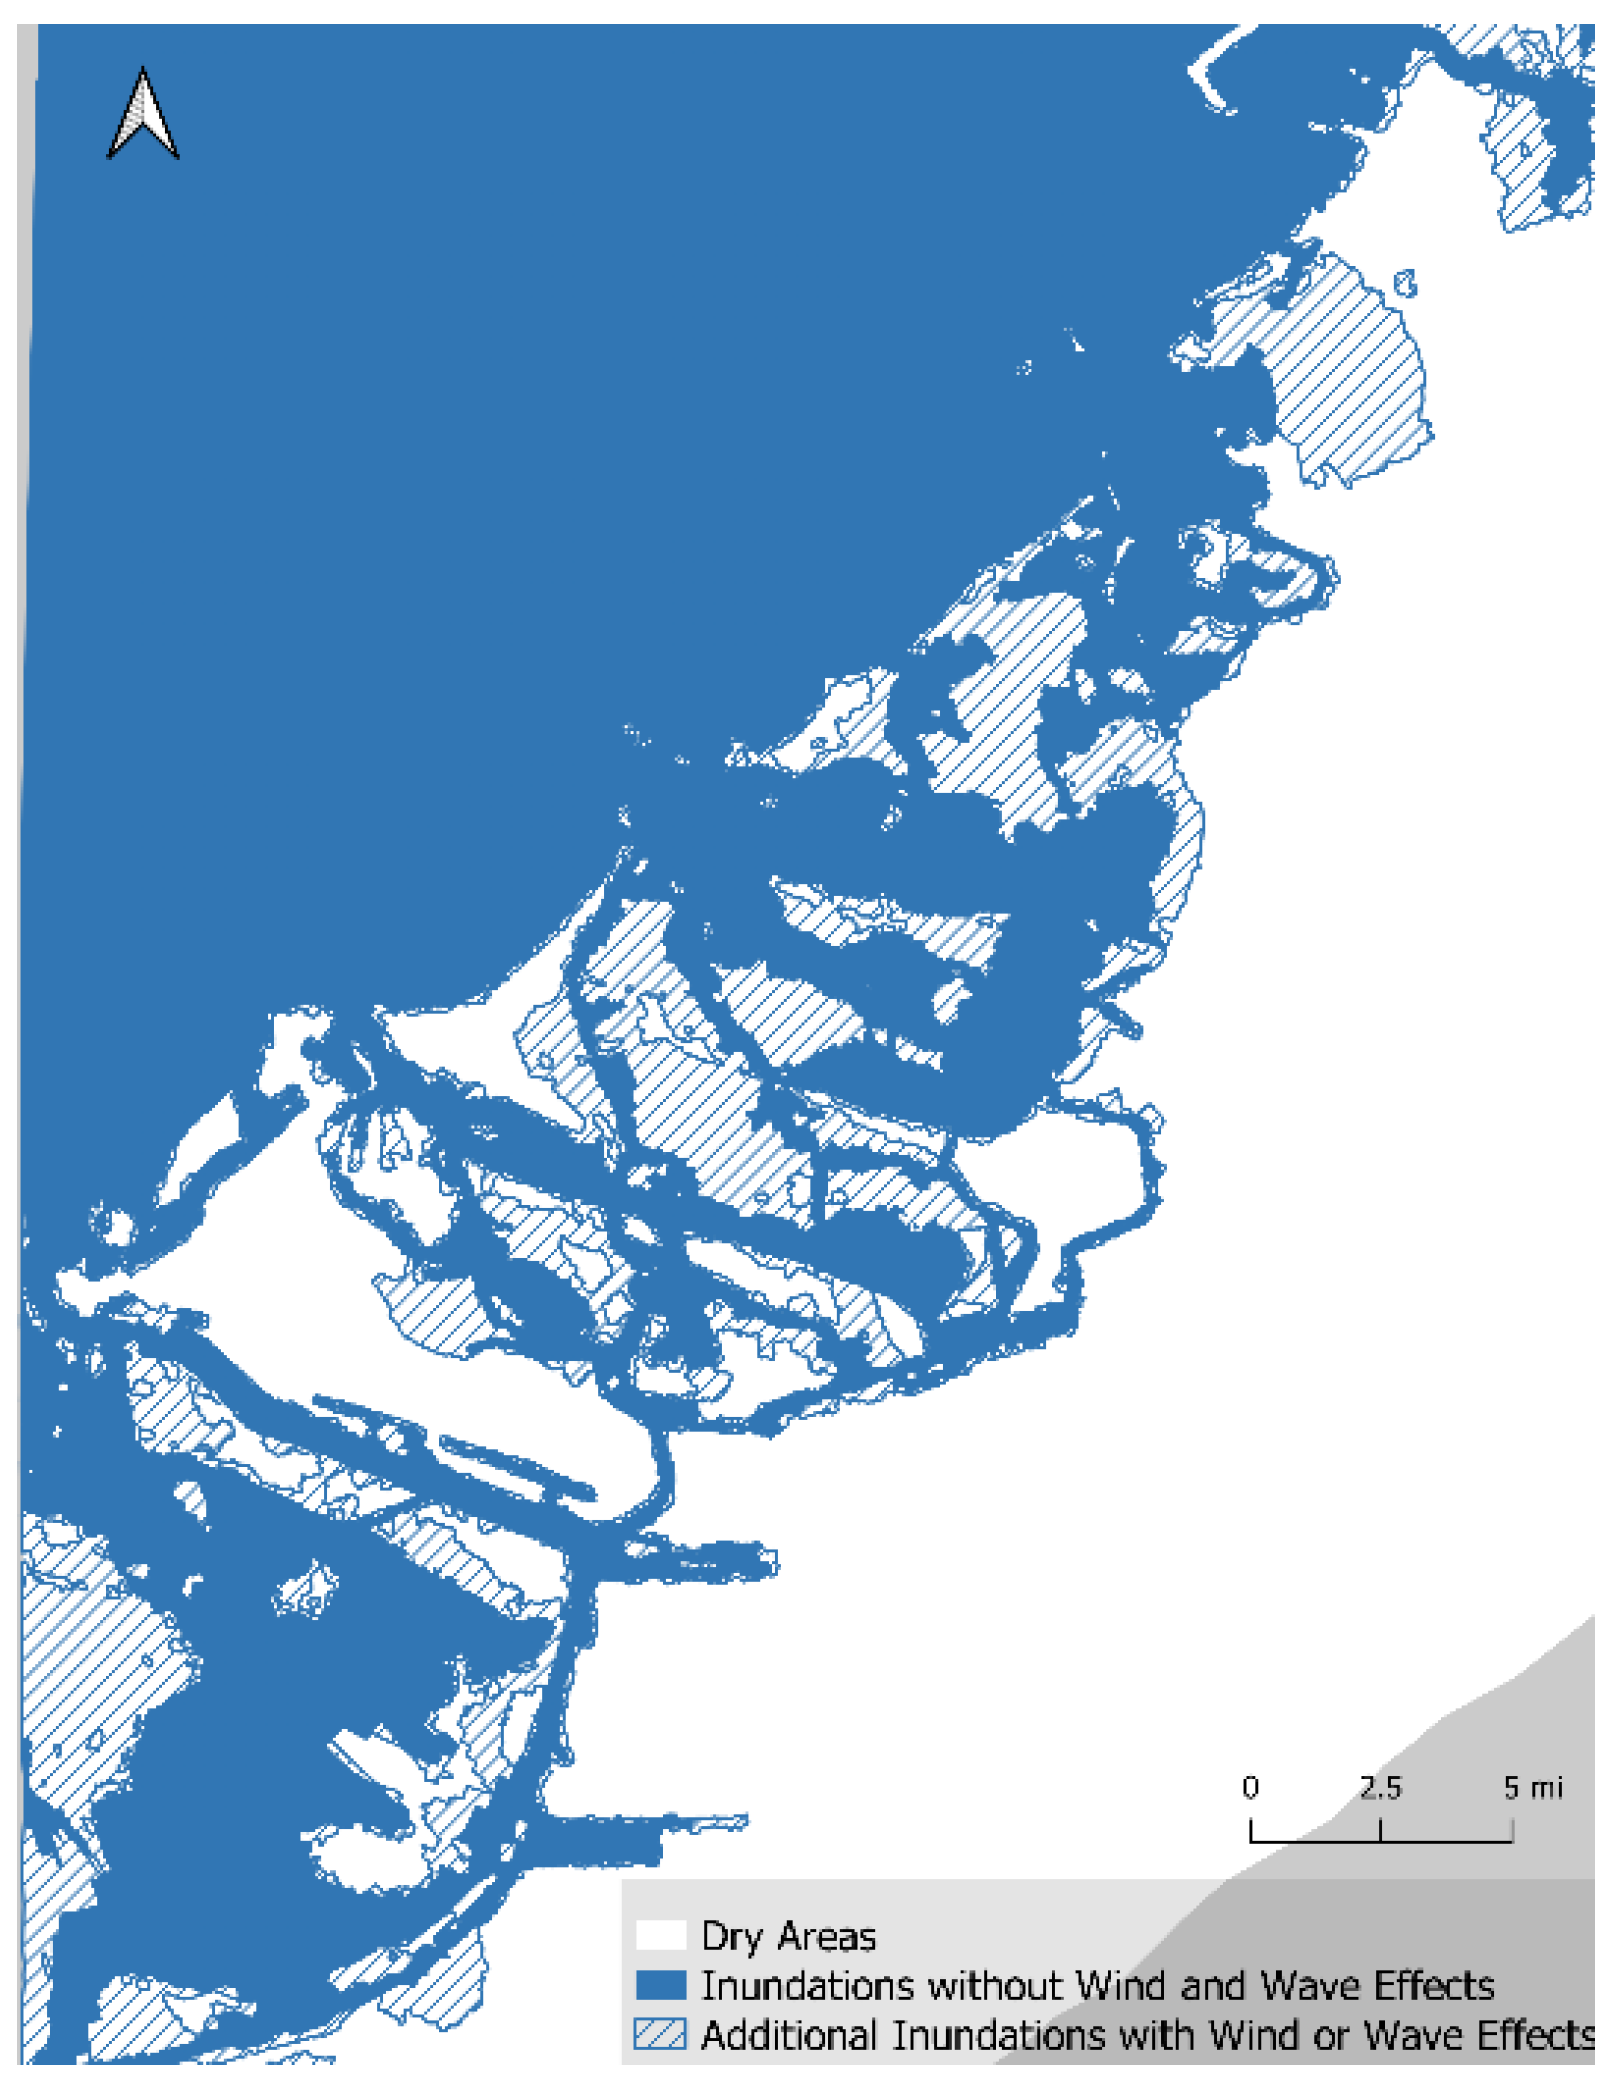
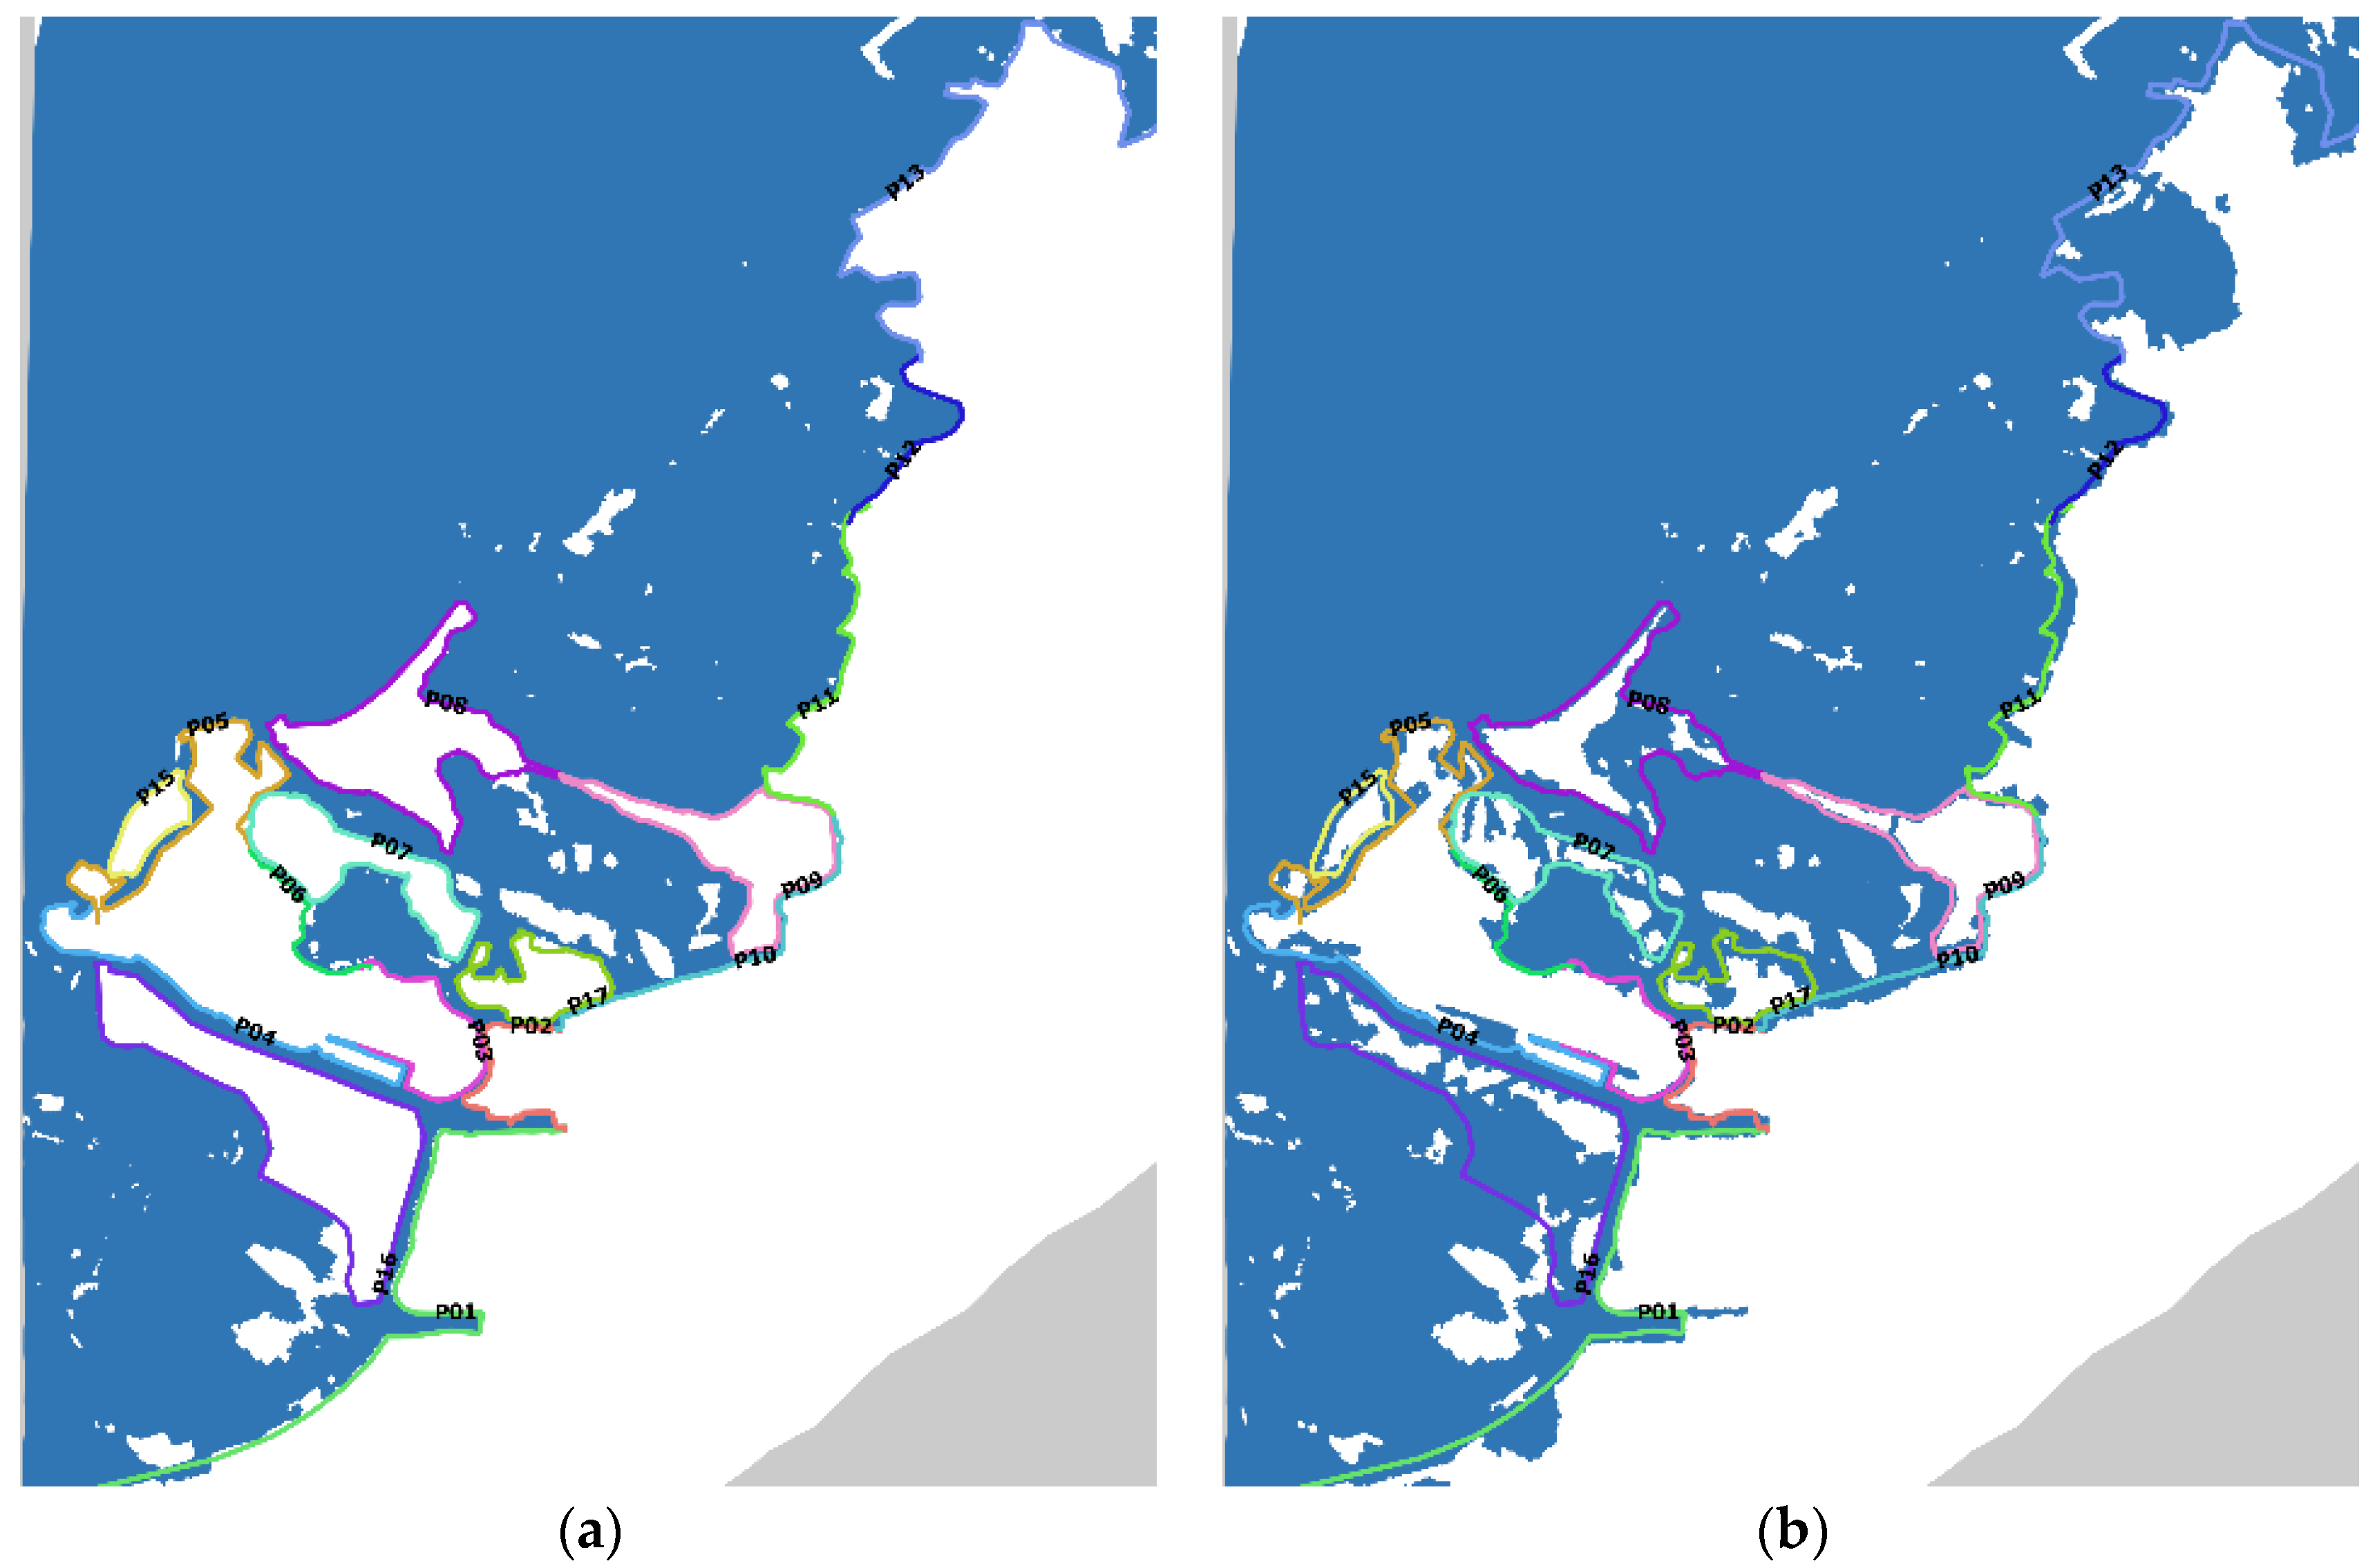
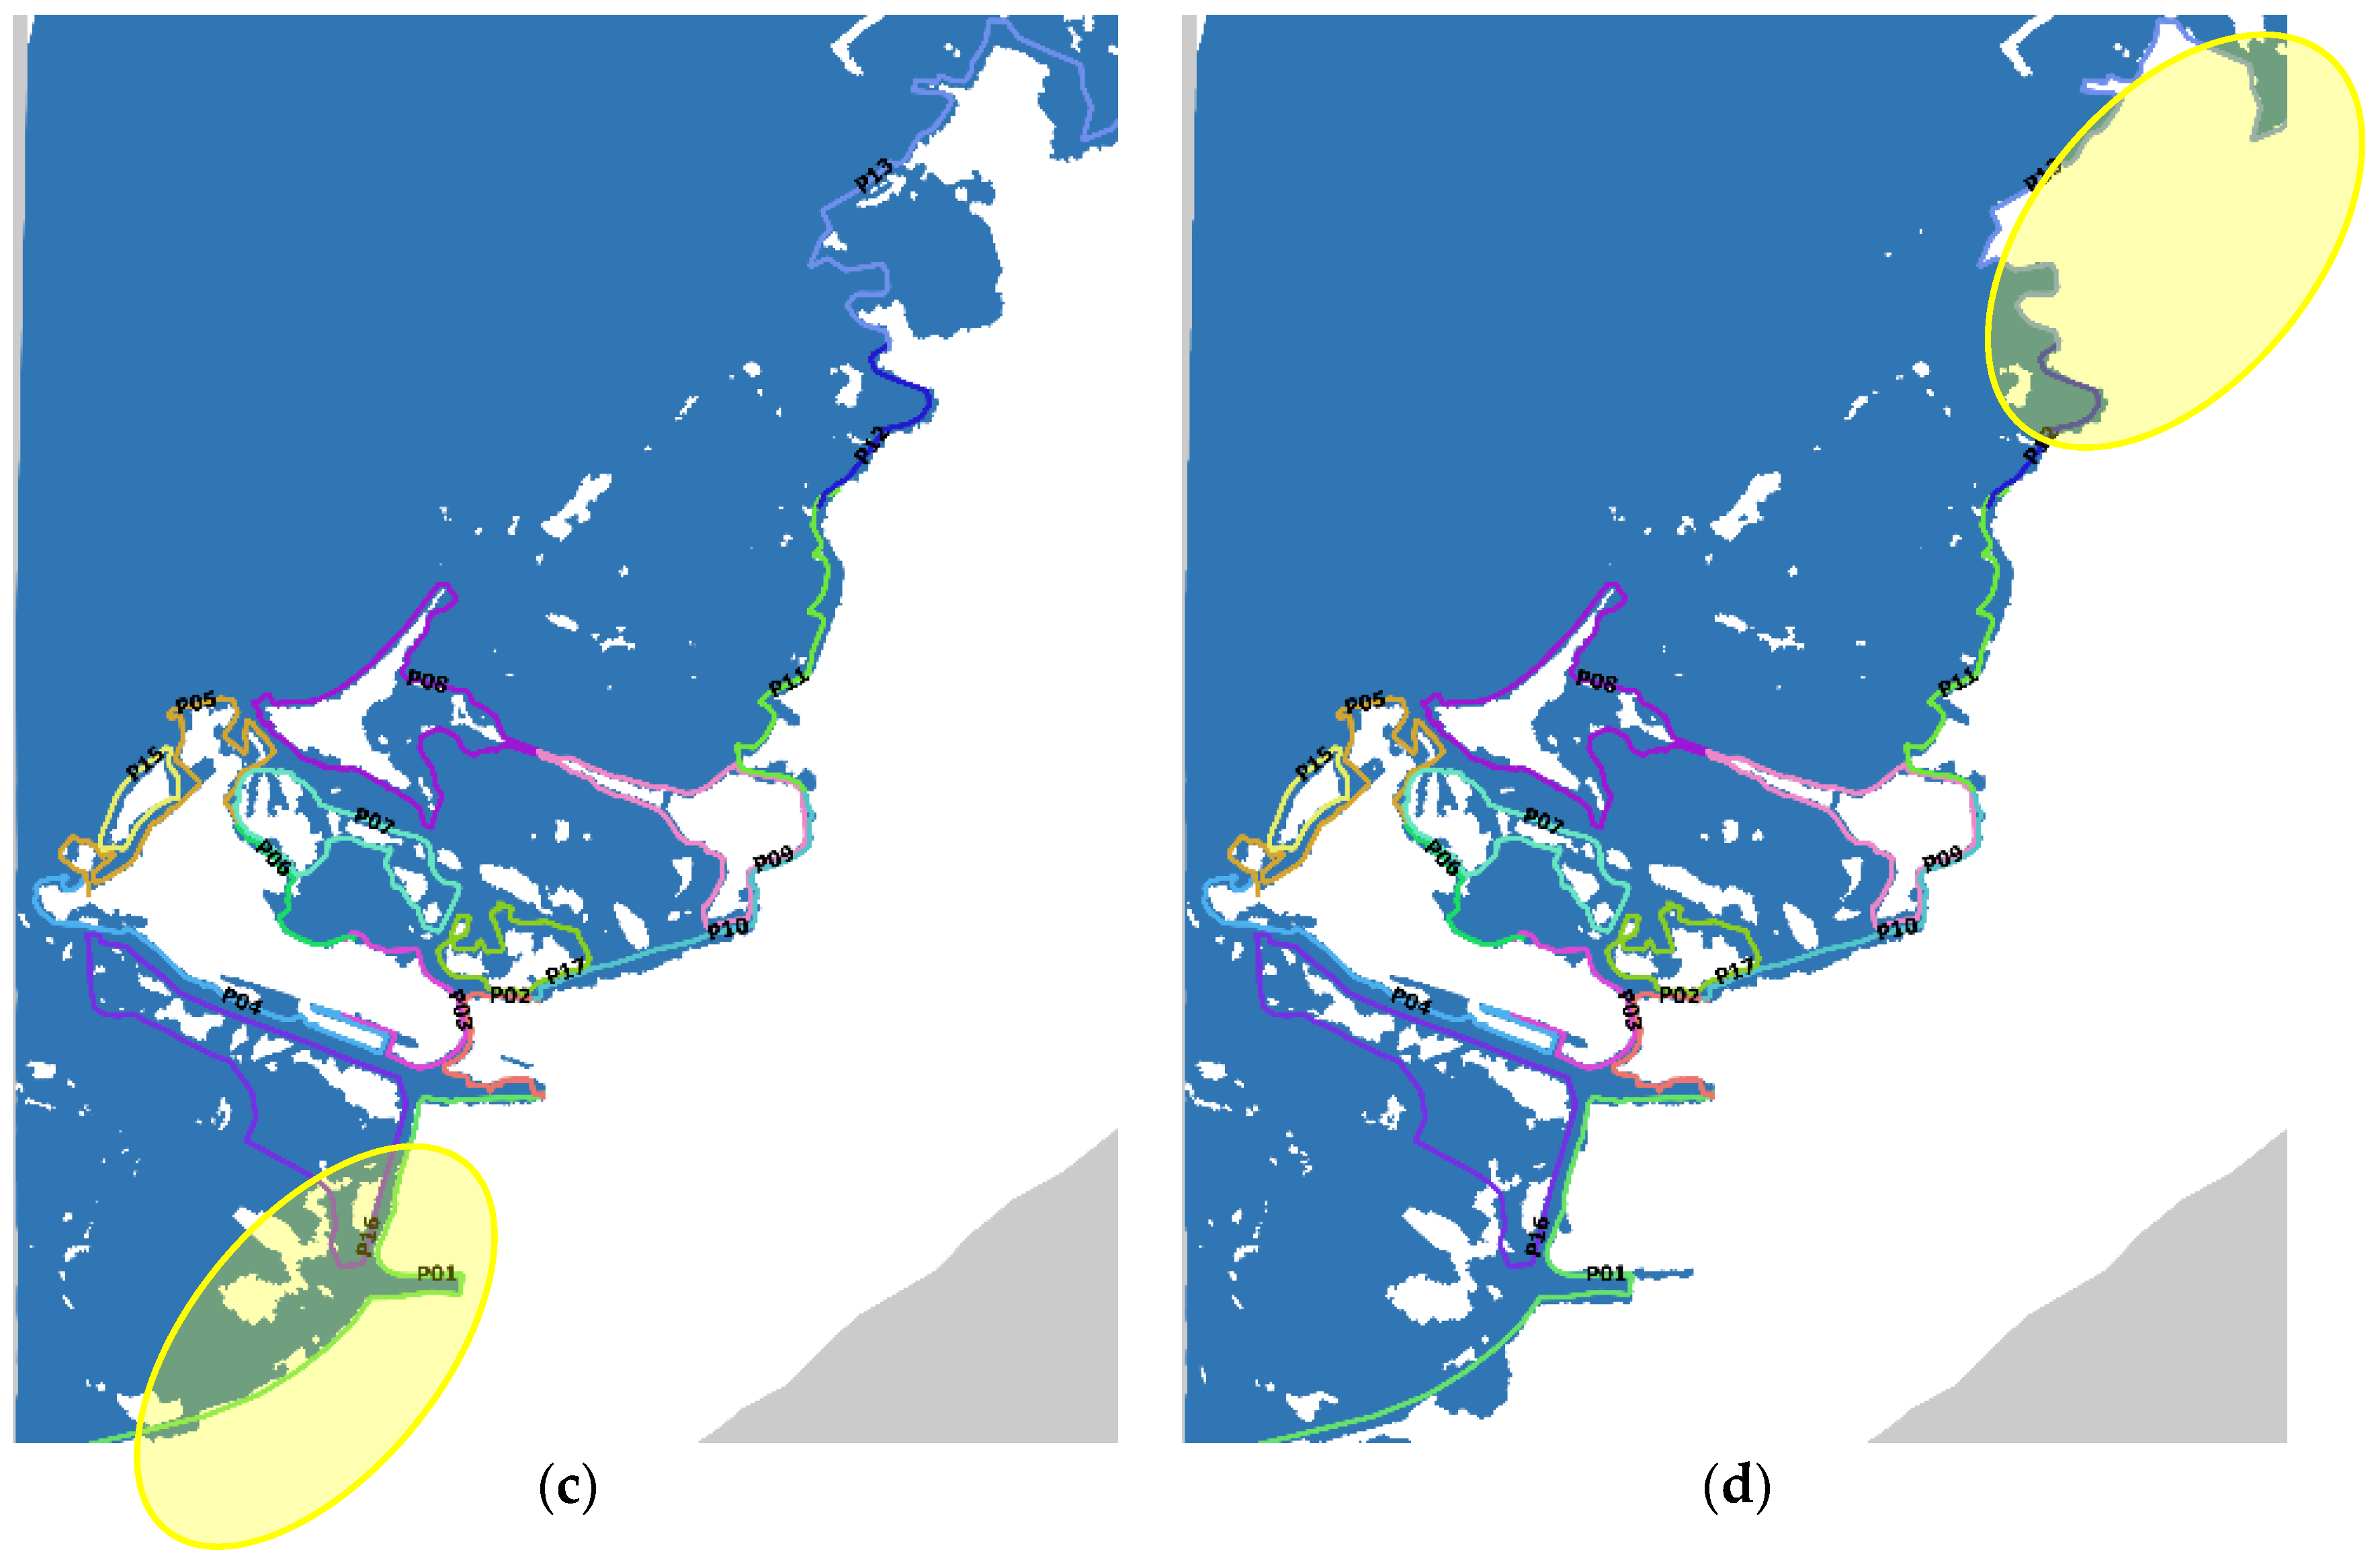
3. Results
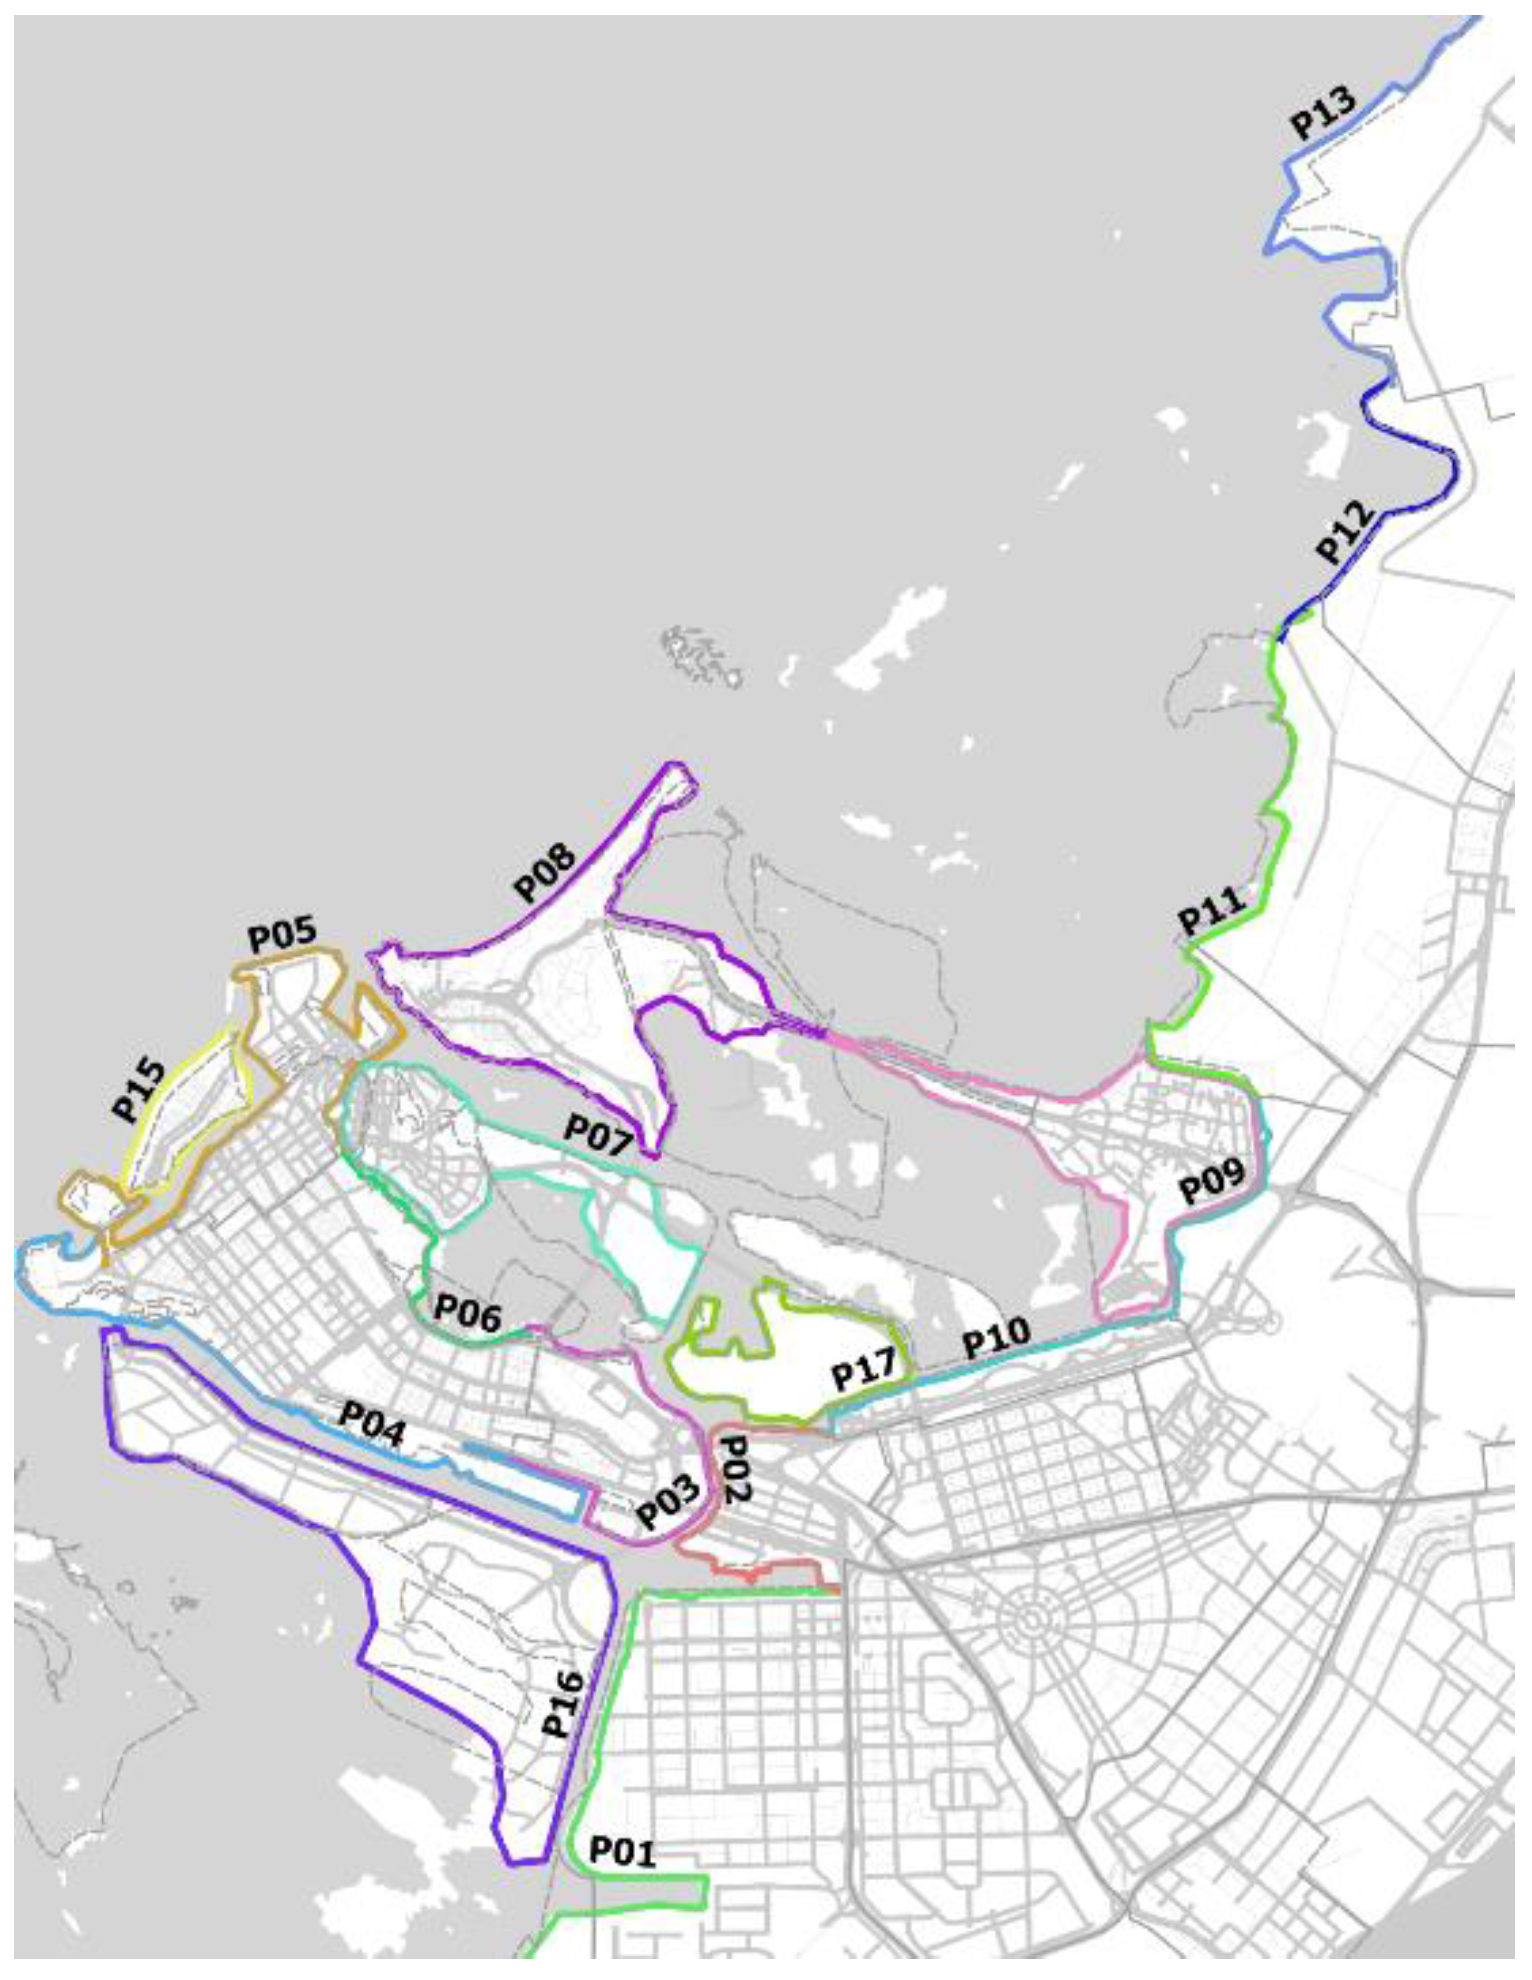
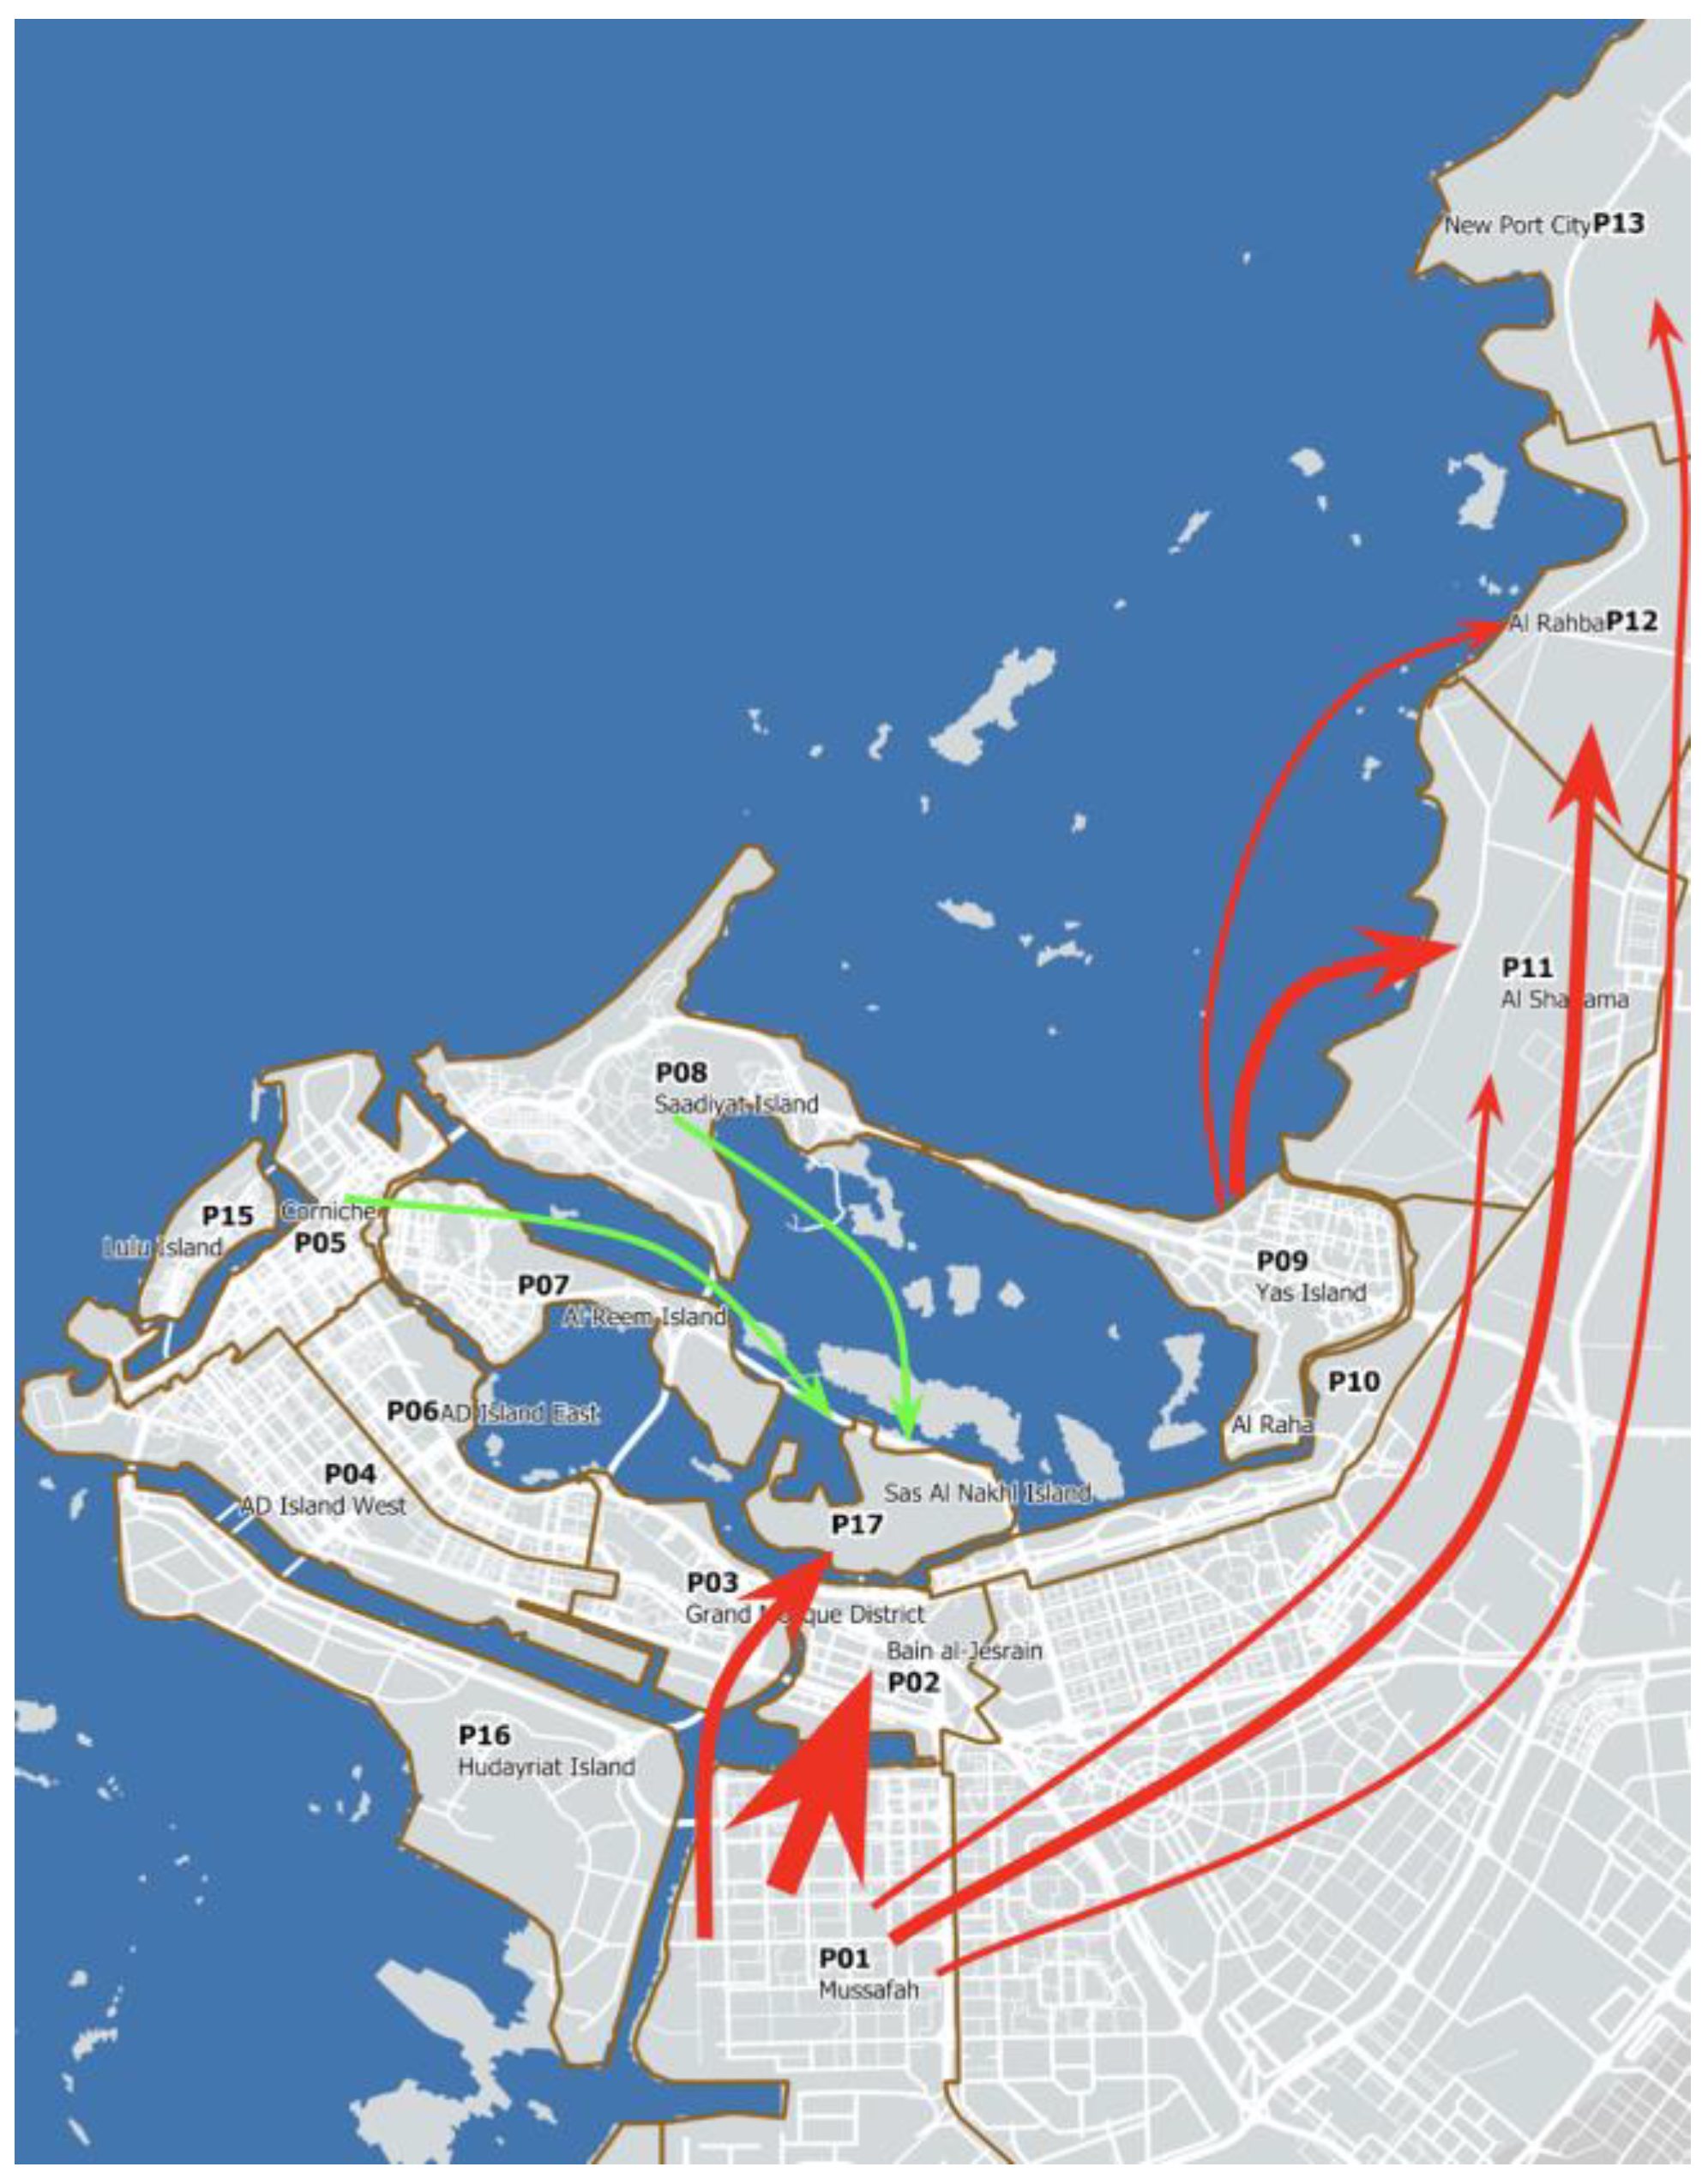
3.1. Protection Scenarios
3.2. Protection Scenario Results
4. Discussion and Conclusions
Author Contributions
Funding
Acknowledgments
Conflicts of Interest
References
- IPCC. Summary for Policymakers. In Climate Change 2021: The Physical Science Basis. Contribution of Working Group I to the Sixth Assessment Report of the Intergovernmental Panel on Climate Change; Masson-Delmotte, V., Zhai, P., Pirani, A., Connors, S.L., Péan, C., Berger, S., Caud, N., Chen, Y., Goldfarb, L., Gomis, M.I., et al., Eds.; Cambridge University Press: Cambridge, UK, 2021; In Press. [Google Scholar]
- Strauss, B.H.; Kulp, S.A.; Rasmussen, D.J.; Levermann, A. Unprecedented threats to cities from multi-century sea level rise. Environ. Res. Lett. 2021, 16, 114015. [Google Scholar] [CrossRef]
- Papakonstantinou, I.; Lee, J.; Madanat, S.M. Game theoretic approaches for highway infrastructure protection against sea level rise: Co-opetition among multiple players. Transp. Res. Part B: Methodol. 2019, 123, 21–37. [Google Scholar] [CrossRef]
- Sea Level Rise Viewer. Available online: https://coast.noaa.gov/digitalcoast/tools/slr.html (accessed on 25 January 2022).
- Hauer, M.E.; Evans, J.M.; Mishra, D.R. Millions projected to be at risk from sea-level rise in the continental United States. Nat. Clim. Change 2016, 6, 691–695. [Google Scholar] [CrossRef]
- Kulp, S.A.; Strauss, B.H. New elevation data triple estimates of global vulnerability to sea-level rise and coastal flooding. Nat. Commun. 2019, 10, 4844. [Google Scholar] [CrossRef]
- Barnard, P.L.; Erikson, L.H.; Foxgrover, A.C.; Hart, J.A.F.; Limber, P.; O’Neill, A.C.; Van Ormondt, M.; Vitousek, S.; Wood, N.; Hayden, M.K.; et al. Dynamic flood modeling essential to assess the coastal impacts of climate change. Sci. Rep. 2019, 9, 4309. [Google Scholar] [CrossRef]
- Jia, G.; Wang, R.-Q.; Stacey, M.T. Investigation of impact of shoreline alteration on coastal hydrodynamics using Dimension REduced Surrogate based Sensitivity Analysis. Adv. Water Resour. 2019, 126, 168–175. [Google Scholar] [CrossRef]
- Wang, R.-Q.; Stacey, M.T.; Herdman, L.M.M.; Barnard, P.L.; Erikson, L. The Influence of Sea Level Rise on the Regional Interdependence of Coastal Infrastructure. Earth’s Future 2018, 6, 677–688. [Google Scholar] [CrossRef]
- Nederhoff, K.; Saleh, R.; Tehranirad, B.; Herdman, L.; Erikson, L.; Barnard, P.L.; van der Wegen, M. Drivers of extreme water levels in a large, urban, high-energy coastal estuary—A case study of the San Francisco Bay. Coast. Eng. 2021, 170, 103984. [Google Scholar] [CrossRef]
- Lubell, M.; Stacey, M.; Hummel, M.A. Collective action problems and governance barriers to sea-level rise adaptation in San Francisco Bay. Clim. Chang. 2021, 167, 1–25. [Google Scholar] [CrossRef]
- Sun, J.; Chow, A.C.; Madanat, S.M. Equity concerns in transportation infrastructure protection against sea level rise. Transp. Policy 2021, 100, 81–88. [Google Scholar] [CrossRef]
- Morim, J.; Vitousek, S.; Hemer, M.; Reguero, B.; Erikson, L.; Casas-Prat, M.; Wang, X.L.; Semedo, A.; Mori, N.; Shimura, T.; et al. Global-scale changes to extreme ocean wave events due to anthropogenic warming. Environ. Res. Lett. 2021, 16, 074056. [Google Scholar] [CrossRef]
- Spicer, P. Tide and Storm Surge Dynamics in Estuaries of Variable Morphology. Master’s Thesis, University of Maine, Electronic Theses and Dissertations, Orono, ME, USA, 2019. Available online: https://digitalcommons.library.umaine.edu/etd/2993 (accessed on 31 May 2020).
- Abdelhafez, M.A.; Ellingwood, B.; Mahmoud, H. Vulnerability of seaports to hurricanes and sea level rise in a changing climate: A case study for mobile, AL. Coast. Eng. 2021, 167, 103884. [Google Scholar] [CrossRef]
- Melville-Rea, H.; Eayrs, C.; Anwahi, N.; Burt, J.A.; Holland, D.; Samara, F.; Paparella, F.; Al Murshidi, A.H.; Al-Shehhi, M.R.; Holland, D.M. A Roadmap for Policy-Relevant Sea level Rise Research in the United Arab Emirates. Front. Mar. Sci. 2021, 8, 907. [Google Scholar] [CrossRef]
- Al Ahbabi, F. Plan Maritime: Abu Dhabi Coastal and Marine Framework Plan; Department of Urban Planning and Municipalities: Abu Dhabi, United Arab Emirates, 2017. [Google Scholar]
- Al Senafi, F.; Anis, A. Shamals and climate variability in the Northern Arabian/Persian Gulf from 1973 to 2012. Int. J. Clim. 2015, 35, 4509–4528. [Google Scholar] [CrossRef]
- Li, D.; Anis, A.; Al Senafi, F. Physical response of the Northern Arabian Gulf to winter Shamals. J. Mar. Syst. 2020, 203, 103280. [Google Scholar] [CrossRef]
- El-Sabh, M.I.; Murty, T.S. Storm surges in the Arabian Gulf. Nat. Hazards 1989, 1, 371–385. [Google Scholar] [CrossRef]
- Reynolds, R.M. Physical Oceanography of the Gulf, Strait of Hormuz, and the Gulf of Oman—Results from the Mt Mitchell Expedition. Mar. Pollut. Bull. 1993, 27, 35–59. [Google Scholar] [CrossRef]
- Johns, W.E.; Yao, F.; Olson, D.B.; Josey, S.A.; Grist, J.P.; Smeed, D.A. Observations of seasonal exchange through the Straits of Hormuz and the inferred heat and freshwater budgets of the Persian Gulf. J. Geophys. Res. Earth Surf. 2003, 108. [Google Scholar] [CrossRef]
- Elshorbagy, W.; Azam, M.H.; Taguchi, K. Hydrodynamic Characterization and Modeling of the Arabian Gulf. J. Waterw. Port Coast. Ocean Eng. 2006, 132, 47–56. [Google Scholar] [CrossRef]
- Alosairi, Y.; Imberger, J.; Falconer, R. Mixing and flushing in the Persian Gulf (Arabian Gulf). J. Geophys. Res. Earth Surf. 2011, 116, C03029. [Google Scholar] [CrossRef]
- Lattemann, S.; Morelissen, R.; van Gils, J. Desalination capacity of the Arabian Gulf—Modeling, monitoring and managing discharges. In Proceedings of the International Desalination Association World Congress on Desalination and Water Reuse, Tianjin, China, 20–25 October 2013. [Google Scholar]
- Chow, A.C.; Verbruggen, W.; Morelissen, R.; Al-Osairi, Y.; Ponnumani, P.; Lababidi, H.M.S.; Al-Anzi, B.; Adams, E.E. Numerical Prediction of Background Buildup of Salinity Due to Desalination Brine Discharges into the Northern Arabian Gulf. Water 2019, 11, 2284. [Google Scholar] [CrossRef]
- Ksiksi, T.; Youssef, T. Sea Level Rise and Abu Dhabi Coastlines: An Initial Assessment of the Impact on Land and Mangrove Areas. J. Ecosyst. Ecography 2012, 2, 115. [Google Scholar] [CrossRef]
- Abu Dhabi Global Environmental Data Initiative (AGEDI). Regional Ocean Modeling Arabian Gulf—Future Scenarios. LNRCCP. CCRG/USP. 2017. Available online: https://agedi.org/item/technical-report-regional-desalination-and-climate-change/ (accessed on 20 April 2020).
- Vieira, F.; Cavalcante, G.; Campos, E. Analysis of wave climate and trends in a semi-enclosed basin (Persian Gulf) using a validated SWAN model. Ocean Eng. 2020, 196, 106821. [Google Scholar] [CrossRef]
- Holleman, R.; Stacey, M.T. Coupling of Sea Level Rise, Tidal Amplification, and Inundation. J. Phys. Oceanogr. 2014, 44, 1439–1455. [Google Scholar] [CrossRef]
- Hughes, M. Coastal Waves, Water Levels, Beach Dynamics and Climate Change; CoastAdapt, National Climate Change Adaptation Research Facility: Gold Coast, Australia, 2016. [Google Scholar]
- Gulf Model Community. Available online: http://www.agmcommunity.org (accessed on 25 January 2022).
- Deltares. Delft3D-FLOW: Simulation of Multi-Dimensional Hydrodynamic Flows and Transport Phenomena, Including Sediments, User Manual. Available online: http://oss.deltares.nl/web/delft3d/manuals (accessed on 22 September 2021).
- Bathymetry data © 2019 EOMAP Bathymetry, All rights reserved.
- TPXO8-Atlas, OSU TPXO Tide Models. Available online: https://www.tpxo.net/global/tpxo8-atlas (accessed on 25 January 2022).
- Egbert, G.D.; Erofeeva, S.Y. Efficient inverse modeling of barotropic ocean tides. J. Atmos. Ocean. Technol. 2020, 19, 183–204. [Google Scholar] [CrossRef]
- Copernicus Climate Change Service (C3S). ERA5: Fifth Generation of ECMWF Atmospheric Reanalyses of the Global Climate. Copernicus Climate Change Service Climate Data Store (CDS). 2017. Available online: https://cds.climate.copernicus.eu/cdsapp#!/home (accessed on 21 February 2020).
- Hersbach, H.; Bell, B.; Berrisford, P.; Hirahara, S.; Horanyi, A.; Muñoz-Sabater, J.; Nicolas, J.; Peubey, C.; Radu, R.; Schepers, D.; et al. The ERA5 global reanalysis. Q. J. R. Meteorol. Soc. 2020, 146, 1999–2049. [Google Scholar] [CrossRef]
- Gulf News. 10-Foot Waves Seen off Dubai, the Highest in 10 Years. 2017. Available online: https://gulfnews.com/uae/weather/10-foot-waves-seen-off-dubai-the-highest-in-10-years-1.1985093 (accessed on 22 September 2021).
- Heidarzadeh, M.; Šepić, J.; Rabinovich, A.; Allahyar, M.; Soltanpour, A.; Tavakoli, F. Meteorological Tsunami of 19 March 2017 in the Persian Gulf: Observations and Analyses. Pure Appl. Geophys. 2020, 177, 1231–1259. [Google Scholar] [CrossRef]
- SWAN. Simulating Waves Nearshore. Available online: https://swanmodel.sourceforge.io/ (accessed on 25 January 2022).
- Holman, R. Extreme value statistics for wave run-up on a natural beach. Coast. Eng. 1986, 9, 527–544. [Google Scholar] [CrossRef]
- Pedregosa, F.; Varoquaux, G.; Gramfort, A.; Michel, V.; Thirion, B. Scikit-learn: Machine Learning in Python. J. Mach. Learn. Res. 2011, 12, 2825–2830. [Google Scholar]
- Abu Dhabi Urban Planning Council. Plan Abu Dhabi 2030. Urban Structure Framework Plan. 2007. Available online: https://www.ecouncil.ae/PublicationsEn/plan-abu-dhabi-full-version-EN.pdf (accessed on 23 September 2021).
- O’Grady, J.G.; Cohen, R.C.Z.; Prakash, M.; McInnis, K.L.; Hoeke, R.K. Wave Overtopping in the City Scale Coupled Hydrodynamic/Hydraulic Numerical Inundation Model: C-FAST. In Proceedings of the Australasian Coasts & Ports 2019 Conference, Hobart, Japan, 10–13 September 2019. [Google Scholar]


| P01 | P02 | P03 | P04 | P05 | P06 | P07 | P08 | P09 | P10 | P11 | P12 | P13 | P14 | P15 | P16 | P17 | |
|---|---|---|---|---|---|---|---|---|---|---|---|---|---|---|---|---|---|
| P01 | −75% | 1% | 1% | 1% | 2% | 1% | 1% | 0% | 2% | 2% | 0% | 1% | 0% | 0% | 1% | 0% | 1% |
| P02 | 22% | −86% | 0% | 1% | 2% | 0% | 0% | −1% | 5% | 6% | 0% | 0% | 0% | 0% | 0% | −1% | 0% |
| P03 | 6% | 0% | −94% | 0% | −3% | 0% | −2% | −3% | 0% | 0% | 0% | 0% | 0% | 0% | 0% | −2% | 0% |
| P04 | 3% | 0% | 0% | −96% | 0% | 0% | 0% | 0% | 1% | 1% | 0% | 0% | 0% | 0% | 0% | 0% | 0% |
| P05 | 6% | 1% | 2% | 2% | −91% | 2% | 2% | −1% | 4% | 3% | −1% | 1% | −1% | 0% | 1% | −2% | 1% |
| P06 | 2% | 0% | −2% | 0% | −1% | −64% | −1% | −1% | 0% | 0% | 0% | 0% | 0% | 0% | 0% | 0% | 0% |
| P07 | 7% | 1% | 2% | 1% | −3% | 1% | −98% | −3% | 1% | 2% | 0% | 1% | 0% | 0% | 1% | −1% | 1% |
| P08 | 5% | 1% | 2% | 1% | −1% | 1% | 2% | −98% | 2% | 3% | 0% | 1% | 0% | 0% | 1% | −1% | 1% |
| P09 | 6% | 1% | 1% | 1% | −1% | 1% | 1% | −2% | −95% | 2% | 0% | 1% | 0% | 0% | 1% | −2% | 1% |
| P10 | 7% | 0% | 1% | 0% | −2% | 0% | 0% | −1% | 0% | −17% | −1% | 0% | 0% | 0% | 0% | −1% | 0% |
| P11 | 9% | 3% | 5% | 4% | 5% | 4% | 5% | 5% | 10% | 6% | −95% | 3% | 1% | 1% | 3% | −5% | 2% |
| P12 | 10% | 1% | 1% | 1% | 6% | 1% | 1% | 1% | 9% | 6% | −1% | −92% | 0% | 0% | 1% | −2% | 1% |
| P13 | 9% | 1% | 4% | 3% | 6% | 2% | 4% | 1% | 6% | 6% | 1% | 2% | −99% | 1% | 1% | −2% | 1% |
| P14 | 7% | 0% | 0% | 0% | 6% | 0% | 0% | 0% | 6% | 2% | 0% | 0% | −6% | −98% | 0% | 0% | 0% |
| P15 | 4% | 0% | 0% | 0% | 0% | 0% | 0% | 0% | 0% | 0% | 0% | 0% | 0% | 0% | −97% | 0% | 0% |
| P16 | 7% | 1% | 1% | 1% | 2% | 1% | 1% | 0% | 3% | 2% | 0% | 1% | 0% | 0% | 1% | −98% | 1% |
| P17 | 13% | 2% | 3% | 2% | −8% | 2% | 0% | −7% | 1% | 4% | 0% | 1% | 0% | 0% | 2% | −3% | −96% |
Publisher’s Note: MDPI stays neutral with regard to jurisdictional claims in published maps and institutional affiliations. |
© 2022 by the authors. Licensee MDPI, Basel, Switzerland. This article is an open access article distributed under the terms and conditions of the Creative Commons Attribution (CC BY) license (https://creativecommons.org/licenses/by/4.0/).
Share and Cite
Chow, A.C.H.; Sun, J. Combining Sea Level Rise Inundation Impacts, Tidal Flooding and Extreme Wind Events along the Abu Dhabi Coastline. Hydrology 2022, 9, 143. https://doi.org/10.3390/hydrology9080143
Chow ACH, Sun J. Combining Sea Level Rise Inundation Impacts, Tidal Flooding and Extreme Wind Events along the Abu Dhabi Coastline. Hydrology. 2022; 9(8):143. https://doi.org/10.3390/hydrology9080143
Chicago/Turabian StyleChow, Aaron C. H., and Jiayun Sun. 2022. "Combining Sea Level Rise Inundation Impacts, Tidal Flooding and Extreme Wind Events along the Abu Dhabi Coastline" Hydrology 9, no. 8: 143. https://doi.org/10.3390/hydrology9080143
APA StyleChow, A. C. H., & Sun, J. (2022). Combining Sea Level Rise Inundation Impacts, Tidal Flooding and Extreme Wind Events along the Abu Dhabi Coastline. Hydrology, 9(8), 143. https://doi.org/10.3390/hydrology9080143