Article

Impact of Climate Change on Water Resources and Crop Production in Western Nepal: Implications and Adaptation Strategies

1
Department of Ecology and Conservation Biology, Texas A&M University, College Station, TX 77843, USA
2
CIMMYT International Maize and Wheat Improvement Center, Kathmandu 44600, Nepal
3
IWMI International Water Management Institute, Lalitpur 44600, Nepal
4
CIMMYT International Maize and Wheat Improvement Center, Dhaka 1212, Bangladesh
*
Author to whom correspondence should be addressed.
Hydrology 2022, 9(8), 132; https://doi.org/10.3390/hydrology9080132
Submission received: 15 June 2022 / Revised: 12 July 2022 / Accepted: 18 July 2022 / Published: 26 July 2022
(This article belongs to the Section Hydrology–Climate Interactions)

Abstract

:
Irrigation-led farming system intensification and efficient use of ground and surface water resources are currently being championed as a crucial ingredient for achieving food security and reducing poverty in Nepal. The potential scope and sustainability of irrigation interventions under current and future climates however remains poorly understood. Potential adaptation options in Western Nepal were analyzed using bias-corrected Regional Climate Model (RCM) data and the Soil and Water Assessment Tool (SWAT) model. The RCM climate change scenario suggested that average annual rainfall will increase by about 4% with occurrence of increased number and intensity of rainfall events in the winter. RCM outputs also suggested that average annual maximum temperature could decrease by 1.4 °C, and average annual minimum temperature may increase by 0.3 °C from 2021 to 2050. Similarly, average monthly streamflow volume could increase by about 65% from March–April, although it could decrease by about 10% in June. Our results highlight the tight hydrological coupling of surface and groundwater. Farmers making use of surface water for irrigation in upstream subbasins may inadvertently cause a decrease in average water availability in downstream subbasins at approximately 14 %, which may result in increased need to abstract groundwater to compensate for deficits. Well-designed irrigated crop rotations that fully utilize both surface and groundwater conversely may increase groundwater levels by an average of 45 mm from 2022 to 2050, suggesting that in particular subbasins the cultivation of two crops a year may not cause long-term groundwater depletion. Modeled crop yield for the winter and spring seasons were however lower under future climate change scenarios, even with sufficient irrigation application. Lower yields were associated with shortened growing periods and high temperature stress. Irrigation intensification appears to be feasible if both surface and groundwater resources are appropriately targeted and rationally used. Conjunctive irrigation planning is required for equitable and year-round irrigation supply as neither the streamflow nor groundwater can provide full and year-round irrigation for intensified cropping systems without causing the degradation of natural resources.

1. Introduction

Estimates suggest that only about 4.7% of available water in Nepal has been effectively utilized due to spatial and temporal variability of water resources. These resources differ significantly in the mid-hills, in higher altitudes with more water table depth, and in the Terai at lower altitudes with less water table depth [1]. About 80% of rainfall in Nepal, which is the main source of groundwater recharge, occurs during the months of June to September. This leaves the remaining months severely dry. The majority of agricultural operations in Nepal are dependent on monsoon rainfall with onlyaround 20% farms having access to year-round irrigation, of which 50% is supplied by groundwater [2,3]. Recent studies and policy imperatives however suggest that there may be considerable untapped potential for groundwater irrigation in Nepal [1,4]. There remains considerable uncertainty, however if surface nor groundwater can provide sufficient and year-round irrigation for intensified cropping systems in Nepal with groundwater only; irrigation development may therefore require conjunctive use of both ground and surface water sources.
Climate change is a matter of concern for hydrologists, climatologists, environmentalists, and agronomists as it is anticiapted to have and increasingly serious impact on water resources, infrastructure, agriculture, biodiversity and ecosystem functioning, and human health [5,6,7,8,9]. Although climate change is experienced globall, the degree of its impact varies considerably from region to region [10,11]. Climate change is anticipated to be particularly very severe in areas where the socio-ecological systems are highly dependent on rainfall and/or stream flow, including areas with climatic conditions such as Nepal [12,13]. Nepal is highly vulnerable to climate change due to its rugged mountainous topography, extreme climatic conditions, frequent climatic hazards, the low capacity of its poor populations to invest in adaptation strategies, and political conflict and governance challenges [14]. These challenges extend to western Nepal, a region in which international donors and government have both stressed the need for irrigation development.
Previous climate change studies conducted in the Babai River watershed in western Nepal indicated that average annual temperature, rainfall, and river flow are likely to increase by 1.5 °C to 4.7 °C, 15% to 25%, and 24% to 37%, respectively, throughout the twenty-first century [15]. Although average annual rainfall is likely to increase, increased drought during winter months and more intense rainfall during the monsoon season are predicted over the Indian sub-continent [16,17,18]. Nepal is already experiencing the negative effect of climate change; this includes as a variability in temperature and precipitation, overbank flooding from snow-fed rivers, amd variability in available river and stream water quantity [19]. Vital sectors such as agriculture, forestry, and biodiversity conservation that are directly related with peoples’ livelihoods are also impacted by the changing climate [20].
Agriculture is the main source of income for the people in Nepal, engaging almost two-thirds of the population and contributing around one-third of the national gross domestic product [21,22]. Extreme weather events such as high rainfall days, drought, and heat waves are likely to impact the hydro-climatology of Nepal and consequently reduce crop productivity. Previous studies show that agricultural production in this area is highly affected by climate change manifest in the form of extreme weather events [23,24,25]. Such impacts have been compounded rural out-migration, resulting in labor shortages that have further aggravated the management of natural resources [26]. Moreover, the recent institutionalization of a federal system of governance has introduced challenges with morr rapid policy formulation and implementation, including but not limited to natural resources management [27].
Most the agricultural practices in Nepal are rainfed and thus crop yield is highly dependent on sufficient and timely precipitation. Although average annual precipitation is about 1600 mm, rainfall distribution is not even throughout the country [15]. Annual precipitation in varies from as low as 150 mm in Manang district to as high as 5000 mm in Kaski district [28]. About 80% of Nepal’s precipitation is received during the monsoon; during just four months from June to September [15,17,29]. In addition to snowmelt, the amount and timing of rainfall affect groundwater recharge and river flow, which consequently affects ground and surface water irrigation potential [30,31]. Combined with these climatic and hydrological challenges, Nepali farmers face obstacles including maintaining sufficient nutritent suppy to crops, in accessing quality seeds, and in managing pests and diseases, in addition to market challenges [32]. Groundwater governance management is also challenged by a lack of clearly defined roles and responsibilities for new federal-, provincial-, and district-level institutions, limited governmental investment capacity, and hurdles to vertical and horizontal coordination among state and non-state agencies. Further challenging the use of groundwater, Nepal has considerable variation in water table depth that is associated in part with topography [33]. Limited understanding of groundwater distribution and flow in the hills and mountains further complicates technical and governance challenges to the use of groundwater for irrigation [34].
Thus, to manage available water resource efficiently and support sustainable agricultural intensification, the impact of climate change on water resources and crop production needs to be analyzed. General circulation models (GCMs), mathematical representations of the earth’s atmosphere, are generally used to simulate future climate scenarios. Climate change scenarios derived from GCMs can provide reliable information regarding historical, current, and future climate trends over long periods. As such, they they are mostly used for predicting the future climates [35]. Regional climate models (RCMs) that have a higher spatial resolution compared to GCMs are more suitable for a mountainous region like Nepal [36]. Climate data simulated by aCORDEX RCM, NOAA_RegCM4, has been widely used for driving hydrological conditions in sumulations of various mountainous basins [37,38,39]. Similarly, Hydrologic models like the Soil and Water Assessment Tool (SWAT) model have been applied broadly in numerous watersheds to predict the impacts of climate change on hydrology and water availability using climate data obtained from GCMs and RCMs [40,41].
In Nepal, SWAT has been applied in climate change impact assessment on hydrology and water resources in watersheds including the Mahakali, Karnali, West Rapti, Babai, Bagmati, and Koshi basins [15,40,42,43,44,45,46]. However, these studies focused mainly on the impact of climate change on streamflow, groundwater resources, and generalized water availability. The impact of climate change on irrigation sustainability and crop intensification has conversely not been systematically assessed [42]. To address this knowledge gap, potential adaptation options were explored by applying the SWAT model and bias-corrected RCM data to simulate the effect of climate change and management scenarios on groundwater recharge rate, surface runoff, and crop productivity during near term (2021 to 2035), and mid-term (2035 to 2050) futures under the RCP 4.5 emissions scenario. The management scenarios implemented in this study, based on a combination of crop suitability, crop diversification potential, and market access, were developed through a participatory approach.

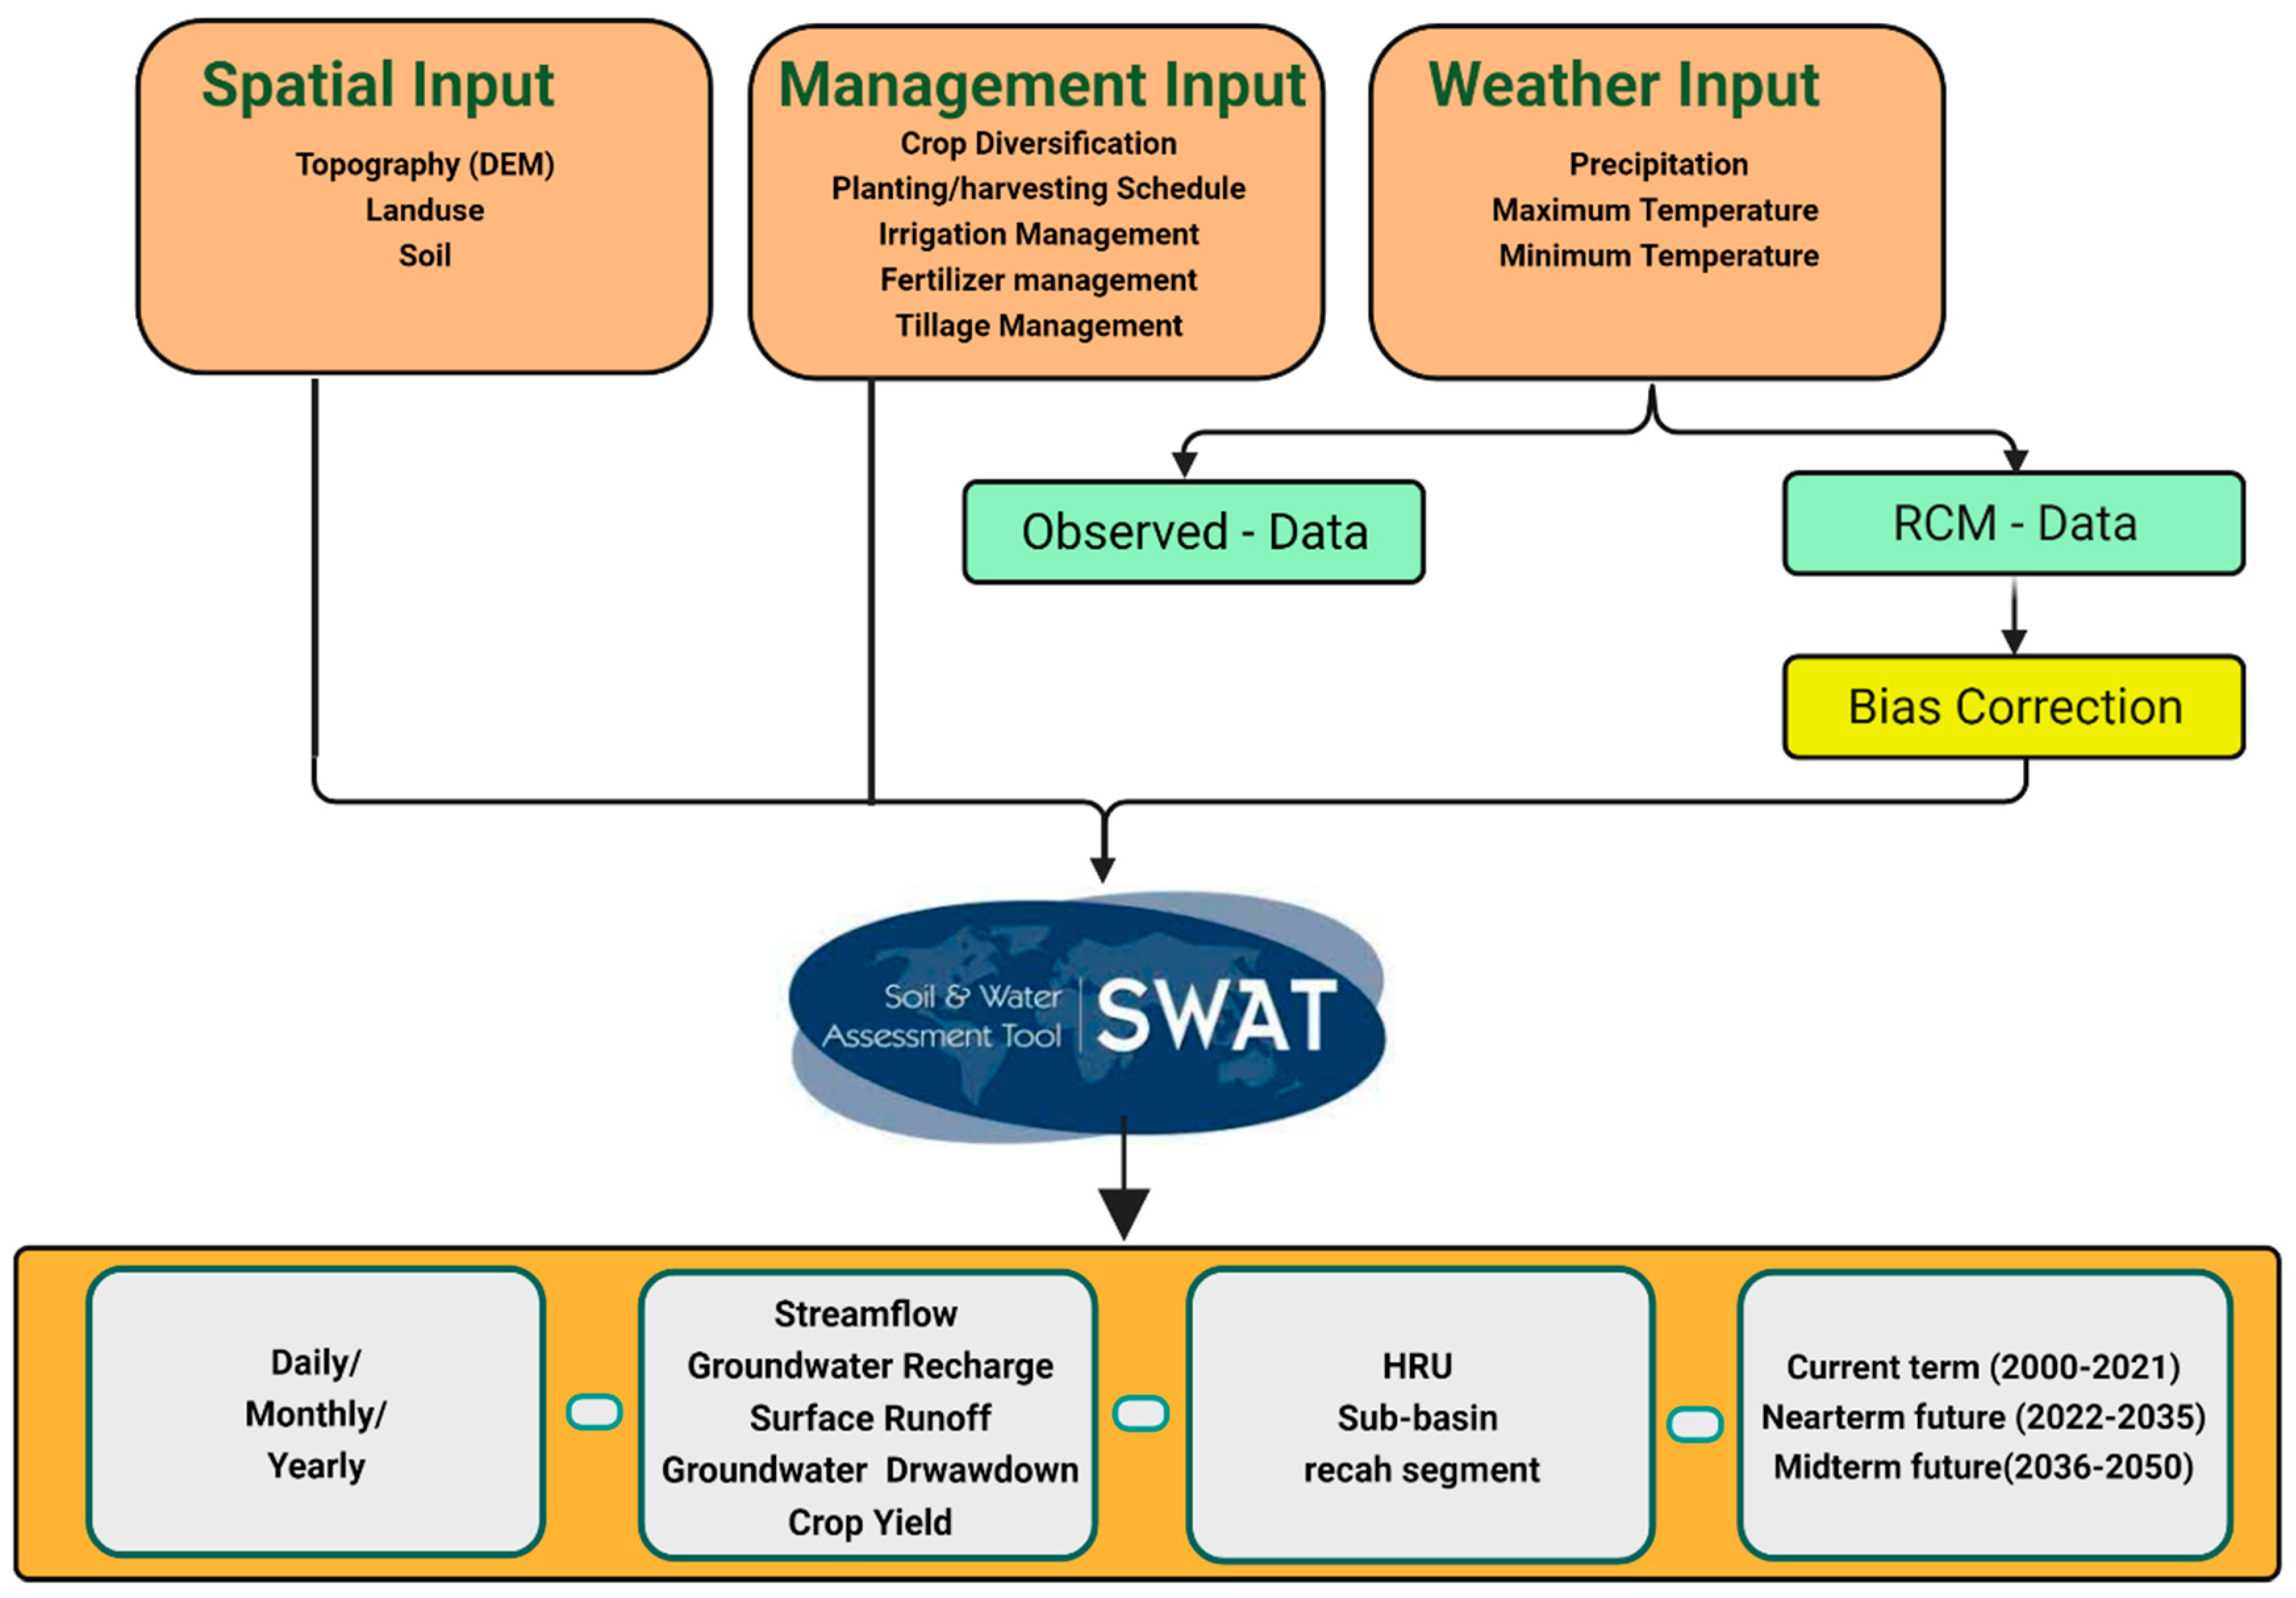
2. Materials and Methods
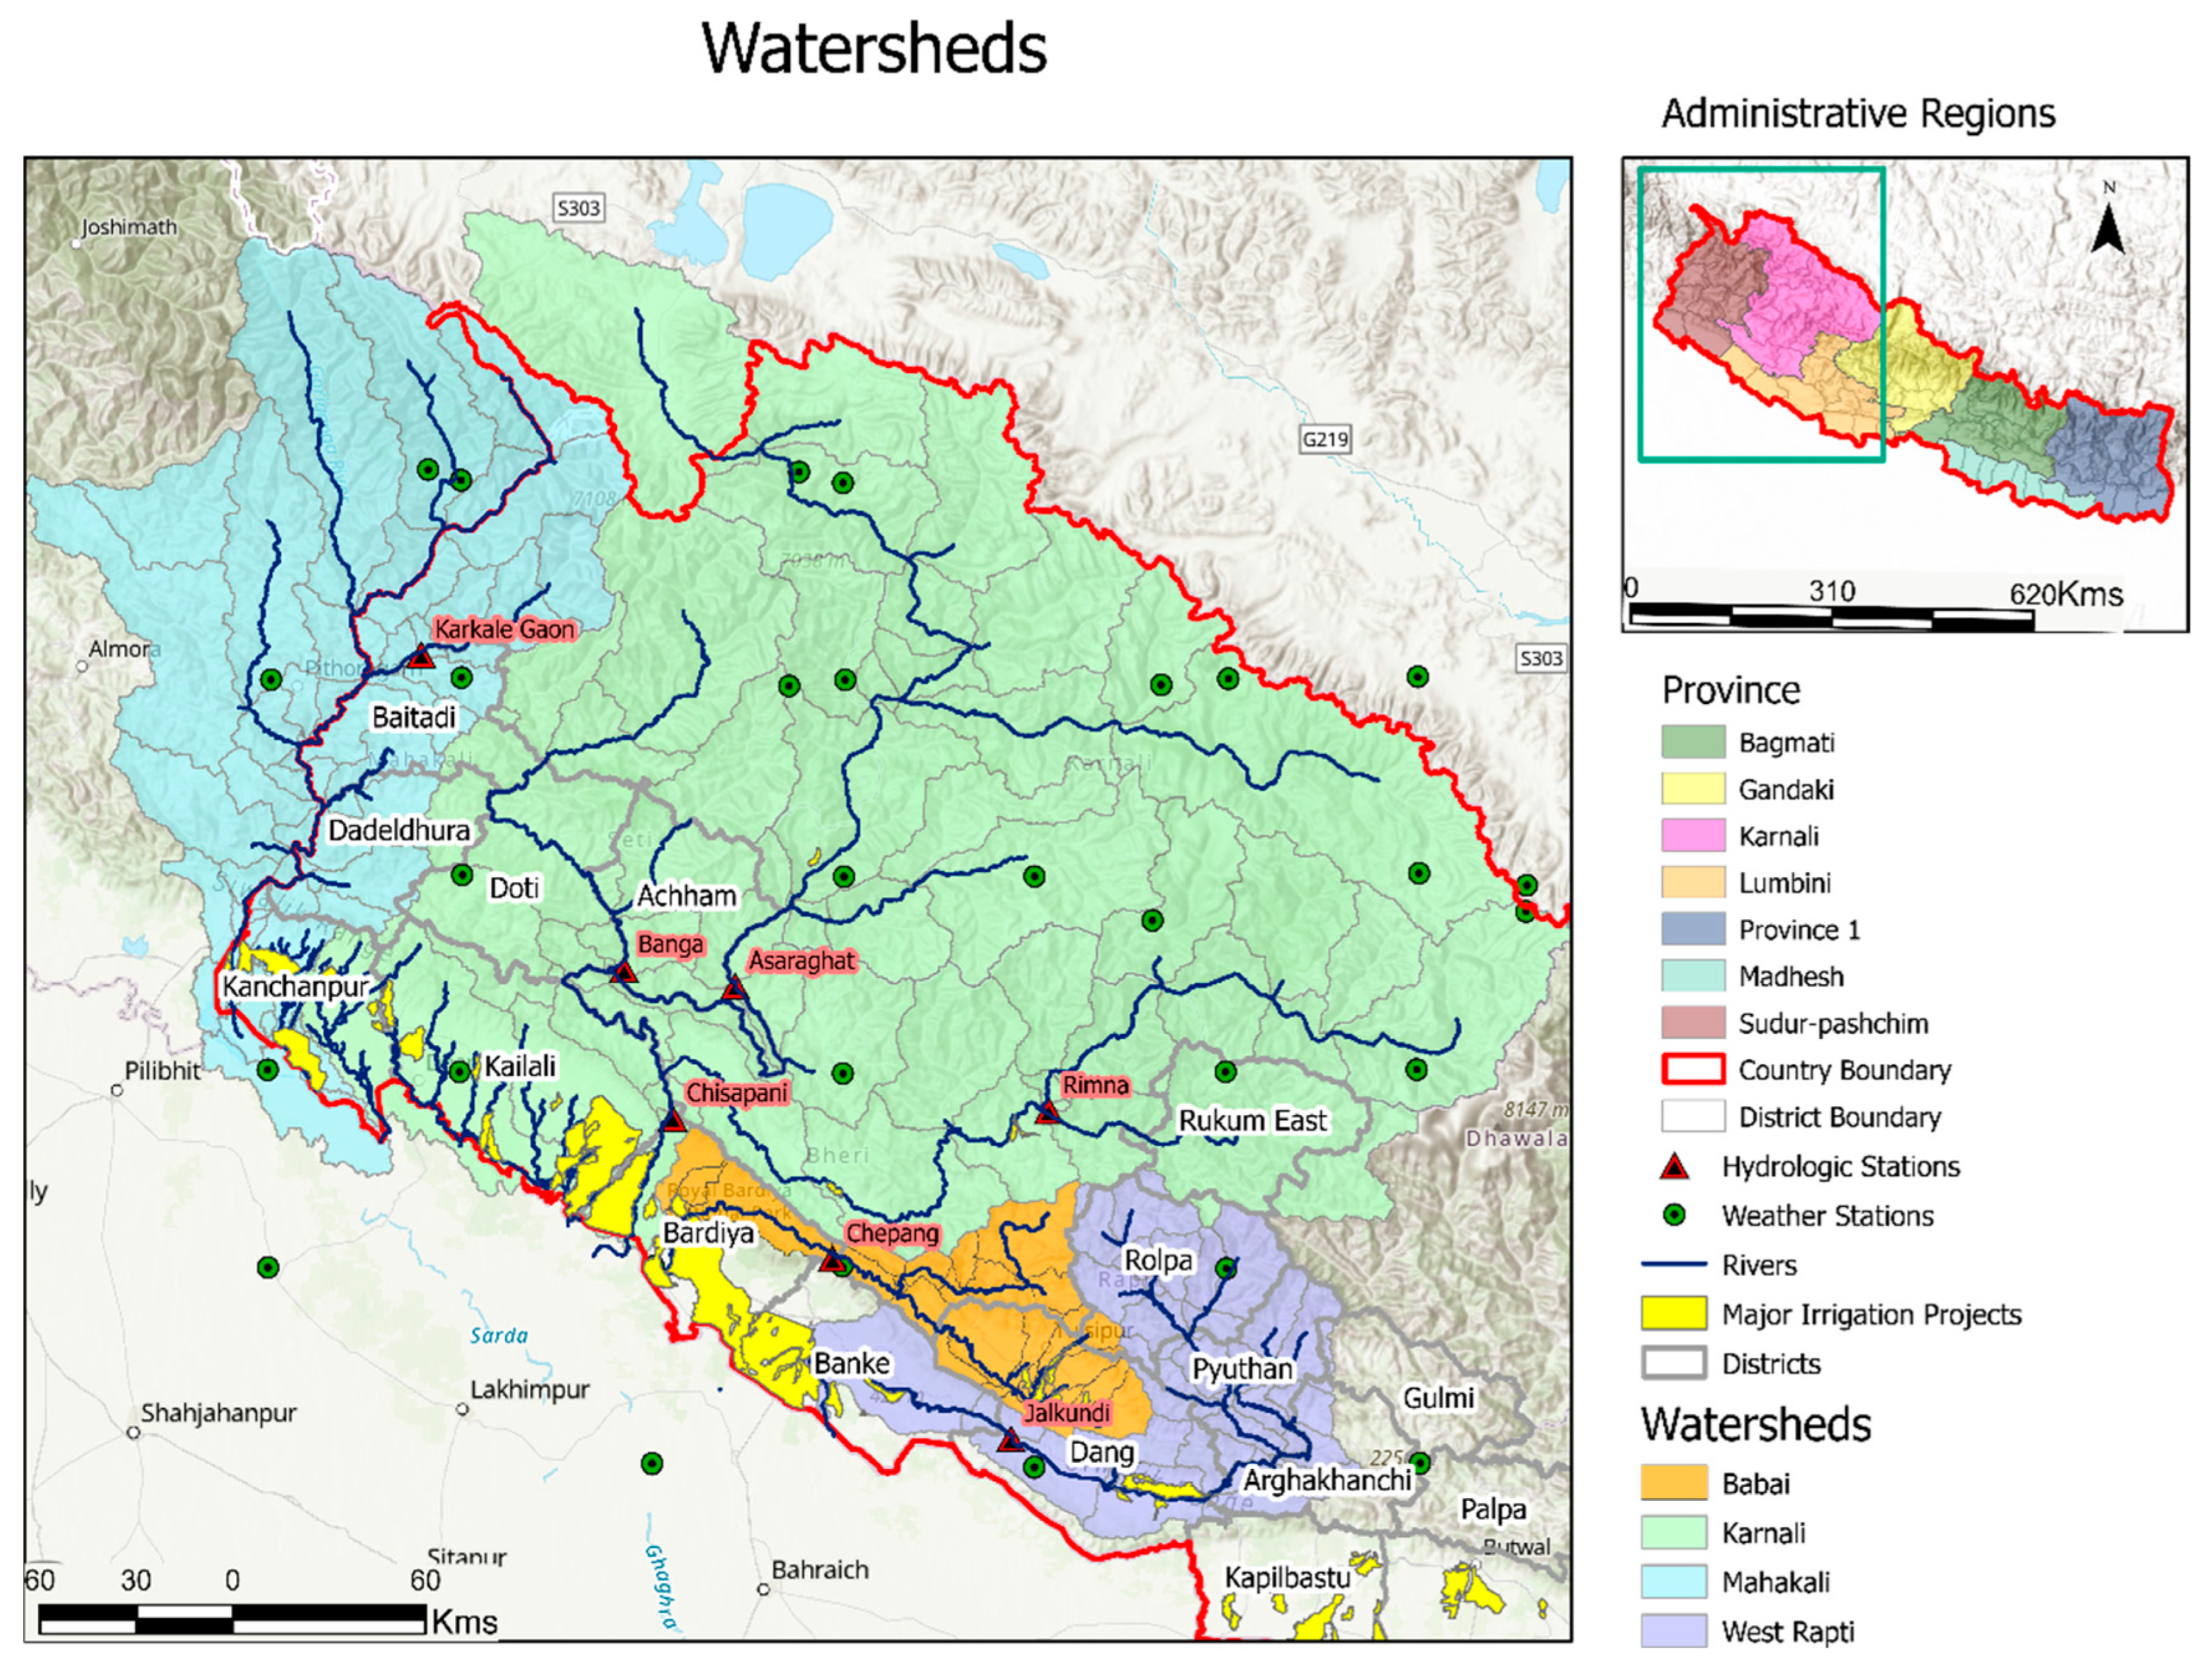
2.1. Study Area

Four watersheds—Mahakali, Karnali, Babai, and West Rapti (Figure 1) in western Nepal were selected for this study as they cover both the mid-hills and Terai regions. They also both feature surface and groundwater irrigation, and experience climate shocks. Among them, Mahakali and Karnali watersheds drain the hilly (Siwalik hills, mid-hill, and snow fed high hills) as well as plain regions (Terai) in Sudurpaschim and Karnali provinces. In comparison, the Babai and West Rapti watersheds drain only the mid-hills and Terai region in Lumbini Province. The Siwalik hills are also known as the “Chure” hills and extend from the Indus River in Pakistan to the Brahmaputra River in India covering about 12% of Nepal’s land area. The Chure hills also have a vital role in the conservation of surface and ground water resources.
The Mahakali watershed covers hilly and Terai plains in Sudurpaschim provinces. The Mahakali River originates from Uttarakhand province in India and flows along the Nepal–India border, with one third of its drainage area in Nepal and two thirds in India (Figure 1). Similarly, the Karnali River, originating on the Tibetan Plateau in China, drains a large area of Karnali province and some areas of Lumbini and Sudurpaschim provinces. The Babai River conversely originates in the inner Terai in the Dang valley. It drains portions of Dang and Bardiya districts of Lumbini Province. Lastly, the West Rapti River originates on the ridge of a mountain and the Chure range. It initially flows toward the east and then flows toward south-west, and drains portion of Rolpa, Pyuthan, Argakhanchi, Dang and Banke districts of Lumbini Province.
About 70% of the study watersheds are covered by forest and about 20% by agriculture. Rice is the major monsoon season crop and wheat is the primary winter crop grown together in a rotational system that predominates in the Terai plains. Maize is the major crop in mid-hills which is also suitable in Terai during the winter and spring season. Along with rice, wheat, and maize, mungbean, lentils, and vegetables are also grown in a certain portion of the watershed. The percentage of irrigated land in the watersheds ranges from 3% to 10% of the total land area.
The elevation of the study area ranges from less than 100 m to 8000 m above mean sea level. The major physiographic regions include the Terai (below 700 m), the Siwalik-hills (700 to 1400 m), the mid-hills (1400 to 5000 m), and mountainous region (above 5000 m) [12,47]. The study region has a sub-tropical climate in the Terai, a warm temperate climate in the lower mid-hills, a cool temperate climate in the upper mid-hills, and an alpine climate in the higher mountainous region. Most of the rainfall is received from June to September [15,17,29]. Although the annual precipitation received by the study area may appear to be abundant, the distribution of rainfall is highly uneven both temporally and spatially due to the monsoon and extreme topography.

2.2. Hydrological Model and Data

SWAT is a physically based, continuous-time step semi-distributed model capable of simulating the effects of land management practices on water availability, sediment yield, and agricultural production in different types of watersheds ranging from small field scale to large river basin scale. SWAT is capable of working with a variety of land-use, soil types, and land management practices [48]. The major SWAT outputs include the amount of water (streamflow), sediments, nutrients, and crop yield at the field, sub-watershed, and watershed scales. The SWAT modeling process includes three phases: model set-up, calibration, and validation. After completing these three phases, the model can be used to evaluate alternative management scenarios [49,50,51,52]. SWAT is therefore generally suitable for a wide range of watersheds located in both sub-tropical and alpine climatic regions of Nepal [42].
SWAT was set up using a Digital Elevation Model (DEM) [53], Land Use-Land Cover (LULC) [54,55], soil [56], and weather data [57,58]. Crop management data were obtained and distilled into an average for each crop from farmer observations (n = 1043) from the Cereal Systems Initiative for South Asia (CSISA) project’s (https://csisa.org/ (accessed on 15 August 2021)) crop management diagnostic database. Although rice and wheat were the most cultivated cereal crops in the study area, we also included vegetables, lentils, maize, and mung in our scenario. Crop management data were validated through discussion with agricultural experts working in the study area.
In SWAT, the Curve Number (CN) method was applied for surface runoff estimation. This method is conceptually simple and is regarded as a standard procedure to estimate runoff from rainfall. Similarly, the Hargreaves method was included to derive potential evapotranspiration (PET) estimates since it required only a maximum and minimum temperature as an input. This is in contrast to Priestley–Taylor, and Penman–Monteith methods that requiring additional inputs including solar radiation data that are challenging to resource in data-scarce environments such as Nepal. Elevation bands were defined for the Mahakali, Karnali, and West Rapti watersheds, where snowfall occurs at higher altitudes, and parameters such as precipitation lapse rate (PLAPS) and temperature lapse rate (TLAPS) were specified according to elevation. PLAPS is a parameter used to adjust precipitation and TLAPS is a parameter to adjust temperature according to change in elevation [48].
The calibration (1990–2000) and validation (2001–2010) of SWAT for streamflow was conducted for all four watersheds. Streamflow calibration conducted at seven different gauging stations, with results indicating that model performance was good with Nash-Sutcliffe efficiency (NSE) and Coefficient of determination (R2) values greater than 0.65 for the majority of the stations. The detail of streamflow calibration and validation for the four watersheds is presented in [1].
Similarly, calibration of change in groundwater depth (2003–2009) was conducted at different observation wells within the watersheds. These generally showed good agreement between observed and simulated data with R2 between 0.52 to 0.81 as described in [1]. In the same way, the calibration of crop yields (2011–2020) was conducted using the average crop production data collected CSISA farmer surveys and is reported in [1].

2.3. Climate Model

The basis for RCM selection is provided by [39] based on evaluation of nineteen different CORDEX RCMs in the Karnali basin of Nepal. Climate data from the NOAA_RegCM4 model, one of the most widely used and well-performing climate models in this region, was selected for this study [37,38]. The global climate model, NOAA-GFDL-GFDL-ESM2M, was used to give boundary conditions for NOAA_RegCM4. A single model, instead of an ensemble of multiple models, was applied in this study since wrong model selection during model assembly may propagate errors and result in a lower predictive accuracy compared to that of an individual model. Climate data were downloaded from the Coordinated Regional Downscaling Experiment for South Asia (CORDEX-SA) in The Earth System Grid Federation portal [59] and the RCP (Representative Concentration Pathway) 4.5. A conservative medium emission scenario was used in this study [60]. The downloaded climate data were further bias-corrected and processed as required for SWAT using the Climate Model data for hydrologic modelling (CMhyd) tool [61]. The same correction algorithm as used for historical conditions was applied for future climatic conditions as the bias correction algorithm for historical climate conditions was assumed to be applicable for a future climate in CMhyd [61].

2.4. Modelling Scenarios

The modelling scenarios implemented in this study were based on a combination of crop suitability, crop diversification potential, and access to irrigation and markets as identified through a participatory, stakeholder driven process. The scenarios were developed in a participatory approach through questionnaire surveys with farmers, multiple scenario planning workshops conducted at the provincial and national level, and a series of regular discussions with project team members, stakeholders, and professionals working in the area. These scenarios were then evaluated based on key sustainability and crop production indicators using SWAT.
For the simulation of these modelling scenarios, agricultural management data on crop selection, tillage, planting, irrigation, fertilization, and harvesting derived from surveys and expert consultation were incorporated in the model. Optimistic scenarios were developed either by replacing a presently practiced cropping system with a new one through irrigation area expansion or by introducing a triple cropping system instead of single or double cropping. The detail on the participatory scenario identification process undertaken for this study and the basis of their selection and allocation of actual and potential land area for different watersheds within the study area has been discussed by [1].
For each selected scenario, the use of surface water, groundwater and conjunctive use of both surface and groundwater for irrigation were considered. We also derived data on the potential effects of cropping systems change on long-term depletion and annual recharge of streamflow and groundwater. This was analyzed by focusing on withdrawals and discharge across multiple seasons and years. These scenarios were applied in the SWAT model to evaluate their impact on streamflow, surface/groundwater sustainability and crop yield for the near-term (2021 to 2035), and mid-term future (2035 to 2050) periods. Under the most optimistic assumption, the groundwater resource is sustainable if the annual groundwater pumping rate is equal to the annual groundwater recharge rate and surface water is considered sustainable when the amount of water in the main river is not depleted greatly by irrigation. The schematic diagram for the methodologic approach of the study is presented in Figure 2.

3. Results and Discussion

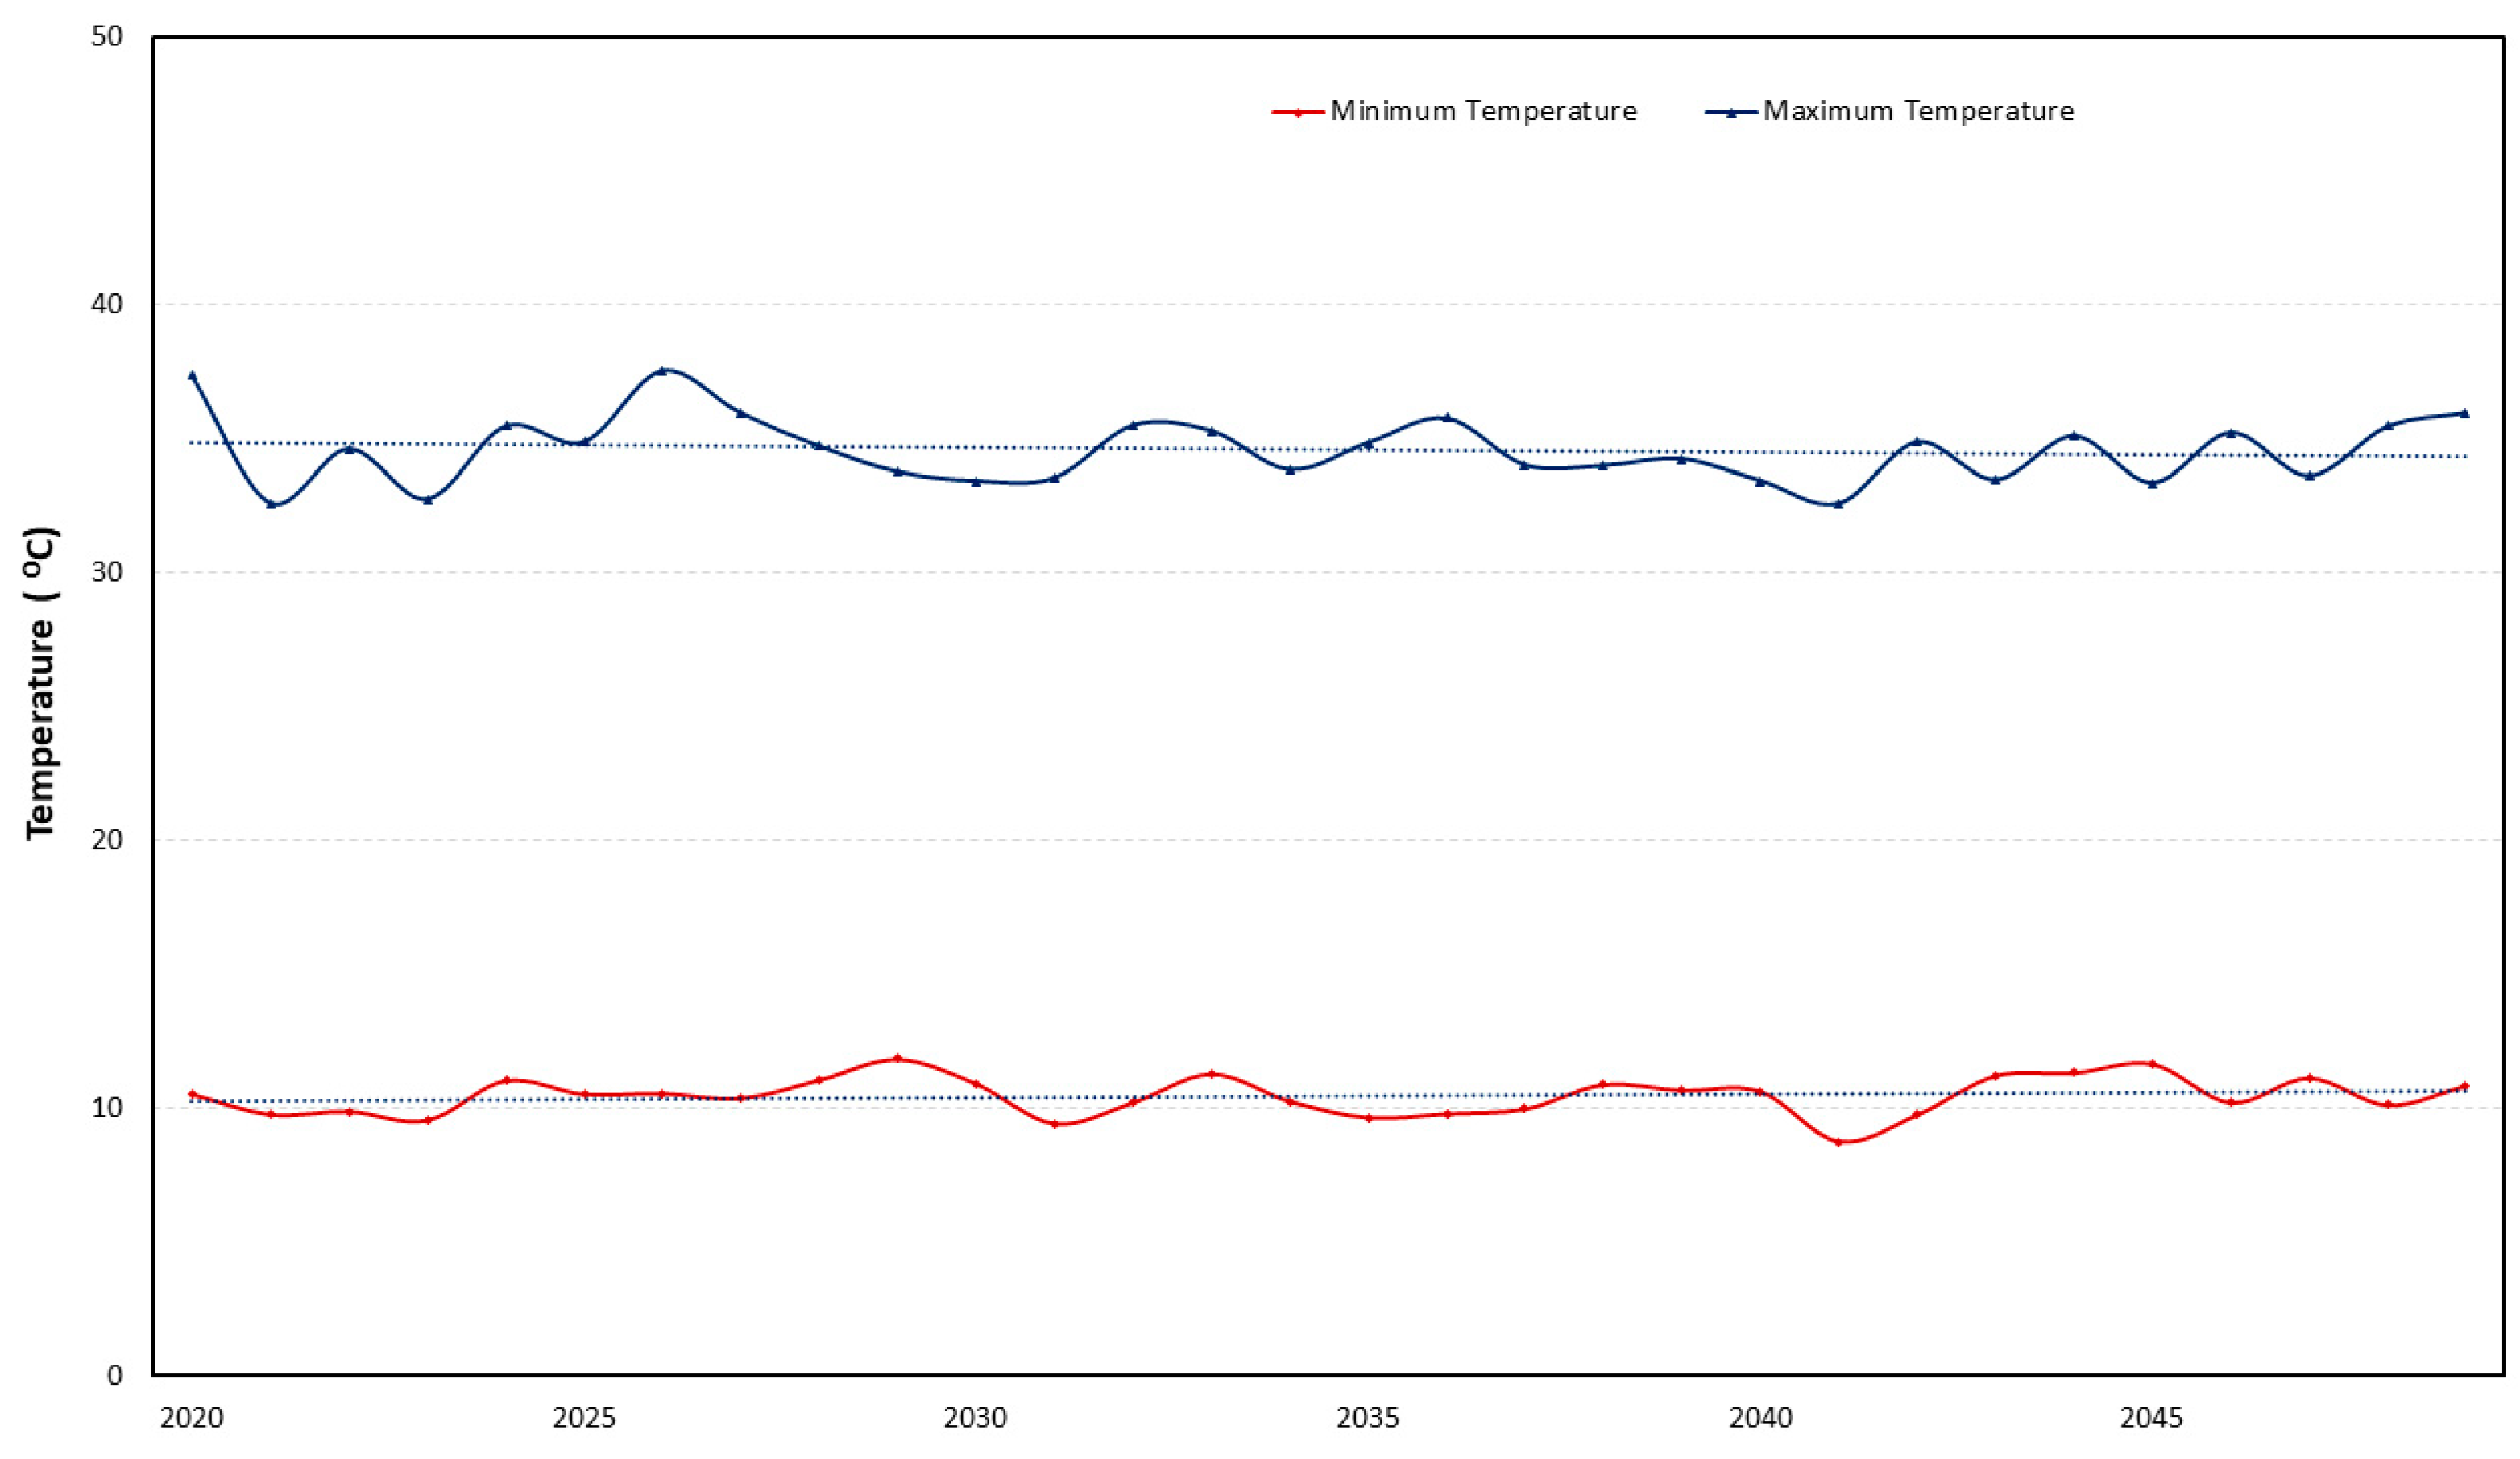
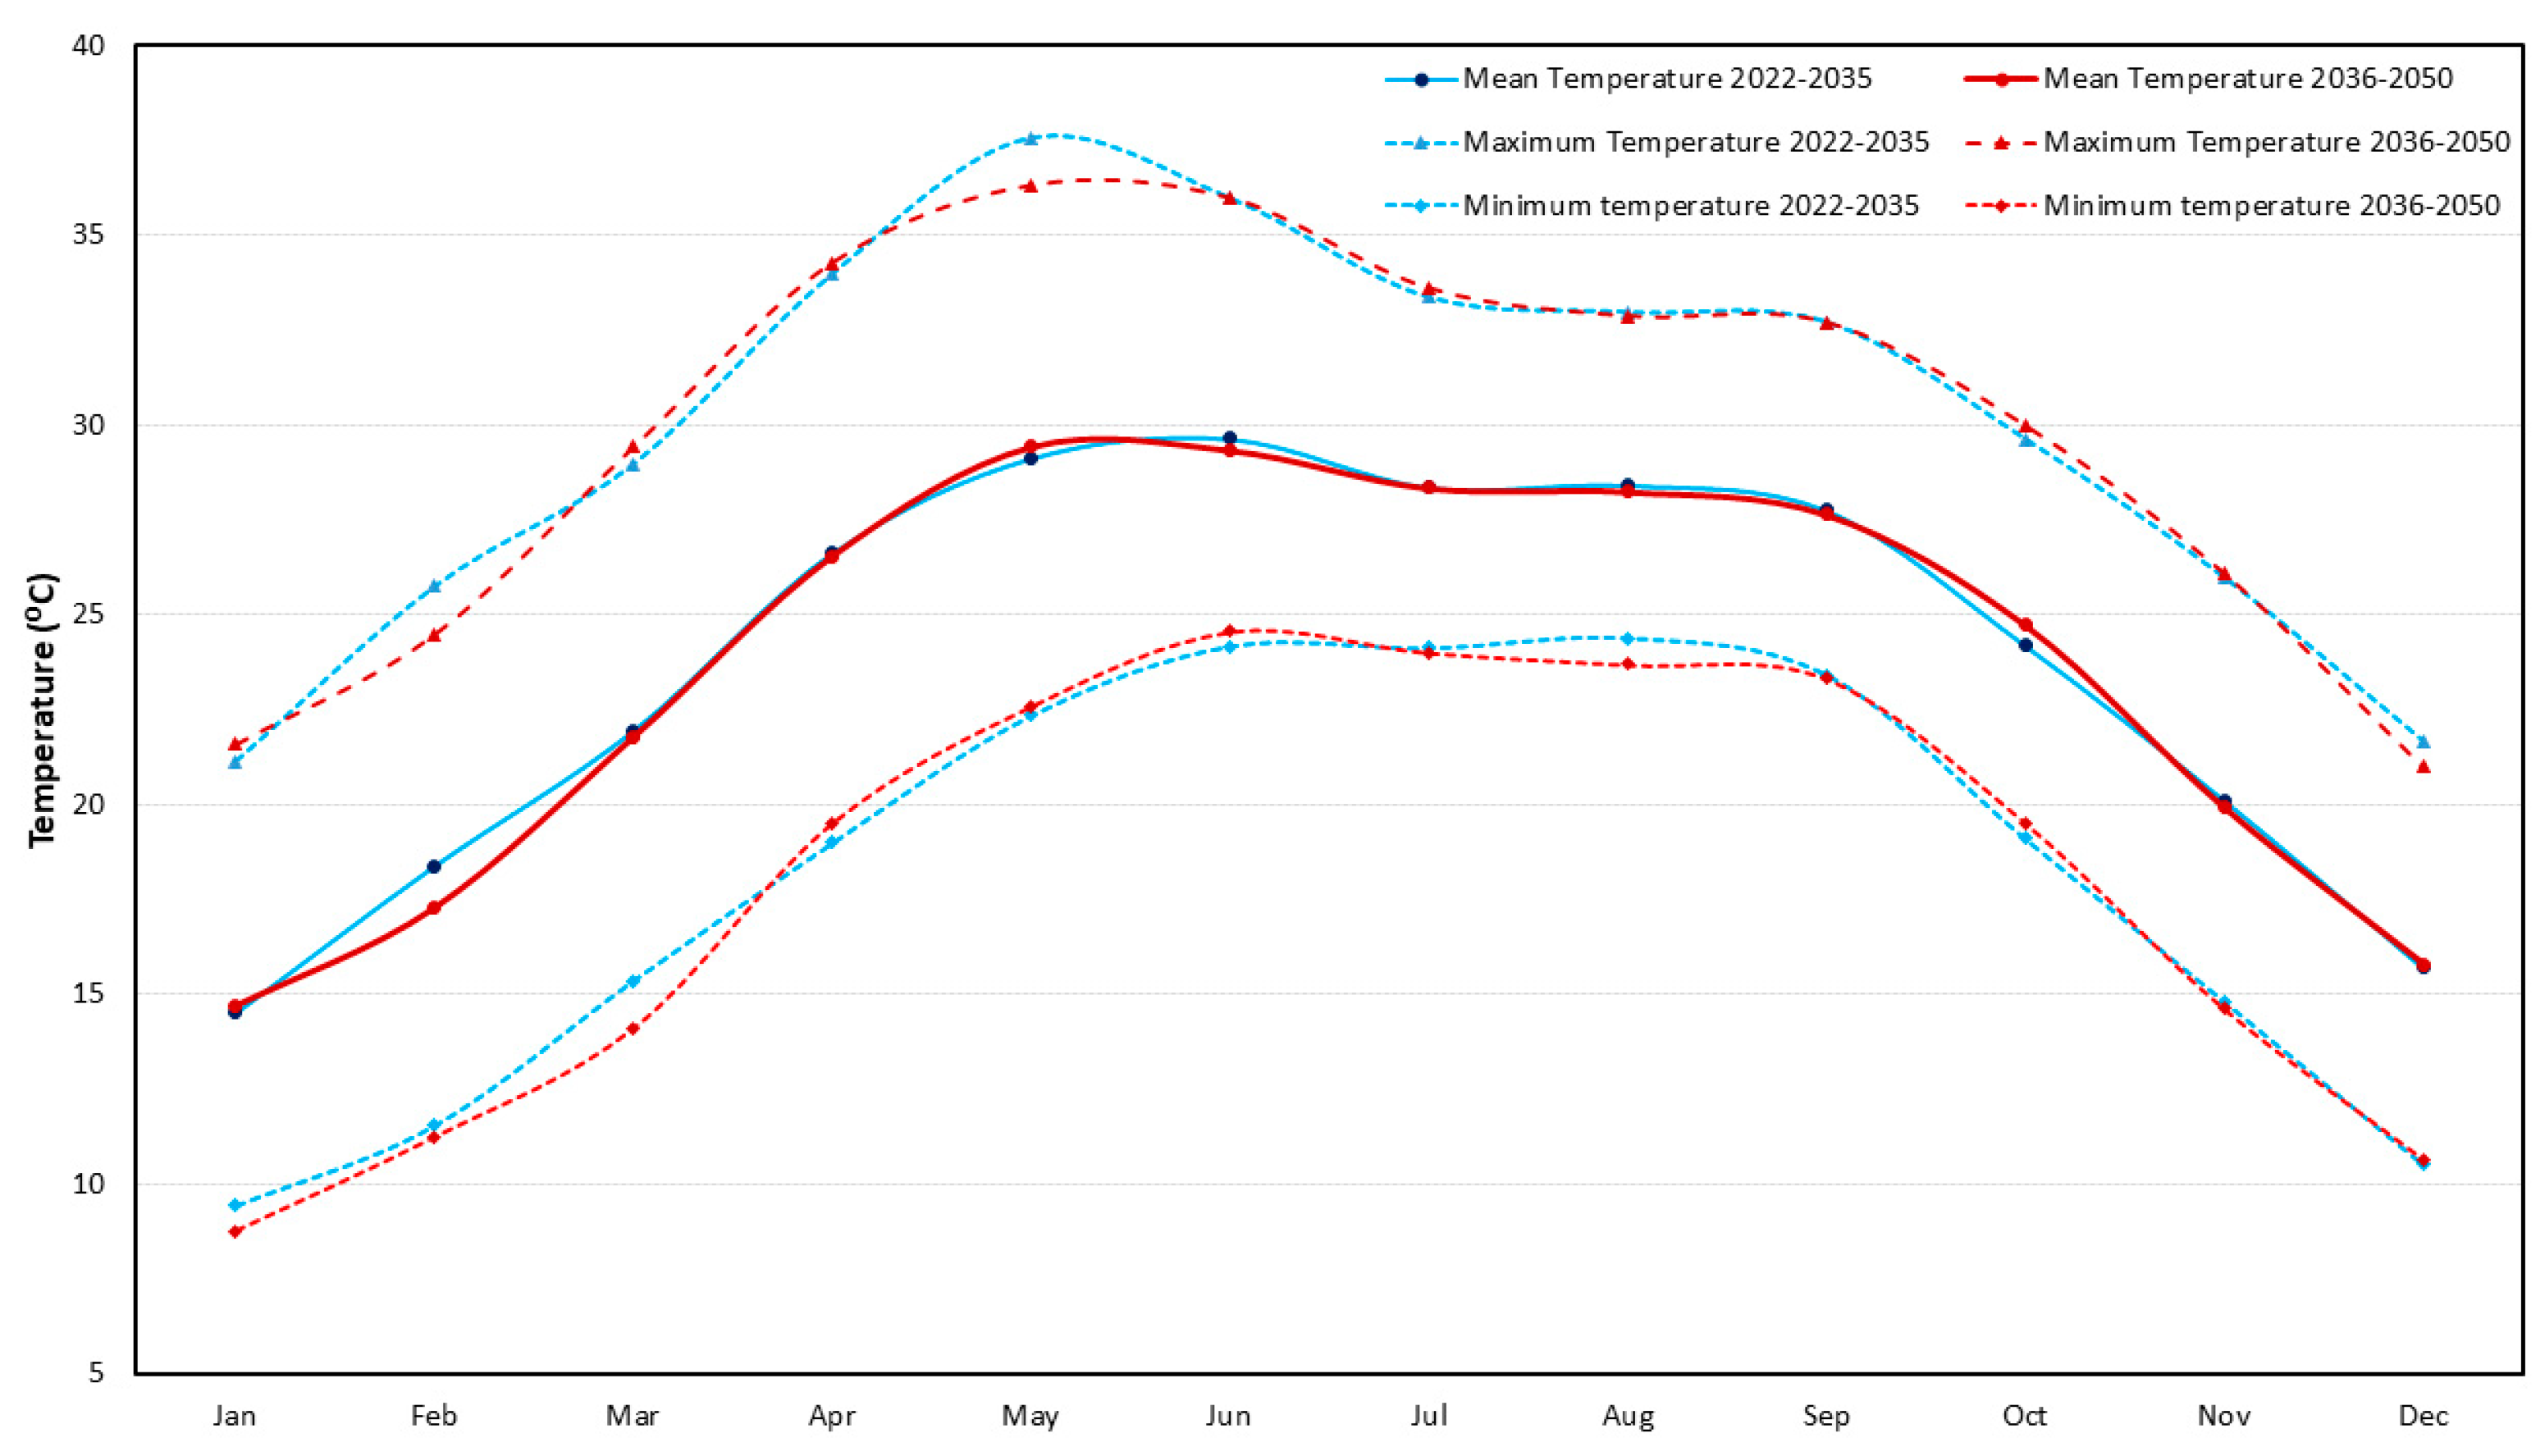
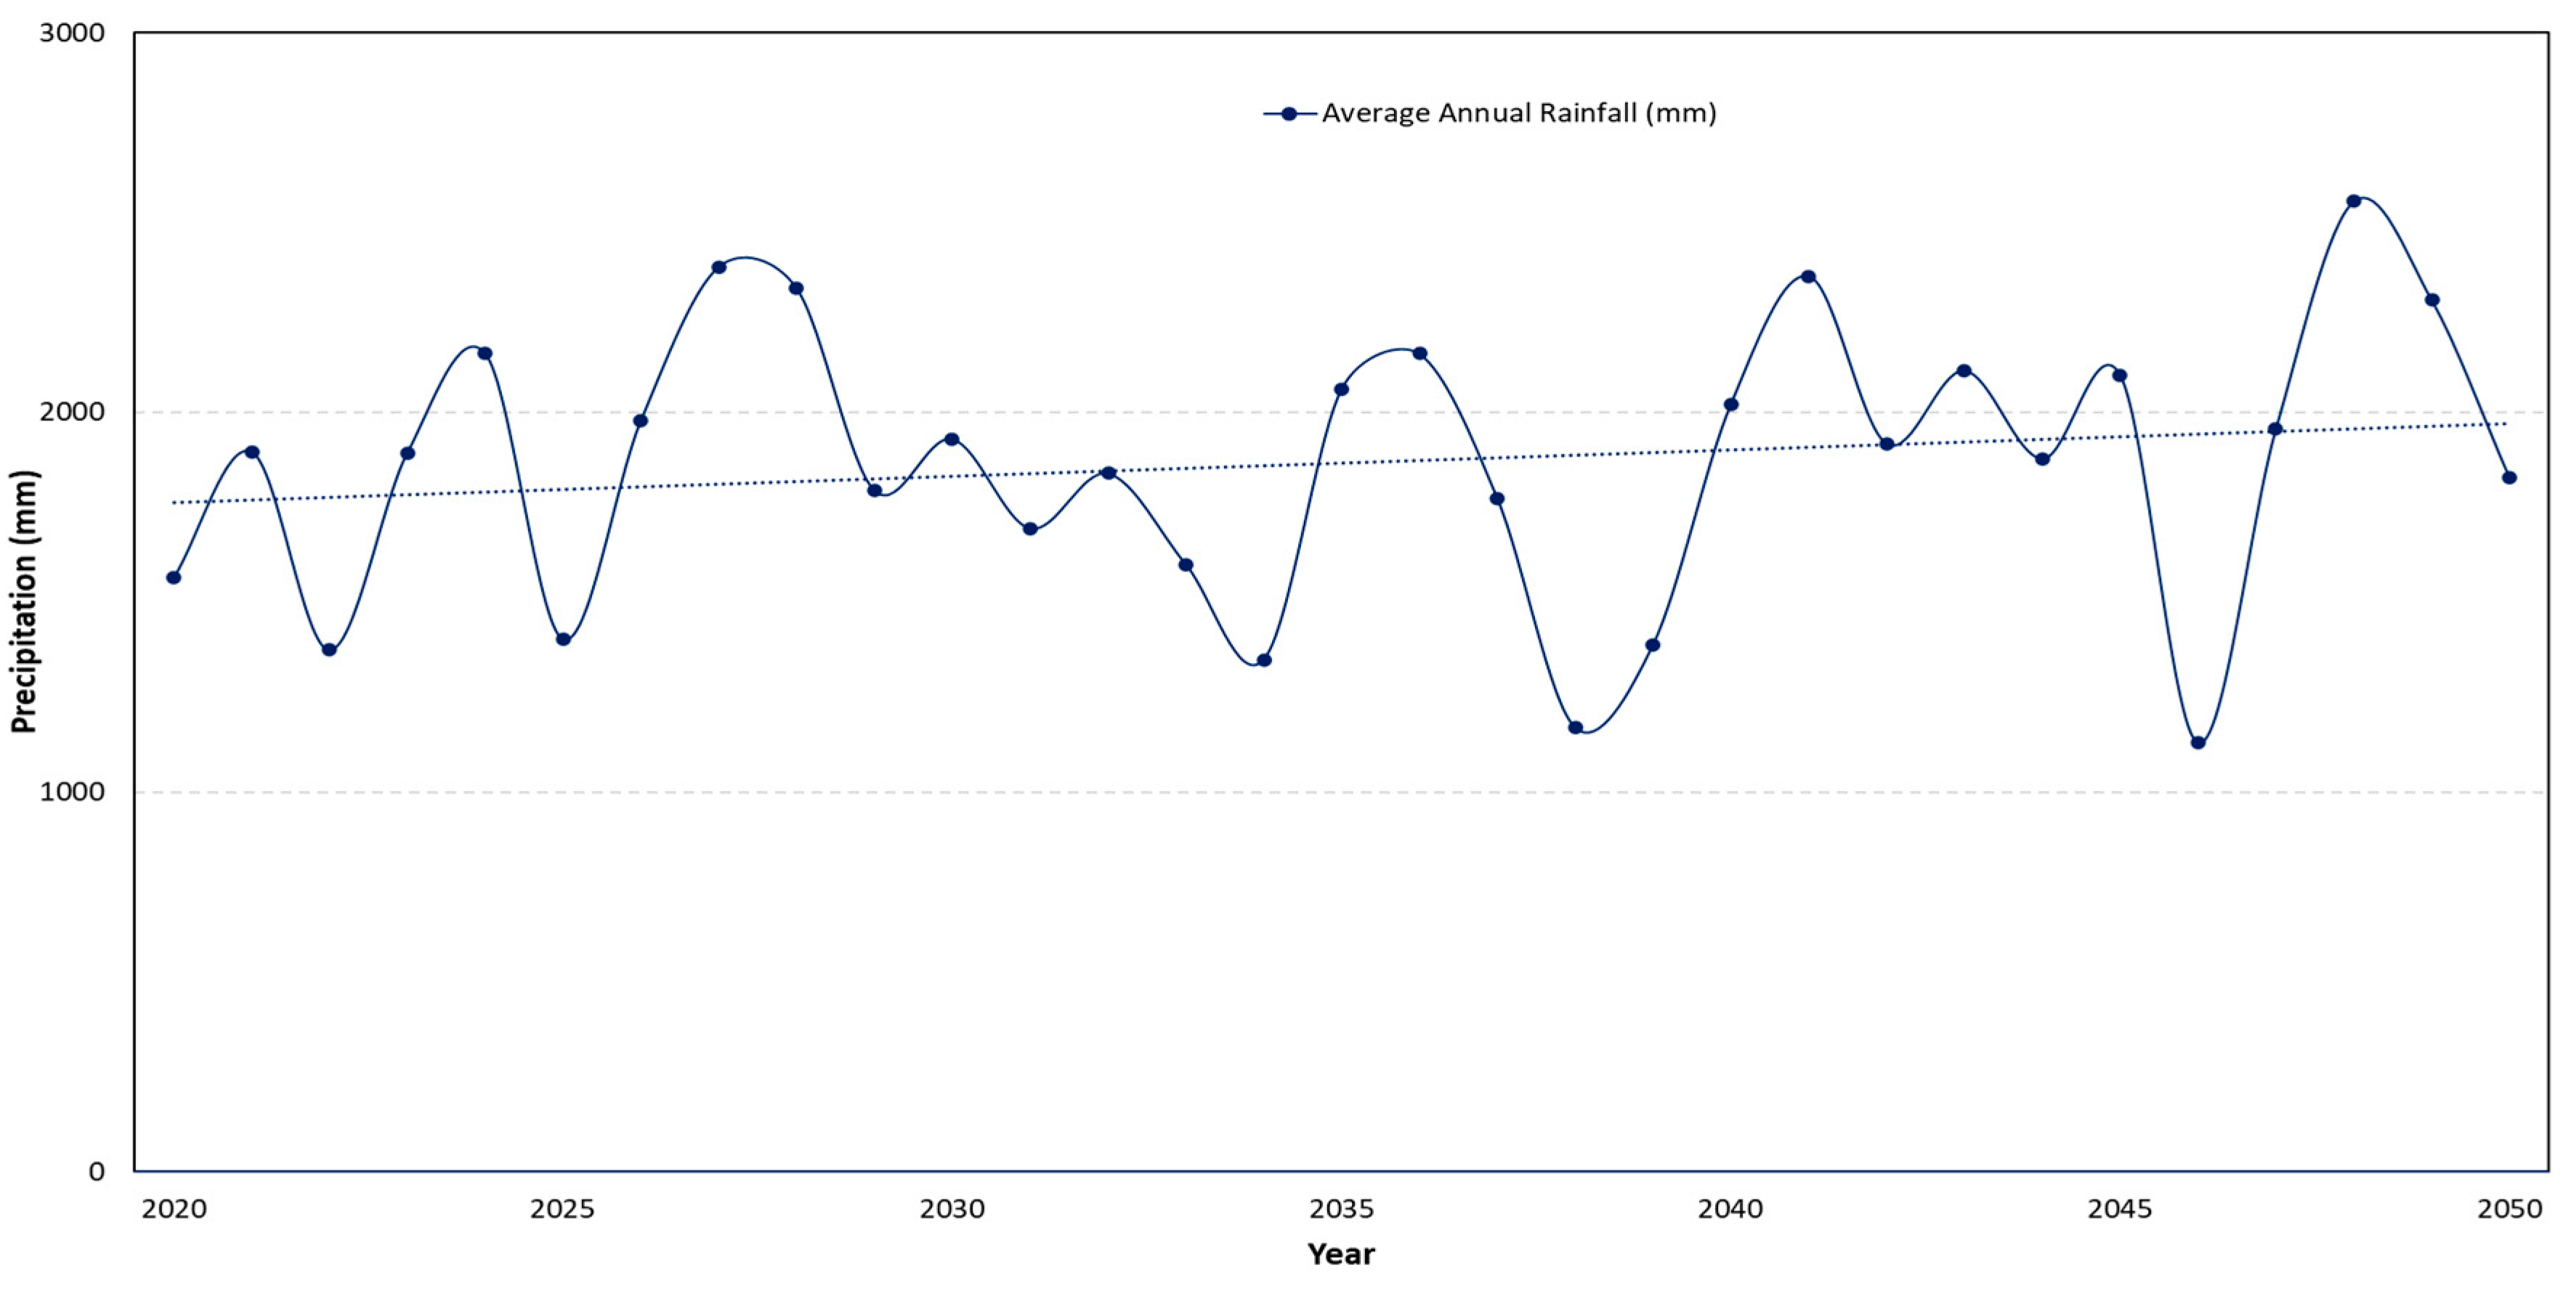
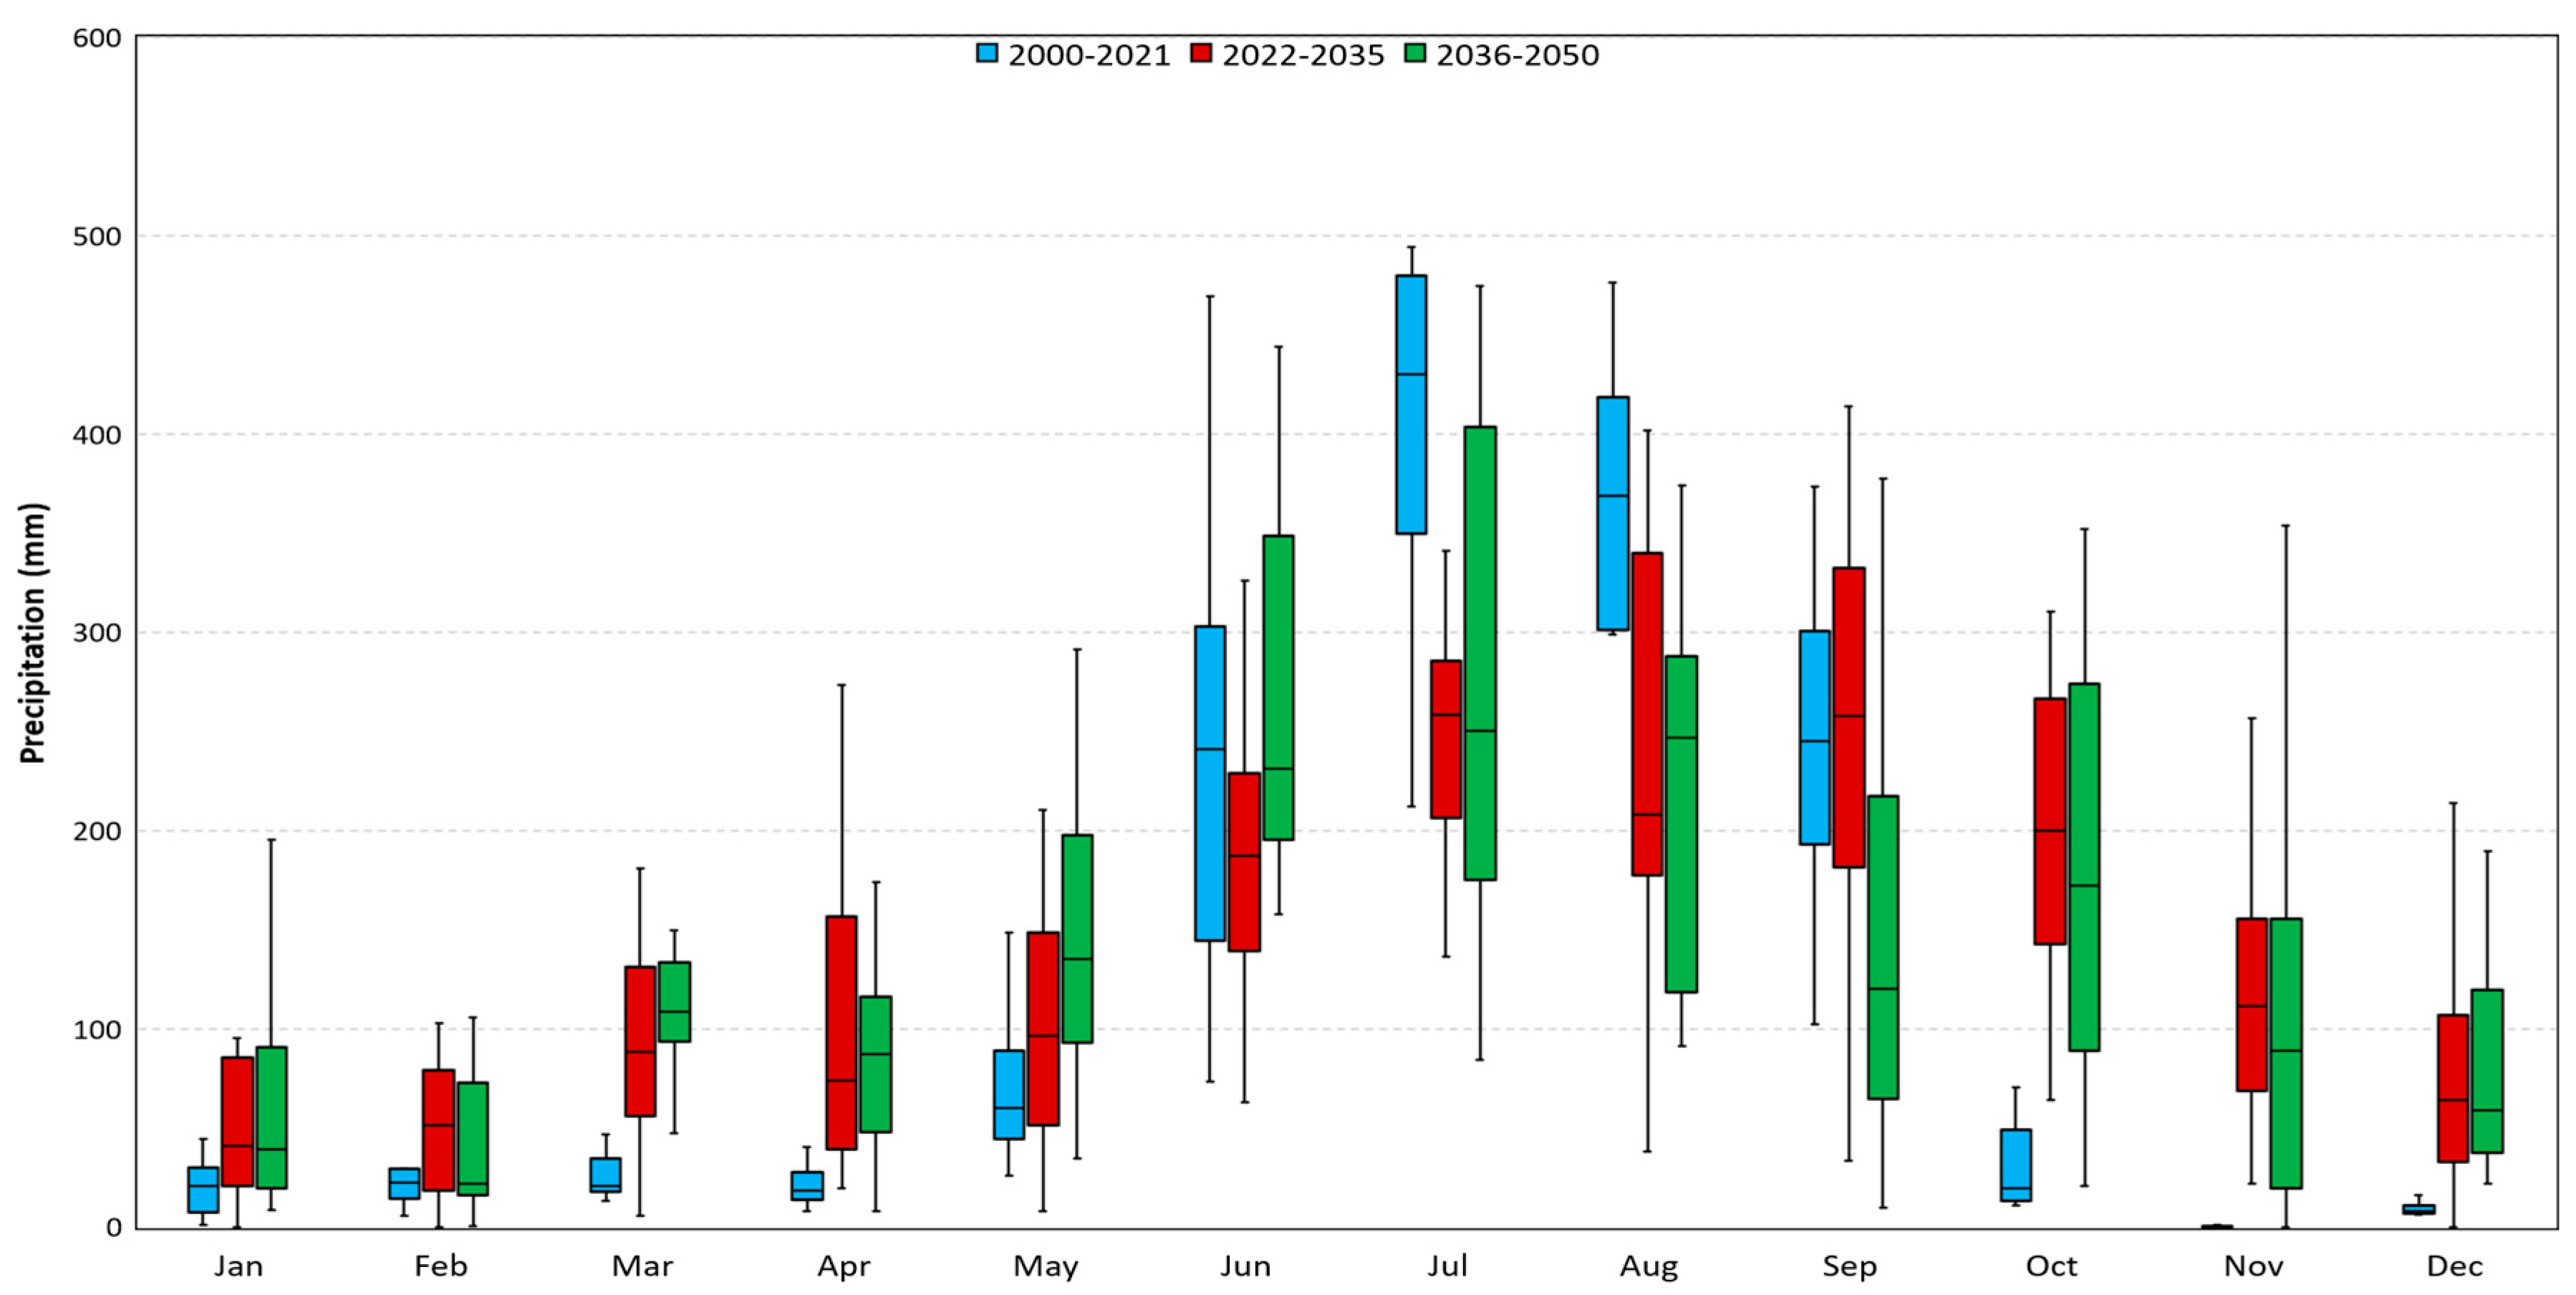
3.1. Projected Change in Average Precipitation and Temperature

The average annual rainfall projection under the climate change scenarios obtained from NOAA_RegCM4 model for the four study watersheds showed a linear but small increasing trend (Figure 3), suggesting a potential increase in future precipitation in the study area of about 4% from 2000 to 2050. The maximum yearly precipitation as per the climate change data was 2555 mm and the minimum yearly precipitation was 1129 mm within the period defined. These observations come with consider inter-annual variability of potential precipitation, with a range of 1426 mm.
The monthly average precipitation during the current (2000–2021) and near-term future (2022–2035) periods were highest during August and September. Conversely, for the mid-term future (2036–2050), the highest rainfall occurred in the month of July (Figure 4). Although the total potential increase in precipitation of 4% is small, the shift in peak rainfall could have an important effect on crop establishment and harvesting dates, which in turn is likely to affects crop yield and the regional water balance [62]. Increases in projected precipitation, especially during the dry months (October to May) can have positive impact on reduction of irrigation requirement and may allow increased flexibility in crop establishment, intercultural management, and harvesting schedules and may even allow for the cultivation additional crops within the year. However, very high rainfall during dry winter season could also be detrimental and could affect the production of less water-stagnant and disease-prone crops such as lentils or wheat cultivated during the dry season.
The projection of temperature under the climate change scenarios obtained from NOAA_RegCM4 model for the study area showed considerably less variability than precipitation, and a linear trend of decreasing maximum temperature by 1.4 °C by 2050. Conversely, an increase in minimum temperature by 0.3 °C0 (Figure 5).
The average monthly mean, minimum, and maximum temperature during the current (2000–2021), model-derived near-term future (2022–2035), and mid-term future (2036–2050) were lowest during December/January while the average monthly maximum, minimum, and mean temperature were highest during May/June (Figure 6). The average monthly mean temperature decreased by 1.1 °C in February and increased by 0.5 °C in October in the mid-term future compared to near-term future scenario. Similarly, average monthly maximum temperature could decrease by 1.3 °C in February and May and increase by 0.5 °C in January and March during the mid-term future compared to the near-term future scenarios. Likewise, the average monthly minimum temperature decreased 1.3 °C in March and increased by 0.5 °C in April under these scenarios, respectively.

3.2. Impact of Climate Change on River and Streamflow

Model outputs suggested that annual river and streamflow may increase in all four watersheds during the near-term (2022–2035) and mid-term (2036–2050) future for all the scenarios compared to the historical period (2000–2021). This was a result of the slight potential increase in precipitation according to the climate change scenario (Figure 7). The average monthly streamflow for the near-term and mid-term future was at its maximum during the months of July, August and September, for all four watersheds. However, the potential increase in streamflow was highest in May, highlighting the potential for early opening of sluice gates to supply water to irrigation canals in surface water irrigation schemes. As such, an increase in streamflow could be potentially beneficial for agricultural production as it leads to an increase in irrigation potential, first through surface water availability and secondly for groundwater through increased recharge. For the Babai and West-Rapti watersheds, model outputs suggest that streamflow may decrease during the dry months from September to December, for both the near-term and mid-term future periods. As such, the water in these watersheds may not be sufficient for irrigation during pre- and post-monsoon seasons, as at least 70% of the total river discharge is recommended to be left in the river for environmental flow requirements.

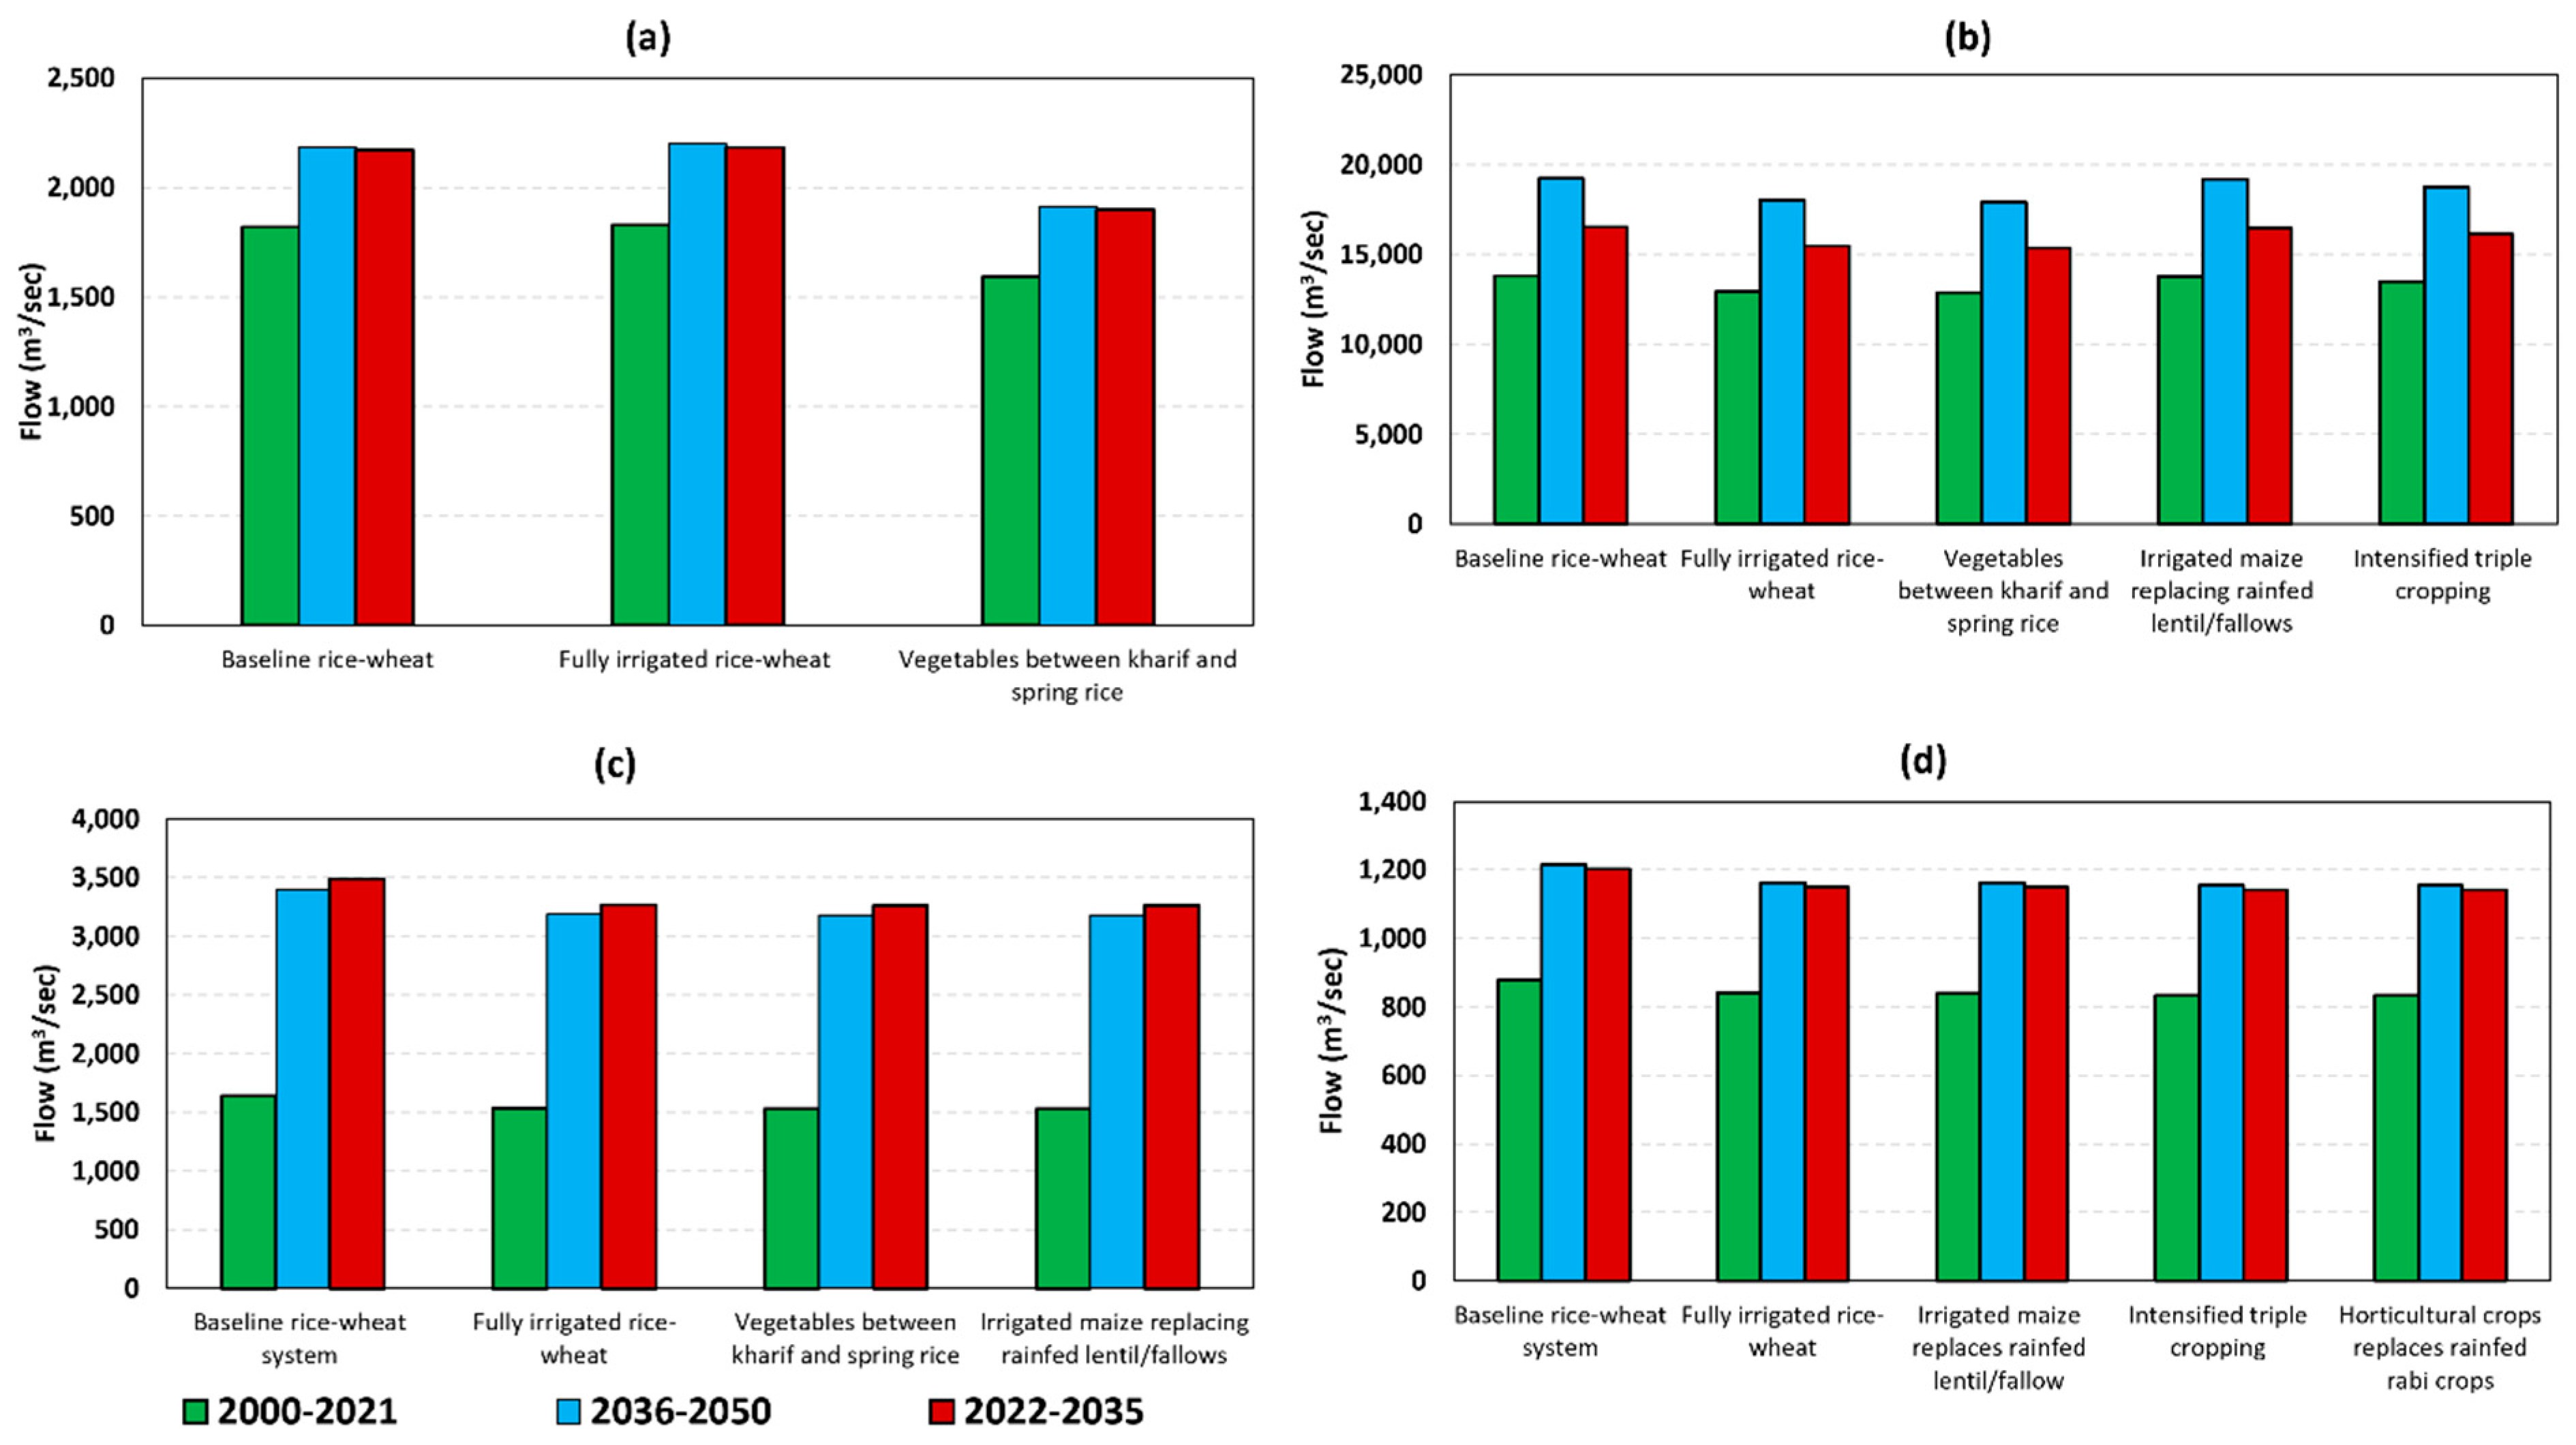
3.3. Impact of Climate Change and Scenarios Implemented at Upstream Subbasins

Interactions between upstream and downstream components of a watershed are important in assessing the sustainability of water resources for irrigation. Our model outputs suggest that rational use of surface water irrigation in upstream subbasins in the monsoon season could increase average water availability in downstream subbasins for all the watersheds studied by around 10%. This modeling result is attributable to an enhancement in groundwater recharge and increase in river flow when surface irrigation was possible. However, available water could conversely be significantly depleted during the dry season if too much groundwater is abstracted for irrigation during the monsoon, thereby limiting recharge. Excessive groundwater withdrawal is also likely to reduce dry season streamflow by about 14%, indicating the potential risks associated with poorly planned groundwater abstraction during the dry season when surface water irrigation potential is limited due to low river baseflow.
The average stream flow during the current period (2000–2021) for the rice-wheat baseline scenario as measured at the outlet of the Babai watershed were 236 m3/s during monsoon, 57 m3/s during post-monsoon, and 7 m3/s during pre-monsoon season. We modeled the potential consequences of a rice–vegetable–rice instead of rice–wheat rotation, which resulted in model outputs suggesting a reduction of streamflow to 222 m3/s during monsoon and 50 m3/s during the post-monsoon. Importantly, streamflow of 57 m3/s during post monsoon and 7 m3/s during pre-monsoon season are unlikely to be sufficient to support surface water irrigation in the watershed. Implication of groundwater for irrigation during these pre and post monsoon season led to a reduction in the post-monsoon season discharge. Average flow during monsoon season was reduced by 6% under modeling scenarios when surface water was withdrawn from the river to deficit irrigate rice cultivated during the monsoon.
Analysis of climate change scenarios suggested that surface runoff is likely to increase by 19% to 30% in the near-term future (2021 to 2035), and by 32% to 45% during mid-term future (2035 to 2050) period. This increased surface run-off can potentially be used to improve irrigation if surplus water is conserved using water harvesting technologies such as construction of storage wetlands, ponds, and in the context of diversified and less irrigation demanding agricultural systems.

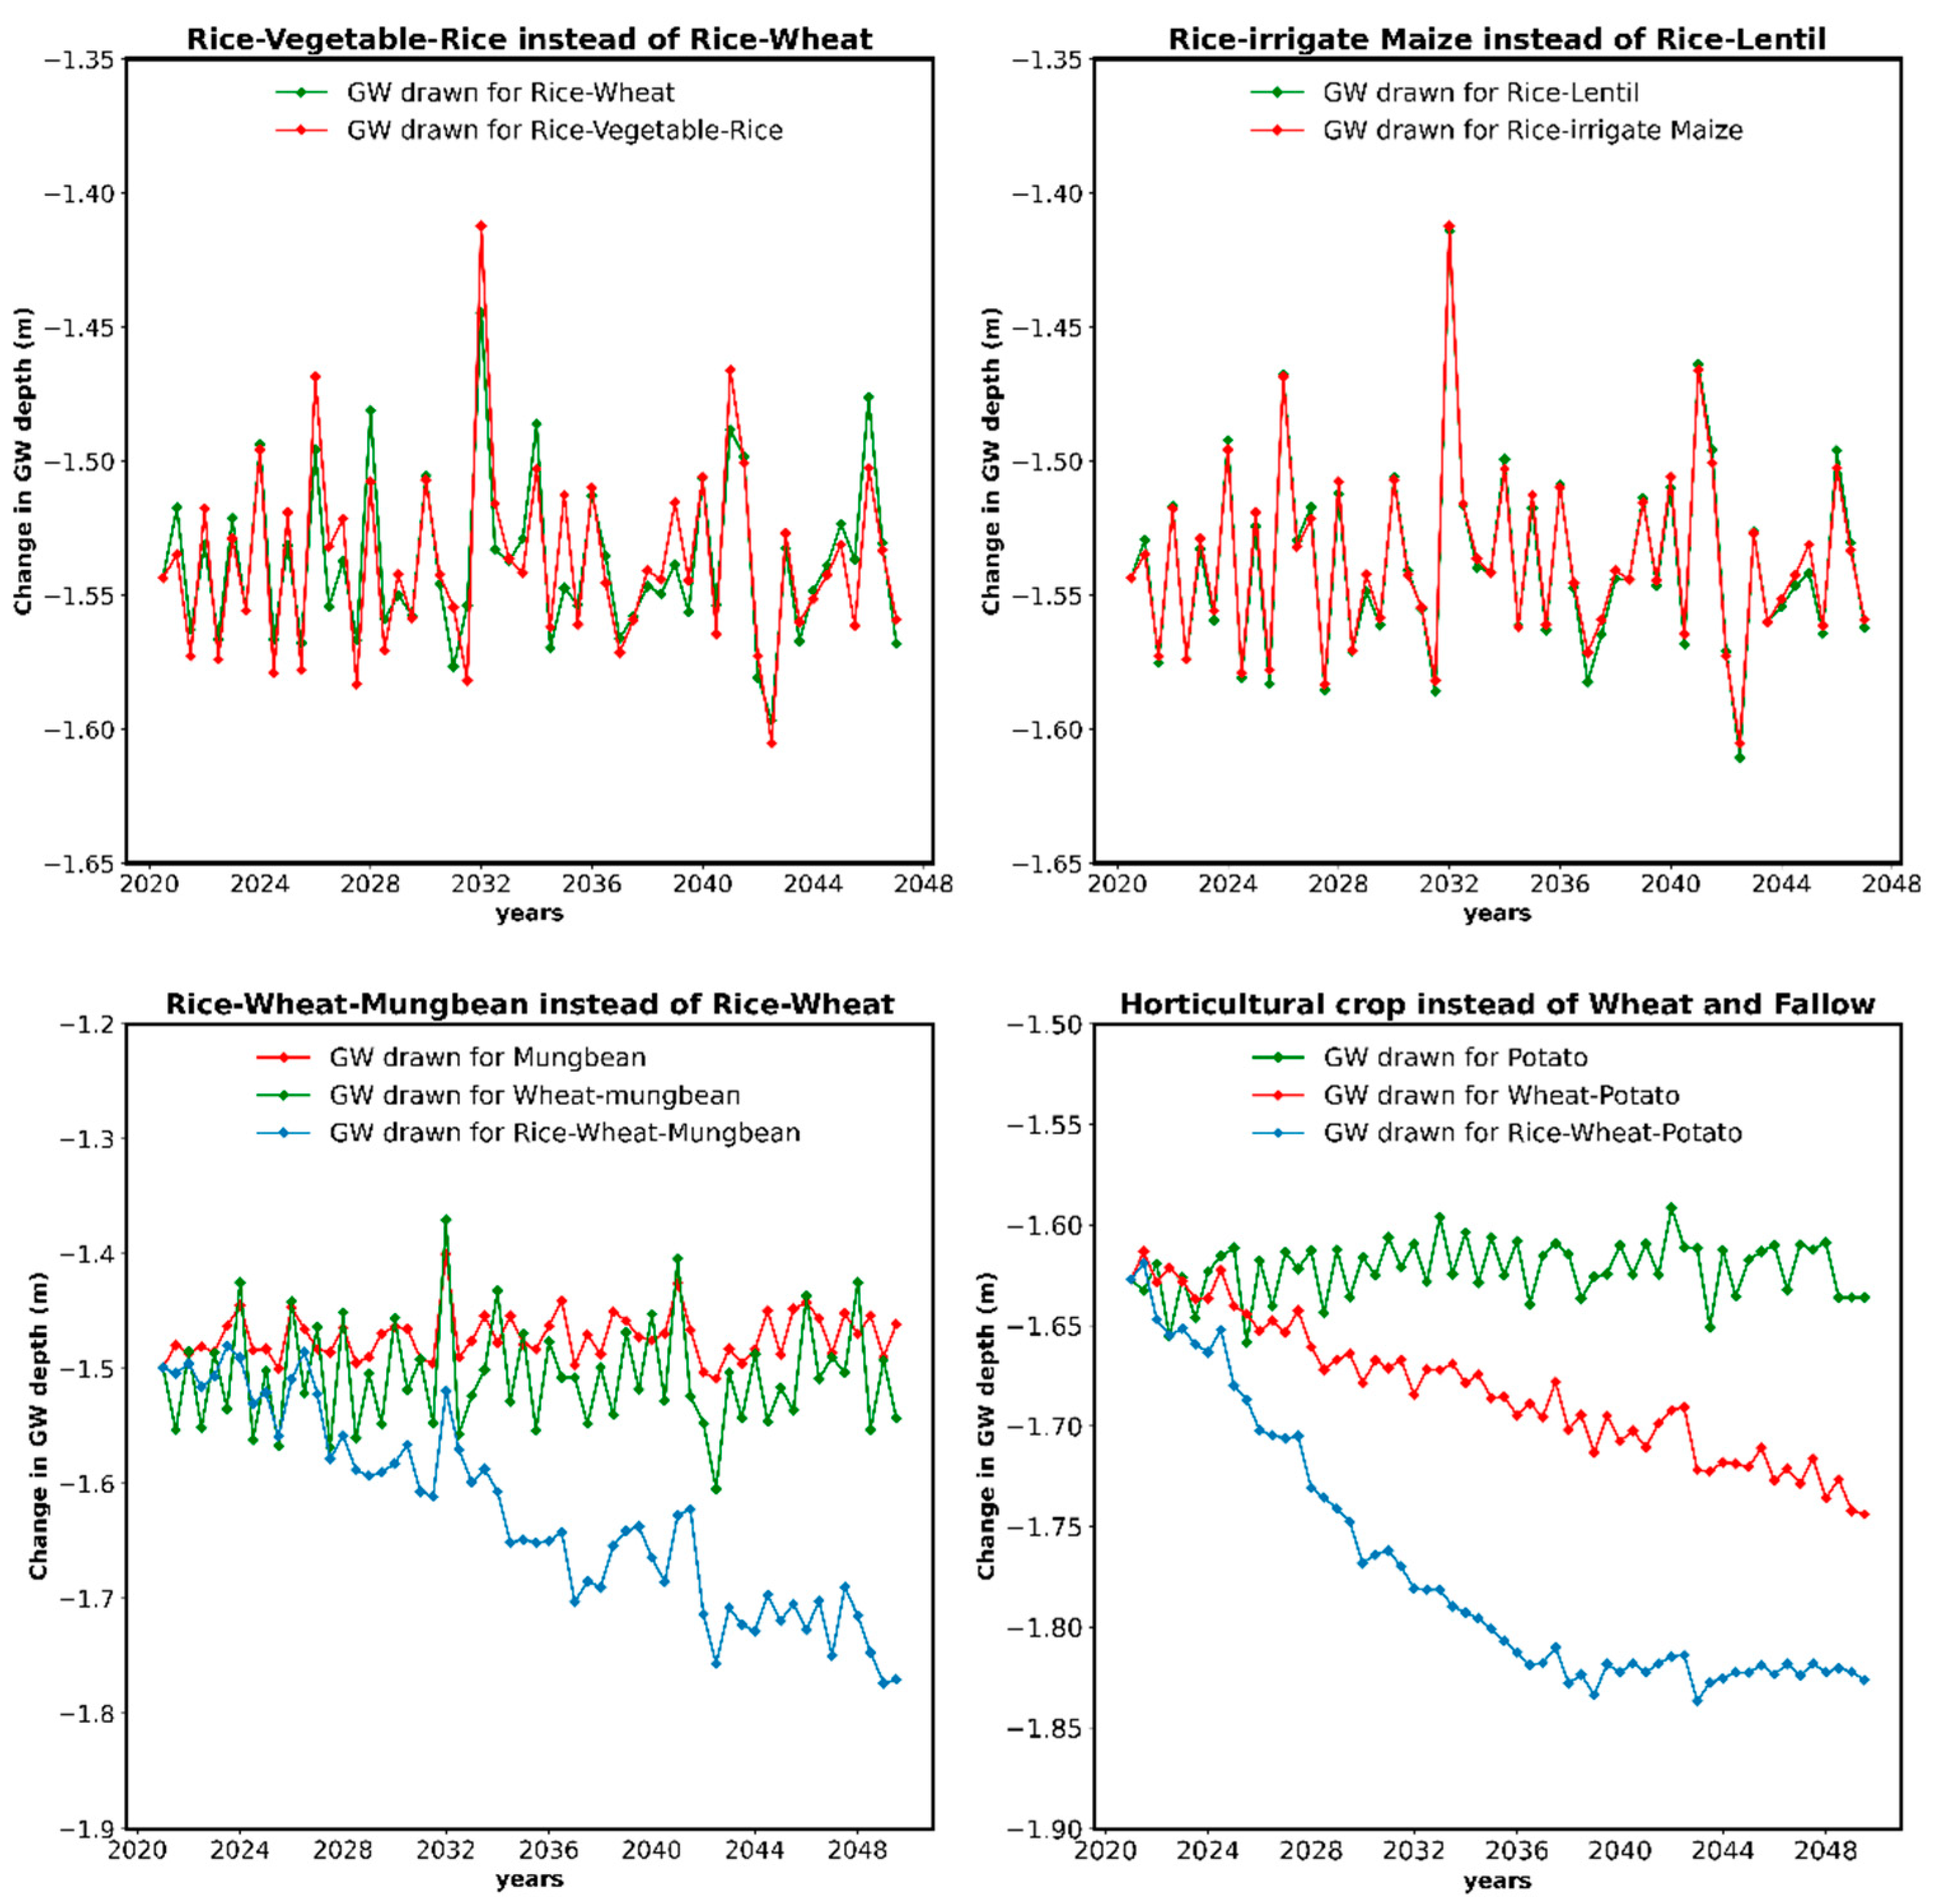
3.4. Impact on Groundwater Recharge and Groundwater Sustainability

Our model results suggested that groundwater reserves could be sufficient to irrigate dry season crops when the monsoon season crops were irrigated with surface water. Surface and groundwater are generally considered as contributing to more sustainable resource management when river flow or groundwater storage is dynamically retained for a longer period through inclusive, equitable and long-term interventions. Farmers managing fields located in the plain Terai region, near the main river channels and irrigation canals may utilize surface water for irrigation to overcome precipitation deficits during the monsoon generally considered sustainable when river flow or groundwater storage is dynamically retained for a longer period through inclusive, equitable and long-term management. Our analysis suggests that such rational use may aid in recharging and conserving groundwater for later use during the dry season. However, if monsoon season crops (mainly monsoon rice) are conversely irrigated exclusively through groundwater, model outputs indicate that water abstraction may become unsustainable as only 27% to 92% of crop water requirements may be fulfilled with groundwater. The sole exemption to this is the rice-lentil cropping system, in which groundwater irrigation appears to be more sustainable even when monsoon rice was irrigated with groundwater as irrigation (Table 1). This is because lentils are typically not irrigated in rice–wheat cropping systems; rather, they are established using residual soil moisture for germination and are grown with precipitation, though the latter can lead to disease problems.
The sustainability of groundwater resources was based on groundwater recharge and irrigation requirements such that if the irrigation requirement was less than 70% of the total annual groundwater recharge, the groundwater irrigation was sustainable (Lopez et al., 2022). Care must be taken when fully irrigating for the entire season with groundwater in the study watersheds as it could lead to further groundwater depletion in the future. Conversely, this challenge is partially offset by increased potential recharge in these periods that result from an increase in average precipitation and streamflow as per the climate change scenarios.

3.5. Impacts on Groundwater Reserves

Historical records of groundwater depth in Nepal are inconsistently available. Due to poor input data availability and some of the limitations of SWAT to directly simulate depth to groundwater, the amount of water in shallow groundwater aquifers was used to estimate groundwater depth. Thus, the groundwater depth change presented in this study is indicative of a relative trend, but not the actual water table fluctuation, as is the case in most modeling studies. The average decrease in groundwater for the rice–wheat baseline scenario, which is the predominate cropping pattern in western Nepal, was 10 mm from 2021 to 2050. The rice–vegetable–rice scenario conversely registered only 4 mm (Figure 8). These indicate the potentially directionality of the impact of increased groundwater use but estimating the true impact would require better data resources. These results suggest that conjunctive use planning for irrigated agriculture is likely to be necessary to avoid the long-term depletion of groundwater resources. Importantly, our results also suggest that with intensified groundwater use, seasonal depletion is likely to increase, leading to lower groundwater tables in the dry season; seasonal depletion could therefore that could compromise farmers’ ability to physically reach groundwater and/or afford the energy resources required for their abstraction. For example, wildlife conservation in Bardiya National Park partially depends on groundwater and capillary rise to sustain grasses that are important for grazing animals and the predators that rely on them. Research that investigates these linkages between agriculture, the water system and wildlife conservation should therefore be part-and-parcel of integrated irrigation and groundwater resources development planning.
For rice– rainfed lentil and rice– irrigated maize cropping systems, a 50 mm and 52 mm increase in groundwater levels was observed from 2021 to 2050 (Figure 8). This suggests that both rice–rainfed lentil and rice-irrigated maize systems are less likely to experience long-term groundwater depletion, especially as recharge is set to increase due to increased precipitation driven by climate change. These results therefore suggest the potential opportunity for increasing farmers’ use of new dry season cropping systems that are linked to irrigation management, conjunctive use of surface and groundwater, and that make optimal use of precipitation.
Replacing double-cropping systems with the inclusion of three rotational crops per year is often championed by policy makers as desirable as these systems could produce more yield in a year. In many of these systems, legume crops like mung, are included as the third crop, as they have shorter growing periods and can fit into intensified cropping sequences. However, triple crop systems may have a significant impact on soil moisture and groundwater reserves if the entire irrigation demand is supplied from groundwater sources, or if the inclusion of legumes results in significantly increased evapotranspiration. Model outputs suggested that a change in groundwater reserve under triple cropped systems from 2021 to 2050 could range from 250 mm to 264 mm when all water requirements were supplied from a groundwater source to assure no water stress (Figure 8). This indicates groundwater sources alone are not sustainable. However, when simulations were undertaken in which groundwater was used to irrigate only mungbean and other crops (for example rice or wheat) were supplemented by a surface water irrigation, only a negligible amount of groundwater drawdown was observed.
Horticultural crops, which can be cultivated between rice and wheat, were also simulated. However, these crops are perishable, and tend to be grown in areas with short distances to markets for sales to drive farmer’s interest in cultivating them. Our participatory scenario design process resulted in the development of a ‘feasible’ scenario in which horticultural crop growth was simulated within a 50 km radius of urban centers in Nepal’s mid-hills and within road-accessible areas in the Terai. These systems could, however, negatively impact groundwater reserves if all water demand is supplied from groundwater alone. We simulated the replacement of currently dry season fallowed land and rainfed pulses in western Nepal with tomato and potato. The consequences of this scenario from 2021 to 2050 indicated a potential 201 mm change in groundwater when all water requirements were supplied from a groundwater alone (Figure 8). However, if the irrigation requirement for monsoon crops was supplemented by surface water to increase recharge, the potential decline in the groundwater reserves resulting from increased horticultural crops was reduced to 127 mm.

3.6. Impact on Crop Yields

Abiotic stress resulted in simulated tomato yields that were considerably lower than wheat, although the higher economic value of the vegetable crop and higher yield of spring rice suggests that these scenarios could nonetheless be attractive for farmers (Table 2). Further research, including improved calibration and systematic model runs are also required to identify the cause of low tomato yields and to identify viable agronomic methods to improve them.
Even though the yield for maize was significantly higher than lentil (Table 3), the higher price of lentil in comparison to maize and potential soil fertility benefits accrued from nitrogen fixation suggests that it has some advantages from an economic and environmental points of view, although lentil remains a disease-prone crop and our SWAT model outputs were unable to account for biotic stresses.
Mungbean can be cultivated as an additional crop after rice and wheat. Mungbean yield was in the range of 1.7 to 2.9 t/ha during current and future periods (Table 4). As a legume, mungbean can also make contributions to improved soil fertility through nitrogen fixation. Thus, from both economic and environmental points of view, the cultivation of mung between rice and wheat by expanding the irrigation system was worth it. The reduction in crop yield and production during the near and midterm future compared to the current period was due to temperature stress as average temperature based on climate change data was observed to be decreased although average rainfall was increased.
Like Mung, potato also has a higher price and could potentially be an attractive crop worthy to cultivate in place of fallow land where markets are proximal and where efficient irrigation systems like drip or sprinklers can be used. The reduction in crop yield and production during the near and midterm future scenarios for potato compared to the current period (Table 5) was due to temperature stress as average temperature based on climate change data decreased although average rainfall increased.

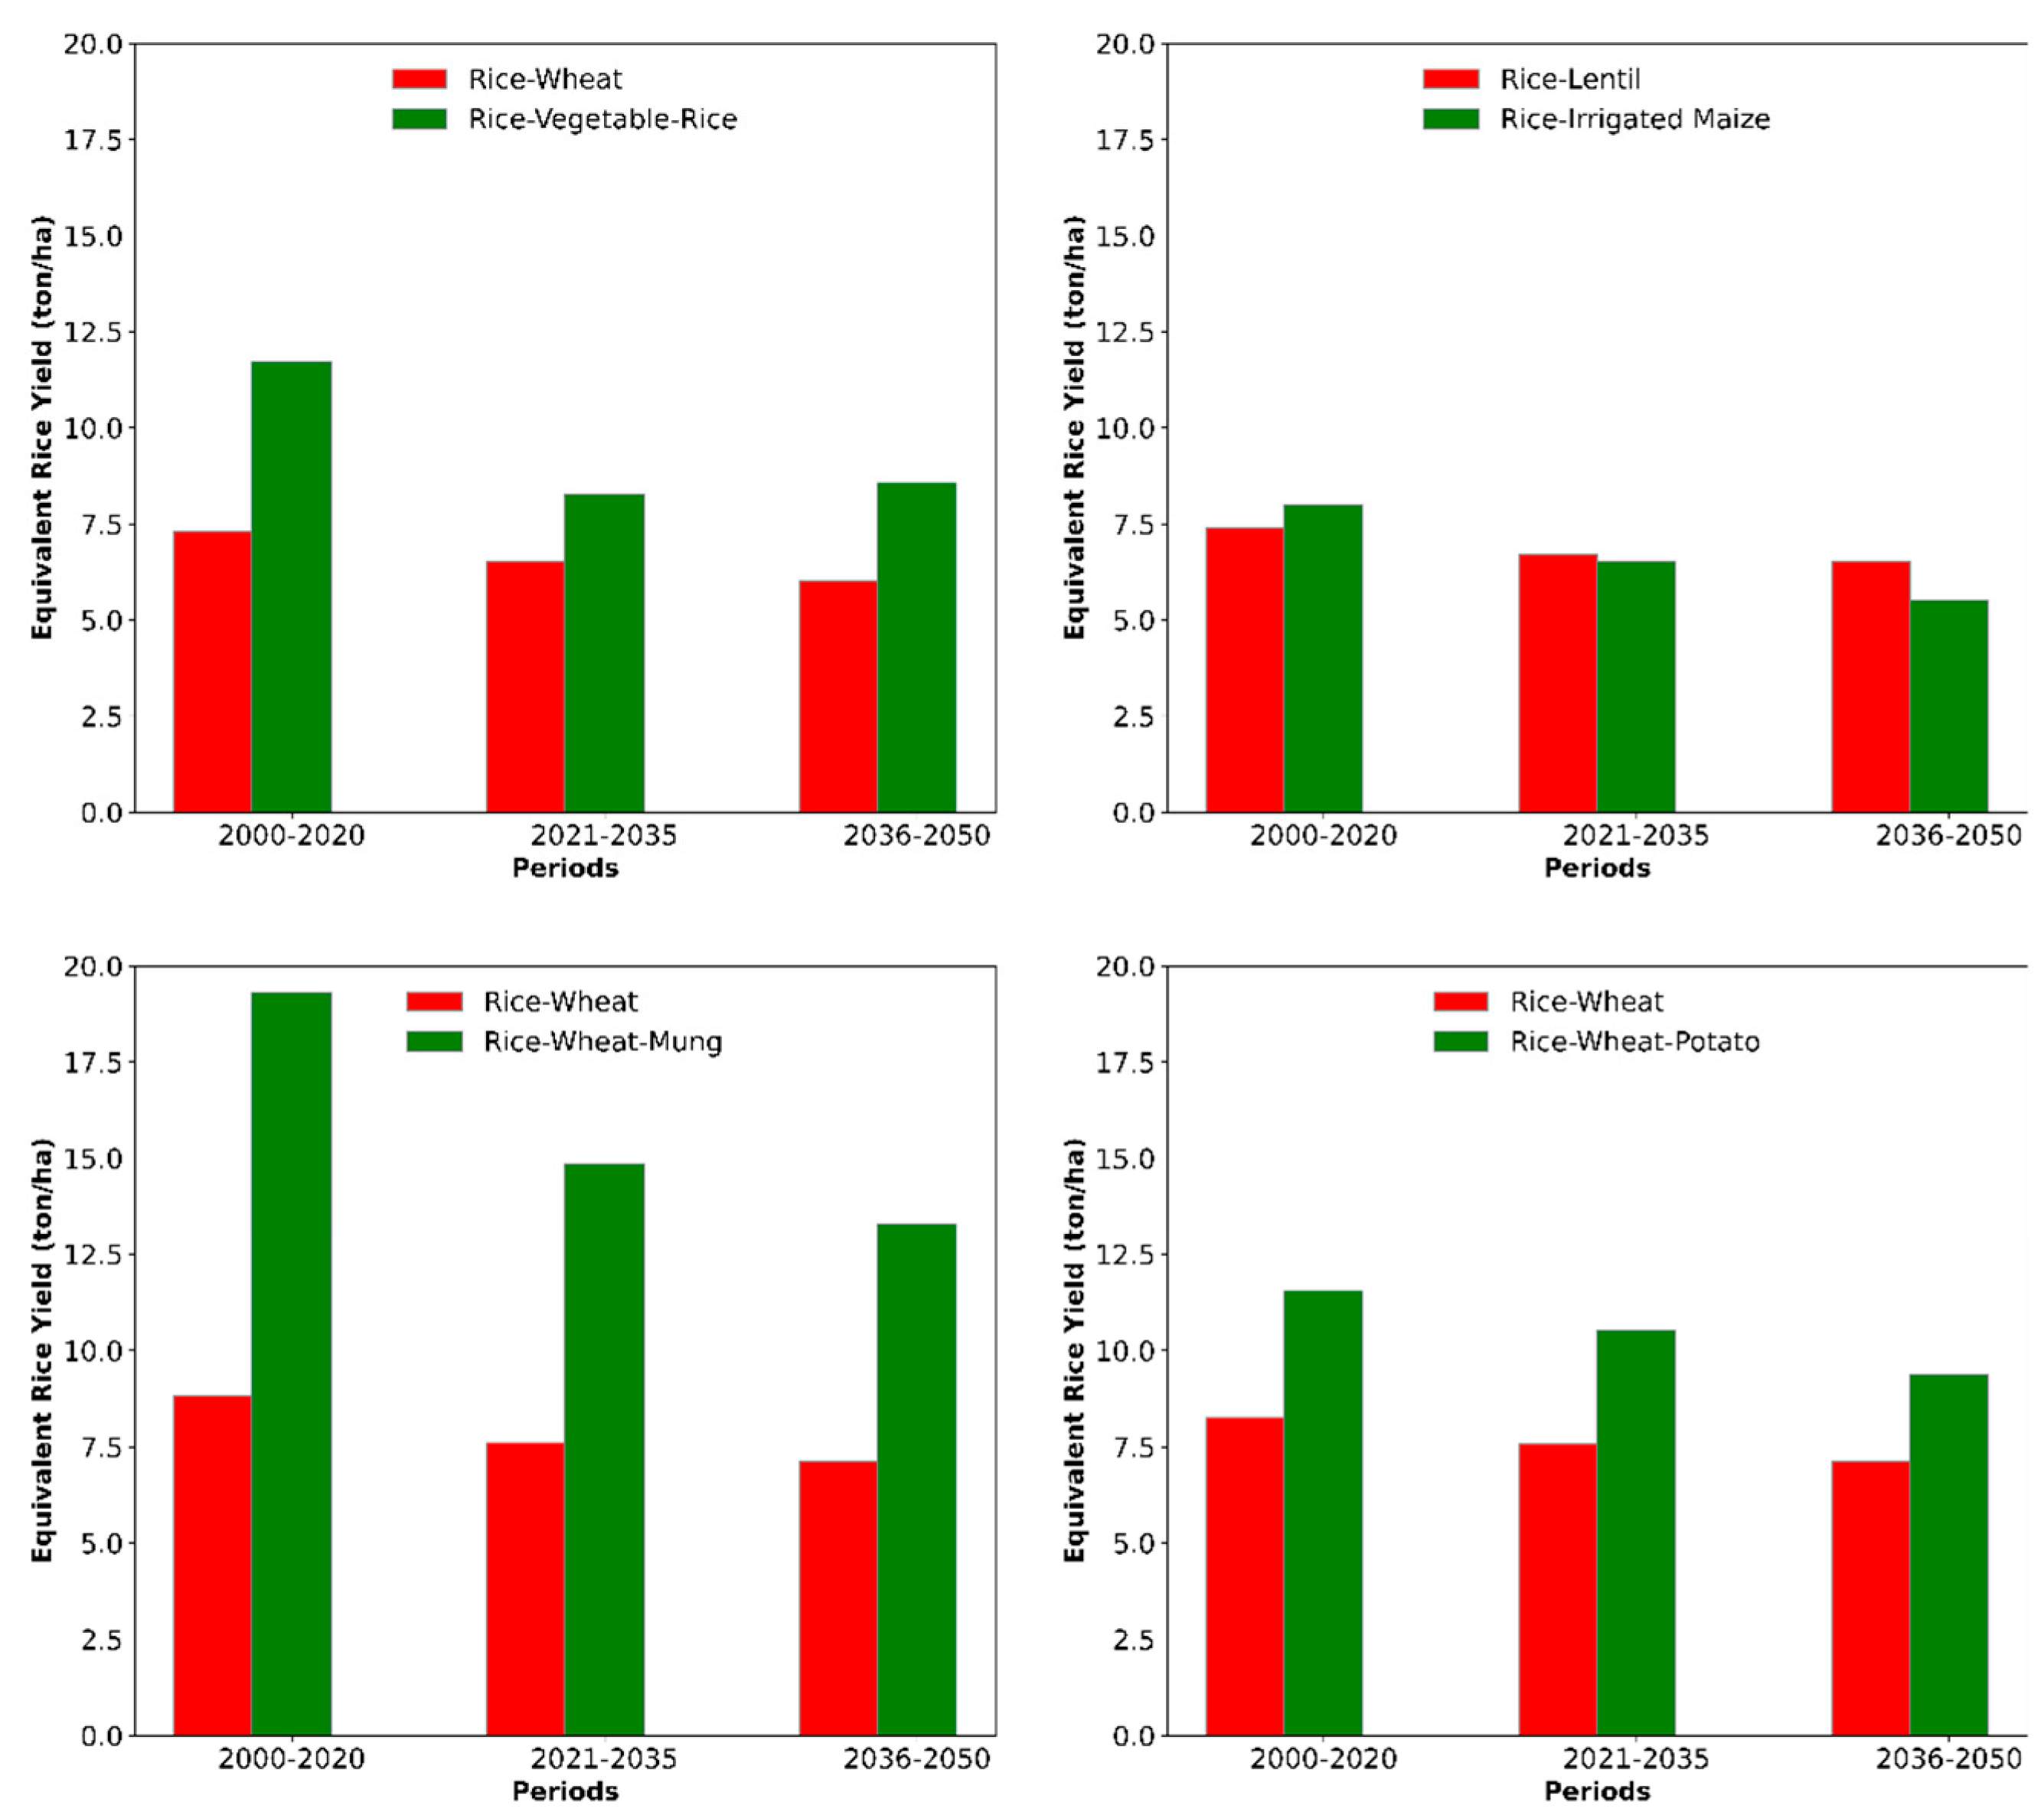
3.7. Impact on Rice Equivalent Yield

Because we simulated the potential production of different species, the comparison of crop yield for different scenarios was also performed using rice equivalent yield (REY). REY was calculated by converting the yield of non-rice crops into equivalent rice yield based on the local price of different crops as described by [63]. Our model outputs and data processing suggest that REY for rice–tomato–rice was greater than that of the most common rice–wheat sequences practiced by farmers (Figure 9). Conversely, rice–maize rotations generated lower REY compared to rice–lentil due to higher prices for lentil (Figure 9). Similarly, the REY for rice–wheat–mung triple crop sequence was 118% higher than rice–wheat in the current term, and 96% greater during the near-term future (2021–3035), which later declined to 87% during mid-term future (2035–2050) (Figure 9). REY for rice–potato was 61%, 65%, and 35% during the current term, near term (2021–3035), and mid-term future (2035–2050) (Figure 9).
However, the difference between the near- and mid-term future scenarios for REY was small, suggesting that diversified systems of production could be attractive from an economic perspective even under climate change. For rice–lentil, and rice–wheat–mung cropping sequences, the added benefits of improved soil fertility from legume cultivation and lower irrigation requirements may further underscore its attractiveness compared to the rice–maize, and rice–wheat scenario. Under the projected climate change scenarios, simulated crop yield and production for the winter and spring season were low even after sufficient irrigation and fertilizer was provided because of shortened growing periods and temperature stress. These results indicated that sustainable irrigation development pathways need to not only be based on sufficient water availability and recharge; adaptation to changing temperature regimes is similarly important. Assessing which combination of field level interventions, planting time adjustments, and cultivar choices are best adapted to climatic conditions will be crucial to support irrigation development.

4. Study Assumptions and Limitations

Since only one regional climate model simulation, the NOAA_RegCM4 RCM, was used to drive the hydrological model in this study, our model outputs may have some uncertainties compared use of ensemble means of multiple RCMs [64]. The climate change scenario used in this study is just one of many plausible possibilities. Since the same correction algorithm was applied to historical and future climate data, use of bias correction methods for future conditions may result in different outcomes for the baseline model parametrization. We however suggest that the good performance observed during the parameterization period is nonetheless likely to behave similarly under conditions of a changing future climate. Previous studies have for example shown that surface temperatures over South Asia are projected to increase by more than the global average [65,66]. Nonetheless, the climate model we selected for this study showed a very slight decrease in temperature. This is unusual when compared to previous research [65,66]. Future research should therefore compare our results to the ensemble mean of bias corrected RCMs throughout the entire simulation period. Increases in in future temperature are likely to affect streamflow, groundwater reserves, and crop production. As such, the results of put preliminary study should be interpreted cautiously.
The data used for the development of SWAT model and scenarios were based farmer survey data and expert consultation. We reasonably assume that these data have captured potential spatial variation in crop management practices, as described in [1]. Likewise, the observed streamflow, crop yield, and groundwater observation well depth data utilized some measurement uncertainties and data gaps that were filled through interpolation methods. Such data limitations are however not uncommon in developing countries in which strong hydrological monitoring systems have not been mandated by policy and regularly implemented. Lastly, the SWAT model uses a relatively coarse approach in assessing groundwater dynamics and, therefore, output obtained from this model should only be considered as relative indicators, and not as absolute numbers.

5. Summary and Conclusions

According to RCM data, average rainfall could increase during the dry season (October to May) for near and mid-term future in western Nepal. Despite the increase in precipitation, the month of May appears to be associated with the highest increase in streamflow, indicating the earlier potential for opening sluice gates to fill irrigation canals and recharge aquifers. However, streamflow is not sufficient to provide full and year-round irrigation for intensified cropping systems. Similarly, our simulations also suggest that sole use of groundwater for irrigation will not be feasible. Increased crop intensity and crop diversification in western Nepal will require planned conjunctive use of surface water in the monsoon season so that ground and surface water can be used for irrigation during dry season of a year. As such, our simulations suggest that groundwater pumping for irrigation during the monsoon season should be limited as much as possible to conserve aquifers for the dry season.
A decrease in mean temperature is likely slow plant growth and reduce leaf chlorophyll content, thereby lowering productivity [67]. Conversely, more timely crop planting may assist in mitigating thermal stress. Crop species choice can have a significant impact on water balance. The rice-vegetable-rice scenario in our study had the highest impact on simulated water balances due to the need to provide irrigation for rice during the months associated with high evapotranspiration. Diversified and high value cropping scenarios are generally feasible from a water resource perspective but require explicit supporting input and output markets in order to be feasible. Crops like tomatoes, potatoes, lentils, and mungbean can provide significant returns to investment due to their larger revenue potential. They also tend to occupy smaller land areas, leaving additional land available for diversification and growth of other crops. However, the reduction in simulated yield of these crops during the near-term and mid-term future compared to the current period resulted from temperature stress as average temperature based on climate change data decreased. This was despite an increase in average rainfall amount and intensity under our climate change simulation. An effective adaptation strategy requires irrigation intensification to be conjunctive and bundled with agronomic strategies that account for differences in temperature. Although preliminary, our results show how irrigation intensification and crop diversification based on future climate scenarios are crucial can provide valuable insights for land use patterns and their potential effect on food and water security, with important implications for farmers’ livelihoods.

Author Contributions

A.R. developed models, analyzed model outputs, and wrote the draft manuscript. R.S. guided research. T.J.K. acquired funding, developed the conceptual research framework, guided research, and reviewed and edited the manuscript; A.U., Y.B., N.S. and G.P.P. reviewed and edited the manuscript. All authors have read and agreed to the published version of the manuscript.

Funding

This work was supported by United States Agency for International Development (USAID) and Bill & Melinda Gates Foundation (Grant Number: INV-029117) through CGIAR Regional Integrated Initiative Transforming Agrifood Systems in South Asia, or TAFSSA (https://www.cgiar.org/initiative/20-transforming-agrifood-systems-in-south-asia-tafssa/, accessed on 25 February 2022).

Informed Consent Statement

Not applicable.

Data Availability Statement

Not applicable.

Acknowledgments

This study is made possible by the financial support from United States Agency for International Development (USAID) and the Bill and Melinda Gates Foundation under Cereal Systems Initiative for South Asia (CSISA) -Nepal COVID-19 Response and Resilience Activity. This work was also supported in part by the CGIAR Regional Integrated Initiative Transforming Agrifood Systems in South Asia, or TAFSSA (https://www.cgiar.org/initiative/20-transforming-agrifood-systems-in-south-asia-tafssa/, accessed on 25 February 2022). The contents of this paper do not necessarily reflect the views of USAID or the United States Government and shall not be used for advertising purposes.

Conflicts of Interest

The authors declare no conflict of interest.

References

  1. Urfels, A.; Khadka, M.; Shrestha, N.; Pavelic, P.; Risal, A.; Uprety, L.; Shrestha, G.; Dile, Y.; McDonald, A.J.; Pandey, V.P.; et al. A Framework for Sustainable and Inclusive Irrigation Development in Western Nepal; The Cereal Systems Initiative for South Asia (CSISA): Kathmandu, Nepal, 2022. [Google Scholar]
  2. Urfels, A.; McDonald, A.J.; Krupnik, T.J.; van Oel, P.R. Drivers of Groundwater Utilization in Water-Limited Rice Production Systems in Nepal. Water Int. 2020, 45, 39–59. [Google Scholar] [CrossRef] [PubMed] [Green Version]
  3. IMP. Irrigation Master Plan Preparation through Integrated River Basin Planning, 2019; Water Resources Project Preparatory Facility Department of Irrigation Ministry of Irrigation Nepal: Kathmandu, Nepal, 2019. [Google Scholar]
  4. Nepal, S.; Neupane, N.; Belbase, D.; Pandey, V.P.; Mukherji, A. Achieving Water Security in Nepal through Unravelling the Water-Energy-Agriculture Nexus. Int. J. Water Resour. Dev. 2021, 37, 67–93. [Google Scholar] [CrossRef] [Green Version]
  5. Guan, X.; Zhang, J.; Bao, Z.; Liu, C.; Jin, J.; Wang, G. Past Variations and Future Projection of Runoff in Typical Basins in 10 Water Zones, China. Sci. Total Environ. 2021, 798, 149277. [Google Scholar] [CrossRef] [PubMed]
  6. Teklay, A.; Dile, Y.T.; Asfaw, D.H.; Bayabil, H.K.; Sisay, K.; Ayalew, A. Modeling the Impact of Climate Change on Hydrological Responses in the Lake Tana Basin, Ethiopia. Dyn. Atmos. Ocean. 2022, 97, 101278. [Google Scholar] [CrossRef]
  7. Sun, L.; Wang, Y.-Y.; Zhang, J.-Y.; Yang, Q.-L.; Bao, Z.-X.; Guan, X.-X.; Guan, T.-S.; Chen, X.; Wang, G.-Q. Impact of Environmental Change on Runoff in a Transitional Basin: Tao River Basin from the Tibetan Plateau to the Loess Plateau, China. Adv. Clim. Chang. Res. 2019, 10, 214–224. [Google Scholar] [CrossRef]
  8. Parajuli, P.B.; Risal, A. Evaluation of Climate Change on Streamflow, Sediment, and Nutrient Load at Watershed Scale. Climate 2021, 9, 165. [Google Scholar] [CrossRef]
  9. Chen, H.; Zhang, W.; Gao, H.; Nie, N. Climate Change and Anthropogenic Impacts on Wetland and Agriculture in the Songnen and Sanjiang Plain, Northeast China. Remote Sens. 2018, 10, 356. [Google Scholar] [CrossRef] [Green Version]
  10. IPCC. Climate Change 2014: Synthesis Report. Contribution of Working Groups I, II and III to the Fifth Assessment Report of the Intergovernmental Panel on Climate Change; IPCC: Geneva, Switzerland, 2014; pp. 1–151. [Google Scholar]
  11. Tucker, J.; Daoud, M.; Oates, N.; Few, R.; Conway, D.; Mtisi, S.; Matheson, S. Social Vulnerability in Three High-Poverty Climate Change Hot Spots: What Does the Climate Change Literature Tell Us? Reg. Environ. Chang. 2015, 15, 783–800. [Google Scholar] [CrossRef] [Green Version]
  12. Shrestha, A.B.; Aryal, R. Climate Change in Nepal and Its Impact on Himalayan Glaciers. Reg. Environ. Chang. 2011, 11, 65–77. [Google Scholar] [CrossRef]
  13. Shrestha, R.P.; Nepal, N. An Assessment by Subsistence Farmers of the Risks to Food Security Attributable to Climate Change in Makwanpur, Nepal. Food Secur. 2016, 8, 415–425. [Google Scholar] [CrossRef]
  14. Mainali, J.; Pricope, N.G. High-Resolution Spatial Assessment of Population Vulnerability to Climate Change in Nepal. Appl. Geogr. 2017, 82, 66–82. [Google Scholar] [CrossRef]
  15. Mishra, Y.; Babel, M.S.; Nakamura, T.; Mishra, B. Impacts of Climate Change on Irrigation Water Management in the Babai River Basin, Nepal. Hydrology 2021, 8, 85. [Google Scholar] [CrossRef]
  16. Krishnamurthy, C.K.B.; Lall, U.; Kwon, H.-H. Changing Frequency and Intensity of Rainfall Extremes over India from 1951 to 2003. J. Clim. 2009, 22, 4737–4746. [Google Scholar] [CrossRef] [Green Version]
  17. Mishra, Y.; Nakamura, T.; Babel, M.S.; Ninsawat, S.; Ochi, S. Impact of Climate Change on Water Resources of the Bheri River Basin, Nepal. Water 2018, 10, 220. [Google Scholar] [CrossRef] [Green Version]
  18. Babel, M.S.; Bhusal, S.P.; Wahid, S.M.; Agarwal, A. Climate Change and Water Resources in the Bagmati River Basin, Nepal. Theor. Appl. Climatol. 2014, 115, 639–654. [Google Scholar] [CrossRef]
  19. Gautam, D.K.; Dulal, K. Determination of Threshold Runoff for Flood Early Warning in Nepalese Rivers. IDRiM J. 2013, 3, 126–136. [Google Scholar] [CrossRef] [Green Version]
  20. Castillo, C.; Robines, L.; Poudel, A.; MacNair, K.L.; Gajewski, C. Impact of Climate Change on Forests and Biodiversity and Current Adaptation Practices-A Case Study of Nepal. Samriddhi J. Dev. Stud. 2014, 7, 5–12. Available online: https://www.researchgate.net/publication/288357872_Impact_of_Climate_Change_on_Forests_and_Biodiversity_and_Current_Adaptation_Practices_-_A_Case_Study_of_Nepal (accessed on 25 February 2022).
  21. Ratha, D.K.; De, S.; Schuettler, K.; Seshan, G.K.; Yameogo, N.D. Migration and Remittances: Recent Developments and Outlook-Transit Migration; World Bank: Washington, DC, USA, 2018. [Google Scholar]
  22. Poudel, S.; Shaw, R. The Relationships between Climate Variability and Crop Yield in a Mountainous Environment: A Case Study in Lamjung District, Nepal. Climate 2016, 4, 13. [Google Scholar] [CrossRef] [Green Version]
  23. Sheikh, M.M.; Manzoor, N.; Ashraf, J.; Adnan, M.; Collins, D.; Hameed, S.; Manton, M.J.; Ahmed, A.U.; Baidya, S.K.; Borgaonkar, H.P. Trends in Extreme Daily Rainfall and Temperature Indices over South Asia. Int. J. Climatol. 2015, 35, 1625–1637. [Google Scholar] [CrossRef]
  24. Wassmann, R.; Jagadish, S.V.K.; Sumfleth, K.; Pathak, H.; Howell, G.; Ismail, A.; Serraj, R.; Redona, E.; Singh, R.K.; Heuer, S. Regional Vulnerability of Climate Change Impacts on Asian Rice Production and Scope for Adaptation. Adv. Agron. 2009, 102, 91–133. [Google Scholar]
  25. Poudel, S.; Shaw, R. Demographic Changes, Economic Changes and Livelihood Changes in the HKH Region. In Mountain Hazards and Disaster Risk Reduction; Springer: Berlin/Heidelberg, Germany, 2015; pp. 105–123. [Google Scholar]
  26. Poudel, A. Migration, Youth Workshops and Forestry: Case Studies from Nepal. Trees For. People 2021, 3, 100057. [Google Scholar] [CrossRef]
  27. Poudel, A.; Kennedy, J.; Basnet, S.M.S.; Pokhrel, P. Federalism and Environment in Nepal: Issues and Challenges. J. Dev. Stud. 2019, 5, 3–10. [Google Scholar]
  28. Karki, R.; Talchabhadel, R.; Aalto, J.; Baidya, S.K. New Climatic Classification of Nepal. Theor. Appl. Climatol. 2016, 125, 799–808. [Google Scholar] [CrossRef]
  29. Shrestha, A.B.; Wake, C.P.; Mayewski, P.A.; Dibb, J.E. Precipitation Fluctuations in the Himalaya and Its Vicinity: An Analysis Based on Temperature Records from Nepal. Int. J. Clim. 2000, 20, 317–327. [Google Scholar] [CrossRef]
  30. Lone, S.A.; Jeelani, G.; Deshpande, R.D.; Mukherjee, A.; Jasechko, S.; Lone, A. Meltwaters Dominate Groundwater Recharge in Cold Arid Desert of Upper Indus River Basin (UIRB), Western Himalayas. Sci. Total Environ. 2021, 786, 147514. [Google Scholar] [CrossRef]
  31. Jeelani, G.; Deshpande, R.D.; Shah, R.A.; Hassan, W. Influence of Southwest Monsoons in the Kashmir Valley, Western Himalayas. Isotopes Environ. Health Stud. 2017, 53, 400–412. [Google Scholar] [CrossRef]
  32. Kapri, K.; Ghimire, S. Migration, Remittance, and Agricultural Productivity: Evidence from the Nepal Living Standard Survey. World Dev. Perspect. 2020, 19, 100198. [Google Scholar] [CrossRef]
  33. Shrestha, S.R.; Tripathi, G.N.; Laudari, D. Groundwater Resources of Nepal: An Overview. Groundw. South Asia. 2018, 169–193. [Google Scholar] [CrossRef]
  34. Poudel, A. Water Security in Nepal—Analysis of Groundwater Resource and Governance. In WaterAid Multi-Country Research on Water Security: HSBC Water Program; Global Synthesis Report; WaterAid: London, UK, 2019. [Google Scholar]
  35. Gonzalez, P.; Neilson, R.P.; Lenihan, J.M.; Drapek, R.J. Global Patterns in the Vulnerability of Ecosystems to Vegetation Shifts Due to Climate Change. Glob. Ecol. Biogeogr. 2010, 19, 755–768. [Google Scholar] [CrossRef]
  36. Flato, G.; Marotzke, J.; Abiodun, B.; Braconnot, P.; Chou, S.C.; Collins, W.; Cox, P.; Driouech, F.; Emori, S.; Eyring, V. Evaluation of Climate Models. In Climate Change 2013: The Physical Science Basis. Contribution of Working Group I to the Fifth Assessment Report of the Intergovernmental Panel on Climate Change; Cambridge University Press: Cambridge, UK, 2014; pp. 741–866. [Google Scholar]
  37. Emami, F.; Koch, M. Sustainability Assessment of the Water Management System for the Boukan Dam, Iran, Using CORDEX-South Asia Climate Projections. Water 2018, 10, 1723. [Google Scholar] [CrossRef] [Green Version]
  38. Pandey, V.P.; Shrestha, D.; Adhikari, M. Characterizing Natural Drivers of Water-Induced Disasters in a Rain-Fed Watershed: Hydro-Climatic Extremes in the Extended East Rapti Watershed, Nepal. J. Hydrol. 2021, 598, 126383. [Google Scholar] [CrossRef]
  39. Dhaubanjar, S.; Prasad Pandey, V.; Bharati, L. Climate Futures for Western Nepal Based on Regional Climate Models in the CORDEX-SA. Int. J. Climatol. 2020, 40, 2201–2225. [Google Scholar] [CrossRef]
  40. Pandey, V.P.; Dhaubanjar, S.; Bharati, L.; Thapa, B.R. Spatio-Temporal Distribution of Water Availability in Karnali-Mohana Basin, Western Nepal: Hydrological Model Development Using Multi-Site Calibration Approach (Part-A). J. Hydrol. Reg. Stud. 2020, 29, 100690. [Google Scholar] [CrossRef]
  41. Wu, K.; Johnston, C.A. Hydrologic Response to Climatic Variability in a Great Lakes Watershed: A Case Study with the SWAT Model. J. Hydrol. 2007, 337, 187–199. [Google Scholar] [CrossRef]
  42. Shrestha, S.; Shrestha, M.; Shrestha, P.K. Evaluation of the SWAT Model Performance for Simulating River Discharge in the Himalayan and Tropical Basins of Asia. Hydrol. Res. 2018, 49, 846–860. [Google Scholar] [CrossRef] [Green Version]
  43. Dahal, V.; Shakya, N.M.; Bhattarai, R. Estimating the Impact of Climate Change on Water Availability in Bagmati Basin, Nepal. Environ. Process. 2016, 3, 1–17. [Google Scholar] [CrossRef]
  44. Devkota, L.P.; Gyawali, D.R. Impacts of Climate Change on Hydrological Regime and Water Resources Management of the Koshi River Basin, Nepal. J. Hydrol. Reg. Stud. 2015, 4, 502–515. [Google Scholar] [CrossRef] [Green Version]
  45. Dahal, P.; Shrestha, M.L.; Panthi, J.; Pradhananga, D. Modeling the Future Impacts of Climate Change on Water Availability in the Karnali River Basin of Nepal Himalaya. Environ. Res. 2020, 185, 109430. [Google Scholar] [CrossRef]
  46. Bhatta, B.; Shrestha, S.; Shrestha, P.K.; Talchabhadel, R. Evaluation and Application of a SWAT Model to Assess the Climate Change Impact on the Hydrology of the Himalayan River Basin. Catena 2019, 181, 104082. [Google Scholar] [CrossRef]
  47. Budhathoki, A.; Babel, M.S.; Shrestha, S.; Meon, G.; Kamalamma, A.G. Climate Change Impact on Water Balance and Hydrological Extremes in Different Physiographic Regions of the West Seti River Basin, Nepal. Ecohydrol. Hydrobiol. 2021, 21, 79–95. [Google Scholar] [CrossRef]
  48. Neitsch, S.L.; Arnold, J.G.; Kiniry, J.R.; Williams, J.R. Soil and Water Assessment Tool Theoretical Documentation Version 2009; Texas Water Resources Institute: College Station, TX, USA, 2011. [Google Scholar]
  49. Gashaw, T.; Dile, Y.T.; Worqlul, A.W.; Bantider, A.; Zeleke, G.; Bewket, W.; Alamirew, T. Evaluating the Effectiveness of Best Management Practices on Soil Erosion Reduction Using the SWAT Model: For the Case of Gumara Watershed, Abbay (Upper Blue Nile) Basin. Environ. Manag. 2021, 68, 240–261. [Google Scholar] [CrossRef] [PubMed]
  50. Maharjan, G.R.; Park, Y.S.; Kim, N.W.; Shin, D.S.; Choi, J.W.; Hyun, G.W.; Jeon, J.-H.; Ok, Y.S.; Lim, K.J. Evaluation of SWAT Sub-Daily Runoff Estimation at Small Agricultural Watershed in Korea. Front. Environ. Sci. Eng. 2013, 7, 109–119. [Google Scholar] [CrossRef]
  51. Nie, W.; Yuan, Y.; Kepner, W.; Nash, M.S.; Jackson, M.; Erickson, C. Assessing Impacts of Landuse and Landcover Changes on Hydrology for the Upper San Pedro Watershed. J. Hydrol. 2011, 407, 105–114. [Google Scholar] [CrossRef]
  52. Risal, A.; Parajuli, P.B.; Ouyang, Y. Impact of BMPs on Water Quality: A Case Study in Big Sunflower River Watershed, Mississippi. Int. J. River Basin Management. 2021, 1–43. [Google Scholar] [CrossRef]
  53. USGS. United States Geological Survey, Global Visualization (GLOVIS) Portal. Available online: http://earthexplorer.usgs.gov/ (accessed on 7 February 2021).
  54. CIMMYT. International Maize and Wheat Improvement Center (CIMMYT). Available online: https://www.cimmyt.org/resources/data/ (accessed on 15 August 2021).
  55. ICIMOD. Land Cover of Nepal. 2010. Available online: http://rds.icimod.org/Home/DataDetail?metadataId=9224 (accessed on 20 June 2021).
  56. ISRIC. International Soil Reference and Information Centre (ISRIC) Soil Data Hub. Available online: https://www.isric.org/explore/isric-soil-data-hub (accessed on 18 June 2021).
  57. DHM. Department of Hydrology and Meteorology, Kathmandu Nepal. Available online: https://www.dhm.gov.np/ (accessed on 25 June 2021).
  58. Funk, C.; Peterson, P.; Landsfeld, M.; Pedreros, D.; Verdin, J.; Shukla, S.; Michaelsen, J. The Climate Hazards Infrared Precipitation with Stations—A New Environmental Record for Monitoring Extremes. Sci Data. 2015, 2, 150066. [Google Scholar] [CrossRef] [PubMed] [Green Version]
  59. ESGF. The Earth System Grid Federation. Available online: https://esgf-node.llnl.gov/search/esgf-llnl/ (accessed on 18 September 2021).
  60. Van Vuuren, D.P.; Edmonds, J.; Kainuma, M.; Riahi, K.; Thomson, A.; Hibbard, K.; Hurtt, G.C.; Kram, T.; Krey, V.; Lamarque, J.-F. The Representative Concentration Pathways: An Overview. Clim. Chang. 2011, 109, 5–31. [Google Scholar] [CrossRef]
  61. Rathjens, H.; Bieger, K.; Srinivasan, R.; Chaubey, I.; Arnold, J.G. CMhyd User Manual. Documentation for Preparing Simulated Climate Change Data for Hydrologic Impact Studies. 2016. Available online: https://swat.tamu.edu/media/115265/bias_cor_man.pdf (accessed on 12 September 2021).
  62. Wang, X.; Folberth, C.; Skalsky, R.; Wang, S.; Chen, B.; Liu, Y.; Chen, J.; Balkovic, J. Crop Calendar Optimization for Climate Change Adaptation in Rice-Based Multiple Cropping Systems of India and Bangladesh. Agric. For. Meteorol. 2022, 315, 108830. [Google Scholar] [CrossRef]
  63. Lal, B.; Gautam, P.; Panda, B.B.; Raja, R.; Singh, T.; Tripathi, R.; Shahid, M.; Nayak, A.K. Crop and Varietal Diversification of Rainfed Rice Based Cropping Systems for Higher Productivity and Profitability in Eastern India. PLoS ONE 2017, 12, e0175709. [Google Scholar]
  64. Park, C.; Min, S.-K.; Lee, D.; Cha, D.-H.; Suh, M.-S.; Kang, H.-S.; Hong, S.-Y.; Lee, D.-K.; Baek, H.-J.; Boo, K.-O.; et al. Evaluation of Multiple Regional Climate Models for Summer Climate Extremes over East Asia. Clim. Dyn. 2016, 46, 2469–2486. [Google Scholar] [CrossRef]
  65. Legg, S. IPCC, 2021: Climate Change 2021—The Physical Science basis. Interaction 2021, 49, 44–45. [Google Scholar]
  66. Sanjay, J.; Krishnan, R.; Shrestha, A.B.; Rajbhandari, R.; Ren, G.Y. Downscaled climate change projections for the Hindu Kush Himalayan region using CORDEX South Asia regional climate models. Adv. Clim. Chang. Res. 2017, 8, 185–198. [Google Scholar] [CrossRef]
  67. Yang, Z.Q.; Han, D.; Wang, L.; Jin, Z.F. Changes in Photosynthetic Parameters and Antioxidant Enzymatic Activity of Four Tea Varieties during a Cold Wave. Acta Ecol. Sin 2016, 36, 629–641. [Google Scholar]
Figure 1. Major watersheds, their river networks, hydrological and meteorological stations, major irrigation projects and administrative regions within the study area in western Nepal.
Hydrology 09 00132 g001
Figure 2. Methodological framework of the study.
Hydrology 09 00132 g002
Figure 3. The trend of potential average annual rainfall in western Nepal according to the climate change scenarios obtained from the NOAA_RegCM4 model.
Hydrology 09 00132 g003
Figure 4. Monthly average precipitation during current (2000–2021), and potential near-term future (2022–2035) and mid-term future (2036–2050) precipitation in western Nepal derived from the NOAA_RegCM4 model. The middle line of the box represents the median, the bottom line of the box represents 1st quartile, the top line of the box represents 3rd quartile and the vertical lines extending from the ends of the box, represent the minimum and maximum value.
Hydrology 09 00132 g004
Figure 5. The trend of average maximum and minimum temperature according to the climate change scenarios obtained from NOAA_RegCM4 model for western Nepal.
Hydrology 09 00132 g005
Figure 6. Model outputs for monthly average, minimum, and maximum temperature during near-term future (2022–2035), and mid-term future (2036–2050) in western Nepal.
Hydrology 09 00132 g006
Figure 7. Average annual streamflow according to each cropping system scenario considered at Mahakali (a), Karnali(b), Babai (c), and West Rapti(d) watersheds for the current period (2000–2021), and modeled near-term future (2022–2035), and mid-term future (2036–2050) periods.
Hydrology 09 00132 g007
Figure 8. Groundwater (GW) fluctuation for rice–wheat and rice–vegetable–rice (top left), for rice-rainfed lentil and rice-irrigated maize (top right), rice–wheat and rice–wheat–mung (bottom left), and rice–wheat and rice–potato (bottom right), averaged over subbasins of multiple watersheds where the scenarios were implemented (note: change in GW depth is indicative of the relative trend in GW levels— not actual water table fluctuation).
Hydrology 09 00132 g008
Figure 9. Rice equivalent yield for rice-wheat and rice-potato-rice (upper left), rice-rainfed lentil and rice-irrigated maize (top right), rice-wheat and rice-wheat-mung (bottom left), and rice-wheat and rice-wheat-potato cropping systems simulated in different time periods in western Nepal (bottom right).
Hydrology 09 00132 g009
Table 1. Percent of total agricultural land in each study watershed that can be provided with groundwater irrigation sustainably for Rice–Wheat, Rice–Vegetable–Rice, Rice–Lentil, Rice–Maize, Rice–Wheat-Mung, and Rice–Potato cropping sequences. Cropping sequences not shown in particular watersheds (which are denoted by ‘—’) were deemed unfeasible based on participatory scenario development as described in [1].
WatershedTime PeriodRice–Wheat (%)Rice–Vegetable–Rice (%)Rice–Rainfed Lentil (%)Rice–Irrigated Maize (%)Rice–Wheat–Mung (%)Rice–Potato (%)
Mahakali2000–20209269
2021–20358972
2035–20509673
Karnali2000–20203945633127
2021–20354461933542
2035–20503647764039
Babai2000–2020644813961
2021–2035645119581
2035–2050625218377
West Rapti2000–20203559313633
2021–20355390494443
2035–20505592494446
Table 2. Average crop yield for Rice–Wheat and Rice–Vegetable–Rice during current, near future and midterm future.
Rice–WheatRice–Tomato–Rice
YearRice Yield (t/ha)Wheat Yield (t/ha)Rice Yield (t/ha)Tomato Yield (t/ha)Spring Rice Yield (t/ha)
2000–204.22.84.21.35.3
2021–353.72.53.70.73.4
2035–503.723.80.63.7
Table 3. Average crop yield for Rice-rainfed Lentil and Rice-irrigated Maize scenario implemented in Karnali, West Rapti, and Babai watersheds during current, near future and midterm future.
Rice–LentilRice–Maize
YearRice Yield (t/ha)Lentil Yield (t/ha)Rice Yield (t/ha)Maize Yield (t/ha)
2000–204.01.34.03.9
2021–353.01.42.93.5
2035–503.11.33.12.4
Table 4. Average crop yield for rice-wheat and rice-wheat-mung scenario implemented in Karnali and West Rapti watersheds during current, near future and midterm future.
Rice–WheatRice–Wheat–Mungbean
YearRice Yield (t/ha)Wheat Yield (t/ha)Rice Yield (t/ha)Wheat Yield (t/ha)Mungbean Yield (t/ha)
2000–204.04.34.04.72.9
2021–353.04.13.02.52
2035–503.13.63.12.11.7
Table 5. Average crop yield for rice–wheat and rice–potato scenario implemented in urban hilly and Terai sub-basins of West Rapti watershed during current, near future and midterm future.
Rice–WheatRice–Potato
YearRice Yield (t/ha)Wheat Yield (t/ha)Rice Yield (t/ha)Potato Yield (t/ha)
2000–202.53.33.43.2
2021–352.1332.9
2035–502.2332.2
Publisher’s Note: MDPI stays neutral with regard to jurisdictional claims in published maps and institutional affiliations.

