Review

Tritium as a Tracer of Leachate Contamination in Groundwater: A Brief Review of Tritium Anomalies Method

1
Dipartimento di Scienze e Ingegneria della Materia, dell’Ambiente ed Urbanistica (SIMAU), Università Politecnica delle Marche, Via Brecce Bianche 12, 60122 Ancona, Italy
2
Scuola di Scienze e Tecnologie, Sezione di Geologia, Università di Camerino, Via Gentile III da Varano, 62032 Camerino, Italy
*
Author to whom correspondence should be addressed.
Hydrology 2022, 9(5), 75; https://doi.org/10.3390/hydrology9050075
Submission received: 31 March 2022 / Revised: 24 April 2022 / Accepted: 27 April 2022 / Published: 29 April 2022

Abstract

:
Environmental isotopes are essential in hydrogeological studies, thanks to their contribution to the understanding of aquifers dynamics, vulnerability, water resources assessment, and management issues. The environmental isotopic approach plays a vital role in tracing the hydrological cycle and identifying various sources of contamination in the environment and gives independent information concerning what can be determined by a traditional hydrogeological study. Even in the framework of COP-26, isotopes have been indicated as fingerprints of climate change and therefore suitable for the evaluation of water balance and assessment of processes involved therein; in pollution studies they are used as fundamental support of traditional geochemical measures. Tritium, in particular, has been used since the 1960s to identify potential leaks in the containment walls of waste disposal sites, since its presence in the leachate (at very high levels in some cases) depends on the incorrect waste disposal of some peculiar items. Its use as a tracer of pollution by landfills is highlighted and emphasized by the very low concentrations of tritium in the natural environment. By comparing tritium content of leachate to that of water downflow from the waste disposal site, it is therefore possible to establish with a good success rate whether leachate have migrated or not out of the landfill, in the surrounding environment. An additional potential of tritium is to give a prompt indication of pollution risk in the environment indicating leaching even before the chemical indicator of pollution can be detected. This article wants to provide a contribution to the scientific community, collecting all the existing research in this field and providing data and benchmarks about this method, in particular stressing the role of tritium as an indicator of leachate transfer out of waste disposal sites.

1. Introduction

Environmental tracers are used nowadays in many areas of scientific and technical application, especially thanks to dissemination operated by some international bodies such as IAEA (International Atomic Energy Agency) and UNESCO (United Nations Educational, Scientific and Cultural Organization) [1,2,3,4,5]; from their first appearance in the scientific context, isotopes, in fact, broadened the concept of chemistry, by opening a window into new properties to be implemented even in specific practical contexts [6].
The isotopes of an element are defined as nuclides of the same element, having the same atomic number but different mass number and therefore different mass [7], being more or less abundant depending on the single specific element. Isotopes can be non-stable (when their nucleus decays emitting radiations) or stable. Environmental isotopes are of various kinds of elements, both major and in trace, such as oxygen, hydrogen, carbon, sulphur, nitrogen, strontium, uranium, radon, and lead, which are widely used in a range of different applications, for example in hydrology, hydrogeology, pollution studies, and forensic science [8,9,10,11,12]. In particular, their use as a fingerprint of climate change has been considered from the beginning [13,14,15,16], and in recent times IAEA and WMO (World Meteorological Organization) have presented an event at COP-26 in Glasgow, stressing the importance of isotopes in the study of the impact of climate change.
Other isotopes of less diffuse elements have been applied in the last decades, to add more opportunities in hydrological and hydrogeological studies [17,18,19].
The most frequently used environmental stable isotopes are: δ2H and δ18O of water molecule, δ15N and δ18O (NO3), δ34S (SO42−), and δ13C (CO32− and HCO3). Tritium (the radioactive isotope of hydrogen) has been used especially in groundwater dating, also taking advantage of the thermonuclear experiments occurring in the 1960s around the world [20], which have given a clear marked signal of tritium increase in the environment [21].
The expression “environmental tracer” is given to those isotopes, naturally present in the environment, which can be used to trace a process, a cycle, or a mechanism of transfer that occurs in the environment [6]. In this context, the following may be included: all the processes related to the hydrogeological cycle (i.e., recharge processes and groundwater–surface water interaction, connection among river/lakes) [22,23], geochemical and bio-geochemical transformations [24,25,26,27,28], potential connections among source of contamination and groundwater or surface water [29,30]. In general, a tracer is defined as a substance that is naturally present in the environment (natural tracer) or can be artificially introduced (artificial tracer) in a known concentration, generally with the aim of marking the pathway of surface water or groundwater, to label the water flow [31,32].
Environmental tracers have an added value with respect to hydro-chemical investigation, since the latter indicate only the amount in water of chemical elements at that point, but not providing any data on their origin and processes to which they have been subjected to. Environmental tracers, instead, approximate the identification of the provenance of chemical compounds: in the literature, in fact, several case studies are present reporting reference ranges of values for many different isotopic species [33,34]. In pollution studies, this aspect is of strategic importance, because one can trace the source of contamination responsible for the high concentration of a pollutant of interest, and then compare also different sites with the same conditions.
In some contamination studies, tritium can assume a prominent role. Its concentration, in fact, can be directly connected to the presence of some items in the waste of sanitary landfills, and this was especially true during years in which the delivery of wastes was still uncontrolled. It is important to note, however, that a single item wasted in the landfill can be responsible for high tritium concentration measured in the leachate, even well after the cessation of the effects of the thermonuclear tests.
For this reason, tritium is still considered a good tracer of leachate exit in the surrounding environment, with results often much more suitable than traditional methods based only on the monitoring of chemical concentrations of pollutants.
This review has the main purpose of describing and summarizing the studies reported in the scientific literature reporting the application of tritium as an environmental tracer of landfill pollution, with some case studies used as a paradigm of the tritium activity anomalies method (TAAM). At the end, even a brief guideline with indication and suggestions to follow will be presented, with the aim of underlining the importance of such a method, not only in the past but likely in some present case studies.

2. Background on Tritium

Tritium (3H) is the radioactive isotope of hydrogen, having a half-life of a little more than 12 years; its concentration can be determined by liquid scintillation analysis, after electrolytic enrichment when considering low-level measurements, with machinery equipped with a thick lead wall [35]. Its content can be expressed either by the common radioactive notation (i.e., Bq/L or Ci/L) or the so-called Tritium Unit (TU), which corresponds to 3H/1H ratio of 10−18, i.e., about 0.118 Bq/L.
Tritium is naturally present in the atmosphere and falls during precipitation as water, spreading in a very low concentration in all the components of the water cycle [36]. Current tritium content in precipitation is known thanks to the international network GNIP (Global Network of Isotopes in Precipitation), developed from the 1960s by IAEA and WMO and now available together with GNIR (Global Network of Isotopes in Rivers) [37] at the portal WISER (Water Isotope System for Data Analysis, Visualization and Electronic Retrieval) [38]. Examples of tritium content in rivers (expressed in logarithm scale), provided by the GNIR dataset are shown in Figure 1. In some cases, river discharge data are furnished by the IAEA database [39].
Tritium level in groundwater and surface water is strongly dependent on its concentration in the atmosphere and its potential artificial presence in the environment; the natural content trend is more smoothed than the one recorded in precipitation due to some factors (most of all the percolation of the infiltrated water through the unsaturated zone) which influence the isotopic signature ([40,41,42,43,44,45,46]).
The use of tritium as an environmental tracer (often together with stable water isotopes) particularly in polluted sites, has been developed in the final decades of the last century, especially concerning contamination by Municipal Solid Waste disposals (MSW) and sanitary landfills, and is strictly connected to the high levels found in the leachates of many MSWs [47,48]. These plants are where the domestic wastes are collected and stored, and inside which the leachate develops due to the infiltration of rainwater through wastes; thus charging itself with high concentrated chemical elements and dissolved solids [49]. A question may rise about the reason why high concentrations of tritium in leachate are observed, given that in landfill plants no nuclear reactions can happen, and the answer concerns the occurrence of some items disposed in MSWs containing very high concentrations of tritium, some of them called Gaseous Tritium Lighting Device (GTLDs) [50]. A few units of them are enough to hugely increase the tritium content in the leachate; in particular, clocks and luminous watches (concentration up to 280 MBq/device, i.e., millions to billions of TU, depending on the amount of leachate), luminous signs and neon (up to 7.5 GBq/device) [51], luminous telephone dials (up to 1 GBq/device) [52] and, in a minor part, luminescent paints [53] and biological and pharmacokinetic studies slags contribute to keep the concentration high. Just to give an idea, one single clock can produce about 3 × 10⁸ TU [54].
For landfills working in the past, a source of tritium (in addition to GTLDs) was surely represented by precipitation infiltrating into the plants from the 1950s to the 1970s, more markedly in some parts of the world, containing high levels of tritium due to thermonuclear tests [55]. This fact led to misleading or partially wrong interpretation of high tritium content found in groundwater, which could be attributed to pollution, or conversely to rainfall infiltration [56]. Sometimes, tritium in the municipal waste leachate was not only provided by precipitation, which did not justify the high values measured in some sites. This can be easily understood by observing plots of tritium in precipitation, recorded in some selected stations over the world; in Figure 2, 15 examples of long-term measurements in rainwater in different continents are reported and expressed in logarithmic scale [57].
A similar behavior is apparent from these plots showing a steep increase in tritium content in precipitation starting from 1960 until 1964. Subsequently, in the following years, a gentle decrease in the tritium content is observed worldwide, and a quasi-stationary seasonal oscillation is recorded on the tritium values in all the selected stations. However, several differences can be noticed between the Northern (Figure 2a) and the Southern (Figure 2b) Hemispheres. Indeed, the Northern Hemisphere is characterized by higher peaks of tritium in precipitation reaching in some cases (AT, DE, FR, US-OR) values in the order of 7000–8000 TU. After the bomb peaks, the decrease in tritium content appears in a continuous but slow signal drop with a sparse and sporadic sharp increase between 1975–1976 and 1994–1996 recorded only in DE and FR stations. The latter stations are characterized during the last 20 years by a precipitation tritium content background slightly higher (5.5 TU) than the other stations belonging to the Northern Hemisphere (1.5–3.5 TU). Regarding the precipitation that occurred in the Southern Hemisphere, the maximum tritium content has been recorded in AS (in the order of 400–600 TU) during the bomb peak, while sporadic tritium content rise can be observed in SH and CL between the years 1990 and 1994. Additionally, in this hemisphere the last 20 years are characterized by low tritium content in precipitation, in the order of 1 up to 20 TU.
Tritium content in precipitation related to the 15 rainfall stations, has been weighted averaged on the monthly precipitation amount for seven time periods (Figure 2). Where available, the computation has been made before the year 1963, between the years 1963–1964, 1965–1979, 1980–1990, 1991–2000, 2001–2010, and after the year 2010. As observed in Figure 1, a general increase in precipitation tritium content is recorded worldwide after the 1960s due to atomic and hydrogen bomb experiments [58], much more visible in the countries located in the Northern Hemisphere. Tritium concentration decreased rapidly since nuclear tests have stopped (from year 1990), reaching pre-nuclear testing values in the time period 1991–2010 (Table 1). Raw data of precipitation are shown in Figure 2; thus, cause the tritium content from the 1980s to decrease constantly (without significant trend changes). For convenience, Table 1 displays time series in decades starting from the year 1980.
For old landfill facilities, closed just a few years after the peak of tritium in the atmosphere, the occurrence of high tritium content in the leachate could be actually related to precipitation (except for the case in which the top and surrounding liners have a leakage towards groundwater and or surface waters). In all the other plants, filled in the following years and still operating (or closed well after the tritium peak in the atmosphere), when the tritium content is higher than the natural level, this is definitely connected to spills of leachate from the landfill.
This fact suggests the importance of measuring the tritium content not only in the surrounding water bodies (up and downgradient with respect the landfill), but also in the leachate, in order to see to what extent tritium can be still successfully used as a tracer; actually, this measure alone of groundwater tritium content, although used frequently in past and recent studies [48,59,60,61], can lead to misleading results or making incomplete conclusions.

3. Tritium Activity Anomalies Method, a Summary

As already outlined in the previous paragraphs, when high levels of tritium are found in groundwater before the 2000s, it is reasonable to state that those values are due to water containing high tritium levels for precipitation that fell in the 1960s, 1970s, or 1980s. From the end of the first decade of the 2000s onwards, there are very few cases of groundwater recharged by that precipitation, and even only in some specific parts of the world.
In any case, tritium dating of groundwater was progressively abandoned in favor of other isotopes, not least because the radioactive decay rate was similar to the removal rate of residual tritium from thermonuclear tests of the 1960s carried out by rain. As a consequence, the age interpretation became rather ambiguous, especially in the Northern Hemisphere of the world [62], and the specific signature was difficult to identify in groundwater due to the period of tests.
Natural values of tritium in recent groundwater usually range from about 2–3 to 10–11 TU nowadays (where the post bomb signature does not exist and no contamination occurs) [63,64], although some authors present a wider range [65], but in general not many studies reporting values in groundwater can be found in the literature.

3.1. Background Concentration

As a rule, one can use tritium as a tracer if its base level concentrations in the environment near the MSW are significantly different from the concentration found in the leachate. Therefore, a few samplings and analyses were usually performed in groundwater and surface water in order to achieve the average background value for the studied area and the values range. These analyses should be repeated in different periods, at least at seasonal scale, to assure good reliability of the obtained data.
Another option is given by handling tritium data in rain or river water (either provided by local stations or GNIP [57], GNIR [37] databases) and viewing them as the maximum extent that tritium can reach in the studied area.

3.2. Tritium as Leachate Tracer

In short, main reasons why tritium was used as an excellent tracer of landfill pollution are:
  • It was present in the leachate of many MSWs at high concentration;
  • Being part of the water molecule, it is not subject to chemical reactions;
  • “………………”, it is not absorbed by the soil;
  • “………………”, it travels together with groundwater, since it is itself water.
  • Some limitations were (and actually are!) instead connected to the following points:
  • Few laboratories in the world own the proper facilities and human resources to perform such analysis;
  • The cost is quite high;
  • When low level tritium analysis is needed, samples are to be concentrated by electrolytical enrichment, which is a long and complex procedure.
In the past, tritium concentration in many MSWs’ leachate was so high it was recommended to be used as an excellent pollution tracer; few data are available in the last decade, but it is expected that its concentration has levelled off around lower values, although probably still higher than those of surrounding environments. Its potential, therefore, could have been reduced at present, but is probably still significant.
In fact, where even a very small amount of leachate leaks out of the landfill, it is possible to trace this leakage better than only traditional chemistry can; indeed, only small variations (greater than the values normally present in the environment) in tritium in groundwater are often enough to ascertain external contamination. For example, if the tritium content in the leachate is higher than 1000 TU, it is possible to trace even a leachate leakage of less than 10 liters.

3.3. Tritium Activity Anomalies: Overview of the TAAM Method

After determining the background values of tritium and other environmental isotopes, the procedure to verify if groundwater and/or surface water is contaminated by leachate is based on the occurrence of tritium activity anomalies and potential concentration changes [66]. Every anomaly in tritium content can be accordingly related to potential pollution from landfill plants. These features have allowed tritium to be used as a landfill pollution tracer, above all because its content inside the MSWs was greatly above the surrounding groundwater, despite the increasing due to thermonuclear tests.
However, it is necessary to evaluate if tritium content in the leachate is high to guarantee a suitable application of such a technique (roughly at least one order of magnitude over the base level), and afterwards to compare measurements in wells, piezometers, rivers, and channels with the background level. An example is given in Figure 3, in which background level of tritium has been evaluated for an area of central Italy where almost monthly measured data have lasted for over two decades. Values above 14 TU (in 1986) and 10 TU (in 2010) have a very low probability of being detected in groundwater and surface water around the site, since the tritium concentration trend is smoothed by infiltration and recharge processes.
This is a specific example, but by searching within the IAEA database (GNIP) it is possible to achieve the tritium trend in precipitation over around the world (Figure 2) and use this as background level indication; the authors recommend determining the tritium background level from precipitation derived by the closest station to the examined area. In this database [57], a large amount of tritium data in precipitation is available for a large part of the world. Of course, in any case, the average tritium values in precipitation should be accompanied by measures of the dispersion of a dataset or even a basic statistic (i.e., standard deviation or variance, minimum, maximum), which is essential to assess if additional factors influencing tritium content variability should be considered. For instance, in Figure 2a the tritium content in Germany (DE) in the last 10 years varies between 3.7 and 15.0 with a standard deviation of 2.9 TU. For Chile (CL) instead, in the decade 2000–2010, tritium content has a maximum value 4.12 and a minimum of 0.35, with a standard deviation of 0.53 TU. These are two examples of different variability of tritium content in precipitation, and the variability of data should be accurately assessed in each investigation, also because in the literature additional factors have been considered as influencing the tritium content in precipitation [67]. As reported by Telloli et al. [67], in fact, for the Treviso area (Italy) the bora wind perturbation coming from the arctic produces more enriched tritium content due to the low water vapor amount in the cold air, and this should be taken into account in the discussion of results.
Another factor to be considered is indeed the analytical–instrumental error associated with the determination of tritium content in water. Since the 1960s, the analytical procedure involved electrolytic enrichment and then counting of radioactive activity with liquid scintillator counting, with errors in the order of 1–2 TU for current values in groundwater. During last decades instead, thanks to the improvement in measurement techniques and apparatus, even smaller errors can be reached, between 0.5 and 1 TU [67].
Last but not least, it is possible to detect potential contamination of groundwater by observing the tritium activity increase with respect to the base level and estimate the mixing ratio with the leachate [66]. In this framework, a review of tritium content and variability in groundwater would certainly be more relevant. However, few examples reporting tritium levels in groundwater are found, also cited in this review [63,64,66,67,68,69,70,71,72,73,74,75,76].

4. Literature Survey on the Application of Tritium in Landfill Pollution Studies

The main purpose of this review is to provide the scientific community with a source of existing literature on the use of tritium, as it is applied by different authors around the world and over the years. The questions to which attention is directed are: (1) “is tritium still a good tracing tool to use?”; (2) “is tritium able to give satisfactory results and a good correlation with other measured chemical–physical parameters?”. This chapter helps to answer these two questions. To do this, a detailed literature search of the use of tritium is presented.
In this section, for a start, readers will find a collection of literature on tritium data in leachate with all the additional chemical parameters associated that were found in the articles (Table 2 and Table 3); then in Section 4.1, Section 4.2 and Section 4.3, three successful case studies are presented to strengthen and promote the use of tritium in hydrogeology, hoping for questions and future discussions on this topic to be opened and therefore contribute to fostering a widespread revival of interest in this important issue.
Scientific literature, in fact, reports a number of studies where the use of tritium and other environmental tracers played a significant role both in characterizing the hydrogeological setting of the surrounding environment and identifying potential connection between leachates and groundwater, even better and before chemical signals have been detected [66,77]. Some research and reports, furthermore, outline the high tritium content in sanitary landfills and municipal wastes, as outlined in [56,78,79,80], among others.
A brief overview of case studies based on the successful application of the TAAM is then reported at the end of the present chapter, with examples of landfill polluting and not polluting the environment.
More in general, TAAM can help in:
  • The identification of the potential absence of pollution, when chemical studies in groundwater lead to uncertain or confusing results.
  • The validation of chemical results in the case of landfill pollution.
  • The assessment of contamination even before and better than chemistry.
  • In these examples, tritium content in the leachate varies from a few tens to some thousands of TU.
First of all, let us focus on the areal distribution and frequency of tritium use in landfill pollution problems, primarily because this gives an indication of which nations are of most interest for this methodology and their purposes. For this reason, all the investigations published as scientific papers and covering especially some parts of the world have been presented in a map (red circles in Figure 4), with a particular focus on those case studies including leachate tritium content; it cannot be certainly excluded that other studies exist, especially technical reports likely to be kept in private libraries without digital media and stored only as hard copies.
As one can see, case studies are mainly distributed between the 30th and the 60th northern parallel (Figure 4). Most of the case studies (about 160) are in Europe, 2 in Asia, 5 in Oceania, 4 in Africa, 6 in North America, 1 in South America, and 4 in Africa. Sixty-one cases are in Italy. A brief synthesis of data for each case study is reported in Table 2 and Table 3. Each MSW plant is presented with some information useful for characterizing the main features as can be deduced from the articles. Unfortunately, geochemical data are often not available, and this is the reason why all data are divided into two different tables. Facilitated by the direct availability of in-country data, the Italian case studies examined reported a more detailed indication of location, including the region of interest, and including different data sources such as technical reports [68,70,71,72,73,74,81] and scientific literature [54,66,69,77,82,83,84,85,86] (Table 2). When available, the sampling period is expressed in month-year. In general, high tritium average content (avg leachate tritium content in Table 2), is found in all the datasets examined, ranging from a minimum value of 13.2 to a maximum of 76,000 TU, with an average value of 1974 TU. When several data of tritium content are present in the original paper, a range of minimum–maximum values are reported (min–max in Table 2).
The first point that can be observed from Table 3 is the wide range of the collected data, especially in terms of the type of parameters measured in addition to tritium; the table collects tritium data of leachate (expressed in TU), sampling period and locations, together with the available data of δ18O, data on chemical composition of leachate (Cl, SO42−, NO3), and some physical parameters such as pH, temperature, and electric conductivity. The δ18O data are available in three out of the total analyzed works, ranging between −8.8 and +0.67 (‰ vs V-SMOW), accompanying a variable relative tritium content (38 < TU < 8001). Cl ranges between 8 and 22,404 mg/L with tritium content ranging between 38 and 76,000 TU in the same samples. As far the NO3 data concerns, they range between less than 0.5 and 2,600 mg/L, while SO42− varies between 2.2 and 156 mg/L with tritium content in the same samples ranging between 7 and 1345 TU.
Table 2. Available literature on tritium content for leachate, analyzed in this brief review.
ReferenceLocationSampling
Period
Leachate Tritium
Content (TU)
AvgMin–Max
[52]Western Australia1989–1992-2119–5339
[52]Western Australia2008–2009-1135–4297
[52]Western Australia2007–2009-237–2144
[53]---160–2800
[54]Piemonte, ItalyMay-2009415.2-
[66]Emilia Romagna, ItalyApr-19971665-
[66]Emilia Romagna, ItalyAug-19971080-
[66]Emilia Romagna, ItalyNov-19971700-
[66]Emilia Romagna, ItalyApr-1996400-
[66]Veneto, ItalyMar-1998983-
[66]Veneto, ItalyMar-19981545-
[66]Veneto, ItalyMar-19981129-
[66]Veneto, ItalyMay-2003217-
[66]Veneto, ItalyApr-2004119.4-
[66]Veneto, ItalySep-2003224.2-
[66]Veneto, ItalyNov-2008428.9-
[66]Veneto, Italy-69.3-
[77]Toscana, ItalyAug-1989980-
[77]Toscana, ItalyNov-19891003-
[77]Emilia Romagna, ItalySep-19961100-
[77]Emilia Romagna, ItalyNov-19971581-
[78]New York, US2006-393–60,152
[79]United Kingdom -*–39,270
[80]Northeastern Scotland19962483-
[80]Northeastern Scotland19991152-
[80]Glasgow, Scotland19982135-
[80]Glasgow, Scotland199511703-
[80]Lowlands, Scotland19965330-
[80]Lowlands, Scotland1999602-
[68]Veneto, ItalyApr-2005529-
[68]Veneto, ItalyJun-20052241-
[68]Veneto, ItalySep-20051330-
[68]Veneto, ItalyApr-2005629-
[68]Veneto, ItalyJun-20053416-
[70]Veneto, ItalySep-20051330-
[70]Veneto, ItalyMar-2003354-
[70]Veneto, ItalyJul-2003225-
[70]Veneto, ItalyApr-2004127-
[71]Emilia Romagna, ItalyJun-2006658-
[71]Emilia Romagna, ItalyApr-1998480-
[71]Emilia Romagna, ItalyJul-1997304-
[71]Emilia Romagna, ItalyMay-1997178-
[71]Emilia Romagna, ItalyDec-1997280-
[72]Veneto, ItalyApr-19971587-
[74]Marche, ItalyMar-200215-
[74]Marche, ItalyMay-200313.2-
[74]Marche, ItalyDec-2001291.2-
[74]Marche, ItalyNov-200153-
[74]Marche, ItalyJul-200229.9-
[74]Marche, ItalyNov-1993520-
[73]Emilia Romagna, ItalySep-1995140-
[73]Emilia Romagna, ItalySep-1995960-
[73]Emilia Romagna, ItalyJul-1997180-
[81]Marche, ItalyMay-2000500-
[69]Marche, ItalyMar-1994910-
[69]Marche, ItalyAug-1994450-
[69]Emilia Romagna, ItalyApr-199683-
[69]Emilia Romagna, ItalyApr-1996134-
[69]Emilia Romagna, ItalyApr-199682-
[69]Emilia Romagna, ItalyApr-199653-
[69]Emilia Romagna, ItalySep-1996270-
[69]Emilia Romagna, ItalySep-1996167-
[69]Emilia Romagna, ItalyApr-19961080-
[82]Marche, ItalyDec-1993290-
[82]Marche, ItalyOct-1993664-
[83]Puglia, ItalyNov-2014235-
[83]Puglia, ItalyMar-2015182-
[83]Puglia, ItalyJun-2015225-
[84]Sicily, Italy2019-48–374
[85]Abruzzo, ItalyJun-201434.5-
[87]Illinois, USPre 1992-227–338
[88]Austria-2000
[89]Austria-3000
[90]California, US19912421-
[91]Scotland1995–1999-212–11,703
[92]California, US2003-*–95,322
[92]Pennsylvania, US2004-*–29,317
[92]Pennsylvania, US2005-*–57,068
[93]BrazilMay-2002-111–141
[94]South Africa1995-*–100,000
[95]South Africa199776000-
* = minimum value not provided; - = data not available.
Table 3. Available literature on leachate tritium content coupled with oxygen-18, Cl, SO42−, NO3, pH, temperature (T), and electric conductivity (EC).
Leachate Tritium
Content (TU)
δ18OCl (mg/L)NO3 (mg/L)SO42− (mg/L)EC (uS/cm)pHT (°C)
Ref.LocationSamp.
Period
AvgMin–MaxMin–MaxAvgMin–MaxAvgMin–MaxAvgMin–MaxAvgMin–MaxAvgMin–MaxAvgMin–Max
[56]Illinois, US--225–8001−8.8–−6.2------------
[96]Philippines2006–2008-750–820--8–204---10–34-3070–20,000----
[97]Korea2002–2003-17–1196--------5888–16,500-7.10–8.05--
[85]Abruzzo, Italy201434.5--416---148.3--32677.1 22-
[98]IndonesiaMar-2013-51–493−5.93–0.67-------10.88–>20-7.61–80.4-30.5–35.2
[99]Greece-38-−7.16–−1.4222404--< 0.52.2-67100-7.5-28-
[95]South AfricaJul-2010787.1--908-1.42-82.12-358.3-7.6---
[95]South AfricaJan-2012781--1427-0.06-48.1-944-8.1---
[97]Korea1994–2016-17–1196--132–3070-2–2600-2–90---7.36–8.29--
[100]Central
Europe
1995–200254010–150,000-------------
[86]Puglia, Italy2015-55–923--1230–14,600-<0.5–53.1-1–156-15,500–35,400-7.5–7.9-19.9–42.5
- = data not available.

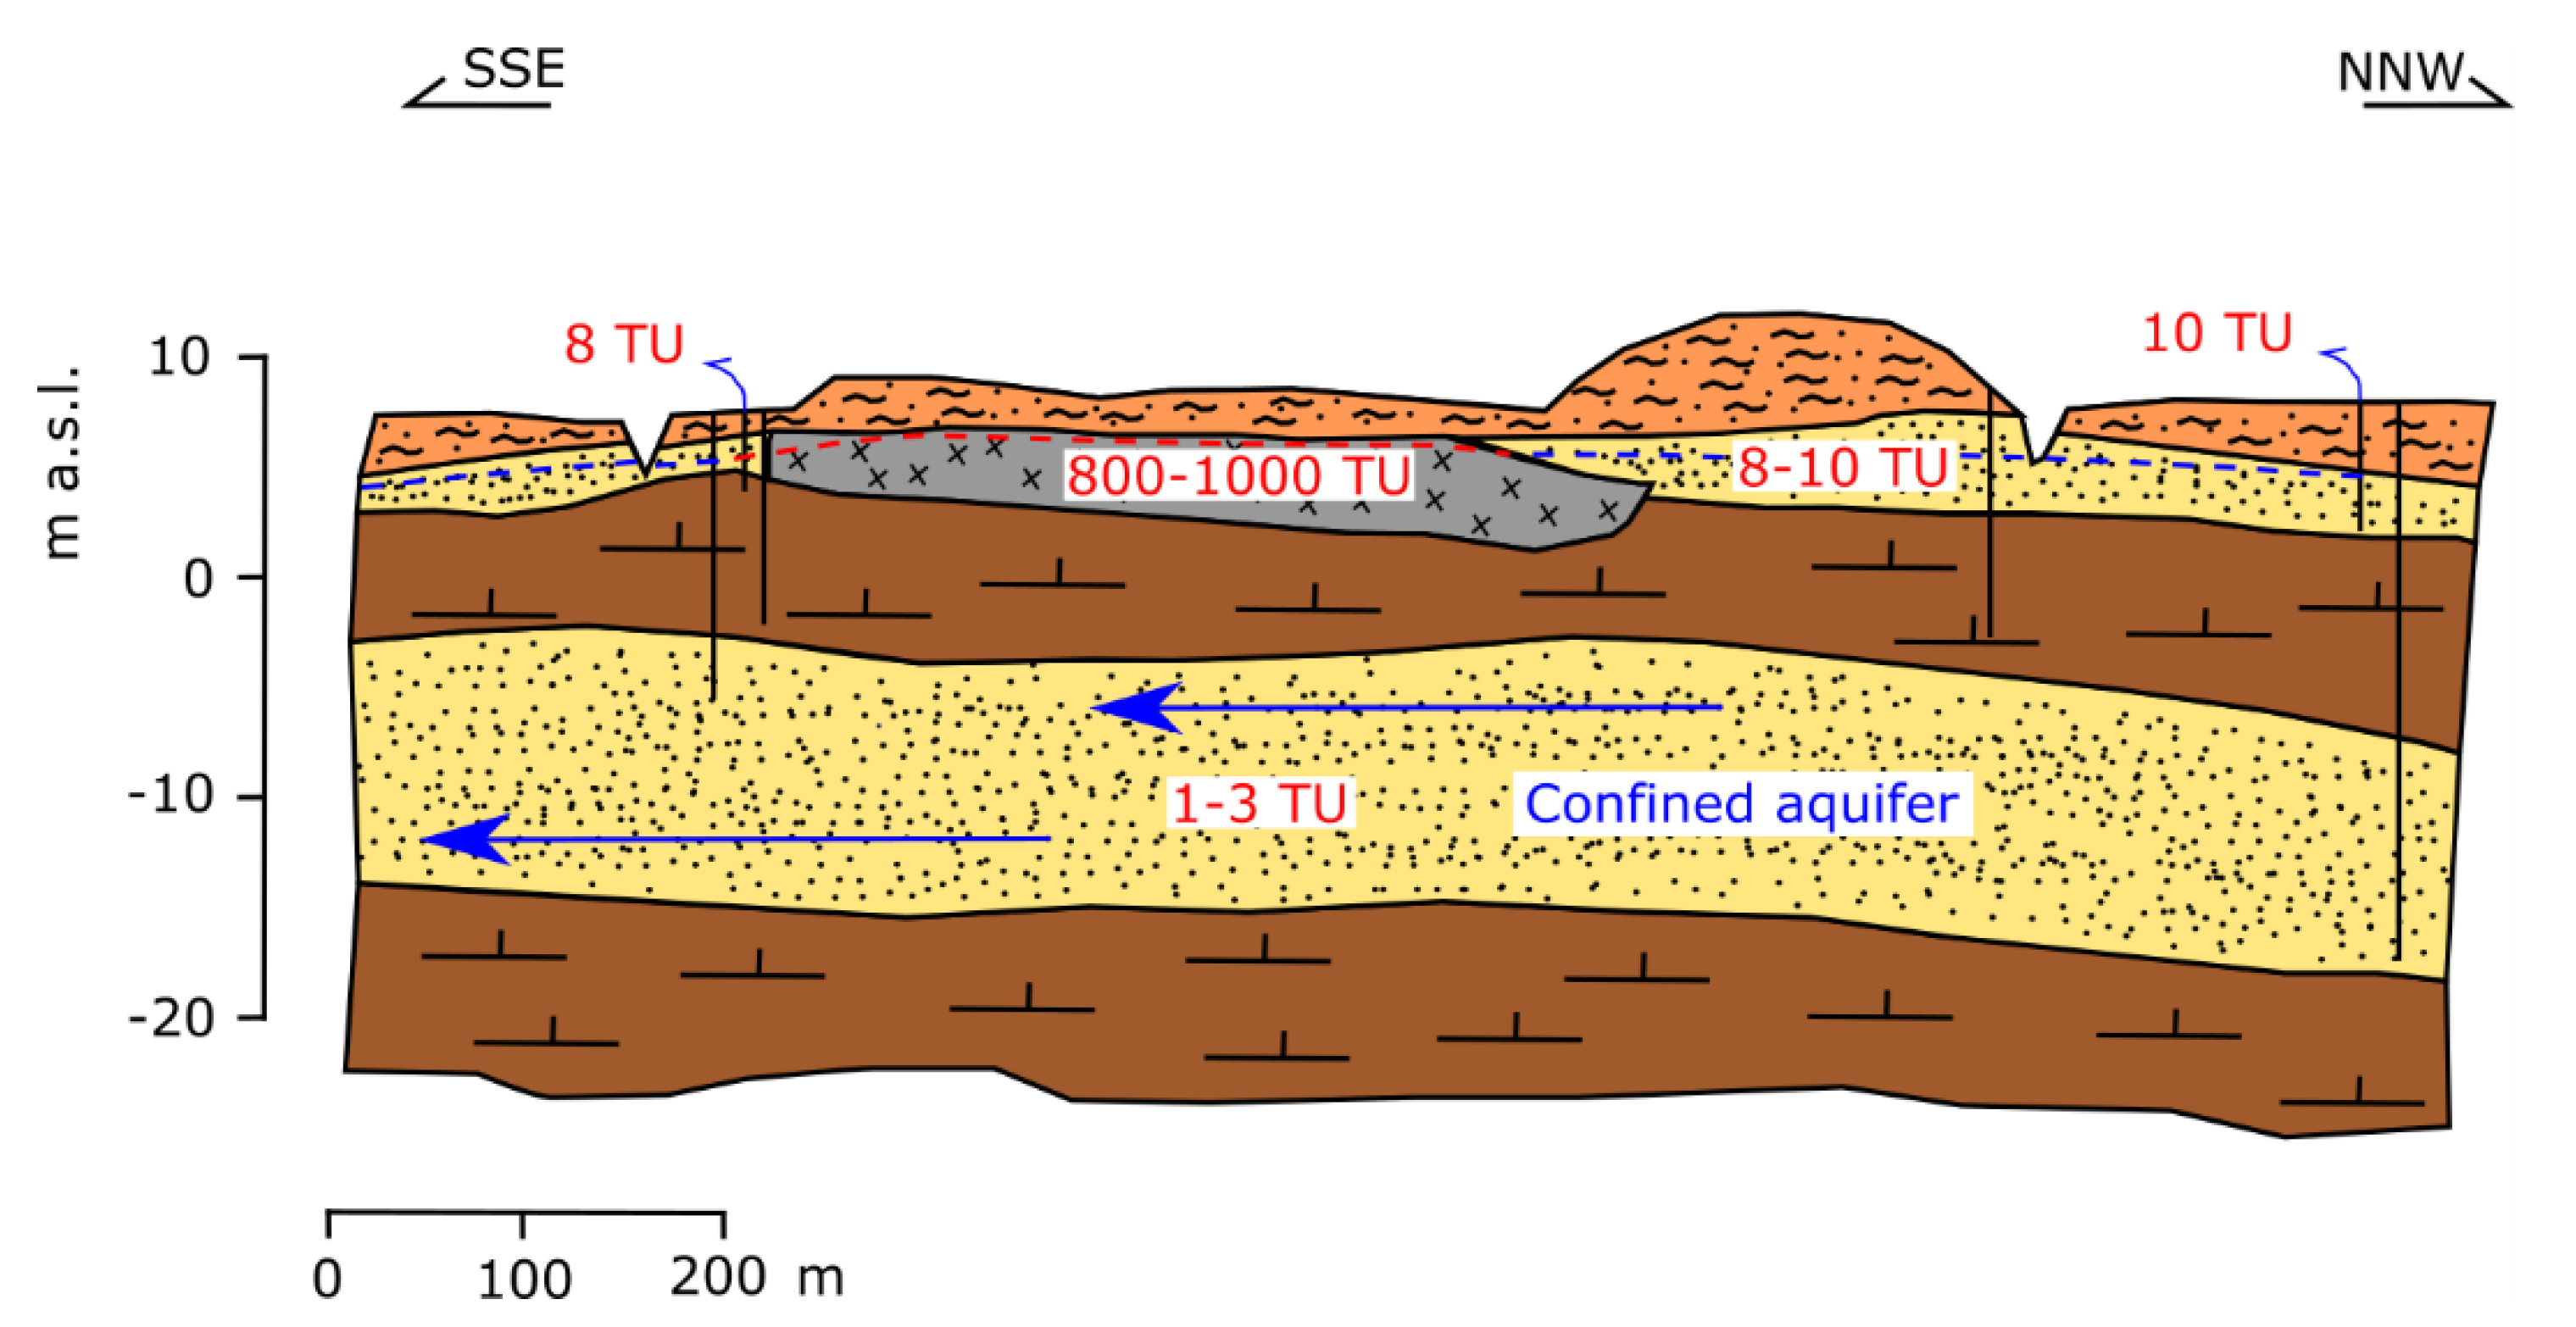
4.1. Case History 1: Landfill Not Polluting the Environment

The MSW disposal site is placed in a wide alluvial plain, made of alternating alluvial deposits (mainly silty clay and silty sand). More or less developed clay lenses divide the shallower aquifer (unconfined, with groundwater table a few meters b.g.s.) from the confined aquifer (depth ranging from about 9 to 16 m b.g.s.) [66]. Groundwater and surface water in the surrounding area were almost ubiquitously contaminated especially by nitrates and ammonium; nevertheless, tritium values (Figure 5) both in unconfined and confined aquifers, were within the environmental background values; thus suggesting the absence of connections among landfill and the aquifers. Other isotopic analysis (δ15N, δ13C, δ34S) indicated the different provenance of chemical compounds whose concentrations were over the limits, in particular advising the diffused use of fertilizers even upward of the plant itself to be responsible for the contamination.

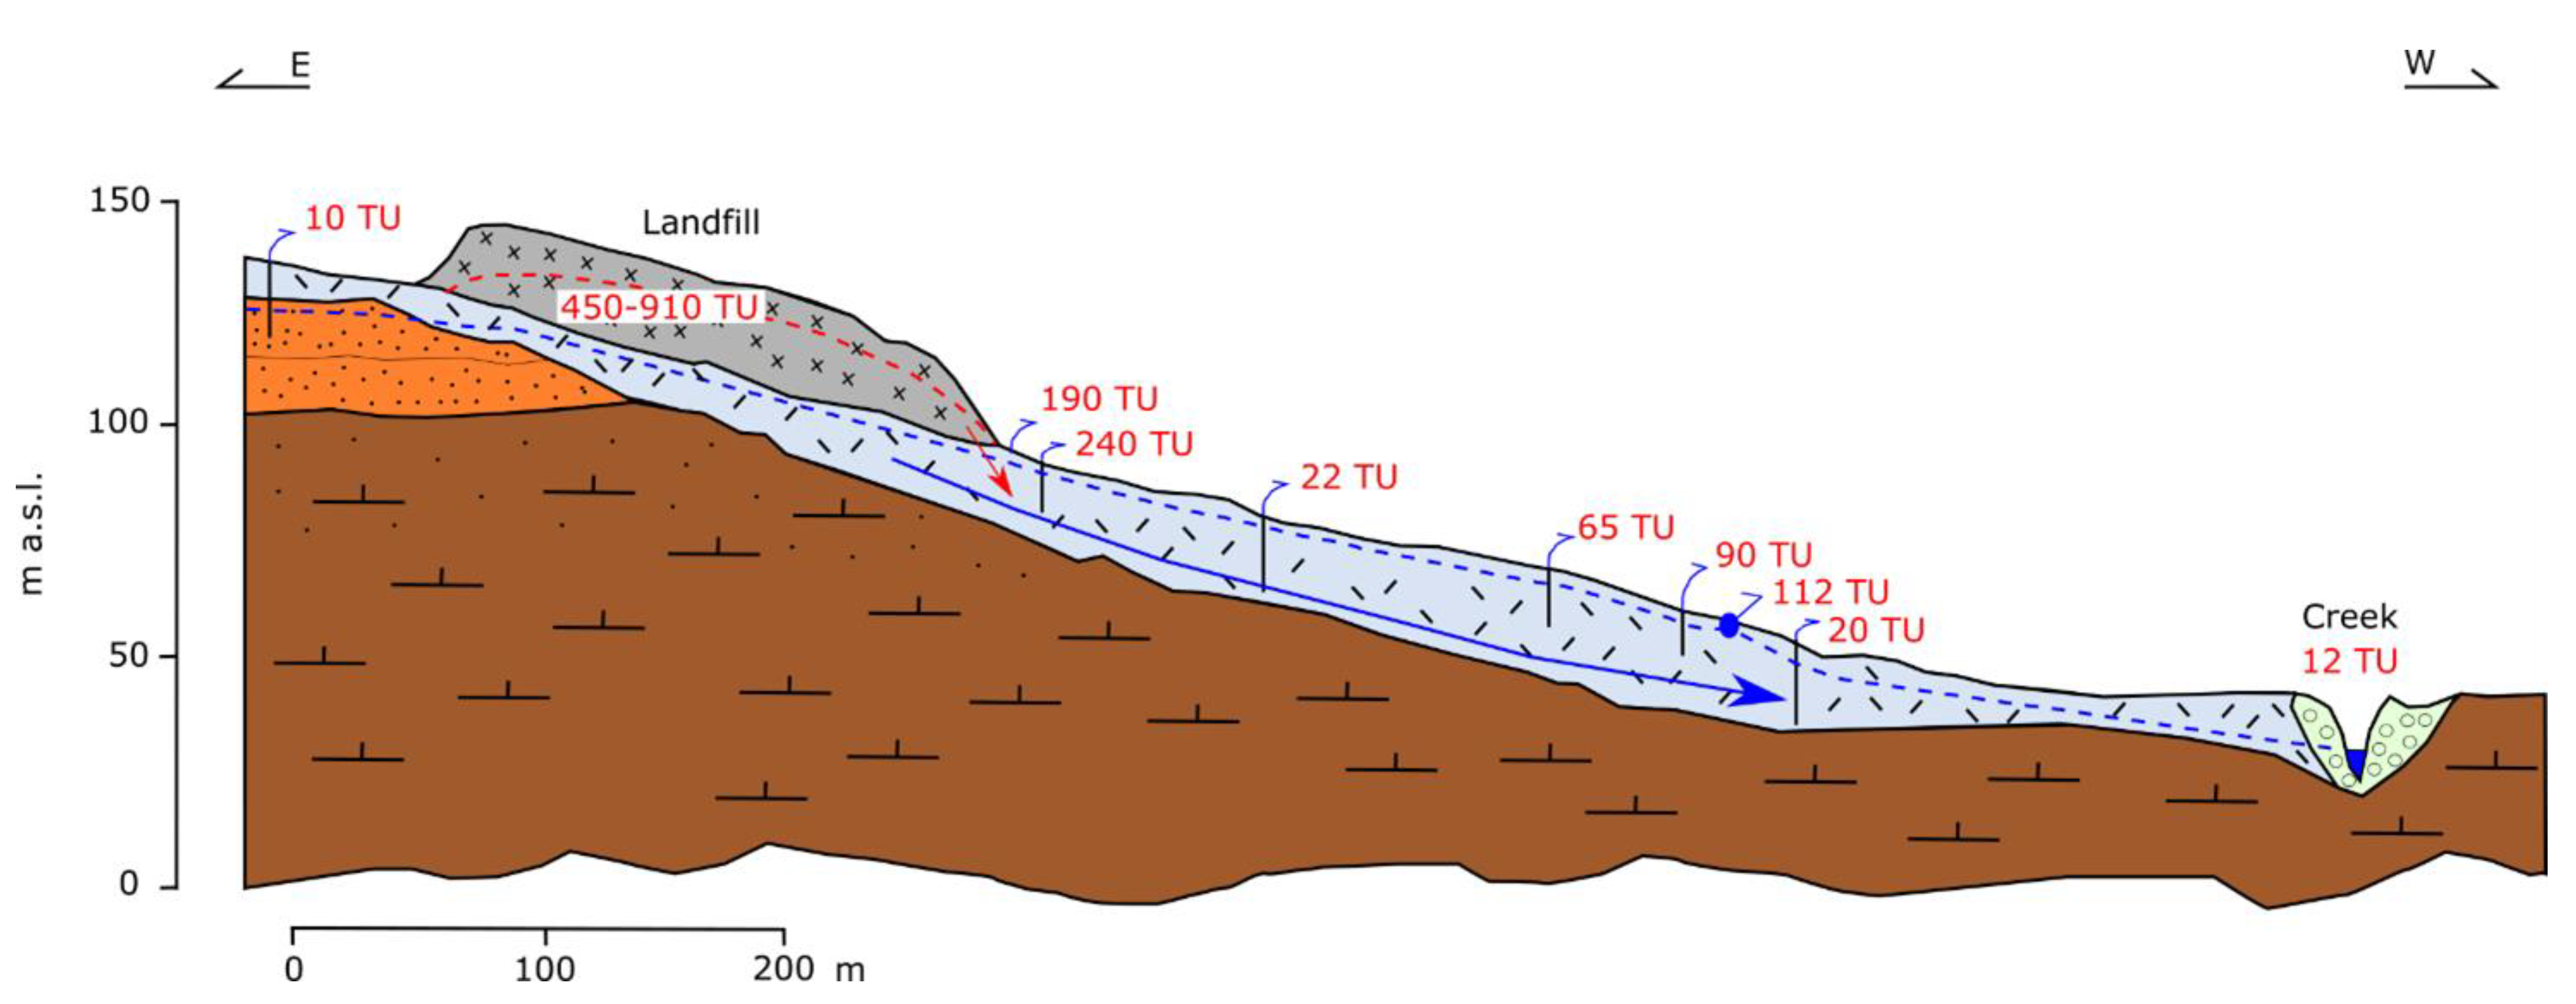
4.2. Case History 2: Landfill Polluting the Environment

The geological setting of the substratum of this landfill site is characterized by stratified marly clay (Plio-Pleistocene) interbedded with silty sand, on which eluvial and colluvial clayey sediments are present with a thickness ranging from 3 to 16 m. Hydraulic conductivity of marly deposits was around 10−6–10−7 m/s, whereas eluvial–colluvial deposits showed slightly more permeable behavior. Groundwater level was about −5 m b.g.s. (in the upper part of the hill) and 0.5–1 m b.g.s. (in the lower part of the hill). Landfill is posed along a hill and was active until 1992 and was responsible for wide pollution of shallow groundwater and surface water downstream, with values of SO42− and Cl significantly above legal limits [69].
Tritium content in the leachate varied between 450 and 910 TU; thus permitting its use as a good tracer of contamination. Tritium analyses in groundwater and surface water were undertaken and confirmed the spread of leachate in the surrounding environment, with values well above the natural background—which was variable between 9 and 15 TU in those years—assessing the contamination measured in some dug wells downstream (Figure 6).

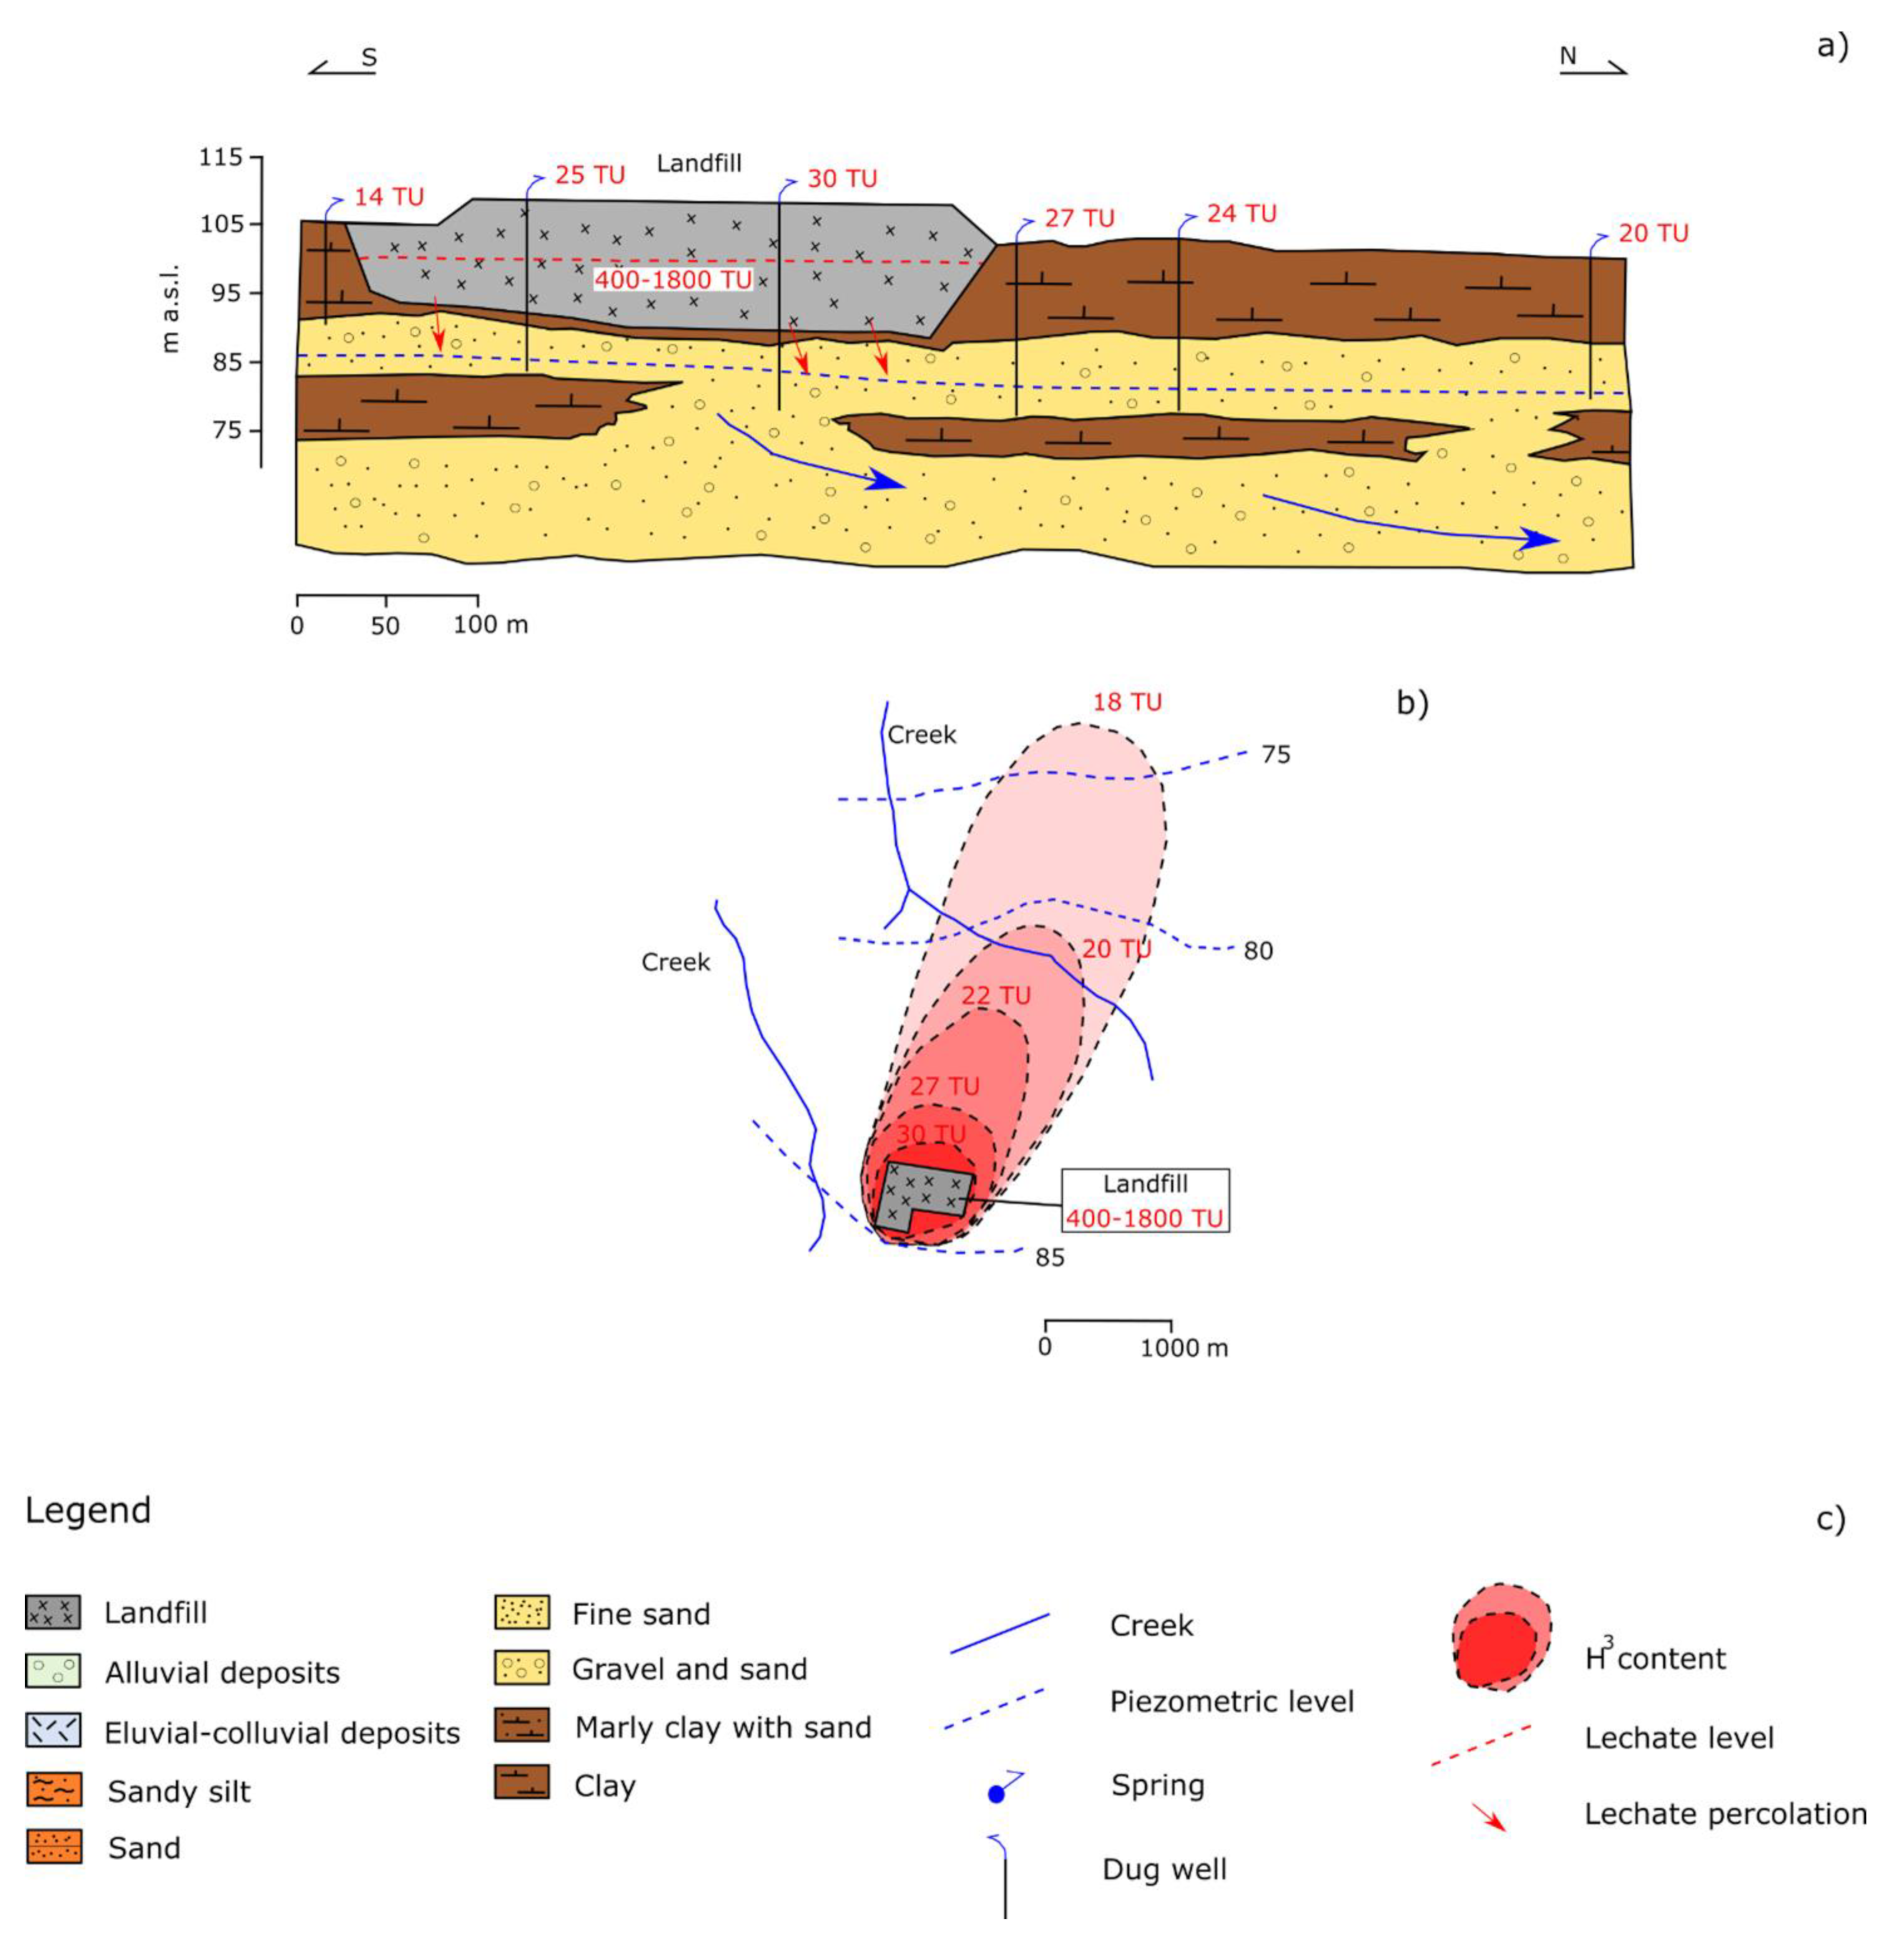
4.3. Case History 3: Assessment of Landfill Leakage before Chemical Concentration Changes

The landfill is located at about 105 m a.s.l., in an alluvial plain characterized by terrains from Holocene to Pleistocene: alternance of alluvial clay and silty-sandy clay from the ground level up to 10–12 m depth; alternance of gravel-sandy and silty-clay sediments from 10–12 to over 40 m b.g.s. At some point, clay sediments are present in the form of lens, even embedded in the gravel sandy sediments [52]; gravel sandy sediments can be considered as a semi-confined aquifer with medium to low permeability, containing groundwater somewhere phreatic, 20–25 m depth, fed by local rainfall and river water. During the time of investigation, some chemical parameters were found above the natural level indicating pollution by the landfill only in close proximity to the plant; tritium values of leachate varied from 400 to 1800 TU, whereas uncontaminated groundwater (upstream of the landfill) showed a background of 6–10 TU (Figure 7a). Under the MSW disposal and right after, tritium activity was markedly above the background even at a considerable distance from the landfill (Figure 7b). In this case, the monitoring of tritium content even downflow can suggest the future occurrence of contamination in farther places with respect to the origin of pollution, currently not shown by significant chemical concentration changes.

5. Conclusions

A number of studies exist on the application of tritium as a leachate tracer in the world, especially in the decades until 2010. The TAAM has demonstrated to be a good method as a support to traditional chemical investigation or, in some cases, an excellent way to discover landfill leakage even before chemical concentrations change.
The actual issue is concerning the effective applicability of such a method due to several reasons:
  • The current level of tritium in the leachate could not be high enough to ensure a good determination in groundwater and surface water, and this can also be dependent on the improvement in processes of waste storage;
  • The analyses are expensive, there is the need of specific equipment (not used for other laboratory determination), the laboratory process is difficult and time-consuming, especially when using electrolytic enrichment;
  • Often (and this is probably the greatest problem), there is a lack of knowledge about the potentiality of such a method in solving problems related to landfill contamination.
The question that therefore arises is whether this method has a future or not. Maybe the answer is not so simple and obvious as it may seem, since it strongly depends on some factors characterizing the specific case under investigation. In a general way, however, one can state that basically only one tritium level determination in the leachate is required to reach a decision about the applicability of TAAM to the case study. The clear asset of this method, however, is represented by its accuracy in providing better information about landfill pollution, sometimes before chemical concentrations change in groundwater downflow from the MSW plants.
The hope is that this review can contribute to verifying the applicability of TAAM and further disseminate this method, which can be certainly useful especially in those sectors where a decision about contamination is mandatory (i.e., forensic studies).

Author Contributions

Conceptualization, A.T.; methodology, A.T.; software, D.F.; validation, A.T., D.F. and E.M.; formal analysis, D.F. and E.M.; investigation, A.T., D.F. and E.M.; resources, A.T.; data curation, D.F. and E.M.; writing—original draft preparation, A.T., D.F. and E.M.; writing—review and editing, A.T., D.F. and E.M.; visualization, D.F.; supervision, A.T.; project administration, A.T.; funding acquisition, A.T. All authors have read and agreed to the published version of the manuscript.

Funding

This research received no external funding.

Institutional Review Board Statement

Not applicable.

Informed Consent Statement

Not applicable.

Data Availability Statement

All data reported in this manuscript are related to the cited literature.

Acknowledgments

The authors thank the editor and the anonymous reviewers. Figures are made with the freely available Inkscape software v.1.1.1 and Excel-Microsoft365®.

Conflicts of Interest

The authors declare no conflict of interest.

References

  1. Kendall, C.; Caldwell, E.A. Fundamentals of Isotope Geochemistry. In Isotope Tracers in Catchment Hydrology; Elsevier: Singapore, 1998; pp. 51–86. [Google Scholar]
  2. Philp, R.P. The Emergence of Stable Isotopes in Environmental and Forensic Geochemistry Studies: A Review. Environ. Chem. Lett. 2007, 5, 57–66. [Google Scholar] [CrossRef] [Green Version]
  3. IAEA, Environmental Isotopes in The Hydrological Cycle-Principles and Applications. Water Resour. Programme 2000, 1, 1–117.
  4. IAEA Isotopes in Environmental Studies. In Proceedings of the Aquatic Forum, Monaco, Austria, 25–29 October 2004.
  5. IAEA Use of Environmental Isotopes in Assessing Water Resources in Snow, Glacier, and Permafrost Dominated Areas under Changing Climatic Conditions. Available online: https://www.iaea.org/projects/crp/f32006 (accessed on 27 April 2015).
  6. Clark, I.D.; Fritz, P. Environmental Isotopes in Hydrogeology; CRC Press: Boca Raton, FL, USA, 2013; ISBN 0-429-06957-X. [Google Scholar]
  7. Kendall, C.; Doctor, D.H. Stable Isotope Applications in Hydrologic Studies. Treatise Geochem. 2003, 5, 605. [Google Scholar]
  8. Kumar, S. Environmental Isotopes in Groundwater Applications. In Groundwater Development and Management; Springer: Berlin/Heidelberg, Germany, 2019; pp. 77–146. [Google Scholar]
  9. Barbieri, M. Isotopes in Hydrology and Hydrogeology; Multidisciplinary Digital Publishing Institute: Basel, Switzerland, 2019; Volume 11, p. 291. [Google Scholar]
  10. Nisi, B.; Raco, B.; Dotsika, E. Groundwater Contamination Studies by Environmental Isotopes: A Review. Threat. Qual. Groundw. Resour. 2014, 40, 115–150. [Google Scholar]
  11. Sankoh, A.A.; Derkyi, N.S.A.; Frazer-williams, R.A.D.; Laar, C.; Kamara, I. A Review on the Application of Isotopic Techniques to Trace Groundwater Pollution Sources within Developing Countries. Water 2021, 14, 35. [Google Scholar] [CrossRef]
  12. Philp, R.P. Application of Stable Isotopes and Radioisotopes in Environmental Forensics. In Introduction to Environmental Forensics; Elsevier: Singapore, 2015; pp. 395–455. [Google Scholar]
  13. Rozanski, K.; Gonfiantini, R. Isotopes in Climatological Studies. IAEA Bull. 1990, 32, 9–15. [Google Scholar]
  14. Wilson, A.T. Isotope Evidence for Past Climatic and Environmental Change. J. Interdiscip. Hist. 1980, 10, 795–812. [Google Scholar] [CrossRef]
  15. Wright, J.D. Global Climate Change in Marine Stable Isotope Records. In Quaternary Geochronology: Methods and Applications; American Geophysical Union: Washington, DC, USA, 2000; pp. 671–682. [Google Scholar]
  16. Darling, W.G. The Isotope Hydrology of Quaternary Climate Change. J. Hum. Evol. 2011, 60, 417–427. [Google Scholar] [CrossRef] [Green Version]
  17. Dogramaci, S.S.; Herczeg, A.L. Strontium and Carbon Isotope Constraints on Carbonate-Solution Interactions and Inter-Aquifer Mixing in Groundwaters of the Semi-Arid Murray Basin, Australia. J. Hydrol. 2002, 262, 50–67. [Google Scholar] [CrossRef]
  18. Tan, S.P.V., VII; Mendoza, N.D.S.; Racadio, C.D.T.; Puthenpurekal, M.; Resurreccion, A.C.; Matsuzaki, H. Iodine-129 for Determining the Origin of Salinity in Groundwater in Pampanga, Philippines. J. Environ. Radioact. 2020, 218, 106239. [Google Scholar] [CrossRef]
  19. Brown, E.T.; Edmond, J.M.; Raisbeck, G.M.; Bourlès, D.L.; Yiou, F.; Measures, C.I. Beryllium Isotope Geochemistry in Tropical River Basins. Geochim. Cosmochim. Acta 1992, 56, 1607–1624. [Google Scholar] [CrossRef]
  20. Solomon, D.K.; Cook, P.G. 3 H and 3 He. In Environmental Tracers in Subsurface Hydrology; Springer: Berlin/Heidelberg, Germany, 2000; pp. 397–424. [Google Scholar]
  21. Tadros, C.V.; Hughes, C.E.; Crawford, J.; Hollins, S.E.; Chisari, R. Tritium in Australian Precipitation: A 50 Year Record. J. Hydrol. 2014, 513, 262–273. [Google Scholar] [CrossRef]
  22. Jasechko, S. Global Isotope Hydrogeology―Review. Rev. Geophys. 2019, 57, 835–965. [Google Scholar] [CrossRef]
  23. Fronzi, D.; Mirabella, F.; Cardellini, C.; Caliro, S.; Palpacelli, S.; Cambi, C.; Valigi, D.; Tazioli, A. The Role of Faults in Groundwater Circulation before and after Seismic Events: Insights from Tracers, Water Isotopes and Geochemistry. Water 2021, 13, 1499. [Google Scholar] [CrossRef]
  24. Benítez, S.V.B. Understanding of (Bio) Geochemical Processes Which Control Chromium Release, Speciation and Isotopic Fractionation in Ultramafic Environments Impacted by Mining Activitites, Université Paris-Est; Università Degli Studi: Cassino, Italie, 2018. [Google Scholar]
  25. Fernex, F.; Richou, M.; Benamou, C.; Benaim, J. Evaluation of the Quality of Bottom Sediments from the North-Western Mediterranean Sea by Bio-Geochemical Criteria. Sci. Total Environ. 1992, 111, 25–46. [Google Scholar] [CrossRef]
  26. Caterina, D.; Orozco, A.F.; Nguyen, F. Long-Term ERT Monitoring of Biogeochemical Changes of an Aged Hydrocarbon Contamination. J. Contam. Hydrol. 2017, 201, 19–29. [Google Scholar] [CrossRef]
  27. Benner, S.G.; Smart, E.W.; Moore, J.N. Metal Behavior during Surface-Groundwater Interaction, Silver Bow Creek, Montana. Environ. Sci. Technol. 1995, 29, 1789–1795. [Google Scholar] [CrossRef]
  28. Hohl, S.V.; Jiang, S.-Y.; Viehmann, S.; Wei, W.; Liu, Q.; Wei, H.-Z.; Galer, S.J. Trace Metal and Cd Isotope Systematics of the Basal Datangpo Formation, Yangtze Platform (South China) Indicate Restrained (Bio) Geochemical Metal Cycling in Cryogenian Seawater. Geosciences 2020, 10, 36. [Google Scholar] [CrossRef] [Green Version]
  29. Bertrand, G.; Siergieiev, D.; Ala-Aho, P.; Rossi, P.M. Environmental Tracers and Indicators Bringing Together Groundwater, Surface Water and Groundwater-Dependent Ecosystems: Importance of Scale in Choosing Relevant Tools. Environ. Earth Sci. 2014, 72, 813–827. [Google Scholar] [CrossRef]
  30. Hintze, S.; Glauser, G.; Hunkeler, D. Influence of Surface Water–Groundwater Interactions on the Spatial Distribution of Pesticide Metabolites in Groundwater. Sci. Total Environ. 2020, 733, 139109. [Google Scholar] [CrossRef]
  31. Kalbus, E.; Reinstorf, F.; Schirmer, M. Measuring Methods for Groundwater–Surface Water Interactions: A Review. Hydrol. Earth Syst. Sci. 2006, 10, 873–887. [Google Scholar] [CrossRef] [Green Version]
  32. Kendall, C.; McDonnell, J.J. Isotope Tracers in Catchment Hydrology; Elsevier: Singapore, 2012; ISBN 0-08-092915-X. [Google Scholar]
  33. Ehleringer, J.R.; Rundel, P.W. Stable Isotopes:History, Units, and Instrumentation. In Stable Isotopes in Ecological Research; Rundel, P.W., Ehleringer, J.R., Nagy, K.A., Eds.; Ecological Studies; Springer: New York, NY, USA, 1989; Volume 68, pp. 1–15. ISBN 978-1-4612-8127-6. [Google Scholar]
  34. Kendall, C.; Elliott, E.M.; Wankel, S.D. Tracing Anthropogenic Inputs of Nitrogen to Ecosystems. Stable Isot. Ecol. Environ. Sci. 2007, 2, 375–449. [Google Scholar]
  35. Nikolov, J.; Todorovic, N.; Jankovic, M.; Vostinar, M.; Bikit, I.; Veskovic, M. Different Methods for Tritium Determination in Surface Water by LSC. Appl. Radiat. Isot. 2013, 71, 51–56. [Google Scholar] [CrossRef] [PubMed]
  36. Michel, R. Tritium in the Hydrologic Cycle. In Isotopes in the Water Cycle; Springer: Berlin/Heidelberg, Germany, 2005; pp. 53–66. [Google Scholar]
  37. IAEA Global Network of Isotopes in Rivers (GNIR). Available online: https://www.iaea.org/services/networks/gnir (accessed on 1 January 1998).
  38. IAEA WISER Portal. Available online: http://www-naweb.iaea.org/napc/ih/IHS_resources_isohis.html (accessed on 1 January 1998).
  39. Mammoliti, E.; Fronzi, D.; Mancini, A.; Valigi, D.; Tazioli, A. WaterbalANce, a WebApp for Thornthwaite–Mather Water Balance Computation: Comparison of Applications in Two European Watersheds. Hydrology 2021, 8, 34. [Google Scholar] [CrossRef]
  40. Tazioli, A.; Cervi, F.; Doveri, M.; Mussi, M.; Deiana, M.; Ronchetti, F. Estimating the Isotopic Altitude Gradient for Hydrogeological Studies in Mountainous Areas: Are the Low-Yield Springs Suitable? Insights from the Northern Apennines of Italy. Water 2019, 11, 1764. [Google Scholar] [CrossRef] [Green Version]
  41. Allen, S.T.; Keim, R.F.; Barnard, H.R.; McDonnell, J.J.; Renée Brooks, J. The Role of Stable Isotopes in Understanding Rainfall Interception Processes: A Review. Wiley Interdiscip. Rev. Water 2017, 4, e1187. [Google Scholar] [CrossRef] [PubMed]
  42. Barbecot, F.; Guillon, S.; Pili, E.; Larocque, M.; Gibert-Brunet, E.; Hélie, J.-F.; Noret, A.; Plain, C.; Schneider, V.; Mattei, A. Using Water Stable Isotopes in the Unsaturated Zone to Quantify Recharge in Two Contrasted Infiltration Regimes. Vadose Zone J. 2018, 17, 1–13. [Google Scholar] [CrossRef] [Green Version]
  43. Wassenaar, L.I.; Hendry, M.J.; Chostner, V.L.; Lis, G.P. High Resolution Pore Water Δ2H and Δ18O Measurements by H2O (Liquid)—H2O (Vapor) Equilibration Laser Spectroscopy. Environ. Sci. Technol. 2008, 42, 9262–9267. [Google Scholar] [CrossRef]
  44. Hendry, M.J.; Wassenaar, L.I. Inferring Heterogeneity in Aquitards Using High-resolution ΔD and Δ18O Profiles. Groundwater 2009, 47, 639–645. [Google Scholar] [CrossRef]
  45. Stumpp, C.; Hendry, M.J. Spatial and Temporal Dynamics of Water Flow and Solute Transport in a Heterogeneous Glacial till: The Application of High-Resolution Profiles of Δ18O and Δ2H in Pore Waters. J. Hydrol. 2012, 438, 203–214. [Google Scholar] [CrossRef]
  46. Mussi, M.; Nanni, T.; Tazioli, A.; Vivalda, P.M. The Mt Conero Limestone Ridge: The Contribution of Stable Isotopes to the Identification of the Recharge Area of Aquifers. Ital. J. Geosci. 2017, 136, 186–197. [Google Scholar] [CrossRef]
  47. Tazioli, A.; Tazioli, G.S. Landfill Contamination Problems: A General Perspective and Engineering Geology Aspects. G. Geol. Appl. 2005, 1, 203–211. [Google Scholar]
  48. Ramaroson, V.; Rakotomalala, C.U.; Rajaobelison, J.; Fareze, L.P.; Razafitsalama, F.A.; Rasolofonirina, M. Tritium as Tracer of Groundwater Pollution Extension: Case Study of Andralanitra Landfill Site, Antananarivo–Madagascar. Appl. Water Sci. 2018, 8, 57. [Google Scholar] [CrossRef] [Green Version]
  49. Hoornweg, D.; Bhada-Tata, P.; Kennedy, C. Peak Waste: When Is It Likely to Occur? J. Ind. Ecol. 2015, 19, 117–128. [Google Scholar] [CrossRef]
  50. Mobbs, S.; Barraclough, I.; Napier, I. A Review of the Use and Disposal of Gaseous Tritium Light Devices. Bibliographic Information available from INIS. Available from British Library Document Supply Centre- DSC:GPE/3984. Available online: http://inis.iaea.org/search/search.aspx?orig_q=RN:31046469 (accessed on 1 January 1998).
  51. United Nations Scientific Committee on the Effects of Atomic Radiation. Report of the United Nations Scientific Committee on the Effects of Atomic Radiation (UNSCEAR) 1977: Report to the General Assembly, with Scientific Annexes; United Nations: New York, NY, USA, 1977; pp. 1–259. [Google Scholar]
  52. Hughes, C.E.; Cendón, D.I.; Harrison, J.J.; Hankin, S.I.; Johansen, M.P.; Payne, T.E.; Vine, M.; Collins, R.N.; Hoffmann, E.L.; Loosz, T. Movement of a Tritium Plume in Shallow Groundwater at a Legacy Low-Level Radioactive Waste Disposal Site in Eastern Australia. J. Environ. Radioact. 2011, 102, 943–952. [Google Scholar] [CrossRef]
  53. Coleman, D.D.; Liu, C.L.; Hackley, K.C.; Benson, L.J. Identification of Landfill Methane Using Carbon and Hydrogen Isotope Analysis. In Proceedings of the International Madison Waste Conference Municipal and Industrial Waste; Department of Engineering Professional Development, Madison, WI, USA, 22–23 September 1993; p. 303. [Google Scholar]
  54. Losana, M.C.; Garbarino, G.; Gastaldo, S.; Marga, M.; Magnoni, M. Misure di Trizio nel Percolato di Discarica in Piemonte. In Proceedings of the AIRP—Atti del XXXV Congresso Nazionale di Radioprotezione, Venezia, Italy, 17–19 October 2012. [Google Scholar]
  55. Balouet, J.; Oudijk, G.; Petrisor, I.; Robert, D. Morrison Emerging Forensic Techniques. In Introduction to Environmental Forensics; Elsevier Academic Press: Cambridge, MA, USA, 2007; pp. 671–732. [Google Scholar]
  56. Hackley, K.C.; Liu, C.-L.; Coleman, D.D. Environmental Isotope Characteristics of Landfill Leachates and Gases. Groundwater 1996, 34, 827–836. [Google Scholar] [CrossRef]
  57. Global Network of Isotopes in Precipitation (GNIP). Available online: https://www.iaea.org/services/networks/gnip (accessed on 1 January 1998).
  58. Zhang, J.; Satake, H. The Chemical Characteristics of Submarine Groundwater Seepage in Toyama Bay, Central Japan. Land Mar. Hydrogeol. 2003, 45–60. [Google Scholar]
  59. Butler, M.J. Ground Water Pollution at Sanitary Landfill Sites: Geohydrological, Environmental Isotope and Hydrochemical Studies; University of the Witwatersrand: Johannesburg, South Africa, 1998. [Google Scholar]
  60. Fekri, A.; Wahbi, M.; Benbouziane, A.; Hammoumi, O.; Marah, H. The Tritium as an Indicator for Landfill Leachate Pollution (Case of Mediouna Landfill, Morocco). Geochim. Cosmochim. Acta Suppl. 2009, 73, A363. [Google Scholar]
  61. Preziosi, E.; Frollini, E.; Zoppini, A.; Ghergo, S.; Melita, M.; Parrone, D.; Rossi, D.; Amalfitano, S. Disentangling Natural and Anthropogenic Impacts on Groundwater by Hydrogeochemical, Isotopic and Microbiological Data: Hints from a Municipal Solid Waste Landfill. Waste Manag. 2019, 84, 245–255. [Google Scholar] [CrossRef]
  62. Morgenstern, U.; Stewart, M.K.; Stenger, R. Dating of Streamwater Using Tritium in a Post Nuclear Bomb Pulse World: Continuous Variation of Mean Transit Time with Streamflow. Hydrol. Earth Syst. Sci. 2010, 14, 2289–2301. [Google Scholar] [CrossRef] [Green Version]
  63. Lindsey, B.D.; Jurgens, B.C.; Belitz, K. Tritium as an Indicator of Modern, Mixed, and Premodern Groundwater Age; US Geological Survey: Reston, VA, USA, 2019. [Google Scholar]
  64. Onugba, A.; Aboh, H.O. The Tritium Content of Precipitation and Groundwater at Yola, Nigeria. Sci. World J. 2009, 4, 23–28. [Google Scholar] [CrossRef] [Green Version]
  65. Brkić, Ž.; Kuhta, M.; Hunjak, T.; Larva, O. Regional Isotopic Signatures of Groundwater in Croatia. Water 2020, 12, 1983. [Google Scholar] [CrossRef]
  66. Tazioli, A.; Boschi, G.; Carlini, A. Monitoraggio Dell’inquinamento Da Discariche: Metodi Isotopici per Individuare La Presenza Di Contaminazione Delle Acque Sotterranee. G. Geol. Appl. 2002, 2, 130–136. [Google Scholar]
  67. Telloli, C.; Rizzo, A.; Salvi, S.; Pozzobon, A.; Marrocchino, E.; Vaccaro, C. Characterization of Groundwater Recharge through Tritium Measurements. Adv. Geosci. 2022, 57, 21–36. [Google Scholar] [CrossRef]
  68. Tazioli, A. Report Analysis on Isotopes and Tritium; Technical Report for SESA SpA; SESA SpA: Varese, Italy, 2006. [Google Scholar]
  69. Tazioli, G.S. Isotope and Tracer Techniques Applied to Studies of Sanitary Landfills and to an Industry for Galvanic Treatment. In Proceedings of the Consultants Meeting on Isotope Techniques in Groundwater Pollution Studies., Vienna, Austria, 6–9 December 1993; Volume 6. [Google Scholar]
  70. Tazioli, A. Report on Isotopes and Chemical Analysis of Leachate and Groundwater; Technical Report for APS SpA; SESA SpA: Varese, Italy, 2003. [Google Scholar]
  71. University of Ancona Collecchio Landfill: Sampling of Groundwater, Surface Water and Leachates for Isotopic Analysis; Technical Report for AMNU SpA; SESA SpA: Varese, Italy, 1997.
  72. University of Ancona Measures of Tritium on Samples from Water and Leachates; Analysis Report for Bastian Beton SpA; SESA SpA: Varese, Italy, 1998.
  73. University of Ancona Ravadese-2 Landfill: Sampling of Groundwater, Surface Water and Leachates for Isotopic Analysis; Technical Report for AMNU SpA; SESA SpA: Varese, Italy, 1996.
  74. University of Ancona Sanitary Landfills in Ancona Province, Tritium and Isotopes Levels; Analysis Report for Ancona Province; SESA SpA: Varese, Italy, 1994.
  75. Cidzikienė, V.; Jakimavičiūtė-Maselienė, V.; Girgždienė, R.; Mažeika, J.; Petrošius, R. Assessment of Tritium Activity in Groundwater at the Nuclear Objects Sites in Lithuania. Int. J. Nucl. Energy 2014, 2014, 1–6. [Google Scholar] [CrossRef] [Green Version]
  76. Kashiwaya, K.; Muto, Y.; Kubo, T.; Ikawa, R.; Nakaya, S.; Koike, K.; Marui, A. Spatial Variations of Tritium Concentrations in Groundwater Collected in the Southern Coastal Region of Fukushima, Japan, after the Nuclear Accident. Sci. Rep. 2017, 7, 12578. [Google Scholar] [CrossRef] [Green Version]
  77. Calestani, G.; Masserano, M.; Pellegrini, M.; Tazioli, G.S.; Vannucchi, M. On the Methods for Monitoring the Interference of Sanitary Landfills Activity Processes with the Underground Environment. The Example of Two Monitored Landfills near the City of Parma, Italy. In Proceedings of the Waste Management and Landfill Symp, Cagliari, Italy, 4–8 October 1999; Volume 4, pp. 245–252. [Google Scholar]
  78. Mutch, R.D., Jr.; Mahony, J.D. A Study of Tritium in Municipal Solid Waste Leachate and Gas. Fusion Sci. Technol. 2008, 54, 305–310. [Google Scholar] [CrossRef]
  79. Robinson, H.D.; Gronow, J.R. Tritium Levels in Leachates and Condensates from Domestic Wastes in Landfill Sites. Water Environ. J. 1996, 10, 391–398. [Google Scholar] [CrossRef]
  80. Hicks, T.W.; Wilmot, R.D.; Bennett, D.G. Tritium in Scottish Landfill Sites; Galston Sciences Limited: Oakham, UK, 2000; p. 29. [Google Scholar]
  81. University of Ancona Sanitary Landfill of Maiolati Spontini; Analysis Report for Sogenus SpA; SESA SpA: Varese, Italy, 2001.
  82. Tomassoni, D.; Tazioli, G.S. Assessment Report on Tritium; Technical Report for Public Prosecutor’s Office of Ancona: Ancona, Italy, 1964. [Google Scholar]
  83. Cossu, R.; Zuffianò, L.E.; Limoni, P.P.; De Giorgio, G.; Pizzardini, P.; Miano, T.; Mondelli, D.; Garavaglia, R.; Carella, C.; Polemio, M. How Can the Role of Leachate on Nitrate Concentration and Groundwater Quality Be Clarified? An Approach for Landfills in Operation (Southern Italy). Waste Manag. 2018, 77, 156–165. [Google Scholar] [CrossRef]
  84. Rizzo, P.; Cappadonia, C.; Rotigliano, E.; Iacumin, P.; Sanangelantoni, A.M.; Zerbini, G.; Celico, F. Hydrogeological Behaviour and Geochemical Features of Waters in Evaporite-Bearing Low-Permeability Successions: A Case Study in Southern Sicily, Italy. Appl. Sci. 2020, 10, 8177. [Google Scholar] [CrossRef]
  85. Nigro, A.; Sappa, G.; Barbieri, M. Application of Boron and Tritium Isotopes for Tracing Landfill Contamination in Groundwater. J. Geochem. Explor. 2017, 172, 101–108. [Google Scholar] [CrossRef] [Green Version]
  86. Raco, B.; Battaglini, R. Tritium as a Tool to Assess Leachate Contamination: An Example from Conversano Landfill (Southern Italy). J. Geochem. Explor. 2022, 235, 106939. [Google Scholar] [CrossRef]
  87. Liu, C.L.; Hackley, K.C.; Baker, J. Application of Environmental Isotopes to Characterize Landfill Gases and Leachate. In Proceedings of the Geological Society of America, Abstracts with Programs, Cincinnati, OH, USA, 26–29 October 1992; Volume 24, p. A35. [Google Scholar]
  88. Rank, D.; Papesch, W.; Rajner, V.; Riehl-Herwirsch, G. Environmental Isotopes Study at the Breitenau Experimental Landfill (Lower Austria). Tracer Hydrol. 1992, 173, 176. [Google Scholar]
  89. Rank, D.; Papesch, W.; Rajner, V. Environmental Isotopes Study at a Research Landfill (Breitenau, Lower Austria). In Proceedings of the Isotopes in Water Resources Management, Breitenau, Austria, 1 March 1996, V. 1. Symposium on isotopes in water resources management, Vienna, Austria, 20–24 March 1995. [Google Scholar]
  90. Kerfoot, H.B.; Baker, J.A.; Burt, D.M. The Use of Isotopes to Identify Landfill Gas Effects on Groundwater. J. Environ. Monit. 2003, 5, 896. [Google Scholar] [CrossRef]
  91. Egboka, B.C.E.; Cherry, J.A.; Farvolden, R.N. Estimation of the Percentage of Annual Groundwater Recharge with Bomb Tritium Using a Cumulative Mass Balance Method. Pure Appl. Geophys. Pageoph 1982, 120, 330–347. [Google Scholar] [CrossRef]
  92. State Water Resources Control Board (SWRCB). Waste Discharge Requirments (Wdrs) For Storm Water Discharges From Small Municipal Separate Storm Sewer Systems (General Permit) 2003, 1–87. Available online: https://www.waterboards.ca.gov/board_decisions/adopted_orders/water_quality/2003/wqo/wqo2003_0005dwq.pdf (accessed on 23 April 2022).
  93. Bandeira, J.V.; Mingote, R.M.; Baptista, M.B.; Oliveira, D.M.; Lima, F.P. The Use of Tritium Content as an Indicator of the Groundwater Contamination by Sanitary Landfills Leachates in the Region of Belo Horizonte City, Brazil. Water Sci. Technol. 2008, 57, 1915–1920. [Google Scholar] [CrossRef] [PubMed]
  94. Verhagen, B.T. A Unique Approach to Evaluate the Utility of Landfill Monitoring Boreholes. In Geotechnics for Developing Africa: Proceedings of the 12th Regional Conference for Africa on Soil Mechanics and Geotechnical Engineering, Durban, South Africa, 25–27 October 1999; CRC Press: Boca Raton, FL, USA, 1999; Volume 12, p. 43. [Google Scholar]
  95. Levin, M.; Verhagen, B. Application of Isotope Techniques to Trace Location of Leakage from Dams and Reservoirs. In Technical Report to the Water Research Commission by School of Geosciences; University of the Witwatersrand: Johannesburg, South Africa, 2013; pp. 9–23. [Google Scholar]
  96. Castañeda, S.S.; Sucgang, R.J.; Almoneda, R.V.; Mendoza, N.D.S.; David, C.P.C. Environmental Isotopes and Major Ions for Tracing Leachate Contamination from a Municipal Landfill in Metro Manila, Philippines. J. Environ. Radioact. 2012, 110, 30–37. [Google Scholar] [CrossRef]
  97. Park, S.D.; Kim, J.G.; Kim, W.H.; Kim, H.S. Distribution of tritium in the leachates and methane gas condensates from municipal waste landfills in Korea. Water Environ. J. 2005, 19, 91–99. [Google Scholar] [CrossRef]
  98. Pujiindiyati, E.R.; Sidauruk, P. Study of Leachate Contamination in Bantar Gebang Landfill to Its Shallow Groundwater Using Natural Isotope Tracers of 18O, 2H and 3H. At. Indones. 2015, 41, 31. [Google Scholar] [CrossRef] [Green Version]
  99. Raco, B.; Dotsika, E.; Battaglini, R.; Bulleri, E.; Doveri, M.; Papakostantinou, K. A Quick and Reliable Method to Detect and Quantify Contamination from MSW Landfills: A Case Study. Water. Air. Soil Pollut. 2013, 224, 1380. [Google Scholar] [CrossRef]
  100. Fuganti, A.; Eichinger, L.; Morteani, G.; Preinfalk, C. L’utilizzo Degli Isotopi Trizio, Ossigeno-18, Deuterio e Carbonio-13 per La Valutazione Dei Rapporti Tra Discariche Di Rifiuti Ed Acque Sotterranee. Geol. Tec. E Ambient. 2003, 2, 5–10. [Google Scholar]
Figure 1. (a) Example of tritium content and river discharge values in the Danube River at Vienna (Austria); (b) tritium content of the Colorado River at Cisco (UT-US) and (c) Mississippi River at Luling (Louisiana, US). Data provided by [28]. The locations of the selected river stations are reported in Figure 4.
Hydrology 09 00075 g001
Figure 2. Tritium content (TU) in precipitation, recorded in different countries worldwide. Data are provided by the GNIP-IAEA portal [31]: (a) Northern Hemisphere; (b) Southern Hemisphere. AT = Austria; CN = China; DE = Germany; ET = Ethiopia; FR = France; IS = Iceland; NL = The Netherlands; US-NC = North Carolina (United States); US-OR = Oregon (United States); US-AK = Alaska (United States), AQ = Antarctica, AU = Australia; CL = Easter Island (Chile); NZ = New Zealand; SH = Ascension Island (Saint Helena, Ascension, and Tristan da Cunha). The location of the selected rainfall stations is reported in Figure 4.
Hydrology 09 00075 g002
Figure 3. Tritium background level in precipitation over time, for a rainfall station located in central Italy and managed by Università Politecnica delle Marche.
Hydrology 09 00075 g003
Figure 4. Location of rainfall stations used to obtain precipitation tritium content provided by [31] (blue squares), river sampling and monitoring points provided by GNIR [28] (green triangles), and landfill case studies reported in this review (red circles). The dimension of the red circles is proportional to the number of examined cases.
Hydrology 09 00075 g004
Figure 5. Geo-lithological cross-section of case history 1, with a landfill showing no interaction between tritium content and the environment. Legend is reported in Figure 7c.
Hydrology 09 00075 g005
Figure 6. Geo-lithological cross-section involving a landfill with pollution of the environment. Legend is reported in Figure 7c.
Hydrology 09 00075 g006
Figure 7. (a) Geo-lithological cross-section of case history 3; (b) schematic planimetric view of landfill and tritium content in groundwater of case history 3; (c) legend of geo-lithological cross-sections of Figure 5, Figure 6 and Figure 7a.
Hydrology 09 00075 g007
Table 1. Weighted average tritium content in precipitation (expressed in TU) recorded in different countries worldwide. Data are provided by the GNIP-IAEA portal [31] and divided into 7 time periods.
Time Period
CountryPre 19631963–19641965–19791980–19901991–20002001–2010Post 2010
AQ--90.97-9.8210.05-
AT475.142374.21259.9825.9515.0711.1210.37
AU18.7549.3429.936.63---
CL-26.7811.571.12.401.43-
CN88.75166.332.457.655.562.28-
DE425.972702.41321.0237.1417.789.948.69
ET--100.0911.428.18--
FR-2373.65171.23226.0015.129.387.71
IS156.94986.77285.04-5.504.10-
NL--113.4320.8011.8510.02-
NZ9.9028.1720.053.682.54--
SH13.8320.077.8787.6653.583.79-
US-NC259.38642.6253.4513.545.753.58-
US-OR-828.8680.788.514.334.23
US-AK--77.587.937.591.44-
Where: AQ = Antarctica; AT = Austria; AU = Australia; CL = Easter Island (Chile); CN = China; DE = Germany; ET = Ethiopia; FR = France; IS = Iceland; NL = The Netherlands; NZ = New Zealand; SH = Ascension Island (Saint Helena, Ascension, and Tristan da Cunha); US-NC = North Carolina (United States); US-OR = Oregon (United States); US-AK = Alaska (United States); - = data not available.
Publisher’s Note: MDPI stays neutral with regard to jurisdictional claims in published maps and institutional affiliations.

