Article

Short-Term Effects of the EU Nitrate Directive Reintroduction: Reduced N Loads to River from an Alluvial Aquifer in Northern Italy

1
Department of Chemistry, Life Science and Environmental Sustainability, University of Parma, Parco Area delle Scienze 11/a, 43124 Parma, Italy
2
Marine Science and Technology Center, Klaipeda University, Herkaus Manto 84, 92294 Klaipeda, Lithuania
3
Institute for Electromagnetic Sensing of the Environment, National Research Council of Italy (CNR-IREA), 20133 Milan, Italy
*
Author to whom correspondence should be addressed.
Hydrology 2022, 9(3), 44; https://doi.org/10.3390/hydrology9030044
Submission received: 18 January 2022 / Revised: 13 February 2022 / Accepted: 23 February 2022 / Published: 25 February 2022

Abstract

:
The Po Plain (northern Italy) is one of the largest aquifers in Europe, and 67% of the utilized agricultural land in this area is classified as a nitrate vulnerable zone (NVZ). However, it hosts intensive agriculture and livestock farming. In a stretch of the Mincio River (a tributary of the Po River), hydraulic heads and physico-chemical parameters of river and groundwater were monitored for a hydrologic year (2020–2021), to evaluate the effects of manure fertilization and flooding irrigation on surface- and groundwater chemistry. From 2020 the Nitrate Directive’s fertilization limit was reintroduced and a comparison has been performed comparing surface- and groundwater data from the 2019 fertilization period (before limit reintroduction) and 2020 (after). Results suggest that in 2021 the phreatic aquifer displayed elevated nitrate (NO3) concentrations, exceeding 50 mg L−1, although average values were lower than those of 2019. Nitrate loads in the Mincio River reached 6670 kg NO3 d−1 and resulted from the overfertilization in the surrounding area and the quick transfer of nitrogen from groundwater to the river. As compared to 2019, the river loads decreased by 59%, suggesting that the introduction of fertilization limits can produce measurable, short-term responses in alluvial aquifers.

1. Introduction

Although vital for society, agriculture and livestock are considered stressors for the hydrological and nutrient cycles in lowland ecosystems, especially when performed using intensive practices. Due to their fast response capability to increasing demand, intensive livestock production systems now account for prevailing shares of global swine and poultry meat and egg production (56%, 72%, and 61%, respectively) and a significant share of milk production [1]. In order to maintain this production, livestock requires water, energy (in the form of carbohydrates), proteins, and 18 mineral nutrients, including phosphorus (P), calcium (Ca), potassium (K), magnesium (Mg), selenium (Se), copper (Cu), and zinc (Zn) [2]. A large percentage of the ingested substances, typically between 70% and 90% of the nitrogen (N) and the mineral nutrients present in the feed, are excreted via manure and urine. A large portion of the harmful environmental effects of intensive livestock production is related to the inadequate management of this livestock excreta, which contain large amounts of undigested organic matter and mineral nutrients [3,4].
The Po Plain (northern Italy) is composed by the Emilia-Romagna, Lombardy, Veneto, and Piedmont regions and is one of the most productive areas of Italy from the perspective of animal farming, accounting for approximately 3.1 × 10⁶ cattle (about 50% of the national stock) and 6.0 × 10⁶ swine (about 65% of the national stock) [5]. The livestock by-products are a precious resource for the intensive agriculture performed in the area. Together, livestock and agriculture contribute to almost 80% of the total N load in the Po Plain, which is appraised at 550,000 t y−1, leading to a diffuse NO3 contamination of both surface and groundwater [6,7]. In addition, the Po Plain is characterized by one of the largest aquifers in Europe [8] and 67% of the utilized agricultural area (UAA) was classified as a nitrate vulnerable zone (NVZ) [9].
The NVZs were characterized during the adoption of the Council Directive 91/676/EEC (Nitrate Directive) concerning the protection of water against pollution caused by nitrates from agricultural sources [10]. They are described as areas draining into, “waters affected and at risk of being affected by nitrates pollution as well […] where agriculture contributes significantly to this pollution”. From a legal perspective, a “directive” is a legislative act that sets out a goal that all EU countries must achieve. However, it is up to the individual countries to devise their own laws regarding how to reach these goals. In Italy, the Nitrate Directive is implemented by individual regions, which are also responsible for the monitoring of the directive application. For example, in Lombardy the monitoring is performed from both environmental (by the Regional Authority for Agriculture and Forests—ERSAF–and by the Regional Environmental Protection Agency of Lombardy—ARPA Lombardia) and administrative institutions (by the Regional general directorate for agriculture, food, and green systems, its local offices and the local police). One of the most important issues of the directive is that in the NVZ, farmers cannot spread more than 170 kg N ha−1 y−1 derived from manure. This limit is applied all over the EU, notwithstanding whether waters are polluted or at risk of pollution, regardless of climatic and pedological conditions and the crops grown. Regarding synthetic fertilizers, the Nitrate Directive does not set a limit, but only states that, “The total nitrogen inputs shall not exceed the foreseeable nutrient demand of the considered crop. It shall take into account the supply from the soil and the increased manure nitrogen availability due to manure treatment. It shall not exceed maximum application standards, as established in the action programmes applicable to the farm”. EU Member States can exceed the proposed limit by requesting a derogation (an occasion when a law is allowed to be ignored) to the EU and proving, “with scientific evidence that for defined crops, in the local conditions the use of higher amounts [of manure] will not hamper in any way water quality”. Italy requested this derogation and was successively granted to the regions of Emilia-Romagna, Lombardy, Veneto, and Piedmont from 2011 to 2015 [11] and again for Lombardy and Piedmont from 2016 to 2019 [12]. Here, farmers were allowed to exceed the 91/676/EEC limits and apply to agricultural soils up to 250 kg N ha−1 y−1 from manure. Although the derogation fostered intensive agriculture in these regions, it also resulted in a (possible) worsening of the environmental conditions regarding the contamination by N and other nutrients lato sensu. Indeed, several authors described different anthropic pressures to the hydrosphere at different (temporal and spatial) scales and areas, using hydrological, biogeochemical, and isotopic approaches [7,13,14,15,16,17]. The overall picture describes a quite diffuse contamination (<50 mg NO3 L−1) and non-homogeneous pollution (>50 mg NO3 L−1) from nitrate in all of the Po Plain in both surface- and groundwater. From 2020, farmers from the above-mentioned regions are obliged to conform to the previous manure fertilization limit of 170 kg N ha−1 y−1, which is expected to better protect surface- and groundwater from NO3 pollution.
Among the emissaries from the Italian northern alpine lakes, one of the relatively less investigated areas by the hydrogeological perspective is the Mincio River basin (Po Plain). Here, livestock farming accounts for 136 × 103 cattle and 483 × 103 swine, whose manure is used in the Mincio River basin to improve crop production, consisting of maize, feed crops, wheat, and permanent grassland [9]. Previous work reported an anomalous rise of NO3 concentrations at the 33rd km of the Mincio River course [18]. The authors, after performing soil system budgets of the area, calculated a high surplus of NO3 in the system and subsequently postulated that the NO3 anomaly could be related to the groundwater feeding the river. This mechanism, likely linked to the high amount of manure used as fertilizer, was still unverified. In addition, the area is poorly monitored by the Regional Environmental Protection Agency (ARPA Lombardia), whose groundwater quality monitoring network is limited in the northern part of the Mincio basin [19], and it is not possible to verify the contamination trend along time.
In this context, the main aims of this study were: (i) the characterization of water quality between the 18th and 33rd km of the Mincio River through the entire hydrological year in both surface- and groundwater, to assess the possible NO3 contamination; (ii) to explore the possible dynamics of the river-groundwater interaction, comparing the variations of the physico-chemical parameters along time in both surface- and groundwater; (iii) the evaluation of the short-term effects of the limits’ reintroduction on the use of fertilizers imposed by the Nitrate Directive in both surface and groundwater. The comparison regards a fertilizing period (autumn) in 2019 (250 kg N ha−1 y−1) and 2020 (170 kg N ha−1 y−1) and the effects of different N inputs on surface- and groundwater NO3 concentrations. In surface waters, the comparison was performed between upstream and downstream the investigated reach of the Mincio River, contrasting the NO3 loads estimated in autumn 2019 and 2020.
We hypothesized a fast response of this system to decreased rates of fertilization. In this area, the flood irrigation and abundant precipitation over permeable soil determine simultaneously large vertical and horizontal transport of contaminants and a relatively fast turnover of groundwater. We speculate that decreased nitrogen excess in cultivated soil would result in a lowering of groundwater nitrate concentrations due to less nitrate-rich percolating water. This mechanism is different from that described in other, less permeable cultivated floodplains where the response is much slower. We also hypothesized that groundwater feeds the Mincio River, especially in the central and southern part of the investigated area, where the joined effects of springs and diffuse groundwater inputs could be more appreciable.

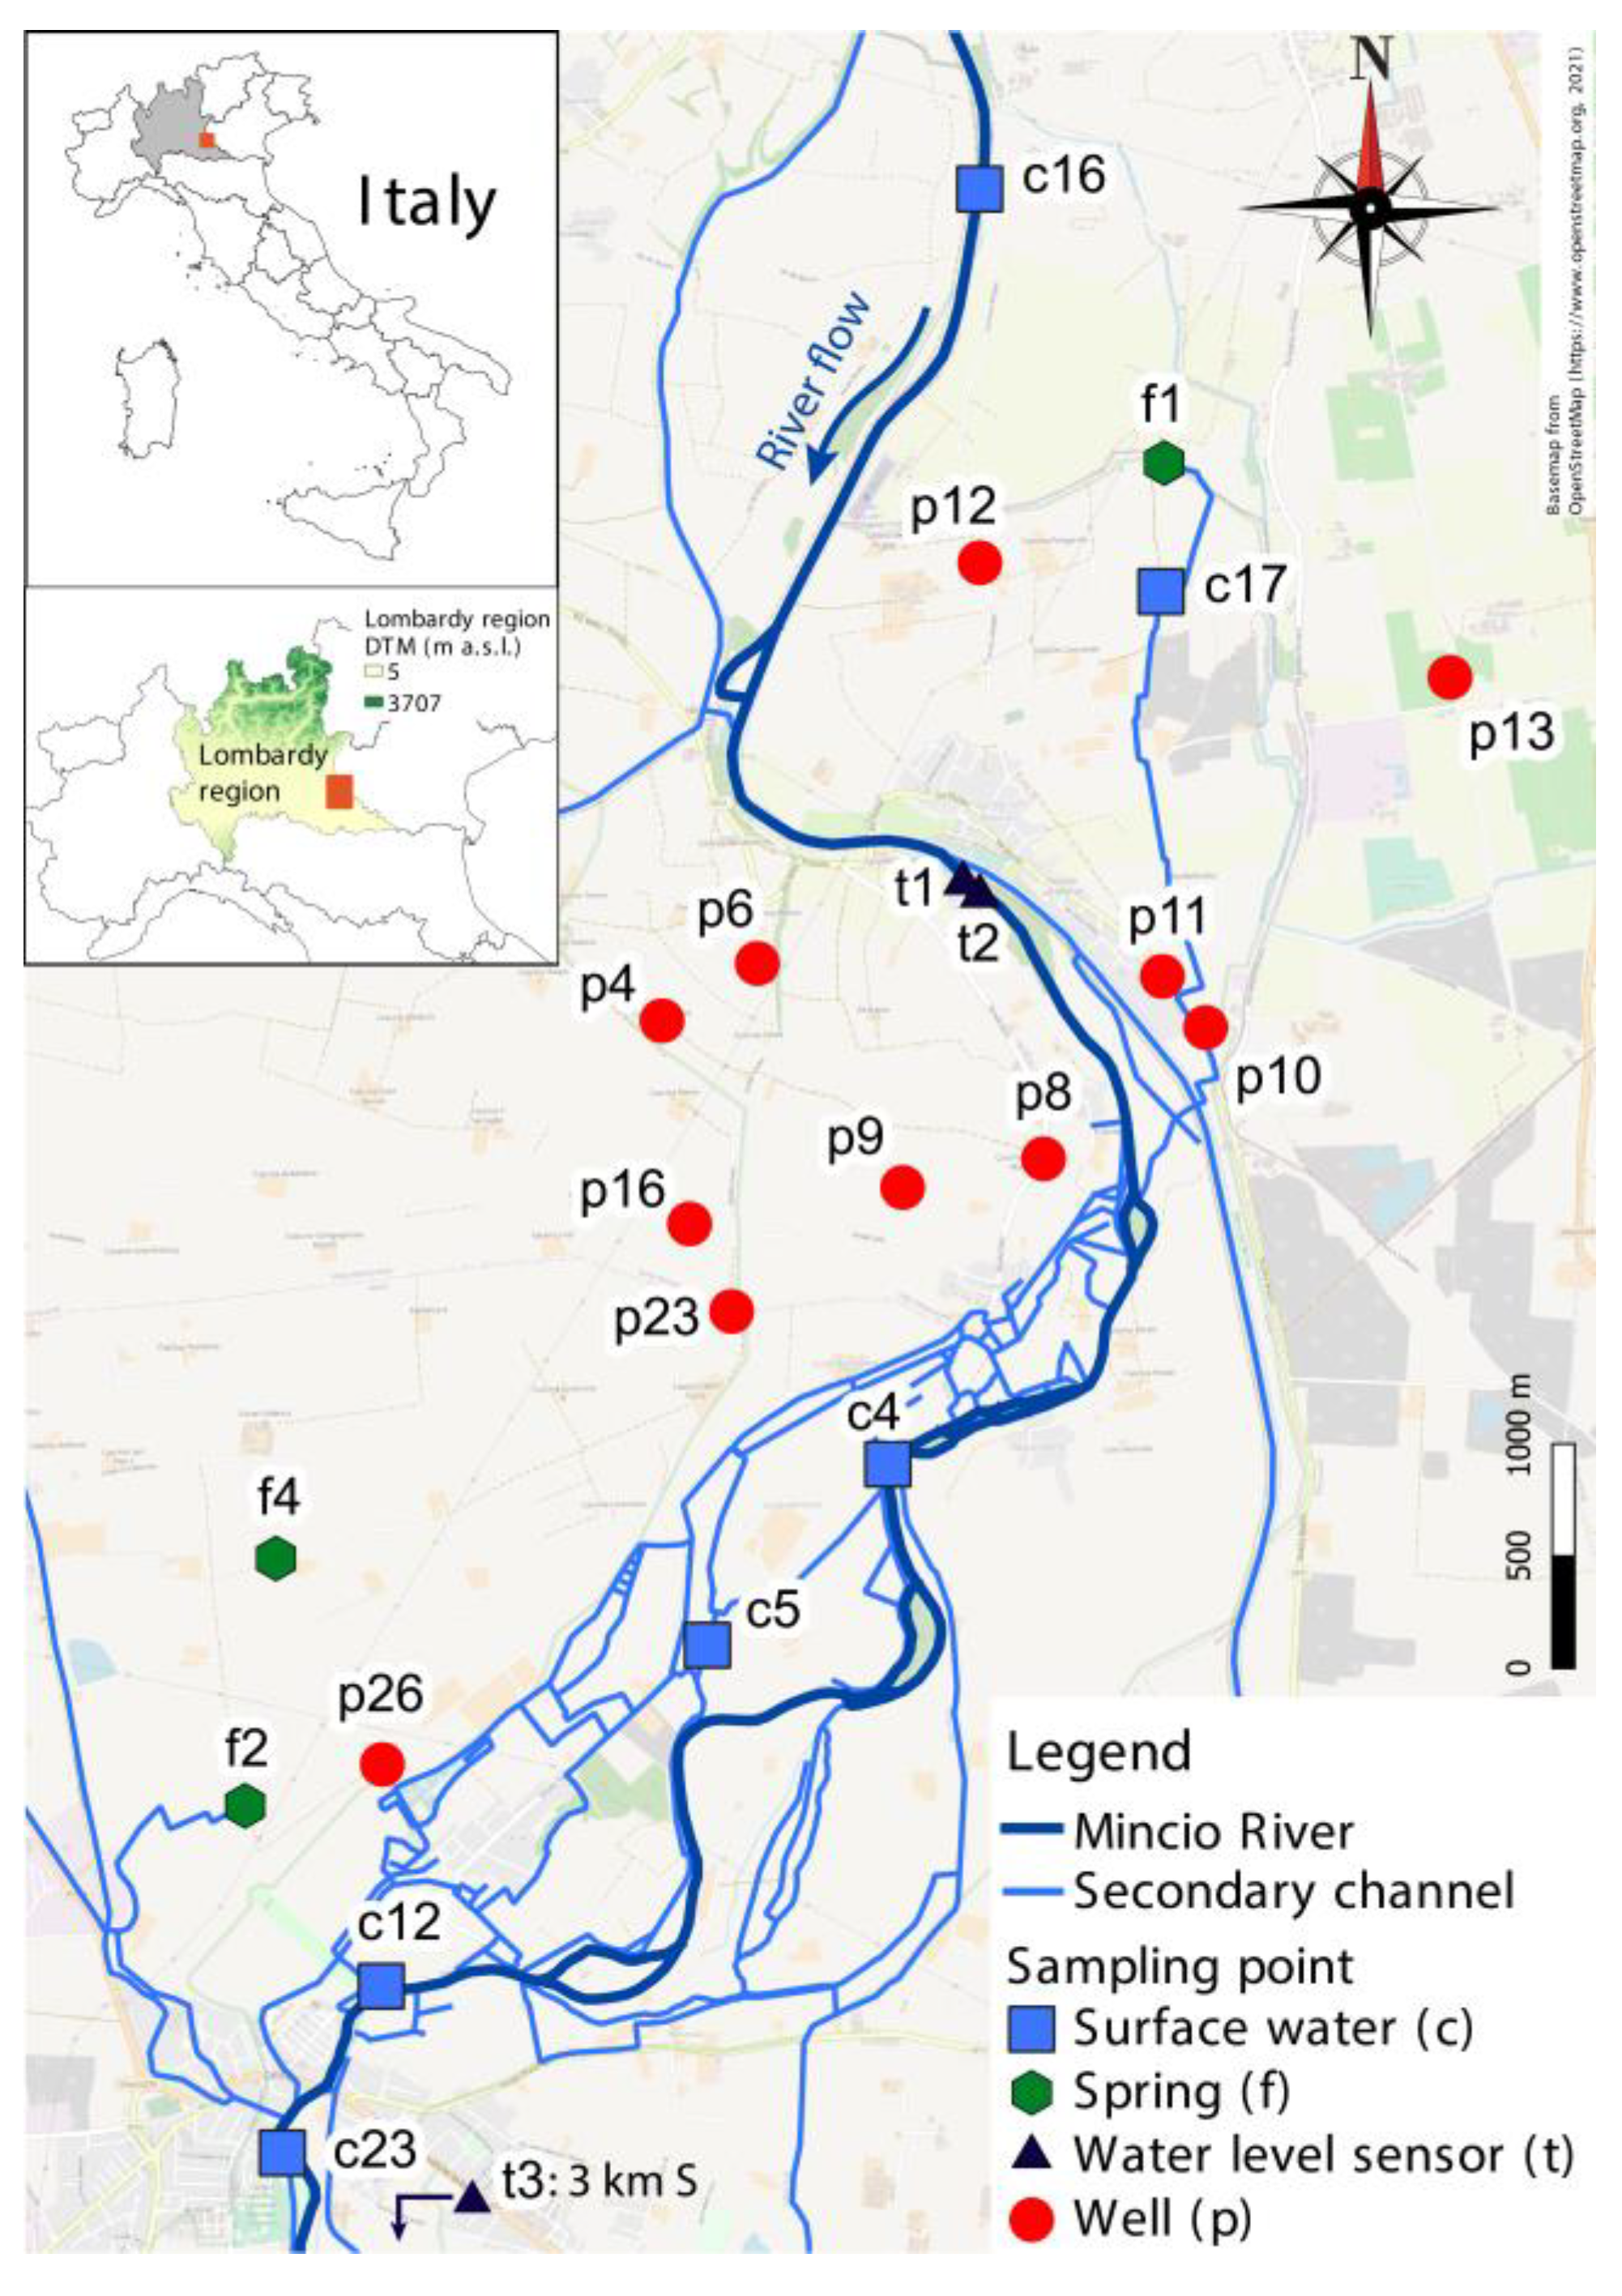
2. Materials and Methods

The investigated area (Figure 1) is located between the 18th and 33rd km of the Mincio River, between the Pozzolo sul Mincio and Goito villages (northern Italy). The hydrogeological characteristics of some portions of the area were already investigated in previous studies [20,21]. The overall hydrogeological conceptual model is characterized by a phreatic aquifer with a thickness varying between 2 and 30 m, which thinner part is located near the Mincio River. The unconfined aquifer is made of gravels and subordinately sands and corresponds to the fluvial-channel facies reported in [22]. Beneath the shallow aquifer, a continuous bed of fine grain-sized deposits is present, belonging to the overbank facies and constituted by clay and silt, with a thickness always larger than 2 m. In the area, the greater recharge is provided by the irrigation waters. During the irrigation period (April–September) the hydraulic heads raised up to 4 m in 2019 [20].
The hydrogeological characterization was performed measuring the groundwater head in 11 wells (identified as “p” in Figure 1) to reconstruct the groundwater potentiometric map variations during the hydrological year, from June 2020 to May 2021. To include the Mincio River stages in the phreatic map (Figure 2), data from three water level sensors (identified as “t” in Figure 1) were downloaded from the Interregional Agency for the Po River [23]. The first two are located upstream (t1) and downstream (t2) of the dam of Pozzolo, whereas the third (t3) is located ~3 km S the investigated area (Figure 1). Given the absence of waterfalls and other similar altitudinal discontinuities along the river course, its water levels were interpolated using a constant gradient between t2 and t3. Together with quantitative monitoring, a qualitative sampling was performed. Wells (n = 11) were sampled using a bailer sampler, whereas the other samples (n = 8) were directly collected using 1 L polyethylene bottles. The other samples consist of the Mincio River and the adjacent channels and some springs, identified as “c” and “f” in Figure 1, respectively. In the field, electrical conductivity (EC), pH, and temperature were measured using a multi-parameter probe (HI9829 HANNA Instruments, Woonsocket, RI, USA), calibrated the day before sampling. Successively, samples were prepared according to the required analyses. For the silica (SiO2) analysis, samples were stored in 50 mL polyethylene bottles without filtration. For the other analytes, samples were filtered with 0.7 μm pore size glass microfiber filters. A sub-sample was stored in glass vials for the alkalinity analyse through 0.1 N HCl titration [24], performed only during three samplings. For ions, samples were filtered with 0.2 μm pore size nylon filters and stored in plastic vials. In the case of cations, vials were acidified with 2 M HNO3 till pH 2 to avoid metals precipitation [25]. All of the samples were stored in a refrigerated box until analyses, carried out within 24 h from the collection. In the laboratory, SiO2 was analysed by spectrophotometry (Novaspec II Pharmacia) according to [26], waiting 10 min after the addition of reagents to permit the colloidal silica depolymerization and reaction with molybdic acid [27]. Samples were successively centrifuged at 2000 rpm for 3 min to allow sedimentation of suspended material and the upper part of the vial was poured in cuvettes for the spectrophotometric reading. Cations and anions were analysed by ion chromatography (883 Basic IC plus Metrohm, Herisau, Switzerland). Data of the Mincio River concentrations from September to December 2019, used for comparison with the ones collected in 2020, where analysed with the same methodology. Each chemical analysis was performed by the same operator on the same instrument using the same standards.
Meteorological data were collected from the meteorological station in Goito and downloaded from [28]. In the investigated river reach more than 80 branches were identified, making the calculation of river flow difficult during the samplings. Water flow data were obtained by the Interregional Agency for the Po River (AIPO, https://www.agenziapo.it/, accessed on 6 December 2021) and by the Mincio Consortium (https://www.territoridelmincio.it/index.php, accessed on 6 December 2021).

3. Results

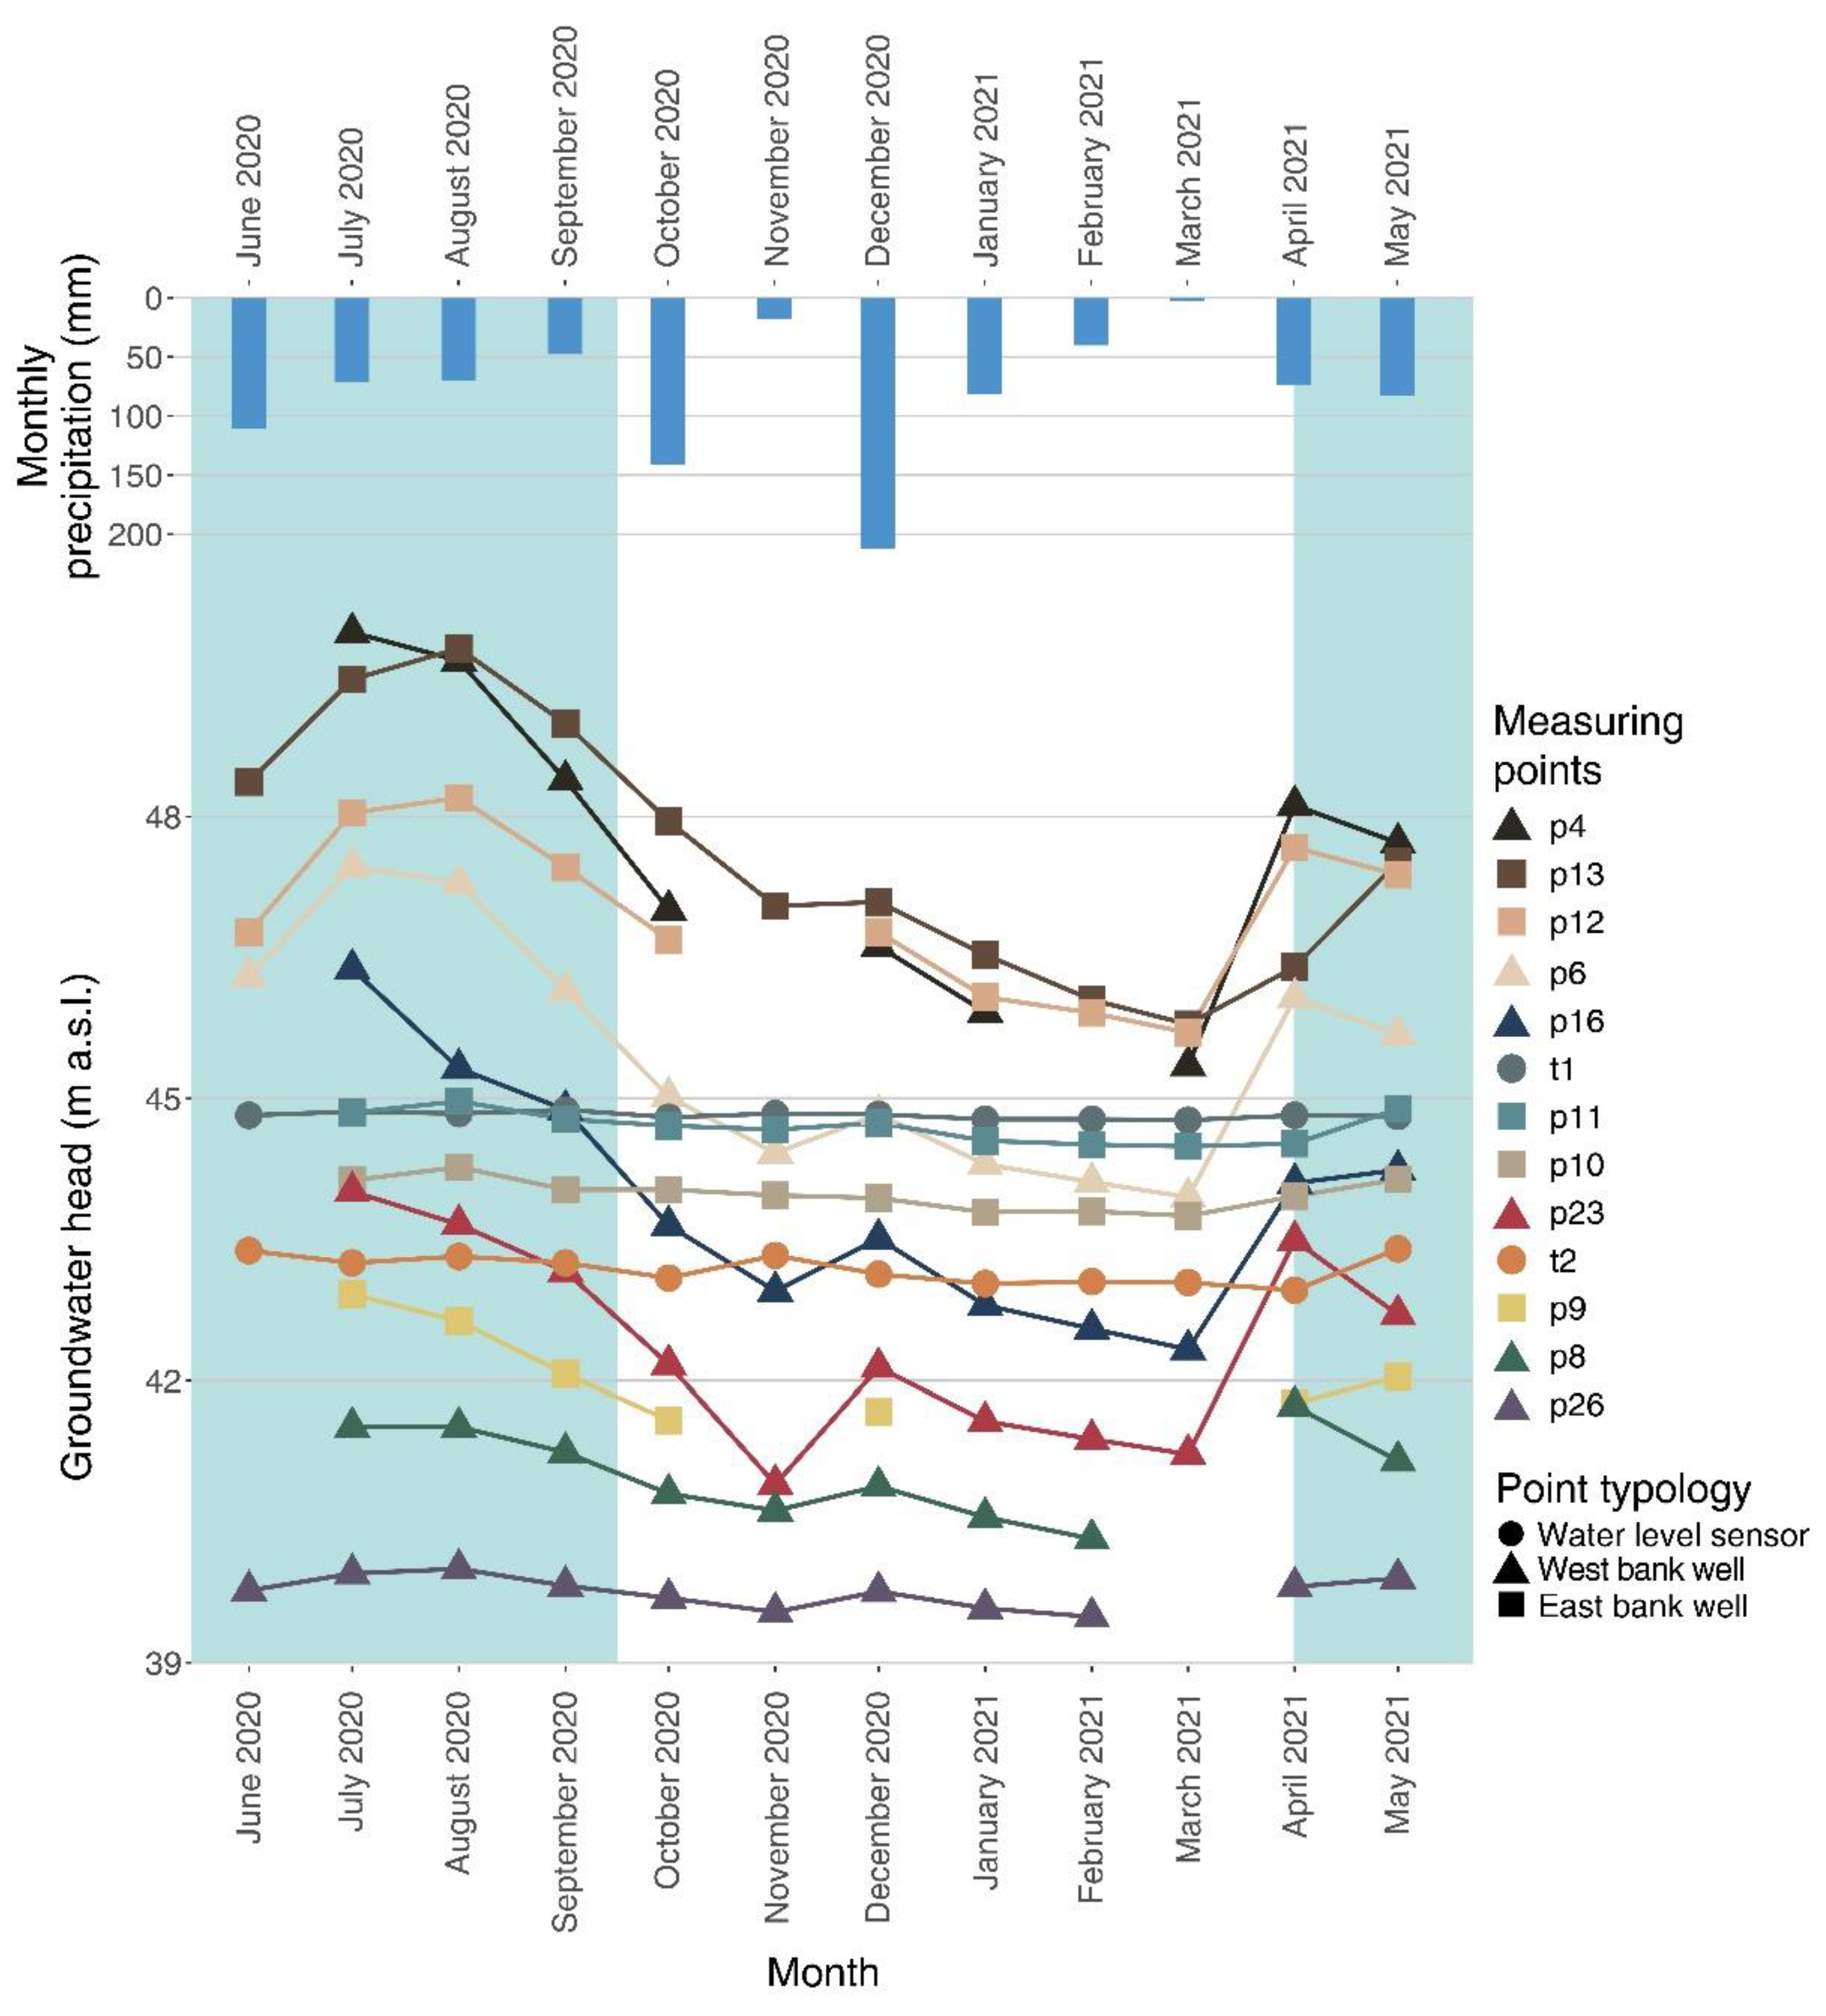
3.1. Surface- and Groundwater Quantitative Monitoring

During the hydrological year, the groundwater flows from outside the investigated area to the Mincio River (Figure 2). The potentiometric surface map, although the variation of hydraulic heads, showed minor differences between the irrigation and non-irrigation period, i.e., between the recharge and recession period, with most of the characteristics constant along time. A main drainage axis is always located in the northern part of the study area (oriented N-S) along the Mincio River course, whereas a groundwater divide is always present in the eastern portion of the area (oriented N-S), although with different entities between the recharge and recession period. Some differences are reported for the western area. Here, two groundwater divides are identified, one near the main drainage axis (oriented W-E) and another one in the southern area (oriented NW-SE). The last one has a greater extent and a different orientation (N-S) during the recession period.
The recharge provided by precipitation is negligible during the irrigation period, also due to the low amount of rain and the relatively high evapotranspiration but can be significant during the rest of the hydrological year. The maximum recharge is given by the flooding irrigation, which deeply modifies the groundwater level from April to September (Figure 3).
During this period, the highest hydraulic heads are reported (July 2020), whereas the recession period shows the lower hydraulic heads peaks in March, when the lowest groundwater heads were measured. The regression coefficients distribution in the study area highlighted two different zones. One is described by the wells near the Mincio River, with an average regression coefficient between the recharge and recession period of 2.92 × 10⁻³ d−1. The other one is located around the wells more distant by the Mincio River, with an average regression coefficient of 0.02 d−1. The hydraulic gradient shows three main areas of variation during the hydrologic year. The first is the western portion of the area, where it varies from a mean value of 0.002 during the recession period to 0.0046 during the recharge period. Near the groundwater divide in the northern area, two other hydraulic gradient values are identified. In the east, a deep change is observed between the recharge period (0.009) and the recession period (0.001). On the contrary, at West, the hydraulic gradient remains constant during the investigated period. The overall variation between the recession and recharge period, is more emphasised far to the Mincio River, as inferable by the groundwater level fluctuations reported in Figure 3.

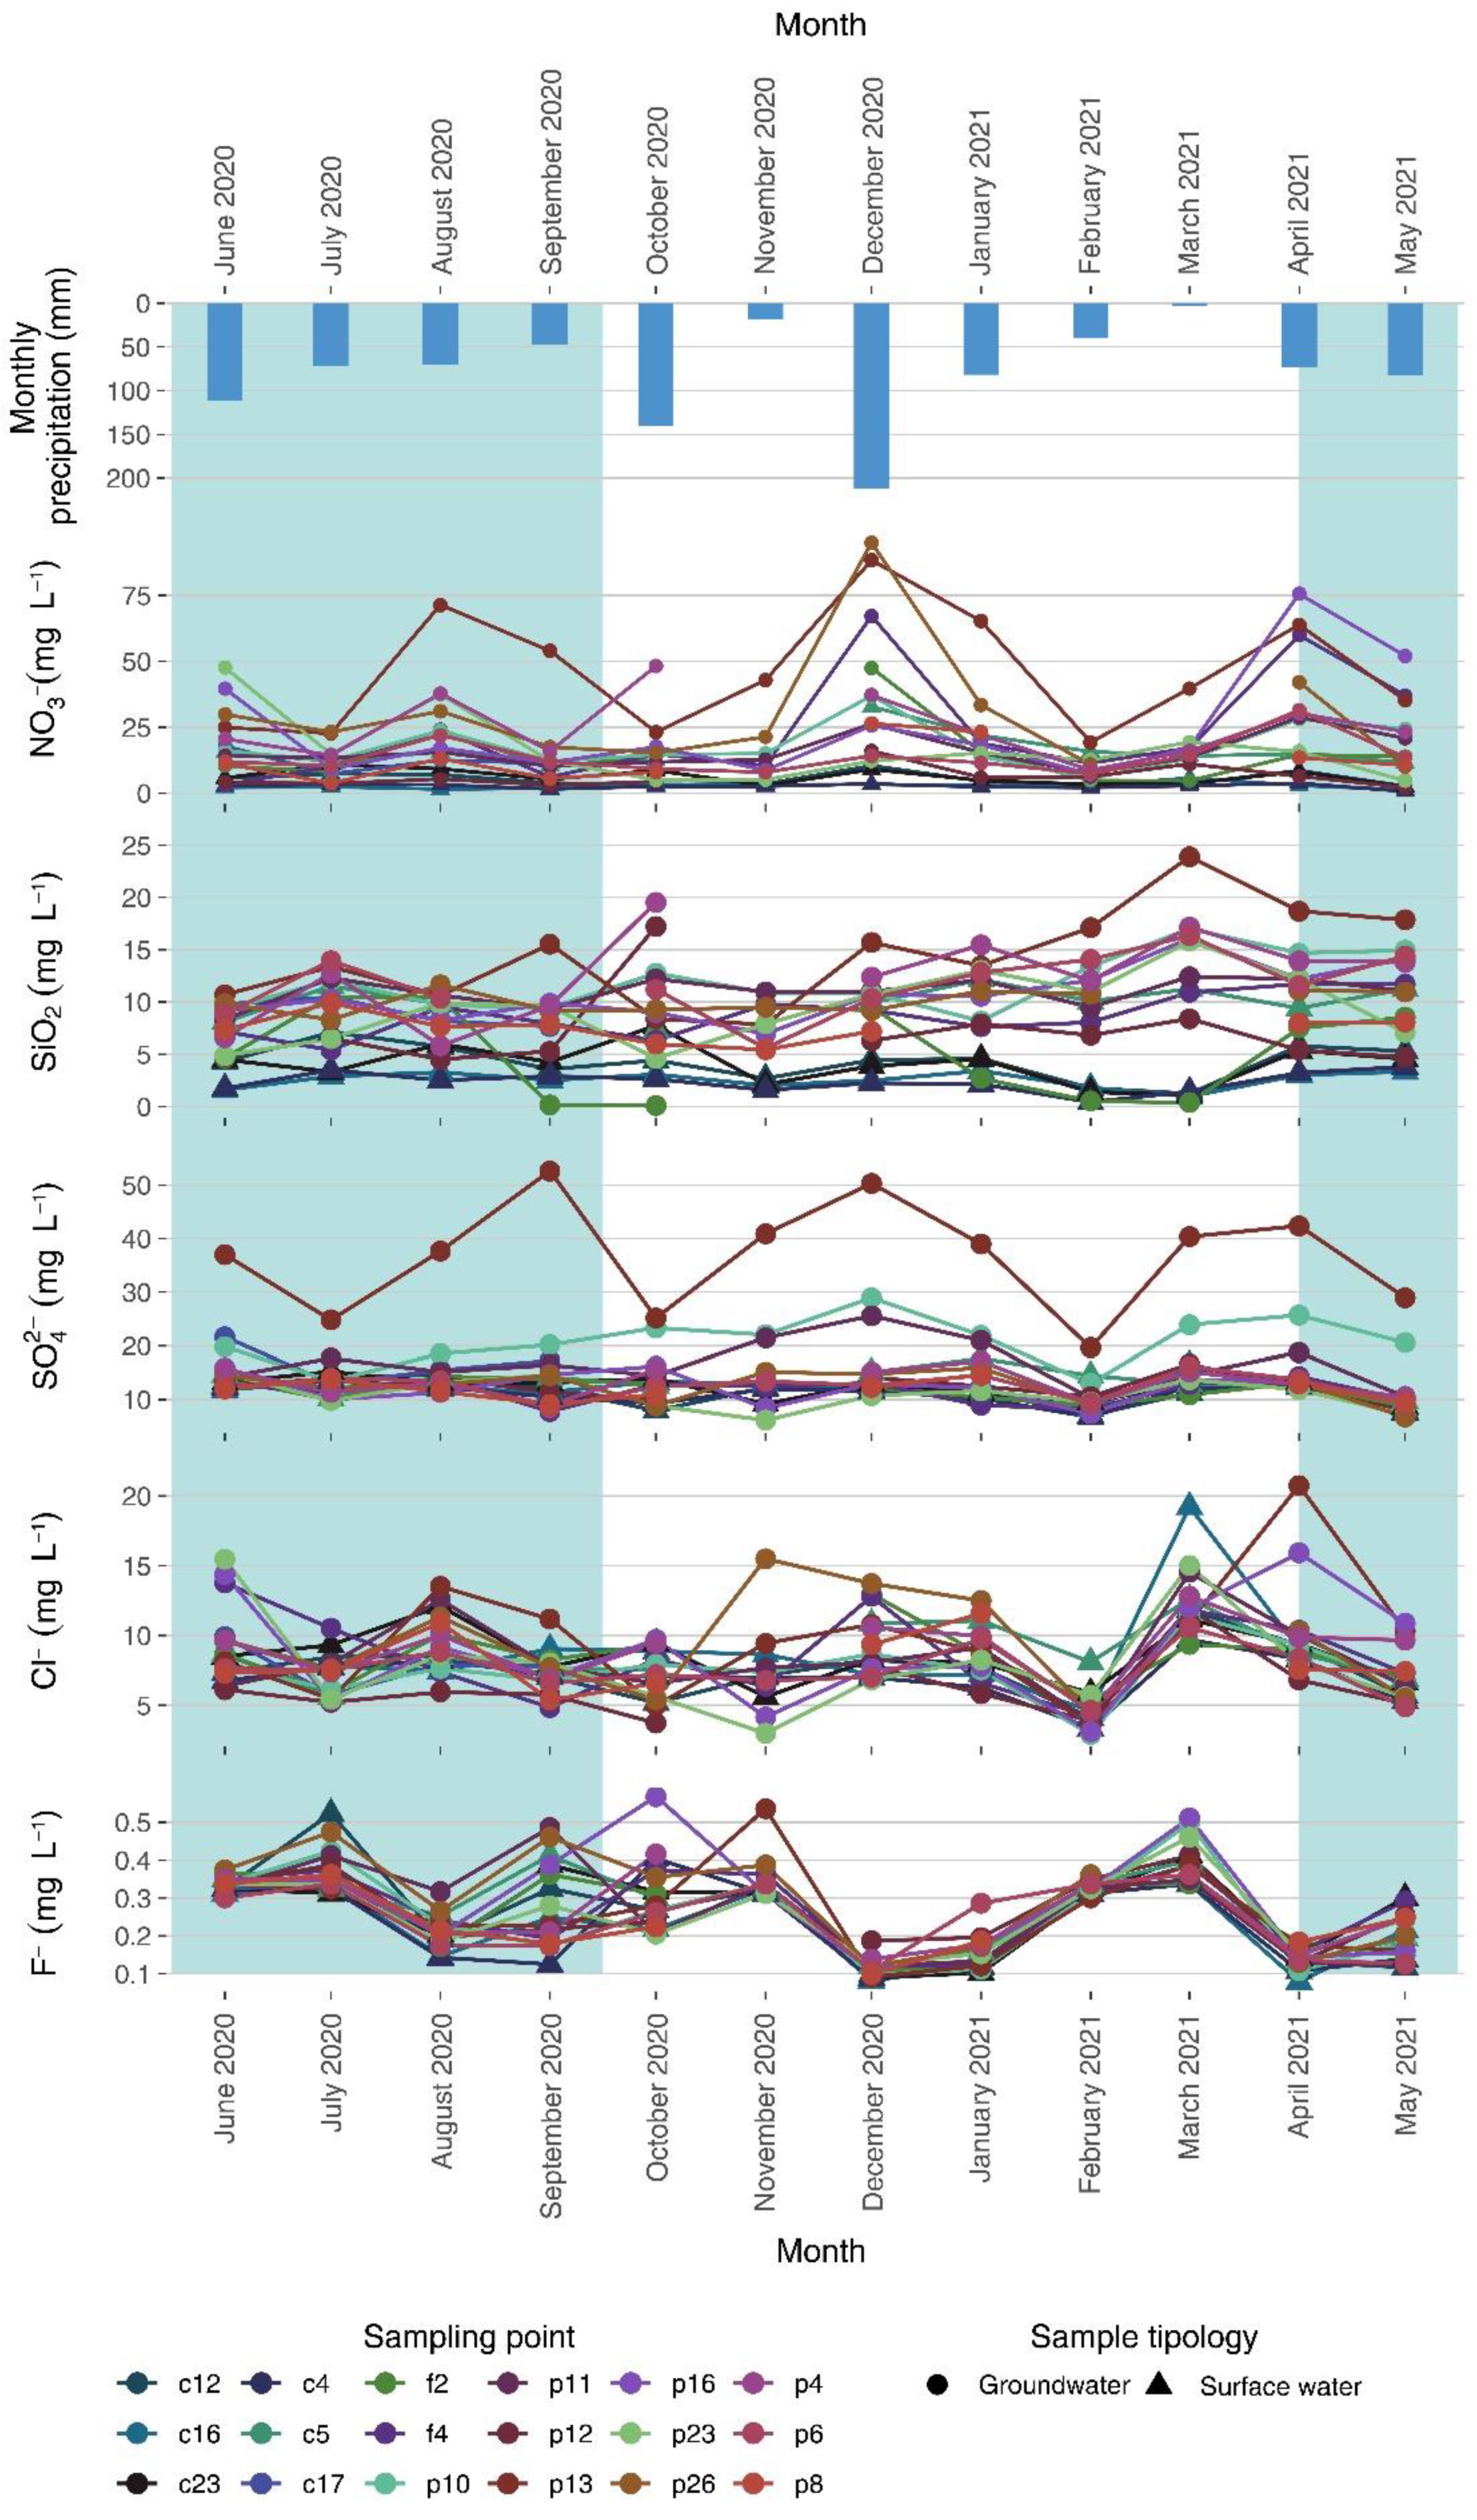
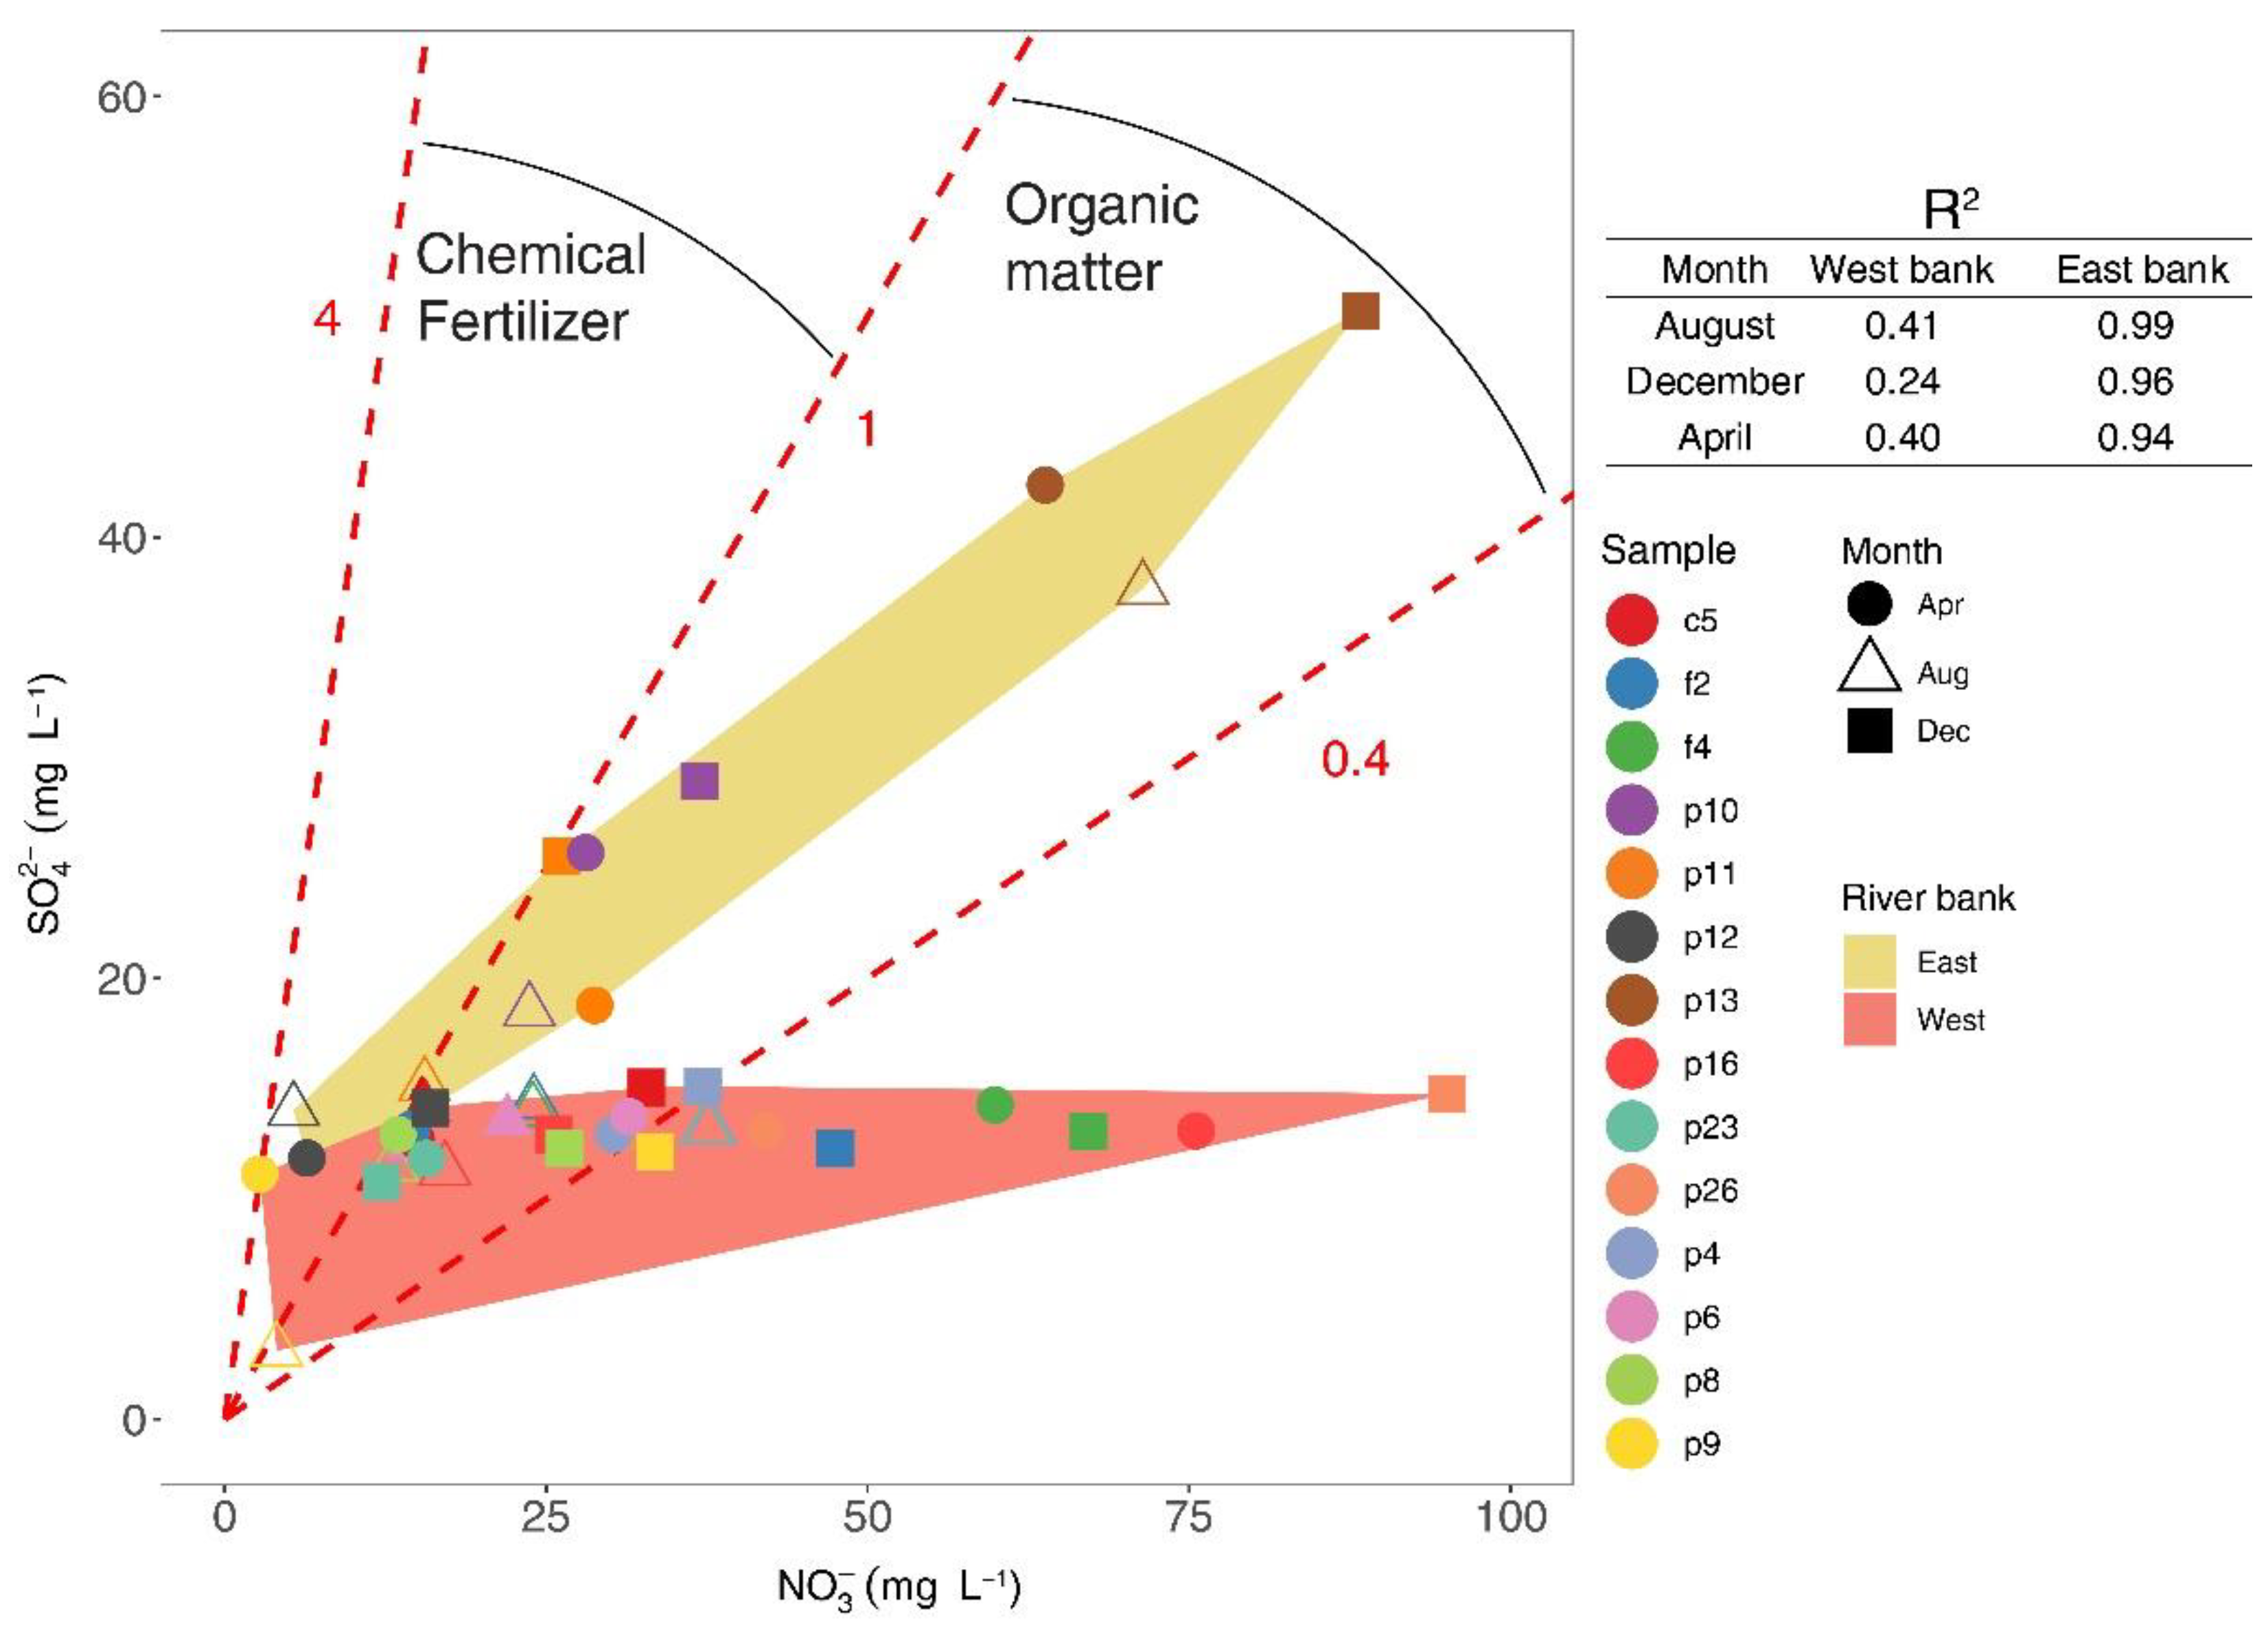
3.2. Monitoring of Water Chemistry of Surface- and Groundwater
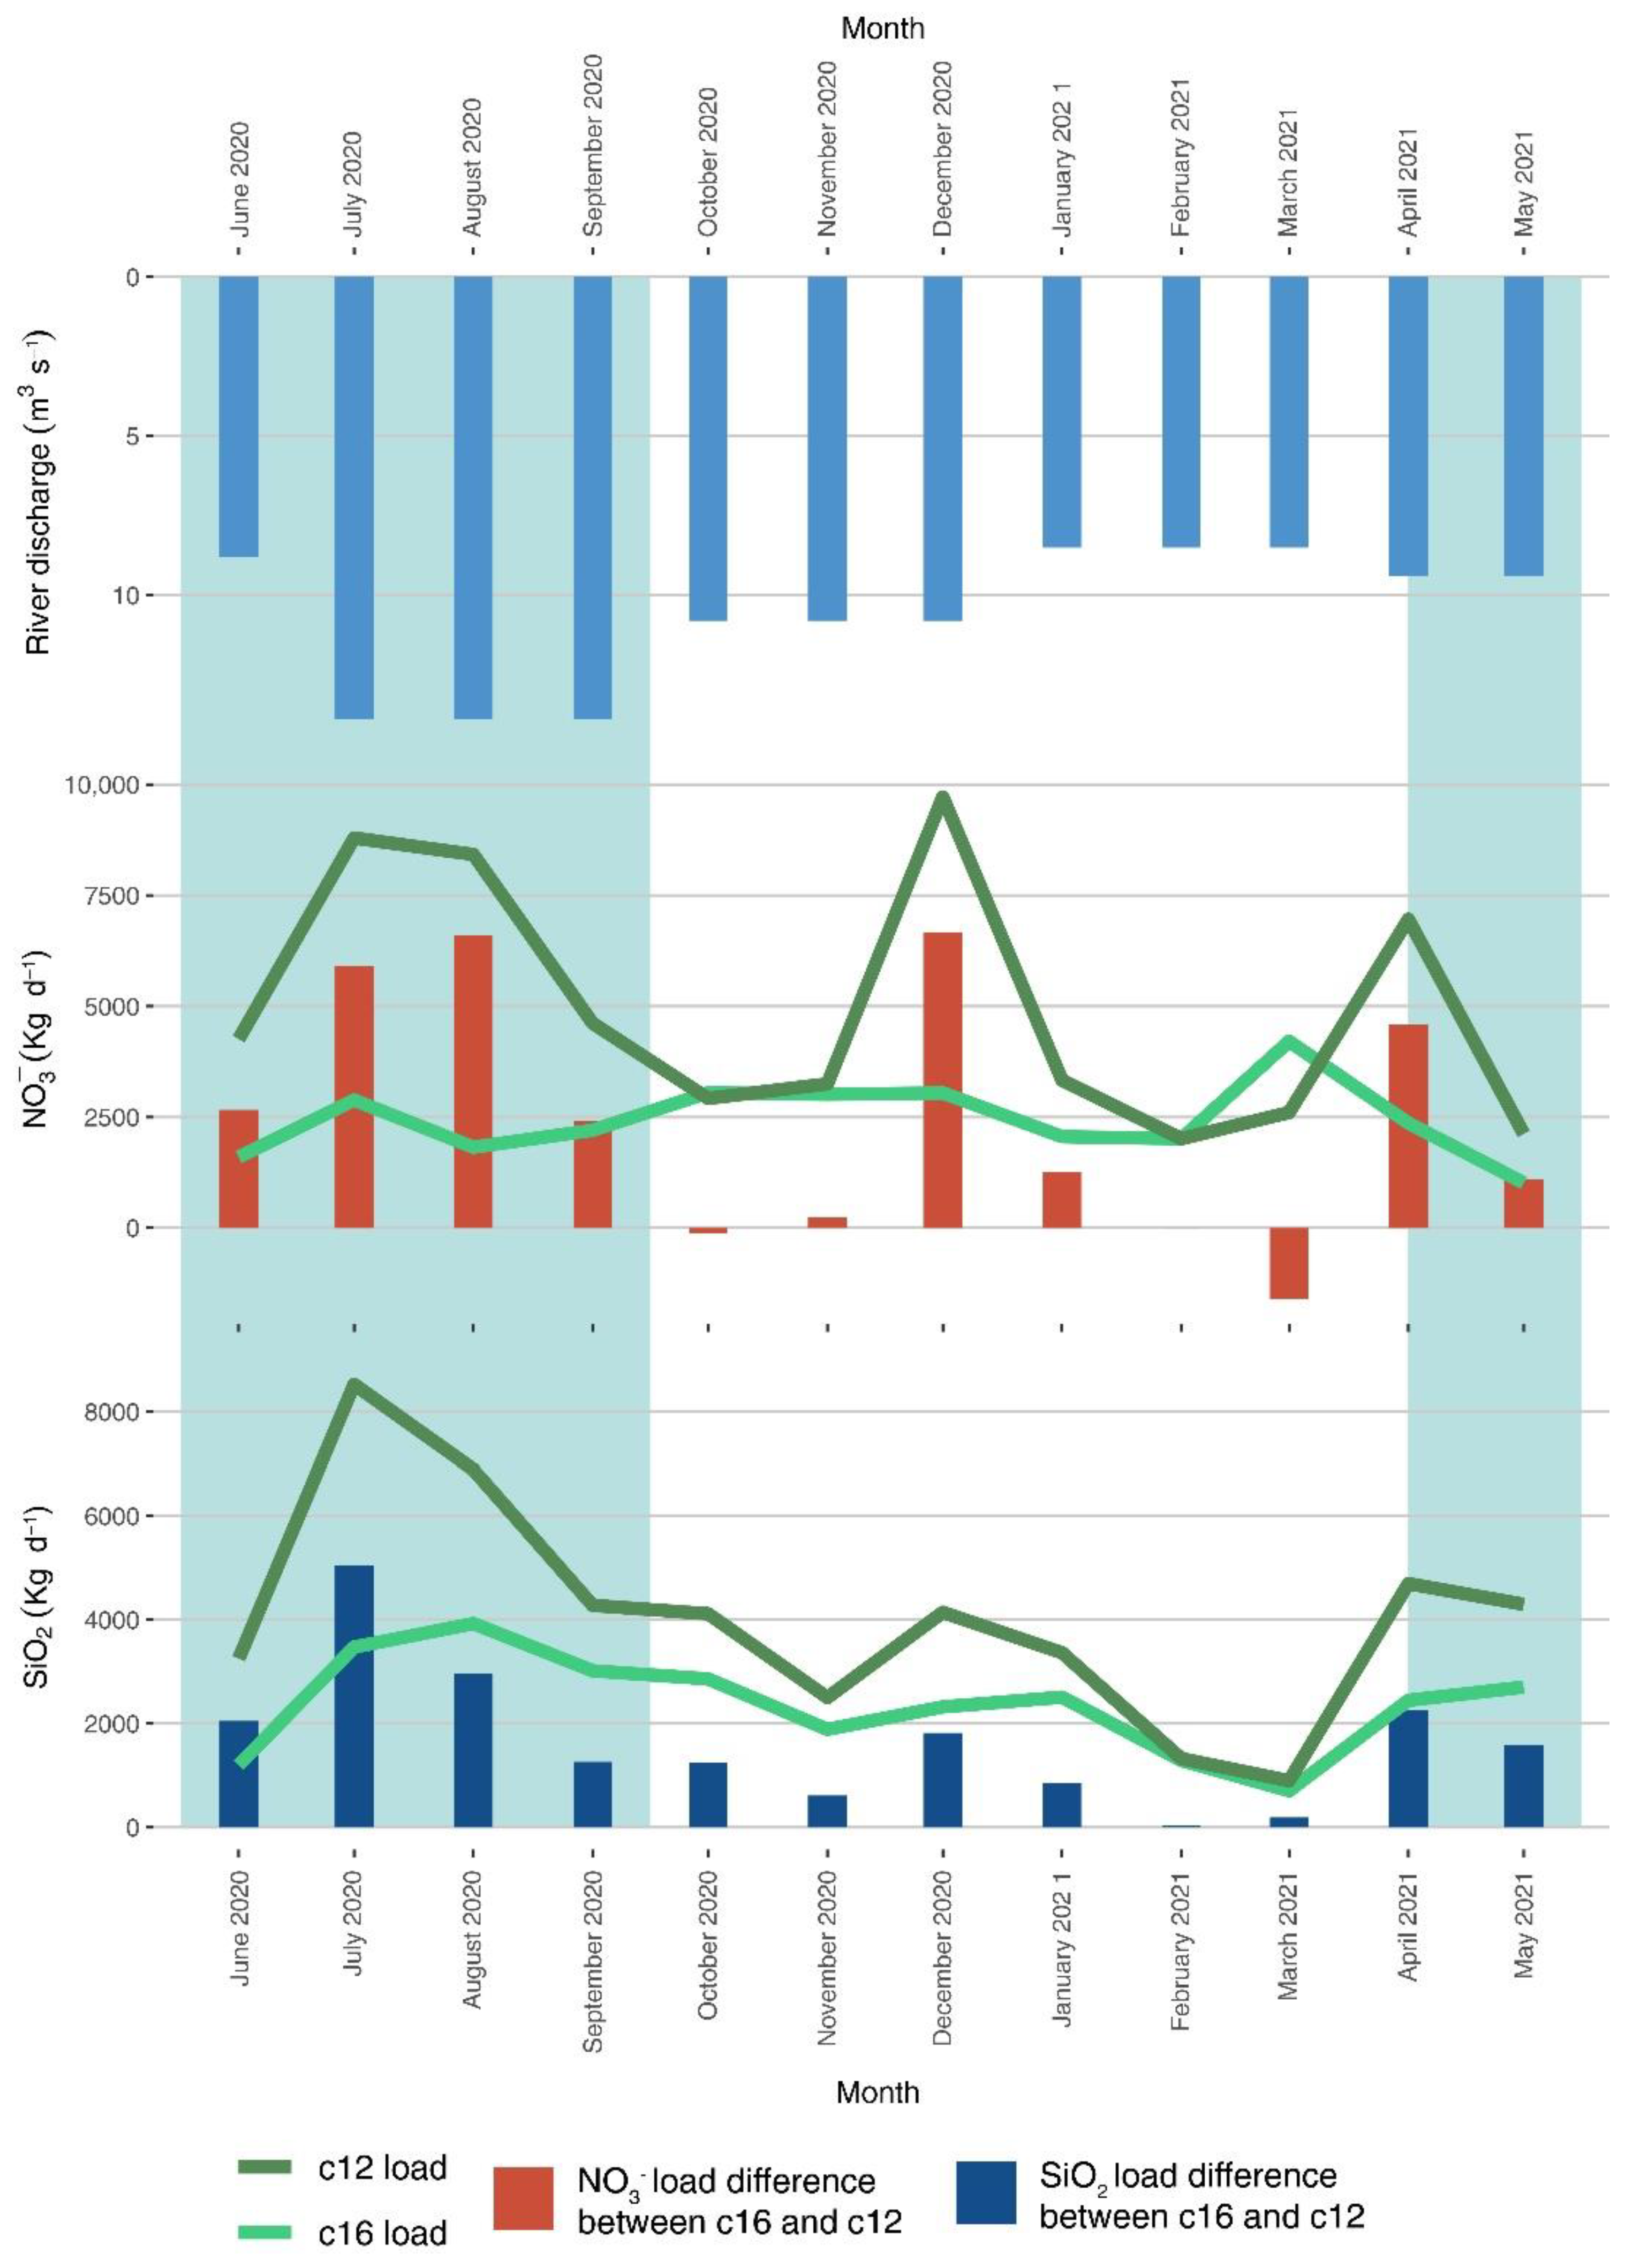
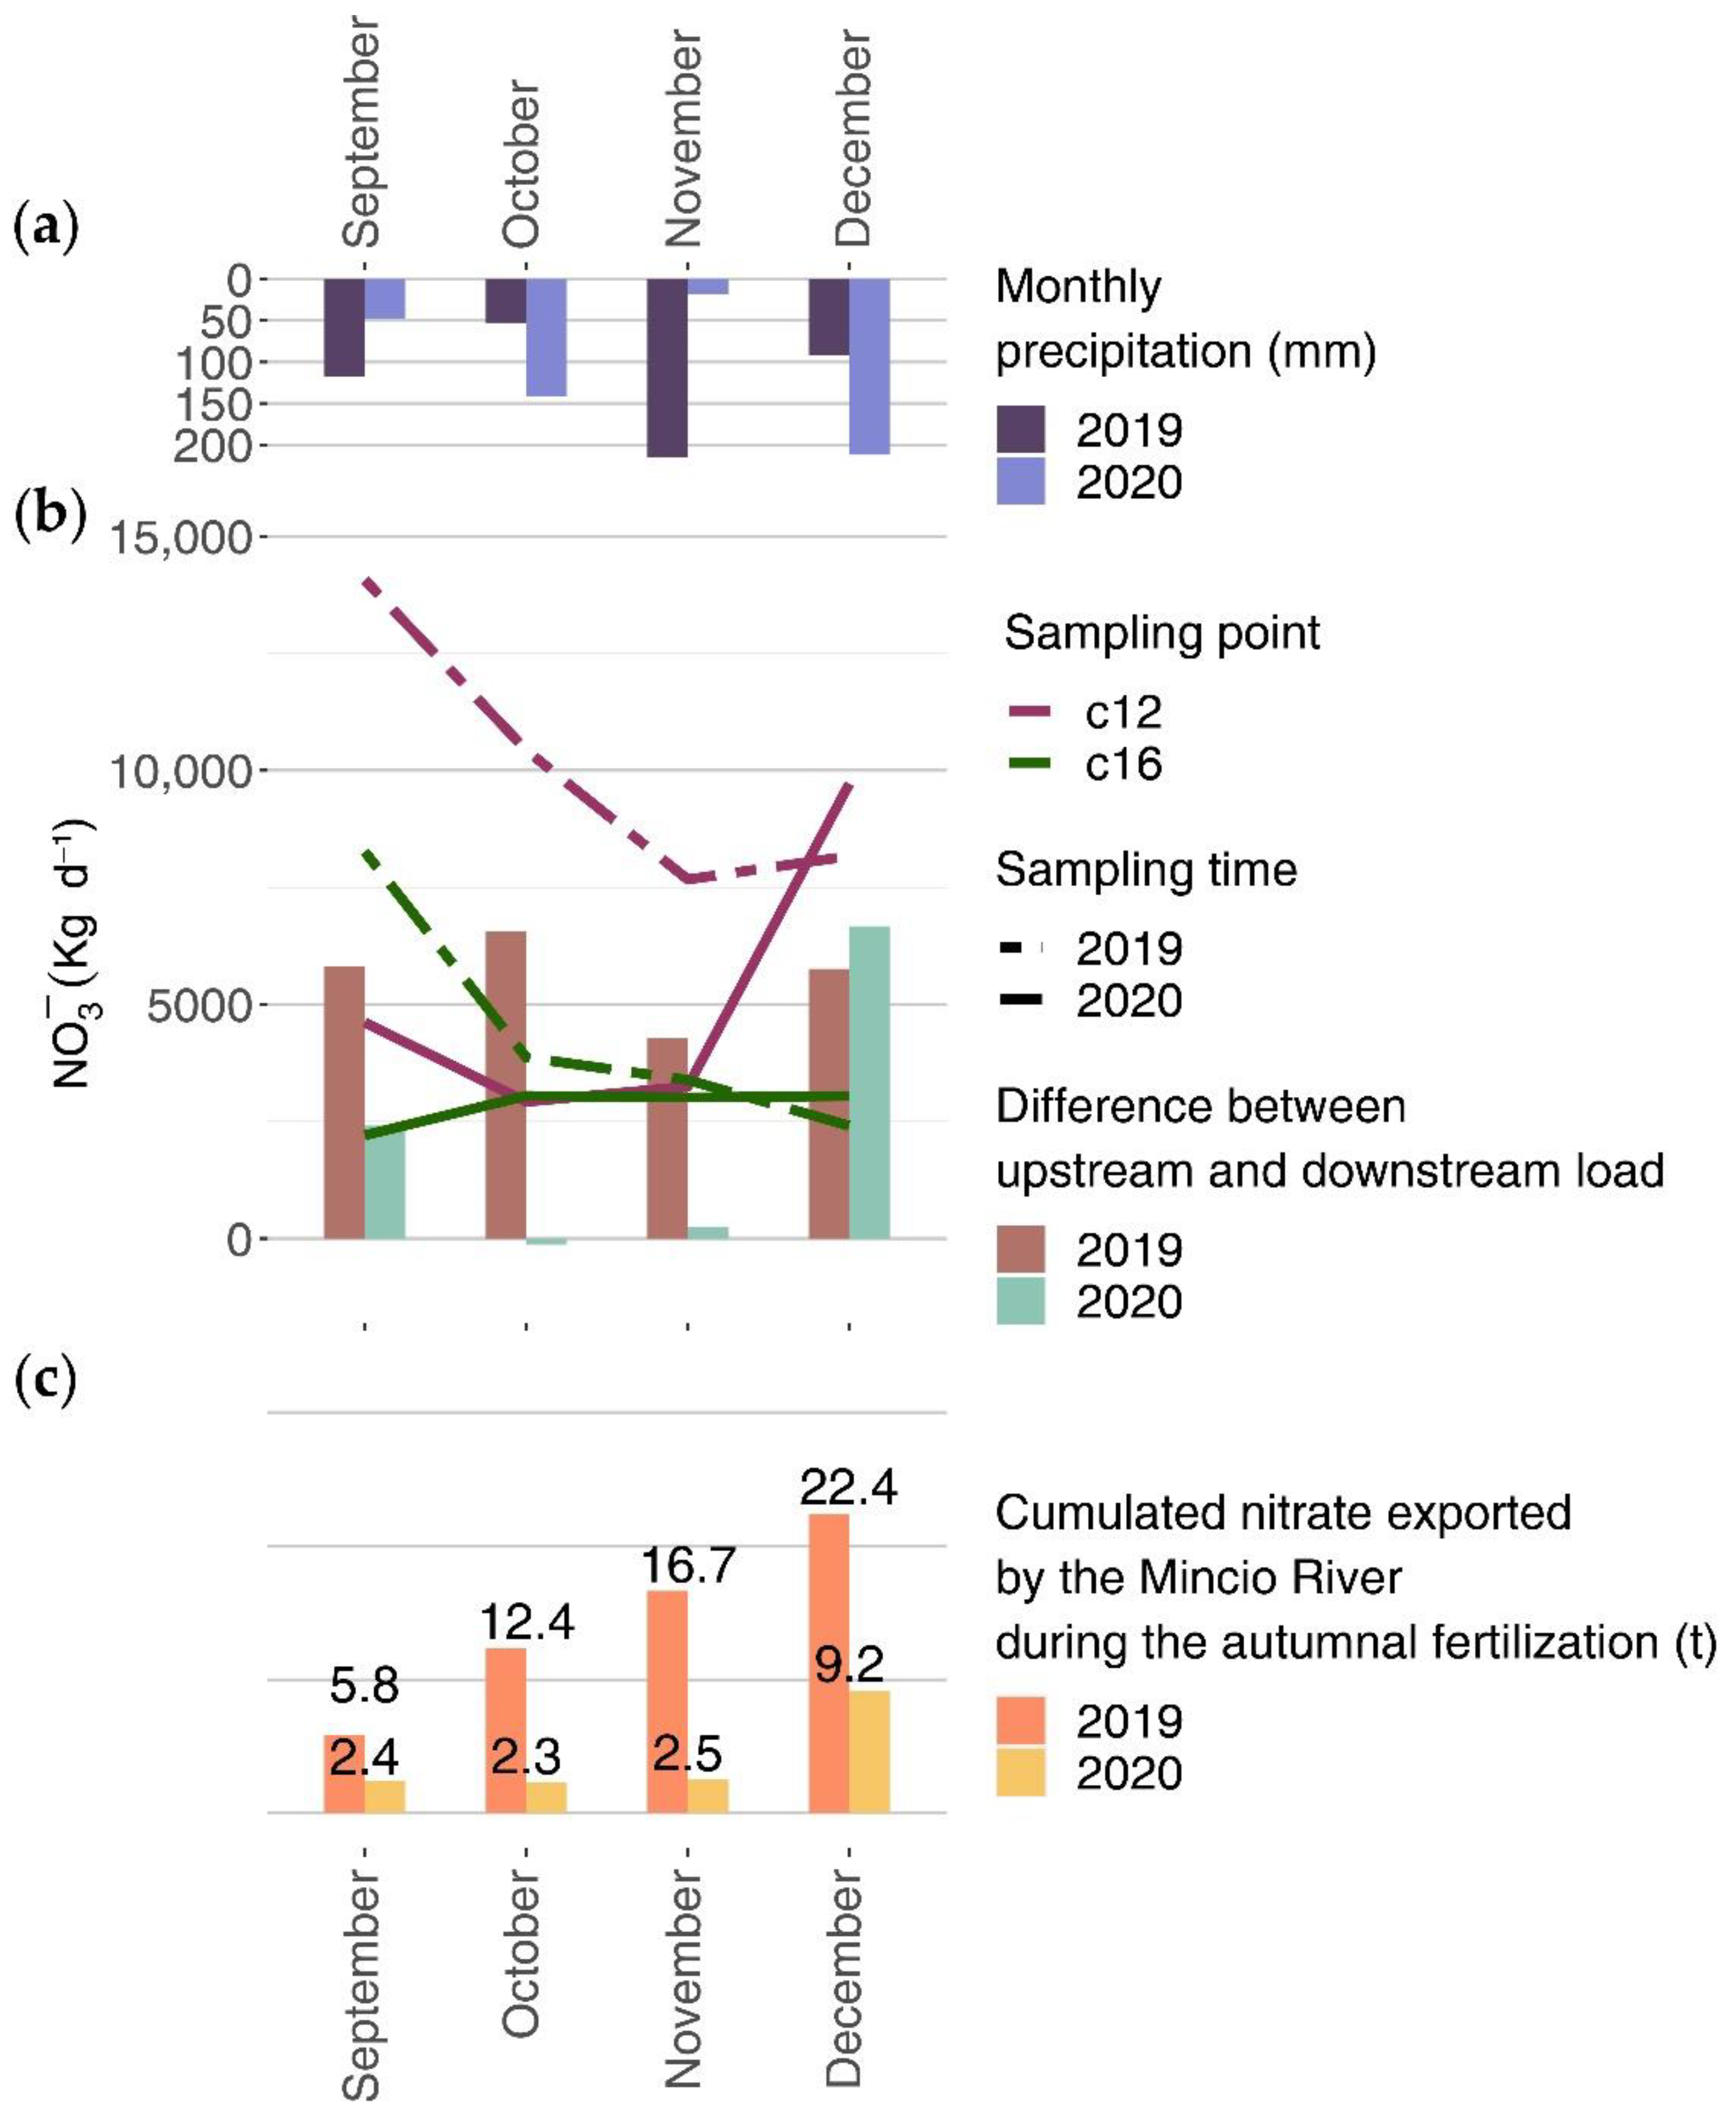
A statistical summary is presented in Table 1, with median values (Median) and standard deviation (Std dev) for each measured parameter for all of the 19 sampling points during the monitored period. Among the parameters measured in the field (Figure S1), the pH did not show specific trends. Interestingly, more basic values were measured in surface waters, up to pH 8.8, whereas groundwater samples had more neutral values. No specific trends were detectable along time but a general rise from February to May. The EC showed a clear difference between groundwater and surface water, with the last having lower values as expected. A heterogeneous but visible rise of the EC values was measured in December and March, whereas no peculiar lowering periods were detected. The temperature was homogeneous between surface- and groundwater samples during autumn and spring. On the contrary, a net difference in temperature was measured during summer and winter samples, with surface waters hotter or colder (up to 4.82 °C) than groundwater, especially in January. In summer, some surface water samples showed high temperatures (up to 25.89 °C), albeit within the expected seasonal variation of groundwater (Figure S2). Among the above-mentioned parameters, some sampling points showed peculiar trends. The sampling point c5, a channel in the centre of the investigated area, showed values usually closer to groundwater than to surface waters, questioning the origin of its waters. The spring f2, located in the southern area, showed intermediate values. EC and pH were similar to those of groundwater, whereas the temperature was close to the surface water’s range. Lastly, p12 showed EC values similar to the surface waters during the irrigation period, whereas the rest of the hydrologic year was similar to groundwater.
Regarding the analysed ions, only a few showed notable trends along time, whereas the others were almost constant or vague (Figure 4).
NO3 showed the most variable concentrations, peaking in three different moments (August 2020, December 2020 and April 2021) with different values (maximum value of 95.034 mg L−1 NO3), higher in groundwater and lower in surface waters. Similarly, sulphate (SO42−) peaked in the same moments, but only in the east bank of the Mincio River and with higher concentrations, while in the west bank, only a peak in March and April 2021 was discernible, with lower concentrations. From a spatial point of view, the distribution of NO3 (areas with higher or lower concentration) was constant during the investigated period (e.g., Figure S3), as happened also in 2019 [20]. The contamination source is in general located upgradient with reference to the investigated area, and the highest concentrations were measured in the wells at its boundaries, both in the eastern area (p13, 88.342 mg NO3 L−1 in December 2020) and western area (p4, 37.179 mg NO3 L−1 in December 2020). This suggests that the contamination is significantly higher outside the investigated area than inside. Two main source directions were identified upstream the wells p4 and p13. The only sensibly high contamination source inside the investigated area is located between the spring f2 and the well p26, which reached 95.034 mg NO3 L−1 in December 2020 and showed lower but high values in the other month. Moreover, some local and temporary contamination sources were found, such as near the well p16 (75.538 mg NO3 L−1 in April 2021) or p23 (47.693 mg NO3 L−1 in June 2020). The complete dataset of NO3 concentrations during the investigated period is reported in Table S1. Silica (SiO2), since it does not undergo biogeochemical processes (in groundwater), showed a different trend, but is still associated with those of NO3 and SO42−. Starting from August, a small increase of concentrations was measured, but they decreased immediately and remained constant till December. Then, its concentration increased from December till March, where the maximum values were detected, after which it started to decrease. During winter and spring, surface- and groundwater showed different trends. In groundwater, SiO2 concentrations decreased from April but surface waters SiO2 concentrations increased. A peculiar temporal trend of SiO2 was distinguished in f2. Here, silica concentration surprisingly fluctuated as in the surface waters, but with much lower concentrations (up to 0.161 mg SiO2 L−1). SiO2 showed a spatial distribution such as NO3 in almost all of the investigated area. Thus, the contamination source is generally located upgradient with reference to the study area, with similar pathways from upstream wells p13 and p4. On the contrary, p26 was characterized by low SiO2 concentrations. As a matter of fact, p26 and f2 are close and they both showed low SiO2 concentrations but high NO3 values.
Point c5 (a secondary natural channel) reported anomalous values for the analytes in Figure 4, as previously described also for EC, temperature, and pH, confirming its similarity with groundwater. Fluoride (F) and chloride (Cl) exhibited unexpected and peculiar trends over time. F showed a concentration decrease in August, December, and April, but higher concentrations in September and March. On the contrary, the concentration of Cl raised in August, decreased in February and finally reached the maximum values in March and April, with a constant concentration from September to January. Although not particularly noteworthy, calcium (Ca2+) and magnesium (Mg2+) did not show trends over time, but their concentrations were higher in groundwater than surface water, as expected.
Finally, in March, April, and May the HCO3 concentrations were calculated from total alkalinity and results were used to evaluate hydrochemical changes through Piper plots (Figure S4). The aim was the evaluation of potential chemical evolution of samples from the recession period till the recharge started in April. Some samples in April showed a consistent negative error in the ionic balance (p13, p16, and p23) probably correlated to titration of other alkalinities. Above all, the possible source of error can be given by ions from organic compounds such as humic and fulvic acids, present in manure and percolating in groundwater with the aquifer recharge. Therefore, these samples were not considered in the Piper plot graphs. The recharge did not provide any chemical alteration of groundwater (and surface waters) and all of the analysed samples can be considered as calcium-bicarbonate waters.

3.3. Mincio River NO3 Loads

An interesting result came from the comparison of NO3 and SiO2 concentrations between c16 and c12 (Figure 5, Table 2). The first represents the Mincio River waters entering the investigated area and the second characterizes the same waters downstream the study area (Figure 1). In general, c16 showed always lower concentrations of the above-mentioned analytes, supporting an enrichment along the river course. An exception is reported for the NO3 concentrations in October and March, when c12 had a lower NO3 concentration than c16. In February, they had the same concentration. On the contrary, SiO2 concentrations were always higher in c12. For both, a clear temporal trend was observed, such as that of NO3 concentrations in groundwater. Although this fact is intuitive for NO3 (the river load has a trend similar to that of groundwater concentration), it is not for SiO2 (the river load has a trend similar to NO3 and not SiO2 in groundwater). This evidence constitutes an essential proof to understand the river-groundwater interaction in the area.
Assuming a constant river flow during the month, during the hydrological year the Mincio River potentially gained a total of 916.06 × 10³ kg of NO3 and 614.18 × 10³ kg of SiO2 between c16 and c12. Thus, a clear increase in the concentration has been observed between c16 and c12.
The comparison between two fertilization periods (autumn 2019 and 2020) resulted in interesting and clear differences between the Mincio River loads before and after the reintroduction of the fertilization limits of the Nitrate Directive (Table 3). This evaluation was performed between a complete season instead of a single month to better handle the variability connected to meteorological conditions and fertilizations timing. Precipitation was similar between 2019 and 2020, with a total of 477.0 and 418.8 mm measured during the autumn (Wilcoxon signed-rank test: Z = 2163.5, p = 0.5109, performed using the R software for statistical computing [29]).
From September 2019, the difference in NO3 load between c16 and c12 was constant till December, with an average value of 5603 ± 953 kg NO3 d−1 (from here, average ± standard deviation). This value is more than double the load measured in the same period in 2020, with 2297 ± 953 kg NO3 d−1. These dissimilarities, taking into account a similar recharge given by precipitation, point out more frequent and abundant manure fertilization in 2019 than 2020.

4. Discussion

4.1. Characterization of the NO3 Contamination: Source and Trend

In the investigated area, the effects of the aquifer recharge modification given by the irrigation practices were already explored, but only for limited zones and periods [20,21]. The monitoring of the hydrological year provided a trend of groundwater heads consistent with the above-mentioned authors. The recharge is homogeneous along time and space, as described by the constant raise of hydraulic heads from April and the widespread network of irrigation channels that provides homogeneous recharge volumes. Nevertheless, the variation of groundwater heads and regression coefficient is not uniform. Evidently, the Mincio River has a major influence on the wells near its course and the effects of aquifer recharge are more detectable only in those wells far from the river. The rapid increase and decrease of hydraulic heads and the limited thickness of the vadose zone suggested a high permeability of the investigated aquifer. Moreover, the hydraulic characterization of the same aquifer [30] reported a transmissivity of 1.0 × 10⁻² m2 s−1 and a storativity of 1.49 × 10⁻². The lack of significant changes in the hydraulic conductivity testifies the absence of increased clay content in the aquifer mineral composition, which could deeply alter the permeability and the hydraulic conductivity. For instance, an increase in clay fraction of 10% can decrease hydraulic conductivity by one order of magnitude [31]. First, a higher clay content in the aquifer matrix could result in a reduced vertical transport (i.e., percolation, as happens in the low Po Plain [16]) of recharge water but favouring runoff and the surficial transport of N from fertilizers. Secondly, a lower hydraulic conductivity can prolong the groundwater residence times, which favour denitrification [32]. Although these pieces of information are scarce at the very local scale, they could be very useful for both the removal of NVZs (where the hydraulic conductivity is lower and denitrification is favoured) and the identification of new NVZs (where the hydraulic conductivity is higher and denitrification is scarce). Surprisingly, according to the data provided by AIPO and by the Mincio Consortium, the groundwater flowing to the Mincio River does not alter its flow between upstream and downstream in the investigated area (see Section 4.2).
The physico-chemical parameters measured in the field differentiated effectively surface- and groundwater samples. The water sampled at point c5 was characterised by similar values of temperature, pH, and EC of groundwater, suggesting that this channel in the west bank of the Mincio River was fed by groundwater for all of the hydrological year. This fact can be an empirical manifestation of the potentiometric map goodness. Moreover, it supports that during both recession and recharge periods there is a diffuse feeding of groundwater to the secondary channels network in the west bank flowing to the Mincio River. In the spring f2 (Figure S5), an anomaly in temperature was found, as it was highly influenced by the air temperature (measured in the near meteorological station, Figure S2). The small dimensions of the spring f2 and the low discharge make it vulnerable to the seasonal variation of air temperature.
NO3 concentration showed high values in groundwater, up to 95.034 mg NO3 L−1 (Table S1). The timing of concentration rises is connected to the fertilization in the investigated area, performed in autumn and spring. Thus, the NO3 concentration increase measured in August and December is likely due to the same fertilization event. In August the slight increase relates to the fertilization and the concurrent irrigation in some portions of the area. The main leaching event occurs in December, when the abundant precipitation promotes leaching of the manure spread (Table S1). The fast increase and decrease of NO3 concentration can be due to nitrification and denitrification processes in the aquifer. The above-mentioned processes cannot be proven since neither isotopic analysis nor dissolved gases analysis (excess nitrogen or nitrous oxide proving denitrification) were performed in the area. Nonetheless, they were partially explored in [20], where the chemical variation of recharge water percolating through the vadose and saturation zone was analysed. Summing up, the temporary high NO3 concentrations could be associated with the vertical zoning of physico-chemical features within the shallower saturated zone. The upper groundwater layer is mostly composed of recently percolated water with high N concentrations (during the fertilization periods), and characterized by oxic conditions, resulting in high NO3 concentrations for a limited time. The NO3 contamination in groundwater is also transferred to surface waters. The spring f2 and the channel c5 reached 47.498 and 32.797 mg NO3 L−1, respectively. These values constitute a risk for the good ecological status requested by the WFD. A focus on the Mincio River concentrations will be introduced below in Section 4.2.
In the investigated area, NO3 and SiO2 are deeply correlated, since both originate from manure and SiO2 has been proposed as a tracer of fertilization [20]. Starting from December, the leaching of manure-rich waters resulted in a constant increase of SiO2 concentrations, testifying the abundant fertilization performed during the autumn. The concentration increase seems postponed by a few months after fertilization, as happened also in 2019 [20]. Probably this is the reason why in April we see the effects of dilution given by recharge and the concentrations decrease instead of a raise due to spring fertilization. An increase would be expected after April, but the conspicuous and continuous recharge keeps the SiO2 concentrations low by dilution, a phenomenon already reported for other analytes in a nearby area of the Po Plain [33].
The surface waters have lower SiO2 concentrations than groundwater from January to April. An exception is given by the spring f2, characterised by low SiO2 values. From January, groundwater samples show increasing concentrations, whereas in surface waters they decrease (except in c5) although diffusively fed by groundwater (Figure 3 and Figure 4c). When in winter the groundwater level is still relatively high, the groundwater feeding surface waters allows to have similar SiO2 values in both compartments. After January, the interaction between surface- and groundwater is less intense due to lower groundwater level. As a result SiO2 from groundwater is diluted in surface waters, although during this period is more concentrated. From April, the water recharge provided by irrigation produces a rise of the groundwater level and the interaction between surface- and groundwater becomes stronger again, resulting in a synchronous increase of SiO2 values. This mechanism regulates also the element loads in the Mincio River (Section 4.2).
Unexpectedly, a clear dissimilarity between SiO2 and NO3 is reported for the southern contamination plume near the well p26 and the spring f2. The hypothesis of the NO3 origin from synthetic fertilizers with low SiO2 seems unlikely, due to the low SO42−/NO3 ratio (discussed below). A plausible explanation could be related to the presence of higher Aluminium (Al) concentrations, not related to deep and enriched flowpaths but to anthropic sources, such as Municipal Solid Waste (MSW) [34], which waste disposal plants are located a few km north outside the investigated area. Aluminium salts hydrolyse into aluminium hydroxide and coprecipitate the silica, decreasing its concentration. In addition, during some samplings the values of SiO2 in f2 were drastically lower than in p26, further suggesting illegal dumping in f2 (during autumn and winter). Nevertheless, these are just hypotheses, for which additional investigations are required to explain the low SiO2 concentrations between the spring f2 and the well p26.
SO42− peaked with the same timing and had a similar spatial distribution of NO3, suggesting that fertilization is the SO42− main source in the study area. Moreover, mineralogical data in a nearby area suggests the absence of sulfate-based minerals in the aquifer [21]. The common source of NO3 and SO42− is supported by their significant correlation (R2) [35] (Figure 6). To identify this source of contamination, a plot of the SO42−/NO3 ratio was performed during the three main fertilization samples (Figure 6). According to Federico [36], a SO42−/NO3 ratio >4 or at least >1 [37] is related to synthetic fertilizers (e.g., N-rich calcium sulphates). On the contrary, NO3 is much more concentrated in sewage, manure, and septic tanks, reaching an SO42−/NO3 ratio of 0.14 [38,39,40]. All samples have an SO42−/NO3 ratio between 0.4 and 1, suggesting the predominant use of organic fertilizer (i.e., manure). The only exception was in April in p9 (SO42−/NO3 = 4.09), probably due to the massive use of chemical fertilizers in the area between the wells p9 and p4. Interviews with local farmers suggest that fertilization may occur every crop change, therefore multiple times per year in areas where horticulture is performed, such as around the well p13 [21]. This could lead to an enrichment in SO42− and NO3 in the soil and in the vadose zone, which can massively percolate during the recharge phase (irrigation and precipitation).

4.2. Transferring of NO3 Contamination from Groundwater to the Mincio River

The Mincio River loads showed important changes across the study area. As seen using SiO2, temperature, and the potentiometric maps in Figure 2, the groundwater diffusively feeds the secondary channels and the Mincio River along its west bank. This fact is also testified by the different SiO2 loads between c16 (lower) and c12 (higher). Since the SiO2 values are higher in groundwater than surface water and the Mincio River is constantly fed by groundwater, its concentrations rise between the extremes of the study area (c16 and c12). The difference between the loads in these two points reaches the minimum values in February and March when the groundwater level is lowest. As explained for the channel in c5, on this occasion the groundwater volumes constitute a low proportion of the Mincio River flow, resulting in a conspicuous dilution of SiO2. The remaining hydrological year showed loads at c12 always higher than those at c16, testifying the continuous feeding of the Mincio River by groundwater. The SiO2 load peaks are a function of two factors: the high concentrations in groundwater and the higher or lower contribution of groundwater to the Mincio flow. In summer, a combination of high groundwater input but with low SiO2 concentrations results in a high load. In winter, groundwater has a high SiO2 concentration, but the low groundwater level produces a reduced input to the Mincio River. However, the combination is still relevant and the highest load in c12 was measured. The spring load is an intermediate scenario, with rising groundwater levels but decreasing SiO2 concentrations. The load at c12 results are therefore moderate. Although the feeding mechanism was demonstrated using SiO2, discharge data report no variation in the Mincio River flow among time between c16 and c12. Although no wells are available to reconstruct the potentiometric map in the S-E part of the study area, the chemical data and the absence of an increase in the discharge indicate that the southern part of the study area is a flow-through system [41] with a gaining west bank and a losing east bank. The feeding groundwater doesn’t result in an incremented discharge of the river, but in an exchange between groundwater flowing from the west bank and river water flowing out through the east bank. This exchange is higher when the groundwater level is higher. In addition, NO3 is transported from groundwater to surface water through the same mechanism. Nevertheless, the biogeochemical processes and its higher variation in groundwater make its loads different. First, NO3 concentrations peak in groundwater in three moments under high recharge and fertilization rates. The higher NO3 concentrations in groundwater correspond to the maximum loads measured at c12, testifying also the rapid circulation between groundwater and river through surface-groundwater interaction. During October and March, the NO3 loads are higher at c16 than at c12. This unexpected result is probably due to the N uptake by macrophytes and denitrification happening in the 8.9 km of river course between c16 and c12. In fact, in this stretch of the Mincio River high denitrification and uptake rates, up to 2500 mmol N m−2 y−1, were reported [42].
Multiplying the monthly loads for all of the year, an overall amount of at least 911.47 × 10³ kg NO3 y−1 are gained by the Mincio River in the investigated section. This value is surely underestimated, since it does not consider the NO3 migrating from groundwater to the Mincio River, but lost due to water abstraction in the two channels in the eastern bank (Figure 1). This constitutes a serious threat to the environmental quality of the downstream water bodies in the sense of [40], such as Mantua Lakes, the Po River [17,43], and the Po River Delta [44,45]. Among them, the Mantua Lakes, three hypereutrophic shallow fluvial lakes fed by the Mincio River and located ~12 km S-E the study area, are the more threatened [46,47,48] by the NO3 loads generated in the watershed and transported by the river.

4.3. The Effects of the Nitrate Directive Fertilization Limits Reintroduction in the Italian NVZ

2019 was the last year with a derogation granted to the Lombardy region regarding the use of N fertilizers inside the NVZs, which limit was raised from 170 kg N ha−1 y−1 to 250 kg N ha−1 y−1. Since 2020, the limits are back to the value proposed in the Nitrate Directive [10]. Given the fast (<1 month) circulation of N among the soil, groundwater, and the Mincio River, a comparison between 2019 and 2020 can provide the first evidence of the short-term effects of the NVZ N fertilization limit. This case represents an example of how N limitation can affect an already contaminated alluvial aquifer over a short period. The comparison proposed below takes into account only one fertilization during the autumn of 2019 and 2020. This comparison is supported by the similar condition of the study area between the two periods, such as same land use [21], fertilizer typology (manure) [20] and precipitation (as described previously). No data are available on the monthly use of fertilizer in the area, but since the above-mentioned conditions didn’t change between 2019 and 2020, we suppose that the percentage of manure used in autumn with respect to the total annual amount remained the same.
Figure 7b shows that a constantly higher NO3 load was measured in c12 and the difference with c16 was similar to that measured in December 2020. Given the similar condition aforementioned, this difference can be attributed to the limit of 250 kg N ha−1 y−1 used for fertilization in 2019. Groundwater had on average a higher NO3 concentration in 2019 (25.773 ± 20.641 mg NO3 L−1) than in 2020 (19.811 ± 18.557 mg NO3 L−1). Also in 2019, some samples had NO3 concentrations higher than 50 mg L−1 [20] (Table S2). This small difference in groundwater concentrations leads to an enormous difference in the daily load of NO3 to the Mincio River. In 2020, the c12 NO3 load was closer to that from c16, underlying a significantly lower NO3 input to the river. This trend is constant along the autumn, with some moments in which a lower NO3 load in c12 than c16 was measured, due to denitrification and macrophytes uptake (Section 4.2). These biogeochemical factors probably influence also the NO3 loads in 2019, but the difference between c12 and c16 is so massive that their values have a negligible effect. Only during the massive recharge in December (which promotes the percolation of all of the NO3 stored in the soil and vadose zone), the difference between the load in c16 and c12 in 2020 is similar to that in 2019. Therefore, the total NO3 gained by the Mincio River during the autumn in these two periods is significantly different (Figure 7c). The higher and constant difference between the loads in c16 and c12 in 2019 resulted in a total of 22.4 × 10³ kg NO3 gained by the Mincio River. After the reintroduction of the limit of 170 kg N ha−1 y−1 for fertilization in the NVZ, in the same period, the river gained only 9.2 × 10³ kg NO3, i.e., a reduction of 59% in the NO3 gained.
These findings point out two important issues regarding the transfer of NO3 to surficial water bodies. First, the reintroduction of the fertilization limit of 170 kg N ha−1 y−1 in the NVZs produces a significant effect also after one hydrological year. This is particularly true in areas such as the one presented and others similar (e.g., [49]), where the transfer of N from the soil to groundwater and finally to surface waters is fast. Therefore, stakeholders, authorities, and administrations aiming at reducing the effects of abundant N fertilization can consider that limiting fertilizer use in NVZs with fast hydrological cycles can be an effective solution to reduce nitrate pollution also over short periods (e.g., years, not decades). Secondly, when the N contamination needs to be investigated to protect surface water bodies from eutrophication and nutrients surpluses, the loads exported should be considered as a better indicator of potential nutrients sources. As reported for this study area, a difference of a few mg N L−1 in groundwater can determine a difference of metric tons (t) of N exported by the river, since this value is the expression of both N concentration and river discharge. These t of N are then transported to other water bodies, where their buffer, absorption, and uptake capacities could not be able to reduce N loads. This is the case of the previously mentioned Mantua Lakes, but also other water bodies which could receive high N input from feeding groundwater and contribute to eutrophication in Italy [7,50,51] and other areas worldwide [52,53,54,55].

5. Conclusions

This study pointed out how the reintroduction of the fertilization limit of 170 kg N ha−1 y−1 resulted in an improvement of the chemical quality of both groundwater and surface water, consistent with the objectives of the Nitrate and Water Framework Directives. The investigated alluvial aquifer is still contaminated right after the manure application and the abundant recharge events, but the average NO3 concentration decreased by 23% from 2019 to 2020. According to flow and chemical data, the cross-river sector of the Mincio River analysed in this study is a flow-through system, gaining groundwater from its west bank and losing stream water through its east bank. As a result, loads of manure tracer (SiO2) are always higher downstream of this interaction area. Also, the NO3 loads are higher downstream of the interaction area, but their values depend also on other biogeochemical processes either amplifying or reducing the effects of fertilization. In a comparison between the autumn fertilization of 2019 and 2020, a 59% reduction of the NO3 gained daily via the river-groundwater interaction in the Mincio River was observed. This is an interesting output of this study, supporting a fast and significant response of the coupled riverine-groundwater system to reduced fertilization rates. Moreover, this result constitutes a potential red flag for the authorities and stakeholders interested in the surface- and groundwater quality of the Po Plain. Although the Mincio River is one of the most important left tributaries of the Po River, this area is still poorly investigated from the hydrogeological perspective, notwithstanding its role in the alteration of the N loads in the Mincio River. Although the hydrogeological conceptual model proposed well explains the transport of N from manure to groundwater and the Mincio River, some aspects are still unknown. In fact, in this area, no isotopic investigations have been previously performed, and the biogeochemical processes occurring in groundwater are only partially explained. The origin of the N pollution, although some inferences can be carried out with the SO42−/NO3 ratio, is still not investigated in detail. Moreover, the strength of the biogeochemical processes modifying the groundwater NO3 concentrations in the study area are poorly known. These concerns will be the focus of the next investigations in the study area.

Supplementary Materials

The following supporting information can be downloaded at: https://www.mdpi.com/article/10.3390/hydrology9030044/s1, Table S1: NO3 concentrations (mg L−1) during the investigated period, from June 2020 to May 2021. Table S2: NO3 concentrations (mg L−1) during autumn 2019. Figure S1: ephemeral physico-chemical parameters. Figure S2: air temperature. Figure S3: NO3 and SiO2 concentrations in the study area during December 2020. Figure S4: Piper plot. Figure S5: the spring f2.

Author Contributions

Conceptualization, M.B., E.S. and F.C.; formal analysis, E.S.; funding acquisition: F.C.; investigation, E.S.; supervision, M.B. and F.C.; validation, E.S.; visualization, E.S.; writing—original draft preparation, E.S.; writing—review and editing, E.S., M.B., M.P. and F.C. All authors have read and agreed to the published version of the manuscript.

Funding

This work has benefited from the equipment and framework of the COMP-HUB Initiative, funded by the ‘Departments of Excellence’ program of the Italian Ministry for Education, University and Research (MIUR, 2018–2022).

Data Availability Statement

The datasets generated and analysed during the current study is available at doi:10.5281/zenodo.5871108.

Acknowledgments

The authors would like to thank Rossano Bolpagni and Claudio Ferrari for their help during samplings. We would also like to thank all of the private owners within the study area for allowing us to sample their wells.

Conflicts of Interest

The authors declare no conflict of interest.

References

  1. Steinfeld, H.; Gerber, P.; Wassenaar, T.; Castel, V.; Rosales, M.; Rosales, M.; de Haan, C. Livestock’s Long Shadow: Environmental Issues and Options; Food & Agriculture Organization: Rome, Italy, 2006. [Google Scholar]
  2. Steinfeld, H.; Mooney, H.A.; Schneider, F.; Neville, L.E. Livestock in a Changing Landscape, Volume 1: Drivers, Consequences, and Responses; Island Press: Washington, DC, USA, 2013. [Google Scholar]
  3. Schröder, J. Revisiting the agronomic benefits of manure: A correct assessment and exploitation of its fertilizer value spares the environment. Bioresour. Technol. 2005, 96, 253–261. [Google Scholar] [CrossRef] [PubMed]
  4. Sims, J.; Bergström, L.; Bowman, B.; Oenema, O. Management. Nutrient management for intensive animal agriculture: Policies and practices for sustainability. Soil Use Manag. 2005, 21, 141–151. [Google Scholar] [CrossRef]
  5. Bartoli, M.; Racchetti, E.; Delconte, C.A.; Sacchi, E.; Soana, E.; Laini, A.; Longhi, D.; Viaroli, P. Nitrogen balance and fate in a heavily impacted watershed (Oglio River, Northern Italy): In quest of the missing sources and sinks. Biogeosciences 2012, 9, 361–373. [Google Scholar] [CrossRef] [Green Version]
  6. Cinnirella, S.; Buttafuoco, G.; Pirrone, N. Stochastic analysis to assess the spatial distribution of groundwater nitrate concentrations in the Po catchment (Italy). Environ. Pollut. 2005, 133, 569–580. [Google Scholar] [CrossRef] [PubMed]
  7. Sacchi, E.; Acutis, M.; Bartoli, M.; Brenna, S.; Delconte, C.A.; Laini, A.; Pennisi, M. Origin and fate of nitrates in groundwater from the central Po plain: Insights from isotopic investigations. Appl. Geochem. 2013, 34, 164–180. [Google Scholar] [CrossRef]
  8. Perego, A.; Basile, A.; Bonfante, A.; De Mascellis, R.; Terribile, F.; Brenna, S.; Acutis, M. Nitrate leaching under maize cropping systems in Po Valley (Italy). Agric. Ecosyst. Environ. 2012, 147, 57–65. [Google Scholar] [CrossRef]
  9. Italian National Institute of Statistics. 6th General Census of Agriculture. Available online: http://dati-censimentoagricoltura.istat.it/Index.aspx (accessed on 15 July 2020).
  10. European Union. Council Directive 91/676/EEC of 12 December 1991 concerning the protection of waters against pollution caused by nitrates from agricultural sources. Off. J. Eur. Communities 1991, 375, 1–8. [Google Scholar]
  11. European Union. Commission Implementing Decision of 3 November 2011 on granting a derogation requested by Italy with regard to the Regions of Emilia Romagna, Lombardia, Piemonte and Veneto pursuant to Council Directive 91/676/EEC concerning the protection of waters against pollution caused by nitrates from agricultural sources (notified under document C(2011) 7770). Off. J. Eur. Communities 2011, 287, 36–41. [Google Scholar]
  12. European Union. Commission Implementing Decision (EU) 2016/1040 of 24 June 2016 on granting a derogation requested by Italian Republic with regard to the Regions of Lombardia and Piemonte pursuant to Council Directive 91/676/EEC concerning the protection of waters against pollution caused by nitrates from agricultural sources (notified under document C(2016) 3820). Off. J. Eur. Communities 2016, 169, 6–13. [Google Scholar]
  13. Lasagna, M.; De Luca, D.A.; Franchino, E. Nitrate contamination of groundwater in the western Po Plain (Italy): The effects of groundwater and surface water interactions. Environ. Earth Sci. 2016, 75, 240. [Google Scholar] [CrossRef]
  14. Zanini, A.; Petrella, E.; Sanangelantoni, A.M.; Angelo, L.; Ventosi, B.; Viani, L.; Rizzo, P.; Remelli, S.; Bartoli, M.; Bolpagni, R.; et al. Groundwater characterization from an ecological and human perspective: An interdisciplinary approach in the Functional Urban Area of Parma, Italy. Rend. Lincei. Sci. Fis. E Nat. 2018, 30, 93–108. [Google Scholar] [CrossRef]
  15. Soana, E.; Racchetti, E.; Laini, A.; Bartoli, M.; Viaroli, P. Soil Budget, Net Export, and Potential Sinks of Nitrogen in the Lower Oglio River Watershed (Northern Italy). Clean-Soil Air Water 2011, 39, 956–965. [Google Scholar] [CrossRef]
  16. Martinelli, G.; Dadomo, A.; De Luca, D.A.; Mazzola, M.; Lasagna, M.; Pennisi, M.; Pilla, G.; Sacchi, E.; Saccon, P. Nitrate sources, accumulation and reduction in groundwater from Northern Italy: Insights provided by a nitrate and boron isotopic database. Appl. Geochem. 2018, 91, 23–35. [Google Scholar] [CrossRef]
  17. Viaroli, P.; Soana, E.; Pecora, S.; Laini, A.; Naldi, M.; Fano, E.A.; Nizzoli, D. Space and time variations of watershed N and P budgets and their relationships with reactive N and P loadings in a heavily impacted river basin (Po river, Northern Italy). Sci. Total Environ. 2018, 639, 1574–1587. [Google Scholar] [CrossRef]
  18. Pinardi, M.; Soana, E.; Laini, A.; Bresciani, M.; Bartoli, M. Soil system budgets of N, Si and P in an agricultural irrigated watershed: Surplus, differential export and underlying mechanisms. Biogeochemistry 2018, 140, 175–197. [Google Scholar] [CrossRef]
  19. Monti, C.; Cipriano, G.; Paleari, M.; Tremolada, L. Stato Delle Acque Sotterranee in Regione Lombardia: Corpi Idrici Sotterranei. Rapporto Sessennale 2014–2019; ARPA Lombardia: Milan, Italy, 2021. [Google Scholar]
  20. Severini, E.; Bartoli, M.; Pinardi, M.; Celico, F. Reactive Silica Traces Manure Spreading in Alluvial Aquifers Affected by Nitrate Contamination: A Case Study in a High Plain of Northern Italy. Water 2020, 12, 2511. [Google Scholar] [CrossRef]
  21. Severini, E.; Bartoli, M.; Celico, F. Can’t tell a book by its cover: Disjointed groundwater contamination and land use in an alluvial aquifer of northern Italy. Ital. J. Eng. Geol. Environ. 2021, 1, 229–238. [Google Scholar] [CrossRef]
  22. Amorosi, A.; Pavesi, M.; Ricci Lucchi, M.; Sarti, G.; Piccin, A. Climatic signature of cyclic fluvial architecture from the Quaternary of the central Po Plain, Italy. Sediment. Geol. 2008, 209, 58–68. [Google Scholar] [CrossRef]
  23. Monitoraggio Idrografico AIPo. Available online: https://www.agenziapo.it/content/monitoraggio-idrografico-0 (accessed on 8 November 2021).
  24. Pearson, F. Fixed Endpoint Alkalinity Determination. J. (Water Pollut. Control Fed.) 1981, 53, 1243–1252. [Google Scholar]
  25. American Public Health, A.; Eaton, A.D.; American Water Works, A.; Water Environment, F. Standard Methods for the Examination of Water and Wastewater; APHA-AWWA-WEF: Washington, DC, USA, 2005. [Google Scholar]
  26. Golterman, H.L.; Clymo, R.S.; Ohnstadt, M.A.M. Methods for Physical and Chemical Analysis of Freshwaters-1BP Handbook No 8, 2nd ed.; John Wiley & Sons, Ltd.: Hoboken, NJ, USA, 1980; Volume 65, p. 169. [Google Scholar]
  27. Okamoto, G.; Okura, T.; Goto, K. Properties of silica in water. Geochim. Cosmochim. Acta 1957, 12, 123–132. [Google Scholar] [CrossRef]
  28. ARPA Lombardy. Archivio Dati Idro-Nivo-Meteorologici Di ARPA Lombardia. Available online: https://www.arpalombardia.it/Pages/Meteorologia/Richiesta-dati-misurati.aspx (accessed on 22 August 2021).
  29. R Core Team. R: A Language and Environment for Statistical Computing; R Foundation for Statistical Computing: Vienna, Austria, 2020. [Google Scholar]
  30. Chelli, A.; Zanini, A.; Petrella, E.; Feo, A.; Celico, F. A multidisciplinary procedure to evaluate and optimize the efficacy of hydraulic barriers in contaminated sites: A case study in Northern Italy. Environ. Earth Sci. 2018, 77, 246. [Google Scholar] [CrossRef]
  31. Goldenberg, L.C.; Magaritz, M.; Amiel, A.J.; Mandel, S. Changes in hydraulic conductivity of laboratory sand-clay mixtures caused by a seawater-freshwater interface. J. Hydrol. 1984, 70, 329–336. [Google Scholar] [CrossRef]
  32. Kolbjørn Jensen, J.; Engesgaard, P.; Johnsen, A.R.; Marti, V.; Nilsson, B. Hydrological mediated denitrification in groundwater below a seasonal flooded restored riparian zone. Water Resour. Res. 2017, 53, 2074–2094. [Google Scholar] [CrossRef]
  33. Rotiroti, M.; Bonomi, T.; Sacchi, E.; McArthur, J.M.; Stefania, G.A.; Zanotti, C.; Taviani, S.; Patelli, M.; Nava, V.; Soler, V.; et al. The effects of irrigation on groundwater quality and quantity in a human-modified hydro-system: The Oglio River basin, Po Plain, northern Italy. Sci. Total Environ. 2019, 672, 342–356. [Google Scholar] [CrossRef]
  34. Rapti-Caputo, D.; Vaccaro, C. Geochemical evidences of landfill leachate in groundwater. Eng. Geol. 2006, 85, 111–121. [Google Scholar] [CrossRef]
  35. Cuoco, E.; Darrah, T.H.; Buono, G.; Verrengia, G.; De Francesco, S.; Eymold, W.K.; Tedesco, D. Inorganic contaminants from diffuse pollution in shallow groundwater of the Campanian Plain (Southern Italy). Implications for geochemical survey. Environ. Monit. Assess. 2015, 187, 46. [Google Scholar] [CrossRef]
  36. Federico, C.; Aiuppa, A.; Favara, R.; Gurrieri, S.; Valenza, M. Geochemical monitoring of groundwaters (1998–2001) at Vesuvius volcano (Italy). J. Volcanol. Geotherm. Res. 2004, 133, 81–104. [Google Scholar] [CrossRef]
  37. Busico, G.; Kazakis, N.; Colombani, N.; Mastrocicco, M.; Voudouris, K.; Tedesco, D. A modified SINTACS method for groundwater vulnerability and pollution risk assessment in highly anthropized regions based on NO3 and SO42− concentrations. Sci. Total Environ. 2017, 609, 1512–1523. [Google Scholar] [CrossRef]
  38. Steinich, B.; Escolero, O.; Marín, L.E. Salt-water intrusion and nitrate contamination in the Valley of Hermosillo and El Sahuaral coastal aquifers, Sonora, Mexico. Hydrogeol. J. 1998, 6, 518–526. [Google Scholar] [CrossRef]
  39. Pawar, N.J.; Shaikh, I.J. Nitrate pollution of ground waters from shallow basaltic aquifers, Deccan Trap Hydrologic Province, India. Environ. Geol. 1995, 25, 197–204. [Google Scholar] [CrossRef]
  40. Panno, S.V.; Hackley, K.C.; Hwang, H.H.; Kelly, W.R. Determination of the sources of nitrate contamination in karst springs using isotopic and chemical indicators. Chem. Geol. 2001, 179, 113–128. [Google Scholar] [CrossRef]
  41. Woessner, W.W. Stream and Fluvial Plain Ground Water Interactions: Rescaling Hydrogeologic Thought. Groundwater 2000, 38, 423–429. [Google Scholar] [CrossRef]
  42. Pinardi, M.; Bartoli, M.; Longhi, D.; Marzocchi, U.; Laini, A.; Ribaudo, C.; Viaroli, P. Benthic metabolism and denitrification in a river reach: A comparison between vegetated and bare sediments. J. Limnol. 2009, 68, 133–145. [Google Scholar] [CrossRef]
  43. Tavernini, S.; Pierobon, E.; Viaroli, P. Physical factors and dissolved reactive silica affect phytoplankton community structure and dynamics in a lowland eutrophic river (Po river, Italy). Hydrobiologia 2011, 669, 213–225. [Google Scholar] [CrossRef]
  44. Naldi, M.; Viaroli, P. Nitrate uptake and storage in the seaweed Ulva rigida C. Agardh in relation to nitrate availability and thallus nitrate content in a eutrophic coastal lagoon (Sacca di Goro, Po River Delta, Italy). J. Exp. Mar. Biol. Ecol. 2002, 269, 65–83. [Google Scholar] [CrossRef]
  45. Viaroli, P.; Naldi, M.; Christian, R.R.; Fumagalli, I. The role of macroalgae and detritus in the nutrient cycles in a shallow-water dystrophic lagoon. Int. Ver. Theor. Angew. Limnol. Verh. 1993, 25, 1048–1051. [Google Scholar] [CrossRef]
  46. Bolpagni, R.; Bresciani, M.; Laini, A.; Pinardi, M.; Matta, E.; Ampe, E.M.; Giardino, C.; Viaroli, P.; Bartoli, M. Remote sensing of phytoplankton-macrophyte coexistence in shallow hypereutrophic fluvial lakes. Hydrobiologia 2014, 737, 67–76. [Google Scholar] [CrossRef]
  47. Pinardi, M.; Bresciani, M.; Villa, P.; Cazzaniga, I.; Laini, A.; Tóth, V.; Fadel, A.; Austoni, M.; Lami, A.; Giardino, C. Spatial and temporal dynamics of primary producers in shallow lakes as seen from space: Intra-annual observations from Sentinel-2A. Limnologica 2018, 72, 32–43. [Google Scholar] [CrossRef]
  48. Bresciani, M.; Rossini, M.; Morabito, G.; Matta, E.; Pinardi, M.; Cogliati, S.; Julitta, T.; Colombo, R.; Braga, F.; Giardino, C. Analysis of within- and between-day chlorophyll-a dynamics in Mantua Superior Lake, with a continuous spectroradiometric measurement. Mar. Freshw. Res. 2013, 64, 303–316. [Google Scholar] [CrossRef]
  49. Balderacchi, M.; Perego, A.; Lazzari, G.; Munoz-Carpena, R.; Acutis, M.; Laini, A.; Giussani, A.; Sanna, M.; Kane, D.; Trevisan, M. Avoiding social traps in the ecosystem stewardship: The Italian Fontanile lowland spring. Sci. Total Environ. 2016, 539, 526–535. [Google Scholar] [CrossRef] [PubMed]
  50. Salvetti, R.; Azzellino, A.; Vismara, R. Diffuse source apportionment of the Po river eutrophying load to the Adriatic sea: Assessment of Lombardy contribution to Po river nutrient load apportionment by means of an integrated modelling approach. Chemosphere 2006, 65, 2168–2177. [Google Scholar] [CrossRef] [PubMed]
  51. Palmeri, L.; Bendoricchio, G.; Artioli, Y. Modelling nutrient emissions from river systems and loads to the coastal zone: Po River case study, Italy. Ecol. Model. 2005, 184, 37–53. [Google Scholar] [CrossRef]
  52. Stuopis, A.; Gregorauskas, M.; Domasevicius, A. ormation of Groundwater Runoff in Nemunas RBD (Lithuania). Datormodelēšana Robežproblēmas 2010, 45, 16–26. [Google Scholar]
  53. Benelli, S.; Bartoli, M.; Zilius, M.; Vybernaite-Lubiene, I.; Ruginis, T.; Petkuviene, J.; Fano, E.A. Microphytobenthos and chironomid larvae attenuate nutrient recycling in shallow-water sediments. Freshw. Biol. 2018, 63, 187–201. [Google Scholar] [CrossRef]
  54. Holman, I.P.; Whelan, M.J.; Howden, N.J.K.; Bellamy, P.H.; Willby, N.J.; Rivas-Casado, M.; McConvey, P. Phosphorus in groundwater-an overlooked contributor to eutrophication? Hydrol. Processes 2008, 22, 5121–5127. [Google Scholar] [CrossRef]
  55. Nakayama, T.; Watanabe, M. Missing role of groundwater in water and nutrient cycles in the shallow eutrophic lake Kasumigaura, Japan. Hydrol. Processes Int. J. 2008, 22, 1150–1172. [Google Scholar] [CrossRef]
Figure 1. Schematic map of the investigated area and sampling points. In the corner, the Lombardy region is highlighted and its digital terrain model (DTM) is reported, with the investigated area indicated by the red rectangle. Basemap from OpenStreetMap (https://www.openstreetmap.org, accessed on 6 December 2021).
Hydrology 09 00044 g001
Figure 2. Potentiometric maps. (a) Potentiometric map of August 2020; (b) Potentiometric map of March 2021. Basemap from OpenStreetMap (https://www.openstreetmap.org, accessed on 6 December 2021).
Hydrology 09 00044 g002
Figure 3. Groundwater level fluctuations in the monitored wells. The bar plot shows the monthly precipitation from the Goito meteorological station. The triangles represent wells in the west bank of the Mincio River, the squares those in the east bank, and the circles represent the water level sensors in the Mincio River. The shaded area includes the irrigation period.
Hydrology 09 00044 g003
Figure 4. Chemical parameters variation along the hydrological year.
Hydrology 09 00044 g004
Figure 5. Discharge, NO3, and SiO2 loads in the Mincio River.
Hydrology 09 00044 g005
Figure 6. SO42/NO3 plot from August 2020, December 2020, and April 2021. The side-table reports the single R2 values. The different lines defining the source of pollution are derived from [35,37].
Hydrology 09 00044 g006
Figure 7. NO3 loads in 2019 and 2020. (a) Monthly precipitation. (b) Loads comparison between c12 (purple) and c16 (green) in 2019 (dashed line) and 2020 (solid line). The difference in loads between them is reported in the bar plot. (c) Progressively cumulated loads differences between 2019 (orange) and 2020 (yellow).
Hydrology 09 00044 g007
Table 1. Statistical summary with median value (Median) and standard deviation (Std dev) for each measured parameter for all of the 19 sampling points during the hydrological year. HCO3 were measured only in March, April, and May.
ParameterMedianStd Dev
t (°C)17.433.47
EC (µS/cm)526136
pH7.480.32
F0.2800.110
Cl7.7922.816
NO312.07215.977
SO42−12.9187.002
HCO3257.43663.613
Na+7.1111.076
K+2.1082.295
Mg2+15.1994.151
Ca2+81.97822.549
SiO28.4704.374
Table 2. NO3 and SiO2 concentrations and loads during the hydrological year 2020–2021. The c12 and c16 data represent the Mincio River concentrations, while their difference is expressed as daily load.
MonthRiver Flowc12c16Difference
NO3 m3 s−1mg L−1mg L−1kg d−1
June 20208.85.6032.1042660
July 202013.97.3212.4015908
August 202013.97.0111.5166599
September 202013.93.8431.8352411
October202010.83.133.268−129
November 202010.83.4833.228237
December 202010.810.4123.2636670
January 20218.54.5342.8061269
February 20218.52.7412.7410
March 20218.53.5465.73−1604
April 20219.48.5672.9124593
May 20219.42.6131.2521106
SiO2June 20208.84.2751.5792050
July 202013.97.0992.8925052
August 202013.95.7363.272961
September 202013.93.5622.5121261
October202010.84.4113.0661255
November 202010.82.6822.024614
December 202010.84.442.4881822
January 20218.54.5813.415856
February 20218.51.8051.75536.5
March 20218.51.2230.961193
April 20219.45.7833.0142250
May 20219.45.2913.3291593
Table 3. NO3 concentrations and loads during the autumnal fertilization period in 2019 and 2020. Concentration is expressed in mg NO3 L−1 and load is reported as kg NO3 d−1. River flow data were obtained by the Interregional Agency for the Po River (AIPO, https://www.agenziapo.it/, accessed on 6 December 2021) and by the Mincio Consortium (https://www.territoridelmincio.it/index.php, accessed on 6 December 2021).
YearSampleValueSeptemberOctoberNovemberDecember
2019c12Concentration11.71711.1808.2208.755
c16Concentration6.8824.1473.6292.581
DifferenceLoad5807656342845761
2020c12Concentration3.8433.1303.48310.412
c16Concentration1.8353.2683.2283.263
DifferenceLoad5807656342845761
Publisher’s Note: MDPI stays neutral with regard to jurisdictional claims in published maps and institutional affiliations.

