
Hydrological and Chemical Budgets of Okama Crater Lake in Active Zao Volcano, Japan

 ,
, 
Abstract
1. Introduction
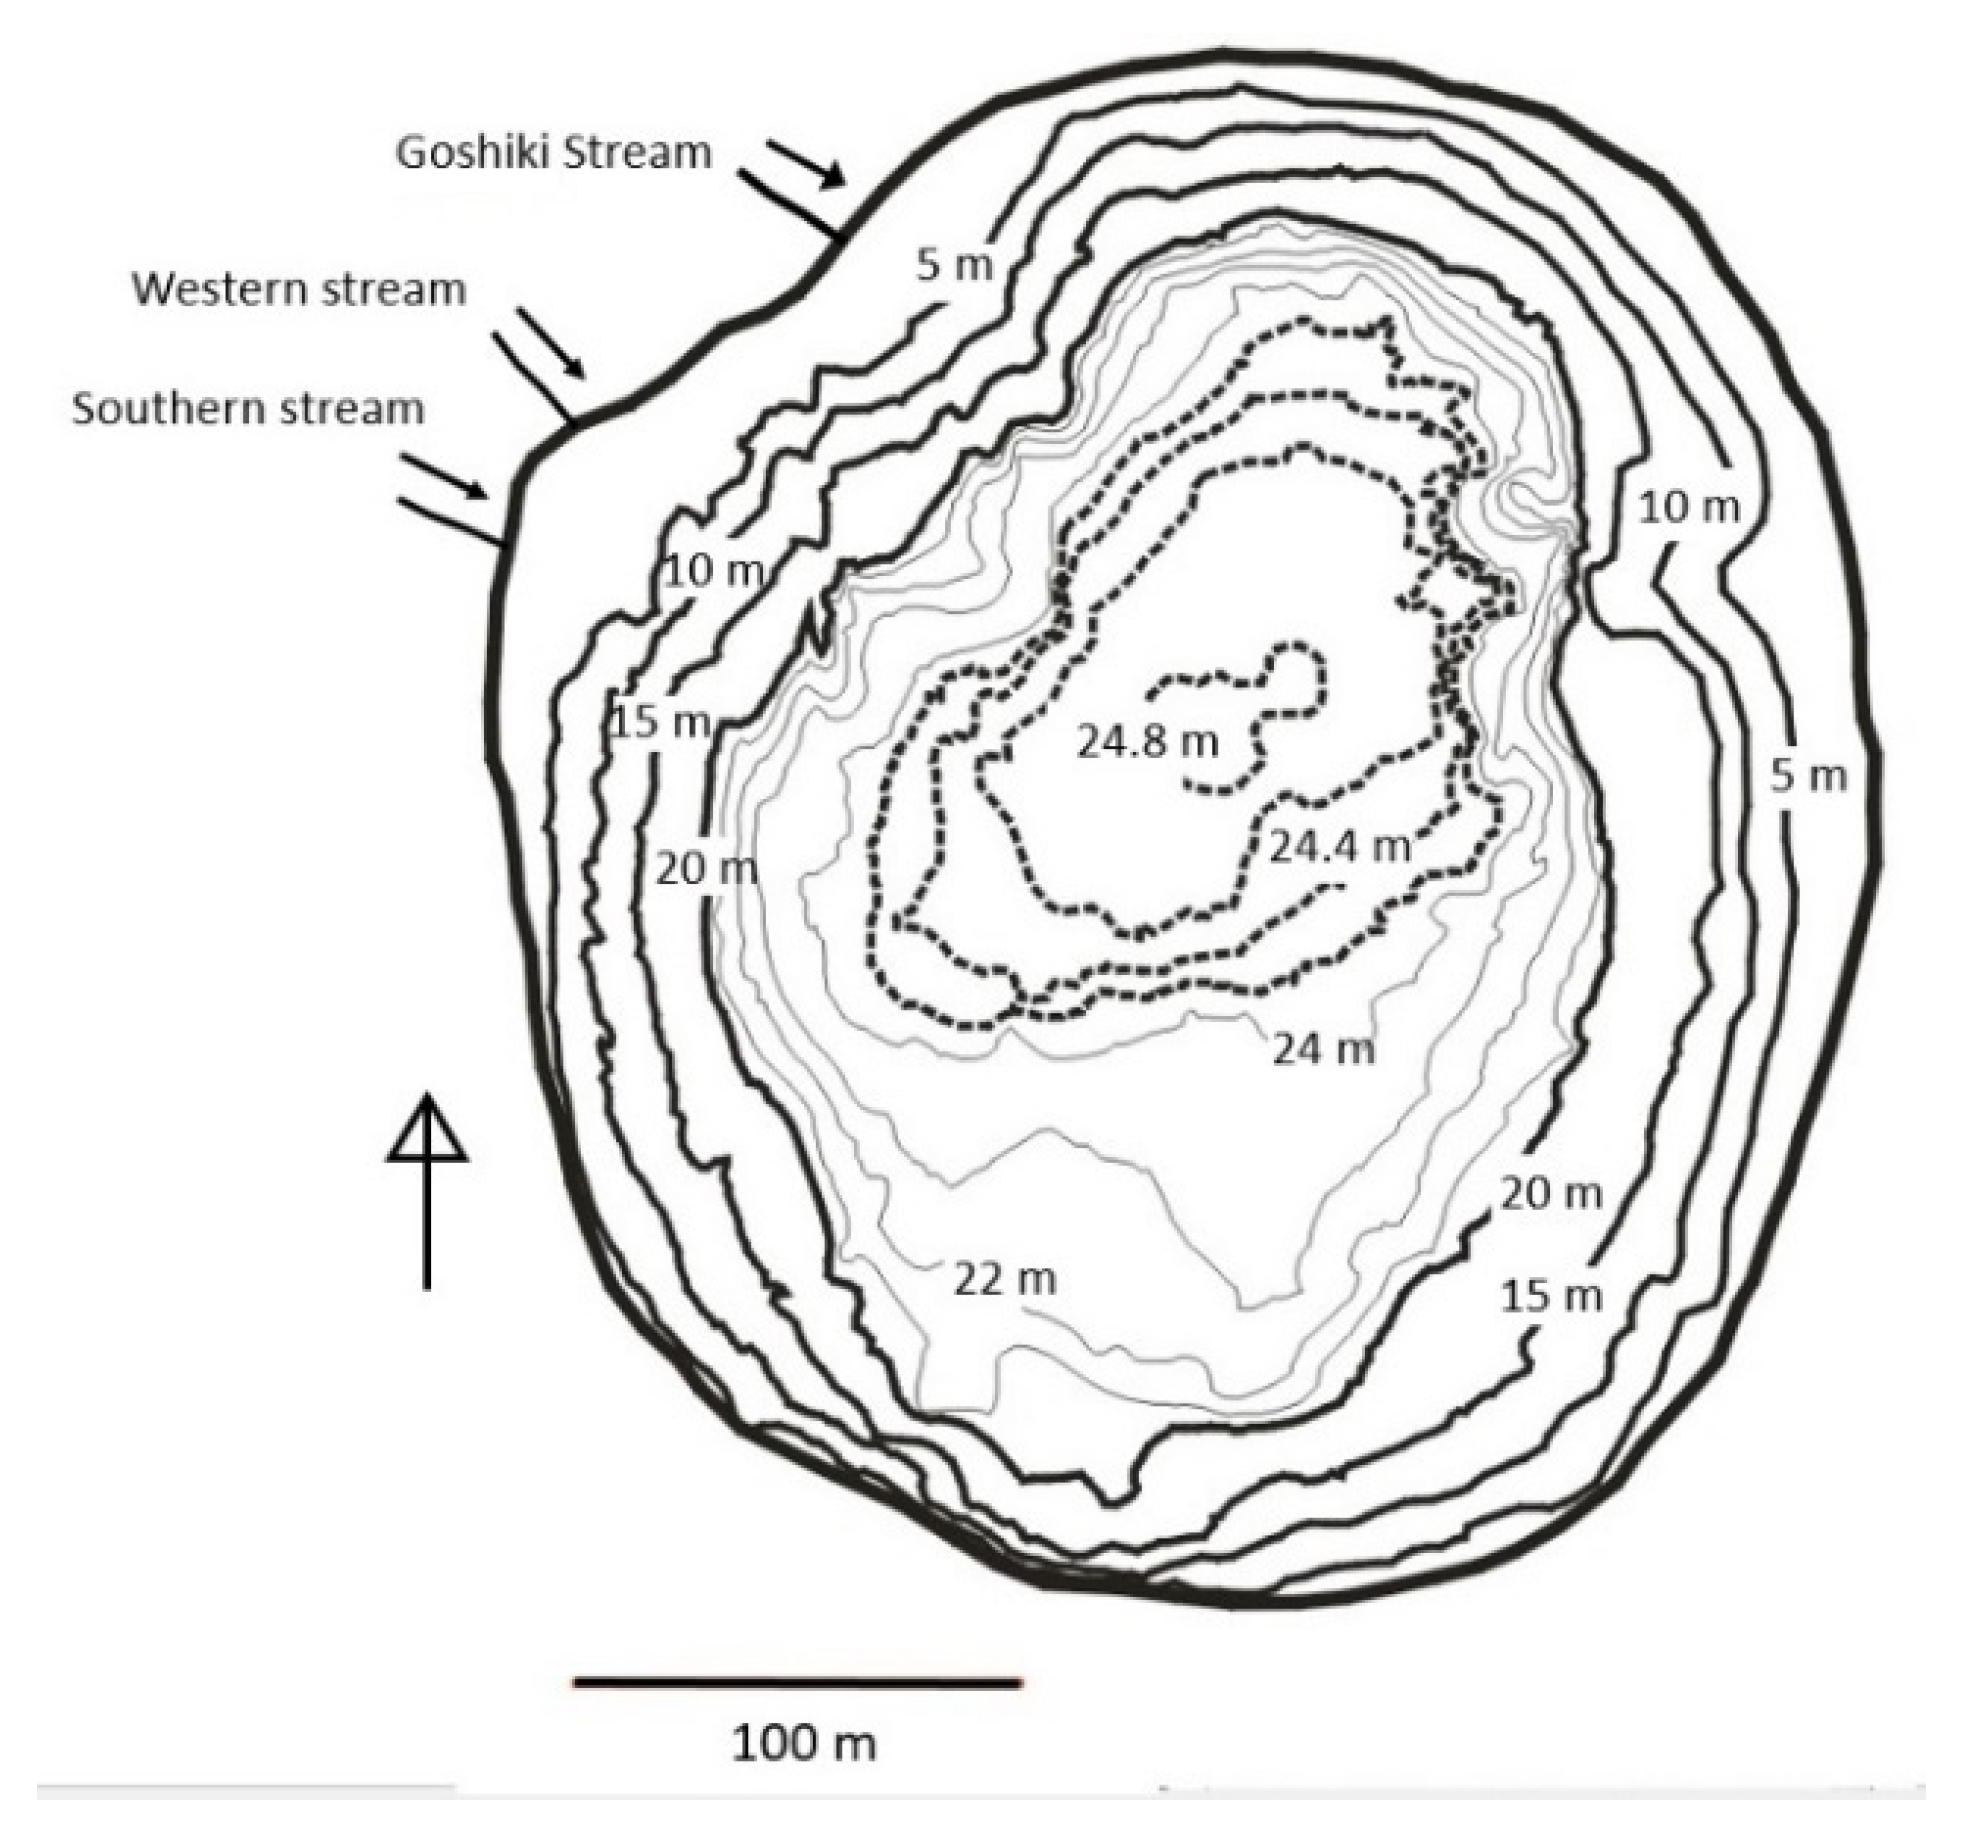
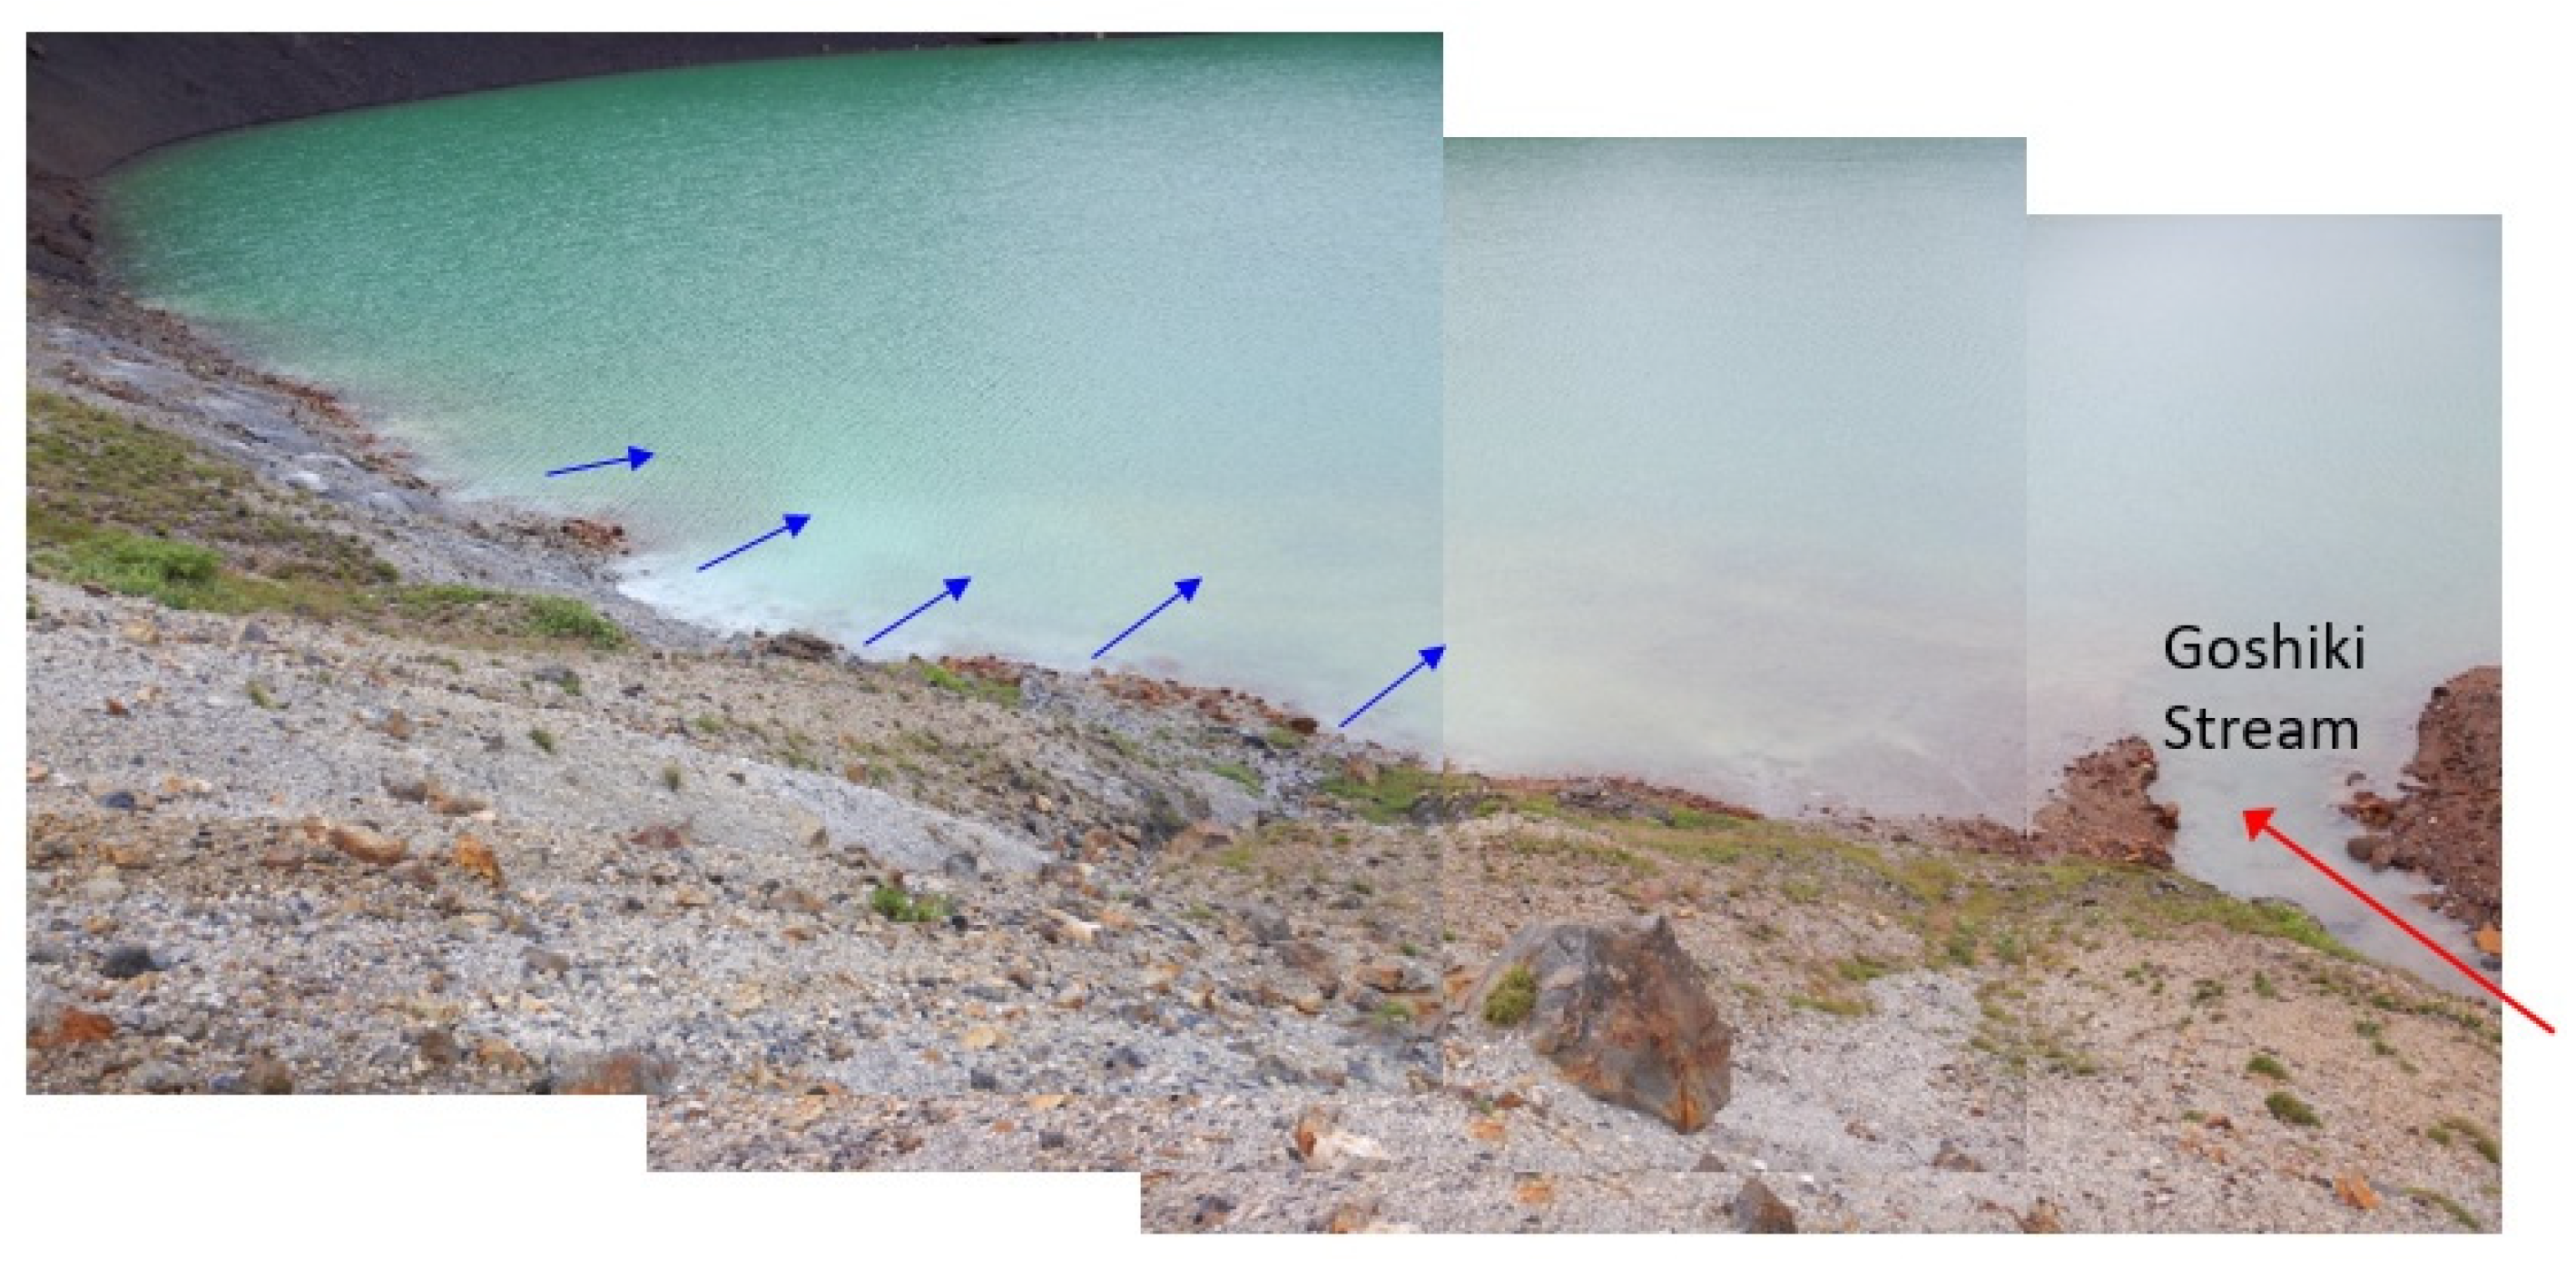
2. Study Area
3. Methods
3.1. Estimates of Hydrological and Chemical Budgets
3.2. Field Observations
3.3. Laboratory Experiments
4. Results
4.1. Water Chemistry
4.2. Thermal Variations in Okama
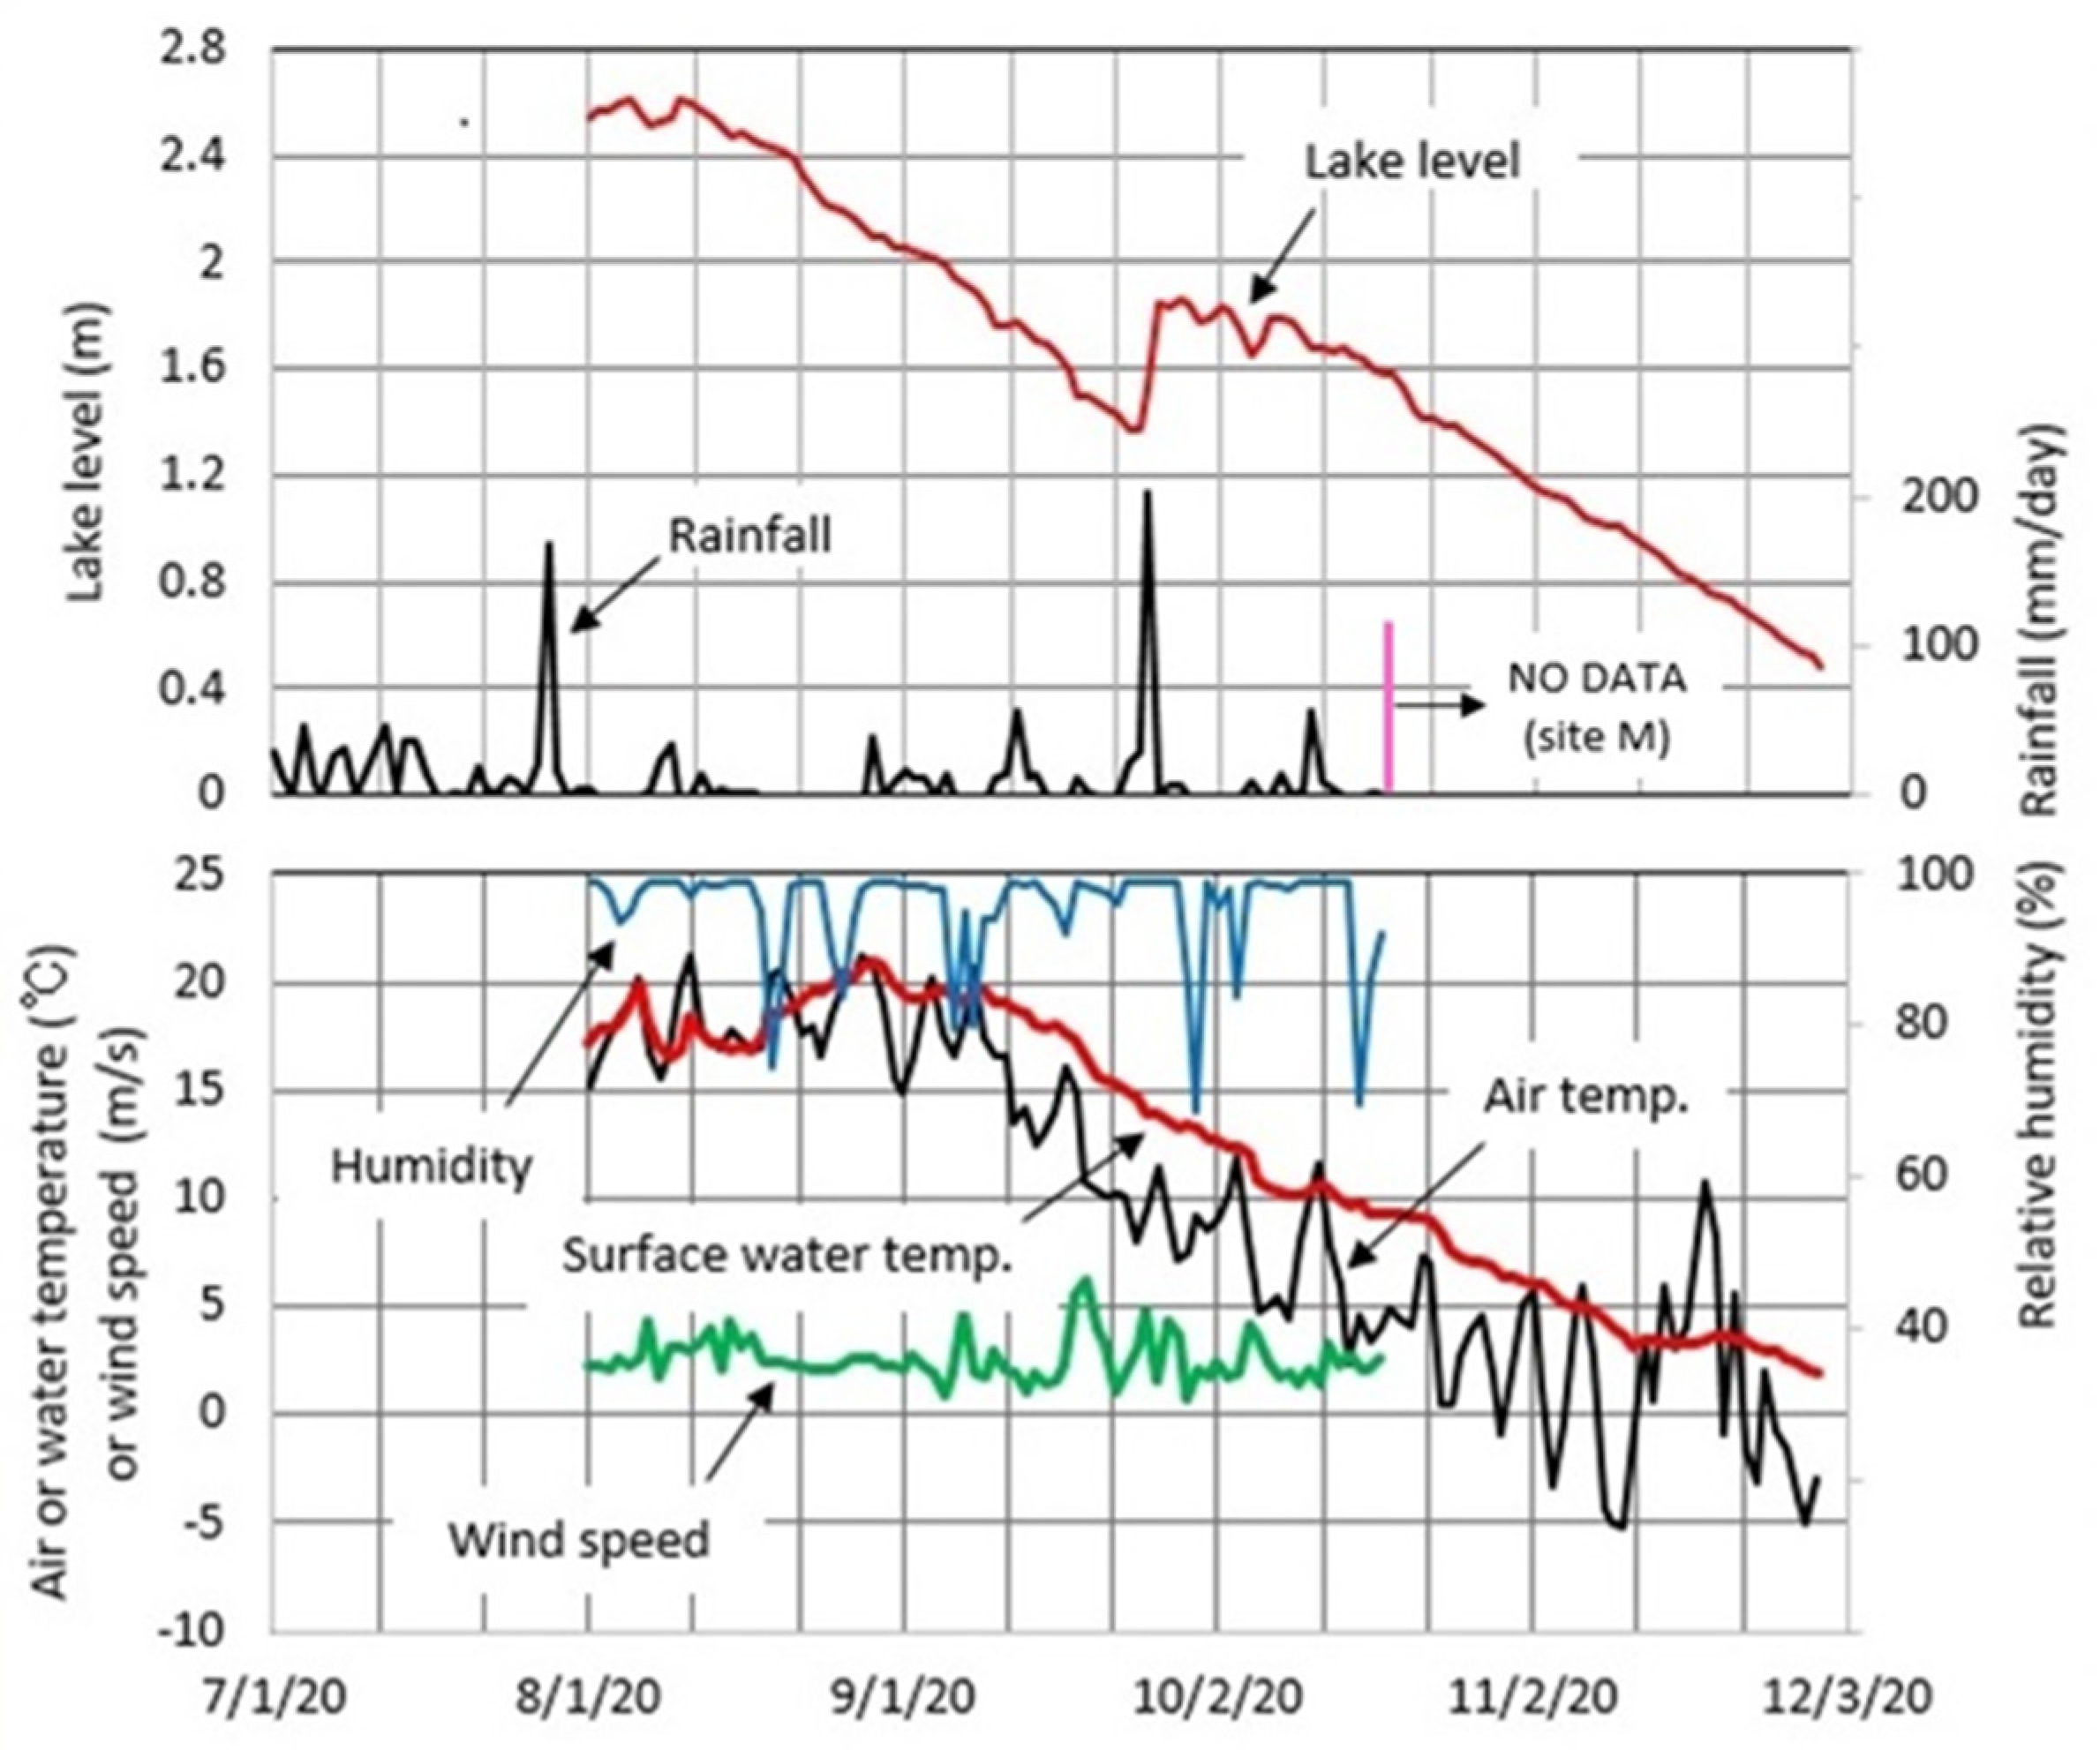
4.3. Meteorology at Okama
5. Discussion
5.1. Geothermal Heat Flux in Okama
5.2. Estimating Groundwater Inflow and Outflow in Okama
6. Conclusions
Author Contributions
Funding
Informed Consent Statement
Acknowledgments
Conflicts of Interest
References
- Shimomura, M.; Putra, R.; Rukmini, N.A. Sulistiyani Numerical simulation of Mt. Merapi pyroclastic flow in 2010. J. Disaster Res. 2019, 14, 105–115. [Google Scholar] [CrossRef]
- Septiana, M.E.; Wardoyo, M.A.I.; Praptiwi, N.Y.; Ashari, A.N.S.; Ashari, A.; Susanti, N.I.; Latifah, F.; Nugrahagung, P.P. Disaster education through local knowledge in some area of Merapi Volcano. Earth Environ. Sci. 2019, 271, 012011. [Google Scholar] [CrossRef]
- Kaneko, T.; Maeno, F.; Nakada, S. 2014 Mount Ontake eruption: Characteristics of the phreatic eruption as inferred from aerial observations. Earth Planets Space 2016, 68, 72. [Google Scholar] [CrossRef]
- Moore, J.G.; Nakamura, K.; Alcaraz, A. The 1965 eruption of Taal Volcano. Science 1966, 151, 955–960. [Google Scholar] [CrossRef] [PubMed]
- Ohba, T.; Hirabayashi, J.; Nogami, K. Temporal changes in the chemistry of lake water within Yugama Crater, Kusatsu-Shirane Volcano, Japan: Implications for the evolution of the magmatic hydrothermal system. J. Volcanol. Geotherm. Res. 2008, 178, 131–144. [Google Scholar] [CrossRef]
- Amador, R.A.M.; Rouwet, D.; González, G.; Vargas, P.; Ramírez, C. Volcanic Hazard Assessment of Poás (Costa Rica) Based on the 1834, 1910, 1953–1955 and 2017 Historical Eruptions. In Poás Volcano. Active Volcanoes of the World; Tassi, F., Vaselli, O., Amador, R.A.M., Eds.; Springer: Cham, Switzerland, 2019. [Google Scholar] [CrossRef]
- Cruz, M.M. Geochemical Evolution of the Acid Crater Lake of Poás Volcano (Costa Rica): Insights into Volcanic/Hydrothermal Processes. Ph.D. Thesis, Utrecht University, Utrecht, The Netherland, 2008; 163p. [Google Scholar]
- Chikita, K.A.; Nishi, M.; Fukuyama, R.; Hamahara, K. Hydrological and chemical budgets in a volcanic caldera lake: Lake Kussharo, Hokkaido, Japan. J. Hydrol. 2004, 291, 91–114. [Google Scholar] [CrossRef]
- Chikita, K.A.; Ochiai, Y.; Oyagi, H.; Sakata, Y. Geothermal linkage between a hydrothermal pond and a deep lake: Kuttara Volcano, Japan. Hydrology 2019, 6, 4. [Google Scholar] [CrossRef]
- Ono, M.; Machida, I.; Ikawa, R.; Kamitani, T.; Oyama, K.; Muranaka, Y.; Ito, A.; Marui, A. Regional groundwater flow system in a stratovolcano adjacent to a coastal area: A case study of Mt. Fuji and Suruga Bay, Japan. Hydrogeol. J. 2019, 27, 717–730. [Google Scholar] [CrossRef]
- Aizawa, K.; Ogawa, Y.; Ishido, T. Groundwater flow and hydrothermal systems within volcanic edifices: Delineation by electric self-potential and magnetotellurics. J. Geophys. Res. 2009, 114, B01208. [Google Scholar] [CrossRef]
- Ban, M.; Oikawa, T.; Yamazaki, S. Geologic Map of Zao Volcano; Geological Survey; AIST: Tsukuba, Japan, 2015; 8p. [Google Scholar]
- Ban, M.; Oikawa, T.; Yamazaki, S.; Goto, A.; Yamamoto, M.; Miura, S. Prediction of eruption courses in volcanoes without eruptions under modern observation system: Example of Zao Volcano. Volcano 2019, 64, 131–138. [Google Scholar] [CrossRef]
- Konno, Y. Nigori-gawa, an acid stream originated from the crater-lake “Okama” of Mt. Zao. Jpn. J. Limnol. 1936, 6, 21–26. [Google Scholar] [CrossRef]
- Yoshimura, S. Limnology; Sansei-do Publication Inc.: Tokyo, Japan, 1937; 520p. [Google Scholar]
- Yamasaki, S.; (Kyoto University, Kyoto, Japan); Yagi, H.; (Yamagata University, Yamagata, Japan). Personal Communication, 2018.
- Tsuchiya, N.; (Tohoku University, Sendai, Japan); Hirano, N.; (Tohoku University, Sendai, Japan). Personal communication, 2018.
- Kondo, J. Meteorology in Aquatic Environments; Asakura Publishing Ltd.: Tokyo, Japan, 1994; 350p. [Google Scholar]
- Katsuki, K.; Seto, K.; Suganuma, Y.; Yang, D.Y. Characteristics of portable core samplers for lake deposit investigations. J. Geogr. 2019, 128, 359–376. [Google Scholar] [CrossRef]
- Chikita, K.A.; Smith, N.D.; Yonemitsu, N.; Perez-Arlucea, M. Dynamics of sediment-laden underflows passing over a sub-aqueous sill: Glacier-fed Peyto Lake, Alberta, Canada. Sedimentology 1996, 43, 865–875. [Google Scholar] [CrossRef]
- Wang, Z.; Li, W.; Zhang, K.; Agrawal, Y.C.; Huang, H. Observations of the distribution and flocculation of suspended particulate matter in the North Yellow Sea cold water mass. Cont. Shelf Res. 2020, 204, 104187. [Google Scholar] [CrossRef]
- Chikita, K.A.; Oyagi, H.; Makino, S.; Kanna, N.; Tone, K.; Sakamoto, H.; Hata, S.; Ando, T.; Shirai, Y. Relations between freezing and climate change in a mountainous lake. J. Jpn. Soc. Phys. Hydrol. 2020, 2, 3–13. [Google Scholar] [CrossRef]
- Ichiki, M.; Kaida, T.; Yamamoto, M.; Miura, S.; Kanda, W.; Ushioda, M.; Seki, K.; Morita, Y.; Uyeshima, M. An electrical resistivity exploration of Zao volcano, using audio-frequency magnetotelluric method to evaluate the eruption potential field. In Proceedings of the Fall Meeting 2021, Volcanological Society of Japan, Tokyo, Japan, 9 September 2021; pp. 1–14. [Google Scholar]
- Boehrer, B.; Fukuyama, R.; Chikita, K.A. Geothermal heat flux into deep caldera lakes Shikotsu, Kuttara, Tazawa and Towada. Limnology 2013, 14, 129–134. [Google Scholar] [CrossRef]
- Shiraiwa, J.; Kazama, S.; Sakamoto, M. The influence of climate change on river water temperature. Ann. J. Hydraul. Eng. 2006, 50, 1063–1068. [Google Scholar] [CrossRef][Green Version]
- Burns, E.R.; Zhu, Y.; Zhan, H.; Manga, M.; Williams, C.F.; Ingebritsen, S.E.; Dunham, J.B. Thermal effect of climate change on groundwater-fed ecosystems. Water Resour. Res. 2017, 53, 3341–3351. [Google Scholar] [CrossRef]
- Takimoto, H.; Ogura, A.; Yoshida, M.; Takase, K.; Maruyama, T. Analysis of snowpack accumulation and melting with a heat balance approach–Role of heat flux from underground in melting snow–. J. Jpn. Soc. Irrig. Drain. Rural Eng. 2014, 292, 9–18. [Google Scholar]
- Mickschl, C. Effects of the Ground Heat Flux on Snowpack Ablation in a Semi-Arid Mountain Climate. Water Resources Professional Project Reports; University of New Mexico: Albuquerque, NM, USA, 2016. [Google Scholar]


| No. | Period | Rin (m3/s) | Gin − Gout (m3/s) | Gin (m3/s) | Gout (m3/s) |
|---|---|---|---|---|---|
| (1) | 3–6 August 2020 | 0.00332 | −0.020 | 0.016 | 0.036 |
| (2) | 19–28 August 2020 | 0.00332 | −0.035 | 0.012 | 0.047 |
| (3) | 7–8 September 2020 | 0.00271 | −0.043 | 0.018 | 0.061 |
| (4) | 16–17 September 2020 | 0.00271 | −0.072 | 0.019 | 0.091 |
| (5) | 21–22 September 2020 | 0.00271 | −0.031 | 0.011 | 0.042 |
| (6) | 30 September–4 October 2020 | 0.00212 | −0.028 | 0.007 | 0.035 |
Publisher’s Note: MDPI stays neutral with regard to jurisdictional claims in published maps and institutional affiliations. |
© 2022 by the authors. Licensee MDPI, Basel, Switzerland. This article is an open access article distributed under the terms and conditions of the Creative Commons Attribution (CC BY) license (https://creativecommons.org/licenses/by/4.0/).
Share and Cite
Chikita, K.A.; Goto, A.; Okada, J.; Yamaguchi, T.; Miura, S.; Yamamoto, M. Hydrological and Chemical Budgets of Okama Crater Lake in Active Zao Volcano, Japan. Hydrology 2022, 9, 28. https://doi.org/10.3390/hydrology9020028
Chikita KA, Goto A, Okada J, Yamaguchi T, Miura S, Yamamoto M. Hydrological and Chemical Budgets of Okama Crater Lake in Active Zao Volcano, Japan. Hydrology. 2022; 9(2):28. https://doi.org/10.3390/hydrology9020028
Chicago/Turabian StyleChikita, Kazuhisa A., Akio Goto, Jun Okada, Takashi Yamaguchi, Satoshi Miura, and Mare Yamamoto. 2022. "Hydrological and Chemical Budgets of Okama Crater Lake in Active Zao Volcano, Japan" Hydrology 9, no. 2: 28. https://doi.org/10.3390/hydrology9020028
APA StyleChikita, K. A., Goto, A., Okada, J., Yamaguchi, T., Miura, S., & Yamamoto, M. (2022). Hydrological and Chemical Budgets of Okama Crater Lake in Active Zao Volcano, Japan. Hydrology, 9(2), 28. https://doi.org/10.3390/hydrology9020028