
Spatiotemporal Trend Analysis of Temperature and Rainfall over Ziway Lake Basin, Ethiopia

 ,
,  ,
,  and
and 
Abstract
:1. Introduction
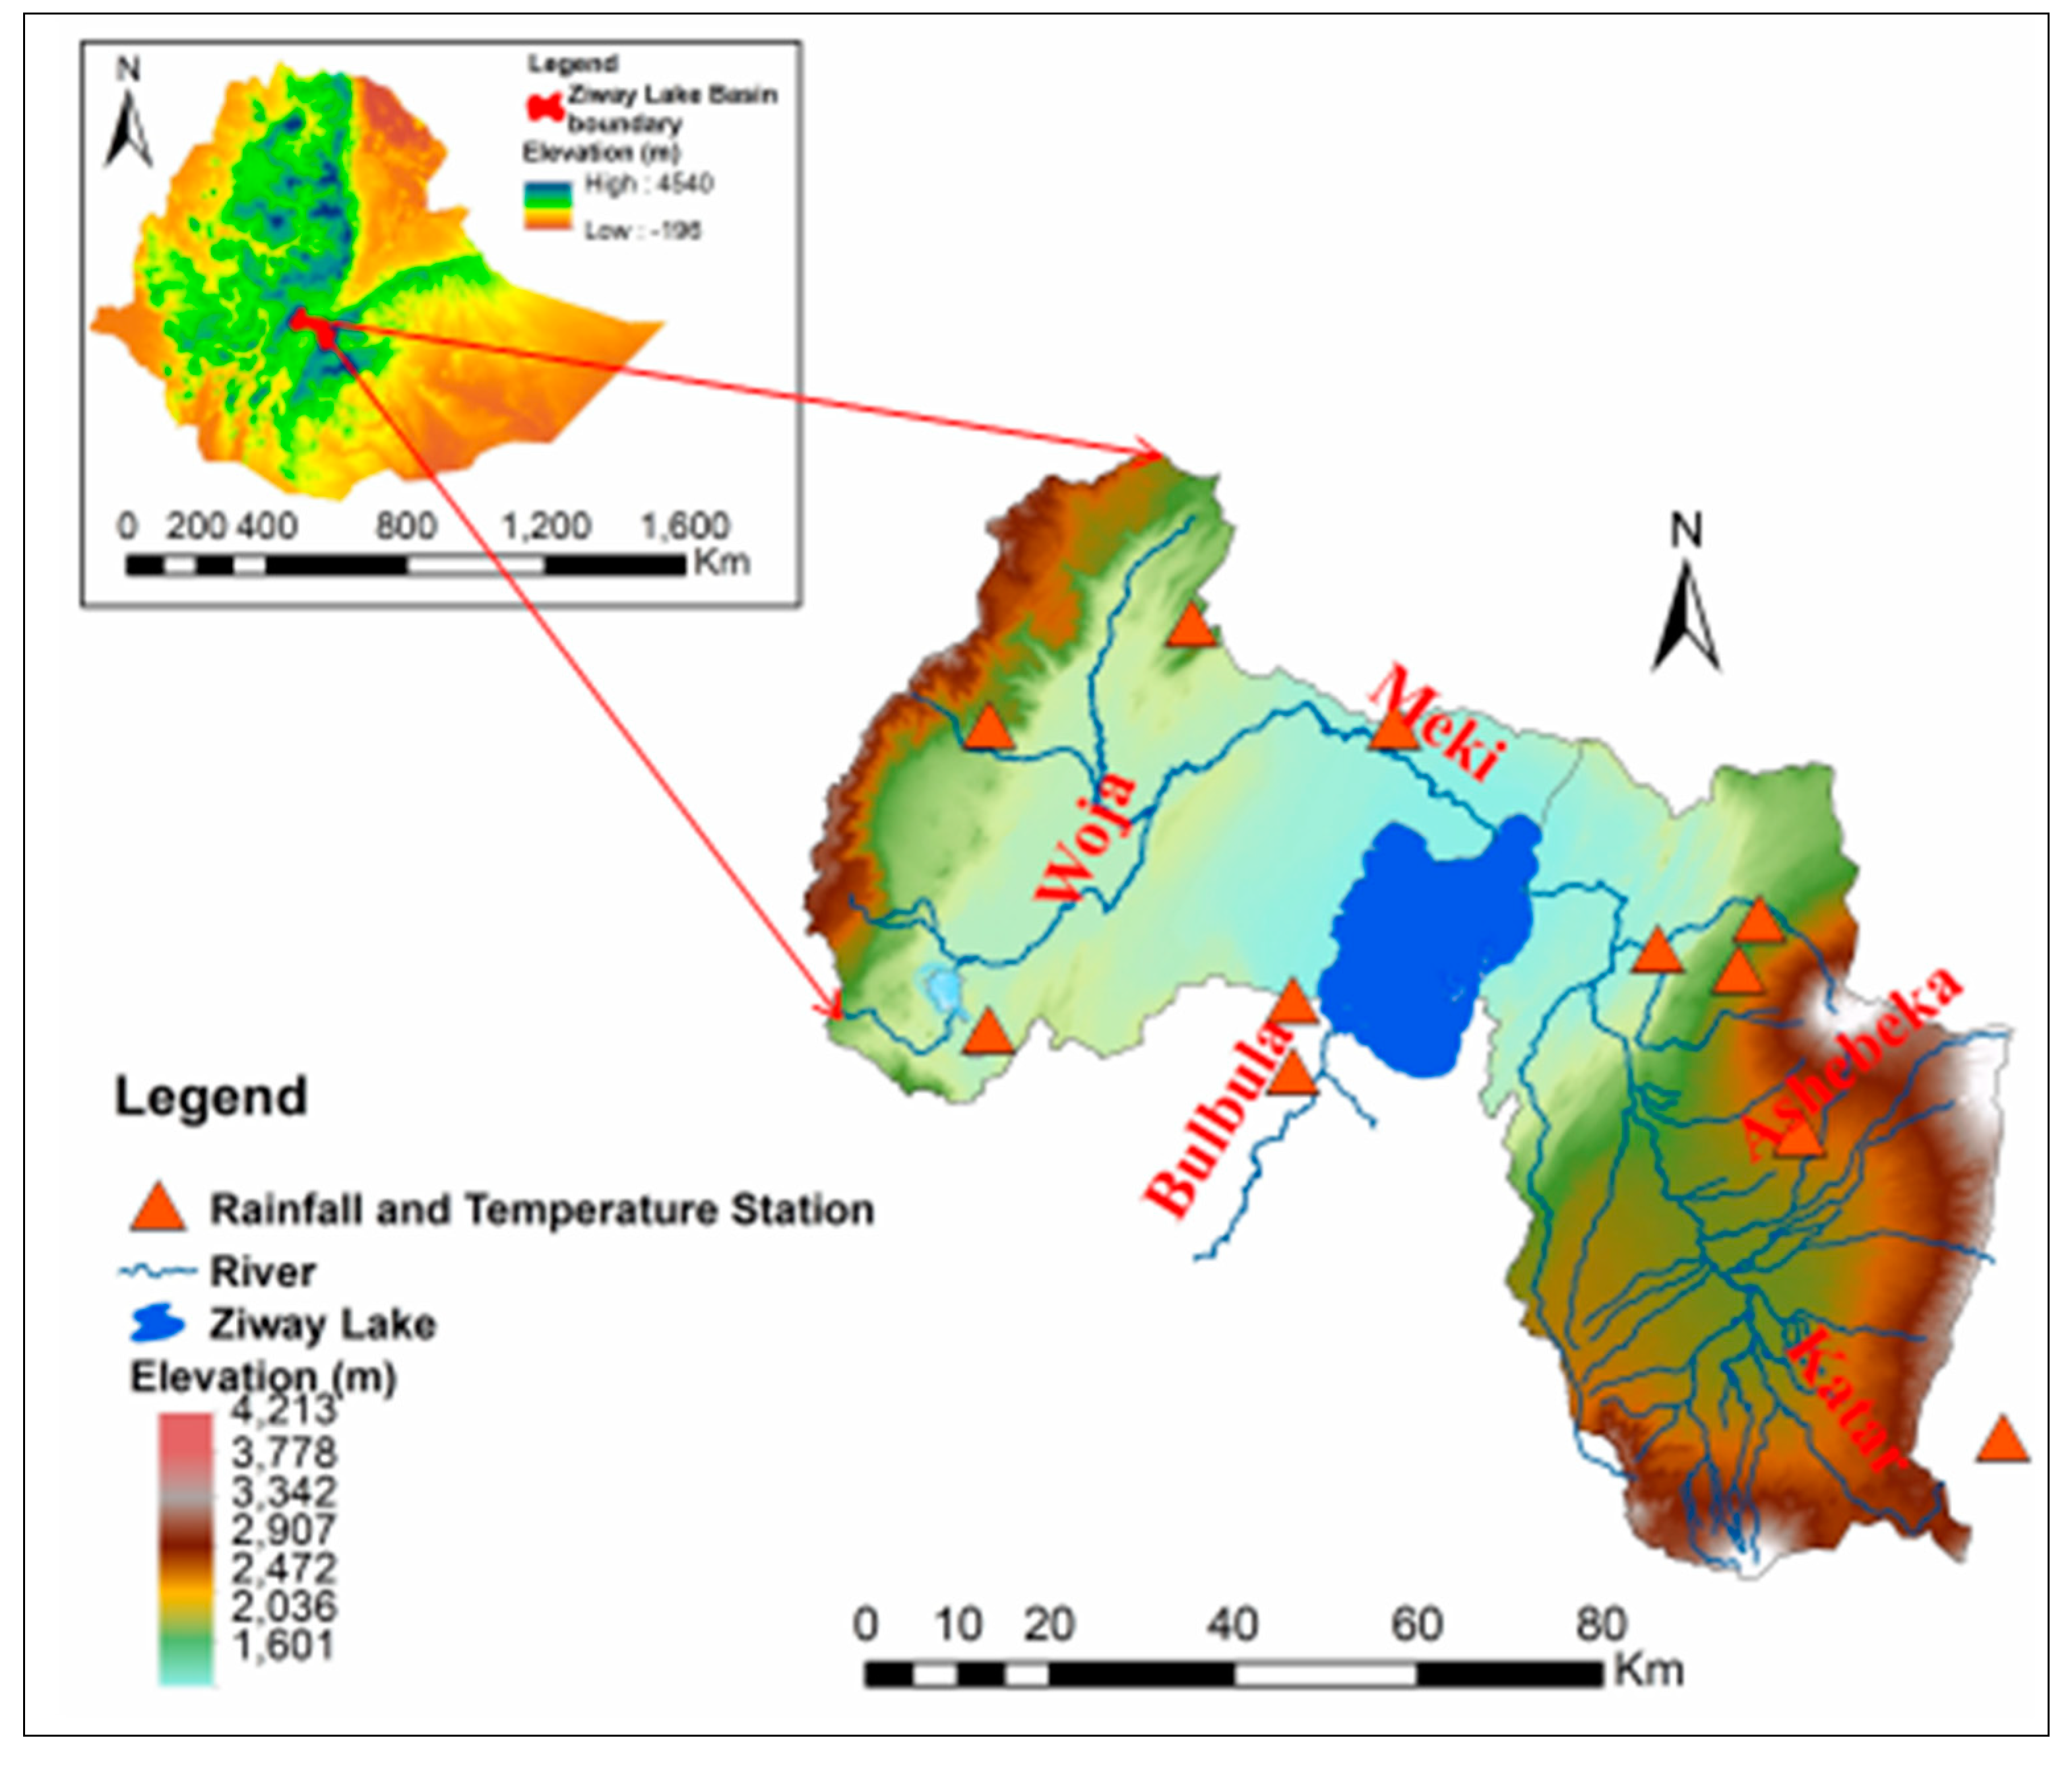
2. Study Area Description
3. Data and Methods
3.1. Observed Data
3.2. Historical and Future Climate Data
3.3. CMIP5 Selection Criteria
3.4. Data Extraction, Downscaling, and Bias Correction
3.5. Climate Models Performance Evaluation
3.6. Rainfall and Temperature Trend Analysis
3.6.1. Mann–Kendall Test
3.6.2. Modified Mann–Kendall Test
4. Results and Discussion
4.1. Performance Evaluation of CMIP5 Models
4.2. Historical Annual Rainfall and Temperature Trends
4.2.1. Temporal Trends of Annual Historical Rainfall and Temperature
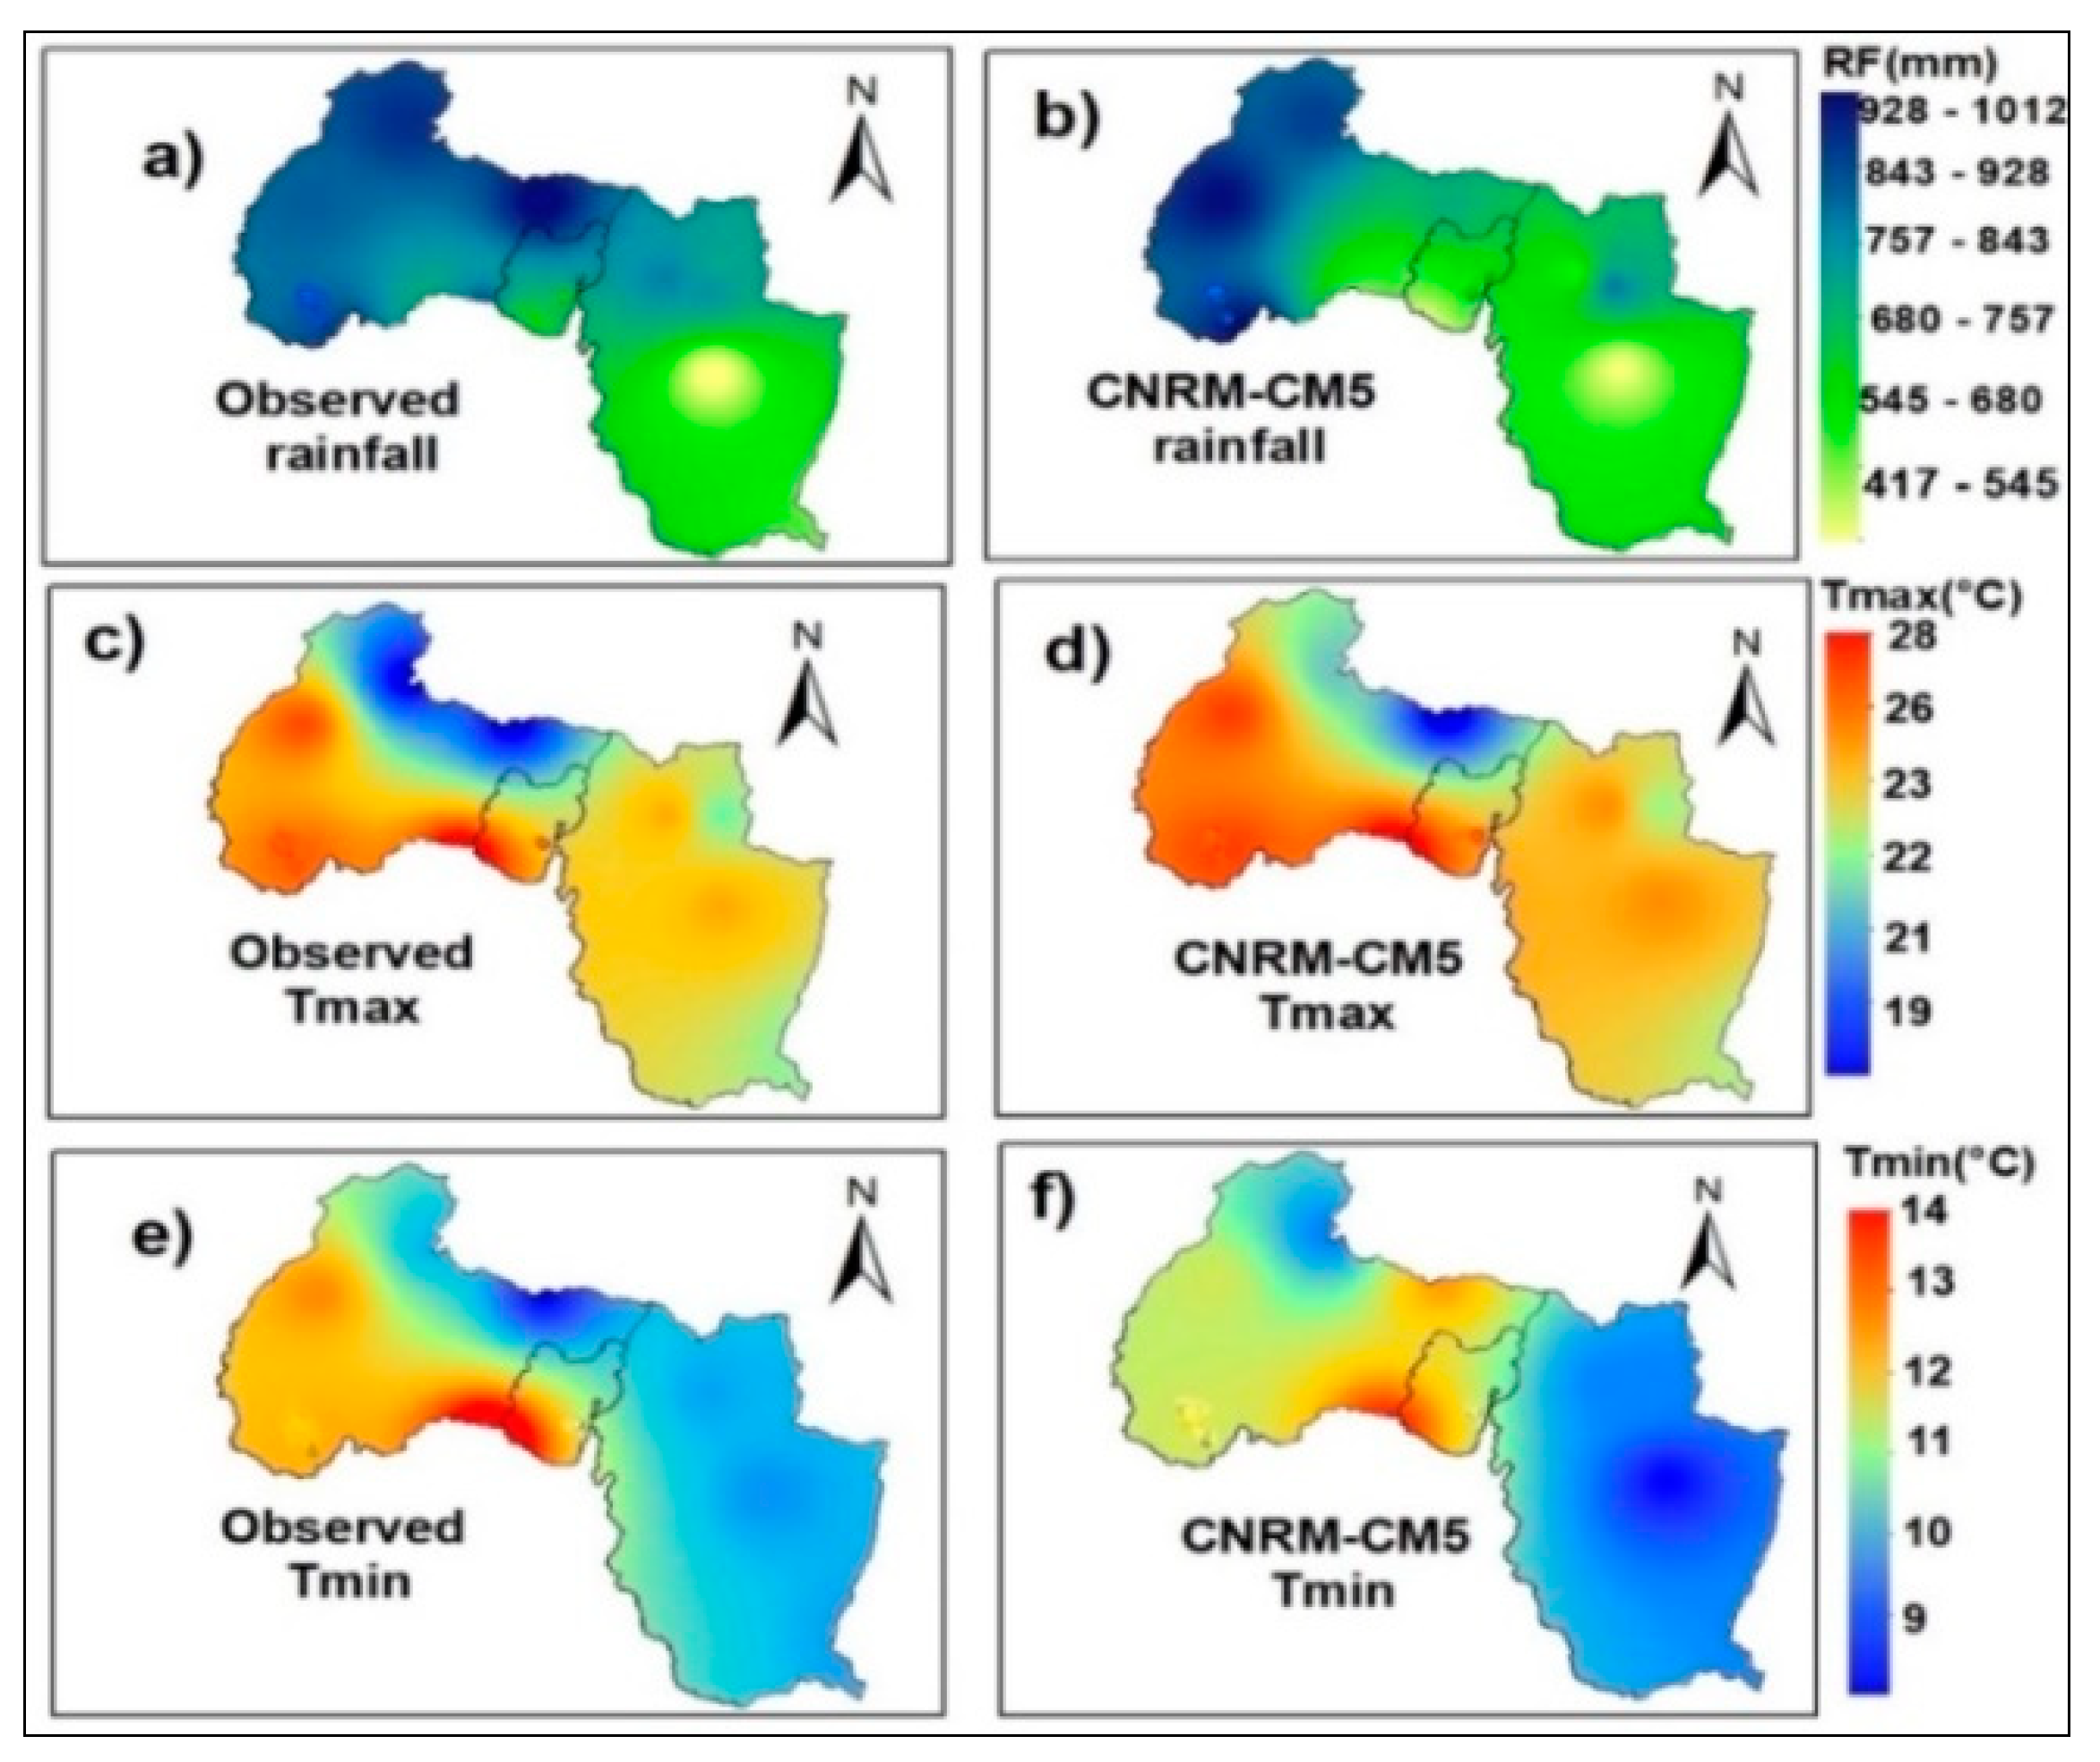
4.2.2. Spatial Distribution of Historical Mean Annual Rainfall and Temperature
4.3. Future Annual Rainfall and Temperature Trends
4.3.1. Temporal Trends of Annual Future Rainfall and Temperature
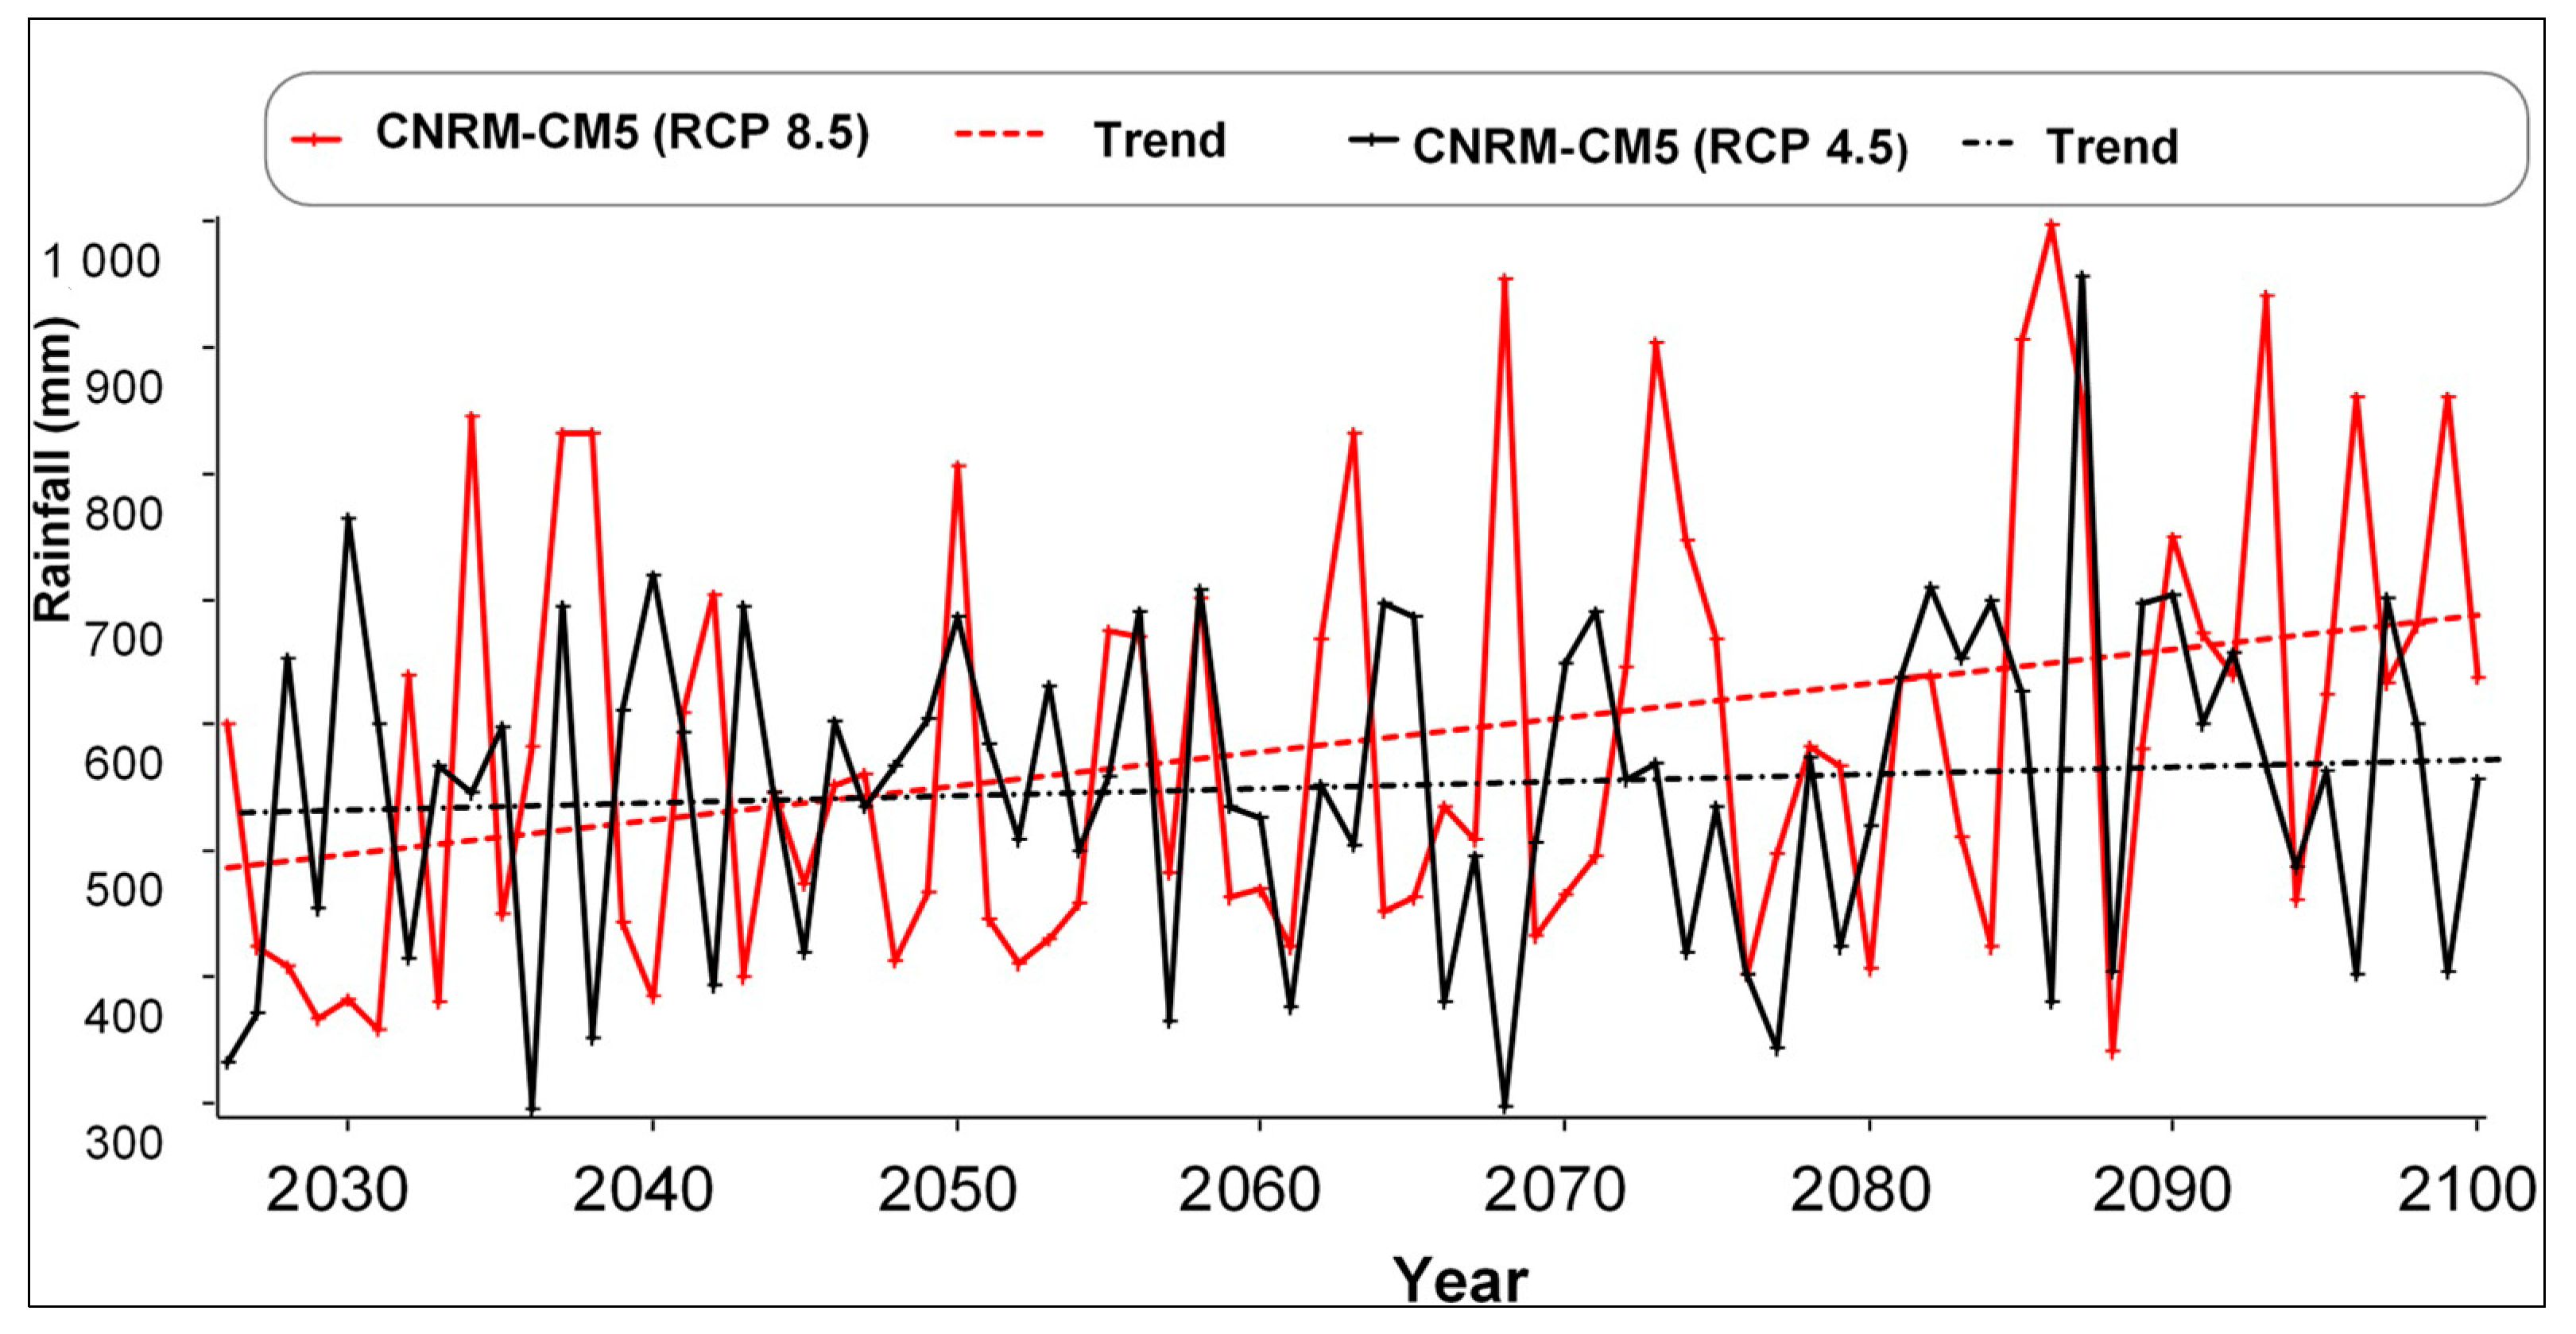
Annual Rainfall Trend
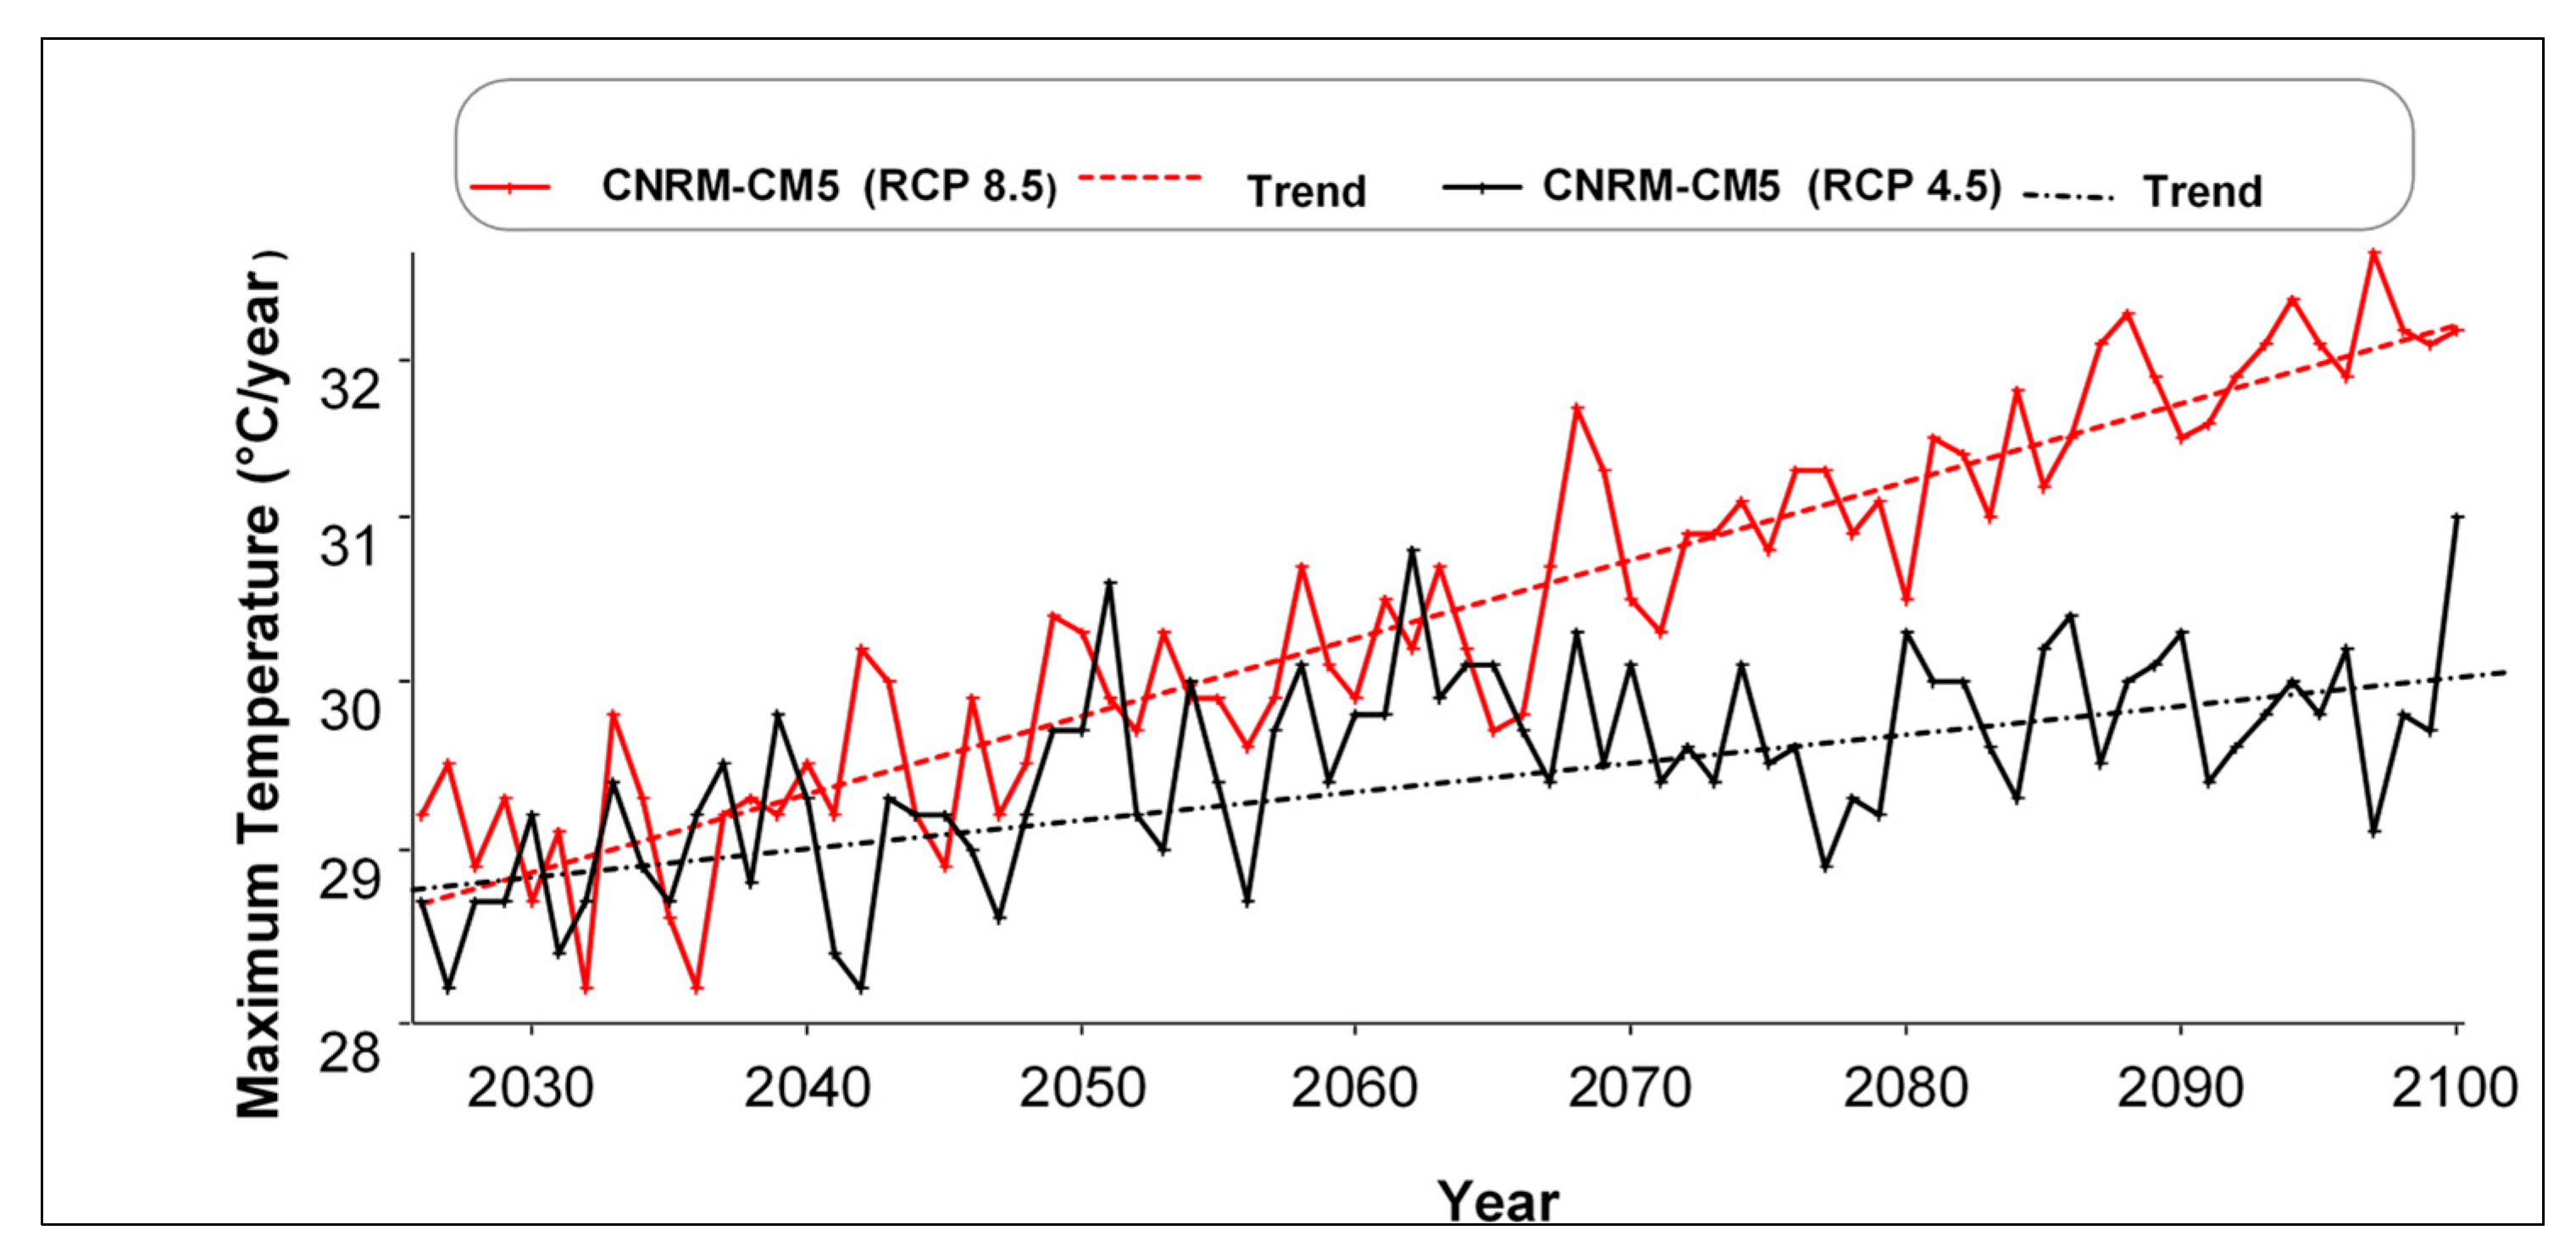
Annual Future Maximum Temperature (Tmax) and Minimum Temperature (Tmin) Trends
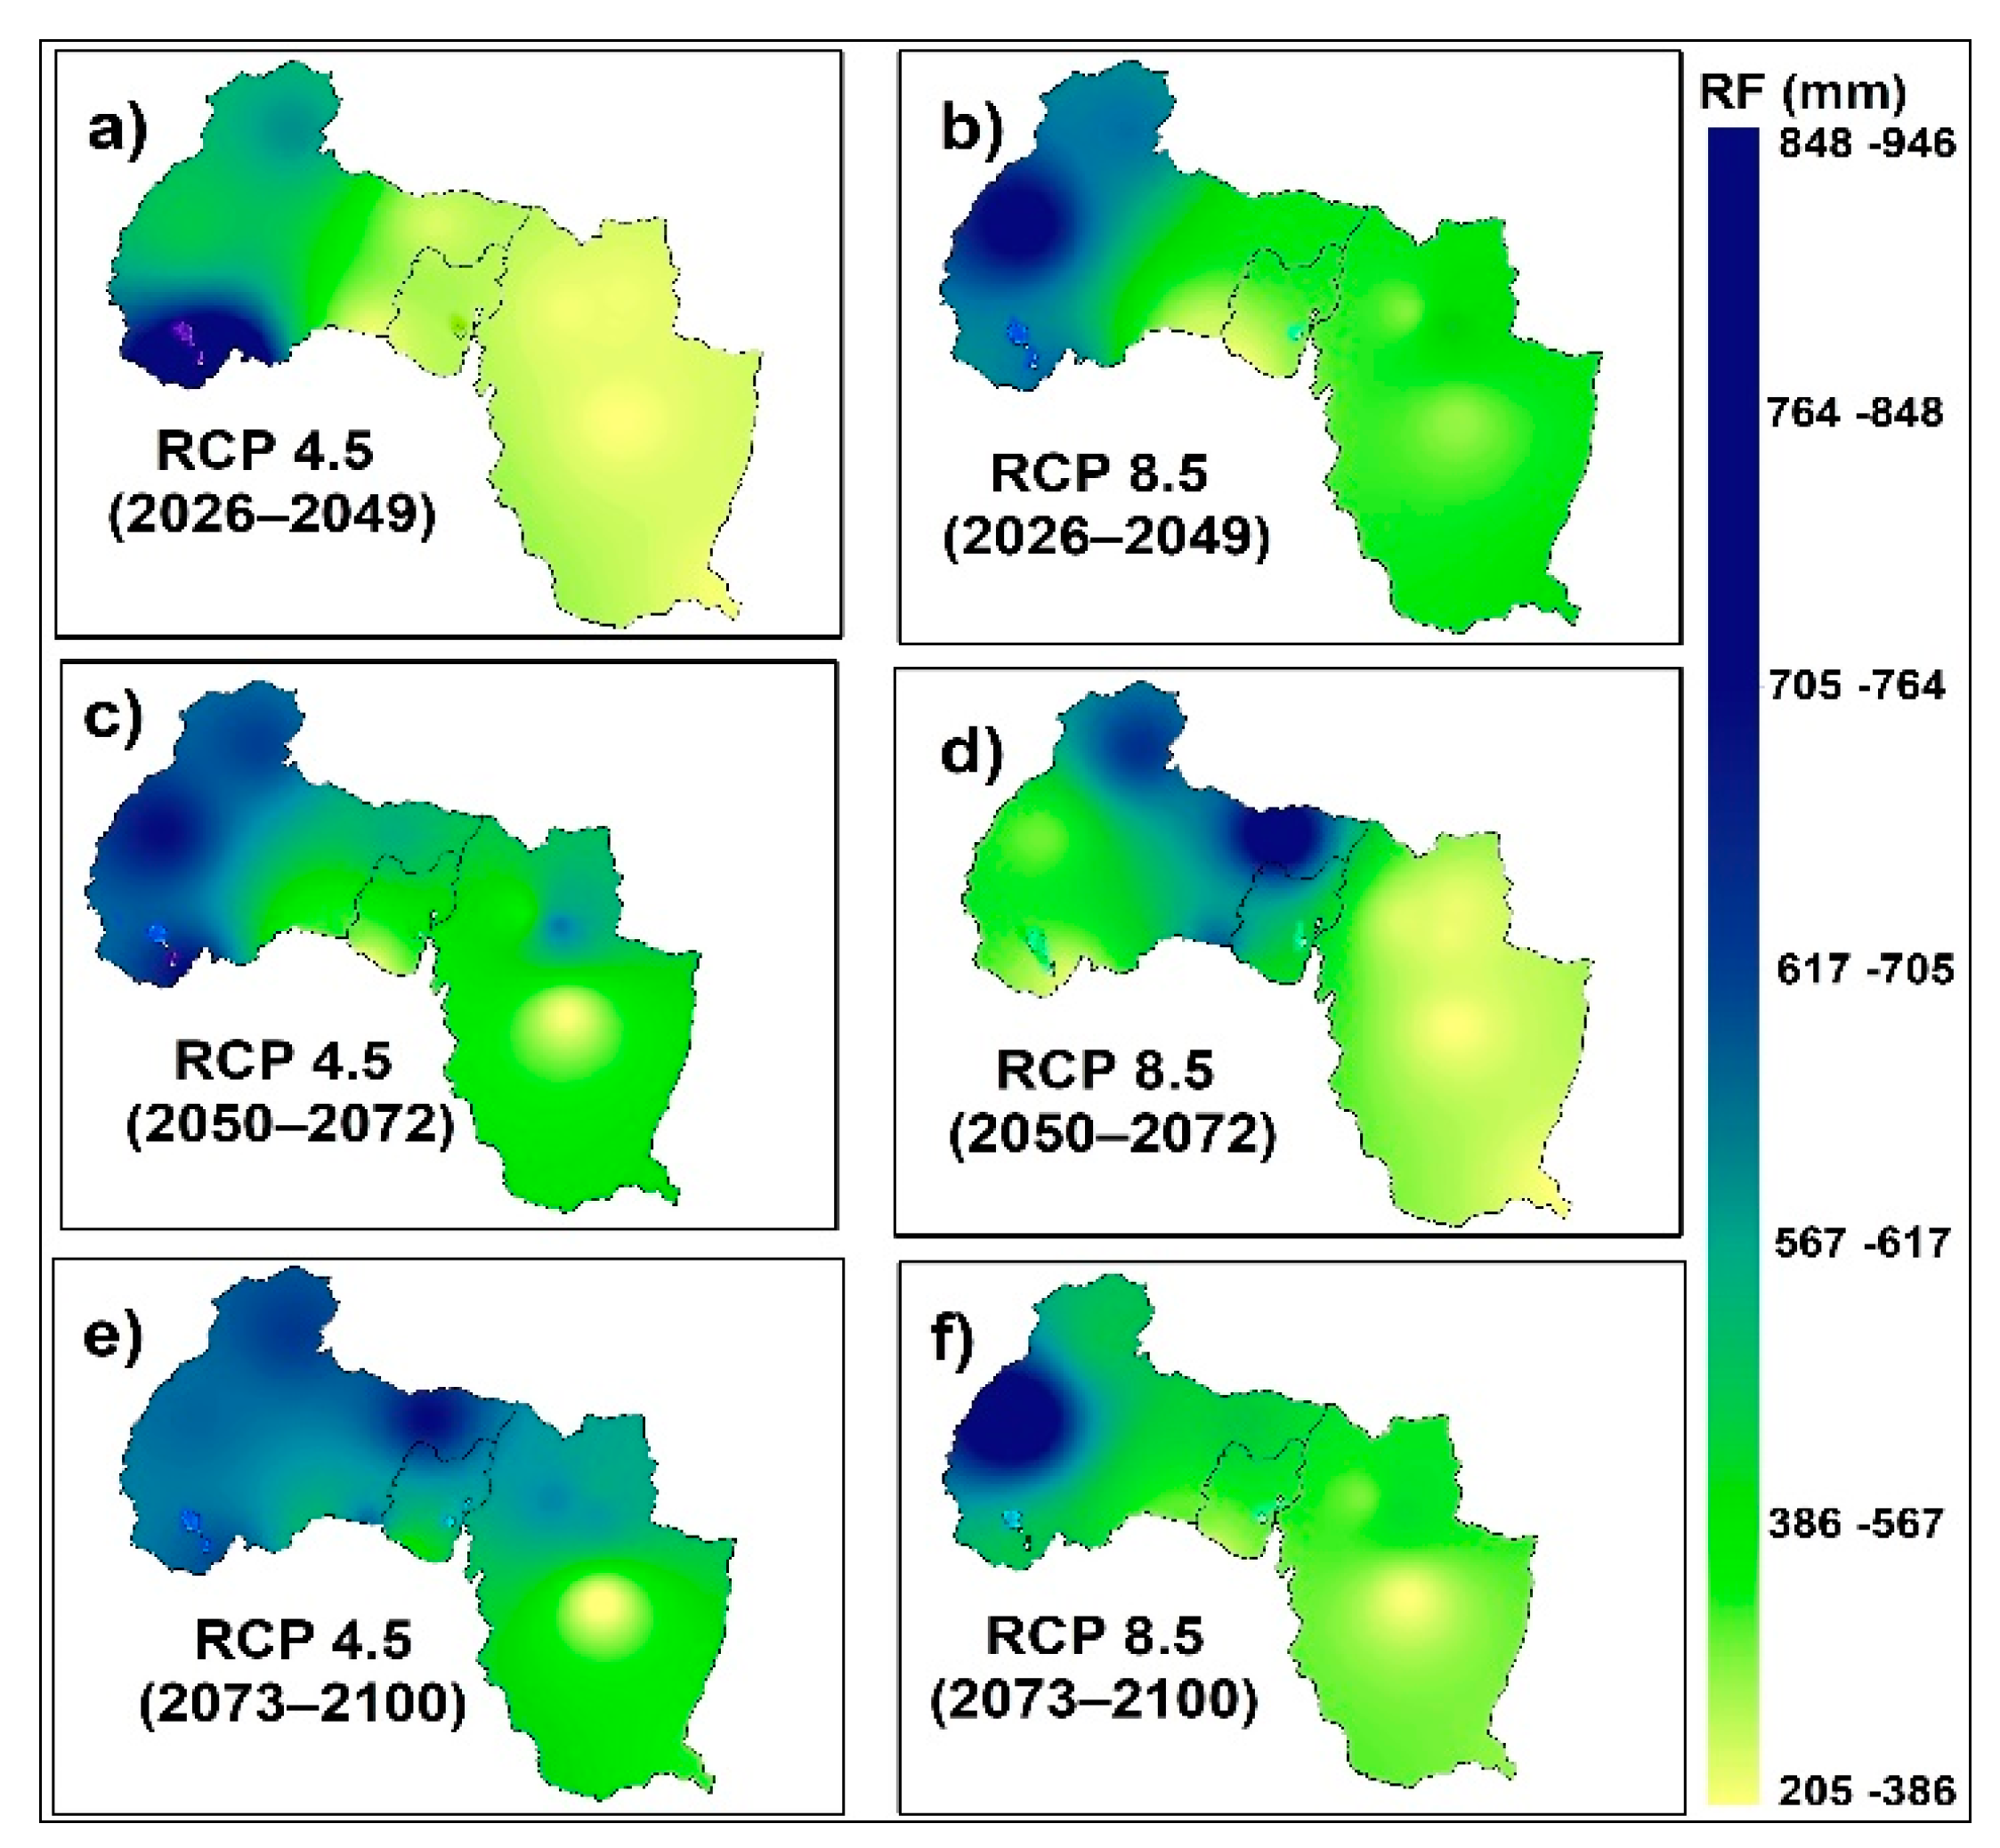
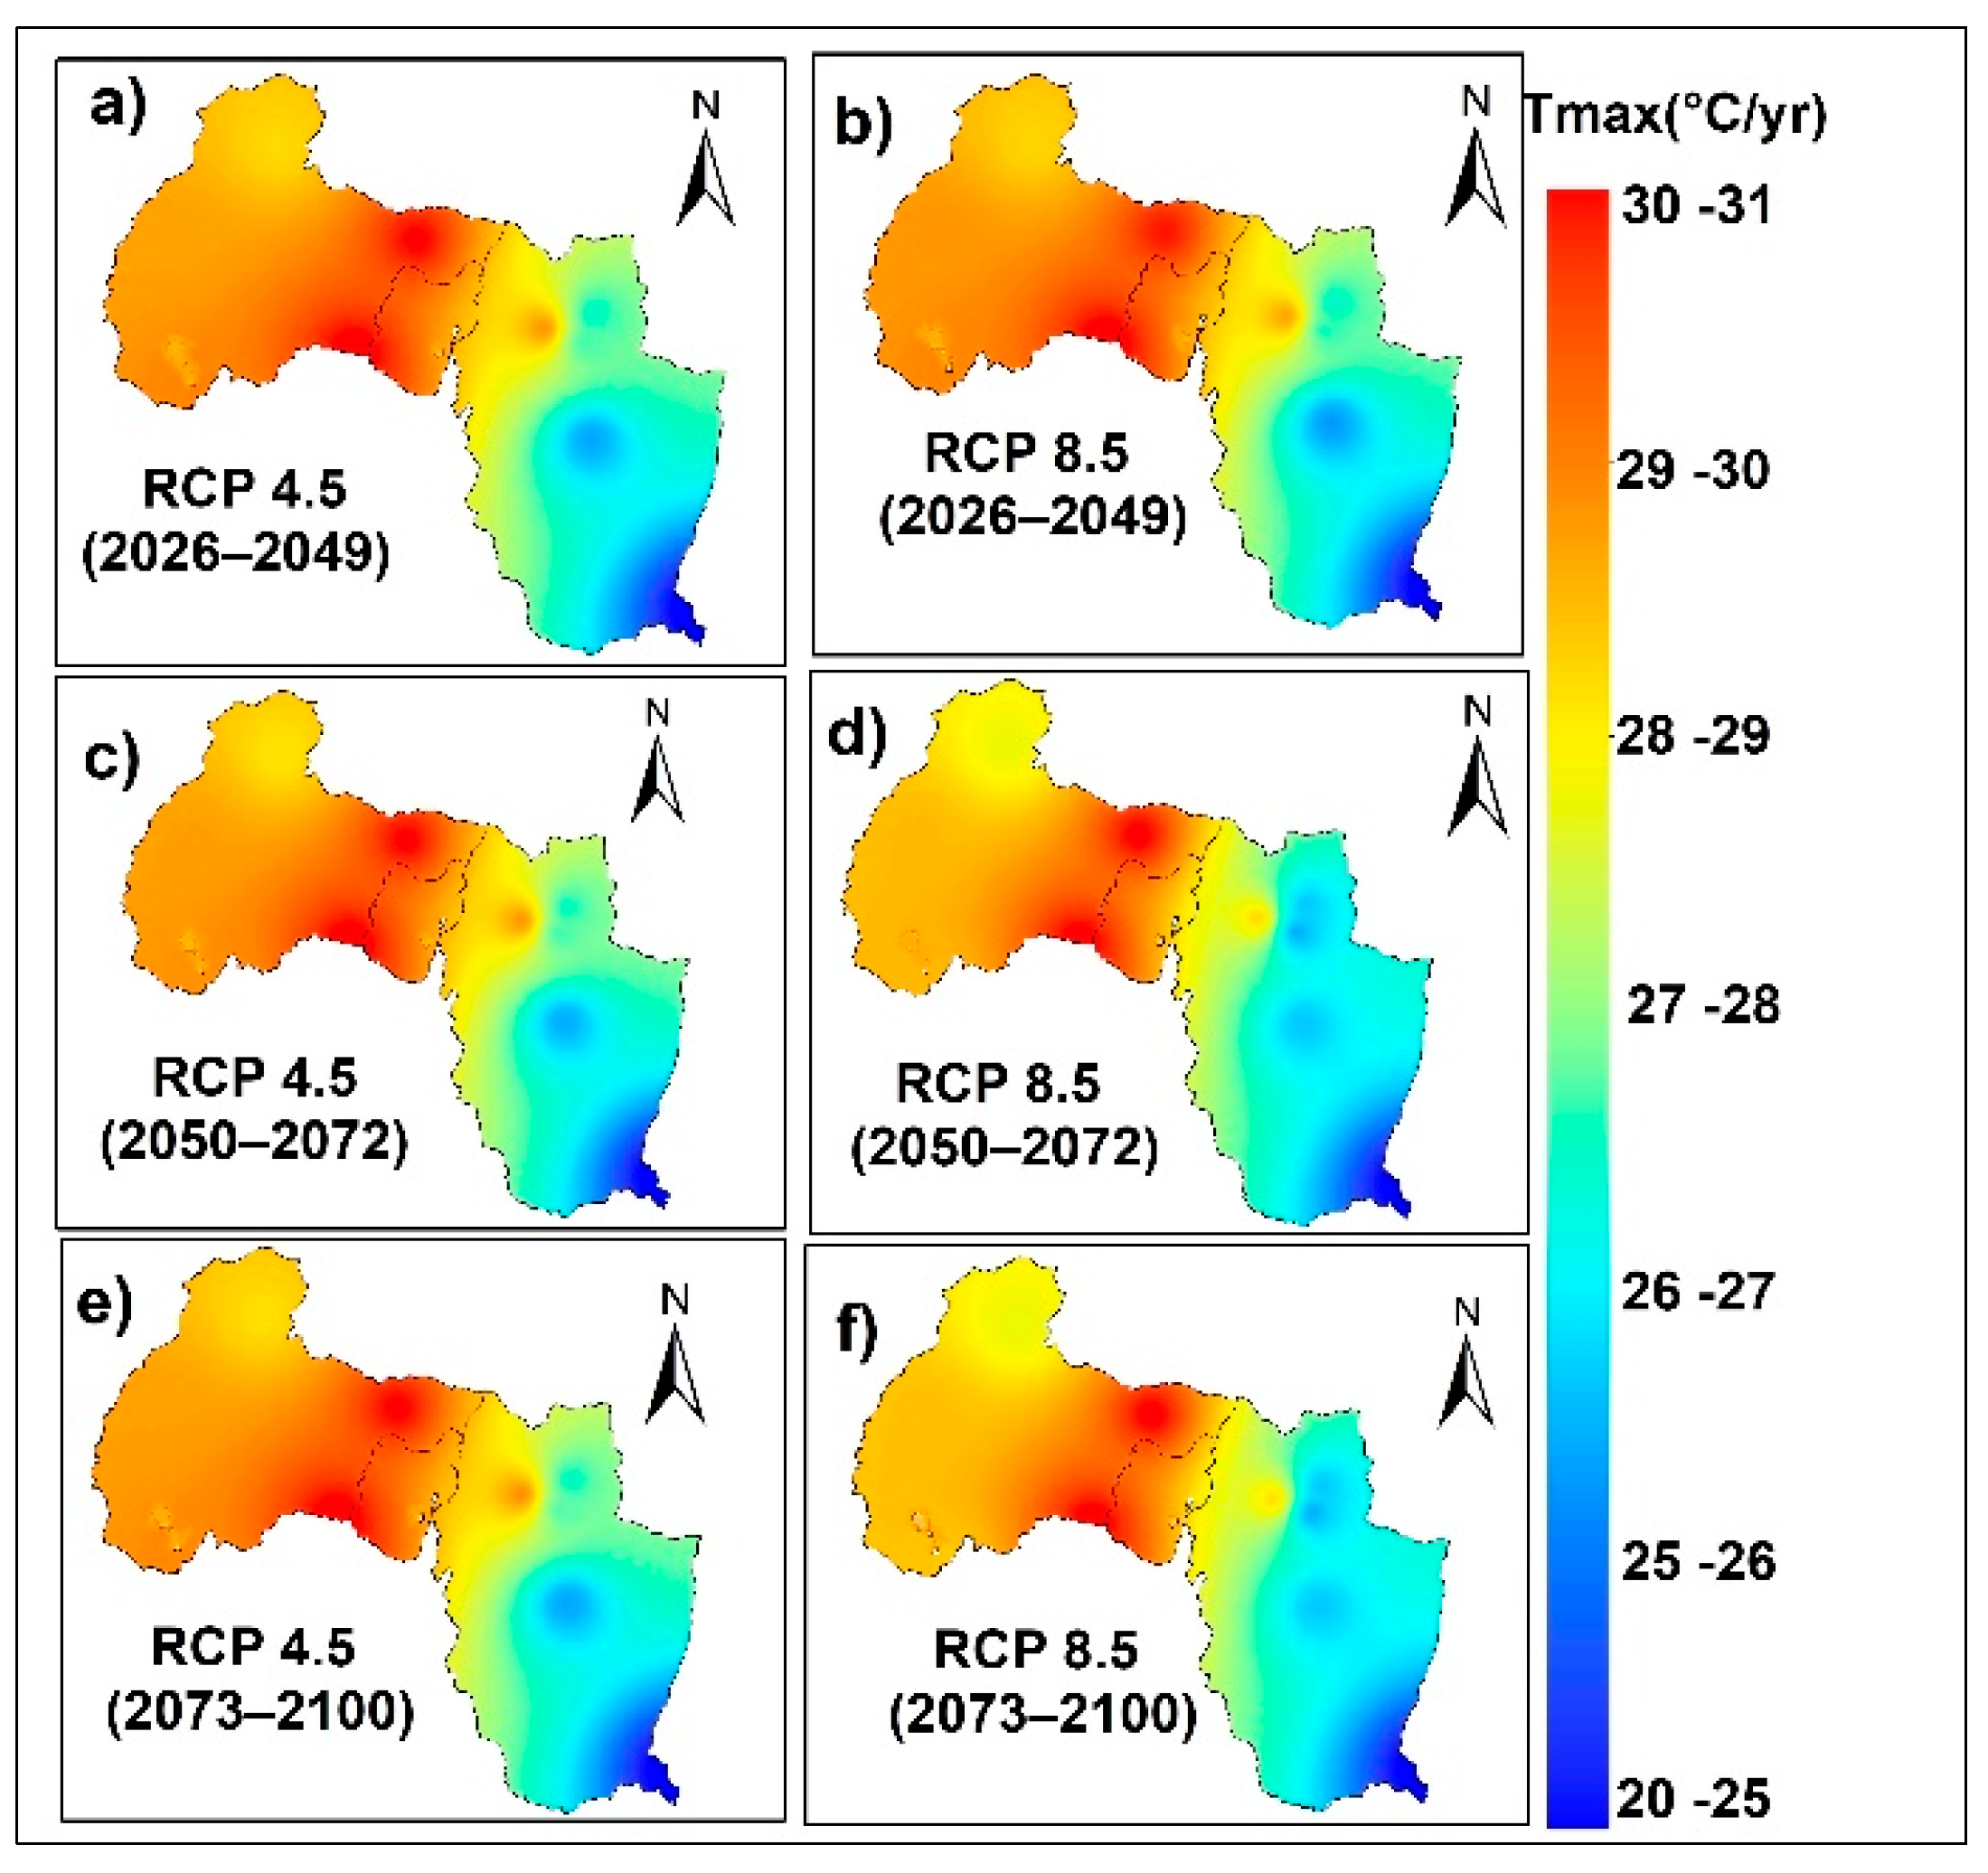
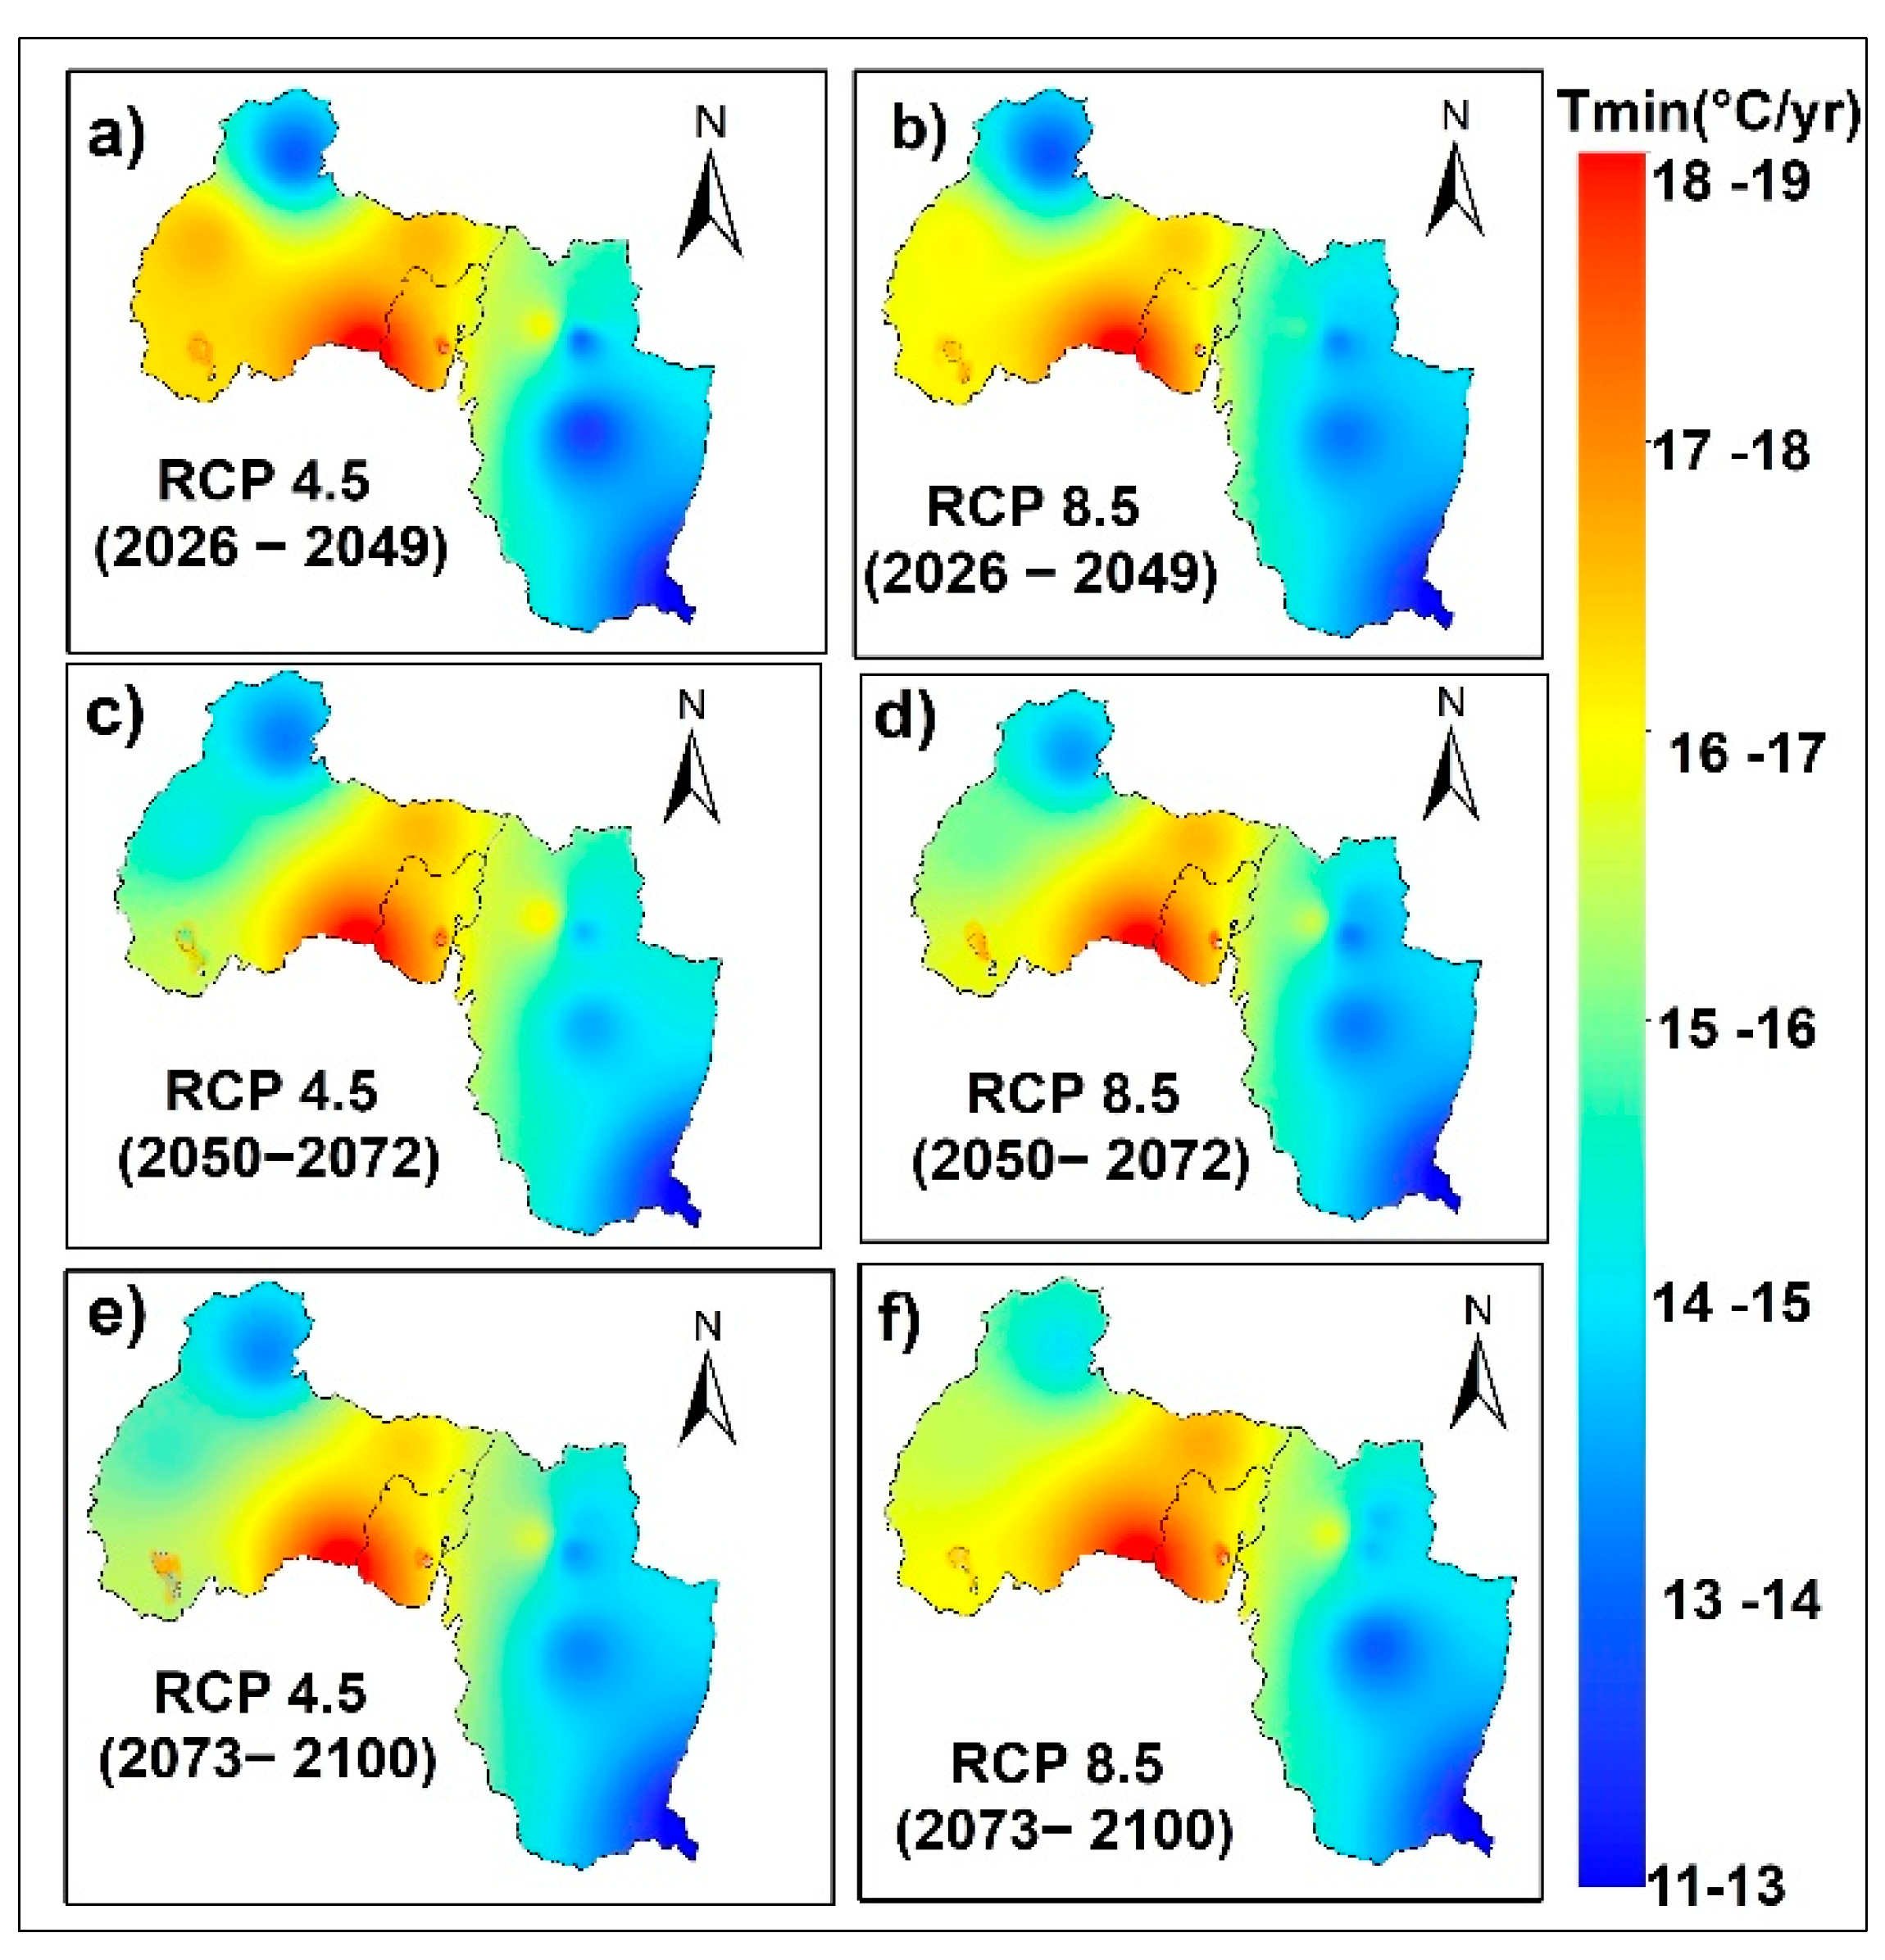
4.3.2. Spatial Distribution of Future Mean Annual Rainfall and Temperature
5. Conclusions
Author Contributions
Funding
Institutional Review Board Statement
Informed Consent Statement
Data Availability Statement
Acknowledgments
Conflicts of Interest
Appendix A

| Model→ | CNMR-CM5 | CSIRO-MK3.6 | MIP-ESM-LR | ||||||
|---|---|---|---|---|---|---|---|---|---|
| Station | RMSE (mm) | PBIAS (%) | r | RMSE (mm) | PBIAS (%) | r | RMSE (mm) | PBIAS (%) | r |
| Ziway | 27.4 | 11.2 | 0.8 | 22.0 | 29.9 | 0.4 | 40.7 | 29.6 | 0.5 |
| Meki | 27.9 | 2.8 | 0.8 | 31.2 | 12.5 | 0.5 | 28.2 | 12.8 | 0.6 |
| Arata | 31.8 | −10.8 | 0.9 | 40.6 | −11.6 | 0.5 | 37.2 | −20.3 | 0.6 |
| Butajira | 39.7 | 35.0 | 0.7 | 28.4 | −3.5 | 0.4 | 43.8 | 5.3 | 0.5 |
| Tora | 33.5 | 1.5 | 0.8 | 39.0 | −1.2 | 0.4 | 46.3 | −2.3 | 0.5 |
| Bui | 38.2 | −4.2 | 0.6 | 34.6 | 2.8 | 0.5 | 32.4 | 2.4 | 0.6 |
| Kulumsa | 9.1 | −9.0 | 1.0 | 16.1 | −1.6 | 0.4 | 44.9 | −2.8 | 0.5 |
| Assela | 26.1 | 7.8 | 0.9 | 27.4 | 12.3 | 0.5 | 47.5 | 12.0 | 0.5 |
| Sagure | 16.9 | 12.2 | 1.0 | 10.6 | 12.2 | 1.0 | 39.6 | 15.0 | 0.6 |
| Merero | 8.5 | 15.8 | 1.0 | 19.2 | 16.7 | 0.5 | 23.4 | 33.1 | 0.6 |
| Adamitulu | 16.2 | 0.0 | 0.9 | 48.6 | −9.7 | 0.4 | 35.8 | −9.5 | 0.5 |
| Model | CNMR-CM5 | CSIRO-MK3.6 | MIP-ESM-LR | ||||||
|---|---|---|---|---|---|---|---|---|---|
| Station | RSME (C°) | PBIAS (%) | r | RSME (C°) | PBIAS (%) | r | RSME (C°) | PBIAS (%) | r |
| Ziway | 1.0 | 0.3 | 0.7 | 1.1 | 0.4 | 0.7 | 1.2 | 0.4 | 0.6 |
| Meki | 1.3 | 40.1 | 0.6 | 1.3 | 28.0 | 0.6 | 1.2 | 50.2 | 0.6 |
| Arata | 1.0 | 22.3 | 0.7 | 1.1 | 22.4 | 0.7 | 1.0 | 22.3 | 0.7 |
| Butajira | 0.9 | −1.7 | 0.6 | 1.0 | −1.6 | 0.6 | 1.0 | −1.6 | 0.5 |
| Tora | 0.9 | 0.8 | 0.7 | 1.0 | 0.8 | 0.7 | 1.0 | 0.8 | 0.6 |
| Bui | 0.9 | 15.1 | 0.6 | 0.3 | 1.0 | 0.6 | 1.1 | 10.7 | 0.6 |
| Kulumsa | 1.1 | −0.9 | 0.6 | 1.1 | −0.8 | 0.6 | 1.2 | −0.9 | 0.5 |
| Assela | 1.1 | −8.8 | 0.7 | 1.1 | −8.8 | 0.7 | 1.2 | −8.8 | 0.6 |
| Sagure | 1.3 | −8.6 | 0.7 | 1.0 | −22.9 | 0.6 | 1.4 | −15.6 | 0.5 |
| Merero | 1.0 | −15.5 | 0.7 | 1.1 | −7.4 | 0.7 | 1.1 | −15.5 | 0.6 |
| Adamitulu | 1.2 | 0.0 | 0.7 | 1.2 | 6.7 | 0.7 | 1.2 | 0.0 | 0.6 |
| CNRM-CM5 | CSIRO-MK3.6 | MIP-ESM-LR | ||||
|---|---|---|---|---|---|---|
| Station↓ Test→ | MK Trend | Sen’s Slope | MK Trend | Sen’s Slope | MK Trend | Sen’s Slope |
| Ziway | 2.01 * | 0.03 | 2.15 * | 0.03 | 2.32 ** | 0.04 |
| Meki | 2.21 * | 0.03 | 2.07 * | 0.03 | 2.32 ** | 0.03 |
| Arata | 2.31 * | 0.03 | 2.29 * | 0.03 | 2.43 ** | 0.03 |
| Butajira | 2.1 * | 0.03 | 2.20 * | 0.02 | 2.69 ** | 0.05 |
| Tora | 1.56 | 0.02 | 2.12 * | 0.02 | 2.69 ** | 0.05 |
| Bui | 2.20 * | 0.03 | 2.15 * | 0.02 | 2.27 ** | 0.03 |
| Kulumsa | 2.20 * | 0.03 | 2.91 ** | 0.05 | 2.32 ** | 0.03 |
| Assela | 2.9 ** | 0.05 | 2.05 * | 0.02 | 2.38 ** | 0.03 |
| Sagure | 2.65 ** | 0.04 | 2.07 * | 0.02 | 2.27 ** | 0.03 |
| Merero | 2.80 ** | 0.05 | 2.16 * | 0.02 | 2.51 ** | 0.03 |
| Adamitulu | 2.50 ** | 0.05 | 2.20 * | 0.02 | 2.32 ** | 0.03 |
| Model→ | CNMR-CM5 | CSIRO-MK3.6 | MIP-ESM-LR | ||||||
|---|---|---|---|---|---|---|---|---|---|
| Station | RSME (C°) | PBIAS (%) | r | RSME (C°) | PBIAS (%) | r | RSME (C°) | PBIAS (%) | r |
| Ziway | 1.1 | 21.3 | 0.8 | 1.3 | 21.3 | 0.7 | 1.2 | 21.3 | 0.7 |
| Meki | 1.4 | 37.3 | 0.7 | 1.5 | 37.1 | 0.6 | 1.8 | 12.2 | 0.4 |
| Arata | 1.2 | −2.1 | 0.7 | 1.2 | −2.1 | 0.6 | 1.0 | −2.1 | 0.7 |
| Butajira | 0.9 | −7.8 | 0.6 | 0.8 | −18.3 | 0.7 | 1.0 | −18.3 | 0.6 |
| Tora | 0.8 | 2.2 | 0.7 | 0.8 | 2.2 | 0.7 | 1.0 | 2.2 | 0.4 |
| Bui | 1.2 | −2.3 | 0.7 | 0.8 | 2.2 | 0.7 | 1.0 | −2.2 | 0.7 |
| Kulumsa | 1.1 | −10.8 | 0.6 | 1.5 | −7.4 | 0.5 | 1.1 | 12.1 | 0.7 |
| Assela | 1.0 | 1.1 | 0.7 | 1.0 | −20.4 | 0.7 | 1.2 | −11.8 | 0.8 |
| Sagure | 0.9 | −7.4 | 0.7 | 1.5 | −43.9 | 0.5 | 1.0 | −27.1 | 0.6 |
| Merero | 0.9 | −3.2 | 0.7 | 1.4 | −44.6 | 0.6 | 1.0 | −44.8 | 0.6 |
| Adamitulu | 1.0 | 0.0 | 0.8 | 1.0 | 0.0 | 0.8 | 1.1 | 0.0 | 0.6 |
| CNRM-CM5 | CSIRO-MK3.6 | MIP-ESM-LR | ||||
|---|---|---|---|---|---|---|
| Station↓ Test→ | MK Trend | Sen’s Slope | MK Trend | Sen’s Slope | MK Trend | Sen’s Slope |
| Ziway | 2.85 ** | 0.02 | 2.01 * | 0.03 | 2.32 * | 0.03 |
| Meki | 1.74 | 0.02 | 1.95 | 0.02 | 2.17 * | 0.03 |
| Arata | 2.32 * | 0.03 | 2.11 * | 0.02 | 2.3 * | 0.03 |
| Butajira | 2.93 ** | 0.02 | 3.16 ** | 0.04 | 2.75 ** | 0.04 |
| Tora | 2.48 * | 0.02 | 2.69 ** | 0.03 | 2.67 ** | 0.04 |
| Bui | 2.48 * | 0.02 | 3.06 ** | 0.04 | 2.43 * | 0.03 |
| Kulumsa | 1.69 | 0.01 | 2.01 * | 0.02 | 1.42 | 0.01 |
| Assela | 1.58 | 0.01 | 2.11 * | 0.02 | 2.34 * | 0.03 |
| Sagure | 1.69 | 0.01 | 2.91 ** | 0.04 | 2.32 * | 0.03 |
| Merero | 1.74 | 0.01 | 2.64 ** | 0.03 | 2.32 * | 0.03 |
| Adamitulu | 1.85 | 0.01 | 2.06 * | 0.03 | 2.32 * | 0.03 |
| Model→ | CNMR-CM5 | CSIRO-MK3.6 | MIP-ESM-LR | |||||||||
|---|---|---|---|---|---|---|---|---|---|---|---|---|
| Station↓ Test→ | MK RCP 4.5 | Sen’s RCP 4.5 | MK RCP 8.5 | Sen’s RCP 8.5 | MK RCP 4.5 | Sen’s RCP 4.5 | MK RCP 8.5 | Sen’s RCP 8.5 | MK RCP 4.5 | Sen’s RCP 4.5 | MK RCP 8.5 | Sen’s RCP 8.5 |
| Ziway | 0.68 | 0.35 | 1.56 | 0.38 | 2.69 ** | 2.16 | 1.42 | 1.91 | −0.32 | −0.08 | 2.17 * | 0.51 |
| Meki | 0.30 | 0.46 | 1.70 | 0.71 | 2.59 ** | 2.33 | 1.47 | 3.29 | −1.17 | −0.27 | 0.82 | 0.53 |
| Arata | 0.49 | 0.47 | 1.61 | 0.64 | 2.64 ** | 2.73 | 1.14 | 1.56 | −0.87 | −0.19 | 1.10 | 0.64 |
| Butajira | 0.35 | 0.43 | 1.47 | 0.48 | 2.17 * | 1.74 | 1.19 | 1.05 | −0.77 | −0.23 | 1.00 | 0.46 |
| Tora | −0.12 | −0.10 | 2.17 * | 1.06 | 1.89 | 1.75 | 1.65 | 1.98 | −1.17 | −0.26 | 0.63 | 0.33 |
| Bui | −0.07 | −0.23 | 2.03 * | 1.04 | 1.99 | 3.60 | 1.33 | 1.54 | −0.82 | −0.30 | 0.58 | 0.53 |
| Kulumsa | −0.30 | −0.30 | 1.75 | 0.76 | 2.17 * | 2.23 | 1.24 | 1.23 | −0.77 | −0.17 | 0.72 | 0.34 |
| Assela | 0.30 | 0.41 | 1.33 | 1.20 | 2.36 * | 1.89 | 1.19 | 1.20 | −1.41 | −0.36 | 0.72 | 0.45 |
| Sagure | 0.16 | 0.26 | 1.33 | 0.55 | 2.17 * | 1.76 | 0.82 | 0.44 | −0.92 | −0.25 | 1.19 | 1.20 |
| Meraro | 0.30 | 0.20 | 1.28 | 0.30 | 1.89 | 1.33 | 1.33 | 1.37 | −1.27 | −0.22 | 0.82 | 0.46 |
| Adamitulu | 0.21 | 0.16 | 0.49 | 0.36 | 2.73 ** | 1.86 | −0.03 | −0.01 | −0.07 | −0.05 | 0.86 | 0.55 |
| Model→ | CNMR-CM5 | CSIROM-MK3.6 | MIP-ESM-LR | |||||||||
|---|---|---|---|---|---|---|---|---|---|---|---|---|
| Station↓ Test→ | MK RCP 4.5 | Sen’s RCP 4.5 | MK RCP 8.5 | Sen’s RCP 8.5 | MK RCP 4.5 | Sen’s RCP 4.5 | MK RCP 8.5 | Sen’s RCP 8.5 | MK RCP 4.5 | Sen’s RCP 4.5 | MK RCP 8.5 | Sen’s RCP 8.5 |
| Ziway | −1.45 | −1.03 | 1.28 | 0.58 | 1.28 | 0.91 | 0.62 | 1.12 | 0.35 | 0.07 | 1.50 | 0.40 |
| Meki | −1.63 | −1.51 | 1.06 | 0.71 | 0.88 | 1.02 | 1.15 | 2.52 | −0.93 | −0.33 | 1.63 | 0.88 |
| Arata | −1.50 | −1.86 | 1.10 | 0.96 | 1.37 | 2.77 | 0.62 | 0.76 | 0.09 | 0.05 | 1.59 | 0.99 |
| Butajira | −1.32 | −1.08 | 1.23 | 0.52 | 1.19 | 1.06 | 1.85 | 2.14 | 0.35 | 0.10 | 1.72 | 0.81 |
| Tora | −1.45 | −2.06 | 0.93 | 0.68 | 1.54 | 1.12 | 1.63 | 2.66 | −0.40 | −0.15 | 1.16 | 1.03 |
| Bui | −1.81 | −3.14 | 0.84 | 0.65 | 1.76 | 2.27 | 0.62 | 1.00 | −2.47 | −1.10 | 1.45 | 0.99 |
| Kulumsa | −1.90 | −2.53 | 0.75 | 0.58 | 0.88 | 0.72 | 0.48 | 0.73 | −2.60 | −0.92 | 1.67 | 0.85 |
| Assela | −0.79 | −0.57 | 0.84 | 0.44 | 1.90 | 1.08 | 0.35 | 0.41 | 0.02 | 0.01 | 1.63 | 0.76 |
| Sagure | −0.97 | −0.79 | 1.28 | 0.63 | 1.28 | 0.95 | 0.04 | 0.03 | −0.79 | −0.25 | 0.35 | 0.41 |
| Meraro | −0.66 | −0.37 | 1.06 | 0.46 | 0.62 | 0.41 | 1.37 | 0.93 | −0.88 | −0.26 | 1.32 | 0.52 |
| Adamitulu | −0.93 | −0.33 | 0.11 | 0.12 | 1.68 | 1.38 | 0.01 | −0.01 | −0.71 | −0.15 | 0.04 | 0.03 |
| Model→ | CNMR-CM5 | CSIROM-MK3.6 | MIP-ESM-LR | |||||||||
|---|---|---|---|---|---|---|---|---|---|---|---|---|
| Station↓ Test→ | MK RCP 4.5 | Sen’s RCP 4.5 | MK RCP 8.5 | Sen’s RCP 8.5 | MK RCP 4.5 | Sen’s RCP 4.5 | MK RCP 8.5 | Sen’s RCP 8.5 | MK RCP 4.5 | Sen’s RCP 4.5 | MK RCP 8.5 | Sen’s RCP 8.5 |
| Ziway | 2.45 * | 0.04 | 2.15 * | 0.03 | 4.52 *** | 0.09 | 4.28 *** | 0.09 | 0.02 | 0.01 | 3.00 ** | 0.04 |
| Meki | 2.07 * | 0.03 | 2.07 * | 0.03 | 4.56 *** | 0.09 | 4.09 *** | 0.09 | 0.03 | 0.01 | 2.91 ** | 0.04 |
| Arata | 2.08 * | 0.03 | 2.29 * | 0.03 | 4.54 *** | 0.09 | 4.27 *** | 0.09 | 0.03 | 0.01 | 2.95 ** | 0.04 |
| Butajira | 2.08 * | 0.03 | 2.20 * | 0.02 | 4.57 *** | 0.09 | 4.27 *** | 0.09 | 0.02 | 0.01 | 3.04 ** | 0.04 |
| Tora | 2.36 * | 0.04 | 2.12 * | 0.02 | 4.67 *** | 0.08 | 4.40 *** | 0.08 | 0.02 | 0.01 | 2.86 ** | 0.04 |
| Bui | 2.07 * | 0.03 | 2.15 * | 0.02 | 4.63 *** | 0.08 | 4.4 *** | 0.08 | 0.02 | 0.01 | 2.73 ** | 0.03 |
| Kulumsa | 2.08 * | 0.03 | 2.91 ** | 0.03 | 4.52 ** | 0.09 | 4.28 *** | 0.09 | 0.02 | 0.01 | 2.87 ** | 0.04 |
| Assela | 4.09 *** | 0.05 | 2.05 * | 0.02 | 4.50 ** | 0.09 | 4.27 *** | 0.09 | 0.02 | 0.01 | 3.04 ** | 0.04 |
| Sagure | 4.09 *** | 0.05 | 2.07 * | 0.02 | 4.32 *** | 0.08 | 4.26 *** | 0.09 | 0.02 | 0.01 | 2.95 ** | 0.04 |
| Meraro | 4.09 *** | 0.04 | 2.16 * | 0.02 | 4.40 *** | 0.09 | 4.28 *** | 0.09 | 0.02 | 0.01 | 3.09 ** | 0.04 |
| Adamitulu | 4.13 *** | 0.05 | 2.20 * | 0.02 | 4.63 *** | 0.09 | 4.14 *** | 0.08 | 0.01 | 0.01 | 3.37 *** | 0.07 |
| Model→ | CNMR-CM5 | CSIROM-MK3.6 | MIP-ESM-LR | |||||||||
|---|---|---|---|---|---|---|---|---|---|---|---|---|
| Station↓ Test→ | MK RCP 4.5 | Sen’s RCP 4.5 | MK RCP 8.5 | Sen’s RCP 8.5 | MK RCP 4.5 | Sen’s RCP 4.5 | MK RCP 8.5 | Sen’s RCP 8.5 | MK RCP 4.5 | Sen’s RCP 4.5 | MK RCP 8.5 | Sen’s RCP 8.5 |
| Ziway | 3.67 *** | 0.07 | 2.78 ** | 0.03 | 4.63 *** | 0.07 | 4.63 *** | 0.07 | 1.51 | 0.02 | 1.90 | 0.03 |
| Meki | 3.62 *** | 0.07 | 2.73 ** | 0.03 | 4.63 *** | 0.07 | 4.63 *** | 0.07 | 1.51 | 0.03 | 1.90 | 0.03 |
| Arata | 3.71 *** | 0.07 | 2.5 * | 0.03 | 4.63 *** | 0.07 | 4.63 *** | 0.07 | 1.56 | 0.03 | 1.81 | 0.03 |
| Butajira | 3.71 *** | 0.06 | 2.47 * | 0.03 | 4.63 *** | 0.07 | 4.63 *** | 0.07 | 1.56 | 0.02 | 1.85 | 0.03 |
| Tora | 3.20 *** | 0.06 | 3.17 ** | 0.04 | 5.47 *** | 0.06 | 4.72 *** | 0.07 | 1.66 | 0.02 | 2.25 | 0.04 |
| Bui | 3.29 *** | 0.05 | 3.31 *** | 0.04 | 5.47 *** | 0.07 | 4.63 *** | 0.07 | 1.71 | 0.02 | 2.20 | 0.03 |
| Kulumsa | 3.34 *** | 0.06 | 3.22 ** | 0.04 | 4.63 *** | 0.07 | 4.63 *** | 0.07 | 1.51 | 0.02 | 1.98 | 0.03 |
| Assela | 3.67 *** | 0.06 | 2.30 * | 0.03 | 4.63 *** | 0.07 | 4.63 *** | 0.07 | 1.51 | 0.02 | 1.90 | 0.03 |
| Sagure | 3.67 *** | 0.06 | 2.47 * | 0.03 | 4.63 *** | 0.07 | 4.63 *** | 0.07 | 1.56 | 0.02 | 1.85 | 0.03 |
| Meraro | 3.62 *** | 0.07 | 2.78 ** | 0.03 | 4.63 *** | 0.07 | 4.38 *** | 0.06 | 1.61 | 0.02 | 0.17 | 0.00 |
| Adamitulu | 3.62 *** | 0.08 | 3.57 *** | 0.05 | 4.38 *** | 0.06 | 4.47 ** | 0.07 | 0.87 | 0.01 | 2.42* | 0.05 |
| Model→ | CNMR-CM5 | CSIROM-MK3.6 | MIP-ESM-LR | |||||||||
|---|---|---|---|---|---|---|---|---|---|---|---|---|
| Station↓ Test→ | MK RCP 4.5 | Sen’s RCP 4.5 | MK RCP 8.5 | Sen’s RCP 8.5 | MK RCP 4.5 | Sen’s RCP 4.5 | MK RCP 8.5 | Sen’s RCP 8.5 | MK RCP 4.5 | Sen’s RCP 4.5 | MK RCP 8.5 | Sen’s RCP 8.5 |
| Ziway | 3.89 *** | 0.07 | 3.45 *** | 0.05 | 4.14 *** | 0.08 | 4.14 *** | 0.08 | 2.46 * | 0.04 | 1.96 | 0.04 |
| Meki | 4.29 *** | 0.07 | 3.89 *** | 0.06 | 4.12 *** | 0.08 | 4.14 *** | 0.08 | 2.36 * | 0.04 | 1.96 | 0.04 |
| Arata | 2.26 * | 0.04 | 2.85 ** | 0.03 | 4.14 *** | 0.08 | 4.09 *** | 0.08 | 2.31 * | 0.04 | 2.01 * | 0.04 |
| Butajira | 1.51 | 0.03 | 1.17 | 0.02 | 4.14 *** | 0.08 | 4.14 *** | 0.08 | 2.36 * | 0.04 | 2.01 * | 0.04 |
| Tora | 0.07 | 0.00 | 2.00 * | 0.01 | 4.78 *** | 0.07 | 4.79 *** | 0.07 | 2.86 ** | 0.04 | 1.71 | 0.04 |
| Bui | 0.05 | 0.00 | 1.17 | 0.01 | 4.78 *** | 0.07 | 4.09 *** | 0.08 | 2.80 ** | 0.04 | 1.76 | 0.04 |
| Kulumsa | 1.61 | 0.04 | 2.41 * | 0.02 | 4.14 *** | 0.08 | 4.14 *** | 0.08 | 2.46 * | 0.04 | 1.91 | 0.04 |
| Assela | 1.12 | 0.02 | 2.80 ** | 0.02 | 4.14 *** | 0.08 | 4.14 *** | 0.08 | 2.41 * | 0.04 | 1.96 | 0.04 |
| Sagure | 1.17 | 0.03 | 2.65 ** | 0.02 | 4.09 *** | 0.08 | 4.14 *** | 0.08 | 2.42 * | 0.04 | 2.01 * | 0.04 |
| Meraro | 1.12 | 0.02 | 2.80 ** | 0.03 | 4.14 *** | 0.08 | 4.39 *** | 0.07 | 2.31 * | 0.04 | 1.28 | 0.04 |
| Adamitulu | 2.25 * | 0.05 | 3.25 ** | 0.04 | 4.39 *** | 0.07 | 4.79 *** | 0.07 | 3.20 ** | 0.06 | 2.21 * | 0.06 |
| Model→ | CNMR-CM5 | CSIROM-MK3.6 | MIP-ESM-LR | |||||||||
|---|---|---|---|---|---|---|---|---|---|---|---|---|
| Station↓ Test→ | MK RCP 4.5 | Sen’s RCP 4.5 | MK RCP 8.5 | Sen’s RCP 8.5 | MK RCP 4.5 | Sen’s RCP 4.5 | MK RCP 8.5 | Sen’s RCP 8.5 | MK RCP 4.5 | Sen’s RCP 4.5 | MK RCP 8.5 | Sen’s RCP 8.5 |
| Ziway | 1.28 | 0.02 | 4.12 *** | 0.02 | 4.58 *** | 0.10 | 4.20 *** | 0.09 | 1.14 | 0.02 | 3.61 *** | 0.05 |
| Meki | 1.00 | 0.02 | 4.30 *** | 0.02 | 4.63 *** | 0.10 | 4.6 *** | 0.10 | 1.14 | 0.02 | 3.60 *** | 0.05 |
| Arata | 1.03 | 0.02 | 4.52 *** | 0.02 | 4.65 *** | 0.09 | 4.18 *** | 0.09 | 1.12 | 0.02 | 3.53 *** | 0.05 |
| Butajira | 1.00 | 0.02 | 4.54 *** | 0.02 | 4.56 *** | 0.10 | 4.18 *** | 0.09 | 1.05 | 0.01 | 3.57 *** | 0.05 |
| Tora | 1.47 | 0.03 | 4.24 *** | 0.02 | 4.14 *** | 0.09 | 4.14 *** | 0.09 | 0.72 | 0.01 | 3.26 ** | 0.05 |
| Bui | 0.98 | 0.02 | 4.14 *** | 0.02 | 4.14 *** | 0.09 | 4.14 *** | 0.09 | 0.82 | 0.01 | 3.35 *** | 0.05 |
| Kulumsa | 1.03 | 0.02 | 4.46 *** | 0.03 | 4.56 *** | 0.10 | 4.18 *** | 0.09 | 1.14 | 0.01 | 3.48 *** | 0.04 |
| Assela | 1.75 | 0.03 | 4.58 *** | 0.02 | 4.58 *** | 0.10 | 4.19 *** | 0.09 | 1.10 | 0.01 | 3.61 *** | 0.04 |
| Sagure | 1.75 | 0.03 | 4.09 ** | 0.02 | 4.09 ** | 0.08 | 4.17 *** | 0.09 | 1.10 | 0.02 | 3.57 *** | 0.04 |
| Meraro | 1.70 | 0.03 | 4.54 *** | 0.02 | 4.54 *** | 0.10 | 4.18 *** | 0.09 | 1.10 | 0.01 | 3.61 *** | 0.05 |
| Adamitulu | 1.56 | 0.03 | 4.62 *** | 0.02 | 4.62 *** | 0.10 | 4.06 *** | 0.08 | 1.56 | 0.02 | 4.18 *** | 0.05 |
| Model→ | CNMR-CM5 | CSIROM-MK3.6 | MIP-ESM-LR | |||||||||
|---|---|---|---|---|---|---|---|---|---|---|---|---|
| Station↓ Test→ | MK RCP 4.5 | Sen’s RCP 4.5 | MK RCP 8.5 | Sen’s RCP 8.5 | MK RCP 4.5 | Sen’s RCP 4.5 | MK RCP 8.5 | Sen’s RCP 8.5 | MK RCP 4.5 | Sen’s RCP 4.5 | MK RCP 8.5 | Sen’s RCP 8.5 |
| Ziway | 2.63 ** | 0.08 | 2.59 ** | 0.06 | 4.43 *** | 0.03 | 4.76 *** | 0.10 | 1.51 | 0.02 | 2.78 ** | 0.05 |
| Meki | 2.63 ** | 0.08 | 2.59 ** | 0.06 | 3.95 *** | 0.05 | 4.76 *** | 0.10 | 1.51 | 0.03 | 2.78 ** | 0.05 |
| Arata | 2.57 * | 0.08 | 2.64 ** | 0.06 | 3.45 *** | 0.07 | 4.76 *** | 0.10 | 1.56 | 0.03 | 2.73 ** | 0.05 |
| Butajira | 2.63 ** | 0.08 | 2.69 ** | 0.06 | 3.20 ** | 0.04 | 4.76 *** | 0.10 | 1.56 | 0.02 | 2.68 ** | 0.04 |
| Tora | 2.69 ** | 0.09 | 2.36 * | 0.06 | 1.56 | 0.02 | 4.89 *** | 0.09 | 1.66 | 0.02 | 2.82 ** | 0.06 |
| Bui | 2.69 ** | 0.07 | 2.31 * | 0.05 | 1.60 | 0.01 | 4.76 *** | 0.10 | 1.71 | 0.02 | 2.60 ** | 0.05 |
| Kulumsa | 2.63 ** | 0.09 | 2.31 * | 0.06 | 2.90 ** | 0.04 | 4.76 *** | 0.10 | 1.51 | 0.02 | 2.73 ** | 0.05 |
| Assela | 2.6 ** | 0.08 | 2.69 ** | 0.06 | 3.1 ** | 0.05 | 4.76 *** | 0.10 | 1.51 | 0.02 | 2.60 ** | 0.04 |
| Sagure | 2.6 ** | 0.08 | 2.69 ** | 0.06 | 3.62 *** | 0.07 | 4.76 *** | 0.10 | 1.56 | 0.02 | 2.64 ** | 0.04 |
| Meraro | 2.6 ** | 0.08 | 2.64 ** | 0.06 | 3.37 *** | 0.04 | 4.98 *** | 0.08 | 1.61 | 0.02 | 1.03 | 0.00 |
| Adamitulu | 2.63 ** | 0.10 | 2.54 | 0.07 | 2.52 ** | 0.04 | 4.89 *** | 0.09 | 0.87 | 0.01 | 3.44 *** | 0.07 |
References
- Wilby, R.L.; Dawson, C.W.; Barrow, E.M. SDSM—A decision support tool for the assessment of regional climate change impacts. Environ. Model. Softw. 2002, 17, 145–157. [Google Scholar] [CrossRef]
- Bonebrake, T.C.; Mastrandrea, M.D. Tolerance adaptation and precipitation changes complicate latitudinal patterns of climate change impacts. Proc. Natl. Acad. Sci. USA 2010, 107, 12581–12586. [Google Scholar] [CrossRef] [PubMed] [Green Version]
- Hanjra, M.A.; Ferede, T.; Gutta, D.G. Reducing poverty in sub-Saharan Africa through investments in water and other priorities. Agric. Water Manag. 2009, 96, 1062–1070. [Google Scholar] [CrossRef]
- Carpenter, S.R.; Fisher, S.G.; Grimm, N.B.; Kitchell, J.F. Global Change and Freshwater Ecosystems. Annu. Rev. Ecol. Syst. 1992, 23, 119–139. [Google Scholar] [CrossRef]
- Kundzewicz, Z.W.; Mata, L.J.; Arnell, N.W.; Döll, P.; Jimenez, B.; Miller, K.; Oki, T.; Şen, Z.; Shiklomanov, I. The implications of projected climate change for freshwater resources and their management. Hydrol. Sci. J. 2008, 53, 3–10. [Google Scholar] [CrossRef]
- Leta, O.T.; El-Kadi, A.I.; Dulai, H. Implications of Climate Change on Water Budgets and Reservoir Water Harvesting of Nuuanu Area Watersheds, Oahu, Hawaii. J. Water Resour. Plan. Manag. 2017, 143, 05017013. [Google Scholar] [CrossRef]
- Kundu, A.; Dwivedi, S.; Chandra, V. Precipitation Trend Analysis over Eastern Region of India Using Cmip5 Based Climatic Models. ISPRS-Int. Arch. Photogramm. Remote Sens. Spat. Inf. Sci. 2014, XL-8, 1437–1442. [Google Scholar] [CrossRef] [Green Version]
- Bamber, J.L.; Oppenheimer, M.; Kopp, R.E.; Aspinall, W.P.; Cooke, R.M. Ice sheet contributions to future sea-level rise from structured expert judgment. Proc. Natl. Acad. Sci. USA 2019, 116, 11195–11200. [Google Scholar] [CrossRef] [PubMed] [Green Version]
- Schilling, J.; Hertig, E.; Tramblay, Y.; Scheffran, J. Climate change vulnerability, water resources and social implications in North Africa. Reg. Environ. Chang. 2020, 20, 15. [Google Scholar] [CrossRef] [Green Version]
- Kotir, J.H. Climate change and variability in Sub-Saharan Africa: A review of current and future trends and impacts on agriculture and food security. Environ. Dev. Sustain. 2010, 13, 587–605. [Google Scholar] [CrossRef]
- Challinor, A.; Wheeler, T.; Garforth, C.; Craufurd, P.; Kassam, A. Assessing the vulnerability of food crop systems in Africa to climate change. Clim. Chang. 2007, 83, 381–399. [Google Scholar] [CrossRef]
- Collins, J.M. Temperature Variability over Africa. J. Clim. 2011, 24, 3649–3666. [Google Scholar] [CrossRef] [Green Version]
- Alemayehu, A.; Bewket, W. Local climate variability and crop production in the central highlands of Ethiopia. Environ. Dev. 2016, 19, 36–48. [Google Scholar] [CrossRef]
- Block, P.J.; Strzepek, K.; Rosegrant, M.W.; Diao, X. Impacts of considering climate variability on investment decisions in Ethiopia. Agric. Econ. 2008, 39, 171–181. [Google Scholar] [CrossRef]
- Evangelista, P.; Young, N.; Burnett, J. How will climate change spatially affect agriculture production in Ethiopia? Case studies of important cereal crops. Clim. Chang. 2013, 119, 855–873. [Google Scholar] [CrossRef]
- Baker, T.J.; Miller, S.N. Using the Soil and Water Assessment Tool (SWAT) to assess land use impact on water resources in an East African watershed. J. Hydrol. 2013, 486, 100–111. [Google Scholar] [CrossRef]
- Gummadi, S.; Rao, K.P.C.; Seid, J.; Legesse, G.; Kadiyala, M.D.M.; Takele, R.; Amede, T.; Whitbread, A. Spatio-temporal variability and trends of precipitation and extreme rainfall events in Ethiopia in 1980–2010. Theor. Appl. Clim. 2018, 134, 1315–1328. [Google Scholar] [CrossRef] [Green Version]
- Esayas, B.; Simane, B.; Teferi, E.; Ongoma, V.; Tefera, N. Trends in Extreme Climate Events over Three Agroecological Zones of Southern Ethiopia. Adv. Meteorol. 2018, 2018, 7354157. [Google Scholar] [CrossRef]
- Wagesho, N.; Jain, M.K.; Goel, N.K. Effect of Climate Change on Runoff Generation: Application to Rift Valley Lakes Basin of Ethiopia. J. Hydrol. Eng. 2013, 18, 1048–1063. [Google Scholar] [CrossRef]
- Abraham, A.T.; Woldemicheala, A.; Muluneha, A.; Abateb, B. Hydrological Responses of Climate Change on Lake Ziway Catchment, Central Rift Valley of Ethiopia. J. Earth Sci. Clim. Change 2018, 9, 6. [Google Scholar] [CrossRef]
- Musie, M.; Sen, S.; Chaubey, I. Hydrologic Responses to Climate Variability and Human Activities in Lake Ziway Basin, Ethiopia. Water 2020, 12, 164. [Google Scholar] [CrossRef] [Green Version]
- Belihu, M.; Abate, B.; Tekleab, S.; Bewket, W. Hydro-meteorological trends in the Gidabo catchment of the Rift Valley Lakes Basin of Ethiopia. Phys. Chem. Earth, Parts A/B/C 2018, 104, 84–101. [Google Scholar] [CrossRef]
- Rosa, L.; Chiarelli, D.D.; Rulli, M.C.; Dell’Angelo, J.; D’Odorico, P. Global agricultural economic water scarcity. Sci. Adv. 2020, 6, eaaz6031. [Google Scholar] [CrossRef] [PubMed]
- Musie, M.; Momblanch, A.; Sen, S. Exploring future global change-induced water imbalances in the Central Rift Valley Basin, Ethiopia. Clim. Chang. 2021, 164, 47. [Google Scholar] [CrossRef]
- Fernández García, I.; Lecina, S.; Ruiz-Sánchez, M.C.; Vera, J.; Conejero, W.; Conesa, M.R.; Domínguez, A.; Pardo, J.J.; Léllis, B.C.; Montesinos, P. Trends and Challenges in Irrigation Scheduling in the Semi-Arid Area of Spain. Water 2020, 12, 785. [Google Scholar] [CrossRef] [Green Version]
- Greaves, G.E.; Wang, Y.-M. Effect of regulated deficit irrigation scheduling on water use of corn in southern Taiwan tropical environment. Agric. Water Manag. 2017, 188, 115–125. [Google Scholar] [CrossRef]
- Cancela, J.J.; Trigo-Córdoba, E.; Martínez, E.M.; Rey, B.J.; Bouzas-Cid, Y.; Fandiño, M.; Mirás-Avalos, J.M. Effects of climate variability on irrigation scheduling in white varieties of Vitis vinifera (L.) of NW Spain. Agric. Water Manag. 2016, 170, 99–109. [Google Scholar] [CrossRef]
- Eshete, D.G.; Sinshaw, B.G.; Legesse, K.G. Critical review on improving irrigation water use efficiency: Advances, challenges, and opportunities in the Ethiopia context. Water-Energy Nexus 2020, 3, 143–154. [Google Scholar] [CrossRef]
- Legesse, D.; Ayenew, T. Effect of improper water and land resource utilization on the central Main Ethiopian Rift lakes. Quat. Int. 2006, 148, 8–18. [Google Scholar] [CrossRef]
- Alhamshry, A.; Fenta, A.A.; Yasuda, H.; Kimura, R.; Shimizu, K. Seasonal Rainfall Variability in Ethiopia and Its Long-Term Link to Global Sea Surface Temperatures. Water 2020, 12, 55. [Google Scholar] [CrossRef] [Green Version]
- Abdulla, G.M. Annual Earth System Grid Federation 2019 Progress Report; Lawrence Livermore National Lab. (LLNL): Livermore, CA, USA, 2019. [Google Scholar] [CrossRef]
- Lamarque, J.-F.; Kyle, G.P.; Meinshausen, M.; Riahi, K.; Smith, S.J.; van Vuuren, D.P.; Conley, A.J.; Vitt, F. Global and regional evolution of short-lived radiatively-active gases and aerosols in the Representative Concentration Pathways. Clim. Change 2011, 109, 191–212. [Google Scholar] [CrossRef]
- Basheer, A.K.; Lu, H.; Omer, A.; Ali, A.B.; Abdelgader, A.M.S. Impacts of climate change under CMIP5 RCP scenarios on the streamflow in the Dinder River and ecosystem habitats in Dinder National Park, Sudan. Hydrol. Earth Syst. Sci. 2016, 20, 1331–1353. [Google Scholar] [CrossRef] [Green Version]
- McSweeney, C.F.; Jones, R.G.; Lee, R.W.; Rowell, D.P. Selecting CMIP5 GCMs for downscaling over multiple regions. Climate Dynamics. 2015, 44, 3237–3260. [Google Scholar] [CrossRef] [Green Version]
- Lutz, A.F.; ter Maat, H.W.; Biemans, H.; Shrestha, A.B.; Wester, P.; Immerzeel, W.W. Selecting representative climate models for climate change impact studies: An advanced envelope-based selection approach. Int. J. Climatol. 2016, 36, 3988–4005. [Google Scholar] [CrossRef] [Green Version]
- Emami, F.; Koch, M. Agricultural Water Productivity-Based Hydro-Economic Modeling for Optimal Crop Pattern and Water Resources Planning in the Zarrine River Basin, Iran, in the Wake of Climate Change. Sustainability 2018, 10, 3953. [Google Scholar] [CrossRef] [Green Version]
- Abraham, T.; Abate, B.; Woldemicheal, A.; Muluneh, A. Impacts of Climate Change under CMIP5 RCP Scenarios on the Hydrology of Lake Ziway Catchment, Central Rift Valley of Ethiopia. J. Environ. Earth Sci. 2018, 8, 81–90. [Google Scholar]
- Musie, M.; Sen, S.; Srivastava, P. Application of CORDEX-AFRICA and NEX-GDDP datasets for hydrologic projections under climate change in Lake Ziway sub-basin, Ethiopia. J. Hydrol. Reg. Stud. 2020, 31, 100721. [Google Scholar] [CrossRef]
- Gudmundsson, L.; Bremnes, J.B.; Haugen, J.E.; Engen-Skaugen, T. Downscaling RCM precipitation to the station scale using statistical transformations—a comparison of methods. Hydrol. Earth Syst. Sci. 2012, 16, 3383–3390. [Google Scholar] [CrossRef] [Green Version]
- Smid, M.; Costa, A.C. Climate projections and downscaling techniques: A discussion for impact studies in urban systems. Int. J. Urban Sci. 2018, 22, 277–307. [Google Scholar] [CrossRef] [Green Version]
- Rathjens, H.; Bieger, K.; Srinivasan, R.; Chaubey, I.; Arnold, J.G. CMhyd User Manual: Documentation for Preparing Simulated Climate Change Data for Hydrologic Impact Studies; SWAT: Garland, TX, USA, 2016; Available online: https://swat.tamu.edu/media/115265/bias_cor_man.pdf (accessed on 2 November 2021).
- Hordofa, A.T.; Leta, O.T.; Alamirew, T.; Kawo, N.S.; Chukalla, A.D. Performance Evaluation and Comparison of Satellite-Derived Rainfall Datasets over the Ziway Lake Basin, Ethiopia. Climate 2021, 9, 113. [Google Scholar] [CrossRef]
- Hoffmann, P.; Spekat, A. Identification of possible dynamical drivers for long-term changes in temperature and rainfall patterns over Europe. Theor. Appl. Clim. 2021, 143, 177–191. [Google Scholar] [CrossRef]
- Mohorji, A.M.; Şen, Z.; Almazroui, M. Trend Analyses Revision and Global Monthly Temperature Innovative Multi-Duration Analysis. Earth Syst. Environ. 2017, 1, 9. [Google Scholar] [CrossRef] [Green Version]
- Yue, S.; Pilon, P.; Cavadias, G. Power of the Mann–Kendall and Spearman’s rho tests for detecting monotonic trends in hydrological series. J. Hydrol. 2002, 259, 254–271. [Google Scholar] [CrossRef]
- Mann, H.B. Nonparametric tests against trend. Econometrica J. Econom. Soc. 1945, 1, 245–259. [Google Scholar] [CrossRef]
- Serinaldi, F.; Kilsby, C.G.; Lombardo, F. Untenable nonstationarity: An assessment of the fitness for purpose of trend tests in hydrology. Adv. Water Resour. 2018, 111, 132–155. [Google Scholar] [CrossRef]
- Bari, S.H.; Rahman, M.T.U.; Hoque, M.A.; Hussain, M.M. Analysis of seasonal and annual rainfall trends in the northern region of Bangladesh. Atmospheric Res. 2016, 176–177, 148–158. [Google Scholar] [CrossRef]
- De Lima, M.I.P.; Carvalho, S.; De Lima, J.L.M.P.; Coelho, M.F.E.S. Trends in precipitation: Analysis of long annual and monthly time series from mainland Portugal. Adv. Geosci. 2010, 25, 155–160. [Google Scholar] [CrossRef] [Green Version]
- Hu, Y.; Maskey, S.; Uhlenbrook, S. Expected changes in future temperature extremes and their elevation dependency over the Yellow River source region. Hydrol. Earth Syst. Sci. 2013, 17, 2501–2514. [Google Scholar] [CrossRef] [Green Version]
- Hu, Y.; Maskey, S.; Uhlenbrook, S.; Zhao, H. Streamflow trends and climate linkages in the source region of the Yellow River, China. Hydrol. Process. 2011, 25, 3399–3411. [Google Scholar] [CrossRef]
- Yue, S.; Pilon, P.; Phinney, B.; Cavadias, G. The influence of autocorrelation on the ability to detect trend in hydrological series. Hydrol. Process. 2002, 16, 1807–1829. [Google Scholar] [CrossRef]
- Hussain, M.M.; Mahmud, I. pyMannKendall: A python package for non-parametric Mann Kendall family of trend tests. J. Open Source Softw. 2019, 4, 1556. [Google Scholar] [CrossRef]
- Cox, D.R.; Stuart, A. Some Quick Sign Tests for Trend in Location and Dispersion. Biometrika 1955, 42, 80–95. [Google Scholar] [CrossRef] [Green Version]
- Tehrani, E.N.; Sahour, H.; Booij, M.J. Trend analysis of hydro-climatic variables in the north of Iran. Theor. Appl. Clim. 2019, 136, 85–97. [Google Scholar] [CrossRef]
- Kamworapan, S.; Surussavadee, C. Evaluation of CMIP5 Global Climate Models for Simulating Climatological Temperature and Precipitation for Southeast Asia. Adv. Meteorol. 2019, 2019, 1067365. [Google Scholar] [CrossRef]
- Voldoire, A.; Sanchezgomez, E.; Mélia, D.S.Y.; Decharme, B.; Cassou, C.; Senesi, S.; Valcke, S.; Beau, I.; Alias, A.; Chevallier, M.; et al. The CNRM-CM5.1 global climate model: Description and basic evaluation. Clim. Dyn. 2013, 40, 2091–2121. [Google Scholar] [CrossRef] [Green Version]
- Rogelj, J.; Meinshausen, M.; Knutti, R. Global warming under old and new scenarios using IPCC climate sensitivity range estimates. Nat. Clim. Change 2012, 2, 248–253. [Google Scholar] [CrossRef]
- Gurara, M.A.; Jilo, N.B.; Tolche, A.D. Impact of climate change on potential evapotranspiration and crop water requirement in Upper Wabe Bridge watershed, Wabe Shebele River Basin, Ethiopia. J. Afr. Earth Sci. 2021, 180, 104223. [Google Scholar] [CrossRef]
- Deressa, T.T.; Hassan, R.M. Economic Impact of Climate Change on Crop Production in Ethiopia: Evidence from Cross-section Measures. J. Afr. Econ. 2009, 18, 529–554. [Google Scholar] [CrossRef]
- Gadissa, T.; Nyadawa, M.; Behulu, F.; Mutua, B. The Effect of Climate Change on Loss of Lake Volume: Case of Sedimentation in Central Rift Valley Basin, Ethiopia. Hydrology 2018, 5, 67. [Google Scholar] [CrossRef] [Green Version]
- Intergovernmental Panel on Climate Change (IPCC). Summary for Policymakers. Climate Change 2014: Part of the Working Group III Contribution to the Fifth Assessment Report of the IPCC, Geneva, Switzerland. Available online: http://pure.iiasa.ac.at/11125 (accessed on 14 September 2021).
- Asare-Nuamah, P.; Botchway, E. Understanding climate variability and change: Analysis of temperature and rainfall across agroecological zones in Ghana. Heliyon 2019, 5, e02654. [Google Scholar] [CrossRef] [PubMed] [Green Version]
- Kelkar, S.M.; Kulkarni, A.; Rao, K.K. Impact of Climate Variability and Change on Crop Production in Maharashtra, India. Curr. Sci. 2020, 118, 1235–1245. [Google Scholar] [CrossRef]
- Gebrehiwot, T.; van der Veen, A. Assessing the evidence of climate variability in the northern part of Ethiopia. J. Dev. Agric. Econ. 2013, 5, 104–119. [Google Scholar] [CrossRef] [Green Version]
- Tesfaye, K.; Aggarwal, P.K.; Mequanint, F.; Shirsath, P.B.; Stirling, C.M.; Khatri-Chhetri, A.; Rahut, D.B. Climate Variability and Change in Bihar, India: Challenges and Opportunities for Sustainable Crop Production. Sustainability 2017, 9, 1998. [Google Scholar] [CrossRef] [Green Version]


| Modeling Center | Model | Resolution in Degrees | Institute | Reference |
|---|---|---|---|---|
| CNRM-CERFACS | CNRM-CM5 | 1.4 × 1.4 | Centre National de Recherches Meteorologiques/Centre Europeen de Recherche et Formation Avancees en Calcul Scientifique | [24,38] |
| MPI-M | MPI-ESM-LR | 1.9 × 1.9 | Max Planck Institute for Meteorology (MPI-M) | [33,34,38] |
| CSIRO-QCCCE | CSIRO-MK3.6 | 1.8 × 1.8 | Commonwealth Scientific and Industrial Research Organization in collaboration with the Queensland Climate Change Centre of Excellence | [37,38] |
| CNMR-CM5 | CSIRO-MK3.6 | MIP-ESM-LR | ||||
|---|---|---|---|---|---|---|
| Station↓ Test→ | MK Trend | Sen’s Slope | MK Trend | Sen’s Slope | MK Trend | Sen’s Slope |
| Ziway | −2.14 | −0.52 | 0.16 | 0.08 | 0.79 | 0.33 |
| Meki | 0.42 | 0.10 | 0.01 | 0.06 | 0.79 | 0.34 |
| Arata | 2.17 * | 0.56 | −0.02 | −0.02 | −0.42 | −0.14 |
| Butajira | −1.21 | −0.31 | 0.63 | 0.27 | 0.63 | 0.23 |
| Tora | −0.50 | −0.19 | −0.26 | −0.19 | −0.58 | −0.30 |
| Bui | −0.66 | −0.23 | 0.63 | 0.29 | 0.63 | 0.31 |
| Kulumsa | 0.90 | 0.37 | −0.53 | −0.07 | 0.05 | 0.07 |
| Assela | 0.85 | 0.37 | −0.16 | −0.03 | 0.05 | 0.10 |
| Sagure | 1.06 | 0.36 | 0.48 | 0.18 | 1.02 | 0.01 |
| Meraro | 0.48 | 0.18 | −0.90 | −0.42 | −0.58 | −0.21 |
| Adamitulu | 1.11 | 0.35 | 0.11 | 0.05 | 0.90 | 0.20 |
| Model→ | CNMR-CM5 | CSIRO-MK3.6 | MIP-ESM-LR | |||||||||
|---|---|---|---|---|---|---|---|---|---|---|---|---|
| Station↓ Test→ | MK RCP 4.5 | Sen’s RCP 4.5 | MK RCP 8.5 | Sen’s RCP 8.5 | MK RCP 4.5 | Sen’s RCP 4.5 | MK RCP 8.5 | Sen’s RCP 8.5 | MK RCP 4.5 | Sen’s RCP 4.5 | MK RCP 8.5 | Sen’s RCP 8.5 |
| Ziway | 0.71 | 0.52 | 0.38 | 0.23 | 0.94 | 0.06 | 1.61 | 1.34 | −0.55 | 0.22 | −1.41 | −2.35 |
| Meki | −0.54 | −0.11 | 1.07 | 0.29 | 0.12 | 0.24 | 2.06 * | 2.37 | 0.38 | −0.03 | 0.07 | 0.04 |
| Arata | −0.53 | −0.09 | 1.41 | 0.53 | 0.02 | 0.14 | 2.01 * | 1.35 | 0.24 | 0.12 | −0.27 | −0.15 |
| Butajira | 0.48 | 0.08 | 0.57 | 0.20 | −0.02 | −0.12 | 1.46 | 1.53 | −0.38 | 0.08 | −0.05 | −0.01 |
| Tora | 0.28 | 0.05 | 0.07 | 0.04 | 0.67 | 0.53 | 1.61 | 1.92 | −0.34 | −0.02 | −0.12 | −0.10 |
| Bui | 0.17 | 0.03 | 0.37 | 0.15 | 0.62 | 0.60 | 1.36 | 0.93 | 0.05 | −0.10 | 0.07 | 0.02 |
| Kulumsa | −0.42 | −0.07 | 0.47 | 0.25 | −0.07 | −0.05 | 1.60 | 1.14 | −0.55 | −0.01 | 0.22 | 0.05 |
| Assela | −0.53 | −0.07 | 0.62 | 2.90 | −0.02 | −0.13 | 1.70 | 1.05 | −0.25 | 0.06 | 0.32 | 0.07 |
| Sagure | −0.18 | −0.03 | 0.57 | 0.15 | −0.07 | −0.23 | 1.51 | 0.69 | −0.67 | −0.06 | 1.66 | 1.05 |
| Meraro | −0.34 | −0.05 | 0.52 | 0.07 | −0.27 | −0.19 | 1.31 | 0.71 | −0.38 | −0.08 | 0.17 | 0.08 |
| Adamitulu | −0.54 | −0.09 | 0.39 | 0.23 | 1.07 | 0.41 | −0.06 | −0.01 | 0.70 | 0.03 | −0.17 | −0.16 |
| Model→ | CNMR-CM5 | CSIRO-MK3.6 | MIP-ESM-LR | |||||||||
|---|---|---|---|---|---|---|---|---|---|---|---|---|
| Station↓ Test→ | MK RCP 4.5 | Sen’s RCP 4.5 | MK RCP 8.5 | Sen’s RCP 8.5 | MK RCP 4.5 | Sen’s RCP 4.5 | MK RCP 8.5 | Sen’s RCP 8.5 | MK RCP 4.5 | Sen’s RCP 4.5 | MK RCP 8.5 | Sen’s RCP 8.5 |
| Ziway | 2.00 * | 0.04 | 1.86 | 0.03 | 2.43 * | 0.03 | 3.35 *** | 0.05 | 1.51 | 0.02 | 2.66 ** | 0.03 |
| Meki | 2.21 * | 0.04 | 2.51 * | 0.05 | 2.95 ** | 0.05 | 4.14 *** | 0.05 | 1.51 | 0.03 | 1.71 | 0.03 |
| Arata | 2.21 * | 0.04 | 2.85 ** | 0.07 | 3.35 *** | 0.07 | 3.35 *** | 0.05 | 1.56 | 0.03 | 1.66 | 0.03 |
| Butajira | 2.21 * | 0.04 | 1.17 | 0.02 | 3.20 *** | 0.04 | 3.34 *** | 0.05 | 1.56 | 0.02 | 1.66 | 0.02 |
| Tora | 1.56 | 0.03 | 2.00 * | 0.04 | 1.56 | 0.02 | 3.64 *** | 0.06 | 1.66 | 0.02 | 2.98 ** | 0.03 |
| Bui | 2.20 * | 0.04 | 0.57 | 0.01 | 0.60 | 0.01 | 3.69 *** | 0.06 | 2.71 ** | 0.02 | 2.01 * | 0.03 |
| Kulumsa | 2.20 * | 0.04 | 2.41 * | 0.04 | 2.90 ** | 0.04 | 3.35 *** | 0.05 | 1.51 | 0.02 | 1.61 | 0.02 |
| Assela | 2.9 ** | 0.04 | 2.80 ** | 0.04 | 3.17 *** | 0.05 | 3.34 *** | 0.05 | 2.32 * | 0.02 | 1.69 | 0.03 |
| Sagure | 2.65 ** | 0.04 | 2.65 ** | 0.04 | 3.62 *** | 0.07 | 3.35 ** | 0.05 | 1.56 | 0.02 | 3.66 ** | 0.02 |
| Meraro | 2.80 | 0.05 | 2.80 ** | 0.05 | 3.37 *** | 0.04 | 3.32 *** | 0.05 | 1.61 | 0.02 | 1.71 | 0.03 |
| Adamitulu | 2.50 ** | 0.07 | 3.25 ** | 0.07 | 3.52 *** | 0.04 | 2.12 * | 0.04 | 0.87 | 0.01 | 3.96 ** | 0.02 |
Publisher’s Note: MDPI stays neutral with regard to jurisdictional claims in published maps and institutional affiliations. |
© 2021 by the authors. Licensee MDPI, Basel, Switzerland. This article is an open access article distributed under the terms and conditions of the Creative Commons Attribution (CC BY) license (https://creativecommons.org/licenses/by/4.0/).
Share and Cite
Hordofa, A.T.; Leta, O.T.; Alamirew, T.; Chukalla, A.D. Spatiotemporal Trend Analysis of Temperature and Rainfall over Ziway Lake Basin, Ethiopia. Hydrology 2022, 9, 2. https://doi.org/10.3390/hydrology9010002
Hordofa AT, Leta OT, Alamirew T, Chukalla AD. Spatiotemporal Trend Analysis of Temperature and Rainfall over Ziway Lake Basin, Ethiopia. Hydrology. 2022; 9(1):2. https://doi.org/10.3390/hydrology9010002
Chicago/Turabian StyleHordofa, Aster Tesfaye, Olkeba Tolessa Leta, Tane Alamirew, and Abebe Demissie Chukalla. 2022. "Spatiotemporal Trend Analysis of Temperature and Rainfall over Ziway Lake Basin, Ethiopia" Hydrology 9, no. 1: 2. https://doi.org/10.3390/hydrology9010002
APA StyleHordofa, A. T., Leta, O. T., Alamirew, T., & Chukalla, A. D. (2022). Spatiotemporal Trend Analysis of Temperature and Rainfall over Ziway Lake Basin, Ethiopia. Hydrology, 9(1), 2. https://doi.org/10.3390/hydrology9010002