Article

REY Patterns and Their Natural Anomalies in Waters and Brines: The Correlation of Gd and Y Anomalies

GFZ German Research Centre for Geosciences, Telegrafenberg, 14473 Potsdam, Germany
*
Author to whom correspondence should be addressed.
Hydrology 2021, 8(3), 116; https://doi.org/10.3390/hydrology8030116
Submission received: 9 June 2021 / Revised: 19 July 2021 / Accepted: 3 August 2021 / Published: 6 August 2021

Abstract

:
Rare earths and yttrium (REY) distribution patterns of the hydrosphere reveal systematic correlations of Gd and Y anomalies besides the non-correlated redox-dependent Ce and Eu anomalies. Eu anomalies are inherited by dissolution of feldspars in igneous rocks, whereas Ce, Gd and Y anomalies develop in aqueous systems in contact with minerals and amorphous matter. Natural, positive Gd and Y anomalies in REY patterns characterize high-salinity fluids from the Dead Sea, Israel/Jordan, the Great Salt Lake, USA, the Aral Sea, Kazakhstan/Uzbekistan, ground- and surface water worldwide. Extreme Gd anomalies mostly originate from anthropogenic sources. The correlation of Gd and Y anomalies at low temperature in water bodies differ from geothermal ones. In nature, dynamic systems prevail in which either solids settle in water columns or water moves through permeable sediments or sedimentary rocks. In both cases, the anomalies in water develop due to repeated equilibration with solid matter. Thus, these anomalies provide information about the hydrological history of seawater, fresh groundwater and continental brines. When migrating, the interaction of aqueous phases with mineral surfaces leads to increasing anomalies because the more hydrophillic Gd and Y preferentially remain in the aqueous phase compared to their nearest neighbors. The correlation coefficients between Gd and Y anomalies in groundwater is 0.5–0.9. In lakes and oceans, it is about 0.1–0.8, under anomalous conditions it can increase to 1.

1. Introduction

The fourteen stable rare earth elements, REE, are unique because of the coherence of their chemical properties. Although Y is not a member of the REE suite, it behaves similarly to Ho in minerals crystallizing from siliceous melts due to the same ionic charge and nearly identical crystallographic ionic radii [1,2]. REE and Y are henceforth combined to REY. Under low-temperature conditions, the lanthanide contraction is expected to generate a continuous change from La(III) to Lu(III). Ce(IV) and Eu(II) behave differently according to oxydation and reduction, respectively. The fractionation of Gd(III) and Y(III) in phase separation processes such as either liquid–liquid extraction [3] or incorporation in mainly Ca minerals is caused by non-linear variation of physical parameters such as partial molal volumes [4] and formation constants of dissolved species. Hydroxo- [5,6,7], bicarbonato and carbonato complexes [8,9,10,11] and phosphato complexes [12,13] show anomalous behavior of Gd and Y. Chemical complexations of REY with chloride [14], fluoride [15,16] and sulfate [17] do not show deviations of formation constants of Gd and Y with respect to their nearest neighbors. In Figure 1a, the complex formation constants of each type of ligand in seawater are divided by their La values. M a q 3 + and consequently MCl 2 + , MSO 4 + show slightly enriched Gd and Y values in seawater. MCO 3 + and M(CO 3 ) 2 are the most abundant species in seawater (Figure 1b).
Positive La, Gd, Lu and Y anomalies characterize modern seawater [18,19,20,21,22,23,24]. REE patterns of marine carbonates and phosphorites resemble those of seawater showing negative Ce and Eu and significantly positive Gd and Y anomalies [22,25]. The behavior of Gd is consistent with reduced adsorption onto particles and colloids in seawater compared to its nearest neighbors [26,27,28]. Chemical complexation with carbonate species and hydroxyl ions is strongly pH dependent. Incorporation of REY in calcite [29,30,31,32] and scavenging by FeOOH [33,34,35] reveals that Gd and Y are less involved and thus relatively increase in solutions compared to their nearest neighbors. They are also less adsorbed onto clay minerals [36] and less incorporated in phosphates [37,38] and sulfates [39,40,41].
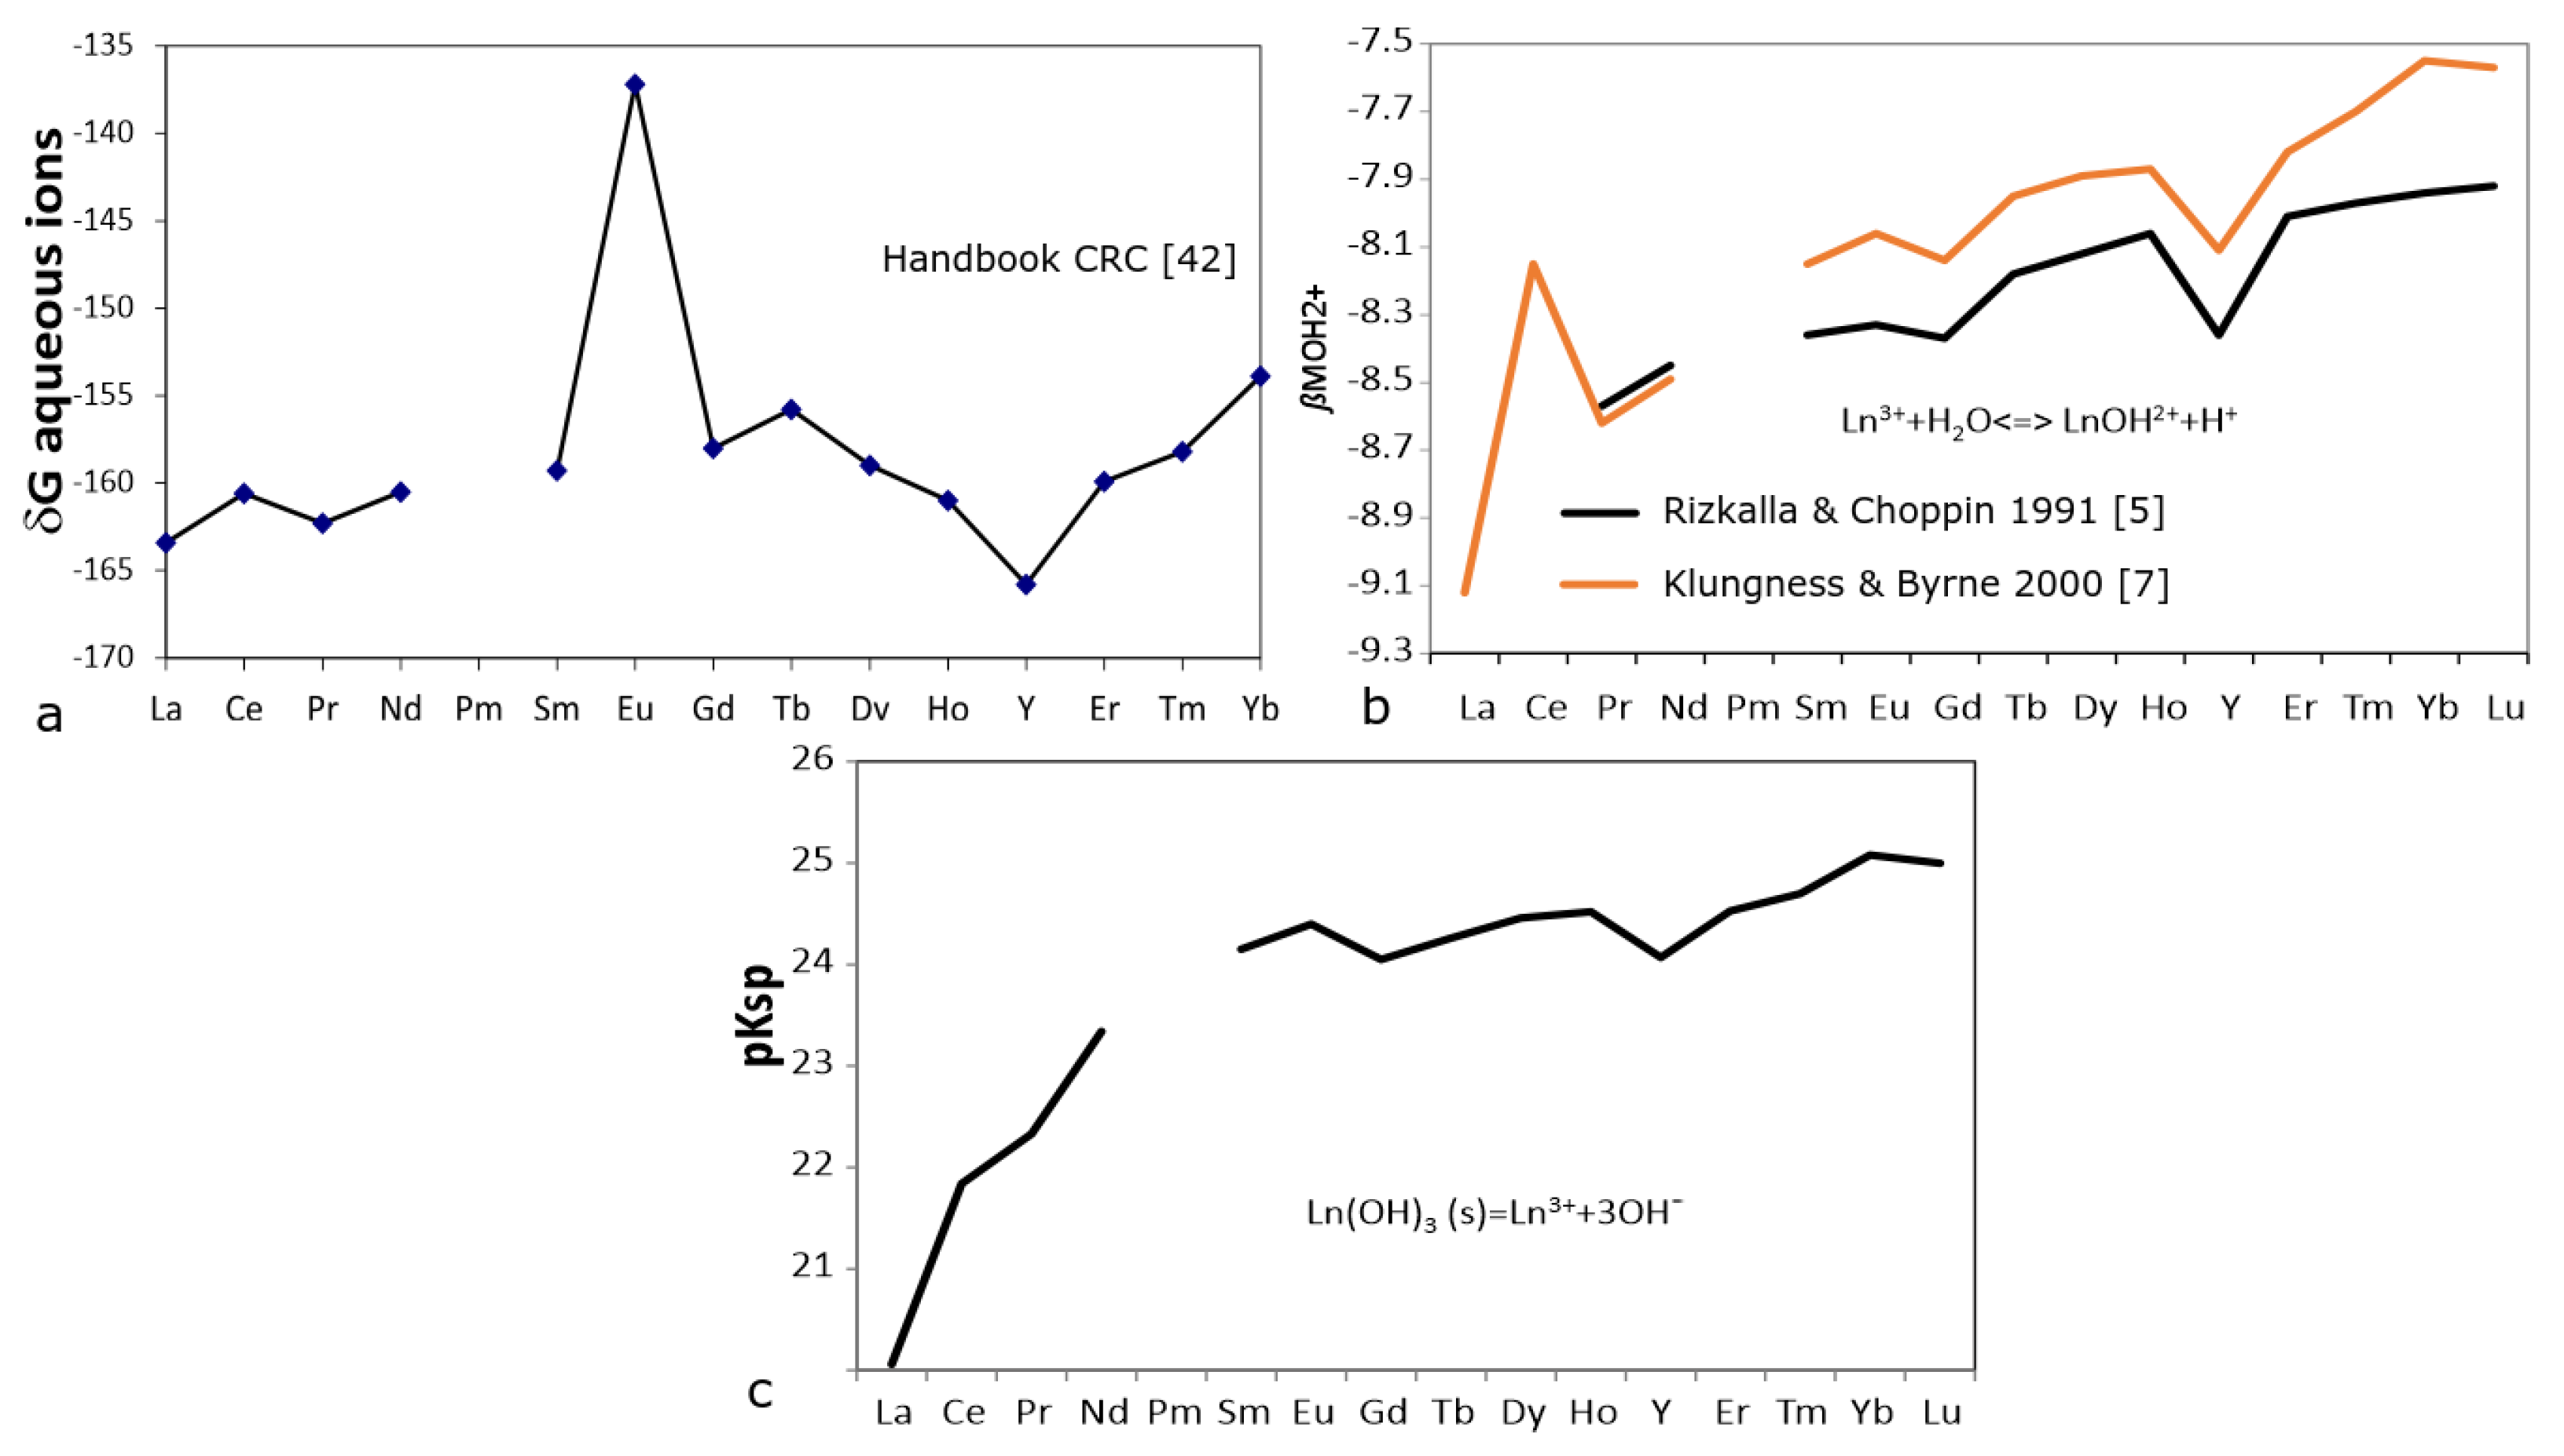
Compared to their nearest neighbors the free energies of formation of aqueous Gd and Y ions [42] (Figure 2a), their formation constants of Ln(OH) 2 + [5,7] (Figure 2b) and their solubility products of hydroxides, pK s p [6] (Figure 2c) are enhanced.
According to [2,19], the fractionation between Y and Ho in oceanic depth profiles from top to bottom is controlled by desorption from particles settling from the eutectic zone. The residence times of Y and Ho in seawater are 5100 and 2700 years [2]. Investigating the local structure of Y 3 + and Ho 3 + in calcite by EXAFS revealed that Y-O and Ho-O distances in calcite are shorter than in corresponding aqua-ions [43]. Y-Ho fractionation is seemingly caused by involvement of 4f orbital electrons in covalent bonding of Ho (and all the other REE) in minerals, a contribution that is missing for Y.
The aim of this contribution is to focus on two aspects: the type of REY patterns and the occurrence of unequivocally natural REY anomalies, in particular, the possible correlation of Gd and Y anomalies in low- to high-salinity and cold to thermal groundwaters or brines. The Ce and Eu anomalies are touched upon because they characterize the redox potentials of the systems [44] and the environmental temperature, respectively [45,46,47].
Understanding the behavior of the REE series as a whole and the anomalous behavior of individual REE and Y improves our knowledge on aqueous REY geochemistry and extends the application of anomalies as tools in studying chemical processes in hydrology. Since very stable organic Gd complexes are used as pseudo-natural tracer in hydrology [48,49,50,51,52], the precise environmental background of Gd has to be known. Furthermore, the REY patterns and their anomalies allow to depict the catchment lithology of groundwater and its possible interaction with sediments containing ferric oxihydroxides, FeOOH, and/or phosphates [53,54]. The influence of organic matter is not a subject of this contribution.

2. Quantification of Ce, Eu, Gd and Y Anomalies

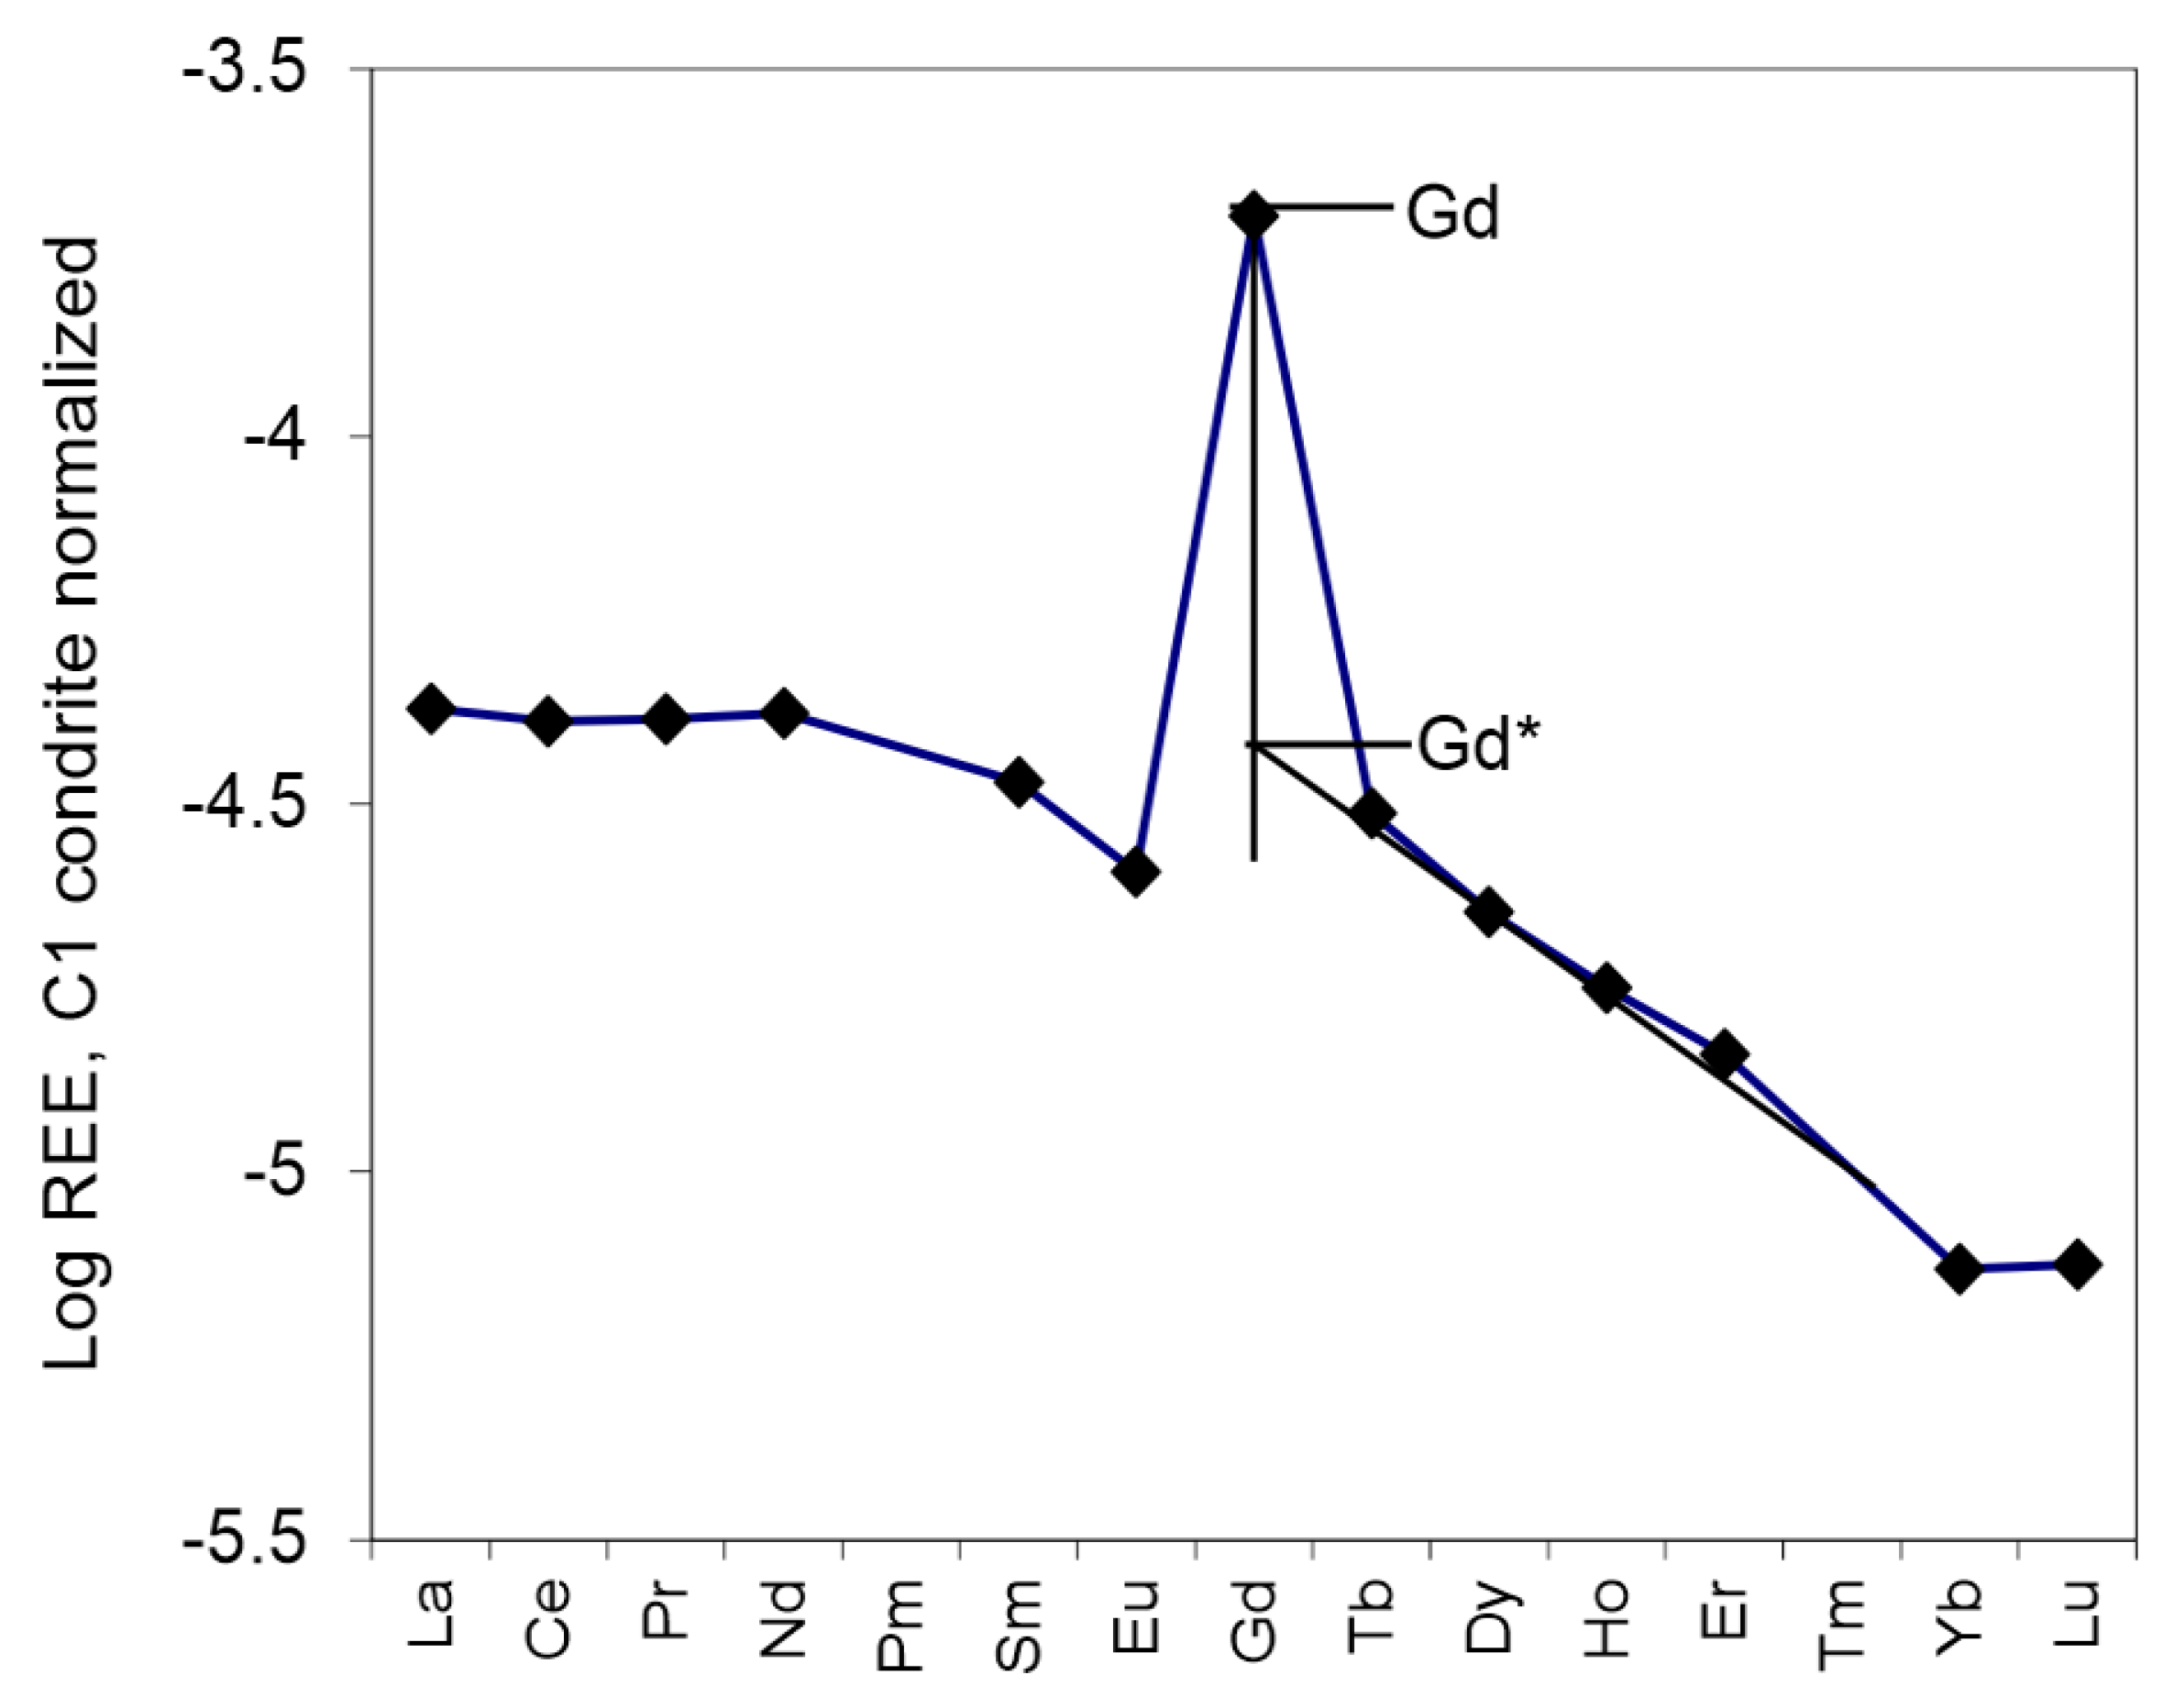
Conventionally, anomalies in normalized REE distribution patterns are defined either by the ratio of both normalized measured and interpolated abundances between their nearest neighbors or as direct ratios of normalized neighbors. Here normalization by C1 chondrite [55] is applied. The Ce anomaly is derived by extrapolation of the Pr-Nd trend (Equation (1), [56,57]) considering La possibly being enhanced due to methanotrophy [58]. Log(Eu/Eu * ) value is defined by Equations (2) and (3), except in case of the presence of anomalous Gd. With Gd often at the bend of the disparate trends of light and heavy REE and Eu commonly behaving anomalously, it is suggested to extrapolate log G d n * from the mostly linear trend of the logarithms of normalized Tb, Dy and Ho in REY patterns (Figure 3). Log(Gd/Gd * ) is then defined as the difference of the logarithms of measured and normalized Gd and the extrapolated log G d n * (Equations (4) and (5)). The anomalous Y is given as a ratio of normalized Y and Ho. The anomalies are defined as Ce/Ce * -1, Eu/Eu * -1, Gd/Gd * -1 and Y n /Ho n -1 yielding either negative or positive values. In this study, only publications covering the series of REE and Y are considered [59]. This excludes all hydrological studies that do not report Y.
log ( Ce / Ce * ) = log Ce n / ( 2 log Pr n log Nd n )
log Eu n * = ( log Gd n * + log Sm n ) / 2
log ( Eu / Eu * ) = log Eu n ( log Gd n * + log Sm n ) / 2
log Gd n * + log Ho n = log Tb n + log Dy n
log ( Gd / Gd * ) = log Gd n + log Ho n ( log Tb n + log Dy n )
Subscript “n” indicates normalization.

3. Results

3.1. Seawater

Worldwide, surface seawaters show lower REY abundances than their oxic deep ones [60]. Because water masses move along with the ocean conveyor belt, the REY patterns in deep ocean waters are not the result of processes in their local top water. Surface and oxic bottom waters are characterized by highly negative Ce anomalies such as in the area of the East Pacific Rise (Figure 4a) [61], the Indonesian Sulu Sea [24], the Java Sea (unpublished), the Fiji, Caroline and Coral basins built by atolls in the south Pacific [62] (Figure 4b) or the Mediterranean Sea (Figure 4c) [63]. Here the Ce anomalies in surface waters decrease and could be even absent (Figure 4b,c). The anoxic deep Mediterranean brine at 3400 m from the Tyro Basin, which is not involved in yearly overturning of the local water column, shows the highest REY abundance with positive Ce anomaly (Figure 4c).
In surface and bottom waters REY patterns of oxic ocean waters show positive Gd and Y anomalies which plot on the same trend line with a slope of about 0.8 (Table 1) and X-axis intercept of about 0.5 (Figure 4d). In marine basins built by atolls, the depth-dependent anomalies of bottom and surface water follow different trend lines with slopes of 0.072 and 0.18, respectively. Their intercepts on the Y-axis of bottom and surface water are about 0 and 0.05, respectively. The surface waters from the Gulf of Thailand [64] at three different times in the monsoon-dominated year plot along the same correlation line as those of the surface water of basins in the South Pacific.

3.2. Lakes and Continental Seas

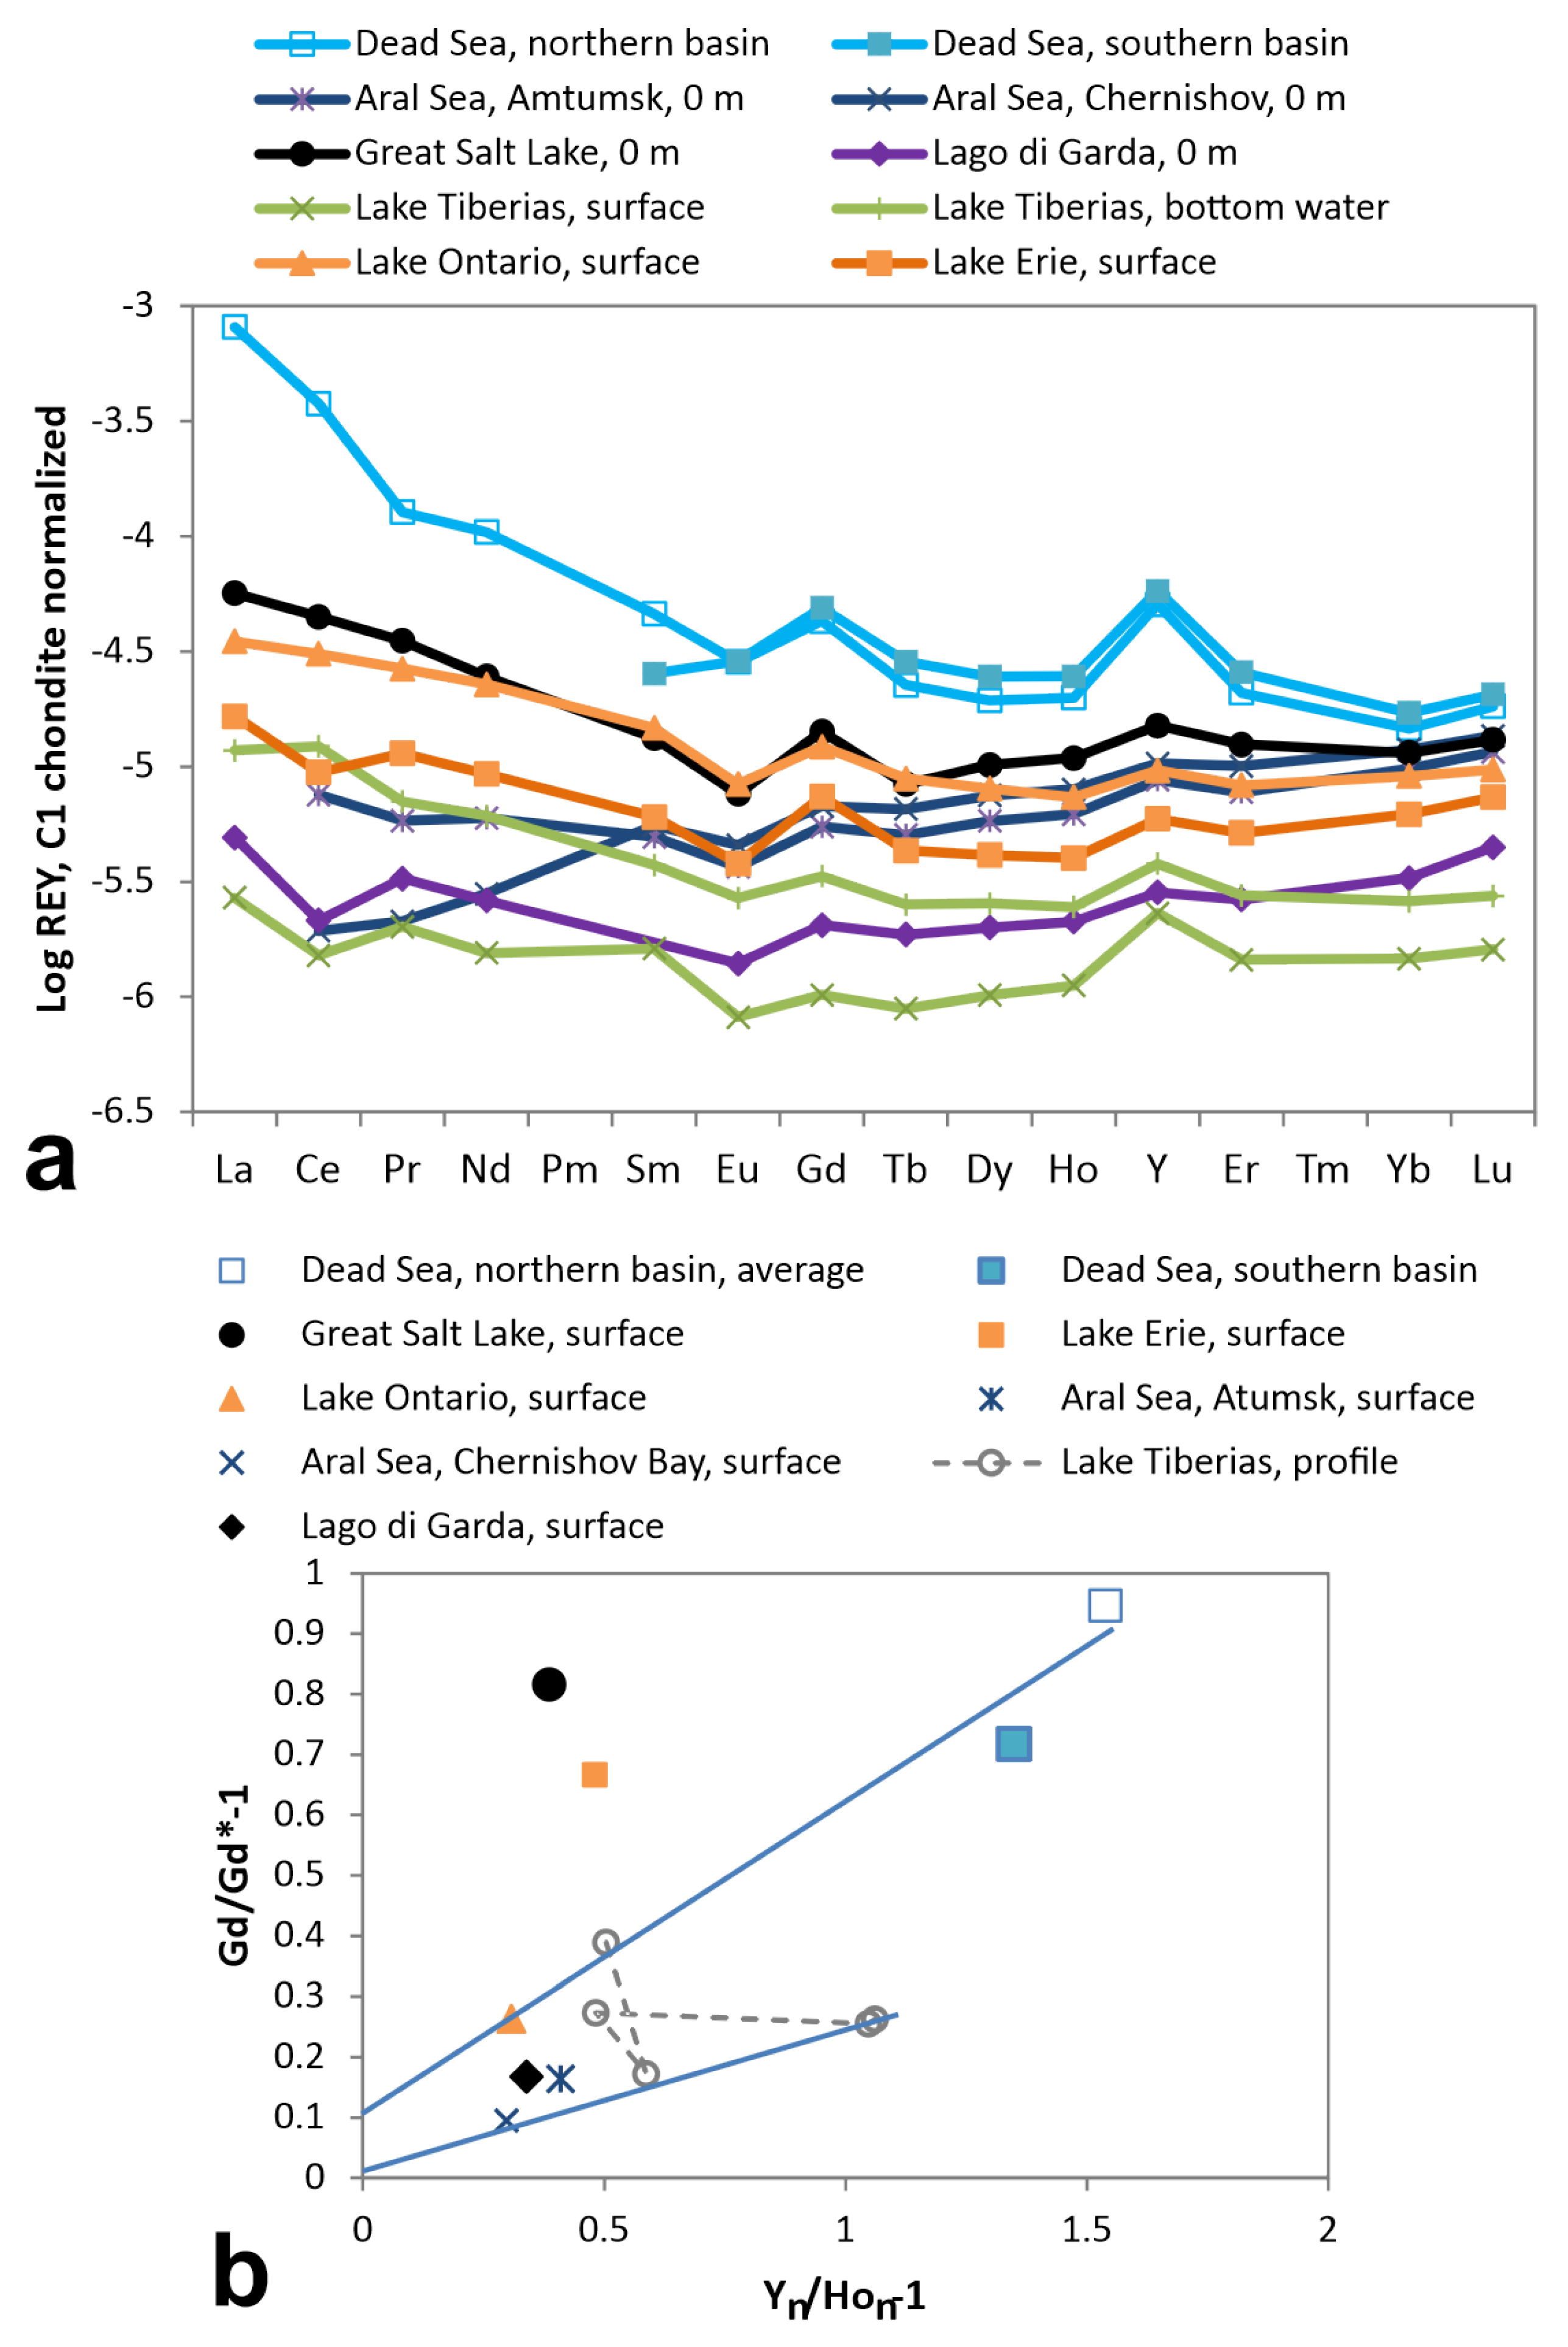
Lakes and continental seas are the ultimate sinks of surface run-off and groundwater flow from continents. Their REY abundance depends on the lithologies of their drainage basins. The surface waters of lakes and seas show either REY patterns without Ce anomalies (Dead Sea, Middle East [65]; Great Salt Lake, USA (unpublished), Lake Ontario, USA/CND [66] or with Ce anomalies (Lago di Garda, Italy (unpublished); Lake Tiberias, Israel [67]; Lake Erie, USA/CND [66]. The REY patterns of surface waters of the hypersaline Great Salt Lake, USA, and the saline Aral Sea, Kazakhstan/Uzbekistan, show increasing abundances from Tb to Lu similar to seawater but contrasting the trend of the Dead Sea brine (Figure 5a). Increasing from 1960 the intensification of the irrigation program in Kazakhstan/Uzbekistan, the water from the Amu-Darya and Syr-Darya was diverted from discharging into the Aral Sea and, consequently, its water level fell due to evaporation. The Aral Sea and Lake Tiberias surface water show negative Ce and Eu anomalies typical for oxic conditions of water, whereas the Dead Sea shows none. The hypolimnion of Lake Tiberias shows no Eu anomalies but positive Ce anomalies [67] (Figure 5a).
The Y and Gd anomalies plot between lines with slopes of 0.3 and 0.7 (Figure 5b). Both suggested bordering lines show small Y axis intercepts for surface water. The developing anomalies of the Aral Sea plot between these lines. Note that Gd anomalies of Lake Erie and the Great Salt Lake do not plot on one of the indicated lines.

3.3. Rivers and Streams

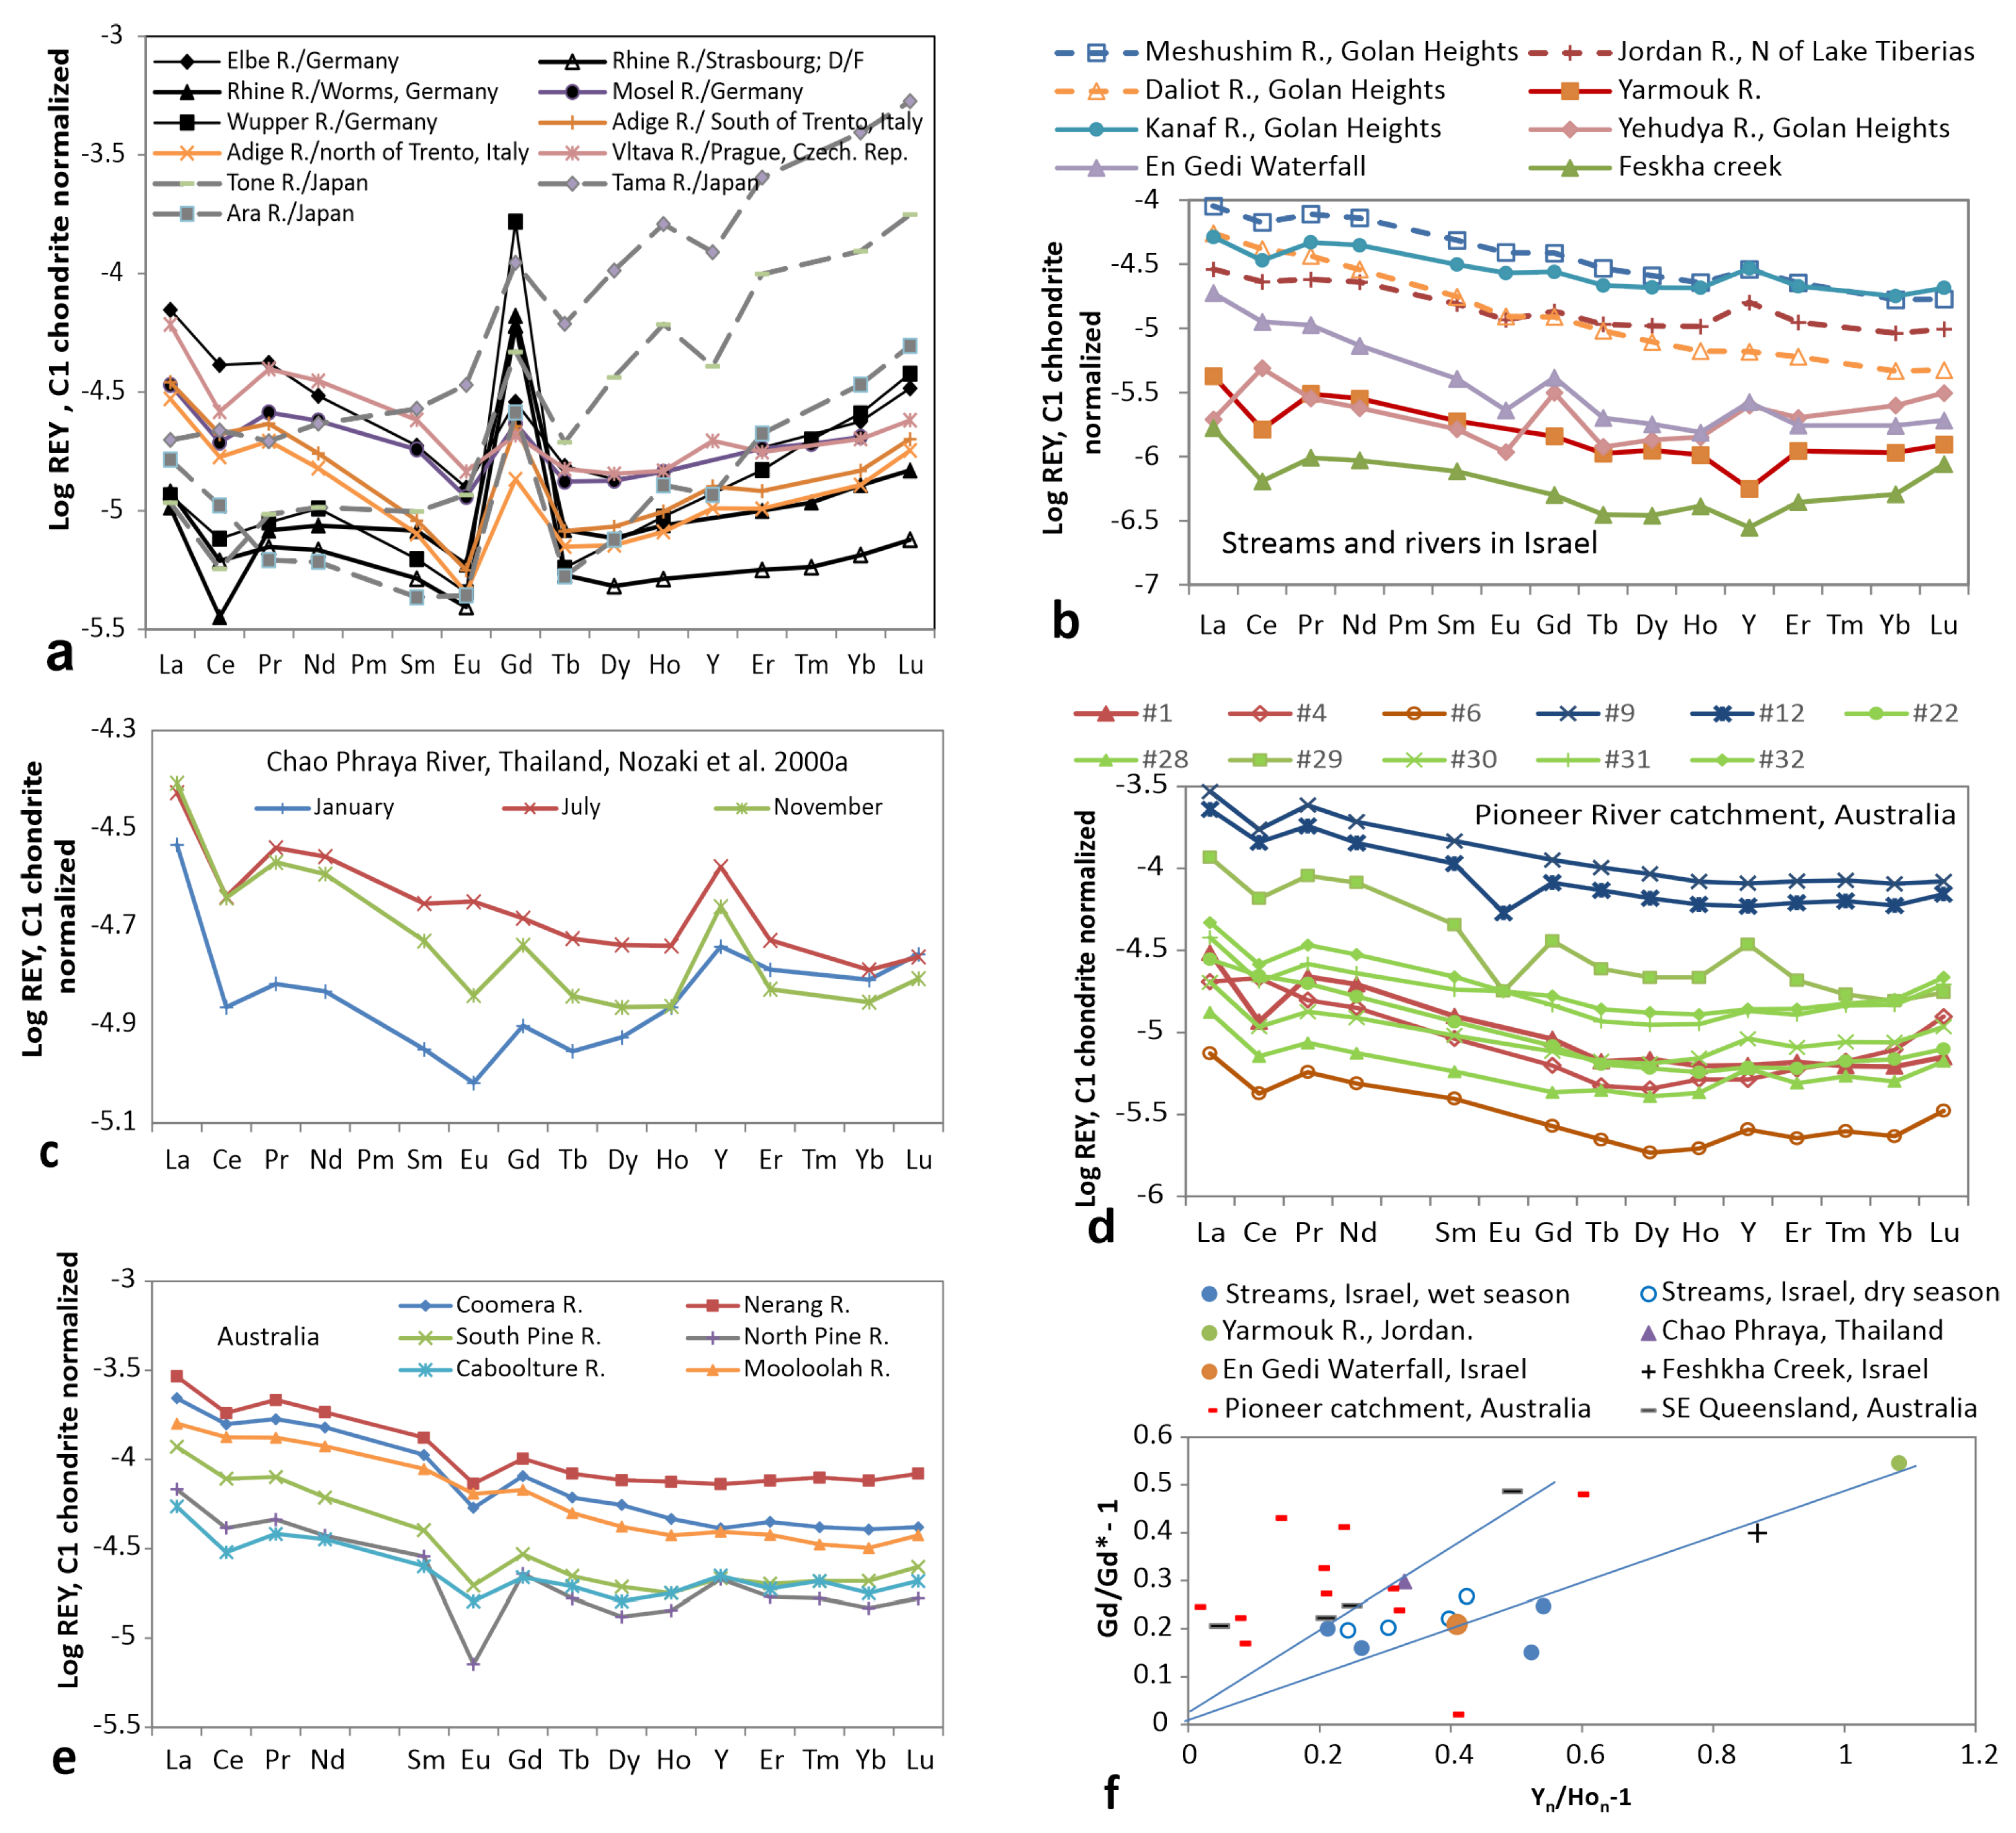
The REY abundances in rivers and streams depend on the lithology of their catchment areas and their bedrocks. Rivers passing big cities in developed countries are contaminated by anthropogenic inputs of Gd via sewage [48,52,56,68,69,70] (Figure 6a) and other REE via industrial waste waters [71,72]. Waters of small rivers and streams constrained to only one type of rock show a relationship to their bedrock [73,74]. The perennial streams in Israel show different REY patterns during wet and dry seasons (Figure 6b). Depending on the REY anomalies of either limestones or alkali olivine basalts, these rivers and streams inherit Y, small Gd and often negative Ce anomalies, but rarely Eu anomalies. The REY patterns of water from limestones resemble those of their host rocks, such as the Jordan River north of Lake Tiberias. The REY pattern of water from the En Gedi waterfall is typical for interaction with limestones.
The REY abundance of the Chao Phraya River discharging into the Gulf of Thailand varies with the monsoon season (Figure 6c). In the Pioneer River catchment, Australia [57], the contributors Finch Hatton (#9 and #12) and Cattle creek (#1; #4; #6) flow in granitic, granodioritic, dioritic and gabbroic beds. After their confluence, the Pioneer River flows in beds of Tertiary and Quaternary sediments (#22–#32; Figure 6d) [56]. Rivers of SE Queensland/Australia originate from largely basaltic hinterland and pass Tertiary and Quaternary sandstones and siltstones (Figure 6e; ref. [57]).
Positive Y and Gd anomalies show assumed correlations with variable slopes between 0.5–1 (Figure 6f) and a wide scatter of data from the Pioneer River catchment with mostly larger Gd–anomalies than those of Yttrium.

3.4. Spring Water

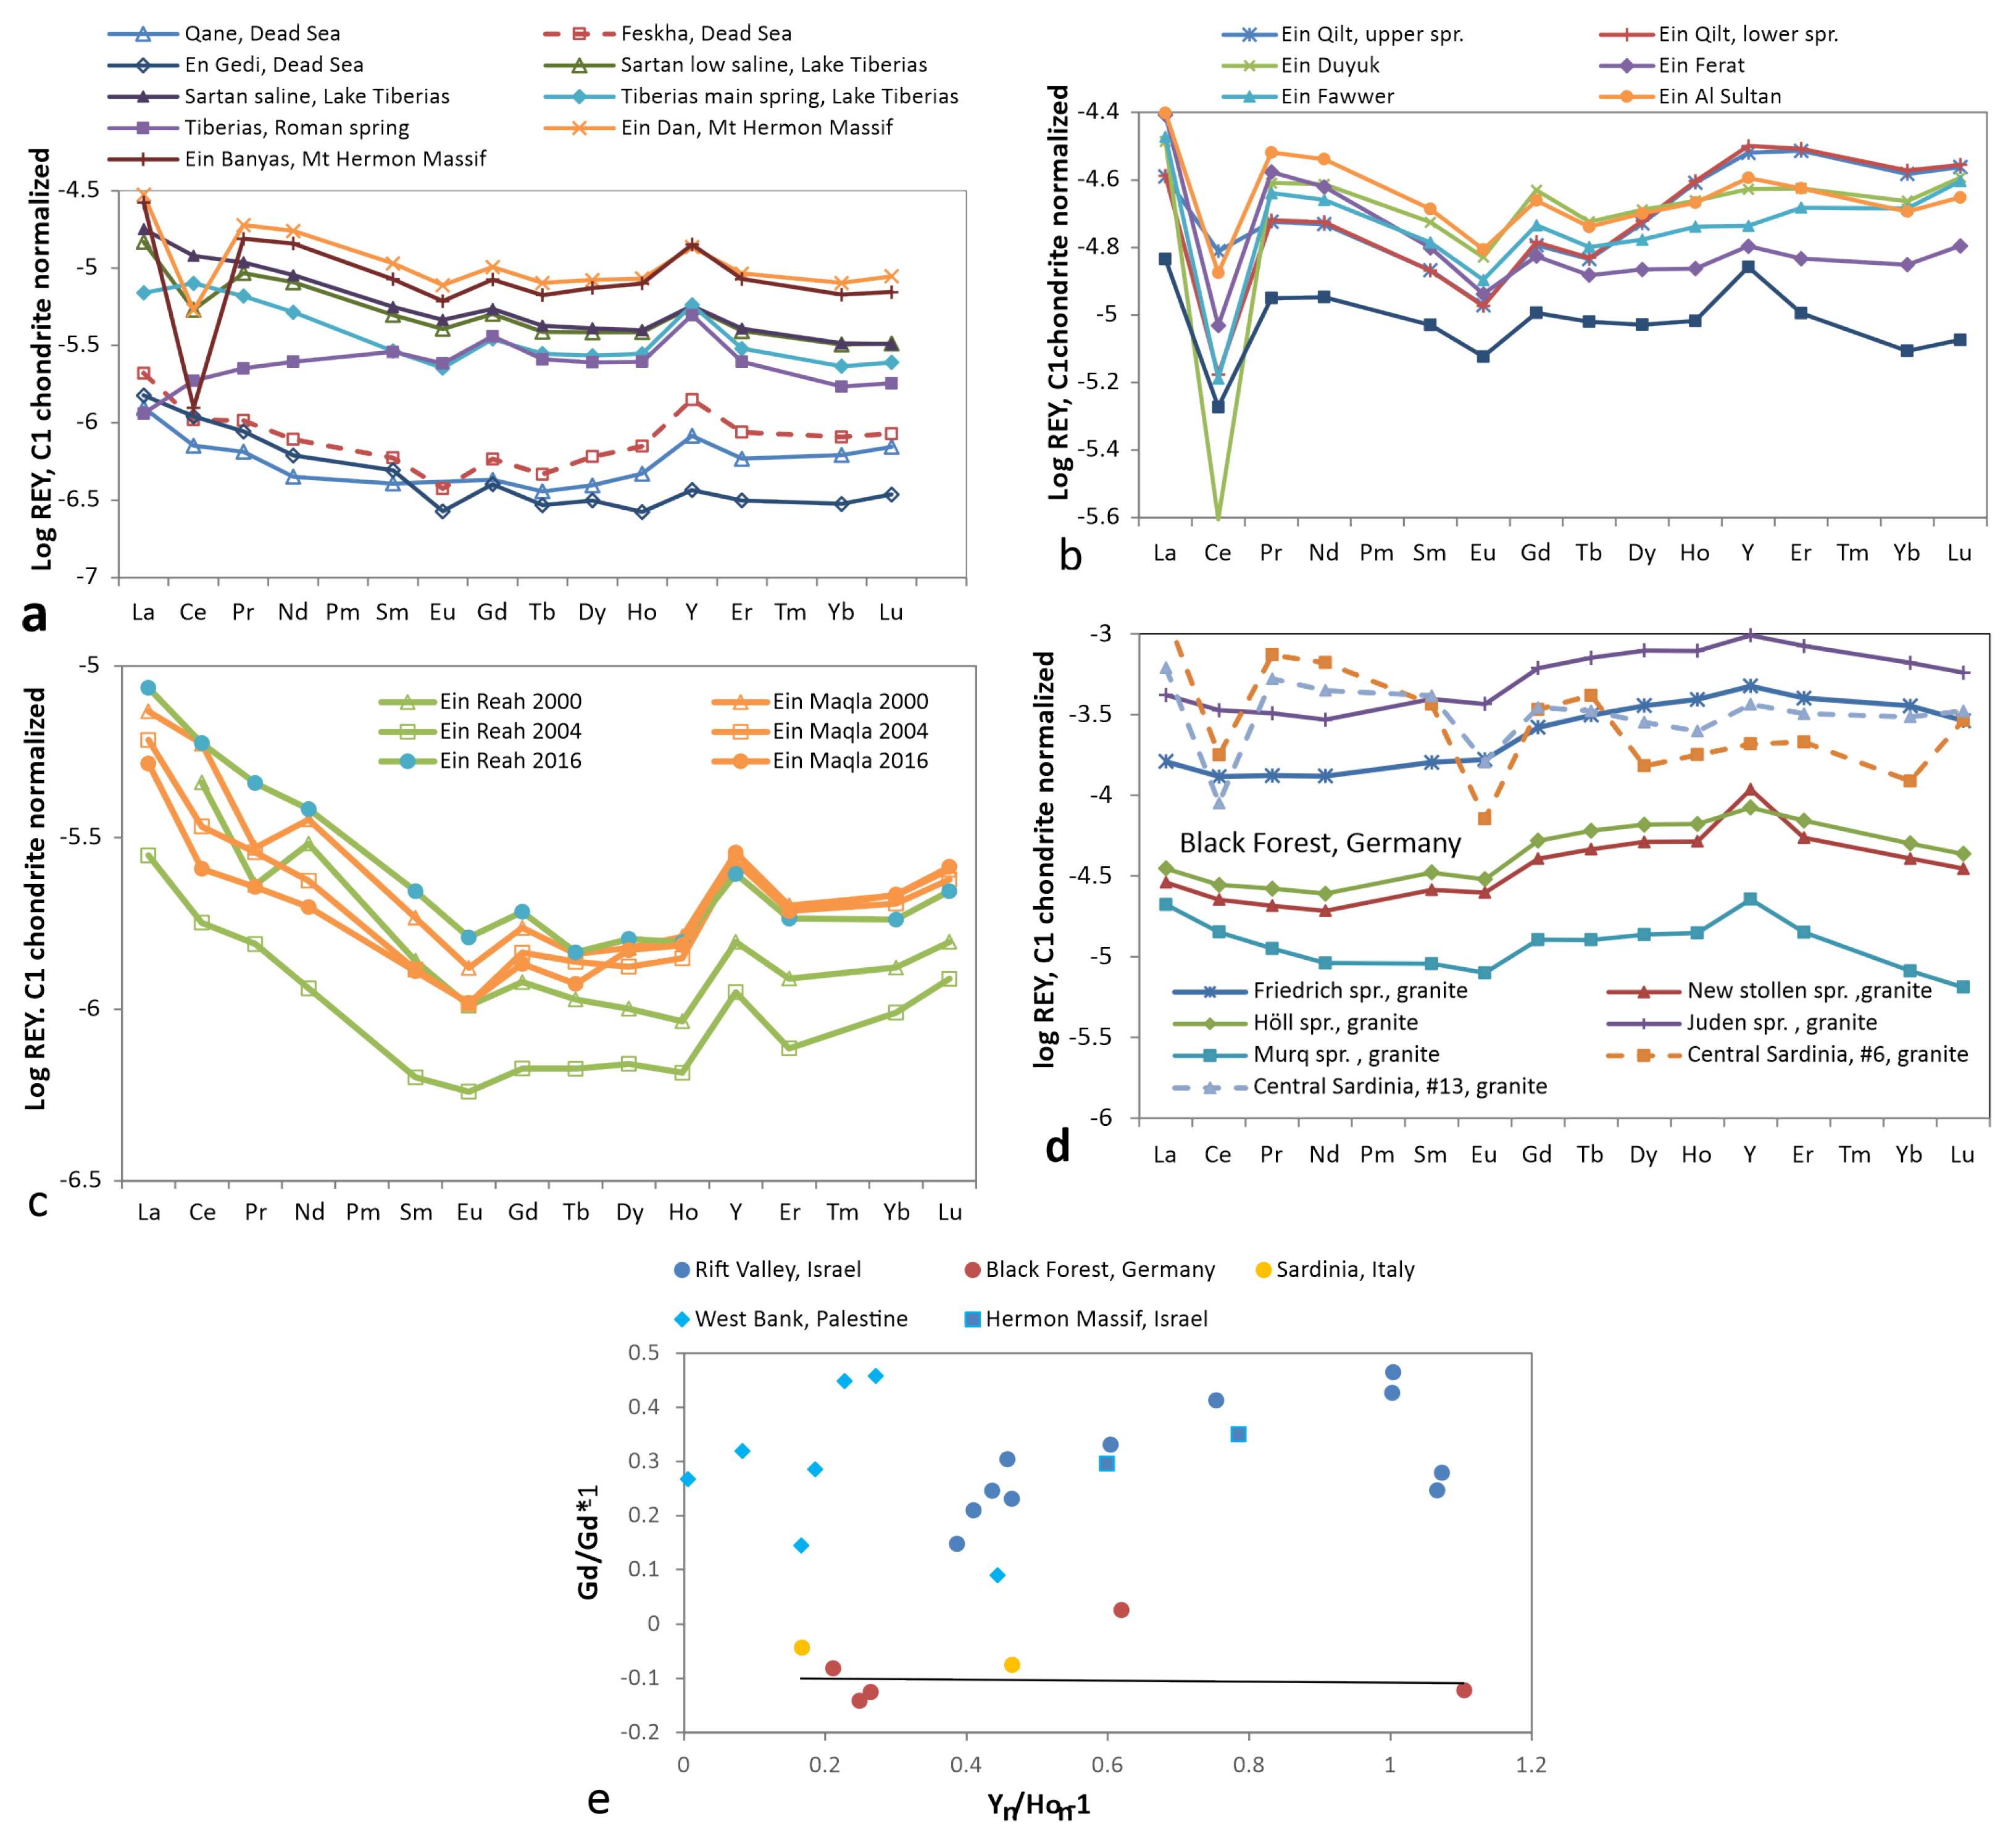
REY patterns of spring waters depend on the availability of leachable minor and/or major minerals in their catchment and aquifer rocks. In Israel. Ein Dan and Ein Banyas waters in the Mt. Hermon Massif originate from Jurassic limestones (Figure 7a). Like the springs of the Jericho area discharging from Upper Campanian limestones (Figure 7b), this type of pattern decreases from La to Eu with strongly negative Ce anomalies and flattens thereafter to Lu showing positive anomalies. Further springs from limestones are the Sartan springs north of Lake Tiberias, Tiberias Main and Roman hot springs at the western shore of Lake Tiberias, En Gedi in the Judea Mountains west of the Dead Sea, and Qane and Feskha at the northern shore of the Dead Sea (Figure 7a).
Weathering of basaltic-rock yields precipitation of FeOOH and scavenging of REY [75]. FeOOH not only precipitates in basalts but FeOOH colloids move with the infiltrating water into underlying aquifer rocks and affects the springs in limestones of Reah and Maqla in Israel (Figure 7c). Typical is the increase of Tb throughout Lu.
The springs from granitic rocks in the Black Forest, Germany, show maxima for normalized Y [76] (Figure 7d). Negative Eu anomalies are inherited from dissolution of feldspars and positive Y anomalies are generated by calcite precipitation during weathering. Gd anomalies seem to be very low or even absent. Due to the extrapolation procedure, Gd anomalies are uncertain when the values of Tb, Dy and Ho scatter. The two patterns from Central Sardinia originating from Carboniferous granitoids [77] resemble those from weathering limestones, probably due to weathering of marble in metamorphites nearby. All these spring waters show wide scatter of Gd and Y anomalies (Figure 5, Figure 6 and Figure 7). Gd anomalies in samples from felsic rocks are between −0.15 and +0.05, whereas those from limestones scatter between 0.1 and 0.5 (Figure 7e).

3.5. Groundwater from Wells with Temperature below 20  ° C

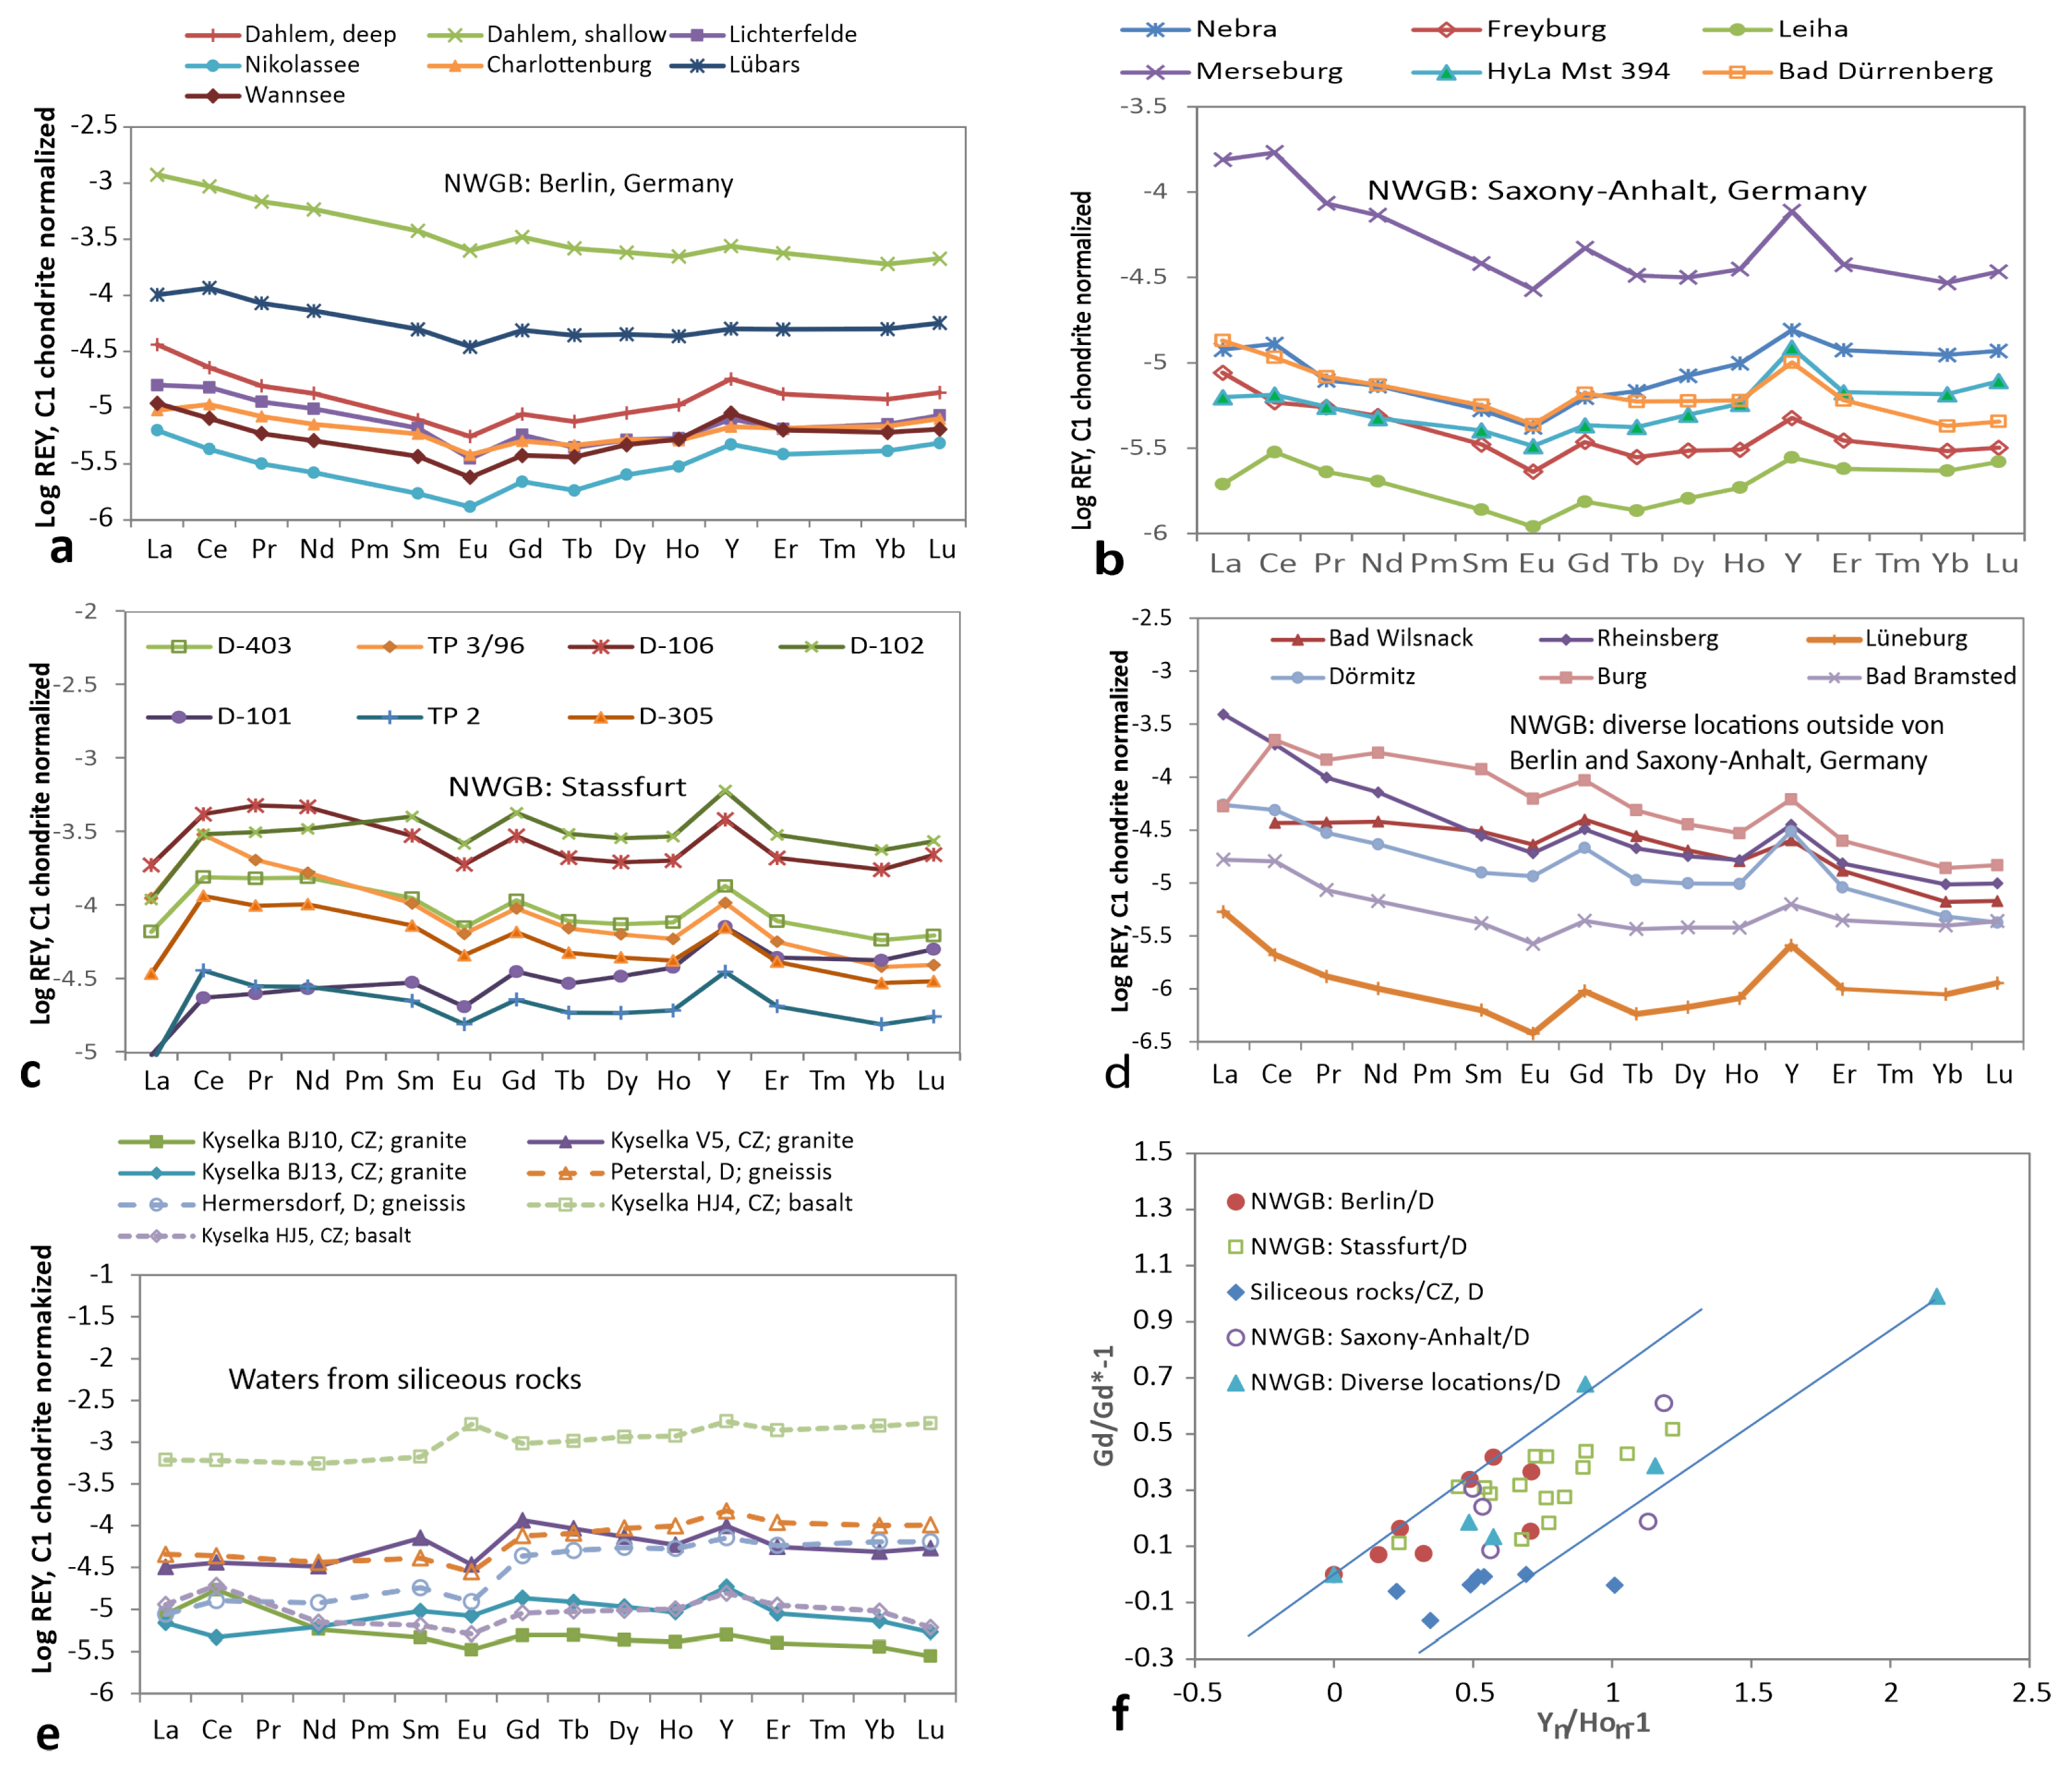
Groundwater from observation wells in Triassic to Pleistocene sedimentary rocks in the Permo-Carboniferous North-Western German Basin, NWGB, show regionally varying REY patterns (Figure 8a–d). The brackish to saline samples from observation wells above the old Stassfurt salt mine represent mixtures of fresh water and leachates of salts. The patterns of the groundwater from granites in the Black Forest, Germany [63], and from granites, basalts and gneisses in the Czech Republic [47] reveal variable types of REY patterns (Figure 8e). The correlation of Gd and Y anomalies scatter widely with slopes of trend lines of about 0.5 (Figure 8f).

3.6. Thermal Water/Brine (20–50  ° C)

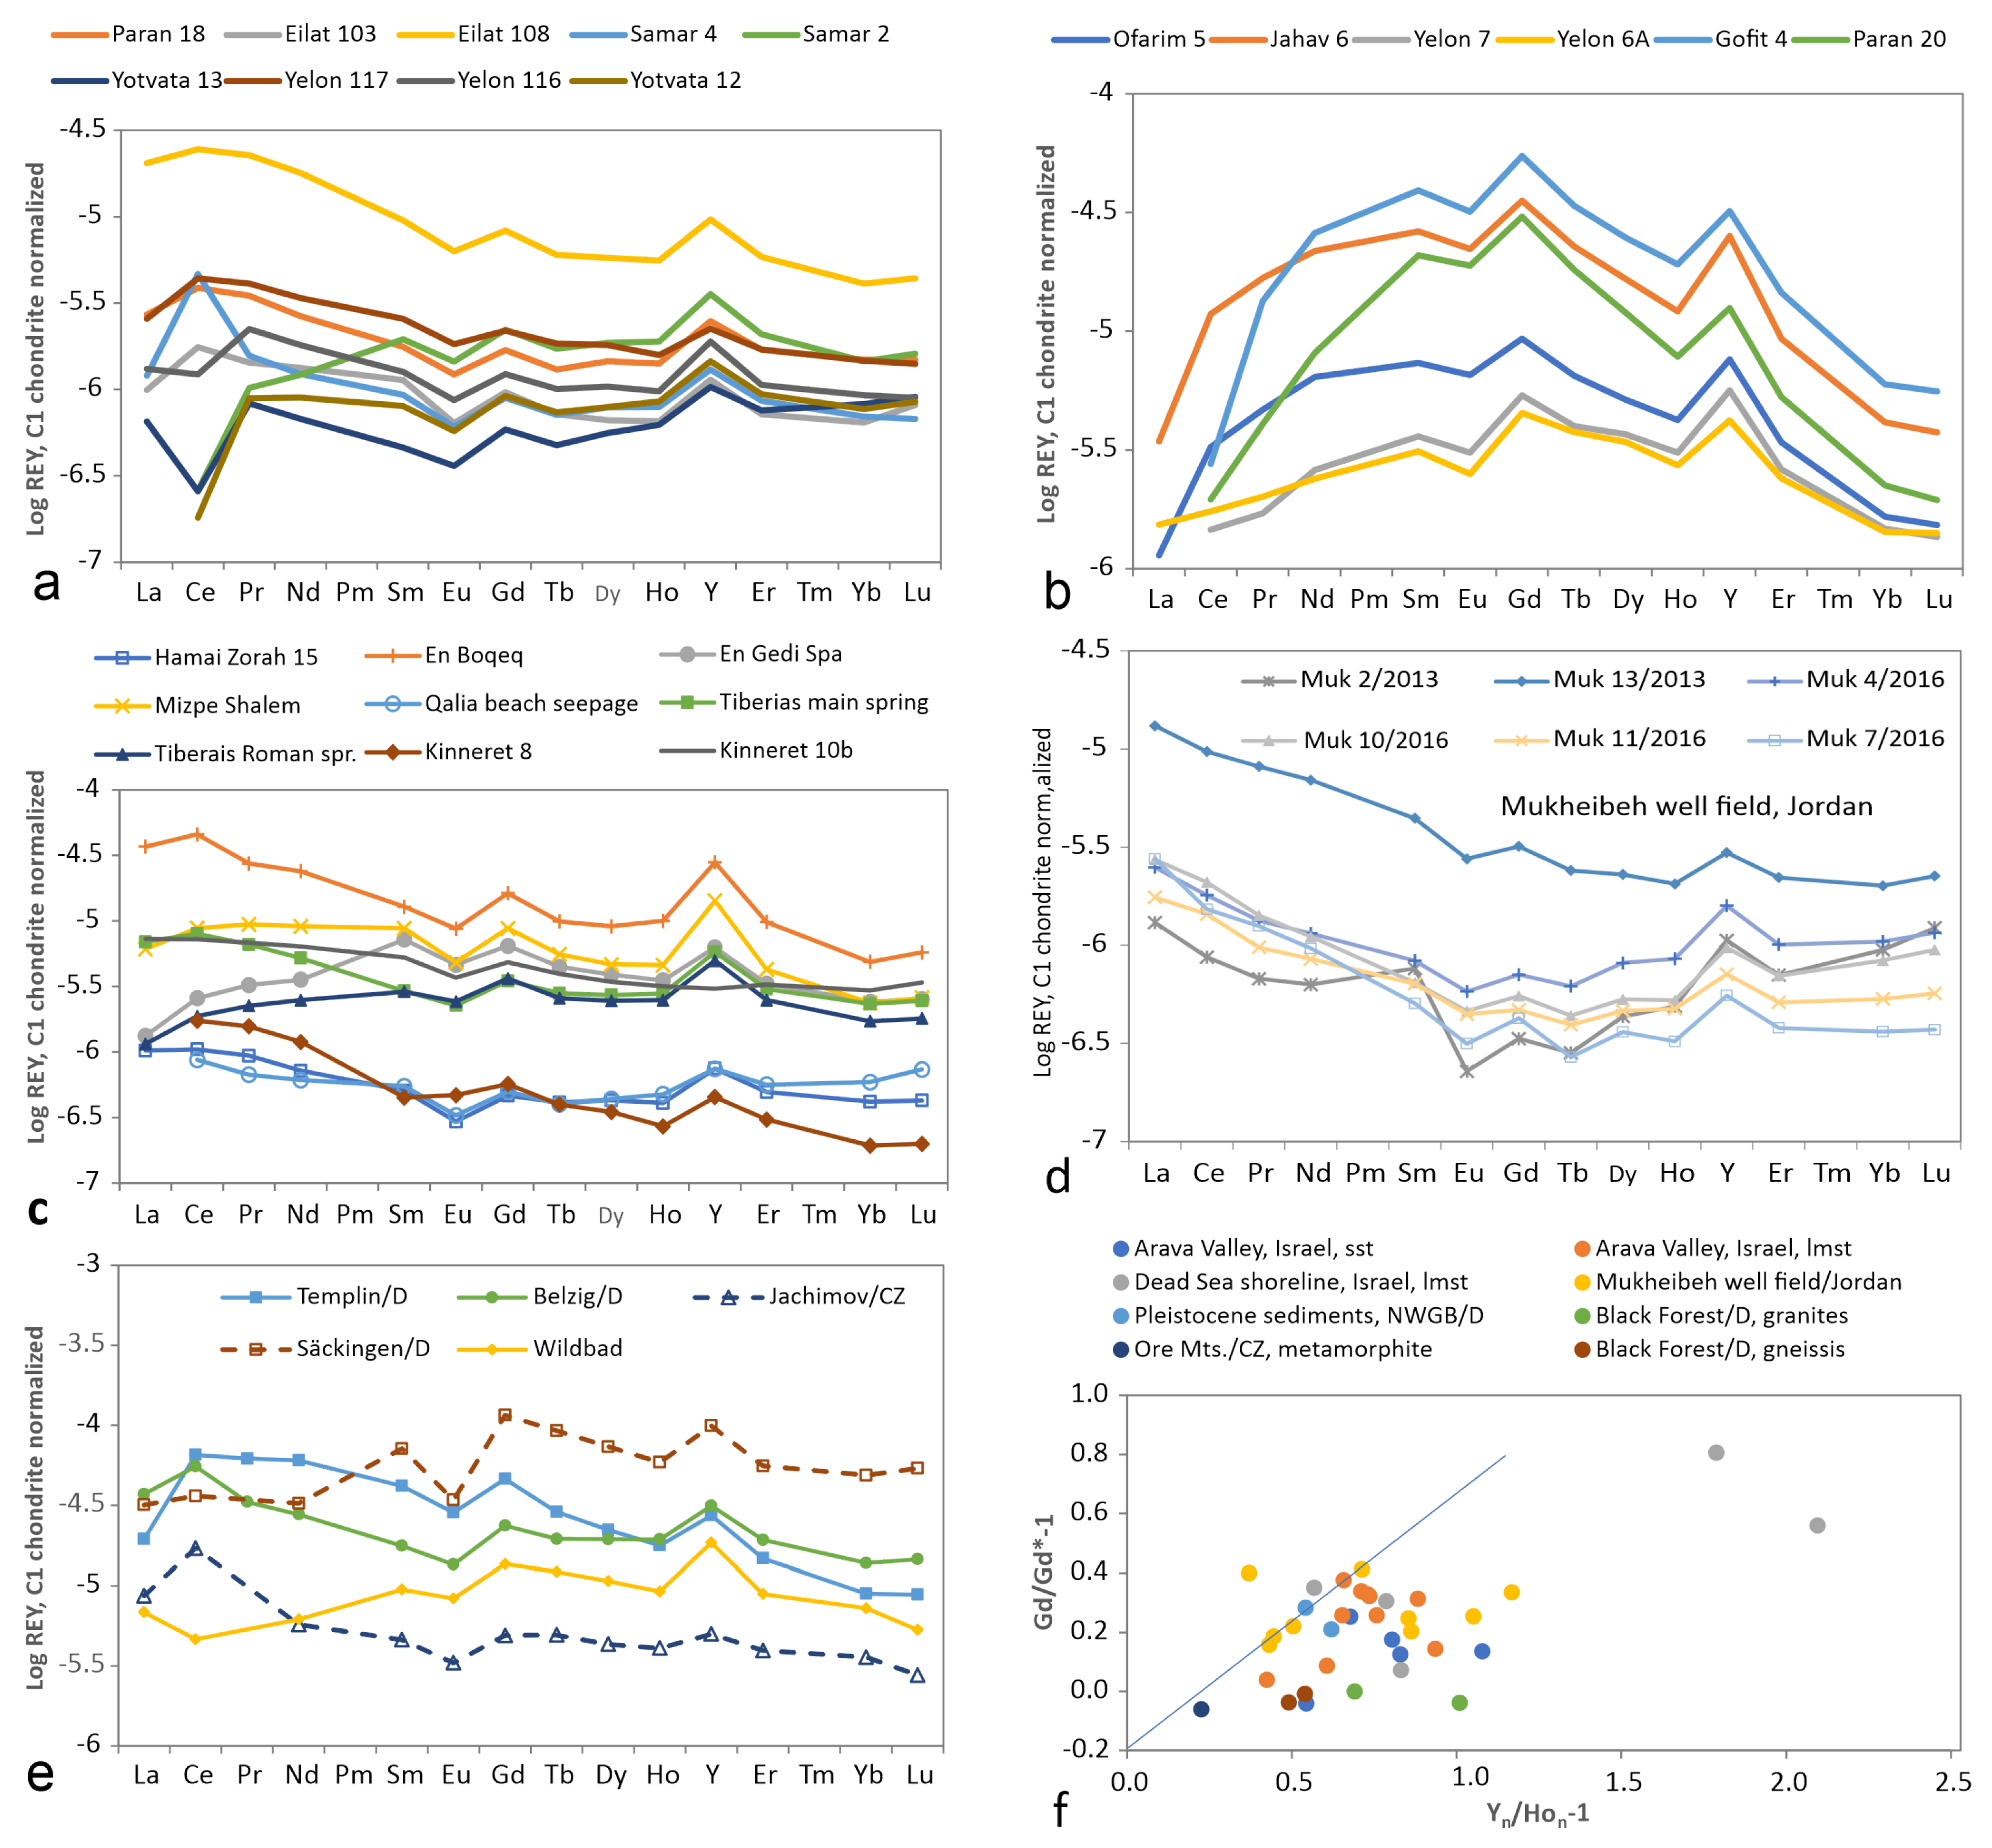
In the Arava Valley, Israel, two types of thermal groundwater coexist side by side due to block faulting of the western Rift flank [81]. The leaching of limestones reveals positive Gd and Y anomalies and negative Eu anomalies (Figure 9a). The convex type of patterns results from leaching of phosphates and gypsum from the Nubian, cemented sandstones in the Negev (Figure 9b) because phosphates are typically enriched in middle REE [38,82]. The sandstone patterns show positive Y and Gd anomalies and negative Ce and Eu anomalies. The thermal waters from the shoreline of Lake Tiberias and the Dead Sea are from limestones (Figure 9c) and show positive Gd and Y anomalies. The waters from the Mukheibeh well field in the Yarmouk Valley, Jordan, increasing from Eu to Lu, are mixtures of waters from limestone and basaltic rocks (Figure 9d). The limestone waters are distinguishable from those from granites such as those from Jachimov, Ore Mountains, Czech Republic or Säckingen and Wildbad, Black Forest, Germany (Figure 9e). The waters from Templin and Bad Belzig (NWGB) are produced from Jurassic limestones and limnic to fluvial deposits, respectively, and rarely show Gd anomalies. The cross plots of Y and Gd anomalies yield poor correlation with maximal slopes up to 0.5 (Figure 9f).

3.7. Geothermal Water/Brine

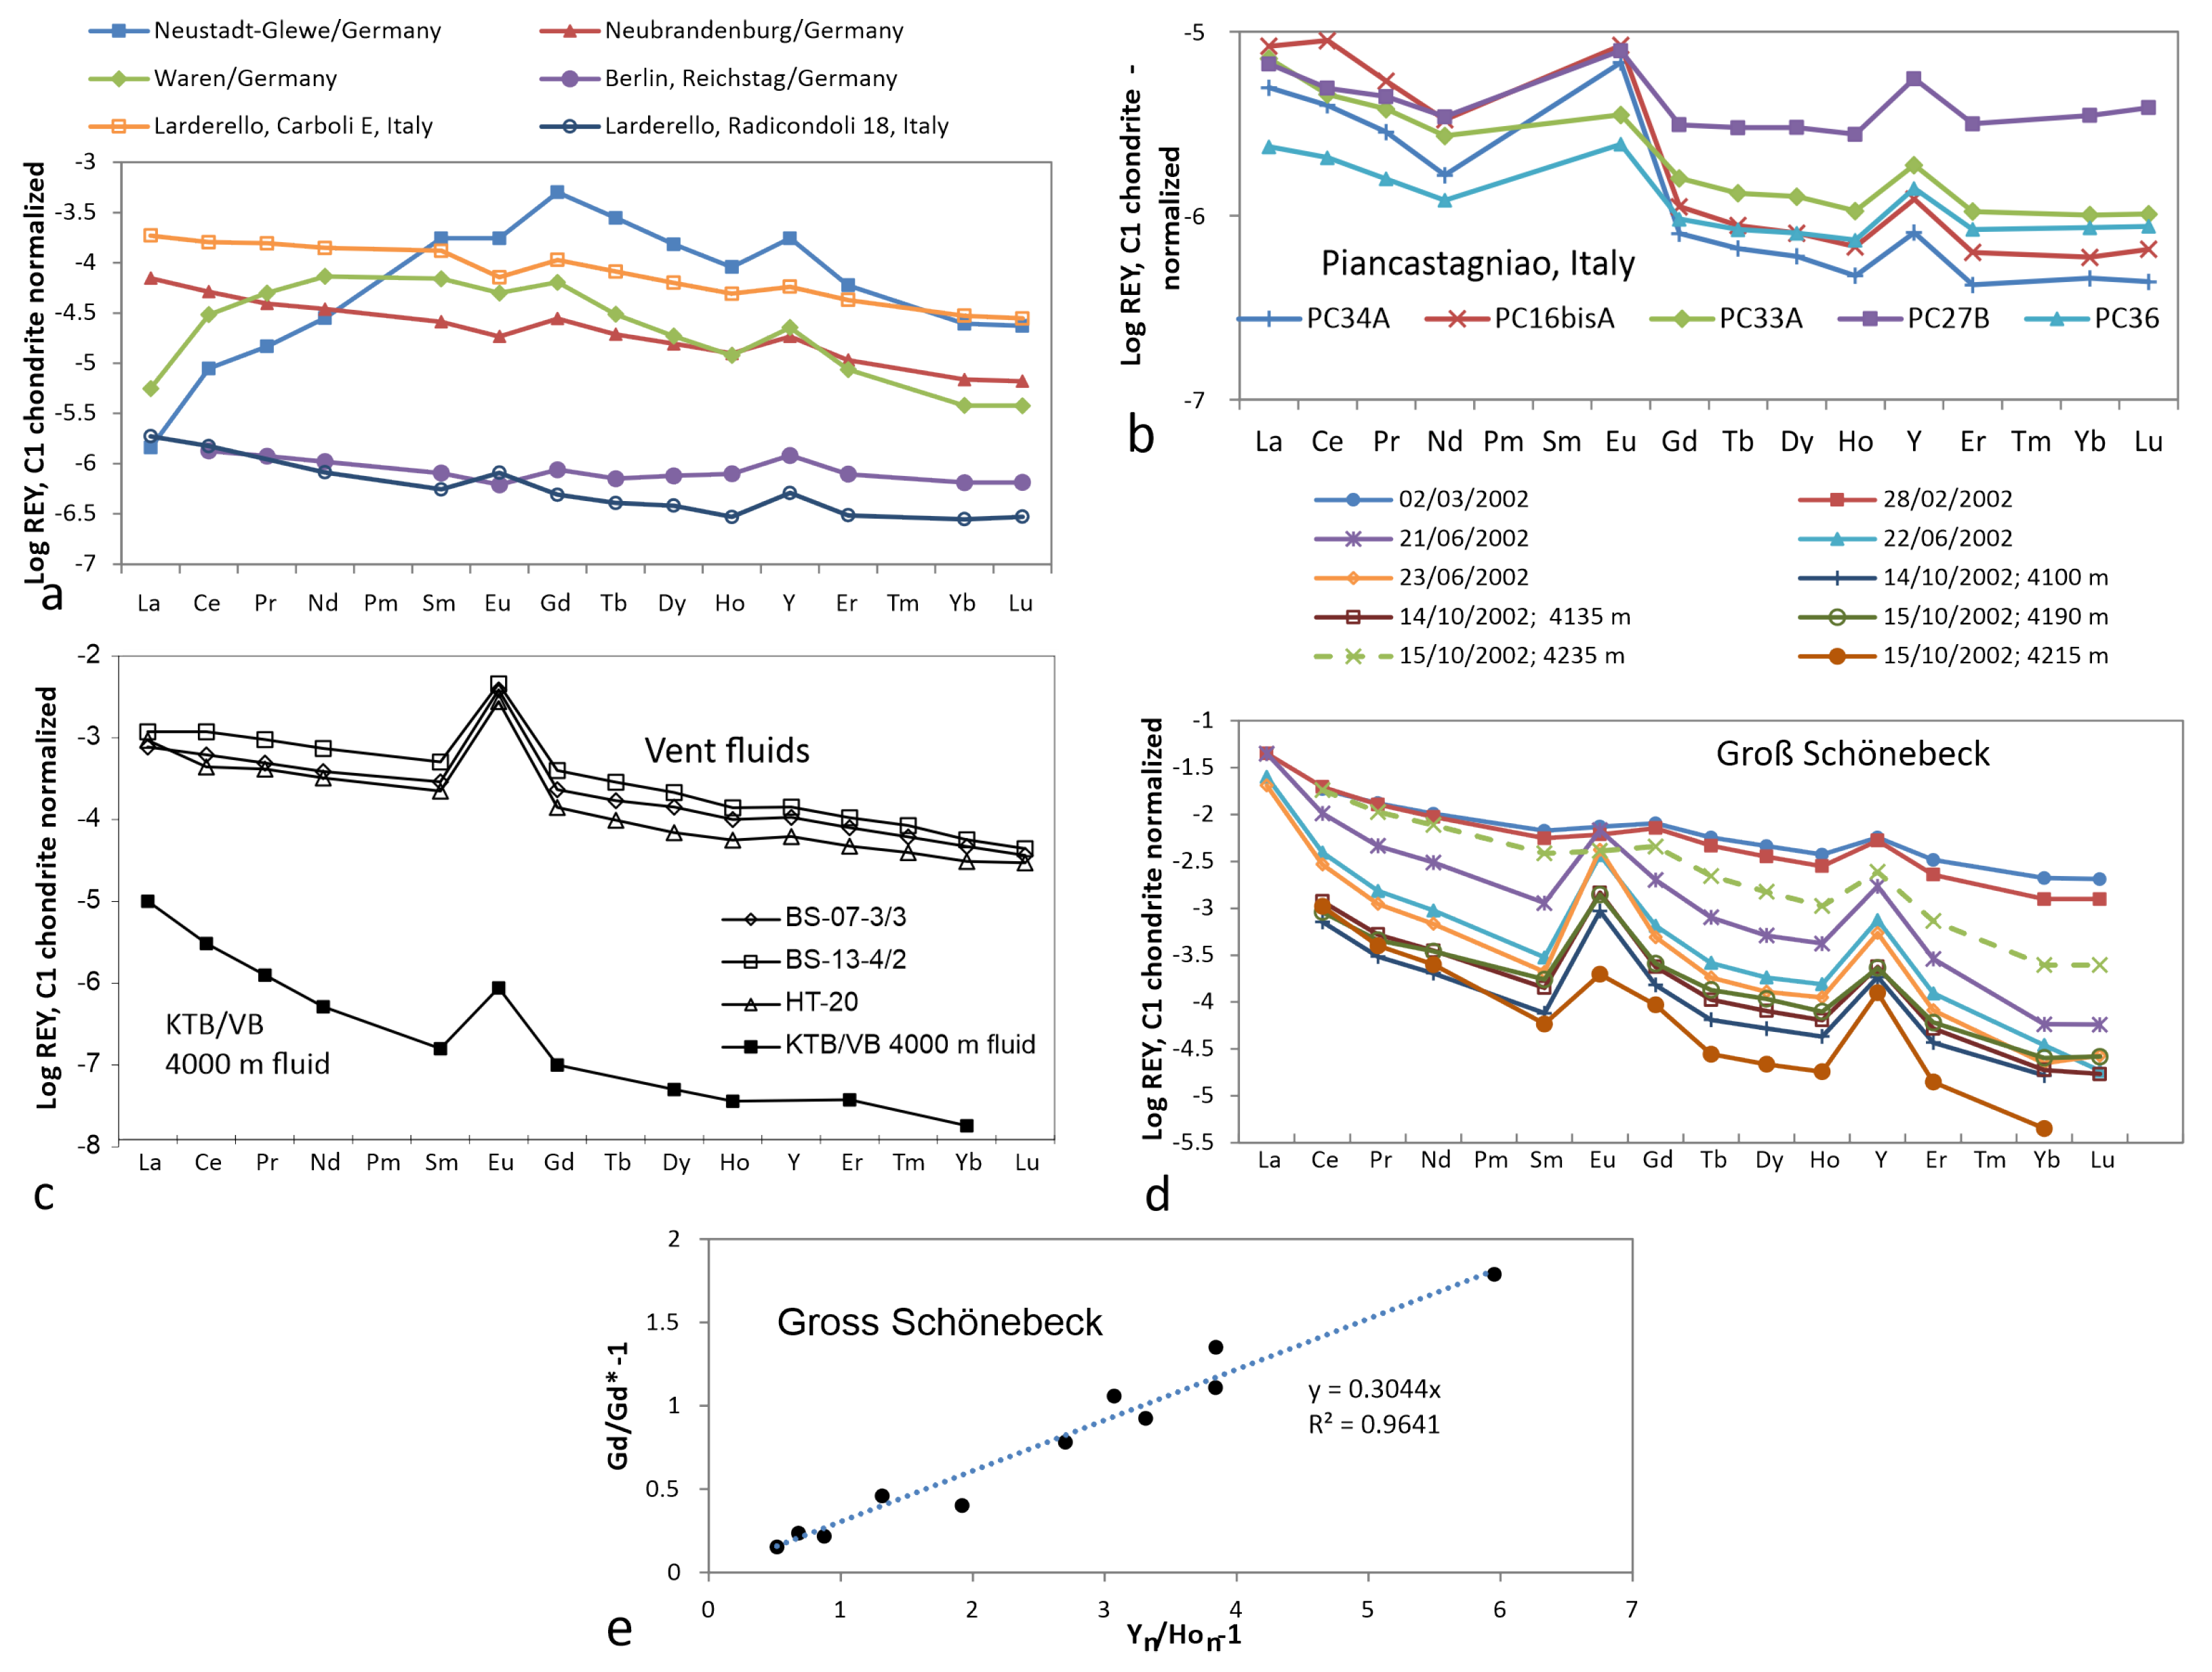
The geothermal waters with temperature >50 ° C from all over the North-West German Basin [78,79] produce brines from Permian to Jurassic formations. One of them resembles REY patterns as in Figure 9b. These brines show REY patterns with Y anomalies but rarely Gd anomalies (Figure 10a). The waters from the Italian geothermal fields of Larderello-Travale (Figure 10a) and Piancastagnaio (Figure 10b) continuously decrease from La through Lu with variable Eu and positive Y anomalies [83,84]. Reactivation and fracking of the well Groß Schönebeck, drilled into the reddish Permian strata (Rotliegend) north of Berlin, yield a wide spread of Y and Gd anomalies due to fracking (Figure 10c) [85]. The brine from the conglomerate (4215 m) is low in REY abundance but shows the highest Gd, Y and Eu anomalies after fracking. The REY abundance in brines before fracking is represented by the two highest patterns. After fracking, the highest anomalies are registered, which decreased with time.
The strongly saline and reducing, 4000 m fluid from the continental deep drilling, KTB/VB in SE Germany, is very low in REE but shows a strongly positive Eu anomaly, indicating that Eu was divalent under the reducing conditions and temperature of 119 ° C [88] (Figure 10d). The chemically reducing vent fluids from mid-ocean ridges [86,87] show strong Eu anomalies but no Gd anomalies and only very small Y anomalies (Figure 10d). These waters are low in pH (pH of 2 to 4 at 100 to 400 ° C).
Among all these geothermal brines, only those from well Gross Schönebeck show Gd and Y anomalies which are highly correlated due to fracking (Figure 10e).

4. Discussion

Dissolution of minerals in soils, evaporites and weathering of catchment and underlying rocks are the fundamental processes by which any infiltrating precipitation is mineralized. REY in groundwater depends on leachable components and adsorption onto and ion exchange into mineral faces [54]. Weathering of igneous rocks leads to isomorphous replacement of Ca 2 + by REY 3 + during precipitation of mainly carbonates or scavenging by Fe-Mn oxihydroxides.

4.1. Water–Rock Interaction

Infiltration of precipitation with low REY abundance into sediments, sedimentary and igneous rocks hosting brines with high REY concentrations induces renewed equilibration between solid and fluid phases in their contact zone. Due to infiltration of HCO 3 in fresh water, some calcite or aragonite precipitate and incorporate REY due to which the latter decrease in pore water. Most of the released REY from dissolving major, minor and trace minerals is locally adsorbed onto surfaces of recrystallizing minerals. For instance, more than 99% of released REY from dissolved limestones are immediately adsorbed by oxihydroxide coatings or bound by ion exchange in surfaces of carbonates [54].
In the Dead Sea (Figure 5), flushed-in calcite is converted into aragonite [89]. Aragonite incorporates less REY than calcite [29]. Therefore, REY abundances increase in Dead Sea brine. During diagenesis of carbonate sediments under marine conditions, REY are increased in limestone [90,91]. The high variability of Ce anomalies in diagenetic carbonates is caused by synsedimentation of clay minerals containing higher REY abundances than in the original carbonate sediment.
The low REY abundance in KTB/VB 4000 m fluid (Figure 10d) is attributed to crystallization of allanite (epidote) (Ce,Ca,Y) 2 (AlFe 3 + ) 3 (SiO 4 )(Si 2 O 7 )O(OH) on fractures in amphibolites under reducing conditions [88]. Therefore, Eu(II) is less incorporated in allanite.
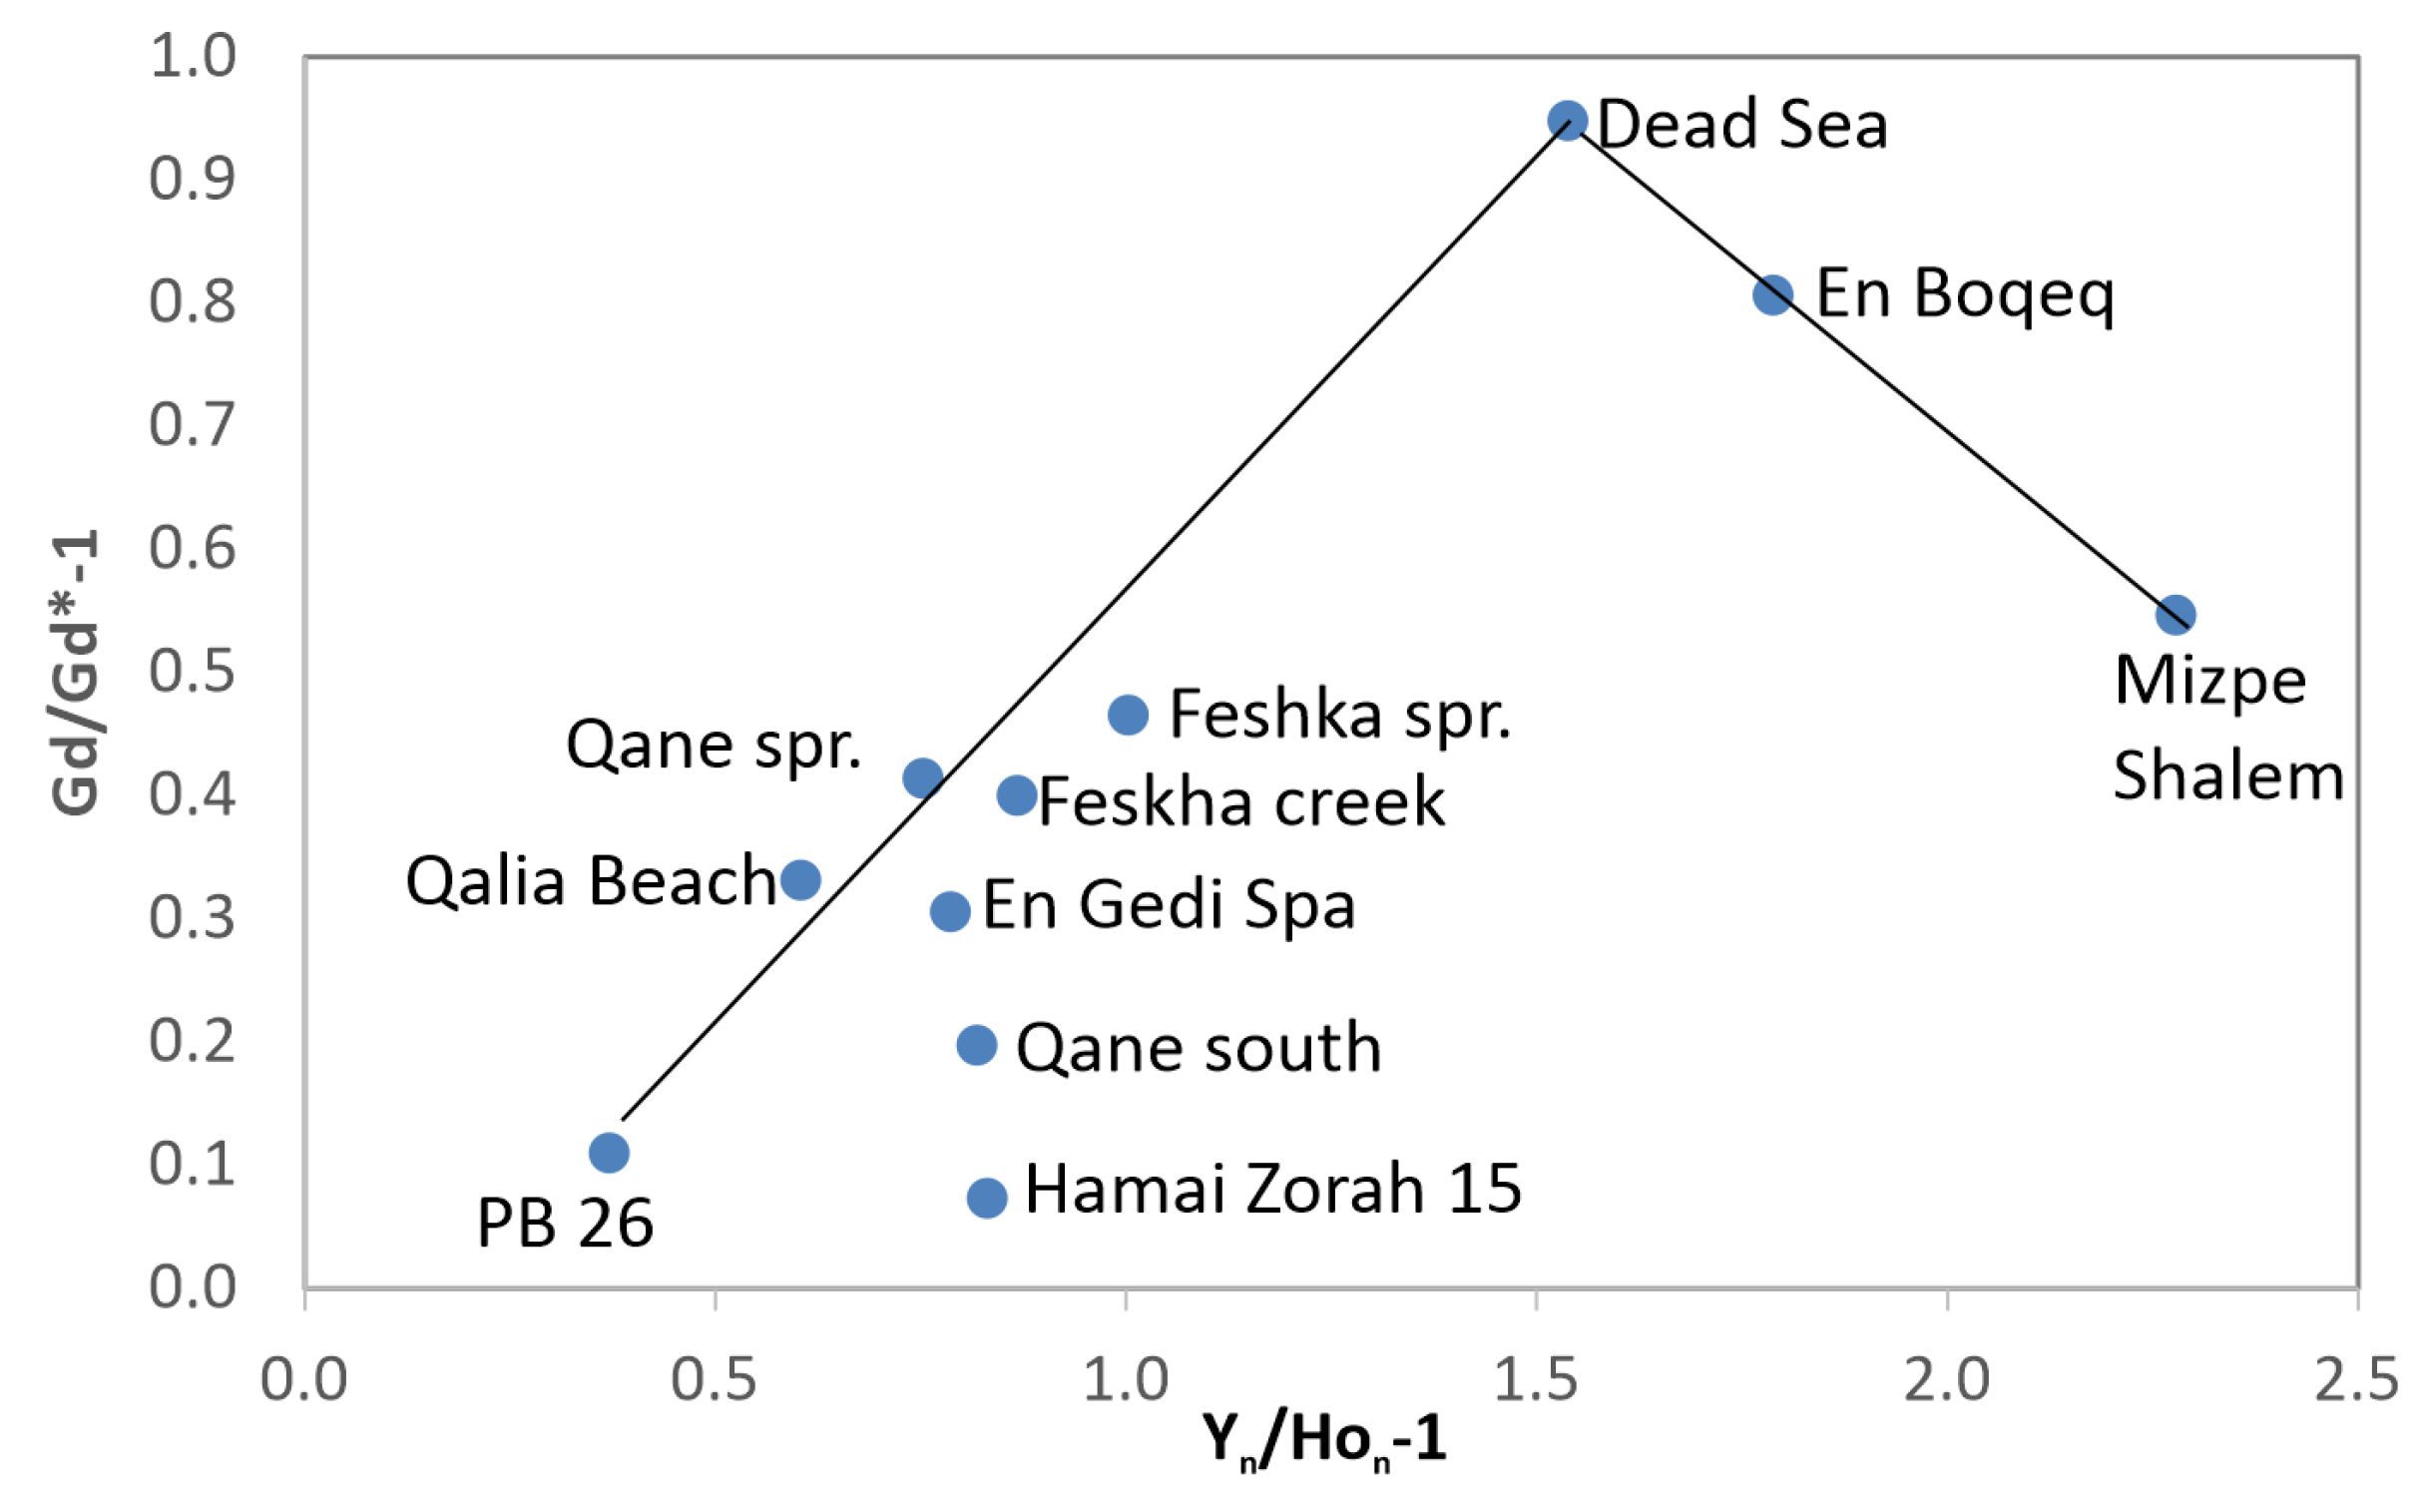
During infiltration of Mg 2 + -rich modern Dead Sea brine at higher stands into adjacent limestones, REE decrease in concentration due to mixing with fresh water, showing negligible anomalies. Under these new conditions, Ho (like all the other REE) is lowered due to coprecipitation with carbonates and Y anomalies increase because of the decrease of Ho. Furthermore, Y is less incorporated in new minerals because of its hydrophillic character (Figure 11). This process may explain the wide spread of anomalies in Figure 8f and Figure 9f. Because the brines are saturated with respect to calcite or aragonite, the infiltrated and mixed brines interact with calcite surfaces which become magnesian-calcitic in composition and REY-rich due to ion exchange with Ca 2 + in calcite surfaces [54]. Y seems to be less involved in this process than Ho [43] and thereby Y/Ho increases in the aqueous phase.
REY are preferably incorporated into Ca 2 + -bearing minerals because of the similarity of ionic sizes (CN VIII: Ca 2 + 1.26 Å; La 3 + 1.30 to Lu 3 + 1.12 Å; ref. [92]). In flow-controlled processes (either solids settling in the water column or water moving through pores), Gd and Y effectively develop positive anomalies with time because Gd and Y are less adsorbed and/or incorporated in minerals than their nearest neighbors. Thus, the hydrophillic Gd and Y are slightly accumulated in the aqueous phase (Figure 1, Figure 2, Figure 4, Figure 5 and Figure 8). In order to explain these positive Gd and Y anomalies in seawater, the incorporation of REY must be controlled by ion species that show less negative free energies of aqueous tervalent REY than Gd and Y (Figure 2a) and lower formation constants of MCO 3 + than their nearest neighbors (Figure 1a). The resulting difference in covalency and physico-chemical parameters seemingly is the source of the hydrophillic character of Gd and Y and different partition coefficients of REE and Y between calcite and solution.
Positive Eu anomalies in groundwater are inherited by weathering of feldspars with their positive Eu anomalies, such as in vent fluids and those from the geothermal wells KTB/VB and Gross Schönebeck (Figure 10). In seawater and waters of lakes and continental seas, the negative Eu anomalies are inherited from weathering of limestones with their negative Eu anomalies (Figure 4, Figure 5, Figure 6, Figure 7 and Figure 8). Positive Eu anomalies are generated in reducing environments of high-temperature geothermal brines [45,47] when Eu(III) changes into Eu(II) and its radius changes from 1.14 to 1.39 Å (CN VIII) [92].
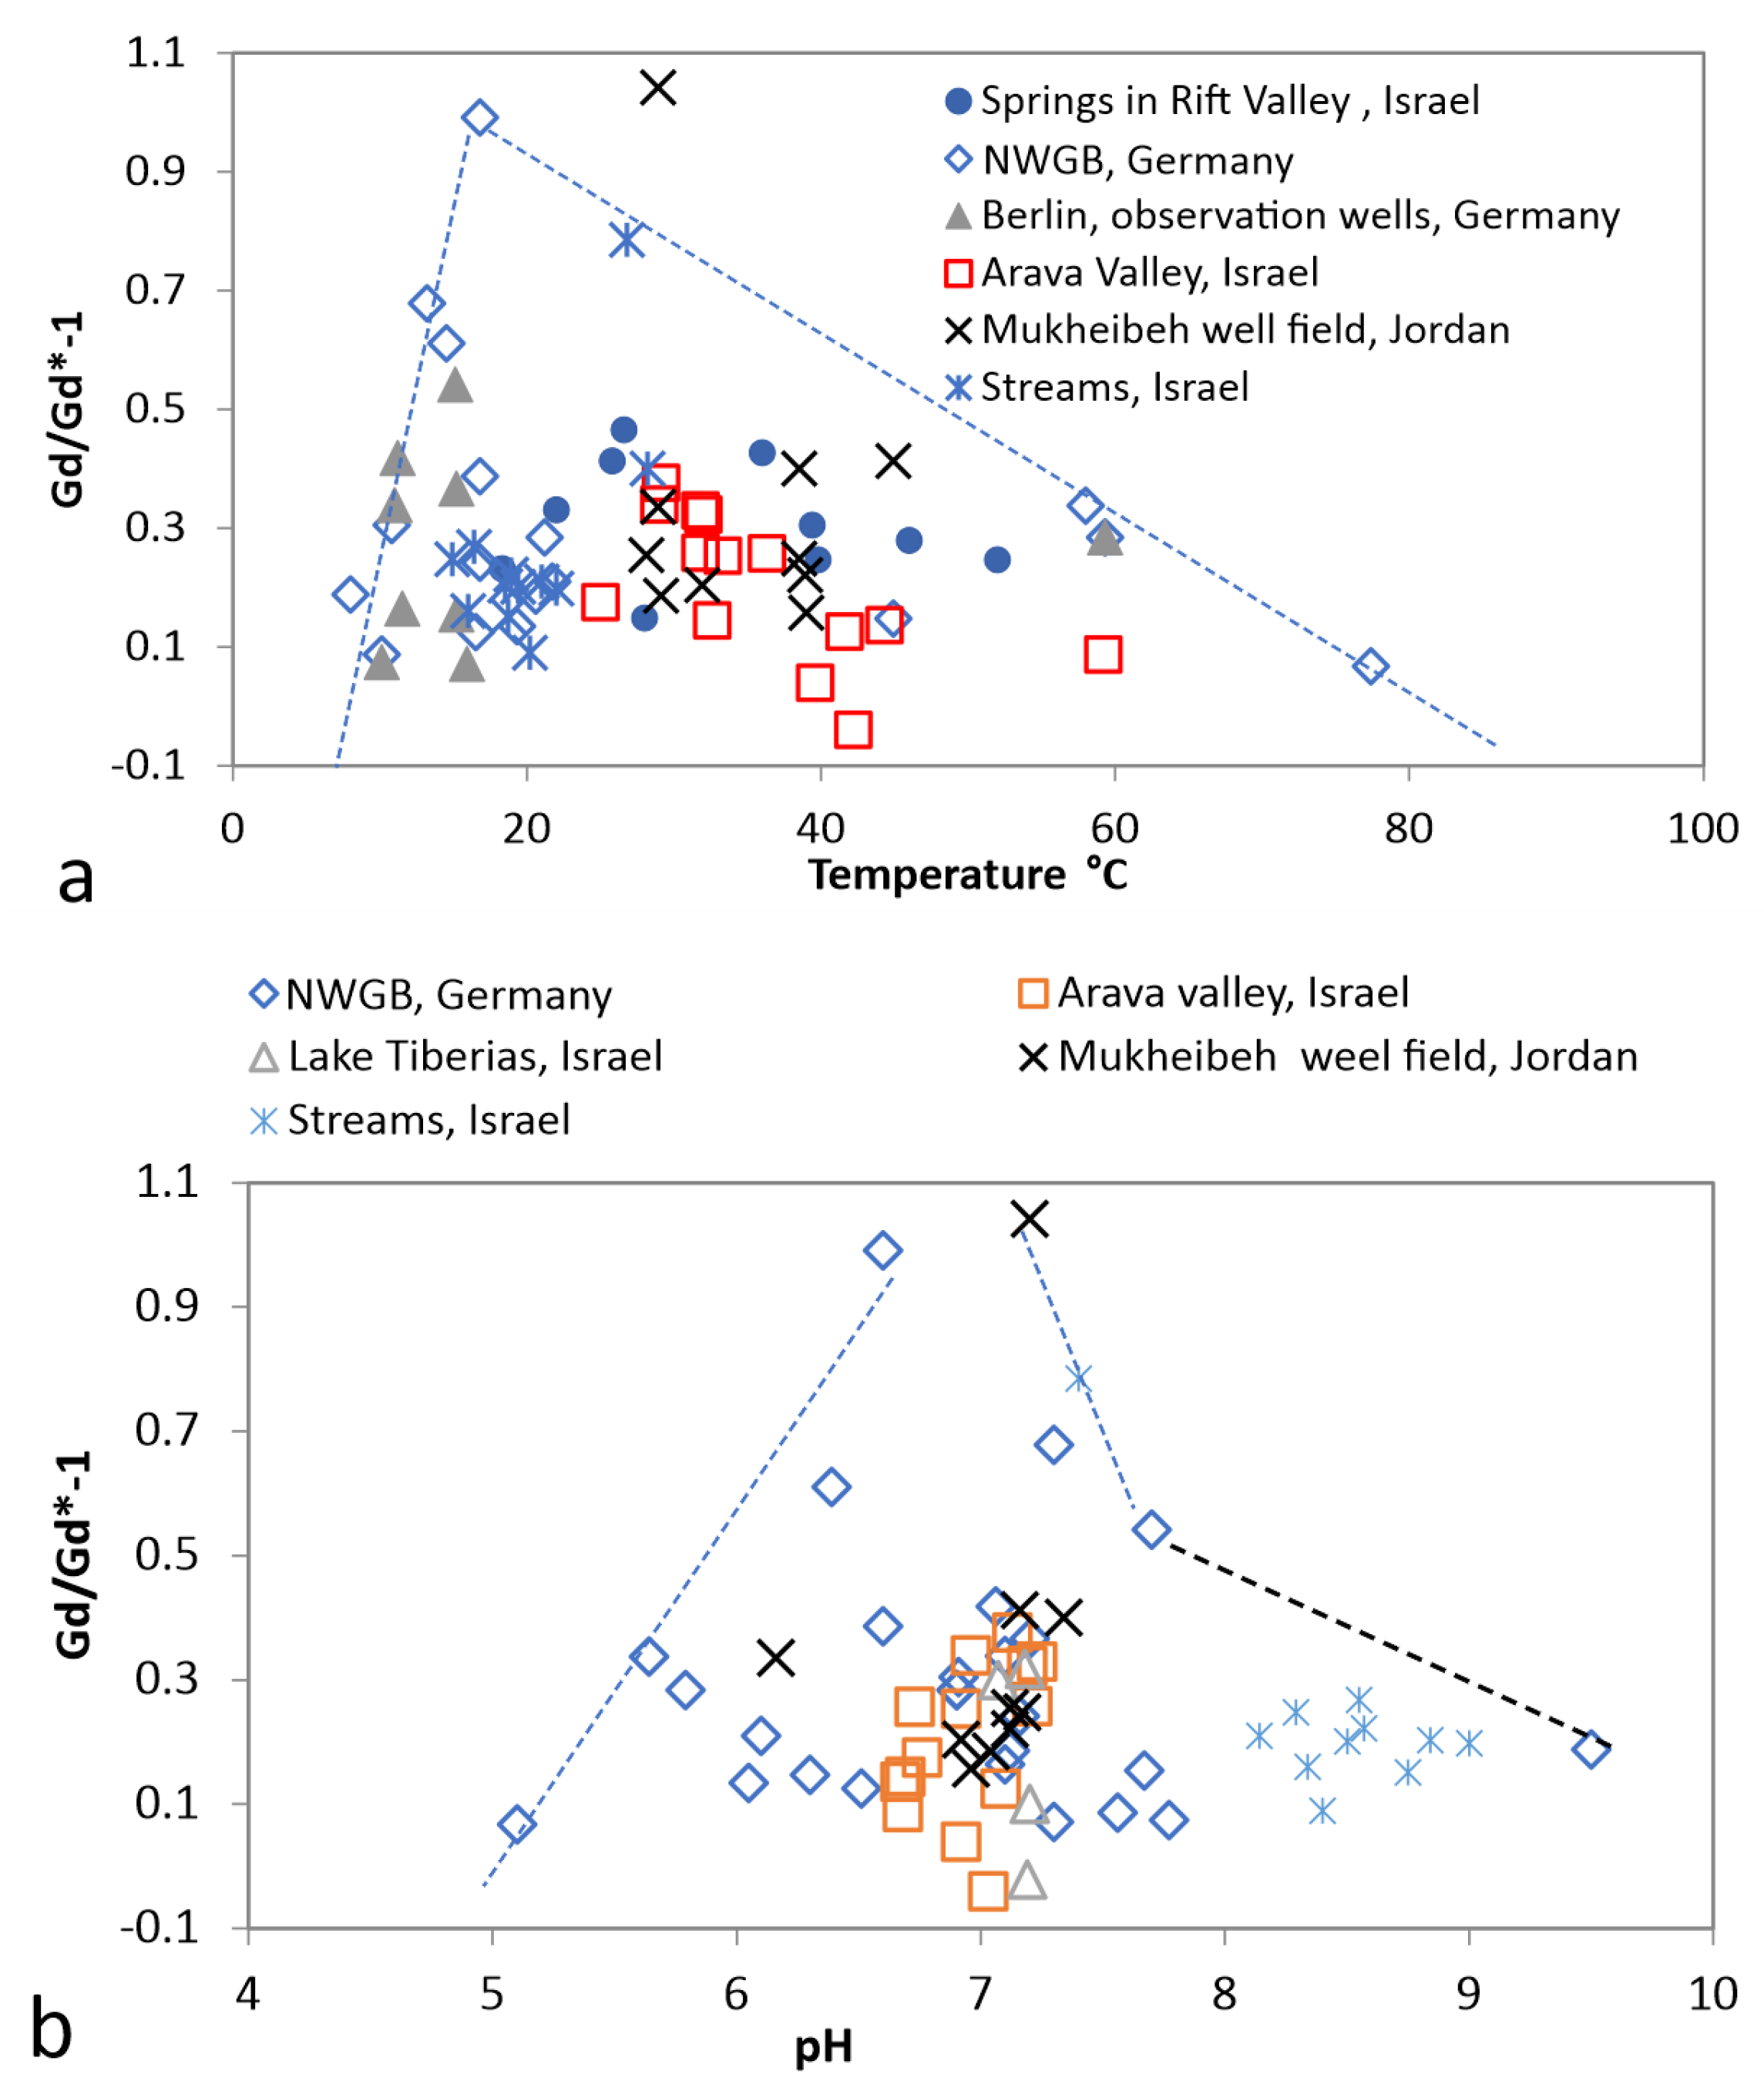
Cross plots of Gd anomalies in groundwater vs temperature yield increase of anomalies in the range of 10–20 ° C and decrease from 30–90 ° C (Figure 12a). Cross plots of Gd anomalies vs pH reveal steep increase of Gd in the pH range between 5 and 6 and decrease between 7 and 10 (Figure 12b). This is in agreement with the reports in [93,94]. No dependence on salinity is visible up to 250 g/l TDS.

4.2. Scavenging by Fe-Mn-Oxihydroxides

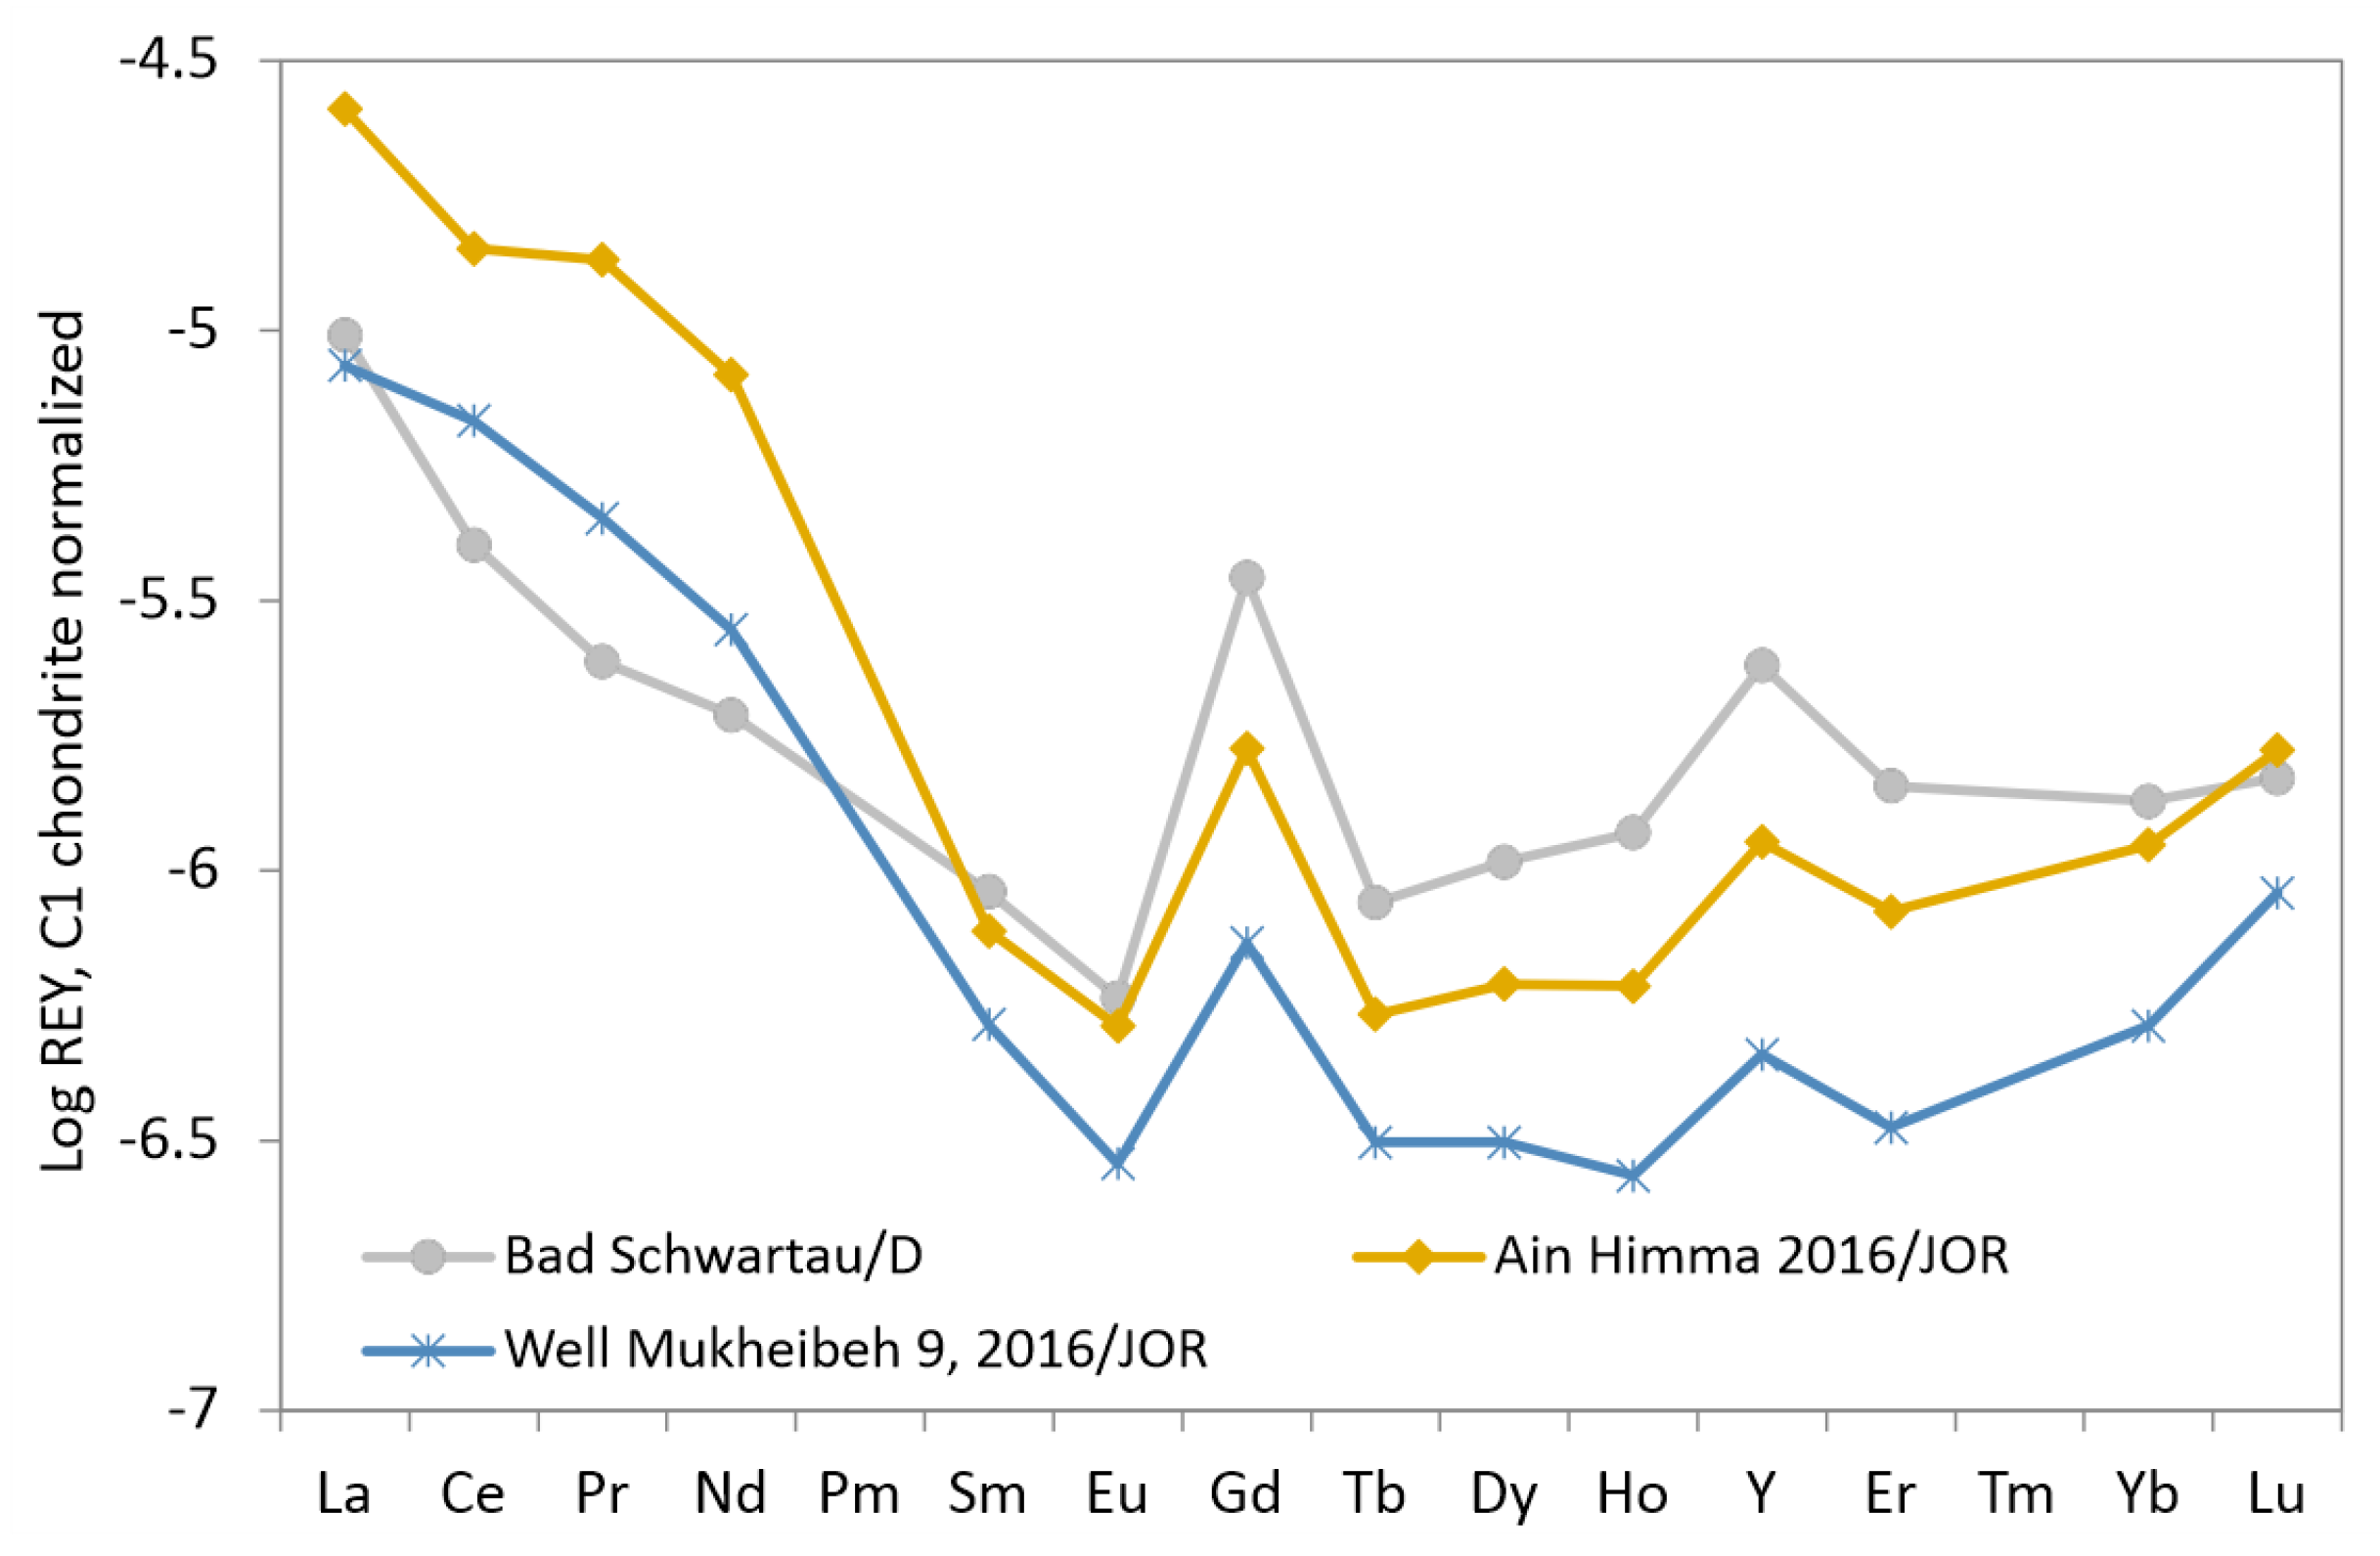
In Fe-Mn oxihydroxides, adsorbed Ce(III) is oxidized to Ce(IV) and negative Ce anomalies develop in waters. In the oxygen-rich surface water of stratified lakes, negative Ce anomalies develop due to catalytic oxidation of Ce on particles coated by Mn-Fe oxihydroxides and REY are adsorbed [95]. Gd and Y are less scavenged than their nearest neighbors [10,33,35]. If these oxihydroxides dissolve under varied conditions, the resulting groundwater does not feature Gd anomalies and it has none to slightly negative Y anomalies (Figure 7d). If FeOOH is reworked by phosphates, groundwater with relatively high Gd but small Y anomalies result by precipitation of churchite, Y(HREE)PO 4 [76]. Such examples are given in Figure 13, where well waters of Bad Schwartau, Germany, Mukheibeh and nearby Ain Himma, Jordan show smaller Y anomalies than Gd anomalies. The Jordanian sources showed this behavior only in 2016, although they have been sampled since 2000 [53].
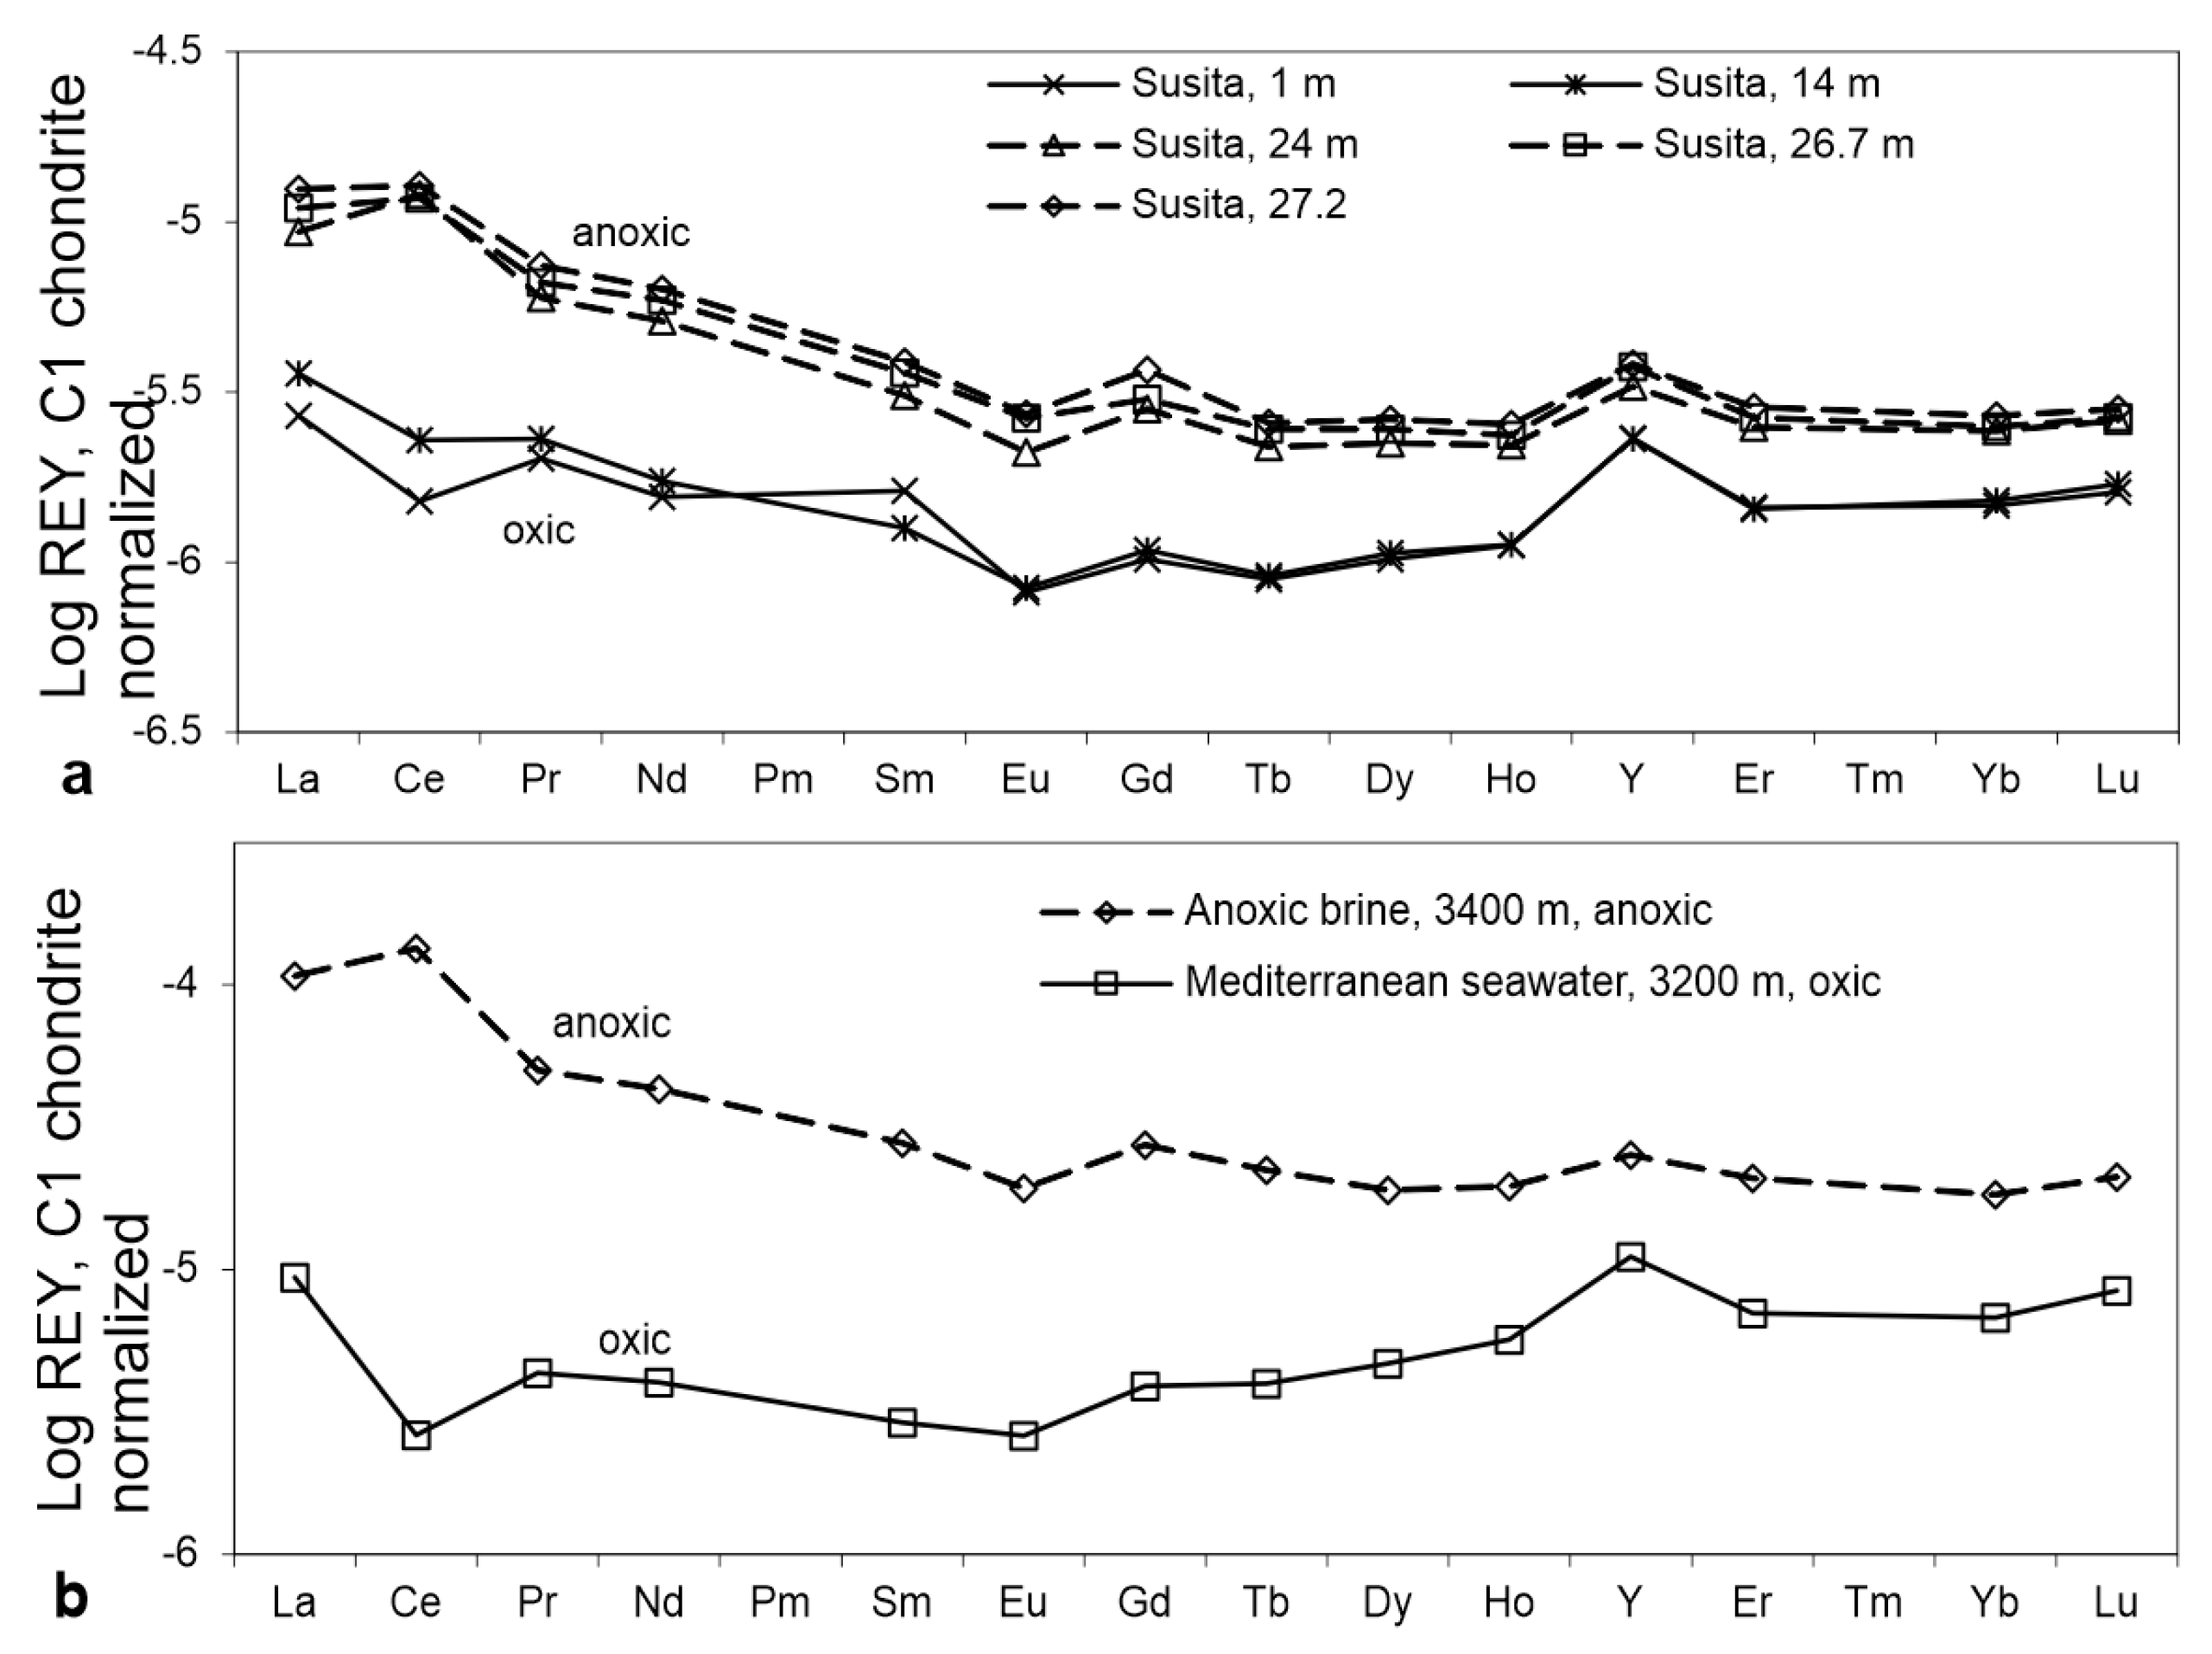
When settling particles pass the reducing bottom water, the Fe-Mn coatings are dissolved and generate positive Ce anomalies, such as in the hypolimnion of Lake Tiberias or in the deep Tyro basin (Figure 4c, Figure 5a and Figure 14). Although the processes in the epi-/hypolimnion of Lake Tiberias, Israel, differ in stratification in the Tyro basin, the final results are very similar (Figure 14). Different are the quantities of Gd and Y involved. For instance, Y increases from 40 in oxic to 60 pmol/L in anoxic water in the yearly overturning Lake Tiberias, and from 200 to 400 pmol/L in the deep stagnant brine of the Tyro Basin in the eastern Mediterranean during many millions of years. Gd increases by factors of 5 and 10 in Lake Tiberias and Tyro Basin, respectively [59], which reflects the importance of REY transport from the oxic to the anoxic zones.
REY from vent fluids, leachates of volcanic rocks along ocean ridges and marine volcanoes are scavenged by formation of oceanic Fe-Mn crusts and Fe-Mn nodules [44,95].

4.3. Gd–Y Anomaly Correlations

In accumulating systems such as oceans and the Dead Sea, presenting the results of fractionation over geologic times intercepts on either X or Y axes are common. The X- and Y-axis intercepts reveal build-up of anomalies in deep times. In lakes and continental seas, the ratio of Gd and Y anomalies is 0.3–0.7 and for springs about 0.5 and groundwater 0.3–0.9, for rivers 0.5–1 (Table 1). These different slopes are generated by different types of water/solid interactions (Figure 4d and Figure 7), settling particles in oceanic basins and monomictic lakes (Figure 5), changes between wet and dry status of streams (Figure 6b) or drastic changes of weathering conditions during monsoon seasons (Figure 6c). In stratified oceanic basins and continental lakes, the oxygen-rich surface waters show correlated positive Gd and Y anomalies. Under anoxic conditions, Y and Gd anomalies are smaller and greater due to REY released from coatings [23,96]. In stratified water bodies of ocean basins built by atolls, the two low-slope trend lines in Figure 4d represent large variations in Y anomalies but small ones in Gd anomalies.
Thermal waters either show limestone REY patterns without Gd and Y anomalies (Tiberias Main Spring) or REY patterns with positive Gd and Y anomalies due to leaching phosphates/gypsum as part of evaporites (Tiberias Roman Spring; Figure 7a) or cements from sandstones in the Arava valley (Figure 9b). The Ce anomalies in Figure 9b,c are uncertain because the La values could be enhanced due the methanotrophy [58]. Gypsum and phosphate cemented sandstones yield convex patterns towards the X axis but with positive Gd and Y anomalies (Figure 9b and Figure 10a). They differ by their algebraic signs of anomalies from water that has dissolved FeOOH (Figure 7d). Locally, there may be interaction with specific minerals that control REY distribution. Such a formation is churchite, YPO 4 , known from lateritic soils [76], which in addition to Y contain preferably heavy REE.
The correlation of Gd and Y anomalies in different aqueous media may be described by their ratios or slopes in Figure 4, Figure 5, Figure 6, Figure 7, Figure 8, Figure 9 and Figure 10 (Table 1). In seawater this slope varies between either 0.8 for open oceans or between 0.07 and 0.2 in oceanic basins of the South Pacific. Note that the monsoon-affected Gulf of Thailand (Figure 6c) perfectly fits into the surface water line of ocean basins in the South Pacific (Figure 4d).

4.4. High Gd Anomalies in Aqueous Phases

In Figure 6a and Figure 13, Gd anomalies are much higher than expected by the correlation with Y anomalies. There are at least two reasons for this:
  • anthropogenic Gd supply to waters (Figure 6a);
  • repeated mineral–aqueous phase interaction (Figure 13).
The anthropogenic effect is best produced in rivers into which effluents from wastewater treatment plants discharge (Figure 6a). The source of high Gd values is their application as stable organic complexes as a contrast agent in magnetic resonance tomography in clinics and private practices. For similar reasons affected are also lakes such as the Great Salt Lake, USA, Lake Erie and to a lesser extent also Lake Ontario [66] or the Tokyo Bay [2,68]. Partial dissolution of Fe-Mn oxihydroxides formed during weathering of Fe-rich rocks such as basalts may yield waters with enhanced Gd values because HREE are precipitated as phosphates. Such geogenic high Gd anomalies are known from well waters of Bad Schwartau, Germany, and Mukheibeh 9 and Ain Himma, Jordan (Figure 13).

5. Conclusions

The REY patterns in groundwaters differ when dominated by weathering of either sedimentary or igneous or metamorphic rocks. In general, REY patterns of waters from igneous rocks are characterized by positive Eu anomalies. Ce, Eu, G and Y anomalies are mostly inherited from sedimentary rocks. Inherited Gd and Y anomalies further develop during water–rock interaction. The influence of humic acids is not considered here.
Gd and Y anomalies are mostly linearly related, suggesting that they are fractionated by similar mineral–water interactions. The presence of Fe-Mn-oxihydroxides as adsorbent plays an important role. This may be the main reason why geothermal waters show small to no anomalies, at least in wells after long-time production. REY patterns of water from felsic rocks differ because of their different compositions of leachable REY tracer minerals.
In addition to the positive correlation of the Gd and Y anomalies, the following trends are common:
  • carbonato and probably phosphato complexes and scavenging by FeOOH colloids generate positive Gd and Y anomalies;
  • Gd anomalies decrease with increasing Y anomalies when surface brines interact with carbonate rocks. In such processes, REE are lowered by adsorption and ion exchange but this process does not affect Y to the same degree;
  • redox-cycling in stratified water bodies transport of REE by settling particles is more efficient than that of Y. For that reason, Y n /Ho n is lower in the anoxic than in the oxic zone; for Gd anomalies it is the opposite (e.g., Lake Tiberias and Eastern Mediterranean);
  • under chemically reducing or acidic conditions Gd and Y anomalies are not generated;
  • Gd and Y anomalies seem to be controlled by pH;
  • excepting Eu anomalies, the anomalies of Ce, Gd and Y vanish with increasing temperatures by ion exchange with other minerals and are therefore mostly absent in geothermal waters;
  • anthropogenic contamination of surface waters produces Gd anomalies uncorrelated with Y anomalies.

Author Contributions

Conceptualization, methodology, formal analysis, P.M. and P.D.; data curation, P.M., P.D. and M.D.L.; writing—original draft preparation, P.M.; writing—review and editing, P.D. and M.D.L. All authors have read and agreed to the published version of the manuscript.

Funding

This research received no external funding.

Institutional Review Board Statement

Not applicable.

Informed Consent Statement

Not applicable.

Data Availability Statement

The data compilation along with primary literature sources are publicly available at https://doi.org/10.5281/zenodo.4899253 (accessed on 4 August 2021) [59].

Acknowledgments

We acknowledge the remarks of two anonymous reviewers.

Conflicts of Interest

The authors declare no conflict of interest.

References

  1. Bau, M. Controls on the fractionation of isovalent trace elements in magmatic and aqueous systems: Evidence from Y/Ho, Zr/Hf and lanthanide tetrad effect. Contrib. Miner. Pet. 1996, 123, 323–333. [Google Scholar] [CrossRef]
  2. Nozaki, Y.; Zhang, J.; Amakawa, H. The fractionation between Y and Ho in the marine environment. Earth Planet. Sci. Lett. 1997, 148, 329–340. [Google Scholar] [CrossRef]
  3. Peppard, D.F.; Mason, G.W.; Lewey, S. A tetrad effect in the liquid-liquid extraction ordering of lanthanide(III). J. Inorg. Nucl. Chem. 1969, 31, 2271–2272. [Google Scholar] [CrossRef]
  4. Spedding, F.H.; Pikal, M.J.; Ayers, B.O. Apparent molar volumes of some aqueous rare earth chloride and nitrate solutions at 25°. J. Phys. Chem. 1966, 70, 2440–2449. [Google Scholar] [CrossRef]
  5. Rizkalla, E.N.; Choppin, G.R. Hydration and hydrolysis of lanthanides. In Handbook of Physics and Chemistry of Rare Earths; Gschneider, K.A., Eyring, L., Eds.; North Holland Publ.: Amsterdam, The Netherlands; London, UK; New York, NY, USA; Tokyo, Japan, 1991; Volume 15, pp. 391–442. [Google Scholar]
  6. Diakonov, I.I.; Ragnarsdottir, K.V.; Tagirov, B.R. Standard thermodynamic properties and heat capacity equations of rare earth hydroxides: II. Ce(III)-, Pr-, Sm-, Eu(III)-, Gd-, Tb-, Dy-, Ho-, Tm-, Yb-, and Y-hydroxides. Comparison of thermodynamical and solubility data. Chem. Geol. 1998, 151, 327–347. [Google Scholar] [CrossRef]
  7. Klungnes, G.D.; Byrne, R.H. Comparative hydrolysis behavior of the rare earths and yttrium: The influence of temperature and ionic strength. Polyhedron 2000, 19, 99–107. [Google Scholar] [CrossRef]
  8. Liu, X.; Byrne, R.H. Comprehensive investigation of yttrium and rare earth element complexation by carbonate ions using ICP-mass spectrometry. J. Sol. Chem. 1998, 27, 803–815. [Google Scholar] [CrossRef]
  9. Kawabe, I.; Ohta, A.; Ishii, S.; Tokumura, M.; Miyaichi, K. REE partitioning between Fe-Mn oxihydroxide precipitates and weakly acid NaCl solutions: Convex tetrad effect and fractionation of Y and Sc from heavy lanthanides. Geochem. J. 1999, 33, 167–179. [Google Scholar] [CrossRef] [Green Version]
  10. Kawabe, I. Hydration change of aqueous lanthanide ions and tetrad effects in lanthanide(III)-carbonate complexation. Geochem. J. 1999, 33, 267–275. [Google Scholar] [CrossRef] [Green Version]
  11. Luo, Y.-R.; Byrne, R.H. Carbonate complexation of yttrium and the rare earth elements in natural waters. Geochim. Cosmochim. Acta 2004, 68, 691–699. [Google Scholar] [CrossRef]
  12. Byrne, R.H.; Liu, X.; Schijf, J. The influence of phosphate coprecipitation on rare earth distribution in natural waters. Geochim. Cosmochim. Acta 1996, 60, 3341–3346. [Google Scholar] [CrossRef]
  13. Liu, X.; Byrne, R.H. Rare earth and yttrium phosphate solubilities in aqueous solution. Geochim. Cosmochim. Acta 1997, 6, 1625–1633. [Google Scholar] [CrossRef]
  14. Luo, Y.-R.; Byrne, R.H. Yttrium and rare earth element complexation by chloride ions at 25 °C. J. Sol. Chem. 2001, 30, 837–845. [Google Scholar] [CrossRef]
  15. Luo, Y.-R.; Byrne, R.H. The ionic strength dependence of rare earth and yttrium fluoride complexation. J. Sol. Chem. 2000, 29, 1089–1099. [Google Scholar] [CrossRef]
  16. Schijf, J.; Byrne, R.H. Determination of stability constants for the mono and difluoro complexes of Y and REE, using a cation-exchange resin and ICP-MS. Polyhedron 1999, 18, 2839–2844. [Google Scholar] [CrossRef]
  17. Schijf, J.; Byrne, R.H. Determination of SO4ß1 for yttrium and rare earth elements at I = 0.66 m and t = 25 °C-Implications for YREE solution speciation in sulphate rich waters. Geochim. Cosmochim. Acta 2004, 68, 2825–2837. [Google Scholar] [CrossRef]
  18. De Baar, H.J.W. The Marine Geochemistry of the Rare Earth Elements. Ph.D. Thesis, Woods Hole Oceanographic Institute/Massachusets Institute of Technology, Cambridge, MA, USA, 1983; 278p. [Google Scholar]
  19. De Baar, H.J.W.; Bacon, M.P.; Brewer, P.G. Rare earth elements in the Pacific and Atlantic Ocean. Geochim. Cosmochim. Acta 1985, 49, 1943–1959. [Google Scholar] [CrossRef]
  20. De Baar, H.J.W.; Brewer, P.; Bacon, M.P. Anomalies in rare earth distributions in seawater: Gd and Tb. Geochim. Cosmochim. Acta 1985, 49, 1961–1969. [Google Scholar] [CrossRef]
  21. Piepgras, D.J.; Jacobsen, S.B. The behavior of rare earth elements in seawater: Precise determination of variations in the North Pacific water column. Geochim. Cosmochim. Acta 1992, 56, 1851–1861. [Google Scholar] [CrossRef]
  22. Bau, M.; Dulski, P. Distribution of yttrium and rare-earth elements in the Penge and Kuruman Iron Formations, Transvaal Supergroup, South Africa. Precamb. Res. 1996, 79, 37–55. [Google Scholar] [CrossRef]
  23. Bau, M.; Möller, P.; Dulski, P. Yttrium and lanthanides in eastern Mediterranean seawater and their fractionation during redox-cycling. Mar. Chem. 1997, 56, 123–131. [Google Scholar] [CrossRef]
  24. Nozaki, Y.; Alib, A.S.; Amakawa, H.; Gamo, T.; Hasumoto, H. Dissolved rare earth elements and hydrography in the Sulu Sea. Geochim. Cosmochim. Acta 1999, 63, 2171–2181. [Google Scholar] [CrossRef]
  25. Möller, P.; Morteani, G.; Dulski, P. Anomalous gadolinium, cerium, and yttrium contents in the Adige and Isarco river waters and in the water of their tributaries (Provinces Trento and Bolzano/Bozen, NE Italy). Acta Hydrochim. Hydrobiol. 2003, 31, 225–239. [Google Scholar] [CrossRef]
  26. Goldstein, S.; Jacobsen, S.B. REE in the Great Whale River estuary, northwest Quebec. Earth Planet. Sci. Lett. 1988, 88, 241–252. [Google Scholar] [CrossRef]
  27. Elderfield, H.; Upstill-Goddard, R.; Sholkovitz, E.R. The rare earth elements in rivers, estuaries, and coastal seas and their significance to the composition of ocean waters. Geochim. Cosmochim. Acta 1990, 57, 513–518. [Google Scholar] [CrossRef]
  28. Sholkovitz, E.R. Chemical evolution of rare earth elements: Fractionation between colloidal and solution phases of filtered river water. Earth Planet. Sci. Lett. 1992, 114, 77–84. [Google Scholar] [CrossRef]
  29. Terakado, Y.; Masuda, A. The coprecipitation of rare earth elements with calcite and aragonite. Chem. Geol. 1988, 69, 101–110. [Google Scholar] [CrossRef]
  30. Zhong, S.; Mucci, A. Partitioning of rare earth elements (REES) between calcite and seawater solutions at 25 °C and 1 atm, and high dissolved REE concentrations. Geochim. Cosmochim. Acta 1995, 59, 4443–4453. [Google Scholar] [CrossRef]
  31. Tanaka, K.; Kawabe, I. REE abundance in ancient seawater inferred from marine limestones and experimental REE partition coefficients between calcite and aqueous solution. Geochem. J. 2006, 40, 425–435. [Google Scholar] [CrossRef] [Green Version]
  32. Toyama, K.; Terakado, Y. Estimation of the practical partition coefficients of rare earth elements between limestones and seawater: Discussion and application. Geochem. J. 2019, 43, 139–150. [Google Scholar] [CrossRef]
  33. Bau, M. Scavenging of dissolved yttrium and rare earths by precipitating iron oxihydroxed: Experimental evidence for Ce oxidation, Y-Ho fractionation, and lanthanide tetrad effect. Geochim. Cosmochim. Acta 1999, 63, 67–77. [Google Scholar] [CrossRef]
  34. Kawabe, I.; Ohta, A.; Miura, N. Distribution coefficients of REE between Fe oxyhydroxide precipitates and NaCl solutions affected by REE-carbonate complexation. Geochem. J. 1999, 33, 181–197. [Google Scholar] [CrossRef] [Green Version]
  35. Quinn, K.A.; Byrne, R.H.; Schijf, J. Comparative scavenging of yttrium and the rare earth elements in seawater: Competitive influences of solution and surface chemistry. Aquat. Chem. 2004, 100, 59–80. [Google Scholar] [CrossRef]
  36. Chopin, F.; Berger, G.; Bauer, A.; Castet, S.; Loubet, M. Sorption of lanthanides on smectite and kaolinite. Chem. Geol. 2002, 182, 57–68. [Google Scholar]
  37. Irber, W. Laugungsexperimente an Peraluminischen Graniten als Sonde für Alterationsprozesse im Finalen Stadium der Granitkristallisation mit Anwendung auf das Rb-Sr-Isotopensystem. Ph.D. Thesis, Free University Berlin, Berlin, Germany, 1996; 319p. [Google Scholar]
  38. Hannigan, R.E.; Sholkovitz, E.R. The development of middle rare earth elements in freshwaters: Weathering of phosphate minerals. Chem. Geol. 2001, 175, 495–508. [Google Scholar] [CrossRef]
  39. Kagi, H.; Dohmoto, Y.; Takano, S.; Masuda, A. Tetrad effect in lanthanides partitioning between calcium sulfate crystal and its saturated solution. Chem. Geol. 1993, 107, 71–82. [Google Scholar] [CrossRef]
  40. Toulkeridis, T.; Podwojewski, P.; Clauer, N. Tracing of the source of gypsum in New Caledonian soils by REE contents and S-Sr isotopic compositions. Chem. Geol. 1998, 145, 61–71. [Google Scholar] [CrossRef]
  41. Playa, E.; Cendon, D.I.; Trave, A.; Chivas, A.R.; Garcia, A. Non-marine evaporites with both inherited marine and continental signatures: The Gulf of Carpentaria, Australia, at ~70 ka. Sediment. Geol. 2007, 201, 267–285. [Google Scholar] [CrossRef]
  42. Handbook of Chemistry and Physics; Selected Values of Chemical Thermodynamic Properties; CRC Press: Boca Raton, FL, USA, 1988; pp. D51–D93.
  43. Tanaka, K.; Takahashi, Y.; Shimizu, H. Local structure of Y and Ho in calcite and its relevance to Y fractionation from Ho in partitioning between calcite and aqueous solution. Chem. Geol. 2008, 248, 104–113. [Google Scholar] [CrossRef] [Green Version]
  44. De Carlo, E.H.; Wen, X.Y.; Irving, M. The influence of redox reactions on the uptake of dissolved Ce by suspended Fe and Mn oxide particles. Aquat. Geochem. 1997, 3, 357–389. [Google Scholar] [CrossRef]
  45. Sverjensky, D.A. Europium redox equilibria in aqueous solution. Earth Planet. Sci. Lett. 1984, 67, 70–78. [Google Scholar] [CrossRef]
  46. Bilal, B.A. Thermodynamic study of Eu3+/Eu2+ redox reaction in aqueous solution at elevated temperatures and pressures by means of cyclic voltammetry. Z. Naturforsch. 1991, 46, 1108–1116. [Google Scholar] [CrossRef]
  47. Möller, P.; Dulski, P.; Gerstenberger, H.; Morteani, G.; Fuganti, A. Rare earth elements, yttrium and H, O, C, Sr, Nd, and Pb isotope studies in mineral waters and corresponding rocks from NW -Bohemia, Czech Republic. Appl. Geochem. 1998, 13, 975–994. [Google Scholar] [CrossRef]
  48. Bau, M.; Dulski, P. Anthropogenic origin of positive gadolinium anomalies in river waters. Earth Planet. Sci. Lett. 1996, 143, 245–256. [Google Scholar] [CrossRef]
  49. Fuganti, A.; Möller, P.; Morteani, G.; Dulski, P. Gadolinio ed altre terre rare usabili come traccianti per stabilire l’eta il movimento ed i rischi delle acque sotterranee: Esempio dell’area di Trento. Geol. Tec. Ambient. 1996, 4, 13–18. [Google Scholar]
  50. Knappe, A.; Sommer-von Jarmersted, C.; Pekdeger, A.; Bau, M.; Dulski, P. Gadolinium in aquatic systems as indicator of sewage water contamination. In Geochemistry of the Earth’s Surface; Armannsson, H., Ed.; Balkema: Rotterdam, The Netherlands, 1999; pp. 187–190. [Google Scholar]
  51. Knappe, A.; Möller, P.; Dulski, P.; Pekdeger, A. Positive gadolinium anomaly in surface water and ground water of the urban area Berlin Germany. Chem. Erde 2005, 65, 167–189. [Google Scholar] [CrossRef]
  52. Möller, P.; Paces, T.; Dulski, P.; Morteani, G. Anthropogenic Gd in surface water, drainage systems, and the water supply of the city of Prague, Czech Republic. Environ. Sci. Technol. 2002, 36, 2387–2394. [Google Scholar] [CrossRef]
  53. Siebert, C.; Möller, P.; Magri, F.; Shalev, E.; Rosenthal, E.; Al-Raggad, M.; Rödiger, T. Applying rare earth elements, uranium and 87Sr/86Sr to disentangle structurally forced confluence of regional groundwater resources; The case of the lower Yarmouk Gorge. Geofluids 2019, 2019, 6727681. [Google Scholar] [CrossRef]
  54. Möller, P.; De Lucia, M. Incorporation of rare earths and yttrium in calcite: A critical evaluation. Aquat. Geochem. 2020, 26, 89–117. [Google Scholar] [CrossRef] [Green Version]
  55. Anders, E.; Grevesse, N. Abundance of elements: Meteoric and solar. Geochim. Cosmochim. Acta 1989, 53, 197–214. [Google Scholar] [CrossRef]
  56. Lawrence, M.G.; Jupiter, S.D.; Kamber, B.S. Aquatic geochemistry of rare earth elements and yttrium in the Pioneer River catchment, Australia. Mar. Freshw. Res. 2006, 57, 725–736. [Google Scholar] [CrossRef]
  57. Lawrence, M.G.; Greig, A.; Collerson, K.D.; Kamber, B.S. Rare earth elements and Yttrium variability in South East Queensland waterways. Aquat. Geochem. 2006, 12, 39–72. [Google Scholar] [CrossRef]
  58. Wang, X.; Barrat, J.A.; Bayon, G.; Chauvaud, L.; Feng, D. Lanthanum anomalies as fingerprints of methanotrophy. Geochem. Perspect. Lett. 2020, 14, 26–30. [Google Scholar] [CrossRef]
  59. Möller, P.; Dulski, P.; De Lucia, M. Compilation of Data Used in the Manuscript “REY Patterns and Their Natural Anomalies in Waters and Brines: The Correlation of Gd- and Y-Anomalies”. 2021. Available online: https://zenodo.org/record/4899253#.YQyny0C-tPY (accessed on 4 August 2021). [CrossRef]
  60. Elderfield, H.; Greaves, M.J. The rare earth elements in seawater. Nature 1982, 296, 214–219. [Google Scholar] [CrossRef]
  61. Möller, P.; Dulski, P.; Bau, M. Rare-earth element adsorption in a seawater profile above the East Pacific Rise. Chem. Erde 1994, 54, 129–149. [Google Scholar]
  62. Zhang, J.; Nozaki, A. Rare earth elements and yttrium in seawater: ICP-MS determinations in the East Caroline, Coral Sea, and South Fidgi basins of the western South Pacific Ocean. Geochim. Cosmochim. Acta 1996, 60, 4631–4644. [Google Scholar] [CrossRef]
  63. Möller, P.; Stober, I.; Dulski, P. Seltenerdelement-, Yttrium Gehalte und Bleiisotope in Thermal- und Mineralwässern des Schwarzwaldes. Grundwasser 1997, 3, 118–132. [Google Scholar] [CrossRef]
  64. Nozaki, Y.; Lerche, D.; Alibo, D.S.; Sinidvongs, A. The estuarine geochemistry of rare earth elements and Indium in the Chao Phraya River, Thailand. Geochim. Cosmochim. Acta 2000, 64, 3983–3994. [Google Scholar] [CrossRef]
  65. Möller, P.; Rosenthal, E.; Dulski, P.; Geyer, S. Characterization of recharge areas by rare earth elements and stable isotopes of H2O. In The Water of the Jordan Valley; Hötzl, H., Möller, P., Rosenthal, E., Eds.; Springer: Berlin/Heidelberg, Germany, 2009; pp. 123–147. [Google Scholar]
  66. Bau, M.; Knappe, A.; Dulski, P. Anthropogenic gadolinium as a micropollutant in river waters in Pennsylvania and in Lake Erie, northwestern United States. Chem. Erde/Geochem. 2006, 66, 143–152. [Google Scholar]
  67. Siebert, C. Saisonale Chemische Variationen des See Genezareth, Seiner Zuflüsse und Deren Ursachen. Ph.D. Thesis, Free University Berlin, Berlin, Germany, 2006; 222p. [Google Scholar]
  68. Nozaki, Y.; Lerche, D.; Alibo, D.S.; Tsutsumi, M. Dissolved indium and rare earth elements in three Japanese rivers and Tokyo Bay: Evidence for anthropogenic Gd and In. Geochim. Cosmochim. Acta 2000, 64, 3975–3982. [Google Scholar] [CrossRef]
  69. Verplanck, P.L.; Taylor, H.E.; Nordstrom, D.K.; Barber, L.B. Aqueous stability of Gadolinium in surface waters receiving sewage treatment plant effluent, Boulder Creek, Colorado. Environ. Sci. Technol. 2005, 39, 6923–6929. [Google Scholar] [CrossRef] [PubMed]
  70. Kümmerer, K.; Helmers, E. Hospital effluents as a source of gadolinium in the aquatic ebvironment. Environ. Sci. Technol. 2002, 34, 573–577. [Google Scholar] [CrossRef]
  71. Kulaksiz, S.; Bau, M. Contrasting behavior of anthropogenic gadolinium and natural rare earth elements in estuaries and the gadolinium input into the North Sea. Earth Planet. Sci. Lett. 2007, 260, 361–371. [Google Scholar] [CrossRef]
  72. Kulaksiz, S.; Bau, M. Rare earth elements in the Rhine River Germany: First case of anthropogenic lanthanum as a dissolved microcomponent in the hydrophere. Environ. Intern. 2011, 37, 973–979. [Google Scholar] [CrossRef]
  73. Banks, D.; Hall, G.; Reimann, C.; Siewers, U. Distribution of rare earth elements in crystalline bedrock groundwaters: Oslo and Bergen regions, Norway. Appl. Geochem. 1999, 14, 27–39. [Google Scholar] [CrossRef]
  74. Johannesson, K.H.; Zhou, X.; Guo, C.; Stetzenbach, K.J.; Hodge, V.F. Origin of rare earth element signatures in groundwaters of circumneutral pH from southern Nevada and eastern Califiornia, USA. Chem. Geol. 2000, 164, 239–257. [Google Scholar] [CrossRef]
  75. Möller, P.; Rosenthal, E.; Geyer, S.; Guttmann, J.; Dulski, P.; Rybakov, M.; Zilberbrand, M.; Jahnke, C.; Flexer, A. Hydrochemical processes in the lower Jordan valley and in the Dead Sea area. Chem. Geol. 2007, 239, 27–49. [Google Scholar] [CrossRef]
  76. Göb, S.; Loges, A.; Nolde, N.; Bau, M.; Jacob, D.E.; Markl, G. Major and trace element compositions (including REE) of mineral, thermal, mine and surface waters in SW Germany and implications for water rock interaction. Appl. Geochem. 2013, 33, 127–152. [Google Scholar] [CrossRef]
  77. Biddau, R.; Cidu, R.; Frau, F. Rare earth elements in water from the albite-bearing granodiorites of Central Sardinia, Italy. Chem. Geol. 2002, 182, 1–14. [Google Scholar] [CrossRef]
  78. Tesmer, M.; Möller, P.; Wieland, S.; Jahnke, C.; Pekdeger, A.; Voigt, H. Deep reaching fluid flow in the North-East German Basin. Origin and processes of groundwater salinisation. J. Hydrol. 2007, 15, 1291–1306. [Google Scholar] [CrossRef]
  79. Möller, P.; Weise, S.M.; Tesmer, M.; Dulski, P.; Pekdeger, A.; Bayer, U.; Magri, F. Salinization of groundwater in the North German Basin; Results from conjoint investigation of major, trace element and multi-isotope distribution. Int. J. Earth Sci. (Geol. Rundsch.) 2008, 97, 1057–1073. [Google Scholar] [CrossRef]
  80. Paces, T.; Möller, P.; Fuganti, A.; Morteani, G.; Pecek, J. Sparkling mineral water at western rim of the Doupovske hory Mountains (Czech Republic): Genesis by water-rock interaction and deep-seated CO2. Bull. Czech. Geol. Surv. 2001, 76, 189–202. [Google Scholar]
  81. Möller, P.; Dulski, P.; Morteani, G. Partitioning of rare earth elements, yttrium and major elements among source rocks, liquid and vapor of Larderello-Travale Geothermal Field, Tuscany (central Italy). Geochim. Cosmochim. Acta 2003, 67, 171–183. [Google Scholar] [CrossRef]
  82. Leybourne, M.I.; Johannesson, K.H. Rare earth elements (REE) and yttrium in stream waters, stream sediments, and Fe-Mn oxyhydroxides: Fractionation, speciation and controls over REE+Y patterns in the surface environment. Geochim. Cosmochim. Acta 2008, 72, 5962–5983. [Google Scholar] [CrossRef]
  83. Möller, P.; Rosenthal, E.; Dulski, P.; Geyer, S.; Guttman, Y. Rare earths and yttrium hydrostratigraphy along the Lake Kinneret-Dead Sea-Arava transform fault, Israel and adjoining territories. Appl. Geochem. 2003, 18, 1613–1628. [Google Scholar] [CrossRef]
  84. Möller, P.; Morteani, G.; Dulski, P.; Reinfalk, C. Vapor/liquid fractionation of rare earths, Y3+, Na+, K+, NH4+, Cl, HCO3, SO42−, and borate in fluids from the Piancastagnaio geothermal field, Italy. Geothemics 2009, 38, 360–369. [Google Scholar] [CrossRef]
  85. Möller, P.; Dulski, P. Induced Rare earth element fractionation in brines by hydraulic fracturing of their aquifer rocks. Geothermics 2018, 72, 307–315. [Google Scholar] [CrossRef]
  86. Douville, E.; Bienvenue, P.; Charlou, J.L.; Donval, J.P.; Fouquet, Y.; Appriou, P.; Gamo, T. Yttrium and rare earth elements in fluids from various deep-sea hydrothermal systems. Geochim. Cosmochim. Acta 1999, 63, 627–643. [Google Scholar] [CrossRef]
  87. Bau, M.; Dulski, P. Comparing yttrium and rare earths in hydrothermal fluids from the Mid-Atlantic Ridge: Implications for Y and REE behaviour during near-vent mixing and for the Y/Ho ratio of Proterozoic seawater. Chem. Geol. 1999, 155, 77–90. [Google Scholar] [CrossRef]
  88. Möller, P.; Woith, H.; Dulski, P.; Lüders, V.; Erzinger, J.; Kämpf, H.; Pekdeger, A.; Hansen, B.; Lodemann, M.; Banks, D. Main and trace elements in KTB-VB fluid: Composition and hints to its origin. Geofluids 2005, 5, 28–41. [Google Scholar] [CrossRef]
  89. Barkan, E.; Luz, B.; Lazar, B. Dynamics of carbon dioxide system in the Dead Sea. Geochim. Cosmochim. Acta 2001, 65, 355–368. [Google Scholar] [CrossRef]
  90. Scherer, M.; Seitz, H. Rare-earth element distribution in Holocene and Pleistocene corals and their redistribution during diagenesis. Chem. Geol. 1980, 28, 279–289. [Google Scholar] [CrossRef]
  91. Tanaka, K.; Ohta, A.; Kawabe, I. Experimental REE partitioning between calcite and aqueous solution at 25 °C and 1 atm: Constraints on the incorporation of seawater REE into seamount-type limestones. Geochem. J. 2004, 38, 19–32. [Google Scholar] [CrossRef] [Green Version]
  92. Shannon, R.D. Revised effective ionic radii and systematic studies of interatomic distances in halides and chalcogenites. Acta Crystallogr. 1976, A32, 751–767. [Google Scholar] [CrossRef]
  93. Kikawada, Y.; Oi, T.; Honda, T.; Ossaka, T.; Kakihana, H. Lanthanoid abundances of acidic hot spring and crater lake waters in the Kusatsu-shirane volcano region, Japan. Geochem. J. 1993, 27, 19–33. [Google Scholar] [CrossRef]
  94. Lewis, A.J.; Komninou, A.; Yardley, B.W.D.; Palmer, M.R. Rare earth speciation in geothermal fluids from Yellowstone National Park, Wyoming, USA. Geochim. Cosmochim. Acta 1998, 62, 657–663. [Google Scholar] [CrossRef]
  95. Ohta, A.; Kawabe, I. RE(III) adsorption onto Mn dioxide (δ-MnO2) and Fe oxihydroxide: Ce(III) oxidation by δ-MnO2. Geochim. Cosmochim. Acta 2001, 65, 695–703. [Google Scholar] [CrossRef]
  96. Möller, P.; Siebert, C. Cycling of calcite and hydrous metal oxides and chemical changes of major element and REE chemistry in monomictic hardwater lake; Impact on sedimentation. Geochemistry 2016, 76, 133–148. [Google Scholar] [CrossRef]
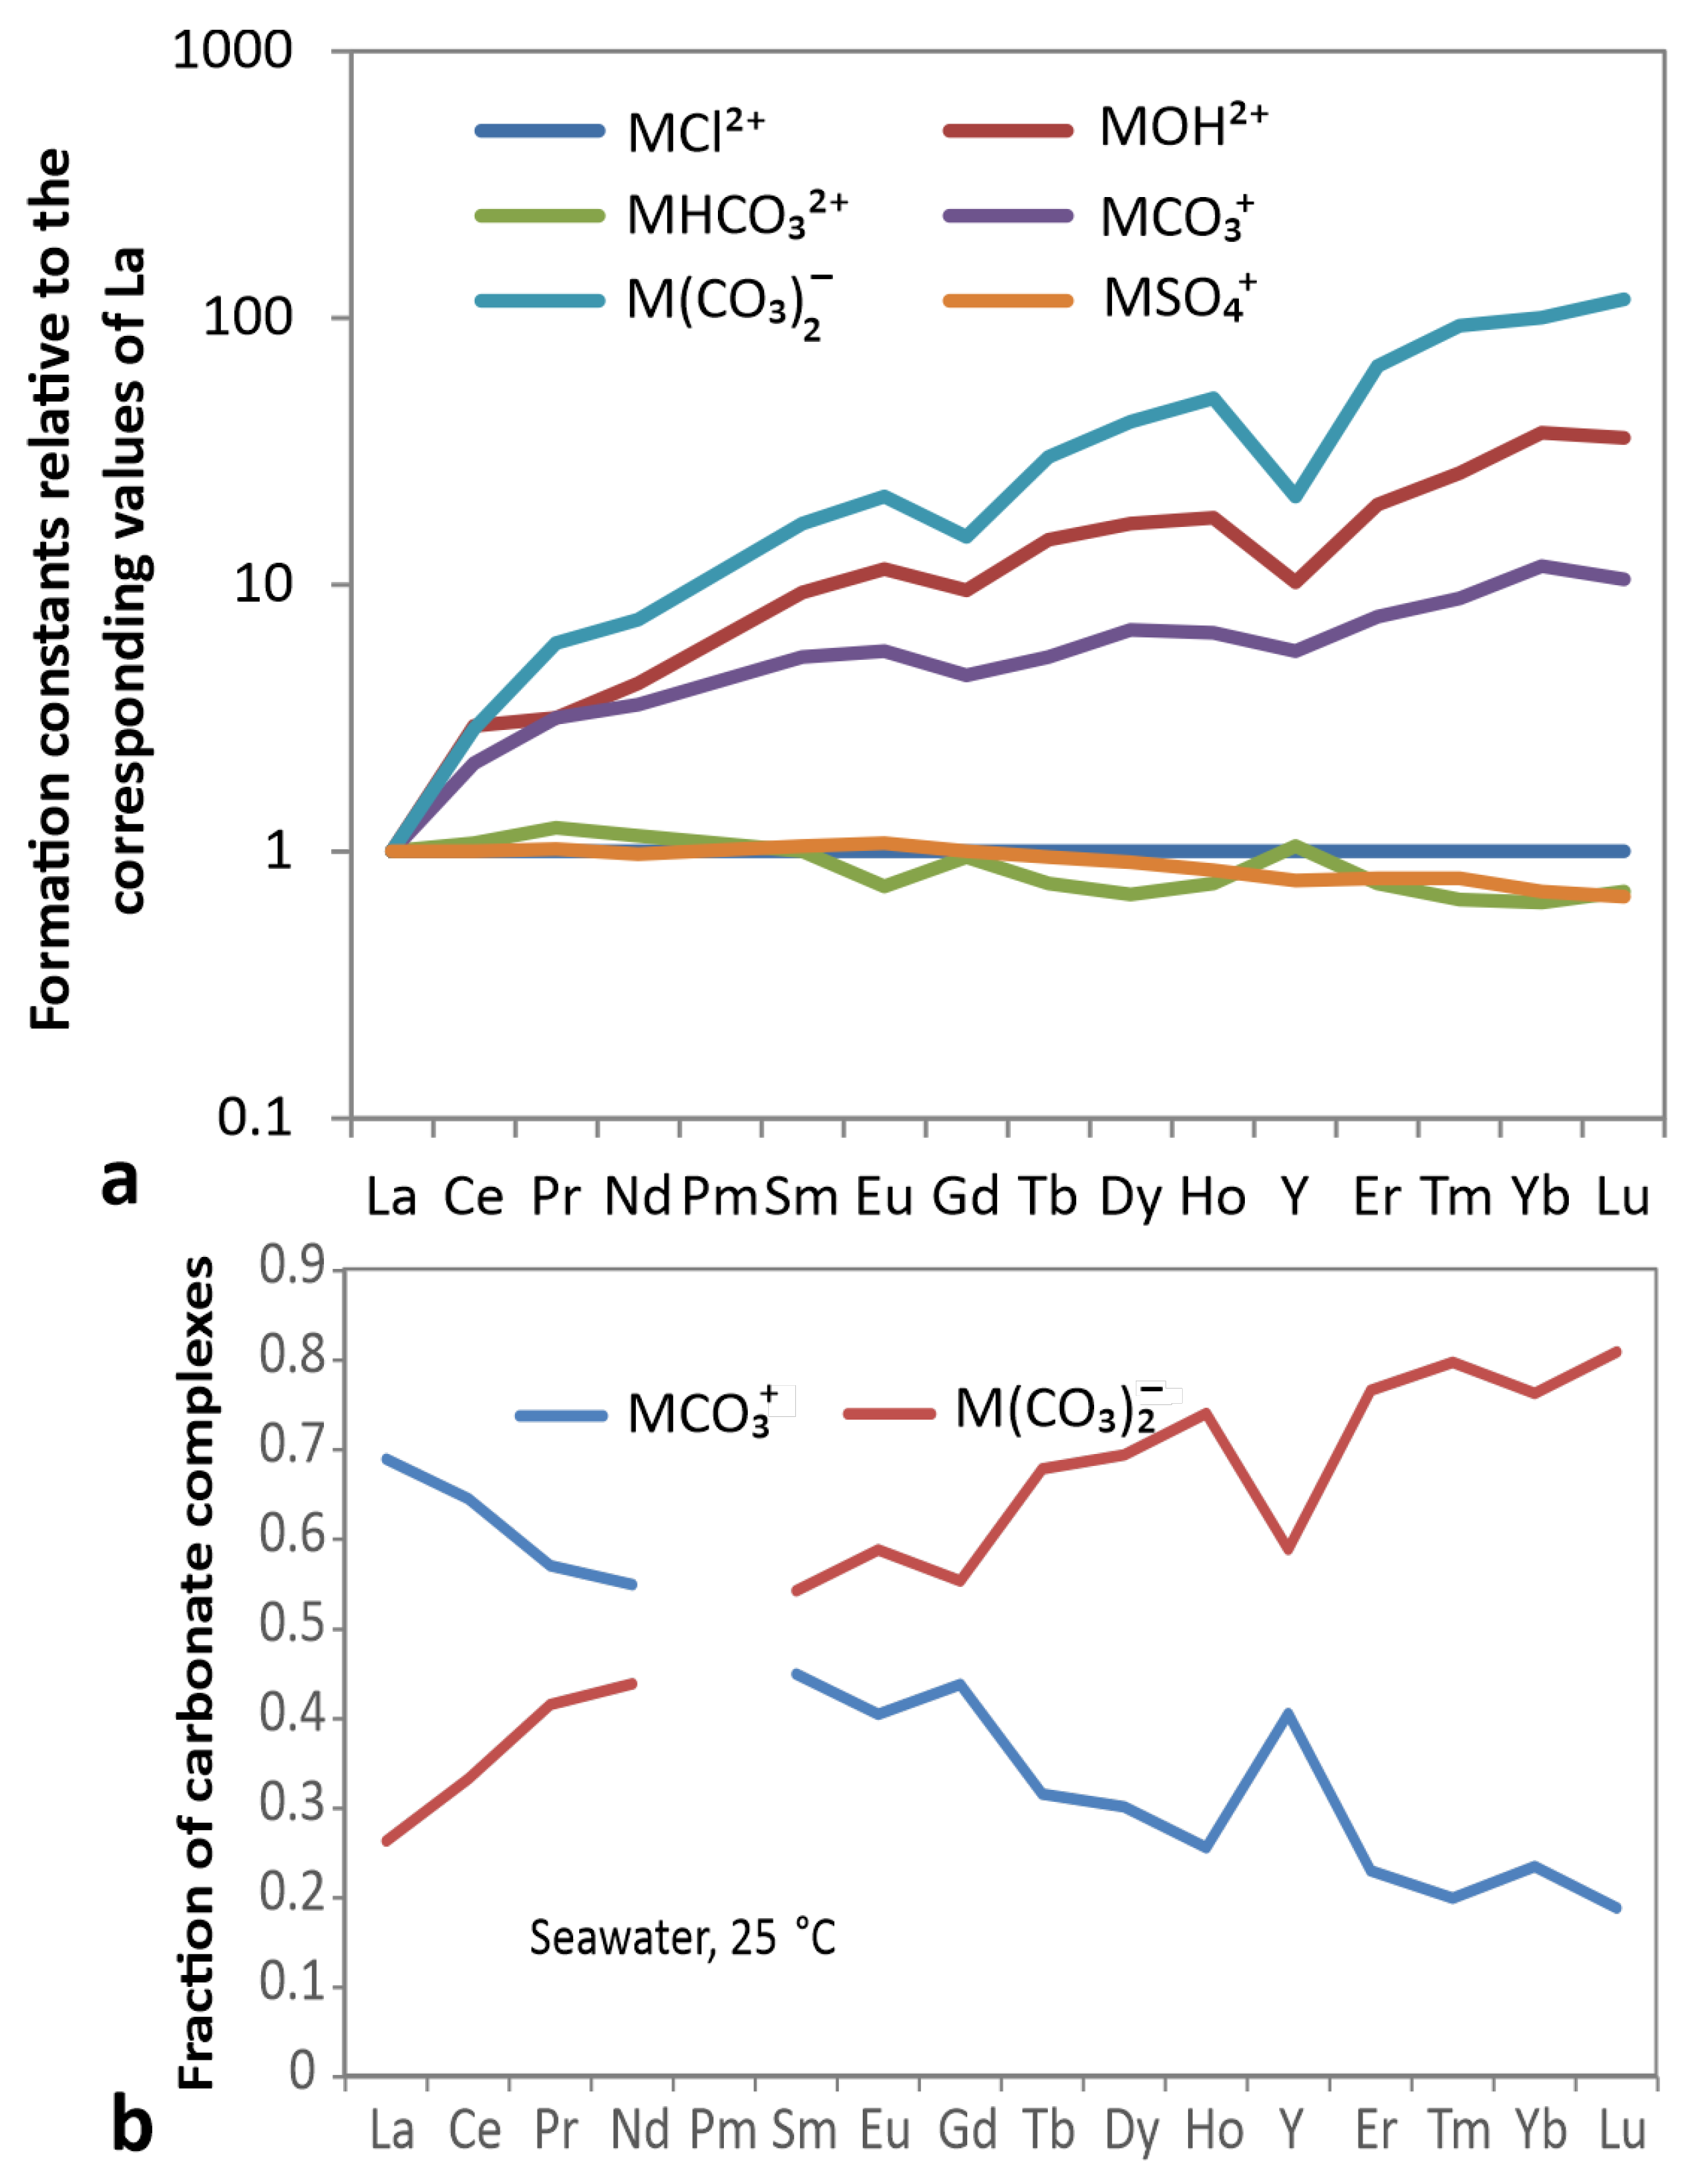
Figure 1. Formation constants and speciation in seawater at 25 ° C. (a) All patterns of formation constants are normalized to their corresponding La values. M refers to REY. References for formation constants are cited in the text. (b) A fraction of the most important REY species in seawater at 25 ° C.
Hydrology 08 00116 g001
Figure 2. Physico-chemical parameters of rare earth elements and Y. (a) Free energy of formation of aqueous ions [42]; (b) formation constant of mono-hydroxo-complexes [5,7]; (c) solubility product of tri-hydroxides [6].
Hydrology 08 00116 g002
Figure 3. Determination of the Gd anomaly exemplified by a pattern of high-salinity brine from the Dead Sea. Gd is exaggerated in order to illustrate the procedure of Gd * extrapolation.
Hydrology 08 00116 g003
Figure 4. REY in seawater. (a) C1-chondrite-normalized rare earths and Y distribution patterns of waters from surface- (solid line) and deep (broken line) water bodies showing changes in REY distribution patterns and corresponding changes of Ce, Gd and Y anomalies. East Pacific Rise [61]; North Pacific [24]; Java Sea (unpublished); Sulu Sea [24]; Gulf of Thailand [2]. (b) Oceanic basins build by atolls [62]. (c) Tyro sub-basin in the eastern Mediterranean Sea [23]. (d) Correlation of Gd and Y anomalies in seawater.
Hydrology 08 00116 g004
Figure 5. REY in lakes. C1 chondrite-normalized rare earths and Y distribution patterns of lakes and continental seas. (a) REY patterns of Lake Erie and Ontario are taken from [66]; Aral Sea (unpublished); Great Salt Lake (unpublished); Lago di Garda (unpublished); Lake Tiberias [67]; Dead Sea [65]. (b) Possible correlations between Gd and Y anomalies. Data for stratified Lake Tiberias are taken from [67]. Upper and lower tentative trends are given with slopes of about 0.7 and 0.3, respectively.
Hydrology 08 00116 g005
Figure 6. REY in rivers and streams. (a) Examples of rivers contaminated by anthropogenic Gd [48,49,52]; (b) Stream and rivers in Israel during wet (broken) and dry (bold) seasons; (c) Chao Phraya River in Thailand during three different seasons [64]; (d) Streams from various siliceous rocks and Quaternary sediments in Australia [56]. Note that Eu is often not reported; (e) Rivers in South East Queensland, Australia [57]; (f) Correlation of Gd and Y anomalies. Upper and lower tentative trends are given with slopes of about 1 and 0.5, respectively.
Hydrology 08 00116 g006
Figure 7. REY in groundwater from springs. (a) Rift Valley, Isreal, (b) Westbank (unpublished data from springs in limestone); (c) Yarmouk Gorge, hot springs in Israel; (d) Black Forest (springs from granites; ref. [76] and springs from granitoids in Central Sardinia, Italy [77]); (e) Correlation of Gd and Y anomalies. Gd anomalies in samples from felsic rocks are between 0.15 and +0.05, whereas those from limestones scatter between 0.1 and 0.5. Y anomalies spread like in the limestone group.
Hydrology 08 00116 g007
Figure 8. REY in groundwater from wells with temperatures less than 20 ° C. Groundwater from the Permian North-Western German basin (NWGB): (a) Berlin area; (b) Saxony-Anhalt; (c) Saline waters from observation wells above the closed salt mine of Stassfurt (NWGB); (d) saline waters from various formations of all over NWGB outside Berlin and Saxony-Anhalt [78,79]; Upper Permian: Lüneburg, Dörmitz, Bad Bramstedt; Triassic/Keuper: Bad Wilsnack; Triassic/Bunter: Rheinsberg, Burg; Lower Tertiary: Bad Schwartau; (e) Wells at Kyselka in the Duopowski Mts, Czech Republic [80], and Black Forest, Germany [63]; (f) Correlation of Gd and Y anomalies. Average slope is about 0.5.
Hydrology 08 00116 g008
Figure 9. Thermosaline groundwater. C1 chondrite-normalized rare earths and Y distribution patterns of (a) saline waters from limestones of the Arava Valley, Israel [65]; (b) saline waters from Nubian sandstones in the Arava Valley/Negev, Israel [83]; (c) brines from wells along Lake Tiberias and the Dead Sea, Israel [75]; (d) Groundwater from limestones in the Mukheibeh well field, Yarmouk Gorge, Jordan [53]; (e) well water from the Quaternary sediments in the North-Western German Basin [79]. (f) Correlation of Gd and Y anomalies. The slopes scatter between 0 and 0.6.
Hydrology 08 00116 g009
Figure 10. Geothermal well water. (a) Brines from wells Neustadt-Glewe, Neubrandenburg and Berlin (Germany, NWGB; refs. [78,79]; Paran in the Arava Valley, Israel [83]; condensed steam in Larderello/Travale, Italy [81]; (b) condensed steam in Mt Amiata, Italy [84]; (c) geothermal project Groß Schönebeck before (upper two patterns) and after fracking (lower four patterns) of Rotliegend conglomerates and Rotliegend sandstones [85]; (d) Vent fluids from the Mid-Atlantic Ridge [86,87] and REY patterns of the German Continental Deep Drilling Project KTB/VB 4000 m fluid from Devonian amphibolites [88]. (e) Correlation of Gd and Y anomalies in brines from the geothermal well Groß Schönebeck/Germany showing the effect of fracking with a common slope of 0.3.
Hydrology 08 00116 g010
Figure 11. Cross plots of Gd and Y anomalies in Dead Sea brineinfiltrated into limestones [65]. The systematic changes in brine composition are indicated by the trend of Dead Sea-Mizpe Shalem. The composition of samples not lying on one of the two trends may be related to the dilution line similar to Mizpe Shalem.
Hydrology 08 00116 g011
Figure 12. Cross plots of Gd anomalies of groundwater and temperature (a) and pH (b) showing that the Gd anomalies vanish with both increasing pH and temperature. The dashed lines are bordering lines.
Hydrology 08 00116 g012
Figure 13. REY patterns showing greater Gd anomalies than Y anomalies. Samples are from wells or springs which cannot be affected by anthropogenic contamination (Bad Schwartau: unpublished; Ain Hima and Mukheibeh 9 in 2016 [53].
Hydrology 08 00116 g013
Figure 14. Comparison of REY patterns at surface and bottom conditions passing from oxidizing to reducing conditions in (a) Lake Tiberias, Israel [67] and (b) in Tyro basin, eastern Mediterranean [23].
Hydrology 08 00116 g014
Table 1. Slopes in Gd vs. Y anomalies in natural waters. Slope equals the ratio of (Gd/Gd * -1)/(Y n /Ho n -1).
Intercepts
SlopeX-AxisY-Axis
Seawater 0.80.5
deep basins0.072 0
surface basin0.18 0.05
Lakes and seas 0.3–0.7 0–0.1
Rivers 0.5–1
Springs 0.5
Groundwater<20 ° C0.5
20–50 ° C<0.9
>50 ° C0.3
Publisher’s Note: MDPI stays neutral with regard to jurisdictional claims in published maps and institutional affiliations.