Article

Hydrogeological Characterization of the Thyspunt Area, Eastern Cape Province, South Africa

1
School of Geosciences, University of the Witwatersrand, Private Bag X3, Johannesburg P.O. Box Wits 2050, South Africa
2
School of Agricultural, Earth and Environmental Sciences, University of KwaZulu−Natal, Private Bag X54001, Durban 4000, KwaZulu−Natal, South Africa
*
Author to whom correspondence should be addressed.
Hydrology 2020, 7(3), 49; https://doi.org/10.3390/hydrology7030049
Submission received: 15 July 2020 / Revised: 27 July 2020 / Accepted: 29 July 2020 / Published: 31 July 2020

Abstract

:
This paper presents a comprehensive hydrogeological investigation that involves field work, aquifer test, hydrogeochemical analysis, environmental isotope analysis, and interpretations around a proposed nuclear power facility in South Africa. The study was undertaken to test the complementarity of the various methods in the coastal aquifer and to verify the hydrogeological conditions within and around the site. The study revealed the presence of two types of aquifers: an upper primary aquifer made up of the Cenozoic deposits of the Algoa Group, and a deeper fractured aquifer made of the Palaezoic Table Mountain Group (TMG) metasedimentary rocks. Owing to ductile deformation in the form of folding, the fractured quartzite and shale aquifers resulted in an artesian condition, often characterized by slightly acidic (pH ≤ 6) and iron-rich groundwater. The most important hydrogeochemical processes responsible for the observed changes in the hydrochemical composition and facies are mineral dissolution, ion exchange and mixing. The environmental isotope results suggest that all groundwater samples are characterized by a depleted δ18O and δ2H signal, indicating high latitude moisture source (southern polar region) and recharge from rainfall, with no or minimal evaporation before and during infiltration. Similarities in the stable isotope signatures between the deeper and shallow aquifer confirm the presence of a strong hydraulic link. The residence time of groundwater in the aquifers underlying the proposed nuclear power plant is estimated using tritium (3H) and 14C, and the results indicate that in the shallow aquifer it ranges from recent recharge to 50 years, and in the deeper aquifer, it ranges from 430 ± 5 years to 1000 ± 10 years, which exists in a quasi-pristine condition.

1. Introduction

The sustainable development of water resources necessitates a thorough understanding of the hydrology of the catchment, including the groundwater dynamics in the aquifer system. This requires a vast amount of data and information about the various aspects of groundwater occurrence, circulation, storage and quality within the system [1]. Additionally, the accurate management and sustainable utilization of water resources, particularly in semi-arid and arid regions could be achieved through sound understanding of hydrogeology of an area, which includes the quality and quantity of both groundwater and surface water resources, besides their inter-relationships [2]. The study area has been identified as a potential site for the establishment of a nuclear power plant. Like many other regions in South Africa, the study area has groundwater resource potential that supports domestic and agricultural activities [3,4]. Therefore, it is of paramount importance to conceptualize the coastal aquifer, due to the fact that large number of communities depend on the groundwater resource for their day to day activities. Understanding of the hydrogeological processes could help to manage the aquifer, both in terms of quantity and quality. This is beneficial from an environmental regulatory point of view, since conceptual models are crucial tools for assessing the impact of environmental pollution, as well as in the analyses of the safety of toxic metal industries such as nuclear power plants [5]. Conceptual models provide important input to conduct 3-D numerical groundwater flow modelling. Conceptual models are key for evaluating environmental impacts and in the safety analyses of nuclear power plants [5]. Hence, an understanding of hydrogeological processes helps to minimize the environmental effects during the normal operation and accidental circumstances of nuclear power stations.
An integrated method of aquifer test and lithologic log analyses, hydrogeochemical parameters and environmental isotopes (18O,2H, 3H, 13C,14C) provide valuable information for understanding the hydrogeological conditions of the area, thus providing a robust support for the sustainable management of groundwater resources in the area. This is well demonstrated in numerous studies around the world [2,6,7] that highlighted the robustness of the application of environmental isotopes and hydrogeochemical analyses to understand groundwater occurrence, surface and ground water interaction, and hydrogeochemical evolution of groundwater in the aquifer system.
The main aims of this study were (i) to investigate the hydrogeological conditions of the area proposed for a potential nuclear power site, (ii) to independently verify the hydrogeological conditions within and around the site, (iii) to characterize and document the predevelopment hydrogeological conditions of the study area.

2. The Study Area

2.1. Location, Climate and Drainage

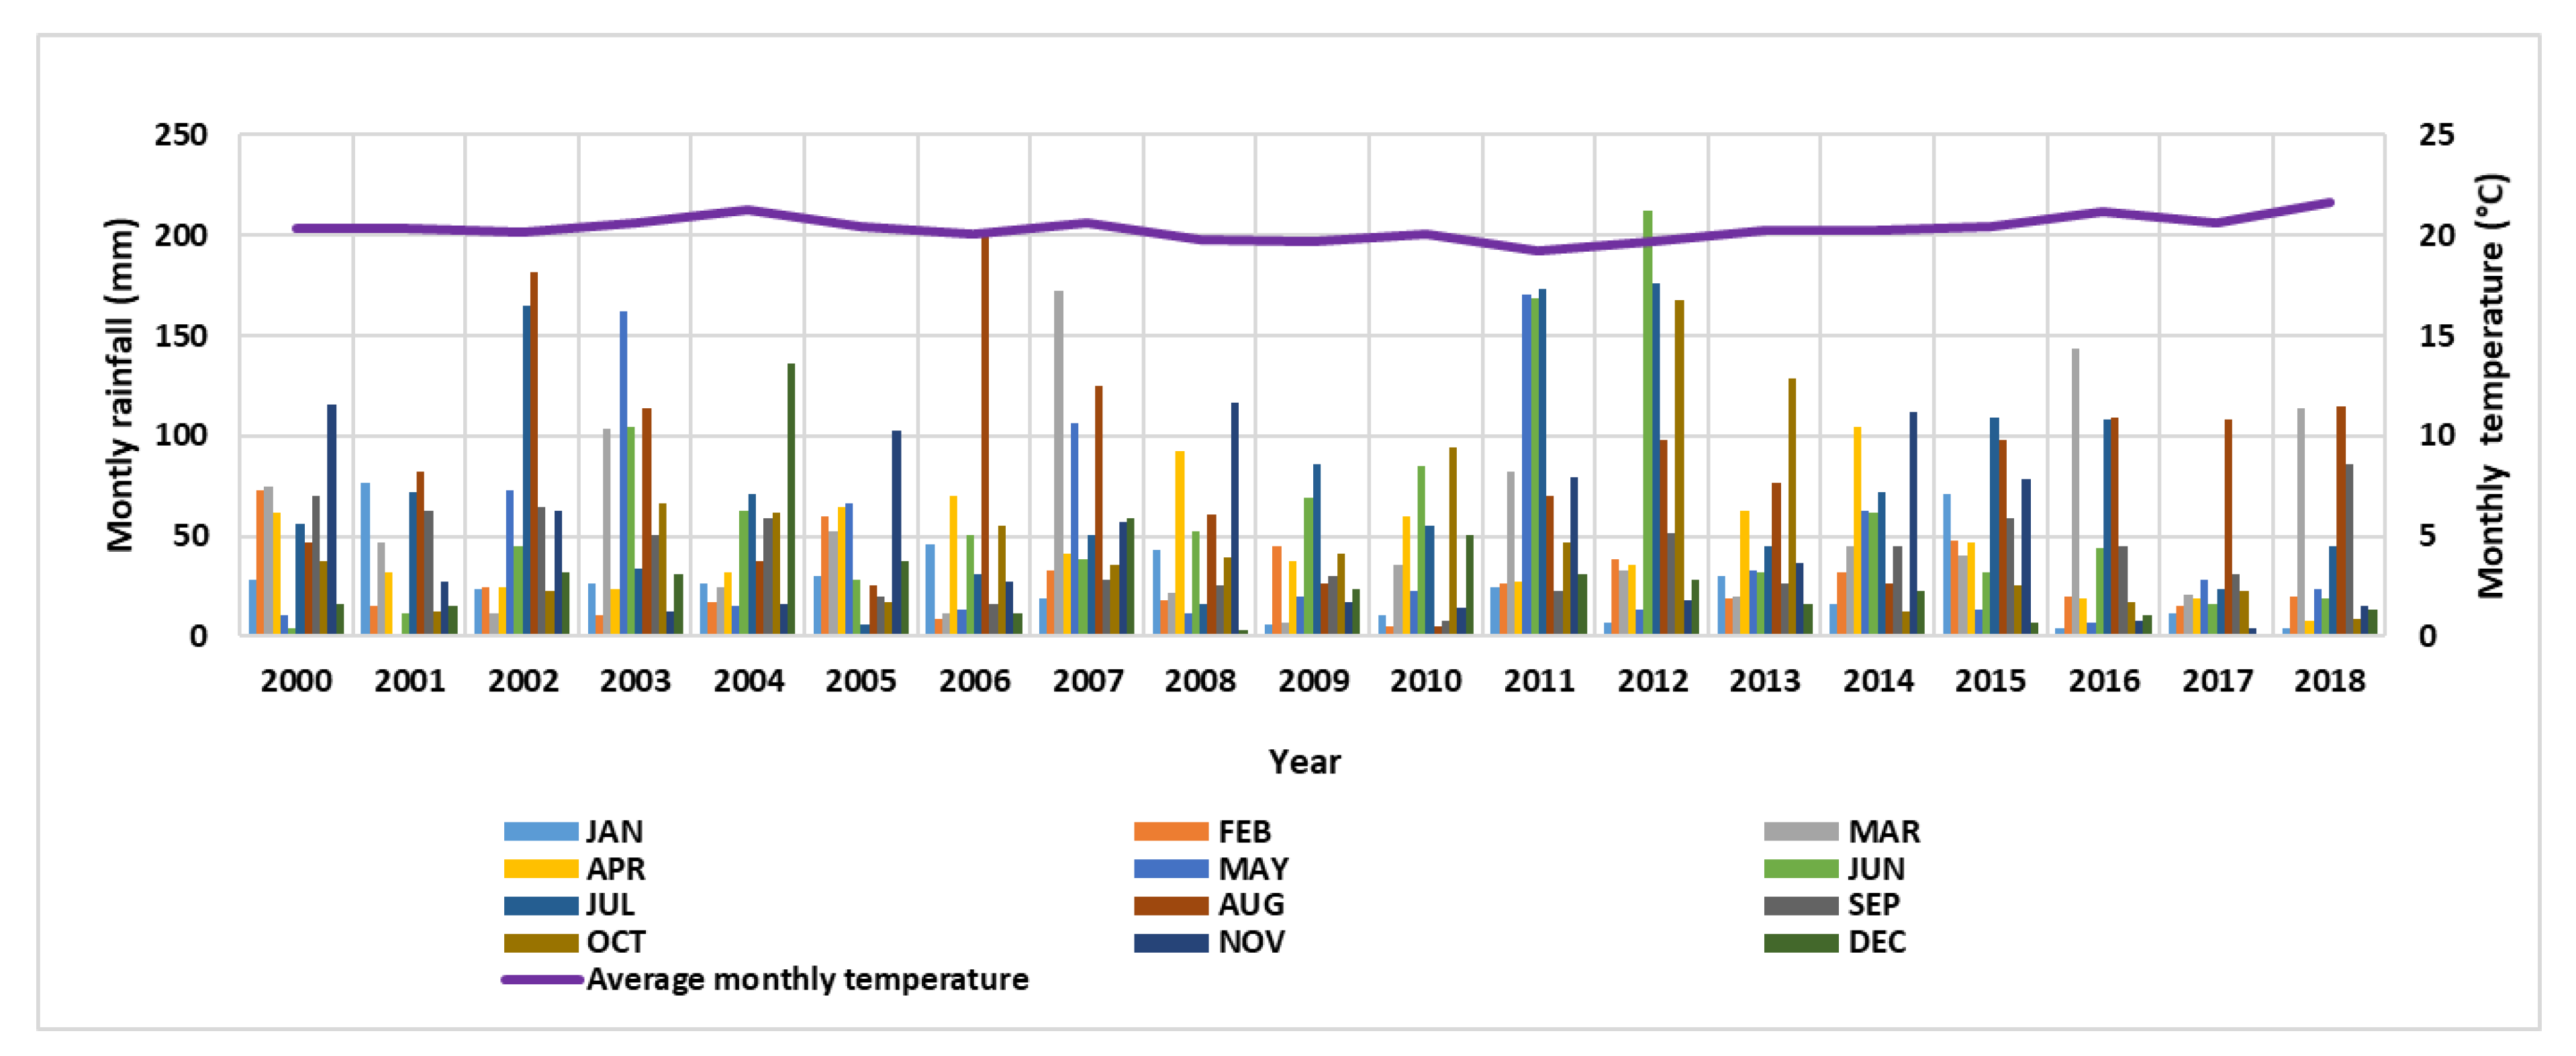
The Thyspunt area is located in the Eastern Cape Province of South Africa, approximately 120 km west of the city of Port Elizabeth, including the Oyster Bay and Cape St. Francis and St. Francis Bay towns (Figure 1). The drainage of the area comprises a network of streams, rivers and wetlands, while the climate is generally humid with warm summers (with an average temperature of 25 °C) and cold winters with average minimum temperature dropping to below 6 °C (Figure 2). The area experiences rainfall throughout the year, with mean monthly rainfall that ranges from 3 mm to 213 mm, and an average annual rainfall of about 622 mm (Figure 2). The Krom and Klipdrift Rivers drain the southeastern and the northwestern part of the area, respectively, and join the Indian Ocean (Figure 1). The Table Mountain Group (TMG) rocks form topographic highs, since they are highly resistant to weathering and erosion.

2.2. Geological and Hydrogeological Setting

The geology of the study area belongs to the Palaezoic Era Cape Supergroup [8]. It forms the extended part of the Southern Cape Mountain Range in the Eastern Cape Province, where the meta-sedimentary Table Mountain Group (TMG) rocks occur in the area (Figure 3) [9,10]. Stratigraphically, the oldest formation of the TMG is represented by the Peninsula Formation, which is composed of quartzites, sandstones and shales. It forms the core of the Cape St. Francis Anticline that strikes NW−SE, with a fold axis trending parallel to the anticline [10]. Overlying the Peninsula Formation is the shale-dominated Cedarburg Formation that forms laterally extensive flatlands, owing to extensive weathering. The Goudini, Skurwerburg and Baviaanskloof Formations collectively make up the Nardouw Subgroup, which is characterized by quartzite and shale intercalation at different proportions. The Bokkeveld Group is characterized by argillaceous deposits of the Ceres Subgroup, and has limited surficial exposure in the area.
The slopes and coastal areas are covered by the Algoa Group coastal deposits, including the indurated Nanaga Formation and calcareous aeolian deposits, which occur in more than one-third of the study area’s surface geology [10]. Based on the field observation, the recent mobile dunes sporadically overlie the indurated sediments and are characterized by medium to coarse-grain sands. The Algoa Group deposits occur in the Oyster Bay– St. Francis Bay headland bypass dune field, which receives sand from the proximal sandy Oyster Bay and Thysbaai beaches [10].
Detailed analysis of water levels and lithological logs indicates that there are at least two types of aquifers in the area. Coastal deposits of the Algoa Group and the fractured quartzite and sandstone (TMG), which occurs in unconfined conditions. However, in some areas, the TMG aquifers occur in confined condition, creating an artesian flow. The fractured and deformed quartzite of the TMG comprises of confined aquifers at depth, where shales with subordinate siltstones of the TMG act as the confining units. The water-bearing capacity of the quartzite is made possible by extensive fractures and folding, that provide conduits for groundwater storage and flow, while the upper weathered zone allows recharge to take place. The often steeply dipping fractures that are aligned parallel to the bedding planes play a paramount role in facilitating vertical recharge. These fractures dip to the southwest in the southern section of the area, and are, therefore, believed to block seawater intrusion. Groundwater levels in both aquifers occur at shallow depths, with the minimum groundwater levels recorded in the range of 3.5 m below ground level (m.b.g.l.).
The general groundwater flow direction is from west to east, and then converges towards the Indian Ocean. It is often controlled by bed-parallel and orthogonal fractures. The structural complexity in the area due to folding and subsequent fracturing dictate the formation of three types of springs, namely, coastal springs that occur along the coastline; contact springs that dominate the inland areas; depression springs are mainly localized to the areas where Algoa Group deposits dominate. The study area is marked by numerous wetlands that also occur on the mobile dunes. The occurrence of the wetlands in the area is largely attributed to the variability in the compaction and consequent permeability variation of sediments, and where quartzites and shales are less fractured.

3. Materials and Methods

After a detailed desktop assessment of the study area and the collection of existing data, field work for sampling and data collection was held from the 20th to 28rd of August 2018. Groundwater levels across the study area were measured using a temperature, water level and conductivity (TLC) meter.
Groundwater and surface water samples were collected for chemical and environmental isotope analyses. Sixty water samples (31 boreholes, 11 springs, 3 rain, 2 river, 10 wetland and 3 seawater samples) were collected for hydrochemical and environmental isotope (18O, 2H, 3H, 13C, 14C) analyses (Figure 4).
Groundwater from boreholes was sampled using a low flow pump after purging for about 5 min. Physicochemical parameters, including water temperature, pH, electrical conductivity (EC) and oxidation–reduction potential (ORP) were determined in the field during sampling, using the Crison and ACCSEN multiparameter probes, calibrated daily before measurement.
A total alkalinity test was performed through titration with a 0.02 N HCl solution to an end point pH of 4.5. Prior to the titration test, a multiparameter probe was used to measure the pH of water, in order to determine the alkalinity range. The presence of carbonate alkalinity (CO32−) was tested using phenolphthalein indicator. No color change was observed, which is in line with none of the samples record pH >8.3. After which the bicarbonate (HCO3) alkalinity was determined by adding several drops of bromocresol green indicator, which turns the sample to blue and the sample was titrated until the color changes to yellow (pH 4.5 end point) and the amount of acid (HCl) was recorded. The total volume of the acid and sample used for titration were used to calculate the total alkalinity and the concentration of bicarbonate.
Samples for 13C and 14C were precipitated onsite, using a 50 L drum− through the addition of BaCl3, NaOH and phenolphthalein indicator.
Major ions were analyzed at the University of KwaZulu−Natal’s Analytical Laboratory, by using a Dionex Ion Chromatograph (IC).
The stable isotopes of 18O and 2H were analyzed by using the liquid water isotope analyzer (LWIA) at the University of the Witwatersrand, based on the IAEA certified procedure (http://www−naweb.iaea.org/napc/ih/documents/other/laser_procedure_rev12.PDF).
The tritium, 13C and 14C samples collected from different water sources were analyzed at the iThemba Environmental Isotope Laboratory in Johannesburg, with the accelerator mass spectrometry method (https://inis.iaea.org/search/search.aspx?orig_q=RN:33001049).
The groundwater residence time was determined using the tritium activity based on Equation (1) [11]:
t = 17.93 ln ( a t 3 H a 0 3 H )
where t is mean residence time in years, at3H is the residual activity of tritium after decay overtime and a03H is the initial tritium activity (3.2 TU has been used from the local rainfall).
The mean residence time (t) based on 14C activity was determined using Equation (2) [11]:
t = 8267 l n A A o
where t is mean residence time of groundwater between the time of recharge until groundwater sampling, Ao = the initial 14C activity (100 pMC), A = the final 14C activity measured in percent modern carbon (pMC).
Pumping (aquifer) test data were used to determine hydraulic properties of the aquifers, such as transmissivity, hydraulic conductivity and storativity. Aquifer parameters were determined based on the pumping test data collected from boreholes in the unconfined aquifers using the modified Fitts Geosolutions, which is based on the Neuman method [12]. In contrast, the Theis method was used to analyze the pumping test data collected from confined aquifers.
Groundwater recharge was estimated using the Water Table Fluctuation (WTF) method (Equation (3)) [13]. This technique was chosen because of the occurrence of groundwater at shallow depth in primary and fractured aquifers, which receives recharge from rainfall that results in sharp rise in the groundwater levels. Based on the WTF method, the recharge is a function of the specific yield (Sy) and changes in groundwater level over time (Δh), and was calculated using Equation (3) [13]:
R = S y Δ h Δ t
where, R is recharge and Δt is observation time, corresponding to Δh. Groundwater level data were provided by the National Nuclear Regulator of South Africa.
Furthermore, five field infiltration tests were conducted across the study area, using a double−ring infiltrometer to determine the infiltration rate/capacity of the soils, and subsequently to determine the groundwater recharge possibilities in the area.

4. Results and Discussion

4.1. Groundwater Occurrence and Hydraulic Characteristics of Aquifers

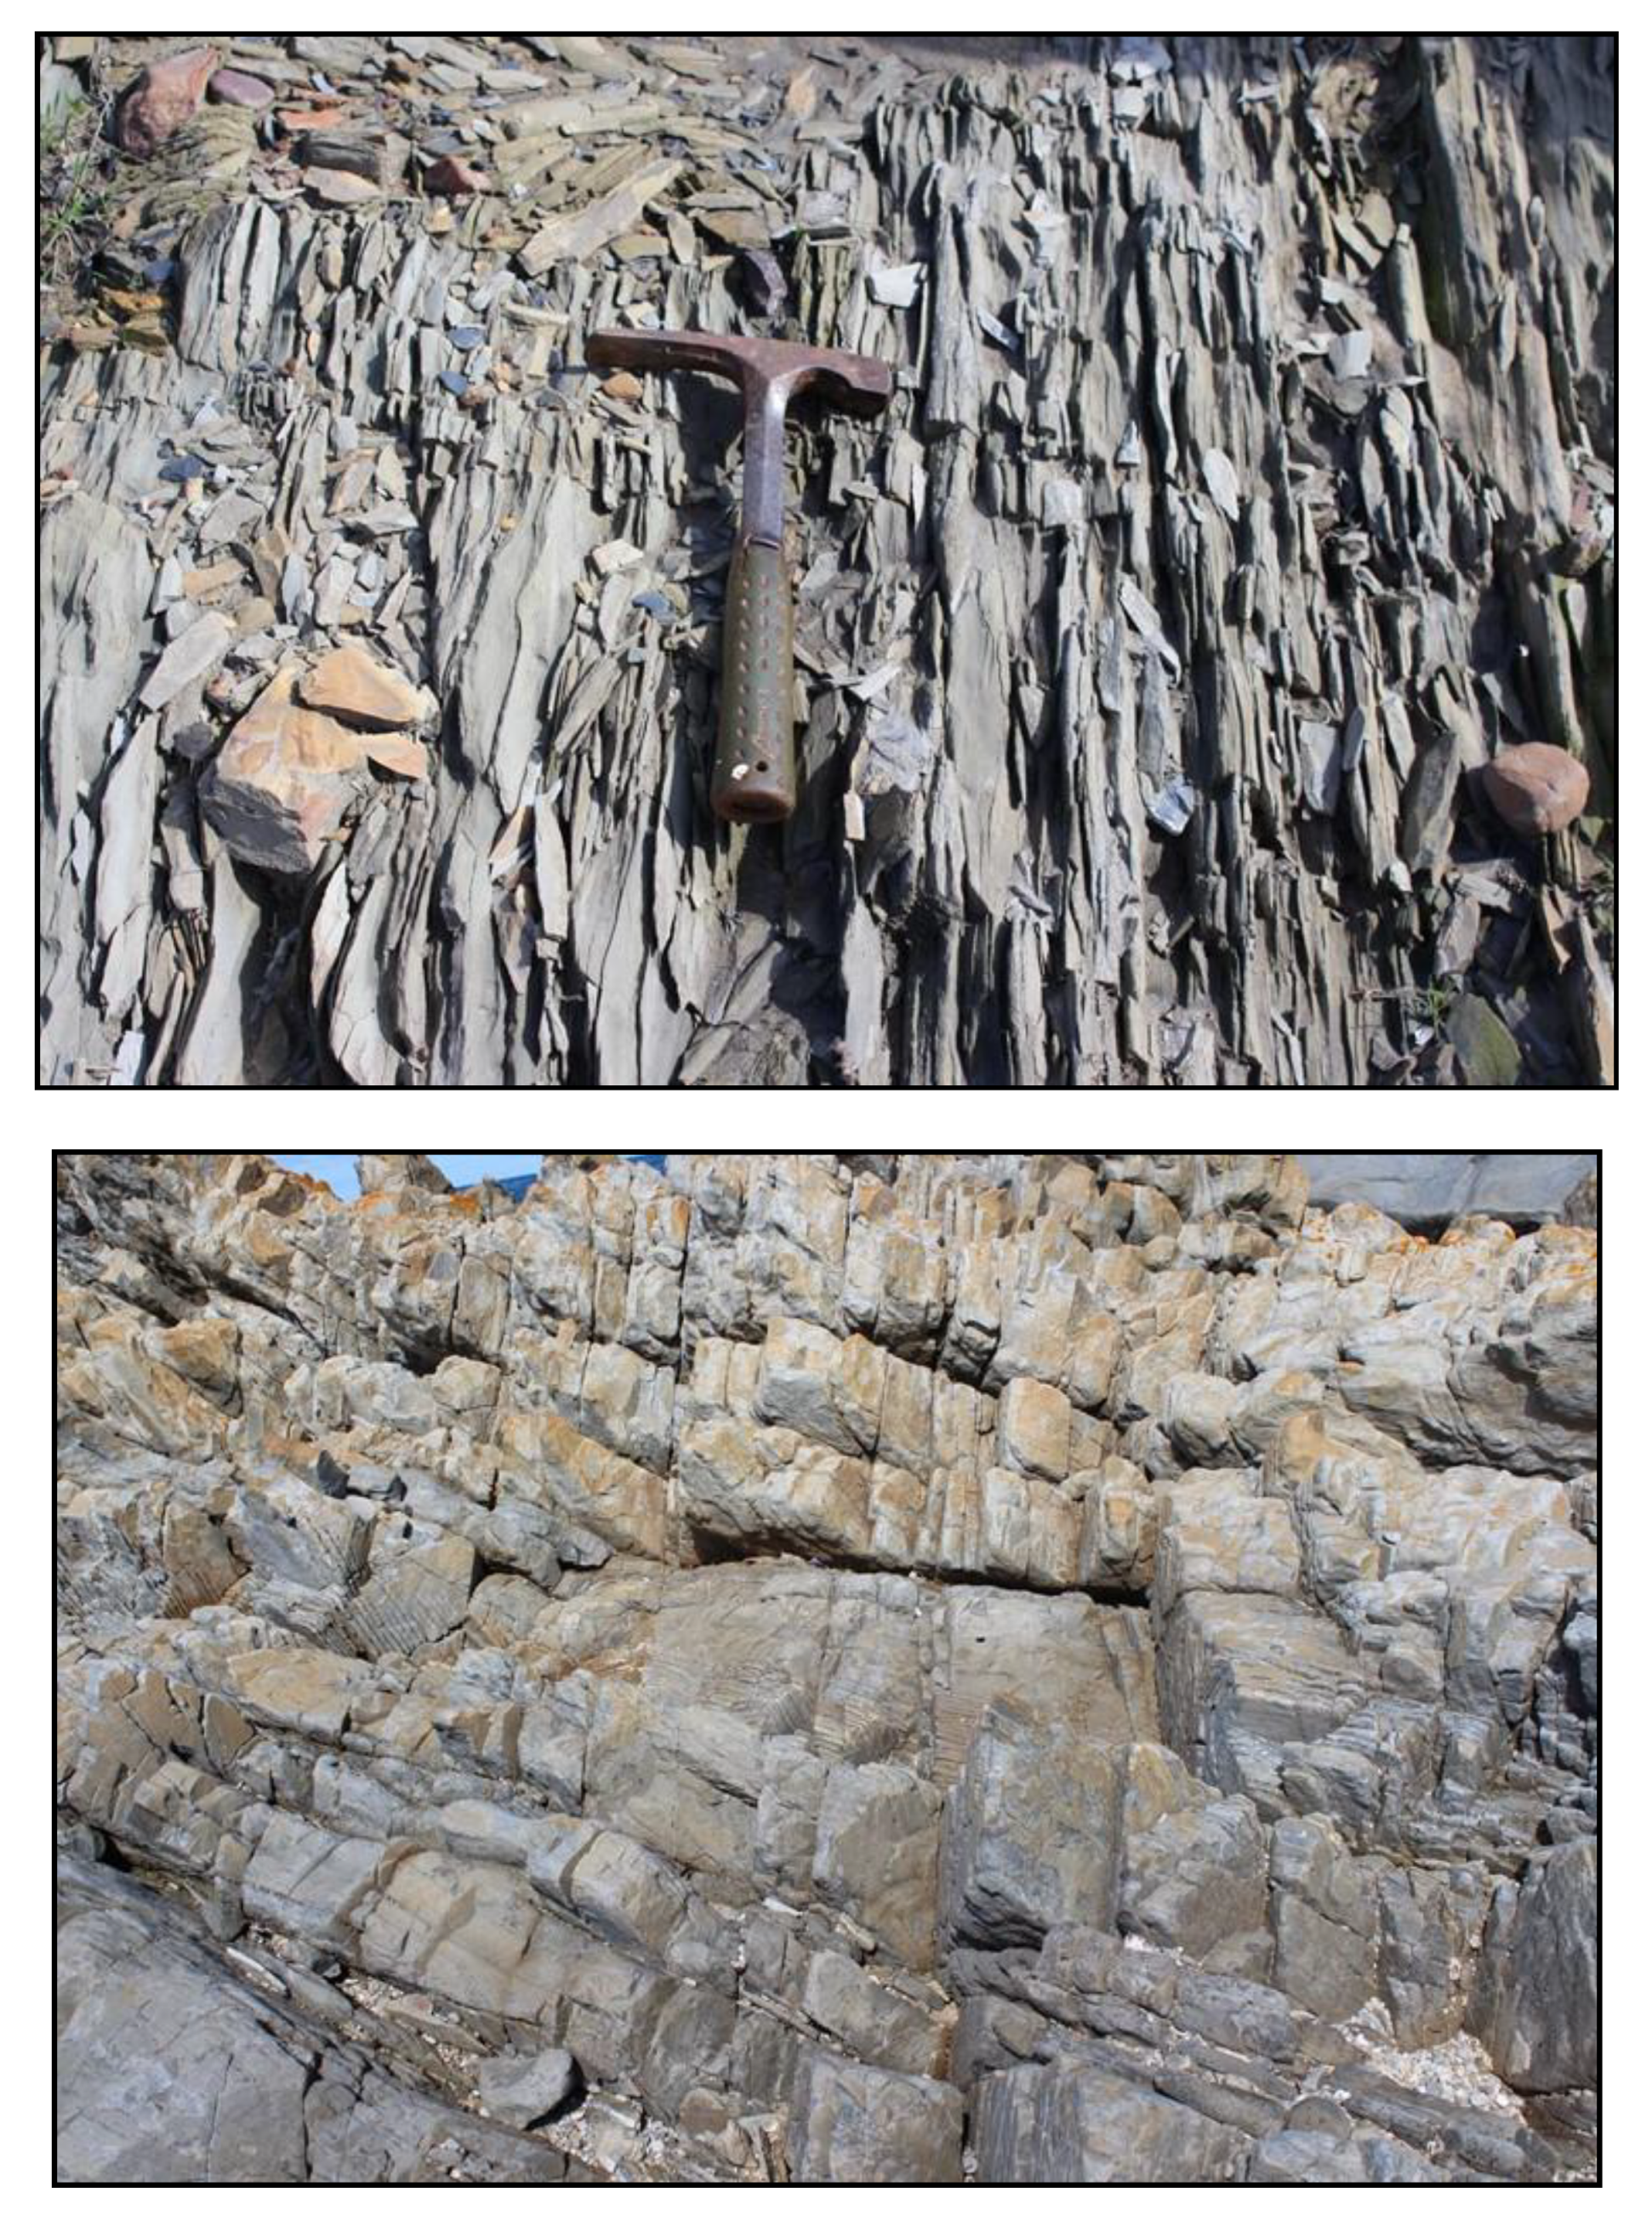
The domestic and agricultural water supply in the Thyspunt area is entirely dependent on groundwater that is hosted within the indurated sediments of the Algoa Group and fractured quartzites, sandstones and shales of the TMG. These rocks are generally folded through anticlinal deformation, with limbs dipping towards NE and SW and bed−parallel fractures are oriented NW−SE (Figure 5). The quartzite layers dip to southwest at 50° to 60° and the northeast at 28° to 44°, with a general strike of 160°. Intensive weathering and erosional processes have removed the cover rocks (sandstones, shales and unconsolidated sediments) from the older Peninsula Formation, resulting in well−exposed quartzites and shales that have been subjected to extensive fracturing (Figure 6), and hence, enhanced their hydraulic characteristics.
The structural plot in Figure 5 shows the prominent dip directions of the local geology, thereby illustrating the characteristic folding of the dominant TMG rocks. Moreover, the geological structures provide conduits along which groundwater can be stored and flow. Some of the major aquifers in the area are composed of quartzites/sandstones and shales of the TMG and have limited primary porosity, and, therefore, these fractures enhance the water transmission capacity of the rocks.
The thickness of the upper unconfined aquifer of the Algoa Group coastal deposits ranges from 13 m to 24 m (Table 1). The TMG aquifers are generally thicker than the Algoa Group aquifers, with an approximate thickness of more than 112 m. Unlike the TMG, the majority of the Algoa Group sediments are semi-consolidated and are surficial deposits, therefore, are prone to erosion that reduces their thickness. Hydraulic conductivity of the Algoa Group aquifers falls between 0.0440 and 19.13 m/day. The higher hydraulic conductivity values could be due to the porous nature, coupled with a high degree of pore interconnectivity. The estimated transmissivities of the unconfined Algoa group aquifers range from 37 m2/day to 275 m2/day. The higher transmissivity disparity is due to the relatively high hydraulic conductivities estimated for the primary aquifers (Table 1). The transmissivities of the TMG aquifers range between 0.359 m2/day and 44.01 m2/day, while hydraulic conductivities fall between 0.0089 and 1.5829 m/day. Storativity of the confined aquifers ranges from 1 × 10⁻⁵ to 3 × 10⁻². The confined aquifers were identified with the occurrence of free flowing boreholes aligned E−W, in accordance with the structural deformation. Based on the position of the boreholes, the artesian aquifer in the area is inferred to be located within the quartzite of the Peninsula Formation, and confined by shales of the Goudini Formation.
The WTF-based point recharge ranges from 4 mm/year to 72 mm/year. The variability in the recharge rate across the area is as a result of lithological diversity, which controls the rate of infiltration. As expected, higher groundwater recharge values are associated with the Algoa Group sediments, which are characterized by both relatively high hydraulic conductivity and high specific yield (0.116). On the other hand, the weathered and fractured quartzites/sandstones of the TMG have relatively low hydraulic conductivity and specific yield (0.006 to 0.1), which resulted in the low rate of groundwater recharge.
Table 2 presents the results of the infiltration test conducted to determine the infiltration capacity of the soil. Infiltration test is an important tool to assess the infiltration rate of the soils since high infiltration capacities of soils indicate higher recharge potentials. The infiltration test results show that sandy−silty soils around the Thyspunt and St. Francis Bay Park areas have relatively higher infiltration capacity (5.1 mm/min and 5.2 mm/min, respectively), suggesting the possibility for the occurrence of high recharge during precipitation. The infiltration tests further indicated that the indurated sediments (Algoa Group) have high infiltration capacity (about 4.5 mm/min). This is in line with the high recharge rate estimated using the WTF method. Lower infiltration rates are encountered in the farmlands and are attributed to the farming activities. The variability in the infiltration rates could also be linked to the variation in the recharge rates in the area.
Natural groundwater discharge occurs in the form of springs and baseflow to streams and wetlands. The occurrence of springs in the area is controlled by the diversity in lithology, fracture occurrence and topographic variation. Most springs support groundwater-dependent wetlands that discharge into streams and the ocean. Groundwater is pumped for domestic and agricultural activities, especially for livestock and dairy farms outside the Thyspunt Nature Reserve area.
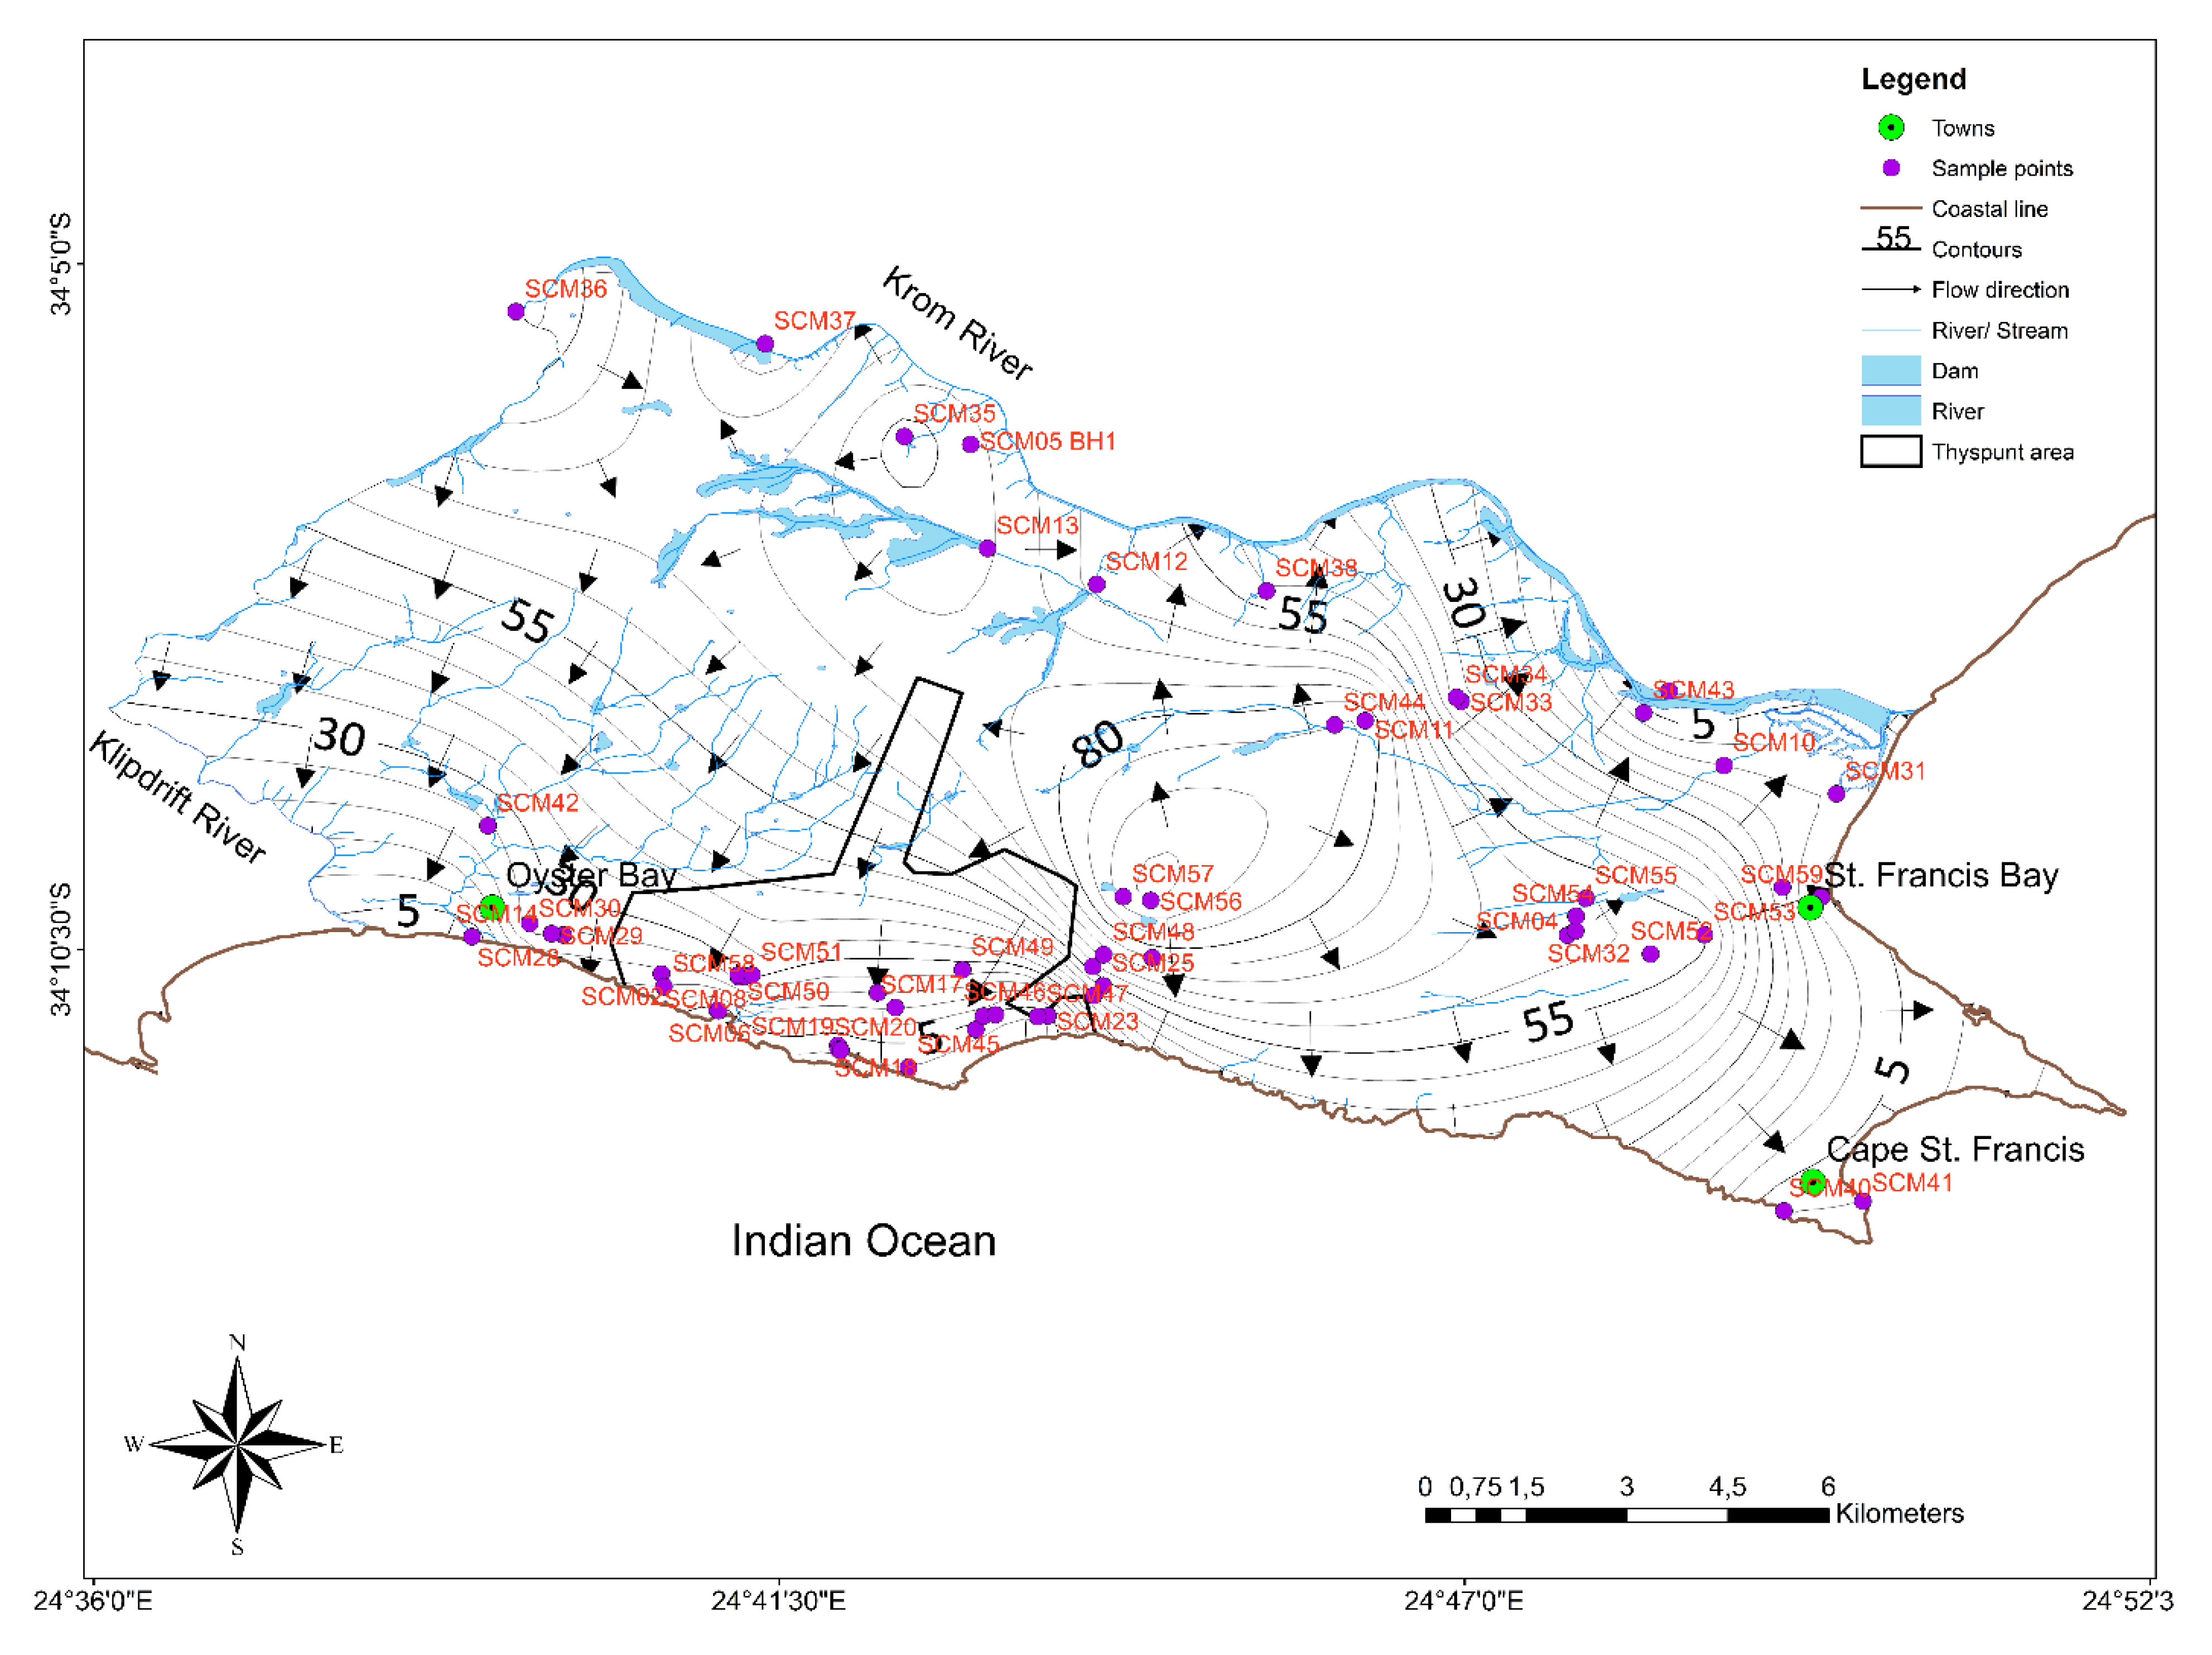
The general groundwater flow direction is from inland towards the Indian Ocean (Figure 7). However, local groundwater flow direction is complex, and is controlled by topographic and lithologic variability, and by the occurrence of wetlands and rivers. The groundwater level and flow map indicates the presence of groundwater and surface water (wetland and rivers) interaction.

4.2. Hydrochemical and Stable Environmental Isotope Characteristics

The physicochemical and chemical parameters were instrumental in revealing the inter-relationship among different water sources (Table 3). The oxidation-reduction potential (ORP) values for groundwater range between −88 mV to −5 mV, suggesting that the groundwater flow essentially occurs within the tight fracture system under anoxic condition. Conversely, shallow groundwater shows higher ORP values. The pH values of the confined aquifers are marginally acidic, with pH of about 6.14, while the unconfined aquifers are marginally alkaline, with pH values of around 8.02, owing to high bicarbonate content (300 to 584 mg/L). Similarly, the pH values in surface water range from 6.75 to 8.26, which demonstrates a probable potential interconnection with groundwater. The electrical conductivity (EC) values of waters in the study area range from 286 µS/cm to 7040 µS/cm, with the ocean water having an EC of around 35,100 µS/cm. Such low value for the sea water could be due to interaction with fresh spring water at the point of measurement. The EC of groundwater generally increases towards the ocean, which follows the trend of the groundwater flow direction. This trend also indicates the possibility of hydrochemical evolution along the flow path involving numerous hydrogeochemical, physical and anthropogenic activities, such as farming and waste disposal.
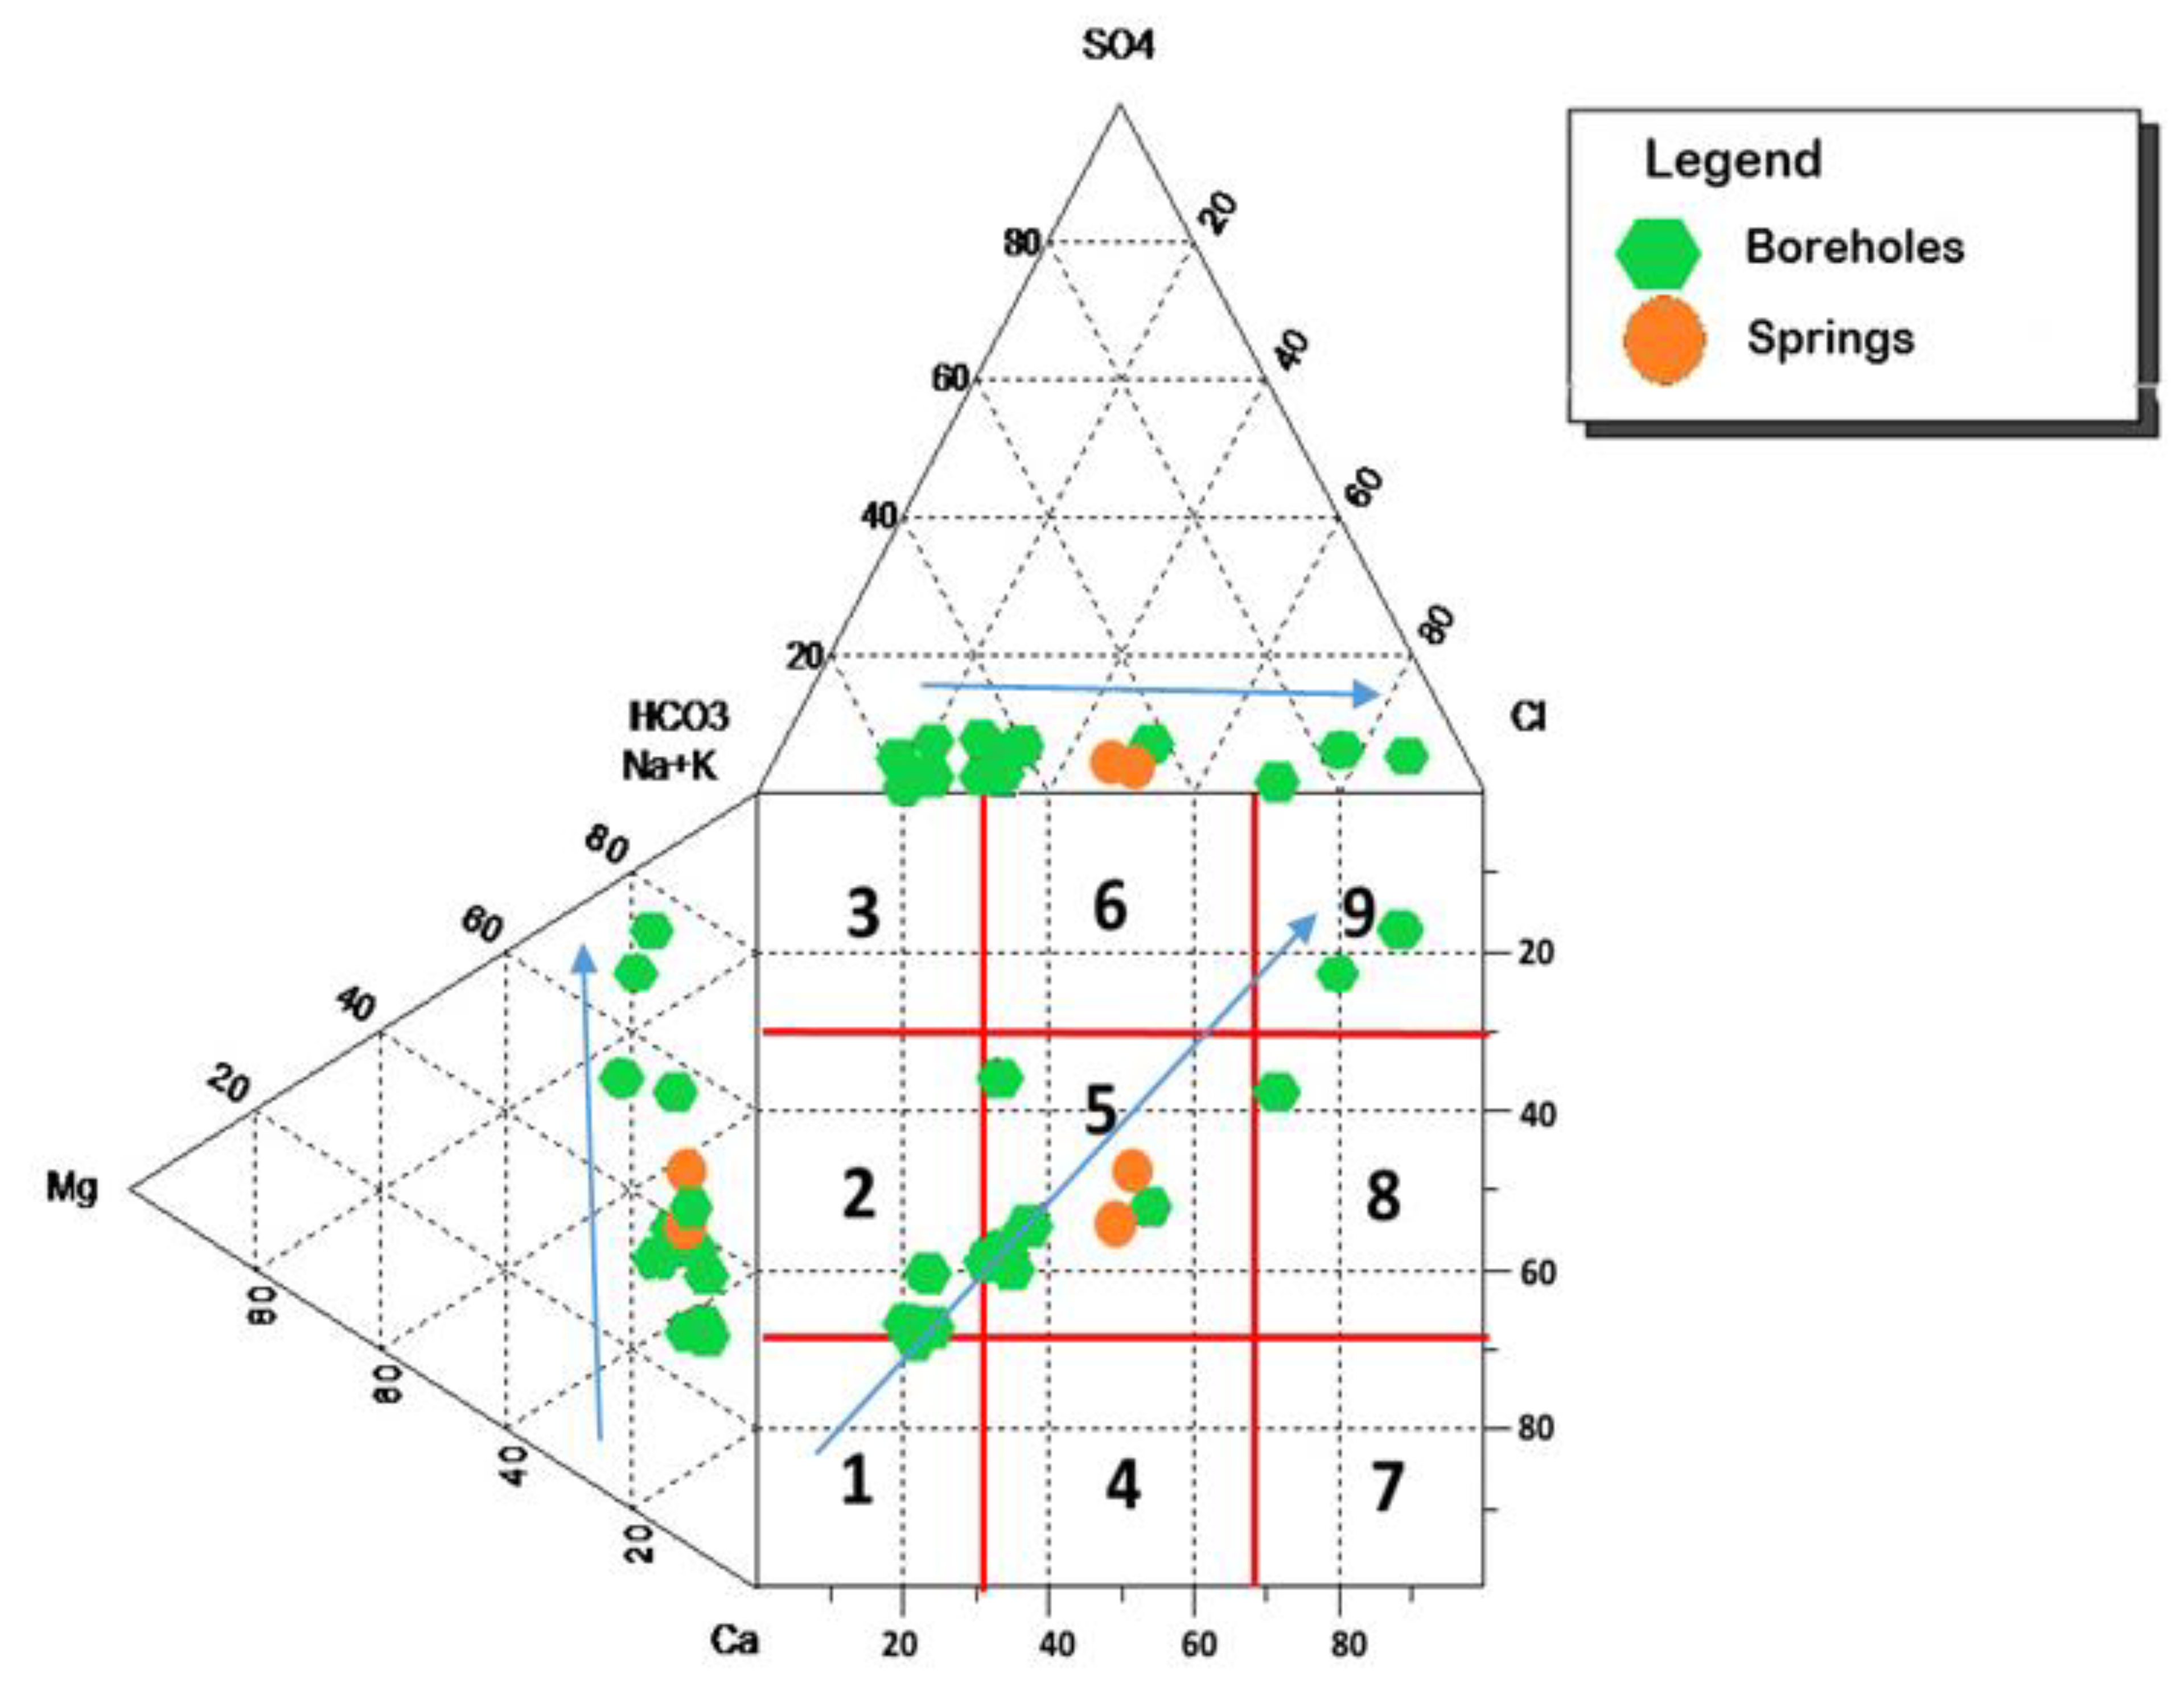
Based on the Durov diagram (Figure 8), the majority of groundwaters belong to the calcium−magnesium−bicarbonate (Ca2+−Mg2+−HCO3) hydrochemical facies. Bicarbonate could be likely sourced from the soil zone and dissolution of calcium carbonate that acts as a cementing material in the calcareous sandstone. As a result, groundwater in the unconfined aquifer is characterized by Ca2+−Mg2+−HCO3 hydrochemical facies. Groundwaters with Ca2+−Mg2+−Cl hydrochemical facies also exist in the Algoa Group aquifers, and are believed to be influenced by wet and dry deposition of chloride from marine source and mixing between Ca2+–Mg2+–HCO3 and Na+Cl type waters along the flow path.
The variation in the chemical composition of water in the area could be linked to mineral dissolution, due to water−rock interaction and the mixing of different water types (Figure 8). Groundwaters sampled from the Algoa Group aquifers fall within field 2 of the Durov diagram (see Figure 8), which is dominated by Ca2+ and HCO3. Moreover, the majority of the groundwater in the Algoa Group aquifers plot within field 5, where no particular cation or anion dominant, signifying the prevalence of mixed water in the aquifer. Furthermore, the groundwater with mixing signatures were sampled closer to the coast, thereby signifying the convergence and subsequent mixing of different flow systems along the groundwater flow direction. Similarly, the hydrochemical behaviour of most springs in the area is as a result of mixing of hydrochemically different waters (shallow water and deep circulating old water). Groundwater from the fractured TMG aquifers plot within field 9, which represents the dominance of Na+ and Cl.
For 50% of the samples, the ionic ratio (in meq/L) for Na/Cl > 1 (1.007−1.743), indicating the presence of additional source for sodium, which could be contributed through cation exchange process, while for the remaining 50% of samples, the ratio falls between 0.688 and 0.952, as a result of high chloride concentration relative to sodium. Since the majority of the boreholes are located in the highly forested nature reserve, transpiration could be the main process for high chloride concentration in the shallow groundwater. On the other hand, the ionic ratio for Ca/HCO3 (in meq/L) < 1 (0.426−0.826) for the large majority of samples, indicating the loss of calcium in the groundwater through precipitation or cation exchange or the leaching of HCO3 from soil horizon, that has increased its concentration irrespective of calcium from common source.
The deep circulating groundwater in the artesian system in the TMG aquifer created an ideal condition for the hydrochemical evolution of the groundwater, through water−rock interaction.
The environmental isotope results, including the deuterium excess (d−excess) values, are presented in Table 4. The stable isotope data are interpreted using the local meteoric water line (LMWL), defined for the Sandveld Station (δ²H = 5.8xδ18O + 5.2‰ [14]). The stable isotope data were plotted with reference to the LMWL and Global Meteoric Water line (GMWL), as shown in Figure 9. All groundwater samples show depleted δ18O and δ2H values, where the δ18O and δ2H values range between −5.40 and 2.60‰, and −22.4 and 17.3‰, respectively (Figure 9). This suggests that groundwater was recharged during colder seasons or by rainfall whose moisture was derived from high latitude source such as the Antarctic region. Moreover, groundwater sampled at proximity to the ocean contains depleted heavy isotope value and, therefore, suggests recharge from heavy isotope depleted moisture source that does not have any relation with the nearby seawater. Most groundwater and spring samples have similar isotopic composition, indicating that the springs originated from the local aquifers where the boreholes were drilled. Some groundwater samples collected from different aquifers exhibit similar isotopic compositions, suggesting a link between them or common recharge area. This aquifer linkage could be explained in terms of groundwater from the unconfined upper intergranular aquifers recharging the lower fractured aquifers. The lack of isotopic and hydrochemical similarities between the seawater and groundwater along the coast indicates the absence of seawater intrusion into the coastal aquifers. Furthermore, the seaward groundwater flow direction, coupled with the dip direction of the limb of the fold towards the ocean, reduces the likelihood of seawater intrusion. The wetland samples show a wide variation in isotopic composition (Figure 9 and Table 4), indicating varying degrees of evaporation and variability in the water source for the wetlands. Wetland samples show enriched isotope signatures because of exposure to extensive evaporation and the type of water source that feeds the wetland (rainfall, interflow, baseflow). These wetlands are located on top of the dunes, and hence, are favorably positioned for evaporation to occur and can be driven by precipitation than groundwater discharge. The distinct isotopic composition of the wetlands and groundwater signifies their hydraulic separation. In some cases, there is a similarity in the stable isotope content of groundwater and the nearby wetland, indicating a possible hydraulic link between the two systems.
The magnitude of the deuterium excess (d−excess) can be used to infer the physical condition of the moisture source, with respect to temperature, humidity and surface temperature [11,15]. Moreover, d−excess is useful for inferring the source of the moisture from which rainfall was generated. The d− excess values range between −0.71‰ and +22.64‰ (Table 4). These indicate the presence of numerous moisture sources for different rainfall events [11]. According to Clark and Fritz [11], groundwater samples characterized by low d−excess are potentially recharged by rainfall sourced from moisture formed under low temperature and humid evaporation conditions, resulting in a highly depleted moisture with respect to heavy isotopes, which is the case for most groundwater samples in the area. All rain samples have the highest d−excess, signifying a local moisture source at the time of sampling, possibly sourced from the Indian Ocean and/or local feedback mechanisms [16].

4.3. Groundwater Residence Time and Implication for Its Management

The results from tritium activity measured for various groundwater samples are presented in Table 5. The mean residence times for groundwater, as calculated from measured tritium activities, range between 5.92 years and 49.71 years in the Algoa Group primary aquifers. As expected, the shortest residence time (5.92 years) implies that the most recent recharge in the Algoa Group aquifers occurred almost 6 years ago. Interestingly, lower tritium values in groundwater from the Algoa Group aquifers were mostly encountered closer to the coast, indicating a high residence time of water, which coincides with the groundwater flow ending position. On the other hand, the tritium-based mean residence time for groundwater from the TMG fractured aquifers was estimated at 24.86 years, which coincides well with the mean residence times in the TMG aquifer of the Western Cape Province [17,18]. Based on this observation, higher tritium concentrations (and therefore, shorter residence times) were encountered in the inland areas, particularly the north and northeastern parts of the study area, where most of the groundwater recharge occurs.
Like tritium, 14C can be used as a geochronological tool to determine the mean residence time of groundwater [19]. The 14C activity measured from groundwater samples is shown in Table 5. The evolution and sources of dissolved inorganic carbon (DIC) in groundwater can be traced using the δ13C values [20]. The δ13C signature in the groundwater samples ranges between −18.81‰ to −10.90‰ (Table 5). The depleted δ13C values could indicate a source of carbon from carbon fractionation through C4 plants photosynthetic cycle and carbon reduction processes [11]. C4 plants have a range of δ13C values between −10‰ and −16‰ [11], with some portion of δ13C being contributed by low grade metamorphic processes. Moreover, the δ13C content in the sample collected from the TMG aquifer (sample SCM45) is −10.90‰, and this is typical of DIC sourced from the dissolution of carbonates, which exists in the calcareous sandstone of the area. This is further supported by the elevated bicarbonate content in the groundwater, indicating recent carbon contribution from recharging water. The 14C based mean residence time of groundwater in the deeper aquifer ranges between 430 ±5 years and 1000 ±10 years. The long residence time is possibly associated with the deep groundwater circulation along the fractures in the bedding of the meta-sedimentary rocks, as indicated by the hydrogeochemically evolved Na+−Cl water type. This could suggest the presence of regional recharge to the area. The difference in the MRT between the shallow and the deep aquifers mean that parts of the deeper aquifers are not in direct hydraulic link with the shallow aquifer, as noted from stable environmental isotope analyses.

4.4. Hydrogeological Conceptual Model of Groundwater Occurrence and Circulation in the Study Area

Based on analyses and the interpretation of geological, hydrogeological, hydrochemical and environmental isotope data, a conceptual hydrogeological model has been proposed (Figure 10), which is based on the lithological and tectonic setting of the area. The conceptual model has been constructed based on a south to north cross-section, as indicated in Figure 3. The complex tectonic deformation that generated fractures both along and across the bedding planes of the metasedimentary rocks with variable depth of weathering and the aeolian deposition mean that defining the conceptual model for the area was a cumbersome task.
The 621 mm/year mean annual rainfall of the area is partitioned into a mean annual recharge rate of 36 mm/year, actual evapotranspiration of 536 mm/year and annual runoff of about 50 mm/year, as estimated from the water balance residual. These suggest that evapotranspiration is the main process that removes water from the area. Groundwater flow generally follows tectonic and weathering features. It mainly discharges in the form of springs and widespread seepages, including as interflow and baseflow to rivers and wetlands.
The lithological logs and associated water strike points during drilling indicate the occurrence of multiple hydrostartigraphic units. The shallow unconfined aquifers are characterized by the weathered, fractured and intergranular aquifers with a thickness that ranges between 12.85 m and 75.97 m, and with a minimum groundwater level of 3.53 m b.g.l. The confined fractured aquifers are composed of the Goudini and Skurwerburg Formations, which occur at greater depth and are occasionally overlain by the unconfined intergranular aquifers (Figure 10). The shale layers with subordinate siltstone of the Ceres Subgroup and Baviaanskloof Formation act as an aquiclude to the confined aquifers.
The occurrence of inclined-bedding planes at different dip angle favors the interlayering of quartzites with different aquifer properties responsible for the occurrence of confined aquifers in the area. At relatively shallow depth, all quartzites behave as fractured aquifers, but confining comes to play at depth where anticlinal deformation brings quartzites and shales at an angle (Figure 10).
Environmental isotope and hydrochemical data support the source of fracture springs and contact springs that emerge due to a strong contrast in the vertical hydraulic conductivity. The upper unconfined aquifers are linked to the lower fractured aquifers at depth in some area, through which groundwater transfers from the intergranular aquifers into the lower fractured aquifers.

5. Conclusions

The synclinal deformation of metasedimentary rocks accompanied by fracturing and weathering in the Thyspunt area generated favorable conditions for groundwater occurrence, storage, circulation and the formation of many springs and wetlands, due to lithological and hydraulic heterogeneities. The area is characterized by an unconfined aquifer made up of weathered and fractured quartzites, sandstone and shale, in addition to recent aeolian dunes that form the primary aquifer. A strong disparity in the d−excess of groundwater and surface water suggests the presence of both local and regional moisture source for rainfall in the area. The absence of seawater intrusion along the coastal aquifers is likely made possible by the orientation of the bedding plane, which dips towards the ocean and the predominant seaward hydraulic gradient in both aquifers, thereby inhibiting the ingress of seawater into the coastal aquifers. Tritium and 14C estimated mean residence times indicate the presence of recent and historic recharge in the unconfined and confined aquifers, respectively. Hydrochemical data indicate that Ca2+−Mg2+−HCO3 are the dominant ions in both surface water, and shallow groundwater as a result of dissolution of carbonates. Mixing of groundwater of different generation was identified closer to the coast, indicating convergence of different flow systems and eventual mixing en-route to the ocean that has evolved chemically. The study further revealed that the proposed nuclear power plant will be situated on the primary Algoa Group aquifer that overlays the fractured quartzite aquifer, which occurs in a pristine condition, necessitating the improvement of the existing an active groundwater monitoring program.

Author Contributions

S.C.M.: drafted the manuscript and participated in field investigations and data collection as a postgraduate student; T.A.A.: designed (PI) and supervised the project, obtained funding for the project, participated in field investigations, carried out stable isotope analysis, edited and reviewed the manuscript; M.B.D.: co-supervised the project (Co-PI), participated in field investigations, carried out hydrochemical analyses of major ions, edited and reviewed the manuscript; M.J.M.: prepared some of the maps and participated in data interpretation. All authors have read and agreed to the published version of the manuscript.

Funding

This research was fully funded by the National Nuclear Regulator of South Africa under the project code CNSS0117−A3−WITS.

Acknowledgments

We extend our deepest gratitude to the Centre for Nuclear Safety and Security of the National Nuclear Regulator of South Africa, for initiating this research beyond the generous financial support they provided. We particularly thank Margaret Mkhosi and Madimetja Segobola from the CNSS for their unprecedented support throughout this research. We also thank Sifiso Nhleko, Lindani Mkhize, Wonderboy Gubela and Tiyane Maluleke for being active during the field campaign. Your assistance was really great. We thank Mr. Michael Butler for tritium and carbon−14 analyses. We wish also to thank Khuliso Masindi for his participation during the field data collection.

Conflicts of Interest

The authors declare no conflict of interest.

References

  1. Taylor, A.R.; Smith, S.D.; Lamontagne, S.; Suckow, A. Characterising alluvial aquifers in a remote ephemeral catchment (Flinders River, Queensland) using a direct push tracer approach. J. Hydrol. 2017, 556, 600–610. [Google Scholar] [CrossRef] [Green Version]
  2. Zhao, D.; Wanga, G.; Liaoa, F.; Yanga, N.; Jianga, W.; Guoa, L.; Liuc, C.; Shia, Z. Groundwater-surface water interactions derived by hydrochemical and isotopic (222Rn, deuterium, oxygen-18) tracers in the Nomhon area, Qaidam Basin, NW China. J. Hydrol. 2018, 565, 650–661. [Google Scholar] [CrossRef]
  3. Department of Water Affairs. Eastern Cape Groundwater Master Plan; DWA EC Office: Port Elizabeth, South Africa, 2010; p. 41.
  4. Department of Environmental Affairs. Nuclear-1 EIA, Draft Environmental Management Plan―Revision 2; Reference No.: 12/12/20/944; Department of Environmental Affairs: Pretoria, South Africa, 2016.
  5. Giacinto, J.; Barnhurst, D.; Tiruneh, N. Conceptual groundwater model development for new nuclear power plants. In Proceedings of the 2nd Joint Federal Interagency Conference, Las Vegas, NV, USA, 1–27 June 2010; pp. 1–12. [Google Scholar]
  6. Oxtobee, J.P.A.; Novakowski, K. A field investigation of groundwater/surface water interaction in a fractured bedrock environment. J. Hydrol. 2002, 269, 169–193. [Google Scholar] [CrossRef]
  7. Baskaran, S.; Ransle, T.; Brodie, R.S.; Baker, P. Investigating groundwater–river interactions using environmental tracers. Aust. J. Earth Sci. 2009, 56, 13–19. [Google Scholar] [CrossRef]
  8. Thamm, A.G.; Johnson, M.R. The Cape Supergroup. In The Geology of South Africa; Johnson, M.R., Anhaeusser, C.R., Thomas, R.J., Eds.; The Geological Society of South Africa and Council for Geosciences: Pretoria, South Africa, 2006; p. 691. [Google Scholar]
  9. Booth, P.W.K.; Munro, A.J.; Shone, R.W. Lithological and structural characteristics of Cape Supergroup rocks at Port Alfred, Eastern Cape, South Africa. S. Afr. J. Geol. 1999, 4, 391–404. [Google Scholar]
  10. Claassen, D. Geographical controls on sediment accretion of the Cenozoic Algoa group between oyster bay and ST. Francis, Eastern Cape Coastline. S. Afr. J. Geol. 2014, 117, 109–128. [Google Scholar] [CrossRef]
  11. Clark, I.D.; Fritz, P. Environmental Isotopes in Hydrogeology; Lewis Publishers: Boca Raton, FL, USA, 1997. [Google Scholar]
  12. Neuman, S.P. Effect of partial penetration on flow in unconfined aquifers considering delayed gravity response. Water Resour. Res. 1974, 10, 303–312. [Google Scholar] [CrossRef]
  13. Crosbie, R.S.; Binning, P.; Kalma, J.D. A time series approach to inferring groundwater recharge using the water table fluctuation method. Water Resour. Res. 2005, 41, 1–9. [Google Scholar] [CrossRef]
  14. Van Wyk, E. Correlations between rainwater and groundwater geochemistry signatures with reference to episodic rainfall events in semi-arid environments. In The Use of Isotope Hydrology to Characterize and Assess Water Resources in South Africa; WRC Report TT570/13; Abiye, T., Ed.; Water Research Commission: Pretoria, South Africa, 2013; pp. 102–110. [Google Scholar]
  15. Froehlich, K.; Gibson, J.J.; Aggarwal, P. deuterium excess in precipitation and its climatological significance. In C&S Papers Series, Proceedings of the International Conference on Study of Environmental Change Using Isotope Techniques, Vienna, Austria, 23–27 April 2001; International Atomic Energy Agency: Vienna, Austria, 2002; Volume 13/P, p. 13531. [Google Scholar]
  16. Abiye, T. (Ed.) The Use of Isotope Hydrology to Characterize and Assess Water Resources in South Africa; WRC Report No TT 570/13; Water Research Commission: Pretoria, South Africa, 2013; p. 211. ISBN 978-1-4312-0480-9. [Google Scholar]
  17. Harris, C.; Burger, C.; Miller, J.; Rawoot, F. O- and H-isotope record of Cape Town rainfall from 1991 to 2008, and its application to recharge studies of Table Mountain groundwater, South Africa. S. Afr. J. Geol. 2010, 113, 33–56. [Google Scholar] [CrossRef]
  18. Miller, J.A.; Dunforda, A.J.; Swanaa, K.A.; Palcsub, L.; Butlerc, M.; Clarked, C.E. Stable isotope and noble gas constraints on the source and residence time of spring water from the Table Mountain Group Aquifer, Paarl, South Africa and implications for large scale abstraction. J. Hydrol. 2017, 551, 100–115. [Google Scholar] [CrossRef]
  19. Kazemi, G.A.; Lehr, J.H.; Perrochet, P. Groundwater Age; John-Wiley and Sons, Inc.: Hoboken, NJ, USA, 2006; p. 9. [Google Scholar]
  20. Fritz, P.; Fonte, J.C.; Frape, S.K.; Louvat, D.; Michelot, J.L.; Balderer, W. The isotope geochemistry of carbon in groundwater at Stripa. Geochim. Cosmochim. Acta 1988, 53, 1765–1775. [Google Scholar] [CrossRef]
Figure 1. Location map of the study area, including topographic elevation in m.a.s.l.
Hydrology 07 00049 g001
Figure 2. Monthly rainfall (bar graph) and monthly ambient temperature (line) in the Thyspunt area (Data supplied by the NNR).
Hydrology 07 00049 g002
Figure 3. Geological map of Thyspunt area. Note N−S sectional line used for the conceptual model.
Hydrology 07 00049 g003
Figure 4. Location of water sampling points within the study area.
Hydrology 07 00049 g004
Figure 5. Rose diagram of the structural orientations of quartzite rocks in Thyspunt.
Hydrology 07 00049 g005
Figure 6. Field photograph showing intensively fractured shale (top) and quartzite (bottom) with inclined fractures along the bedding plane and orthogonal fractures that dissected the rocks.
Hydrology 07 00049 g006
Figure 7. Groundwater level and flow map.
Hydrology 07 00049 g007
Figure 8. The Durov diagram for the Thyspunt water samples.
Hydrology 07 00049 g008
Figure 9. Environmental stable isotope (δ18O and δ²H) plot for surface water and groundwater samples.
Hydrology 07 00049 g009
Figure 10. Hydrogeological conceptual model for the Thyspunt area, based on a south−north cross-section direction, as indicated in Figure 3.
Hydrology 07 00049 g010
Table 1. Hydraulic properties of aquifers estimated from pumping test data analyses of 11 boreholes (T: Transmissivity, S: Storativity, Sy: Specific yield, K: Hydraulic conductivity). Pumping test data provided by NNR.
IDFitts Geosolutions Determined Aquifer PropertiesAquifer ThicknessAquifer TypeAquifer Unit
T K
(m2/d)SSy(m/d)(m)
THY−RP11.451 × 10−3 0.012125ConfinedTMG
THY−RP239.013.75 × 10−40.10.51476ConfinedTMG
THY−RP544.011.0 × 10−3 0.32138ConfinedTMG
THY−RP637.995.0 × 10−5 1.5824ConfinedTMG
THY−RP836.81 0.0060.33112UnconfinedTMG
THY−RP1415.041.69 × 10−3 0.8418ConfinedTMG
THY−RP102.51 0.0450.04457UnconfinedTMG
THY−RP94.563.0 × 10−2 0.06768ConfinedTMG
THY−MR2108.3 0.124.4724UnconfinedALGOA
THY−MR5275 1.47 × 10−219.1313UnconfinedALGOA
THY−RP110.361.0 × 10−5 0.0140ConfinedTMG
THY−MR11125.1 0.17.7216UnconfinedALGOA
Table 2. Infiltration test results conducted around Thyspunt.
Test SiteLatitudeLongitudeAltitude (m.a.s.l)Soil TypeInfiltration Rate (mm/min)
St. Francis Bay Park−34.1636424.8263910Sandy soil5.1
Thyspunt−34.1787224.6863454Sandy soil5.20
Thyspunt34.1915026.713259Sandy soil4.5
Pennisands Farm−34.1504724.70840130Sandy soil2.5
Rosa Farm−34.1079124.7170356Loamy1.1
Table 3. Physicochemical, chemical and descriptive statistics for water samples in the Thyspunt area.
IDWater PointpHEC
(μS/cm)
TDS
(mg/L)
ORP
(mV)
Temp
(°C)
Na
(mg/L)
K
(mg/L)
Mg
(mg/L)
Ca
(mg/L)
Cl
(mg/L)
SO4
(mg/L)
HCO3
(mg/L)
SCM01Rain7.21286180197.714.75
SCM03Spring7.751341856−69 119.543.1316.3996.88183.215.7300.1
SCM05Borehole6.5616651048.95518.5200.557.2431.9535.83324.831.2131.8
SCM07Borehole7.22940592.2−3219.750.221.328.3364.4478.923.4316.7
SCM08Borehole7.18779490.77−3020.852.042.3510.1575.6179.711.5310.6
SCM09Borehole7.16876551.88−2918.449.100.778.2494.4667.90.2468.3
SCM10River7.961284808.92−3211.5
SCM11Spring6.82416262.08−7614.2
SCM12Wetland6.751367861.21−512.9
SCM13Wetland7.231186747.18−2613
SCM14Ocean7.5234,30021,609−5116.7
SCM16Borehole7.2908572.04−3018.545.351.9411.4991.376532.2402
SCM17Borehole7.24781492.03−3321.3
SCM18Ocean7.9133,50021,105−7519
SCM19Spring7.71066671.58−6018.7
SCM20Spring7.95986621.18−7418.3
SCM21Borehole7.3923581.49−3619.2118.024.8415.6559.602023140.1
SCM22Borehole7.12912574.56−2917.839.552.157.5482.5454.29.9375.3
SCM23Borehole7.091041655.83−2720.4
SCM24Wetland7.8787495.81−7217.5
SCM25Borehole7.29863543.69−3818.5
SCM26Borehole7.081493940.59−2619.987.421.2212.04125.4298.114.5584.6
SCM27Spring7.68964607.32−5118.1
SCM28Spring7.7418851187.55−6316.3
SCM29Borehole7.41470926.1−4214.3
SCM30Spring7.7428001764−6016.7
SCM31Borehole7.381500945−4217
SCM33Artesian BH6.14985620.55
SCM34Wetland7.581440907.2−5216
SCM35Spring7.7955601.65−7219.5
SCM36Wetland7.616241023.12−4314.5
SCM38Spring7.69866545.58−4919.6
SCM39Ocean8.0333,80021,294−7819.3
SCM40Ocean7.935,10022,113−7217.6
SCM42River7.0116691051.47−2614.4
SCM43Wetland7.531453915.39−4913.4
SCM44Artesian BH6.751224771.129817.2154.144.9119.1016.21345.328.163.4
SCM45Borehole7.32931586.53−3817.560.614.3311.9770.2098.127.5314.1
SCM46Borehole7.9580365.4−7117.6
SCM47Borehole7.41093688.59−4118.6113.3413.6626.6850.95100.312.2363.8
SCM48Borehole7.0590056717.6 60.681.2216.1385.46122.85.4431.4
SCM50Borehole8.0224601549.8−7718.9
SCM51Borehole7.85430270.9−70
SCM52Spring7.97949597.87−6814.5
SCM53Spring8.261236778.68−7713.9
SCM54Wetland8.2217681113.84−8815.1
SCM55Wetland7.7319361219.68−6013.2
SCM56Wetland8.14493310.59−8516.3
SCM57Wetland7.6370404435.2−5515.8
SCM58Spring7.921135715.05−6416.686.872.4212.7995.74188.219.9340.7
SCM59Borehole7.511557980.91−49 135.905.3319.44137.23289.848.8426.7
MinimumBoreholes6.14430270.9−7714.339.550.777.5416.2154.200.2063.40
Springs6.82416262.08−7713.986.872.4212.7995.74183.2015.70300.10
Wetlands6.75493310.59−8812.9
River7.011284808.92−3211.5
Ocean7.5233,50021,105−7816.7
MaximumBoreholes8.0224601549.89821.3200.5513.6631.95137.23345.3048.80584.60
Springs8.2628001764−4919.6119.543.1316.3996.88188.2019.90340.70
Wetlands8.2270404435.2−517.5
River7.9616691051.47−2614.4
Ocean8.0335,10022,113−5119.3
MeanBoreholes7.231116.57703.44−31.5318.5689.763.9515.2976.10148.2219.07332.98
Springs7.721237.55768.25−66.1516.69103.202.7814.5996.31185.7017.80320.40
Wetlands7.621909.401202.92−53.5014.77
River7.491476.50930.20−2912.95
Ocean7.8434,17521,530.25−6918.15
Table 4. Stable isotope values and d−excess in the Thyspunt area.
IDWater Sourceδ²H (‰)δ18O (‰)d−Excess
SCM01Rain−3.3 ± 2.3−4.47 ± 0.322.65
SCM02Rain0.3 ± 0.7−3.14 ± 0.218.50
SCM03Spring−13.4 ± 0.9−3.42 ± 0.16.46
SCM04Rain−12.5 ± 0.9−4.57 ± 0.213.99
SCM05 BH1Borehole−21.4 ± 0.4−5.37 ± 0.19.77
SCM05−BH1.1Borehole−22.4 ± 4.2−4.92 ± 0.36.18
SCM07Borehole−13.9 ± 0.2−3.94 ± 0.18.87
SCM08Borehole−14.3 ± 0.2−4.01 ± 0.18.95
SCM09Borehole−15.2 ± 0.5−4.28 ± 0.19.61
SCM10River−12.9 ± 0.2−3.62 ± 0.18.09
SCM11Spring−17.1 ± 0.5−4.82 ± 0.010.87
SCM12Wetland−9.9 ± 1.2−3.53 ± 0.110.50
SCM15Borehole−19.8 ± 0.3−4.95 ± 0.18.95
SCM16Borehole−20.6 ± 0.4−5.04 ± 0.18.60
SCM17Borehole−21.1 ± 0.5−4.94 ± 0.17.55
SCM18Ocean water3.5 ± 0.90.73 ± 0.2−0.71
SCM19Spring−17.8 ± 1.4−4.07 ± 0.25.79
SCM21Borehole−13.2 ± 0.6−3.84 ± 0.19.11
SCM22Borehole−12.4 ± 1.0−4.24 ± 0.112.22
SCM23Borehole−10.5 ± 0.5−3.60 ± 0.110.33
SCM24Wetland−11.1 ± 0.4−3.53 ± 0.19.41
SCM25Tap water−8.5 ± 0.3−2.74 ± 0.17.38
SCM26Borehole−15.0 ± 1.4−4.36 ± 0.110.30
SCM27Spring−17.8 ± 0.4−4.69 ± 0.19.42
SCM28Spring−14.4 ± 0.8−4.94 ± 0.114.23
SCM29Borehole−18.6 ± 0.4−4.87 ± 0.19.59
SCM30Spring−14.8 ± 0.4−4.67 ± 0.112.30
SCM31Borehole−15.9 ± 0.7−4.08 ± 0.27.78
SCM32Tap−Borehole−19.2 ± 3.3−4.72 ± 0.38.18
SCM33Artesian Borehole−17.8 ± 1.5−4.58 ± 0.18.78
SCM34Wetland16.5 ± 1.72.11 ± 0.24.29
SCM36Wetland−9.5 ± 0.8−3.57 ± 0.111.28
SCM37Municipal dam6.0 ± 2.30.16 ± 0.35.11
SCM38Spring9.8 ± 1.31.27 ± 0.22.43
SCM39Estuary8.5 ± 0.81.07 ± 0.22.26
SCM40Ocean water3.5 ± 0.70.59 ± 0.10.10
SCM41Ocean water3.6 ± 0.80.60 ± 0.20.16
SCM42stream5.8 ± 0.5−0.65 ± 0.19.58
SCM43Wetland−10.9 ± 2.4−3.25 ± 0.17.92
SCM44Artesian Borehole−17.1 ± 1.0−4.63 ± 0.29.72
SCM45Borehole−17.3 ± 3.2−4.64 ± 0.39.57
SCM46Borehole−13.8 ± 0.8−4.39 ± 0.211.60
SCM47Borehole−16.8 ± 0.4−4.64 ± 0.110.05
SCM48Borehole−14.1 ± 2.0−4.82 ± 0.313.82
SCM50Borehole−9.3 ± 1.4−3.83 ± 0.312.92
SCM51Borehole−13.1 ± 0.3−3.87 ± 0.19.34
SCM52Pond14.5 ± 0.32.57 ± 0.1−0.34
SCM53Quarry17.2 ± 1.22.11 ± 0.65.02
SCM53Pond−11.2 ± 1.0−4.10 ± 0.112.62
SCM54Wetland−3.60 ± 0.6−2.12 ± 0.28.69
SCM55Pond−4.43 ± 1.8−3.83 ± 0.217.76
SCM56Wetland−8.0 ± 0.5−3.30 ± 0.111.16
SCM57Spring−8.1 ± 1.4−3.53 ± 0.212.39
SCM58Borehole−14.5 ± 0.6−4.01 ± 0.18.73
SCM59Borehole−15.7 ± 0.4−4.10 ± 0.18.11
Table 5. Groundwater residence times estimated from 3H and 14C data.
IDWater SourceAquifer TypeHydrochemical FaciesTritium
(T.U.)
3H MRT
(Years)
δ13C
(‰)
14C
(pMC)
14C MRT
(Years)
SCM07BoreholeIntergranular: Algoa GroupCa2+−Mg2+−HCO31.0 ± 0.320.86
SCM08BoreholeIntergranular: Algoa GroupCa2+−Mg2+−HCO31.0 ± 0.320.86
SCM09BoreholeIntergranular: Algoa GroupCa2+−Mg2+−HCO3 −12.3494.99 ± 0.51430 ± 5
SCM15BoreholeIntergranular: Algoa GroupCa2+−Mg2+−HCO32.0 ± 0.38.43
SCM16BoreholeIntergranular: Algoa GroupCa2+−Mg2+−HCO31.8 ± 0.310.32
SCM17BoreholeIntergranular: Algoa GroupCa2+−Mg2+−HCO32.3 ± 0.35.92
SCM21BoreholeIntergranular: Algoa GroupNa+−Cl1.3 ± 0.316.15
SCM22BoreholeIntergranular: Algoa GroupCa2+−Mg2+−HCO31.5 ± 0.313.59
SCM23BoreholeIntergranular: Algoa GroupCa2+−Mg2+−HCO30.7 ± 0.227.25
SCM26BoreholeIntergranular: Algoa GroupCa2+−Mg2+−HCO31.9 ± 0.39.35
SCM29BoreholeIntergranular: Algoa GroupCa2+−Mg2+−HCO30.8 ± 0.224.86
SCM31BoreholeIntergranular: Algoa GroupCa2+−Mg2+−HCO32.2 ± 0.36.72
SCM33Artesian BHFractured: TMGNa+−Cl −18.8188.78 ± 0.45980 ± 5
SCM44Artesian BHFractured: TMGNa+−Cl0.8 ± 0.224.86
SCM45BoreholeFractured: TMGCa2+−Mg2+−HCO3 −10.9088.6 ± 0.621000 ± 10
SCM46BoreholeIntergranular: Algoa GroupCa2+−Mg2+−HCO31.6 ± 0.312.43
SCM47BoreholeIntergranular: Algoa GroupCa2+−Mg2+−HCO30.2 ± 0.249.71
SCM48BoreholeIntergranular: Algoa GroupCa2+−Mg2+−HCO31.0 ± 0.320.86
SCM50BoreholeFractured: TMGCa2+−Mg2+−HCO30.8 ± 0.224.86
SCM51BoreholeFractured: TMGCa2+−Mg2+−Cl0.8 ± 0.224.86
SCM59BoreholeIntergranular: Algoa GroupCa2+−Mg2+−Cl1.7 ± 0.311.34