1. Introduction
Heavy precipitation is the result of interactions between large-scale circulation and small- and medium-scale meteorological systems [
1,
2,
3,
4]. According to the regulations of the China Meteorological Administration, heavy precipitation characterized by a daily precipitation of 50 mm or more is called heavy rain. Extreme rainfalls in China are closely related to large-scale circulation backgrounds such as the summer monsoon from India and the western Pacific, the subtropical high over the western Pacific and the Qinghai–Tibet Plateau, and the atmospheric circulation in the middle and high latitudes of East Asia [
5,
6,
7,
8,
9,
10]. At the same time, they are subject to the constraints of the weather scale system that affects water vapor supply, vertical ascending motion, and stratification stability.
The small- and medium-scale weather systems are often the direct responsible for heavy rainfall [
11,
12,
13]. The small- and medium-scale systems change the distribution of the atmospheric thermal field, humidity field, and wind field through the transmission of mass, energy, and momentum, thus forming a feedback mechanism for the weather scale system [
14]. The occurrence of heavy rain is the product of the interaction between multi-scale circulation and weather system, and tropical cyclone is an important weather system that causes heavy rainfall [
15]. The study of typhoon and rain is also an important topic in the world [
16,
17,
18,
19,
20,
21].
A tropical cyclone is a warm cyclonic vortex that occurs on the surface of the tropics. In common acute natural disasters, typhoons cause the largest number of deaths. The incidence of typhoons in the Pacific Northwest is higher than in other seas, and typhoon disasters in China are among the most numerous in the world [
22,
23,
24,
25]. The winds, heavy rains, and tides brought by typhoons can cause flash floods and even reservoir collapses, causing floods. They can also cause collapse of houses, destruction of power systems and communication systems, or seawall dikes and seawater intrusion. Typhoons pose a huge threat to human life and property security [
26].
China is one of the countries most affected by typhoons in the world, and disasters are often caused by extreme rainfall brought by typhoons. Extreme rainfall induced by typhoons can directly cause disasters such as flash floods and landslides and can even lead to flooding caused by collapse of large reservoirs. Typhoons landfalling in China’s coastal areas often cause severe disasters such as heavy rains and floods, causing huge economic losses and even casualties. Therefore, the study of the formation and distribution of extreme rainfall under the influence of typhoons has great social and scientific significance [
27,
28,
29].
Most studies on heavy rain induced by typhoons have focused on diagnostic analysis and have analyzed the physical mechanisms affecting typhoon precipitation from the perspective of weather. The main occurrence areas of typhoon precipitations are four: (1) cumulonimbus cloud area of typhoon core eye wall; (2) typhoon spiral cloud zone; (3) typhoon inverted-channel shear zone; (4) a certain distance from the front of the west wind trough. No matter from which area it occurs, typhoon precipitations are affected by physical factors such as water vapor, rising motion, and unstable potential. The intensity and distribution of typhoon precipitations are often affected by the structure, topography, and surroundings of the typhoon circulation. The circulation field affecting the typhoon includes the mid-latitude trough, the middle and lower troposphere rapids, the subtropical high, the mid-latitude cut cold vortex, the positive vorticity cloud, low pressure and other low-pressure systems induced by the typhoon, low-latitude or near-equator systems, etc. [
30,
31,
32]. The interaction between typhoon and mid-latitude circulation system and cold air intrusion after westerly trough plays an important role in convective development, while the interaction between convective cloud and tropical depression can lead to heavy rain [
33].
The study on heavy rainfall induced by tropical cyclones has made a lot of progress; however, the accurate prediction of rainfall and precipitation induced by typhoon is still a difficult problem because of the nonlinear relationship between typhoon precipitation process and physical processes such as typhoon dynamics, heat, cloud microphysics, and radiation. In this study, we simulated the rainfall distribution under the influence of a typhoon by using a state-of-the-art atmosphere–ocean-wave model considering a real typhoon as a case study.
2. Rainfall Mechanism Associated with Tropical Cyclones
One of the most remarkable features of our planet is that the atmosphere and the ocean act as one interdependent system. Observations of the atmosphere–ocean system show that what happens in one of these two elements causes changes in the other. Further, the two parts of this system are linked by complex feedback loops, some of which reinforce a change, while others counteract the initial change. Surface currents in the oceans, for instance, are a direct result of earth’s atmospheric wind belts. Conversely, certain atmospheric weather phenomena are manifested in the oceans. In order to understand the behavior of the atmosphere and the oceans, their mutual interactions and relationships must be examined.
Air–sea interactions have important implications in global warming. The global climate change affects the frequency and intensity of typhoons [
34,
35,
36]. A multitude of recent studies have confirmed that the atmosphere is experiencing unprecedented warming as a result of human-caused emissions of carbon dioxide and other gases that absorb and trap heat in the atmosphere. This atmospheric heat is being transferred to the oceans and has the potential to cause widespread marine ecosystem changes. Because of the ocean’s huge extent over earth’s surface and also because of water’s unusual thermal properties, the ocean dramatically influences global weather phenomena and climate patterns.
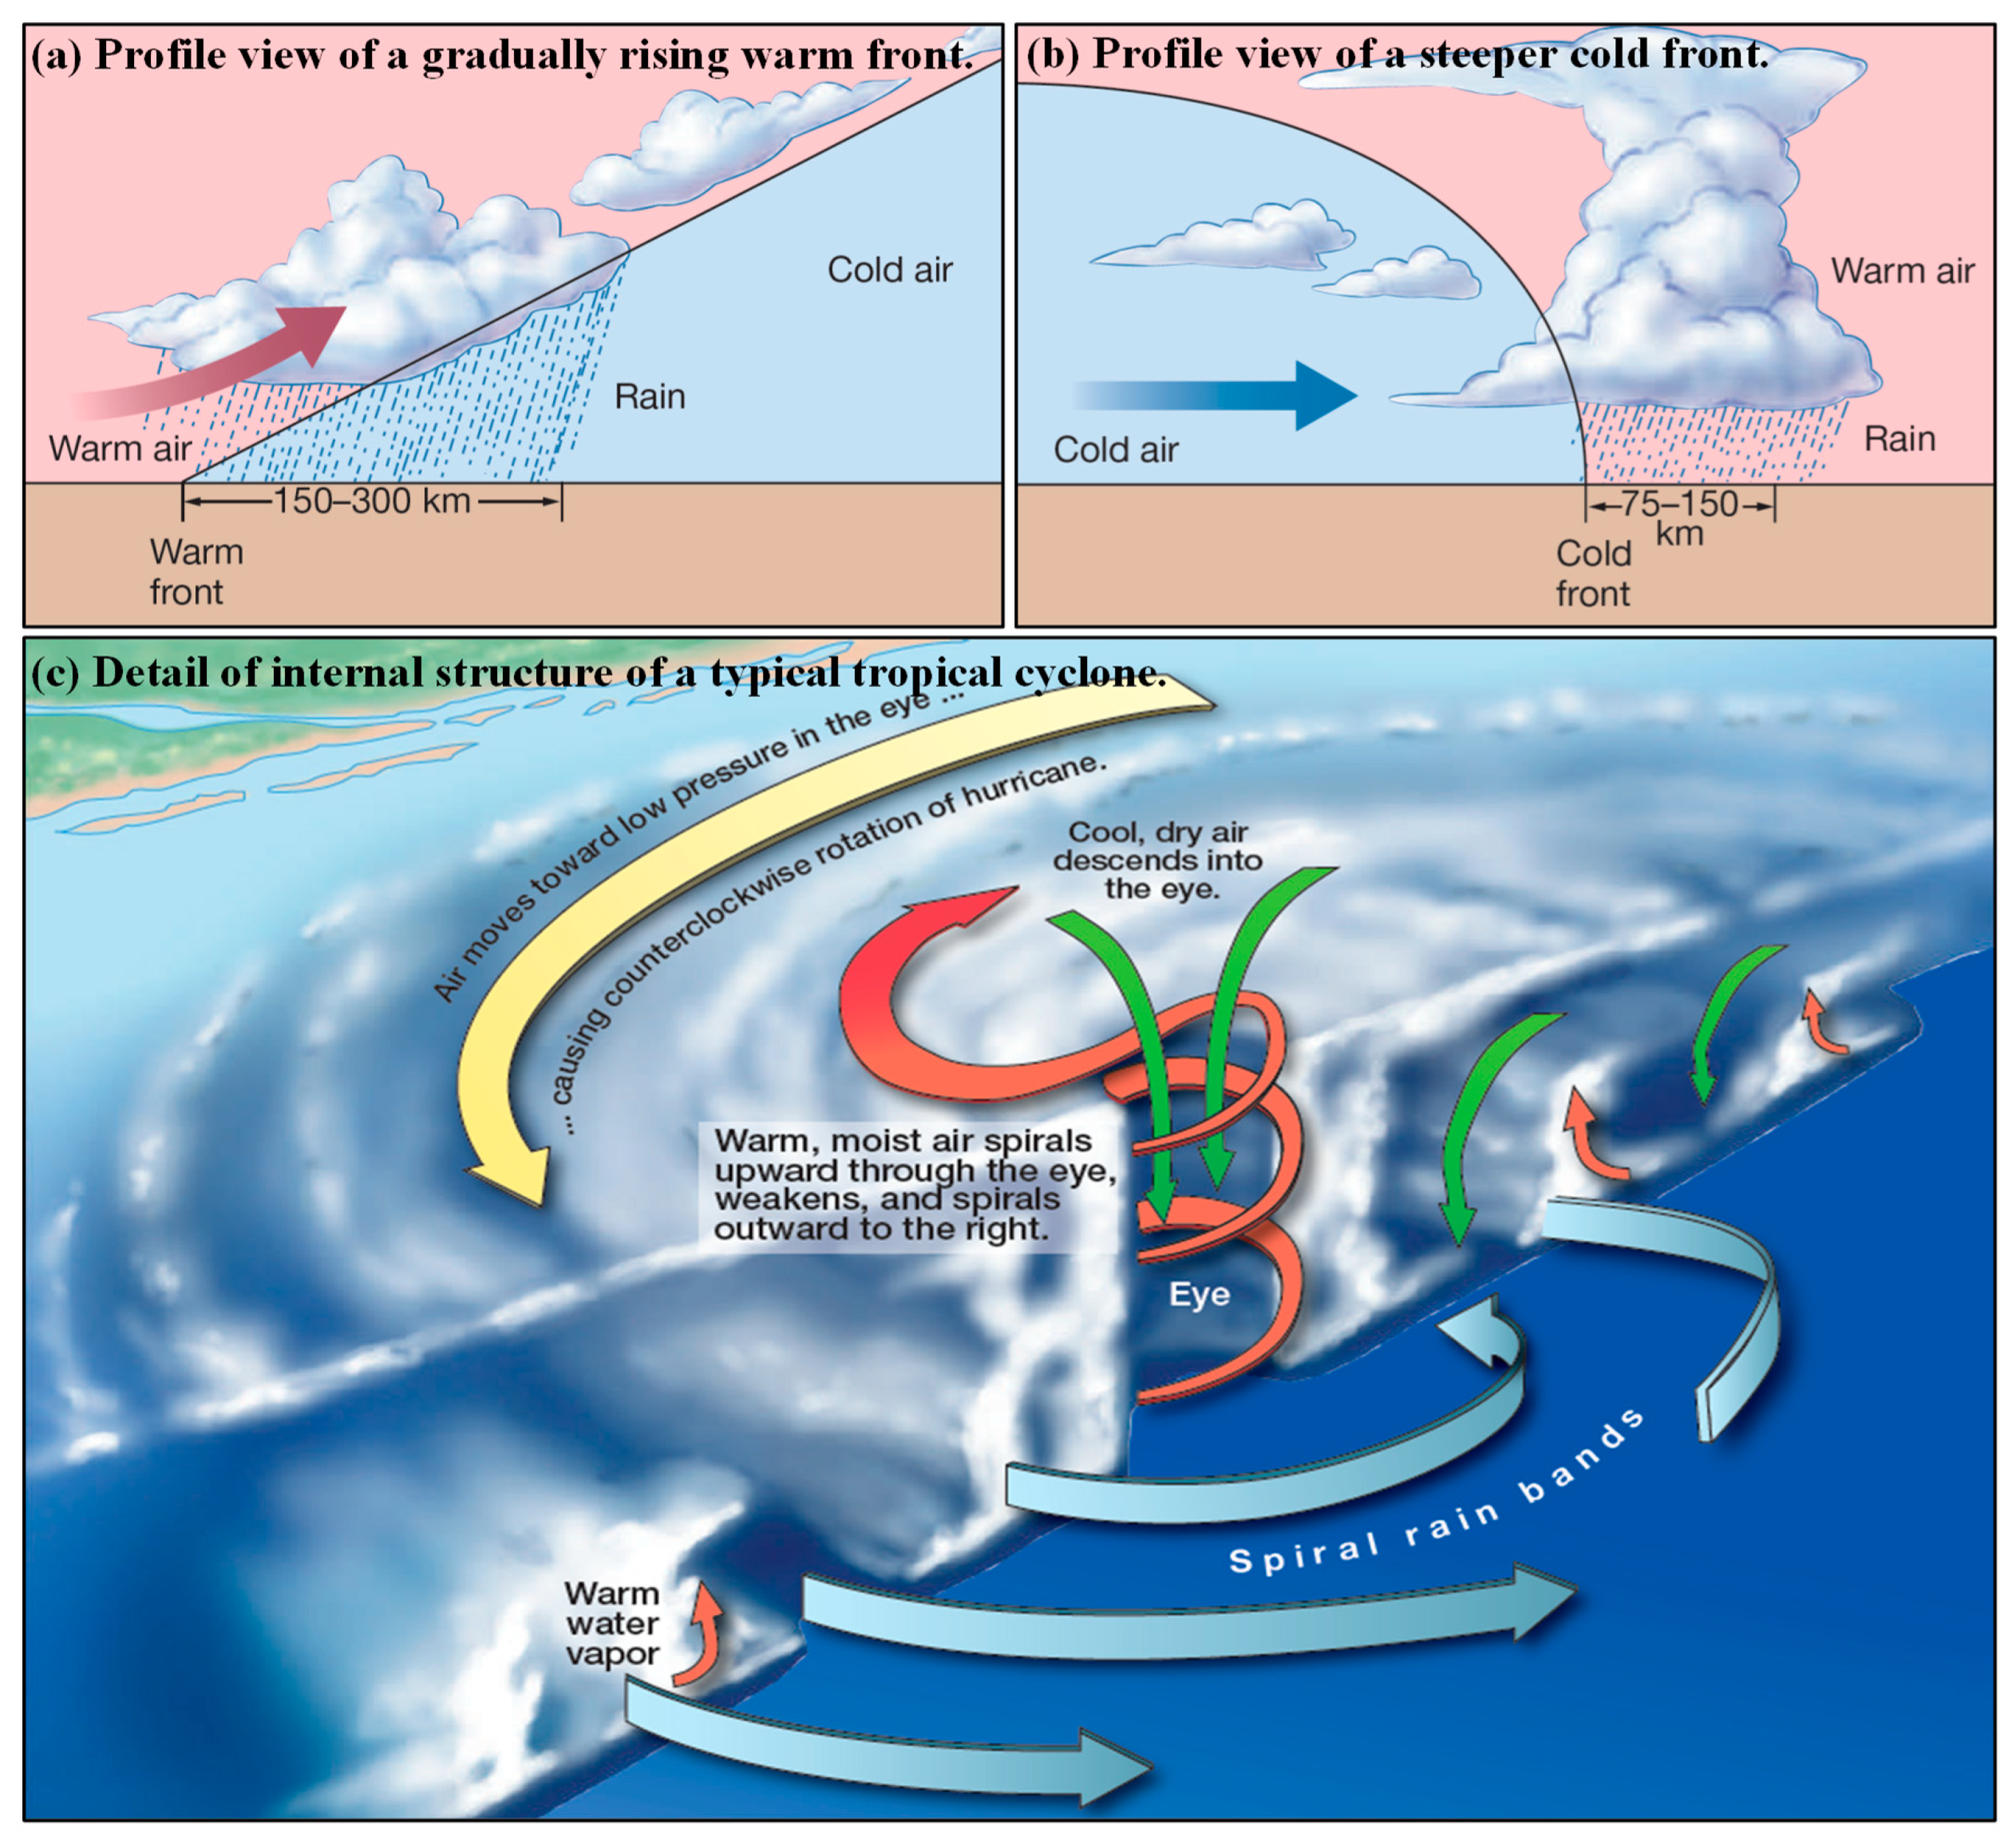
At very high and very low latitudes, there are almost no daily and slight seasonal variations in weather. Equatorial regions are usually warm, damp, and typically calm because the dominant direction of air movement in the doldrums is upward. Midday rains are common, even during the supposedly “dry” season. It is within the middle latitudes between 30 and 60 degrees north or south where storms are common. Storms are atmospheric disturbances characterized by strong winds, precipitation, and lightning. Because of seasonal variations in the pressure system on the mainland, air masses from high latitudes and low latitudes may enter mid-latitudes and encounter severe storms. Air masses are large amounts of air with a clear origin and unique characteristics. As the polar and tropical air masses enter the mid-latitudes, they also gradually move eastward. The warm front is the contact between the warm air mass moving to the area occupied by cold air. The cold front is the contact between the mass of cold air moving to the area occupied by warm air (
Figure 1a,b).
These confrontations are caused by the movement of the rapids, which are narrow, fast-moving, air-flowing air masses. They are located above the mid-latitude area just below the top of the troposphere and about 10 km (6 miles) above sea level. They usually travel along a wave path and may cause abnormal weather by directing polar air masses to tropical air masses far to the south or away from the north. Whether the front is warm or cold, the warmer, lower density air is always higher than the denser cold air. The warm air cools as it rises, so its water vapor condenses into a precipitate. The cold front is usually steeper, and its temperature difference is greater than that of the warm front. Therefore, the rain along the cold front is usually heavier and more short-lived than the rain along the warm front.
Tropical cyclones (hurricanes or typhoons) are massive low-pressure rotating masses characterized by strong winds and heavy rains. They are the largest storm system on earth, although they are not related to any frontier. Tropical cyclones can be very destructive. In fact, a single hurricane contains more energy than all the energy produced by the United States in the past 20 years.
It is worth noting that the strength of tropical storms is the release of a large amount of potential latent heat of condensation, which is carried in water vapor and released as the water condenses in the hurricane to form clouds. The tropical cyclone begins as a low-voltage battery that disconnects from the equatorial low-pressure zone and grows as it absorbs thermal energy in the following manner. The surface wind transports moisture (in the form of water vapor) into the storm. When water evaporates, it stores tremendous amounts of heat in the form of latent heat of evaporation. When the water vapor condenses into a liquid (in this case, clouds and rain), it releases this stored heat—latent heat of condensation—into the surrounding atmosphere, which causes the atmosphere to warm and the air to rise. This rising air causes the surface pressure to decrease, drawing additional warm moist surface air into the storm. This air, as it rises and cools, condenses into clouds and releases even more latent heat, further powering the storm and continuously repeating its movement in a feedback loop, each time intensifying the storm.
Once tropical cyclones move over cooler water or land, their energy source is cut off, which causes tropical cyclones to dissipate. The diameter of a typical tropical cyclone is less than 200 km, although extremely large hurricanes can exceed diameters of 800 km. As air moves across the ocean surface toward the low-pressure center, it is drawn up around the eye of the tropical cyclone (
Figure 1c). The air in the vicinity of the eye spirals upward, so horizontal wind speeds may be less than 15 km per hour. The eye of the hurricane, therefore, is usually calm. Tropical cyclones are composed of spiral rain bands where intense rainfall caused by severe thunderstorms can produce tens of centimeters (several inches) of rainfall per hour.
3. Case Selected
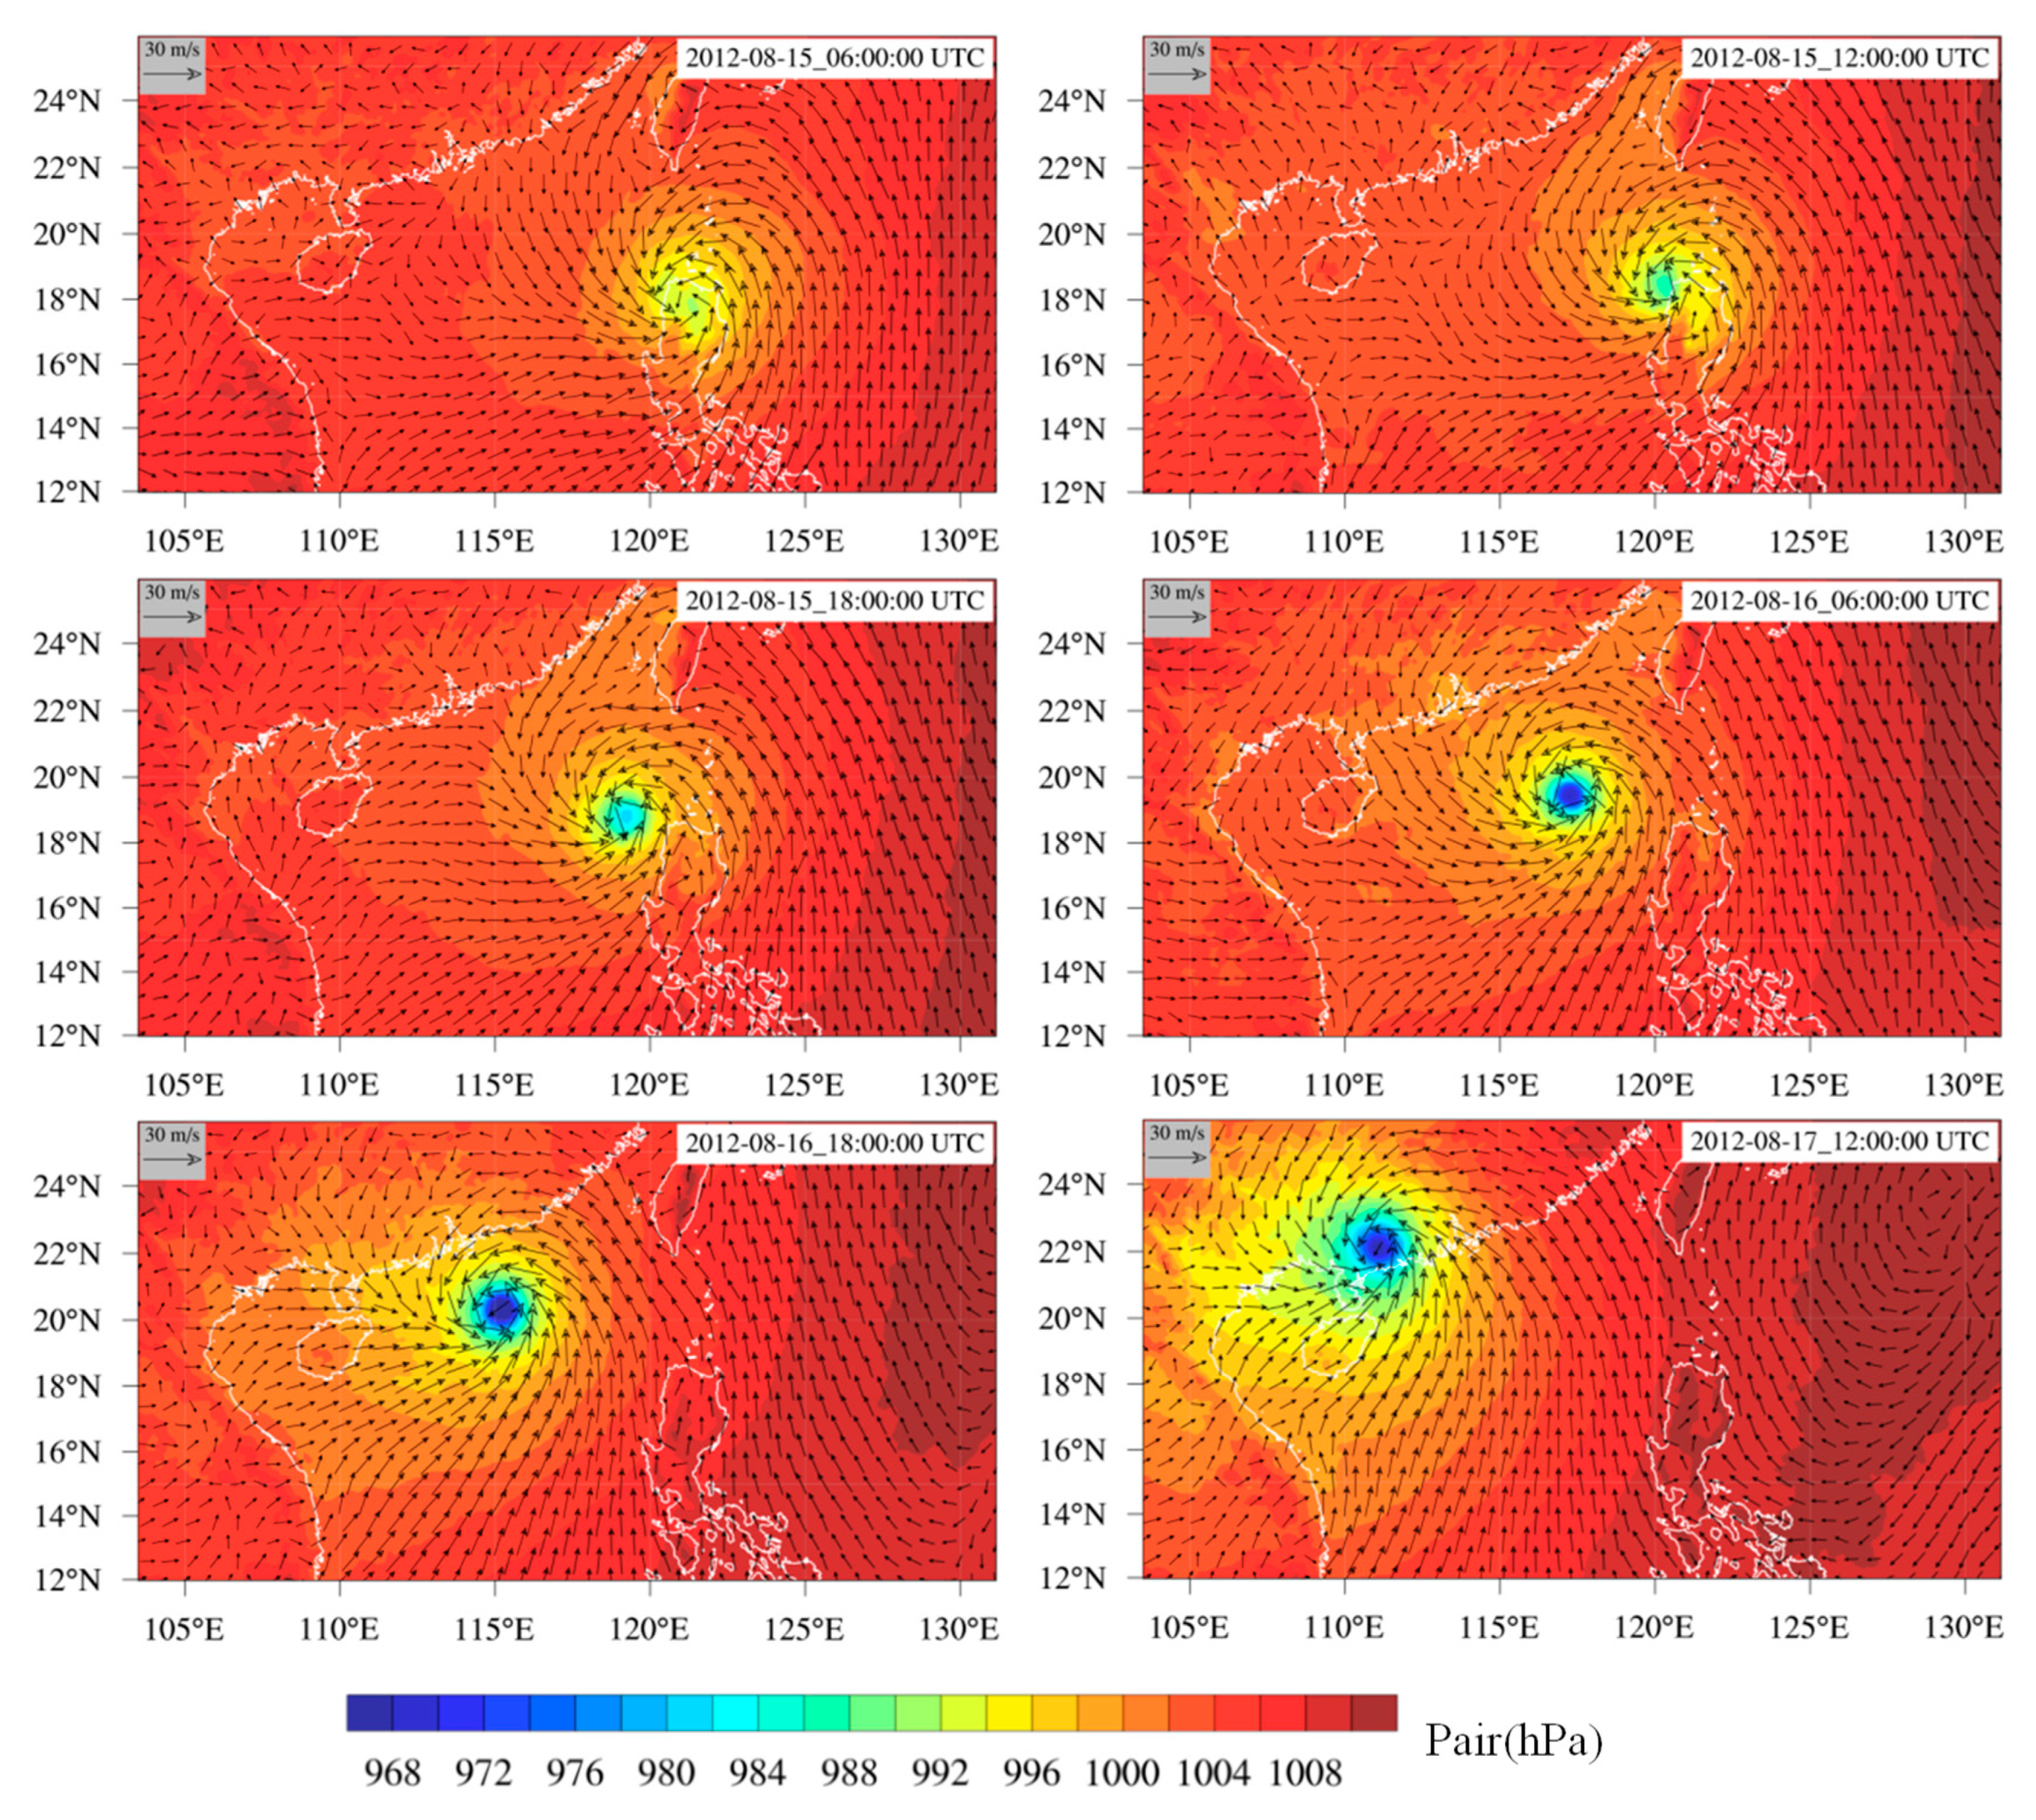
Typhoon Kai-tak (2012) formed as a tropical depression in the western Pacific on August 12, 2012, became a typhoon on August 15, and finally diminished on August 17. During that time, the storm dropped heavy precipitations between the Philippines and Vietnam.
By August 13, 2012, tropical storm Kai-tak extended the spiral arm in the northern part of the Philippines but opened a longer path to the southeast coast of China. After the torrential rains in the Philippines caused by typhoons Saola, Damrey, and Haikui, Kai-tak had the potential to cause greater damage in areas that had been hit by tropical storms and monsoon rains. After strengthening the typhoon, Kai-tak continued to travel to Chinese coastal areas on August 16, 2012. From
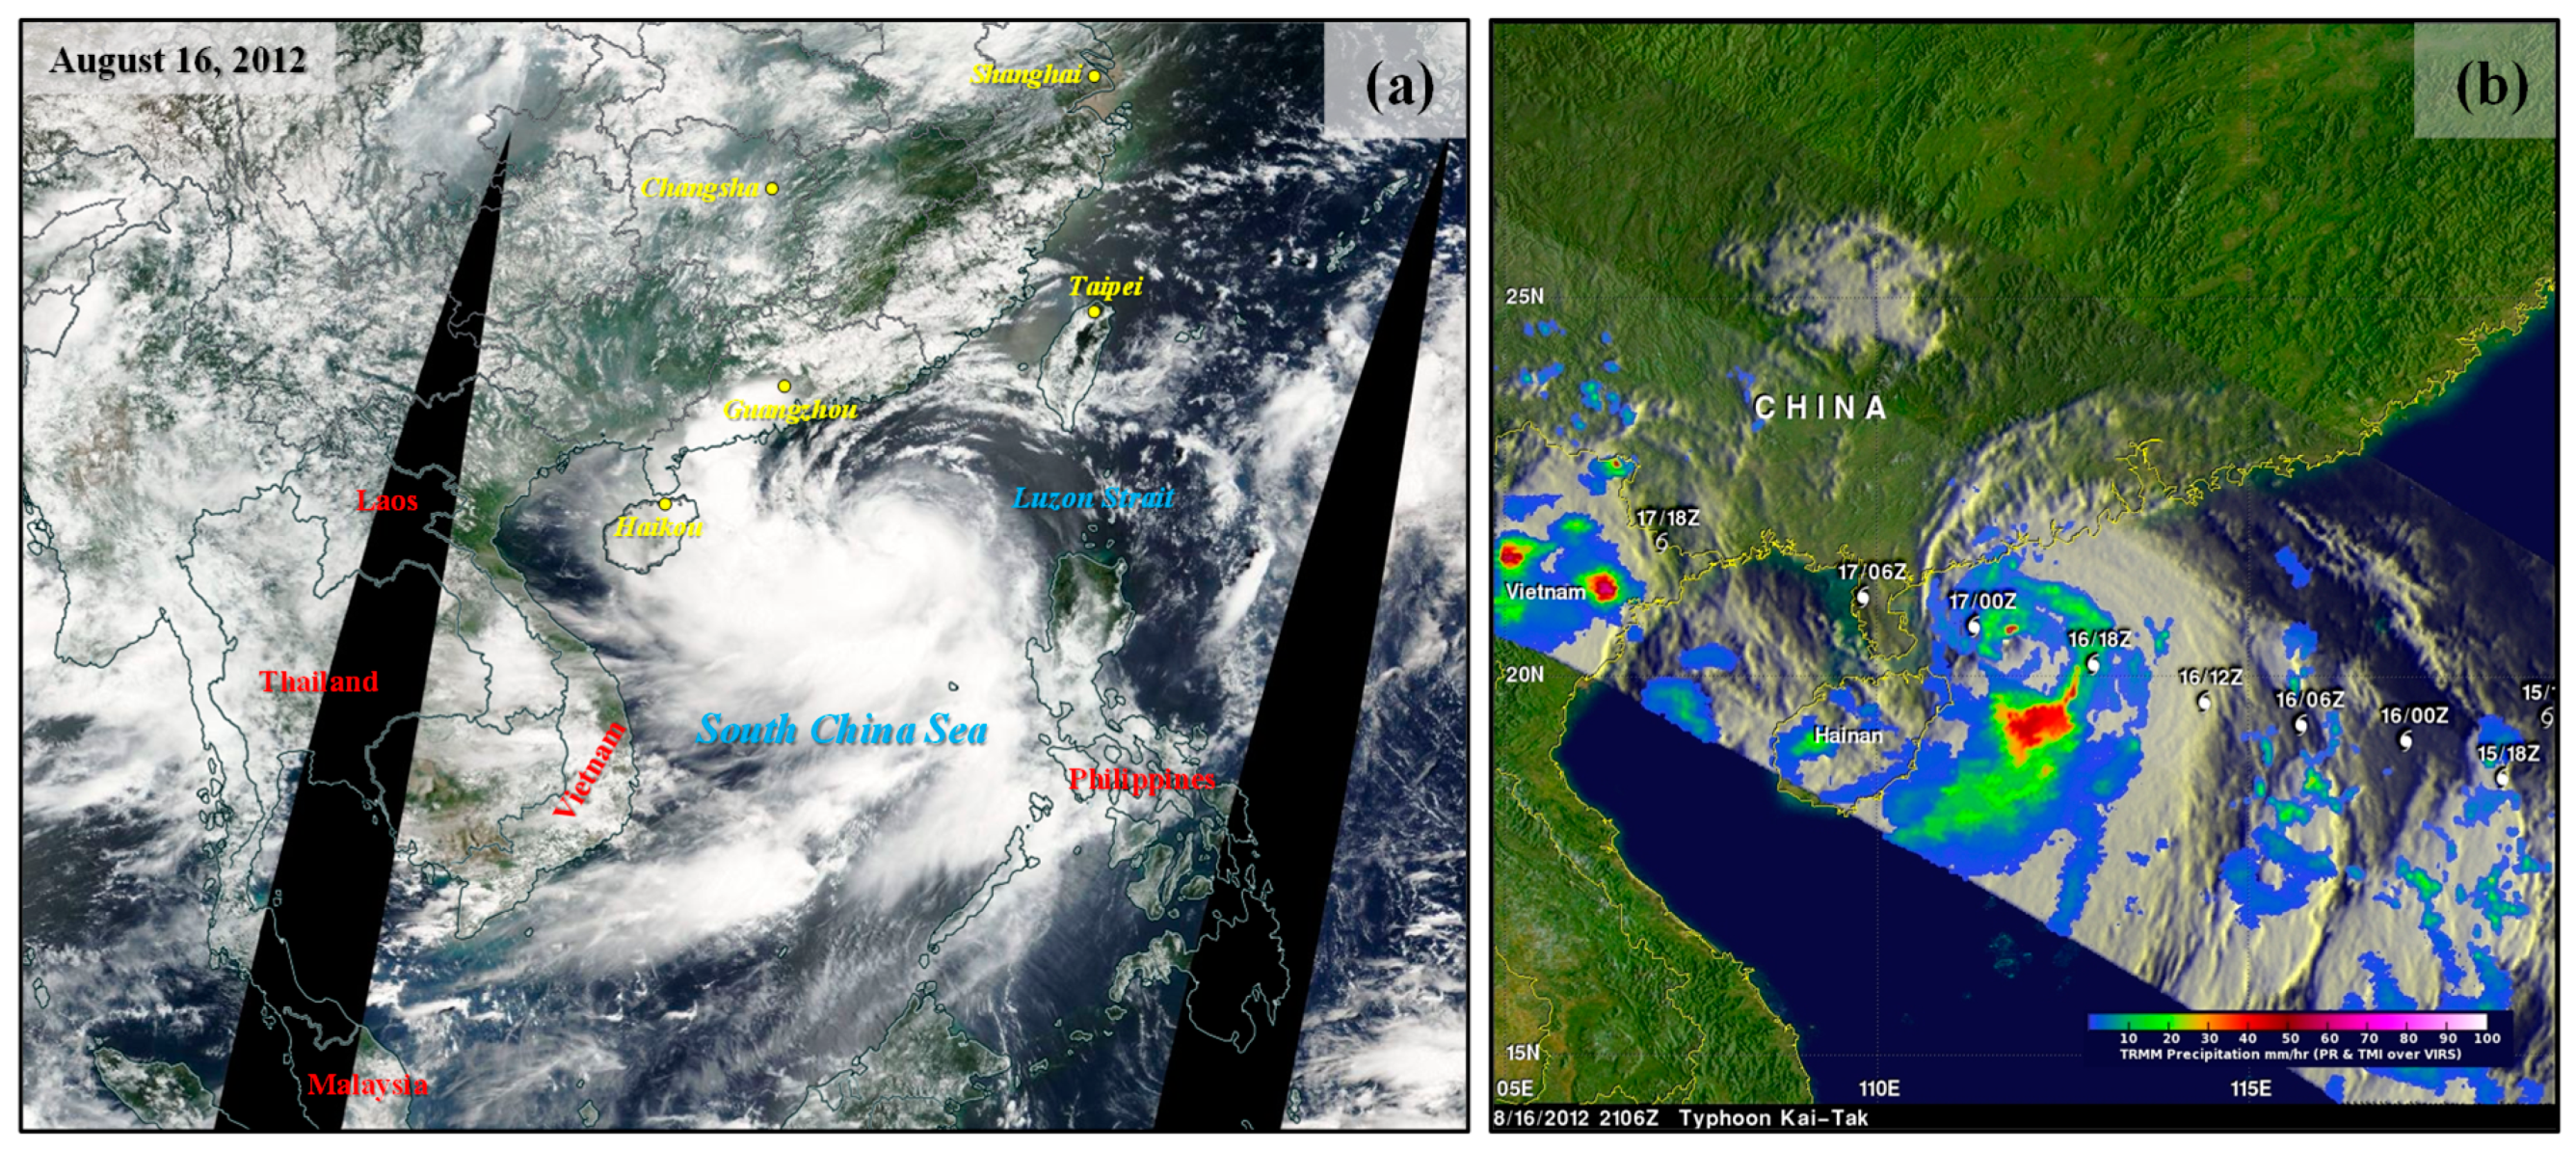
Figure 2a, it can be seen that typhoon Kai-tak lacked a clear eye but had the apostrophe shape typical of strong storms. Shortly before noon on August 17, 2012, the eye of typhoon Kai-tak was located just off the eastern shore of China’s Leizhou Bandao (Leizhou Peninsula). Storm clouds extended northward over mainland China and southward over southern Vietnam. In the two weeks after typhoons Saola, Damrey, and Haikui, Typhoon Kai-tak was the fourth storm to landfall in eastern China. The storm also followed heavy rains and deadly flooding in the Philippines.
Typhoon Kai-Tak was seen by the TRMM satellite on August 16, 2012, at 09:06 p.m. UTC when it was approaching southern China. As shown in
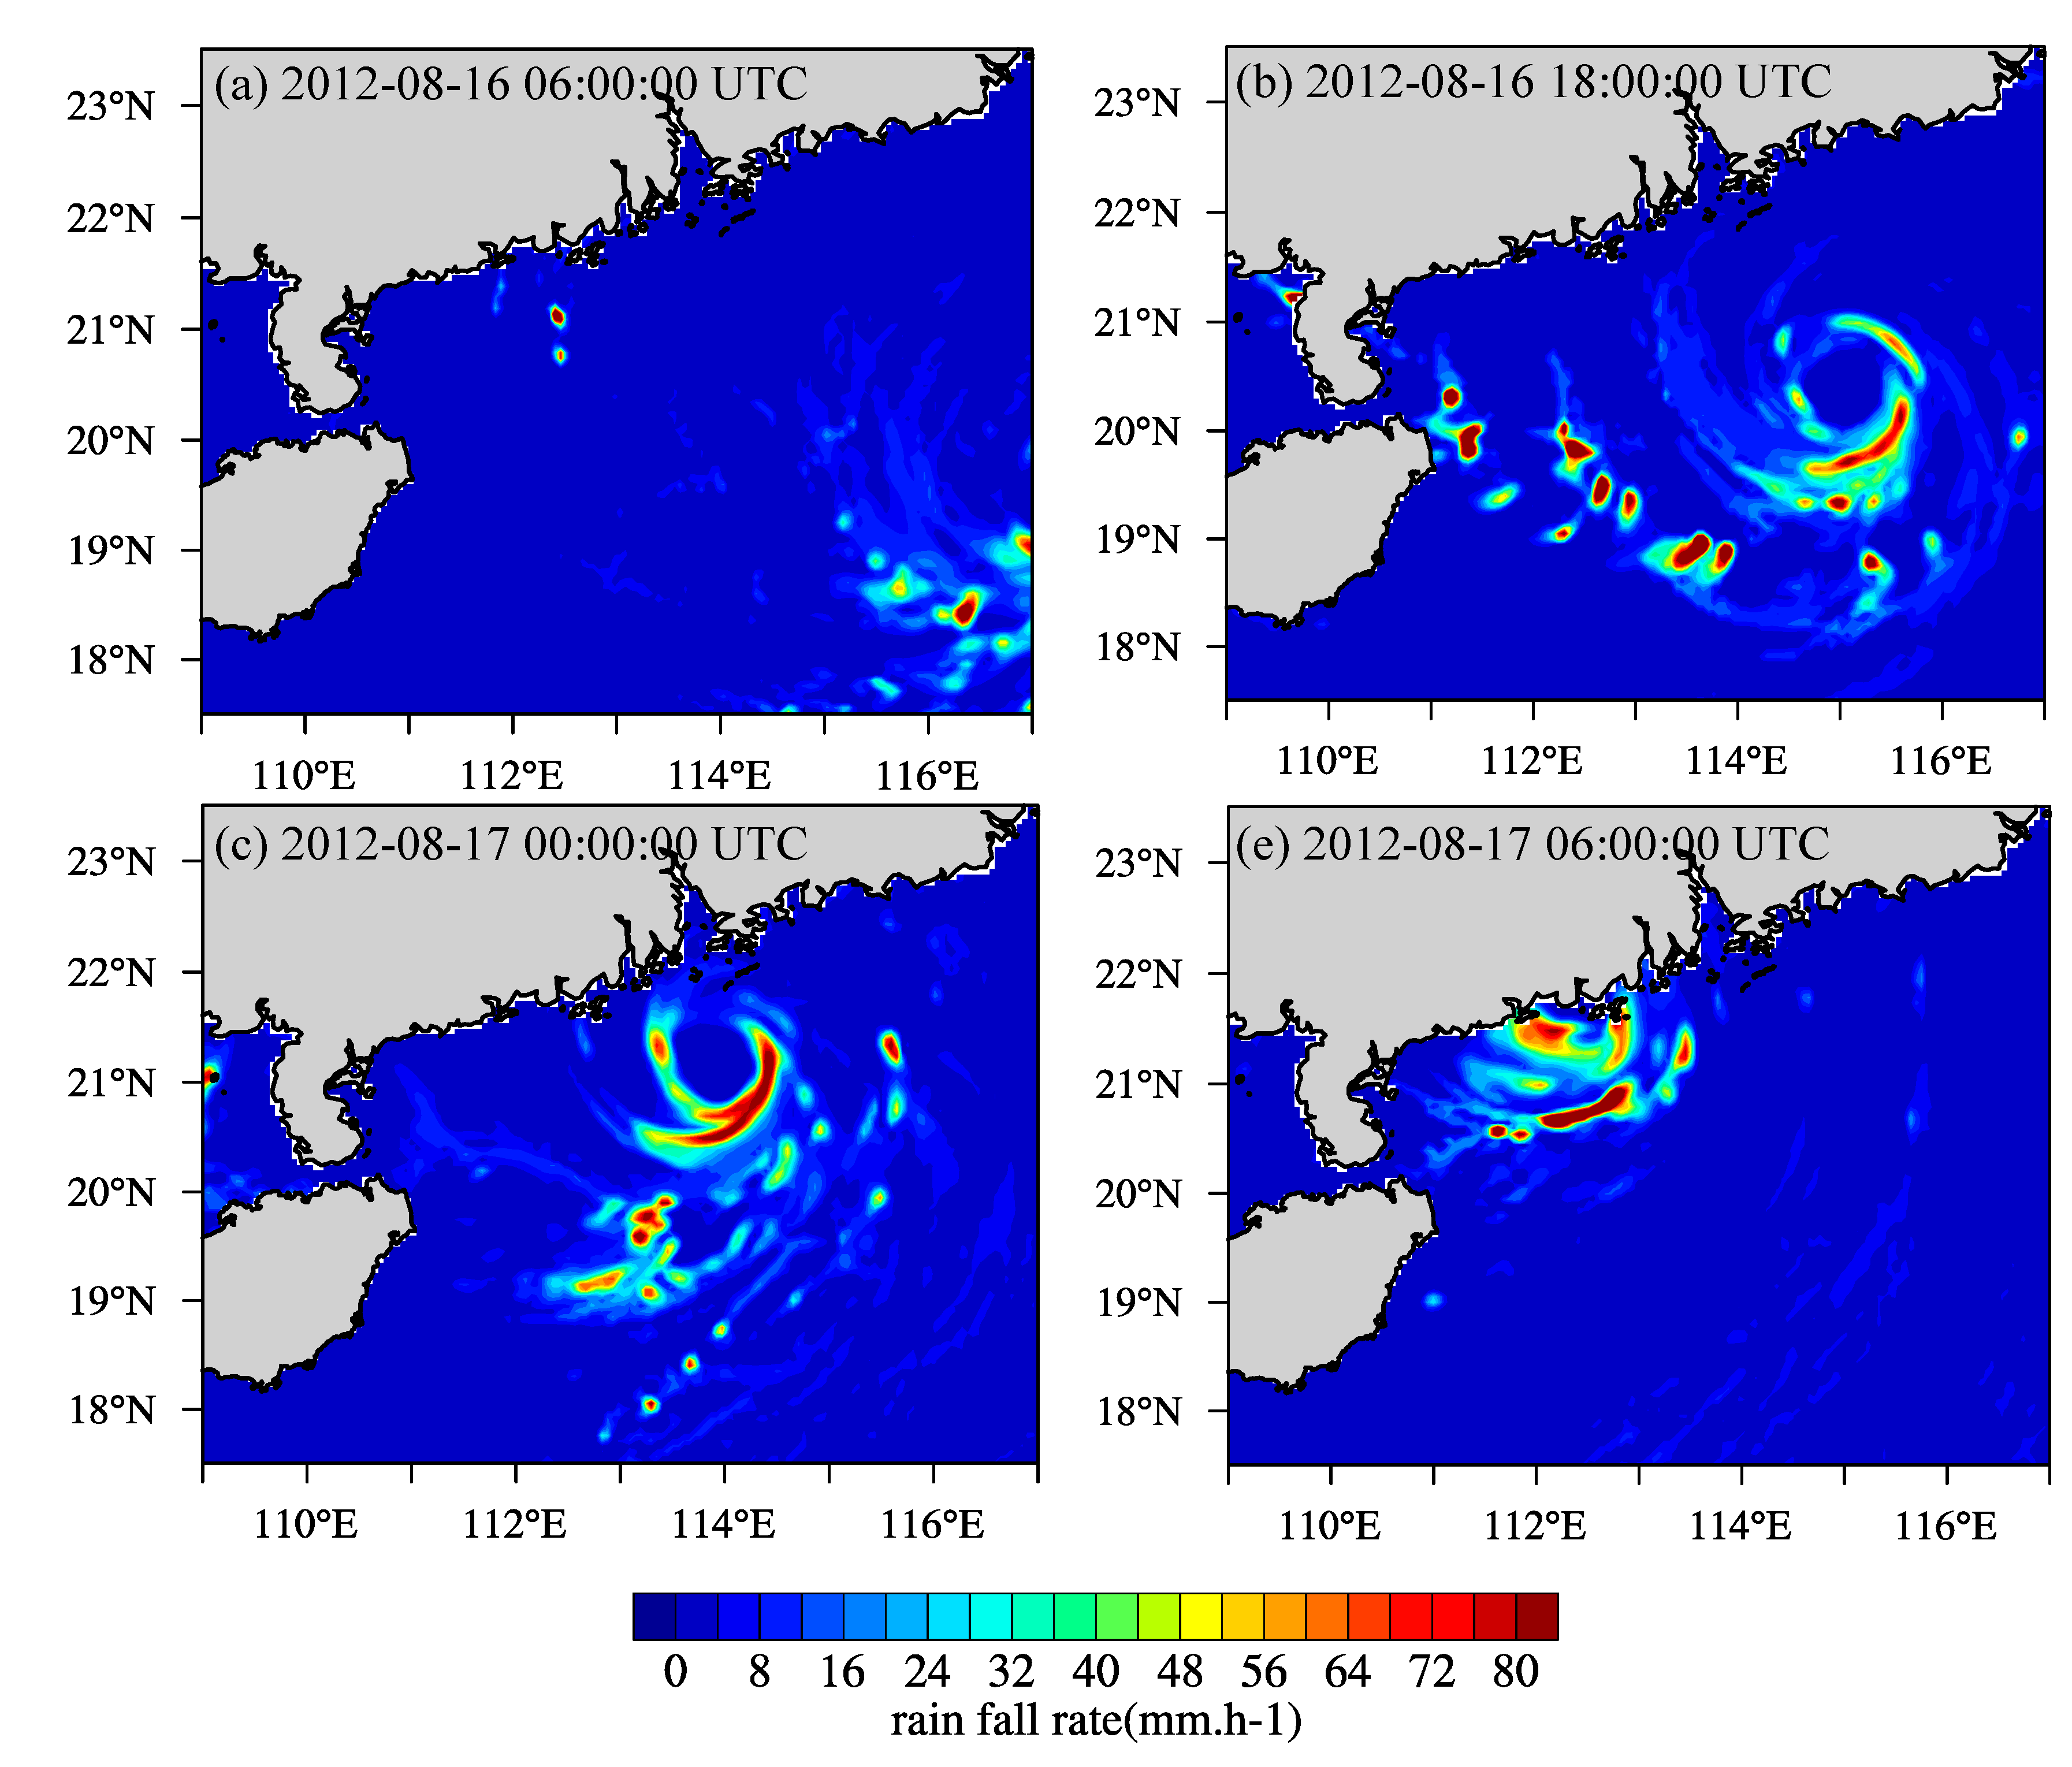
Figure 2b, TRMM’s Precipitation Radar (PR) data showed that powerful storms in the northwest side of Kai-Tak’s eye were dropping rain at a rate greater than 50 mm/h (~2 inches). TRMM’s Microwave Imager (TMI) data also showed that at that time, Kai-Tak had a large area of heavy rainfall located east of Hainan. Kai-Tak made landfall in southern China’s Guangdong province with sustained wind speeds of about 64 kts (~75 mph). Kai-Tak made landfall in mainland China on August 17 and brought heavy rainfall and gusty winds to some cities in Guangxi and southern Guangxi, crediting to SSAI/NASA Hal Pierce.
Figure 3 shows the total amount of rainfall in the area August 13–19, 2012. The most severe rainfall was over 540 mm, as shown by the dark blue color in
Figure 3. The lightest rainfall was less than 60 mm, as shown in
Figure 3 by the light green color. A small amount of rain is represented in yellow. The heaviest rainfall occurred around the Philippines, but another pocket of heavy rain also occurred over northern Vietnam. Superimposed upon the rainfall totals is a storm track for Typhoon Kai-tak, with darker shades of red-orange indicating greater storm intensity. Typhoon Kai-tak was a Category 1 typhoon from August 15 to August 17, as it traveled across the South China Sea and the Leizhou Peninsula of southeastern China.
The image is based on multi-satellite precipitation analysis data produced by NASA Goddard Space Flight Center and was estimated by combining measurements from multiple satellites and using rainfall measurements from Tropical Rainfall Measurement Mission (TRMM) satellites. Because this image is an estimate of the rainfall recorded in a very large area when the satellite was overhead, it may miss heavy rain in smaller areas or more or less heavy rainfalls in a short period of time. Therefore, the total amount of local rainfall measured from the ground may be different from the estimates shown here.
In order to fully reflect the interaction between sea and air, this paper considered the atmosphere–wave-ocean coupled model of the South China Sea, using the model-coupling toolkits (MCT) to establish a state-of-the-art coupled atmosphere–ocean-wave model (COAWST modeling system [
38,
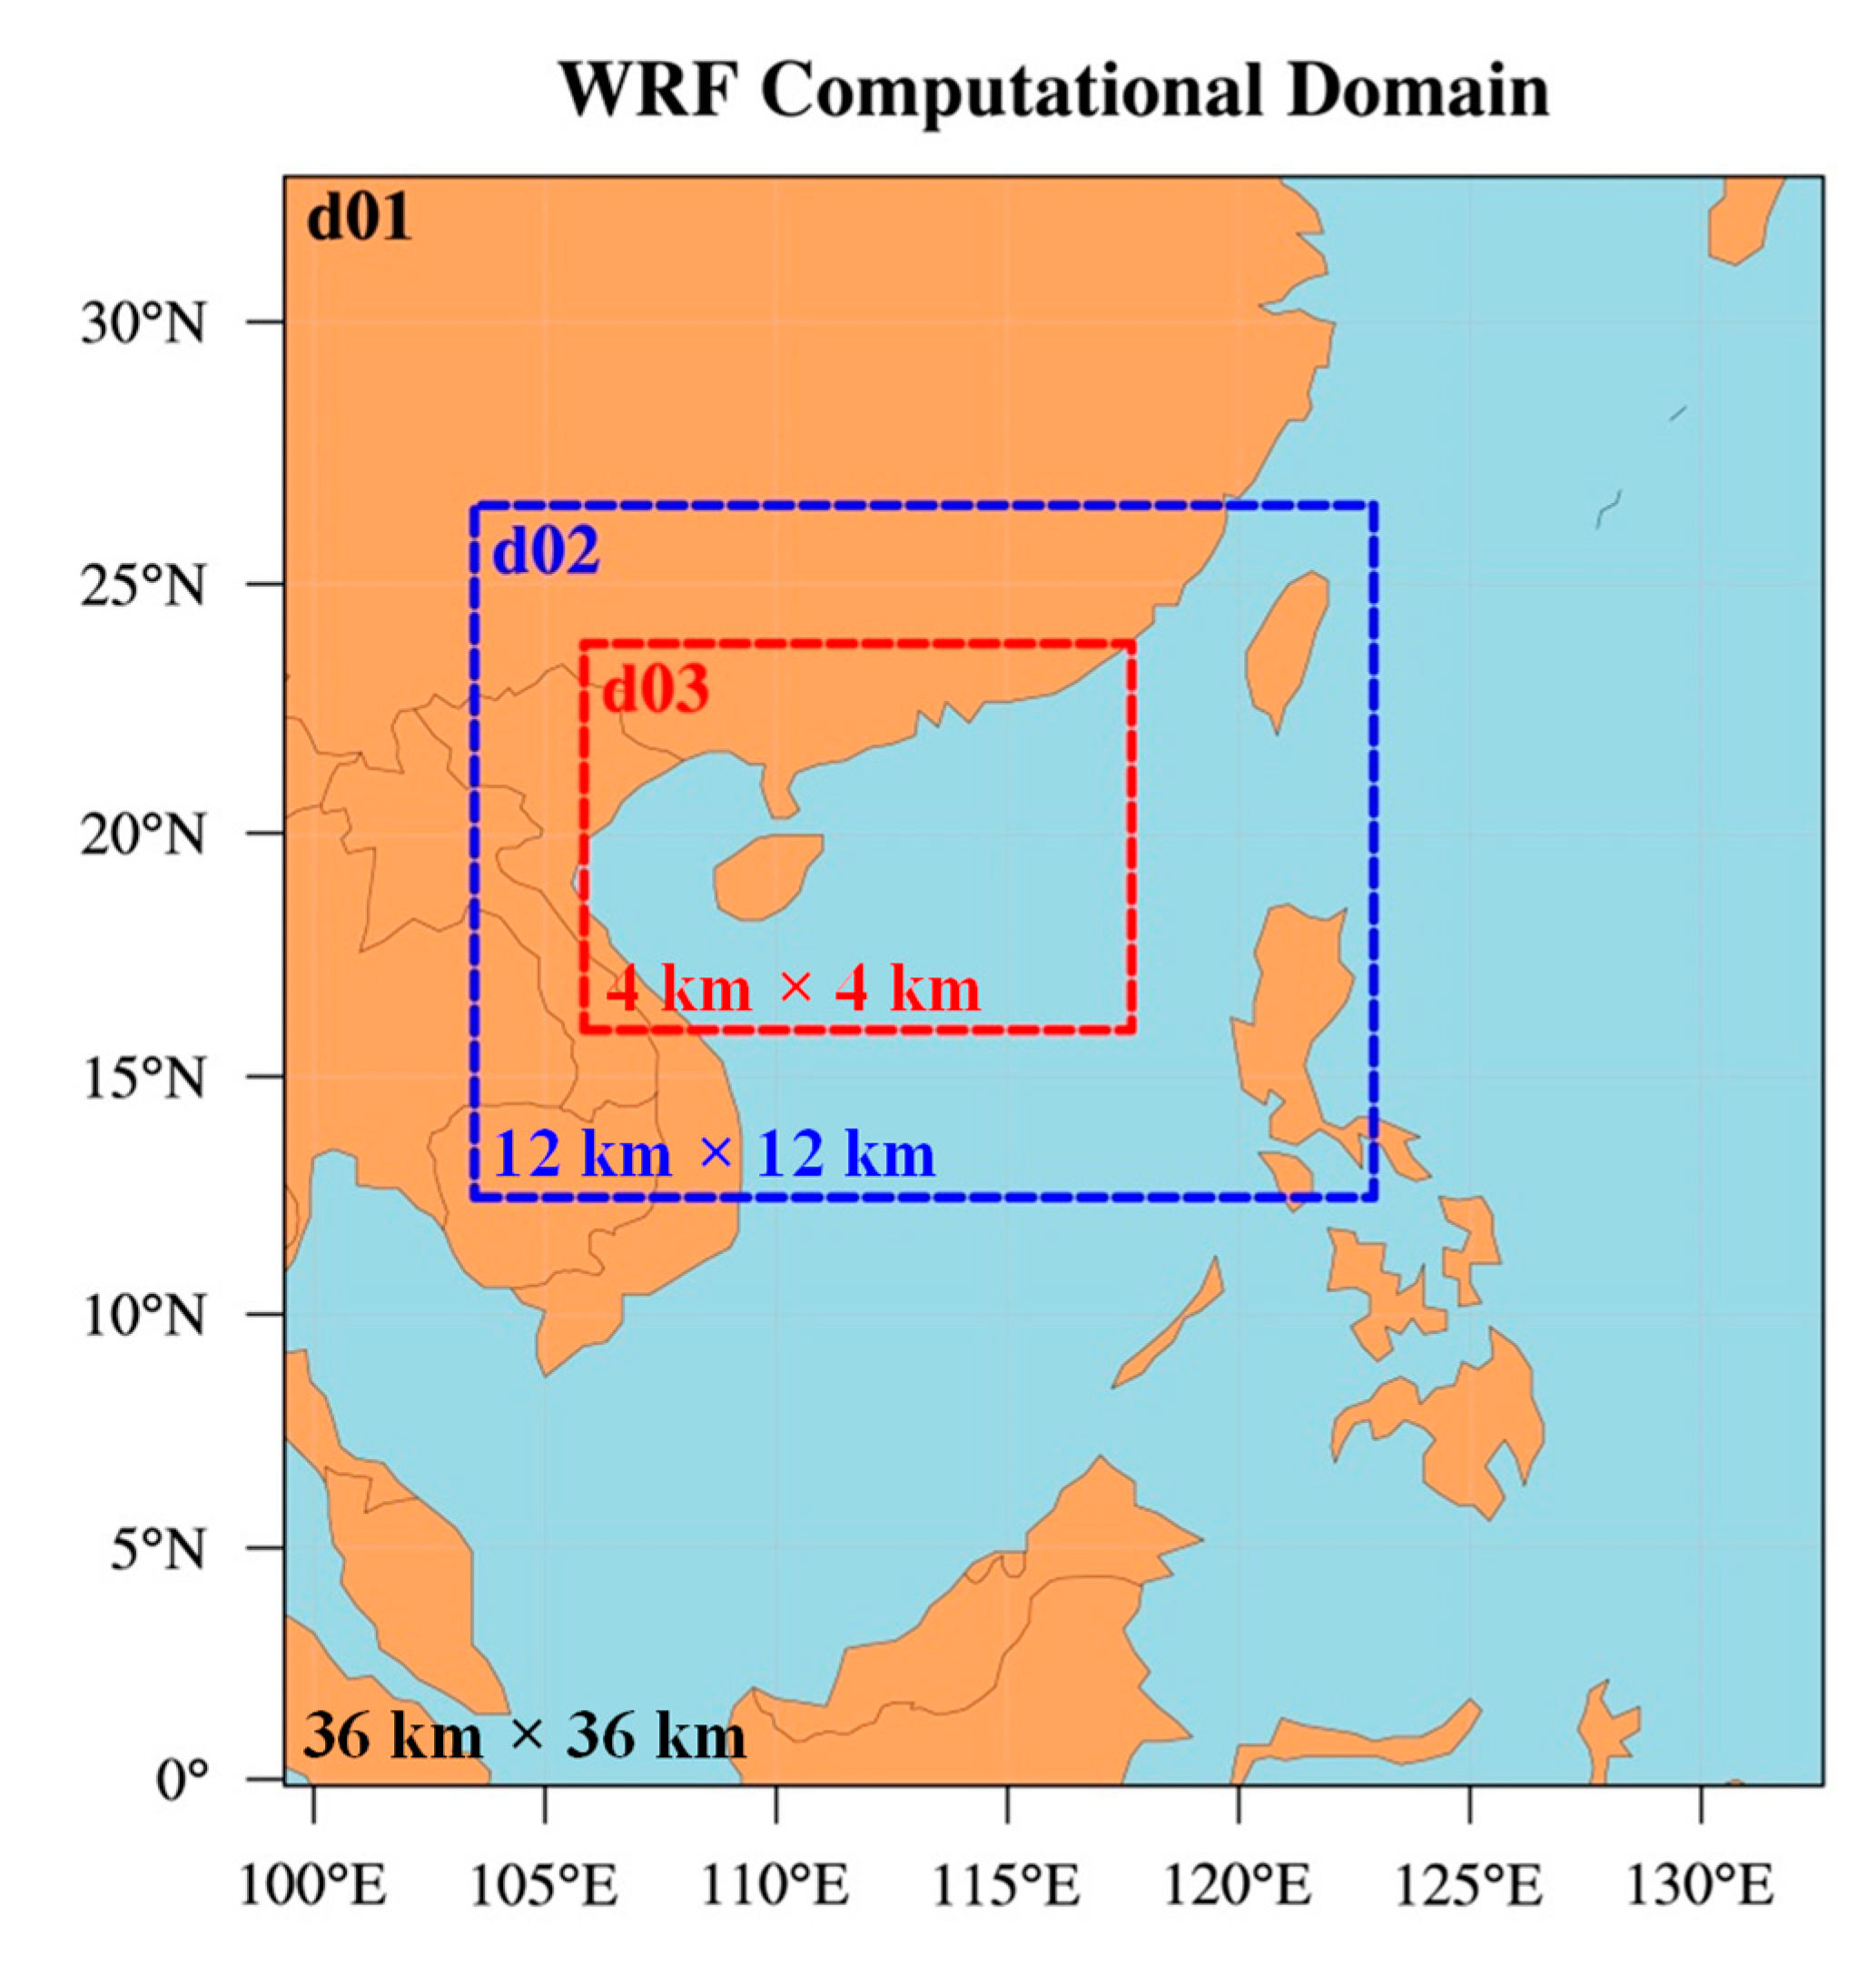
39]). The coupling model included the atmospheric model WRF (the Weather Research and Forecasting Model), the ocean wave model SWAN (a third-generation wave model), and the ocean model ROMS (Regional Ocean Modeling System). At a certain moment (MCT (the Model Coupling Toolkit) time), the three models exchanged data in real time directly in pairs. In this study, the simulation domains were the South China Sea and the near region (0° N, 102° E to 32° N, 130° E), as shown in
Figure 4. More details, including database, configurations, and verification of the model can be found in references [
22,
23].
The physical and parameterization schemes for typhoon Kai-tak in the WRF were as follows: the gird resolution in horizontal direction using a two-way nesting grid of 36 km, 12 km, and 4 km, 35 layers were taken in the vertical direction, and the maximum top pressure recommended was 2000 Pa. The WSM6 (WRF single-moment 6-class microphysics scheme) parameterization scheme and Kain–Fritsch scheme were selected for the microphysical parameterization schemes and cumulus parameterization schemes, respectively, and the YSU (Yonsei University) scheme was used for the boundary layer scheme in the WRF model. The initial conditions were provided by the Global Forecast Model (GFS, FNL (final) data) of the NCEP (National Centers for Environmental Prediction), which has a time accuracy of 6 h and a spatial accuracy of 1 degree. The d01 model (parent model) outputs the results every 180 min, and the d02 and d03 models (child model) output the results every 60 min.
The wave model SWAN and the ocean model ROMS use two-way nesting grids with 170 × 170 nodes (parent grid) and 225 × 240 nodes (child grid). The grid size ratio between parent grid and child grid is 1:3: 15 km × 15 km and 5 km × 5 km. The parent model encompasses the entire South China Sea and nearby sea regions and the child model mainly includes the central and north of the South China Sea, as shown in
Figure 1. The vertical layer of the double grid is 16 layers, and the vertical coordinate stretching parameters THETA_S = 5.0, THETA_B = 0.4, that is, the sea surface and bottom layer have improved resolution.
In the ROMS model, as shown in
Figure 1, the east, west, south, and north boundaries of the parent model were all set as open boundary. The harmonic constants for the eight mains tidal of M2, S2, N2, K2, K1, O1, P1, and Q1 were obtained from the China Seas and Indonesia 2016 scheme in OTIS. According to the mesh division of the ROMS model, the value of the open boundary point in the model was interpolated by the OSU Tidal Prediction Software (OTPS), the water level forecast value was obtained through the t_predic function, and the obtained water level was used as the open boundary of the ROMS model. The west and north boundaries of the child model were set as closed boundary, and the boundary conditions on the south and east were provided by the parent model. The water level forecast in the parent model was calculated according to the following formula:
where
is the water level,
represent the amplitude, the late angle, and the angular velocity of the
i-th component tide, respectively,
is the intersection point factor of the tidal component,
is the correction angle of the tidal point intersection, and
is the astronomical initial phase of the tidal range. The mid-bottom friction coefficient was taken as 0.0015, and the horizontal mixing coefficient was taken as 0.1 in this study.
The coupled WRF–SWAN–ROMS model simulation started on August 15, 2012 at 00:00:00 (UTC) and ended on August 18, 2012 at 06:00:00 a.m. (UTC), for a total of 78 h, including the entering processes of landing and leaving of typhoon Kai-tak in the South China Sea. The time step of the atmosphere model WRF was set to 60 s, and the timestep of the parent and child ocean model ROMS was set to 60 s and 20 s; the time step of the MCT synchronization was set to 600 s.
The simulation results of four different computational schemes (in
Table 1) were used to compare and analyze the effects of the storm surge simulation results based on different coupling models.
5. Conclusions
The basic conditions for the formation of a precipitation are the vertical movement of water vapor and low-level jets and air. The more water vapor content in the air, the greater the precipitation. Larg precipitations require a constant supply of water vapor, and tropical ocean air masses and equatorial ocean air masses are the main sources of water vapor.
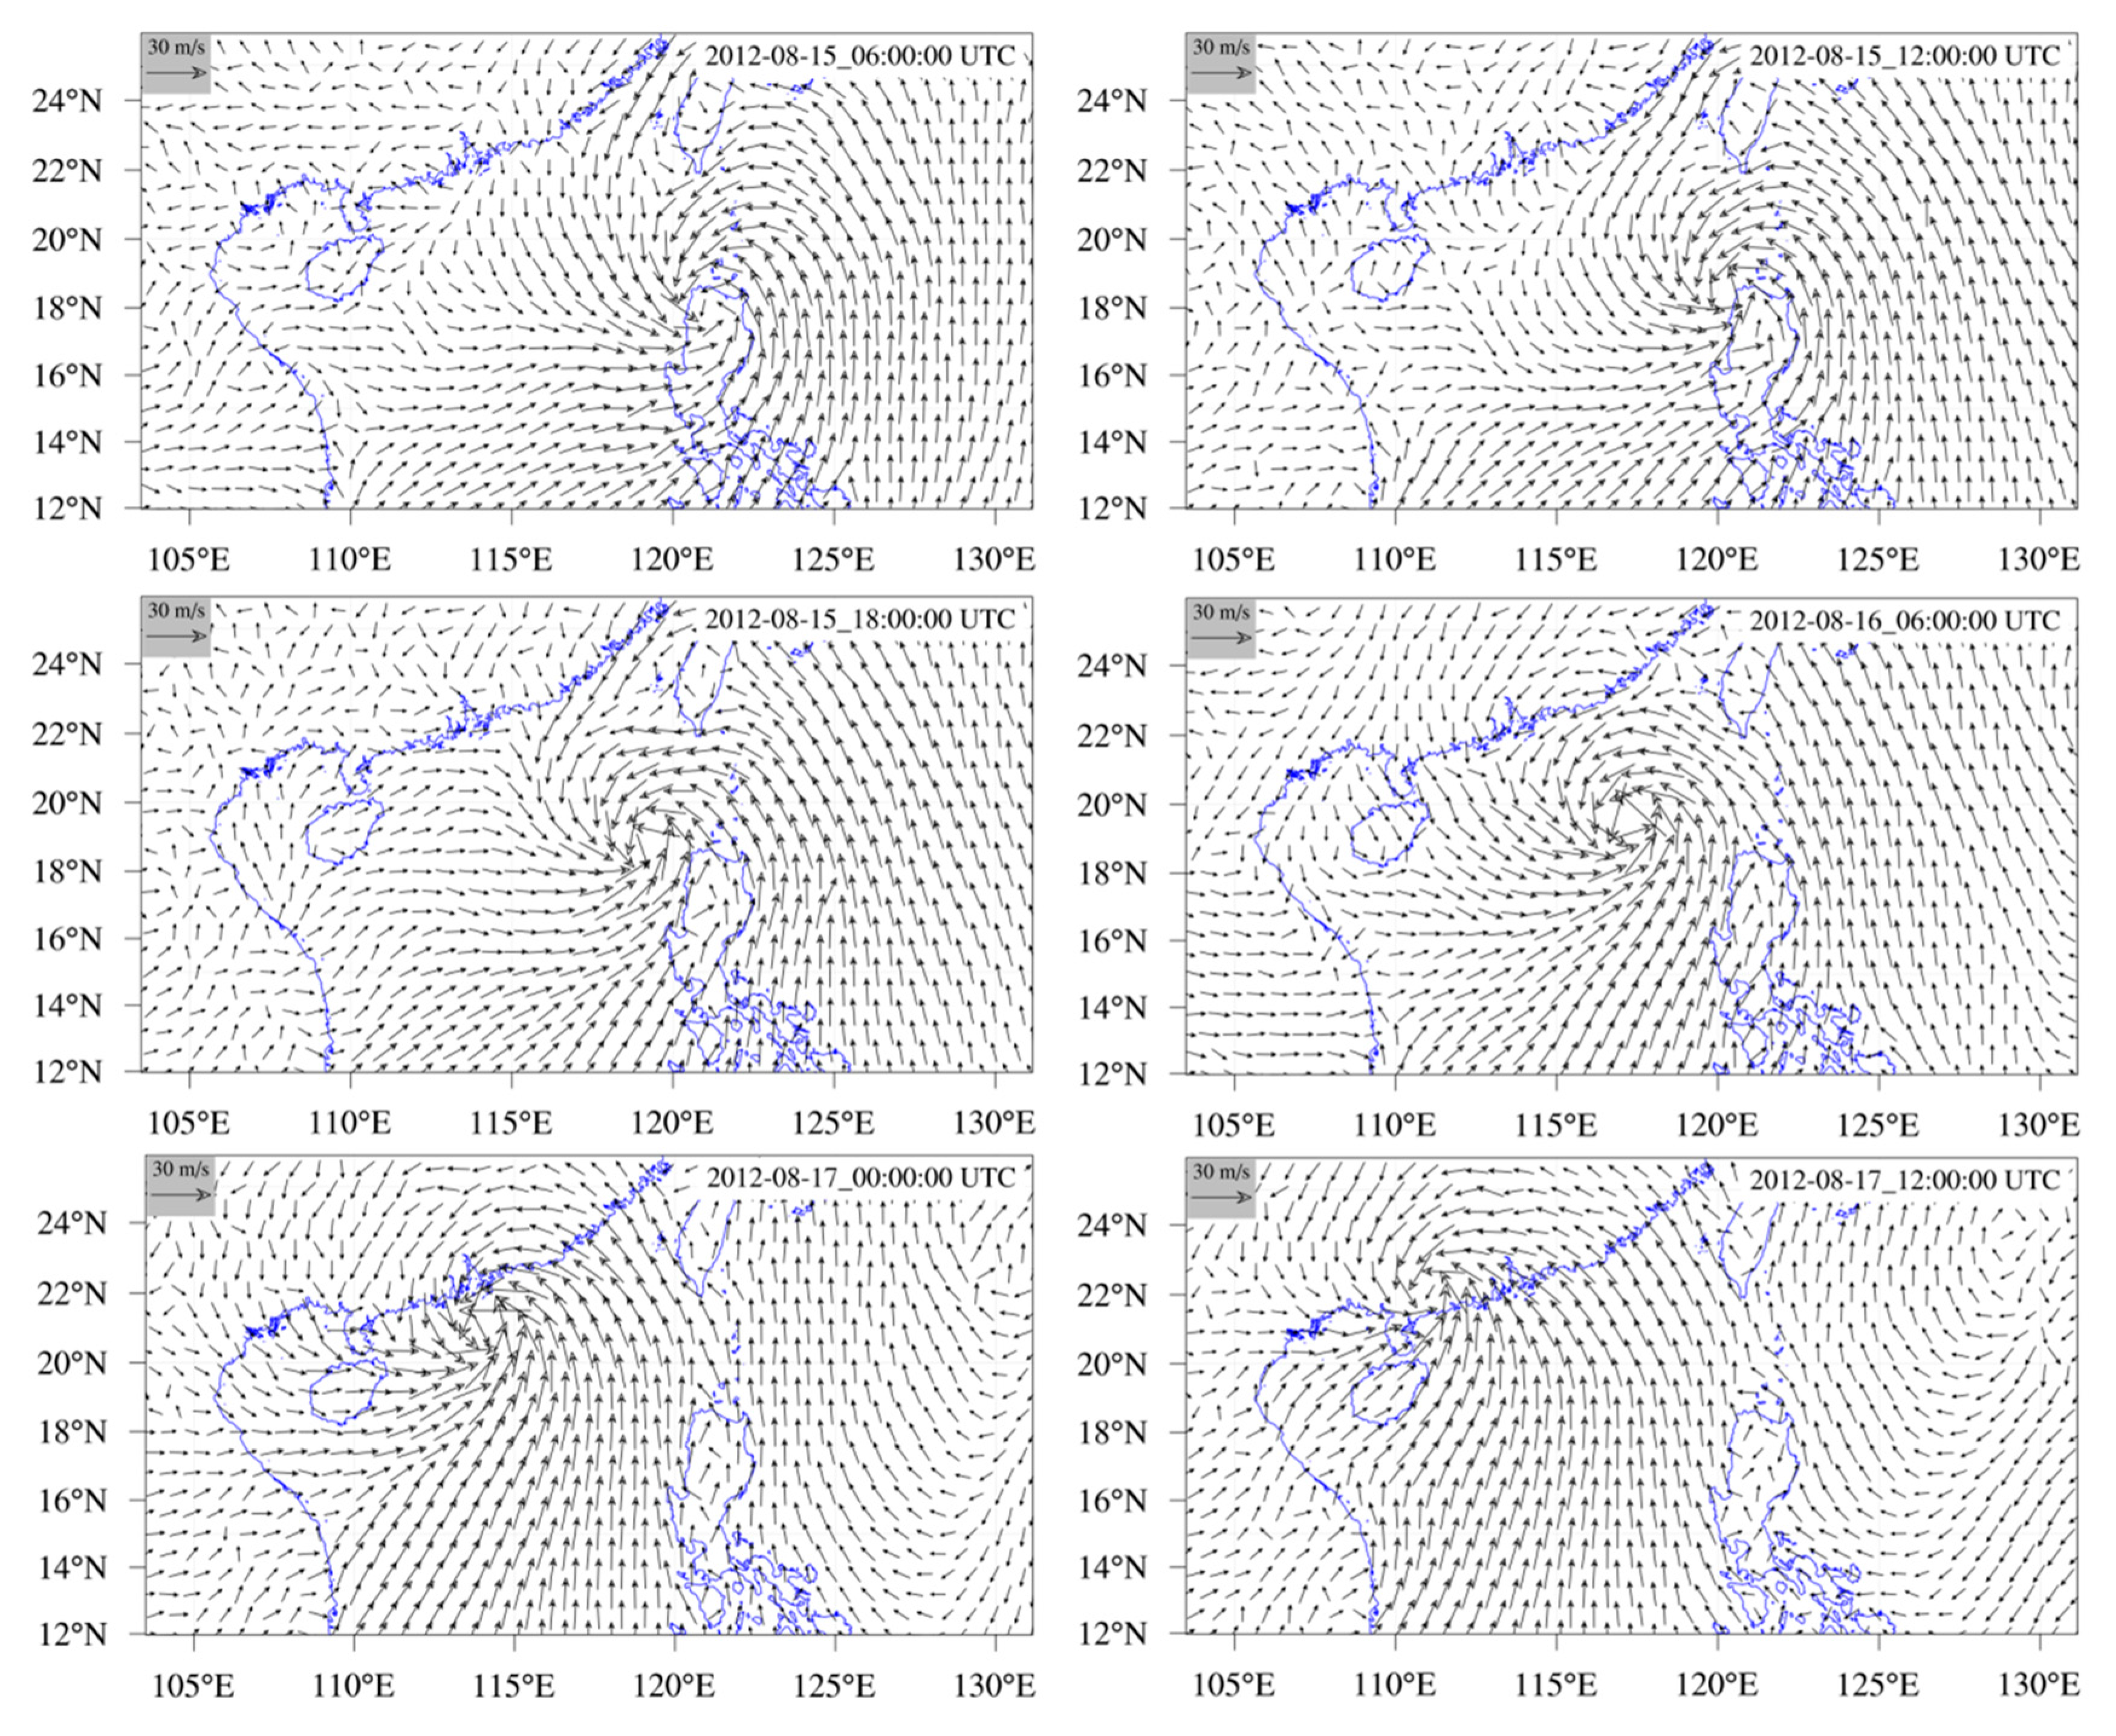
A state-of-the-art coupled atmosphere–ocean-wave model over the South China Sea was established on the basis of the COAWST modeling system. The GSHHS (Global Self-consistent, Hierarchical, High-resolution Shorelines) shoreline data and ETOPO1 depth data were used for this model. The WSM6 parameterization scheme and the Kain–Fritsch scheme were selected for the microphysical parameterization scheme and the cumulus parameterization scheme, respectively. The YSU scheme was used in the boundary layer scheme in the WRF model. The initial conditions were provided by the NCEP Global Forecast Model (GFS, FNL Data). Typhoon Kai-tak was selected to simulate a case. The typhoon wind field, pressure field, and spatial and temporal distribution of rainfall were simulated based on the coupled atmosphere–ocean-wave model.
The spatial asymmetry distribution characteristics of typhoon wind field, pressure field, and rainfall were revealed by the simulation. On the basis of the simulation results of the WRF model, the heavy rainfall caused by typhoon Kai-tak and its asymmetric distribution characteristics were analyzed. The results showed that the forcing effect of the mesoscale weather system on the vertical motion field of the typhoon Kai-tak system was the main factor, followed by the forcing effect of the large-scale weather system. Because of these factors, the tropical convergence zone was distributed east-west around 20° N and was connected to the low pressure of the Bangladesh monsoon, the southwest monsoon was in an active phase, and the monsoon jet delivered unstable energy and sufficient water vapor. These factors played an important role in the asymmetric distribution of rainfall under the influence of typhoon Kai-tak.
