Article

Mid-Century Daily Discharge Scenarios Based on Climate and Land Use Change in Ouémé River Basin at Bétérou Outlet

by
Lawin Agnidé Emmanuel
1,
Yèkambèssoun N’Tcha M’Po
1,2,*,
Chabi Angelbert Biaou
3,
Kossi Komi
4,
Rita Hounguè
1,
Kouassi Benjamin Yao
2 and
Abel Akambi Afouda
3
1
Laboratoire d’Hydrologie Appliquée, Institut National de l’Eau, Cotonou 01 BP 4521, Benin
2
Laboratoire des Procédés Industriels, de Synthèse, de l’Environnement et des Energies Nouvelles (LAPISEN), Institut National Polytechnique Félix HOUPHOUËT-BOIGNY (INP-HB), Yamoussoukro BP 1093, Cote d′Ivoire
3
Laboratoire Hydrologie et Ressources en Eau, Institut International d′Ingénierie de l′Eau et de l’Environnement, Ouagadougou 01 BP 594, Burkina Faso
4
West African Science Service Center on Climate Change and Adapted Land Use, Institut National de l′Eau, Cotonou 01 BP 4521, Benin
*
Author to whom correspondence should be addressed.
Hydrology 2018, 5(4), 69; https://doi.org/10.3390/hydrology5040069
Submission received: 6 November 2018 / Revised: 20 November 2018 / Accepted: 3 December 2018 / Published: 13 December 2018

Abstract

:
This study evaluates the impacts of land use and climate changes on daily discharge in Ouémé river basin at Bétérou outlet. Observed rainfall and temperature over 2002–2008 and land use data of 2003 and 2007 were used. Corrected rainfall and temperature data, under RCP4.5 and RCP8.5 scenarios from regional climate model REMO were considered. Two land use scenarios from RIVERTWIN project were used. The first one, Land Use A (LUA), is characterized by stronger economic development, controlled urbanization, implementation of large-scale irrigation schemes, and 3.2% population growth per year. The other one, Land Use B (LUB), is characterized by a weak national economy, uncontrolled settlement, and farmland development as well as 3.5% population growth per year. Four climate and land use combined scenarios (LUA + RCP4.5, LUA + RCP8.5; LUB + RCP4.5, and LUB + RCP8.5) were used for forcing LISFLOOD hydrological model to estimate future discharges at 2050. As a result, during calibration and validation, the LISFLOOD model showed high ability to reproduce historical flows of Ouémé River at Bétérou outlet with Nash–Sutcliffe efficiencies greater than 90%. Future discharges simulations show general increase for all land use and climate combined scenarios for all time horizons until 2050. The increase is more exacerbated under the combined scenarios using LUB than the ones using LUA. Increase of river discharge varies between 7.1% and 52% compared to the mean of the reference period 2002–2004. These findings highlight growing challenges for water resources managers and planners. Moreover, they emphasize the need to address potential climate and land use changes’ impact on water resources. Then, developing water management plans, strategies to reduce flooding risks must be considered.

1. Introduction

Managing future fresh water resources under a changing climate with vastly uncertain future atmospheric greenhouse gas emissions is an important challenge faced by human society today. One of these challenges is riverine floods management which is the second highest death-causing natural disaster worldwide [1]. Previous studies have indicated that increased exposure of people and assets, as a result of population increase and economic growth, has caused more damage due to weather-related natural disasters, including flooding [2,3]. For Africa, the number of flood-related casualties affected people and associated economic losses have significantly increased since the middle of the 1990s, due to an increase of human settlements in flood-prone areas [4]. Furthermore, the long-term observational records and climate projections provide abundant evidence that freshwater resources are vulnerable and have the potential to be strongly impacted by climate change, with wide-ranging consequences for human societies and ecosystems [5]. These consequences are more severe in regions dominated by an arid and semiarid climate such as West Africa [6]. The high vulnerability of West Africa is not only the effects of global environmental changes on the water cycle, but also the high population growth and its high exposure and low adaptive capacity.
With an annual freshwater availability of 4000 m3 per capita, Benin is far beyond the water stress threshold of about 1700 m3 [7]. Nevertheless, Giertz et al.’s [8] investigations show that water scarcity occurs at the local scale at the end of the dry season [8]. Furthermore a significant decrease in water availability (surface water and groundwater) due to a decrease in rainfall and significant increase in evapotranspiration was showed by [7]. According to previous simulations based on IPCC scenario B2, Giertz et al. [8] estimated a decrease of renewable water resources of about 55% for 2025 compared to the period 1993–2003 in Ouémé basin at Bétérou. Bossa et al. [9], combining climate and land use change, showed an increase of the annual surface runoff of about 6% to 42% under four climate and land use/cover combined scenarios for 2029 compared to the period 2000–2009 for Ouémé basin at Bonou. Hounkpè [10] analyzed effects of land use change on flood regime in one of the tributaries of Ouémé basin. He showed that the magnitude of flood event would increase for most return periods with greatest changes for low return periods.
Even though important efforts have been made to study renewable water resources under climate and land use changes, daily discharge trend analysis remains a challenge. The river discharges are the most important components of hydrological cycle for water planning and management in Bétérou basin. Indeed, due to financial and technological constraints which hinder a satisfactory development, and exploration of groundwater and reservoir resources in Ouémé basin, river water is the most accessible water for many uses such as irrigation, livestock watering, and washing. In addition, daily discharges are the most important parameters for flood predictions. But, all the studies mentioned above about the Ouémé watershed in general, have often evaluated the impact of global change on total annual runoff based on old scenarios A1B, B1, and B2 of the Intergovernmental Panel on Climate Change (IPCC) detailed in the Special Report on Emission Scenarios (SRES). Thus, more investigations are needed to assess the impact of climate and land use/cover changes on flow regime in the Ouémé basin at Bétérou using new IPCC climate scenarios (RCP4.5 and RCP8.5) combined with land use change scenarios. This study area is a site of NAPA (National Adaptation Program to climate change) and more investigations would help the climate adaption programs makers to better design adaption strategies. In order to fill this gap, this study assesses the impacts of climate and land use changes on daily discharge in Ouémé river basin at Bétérou outlet. The corrected data under RCP4.5 and RCP8.5 scenarios from regional climate model REMO and land use scenarios from RIVERTWIN project were used as input of the hydrological model LISFLOOD to assess discharge scenarios.
The study is structured as follows: data and methods are described in Section 2; the results and discussion are presented in Section 3; and Section 4 summarized the study findings.

2. Materials and Methods
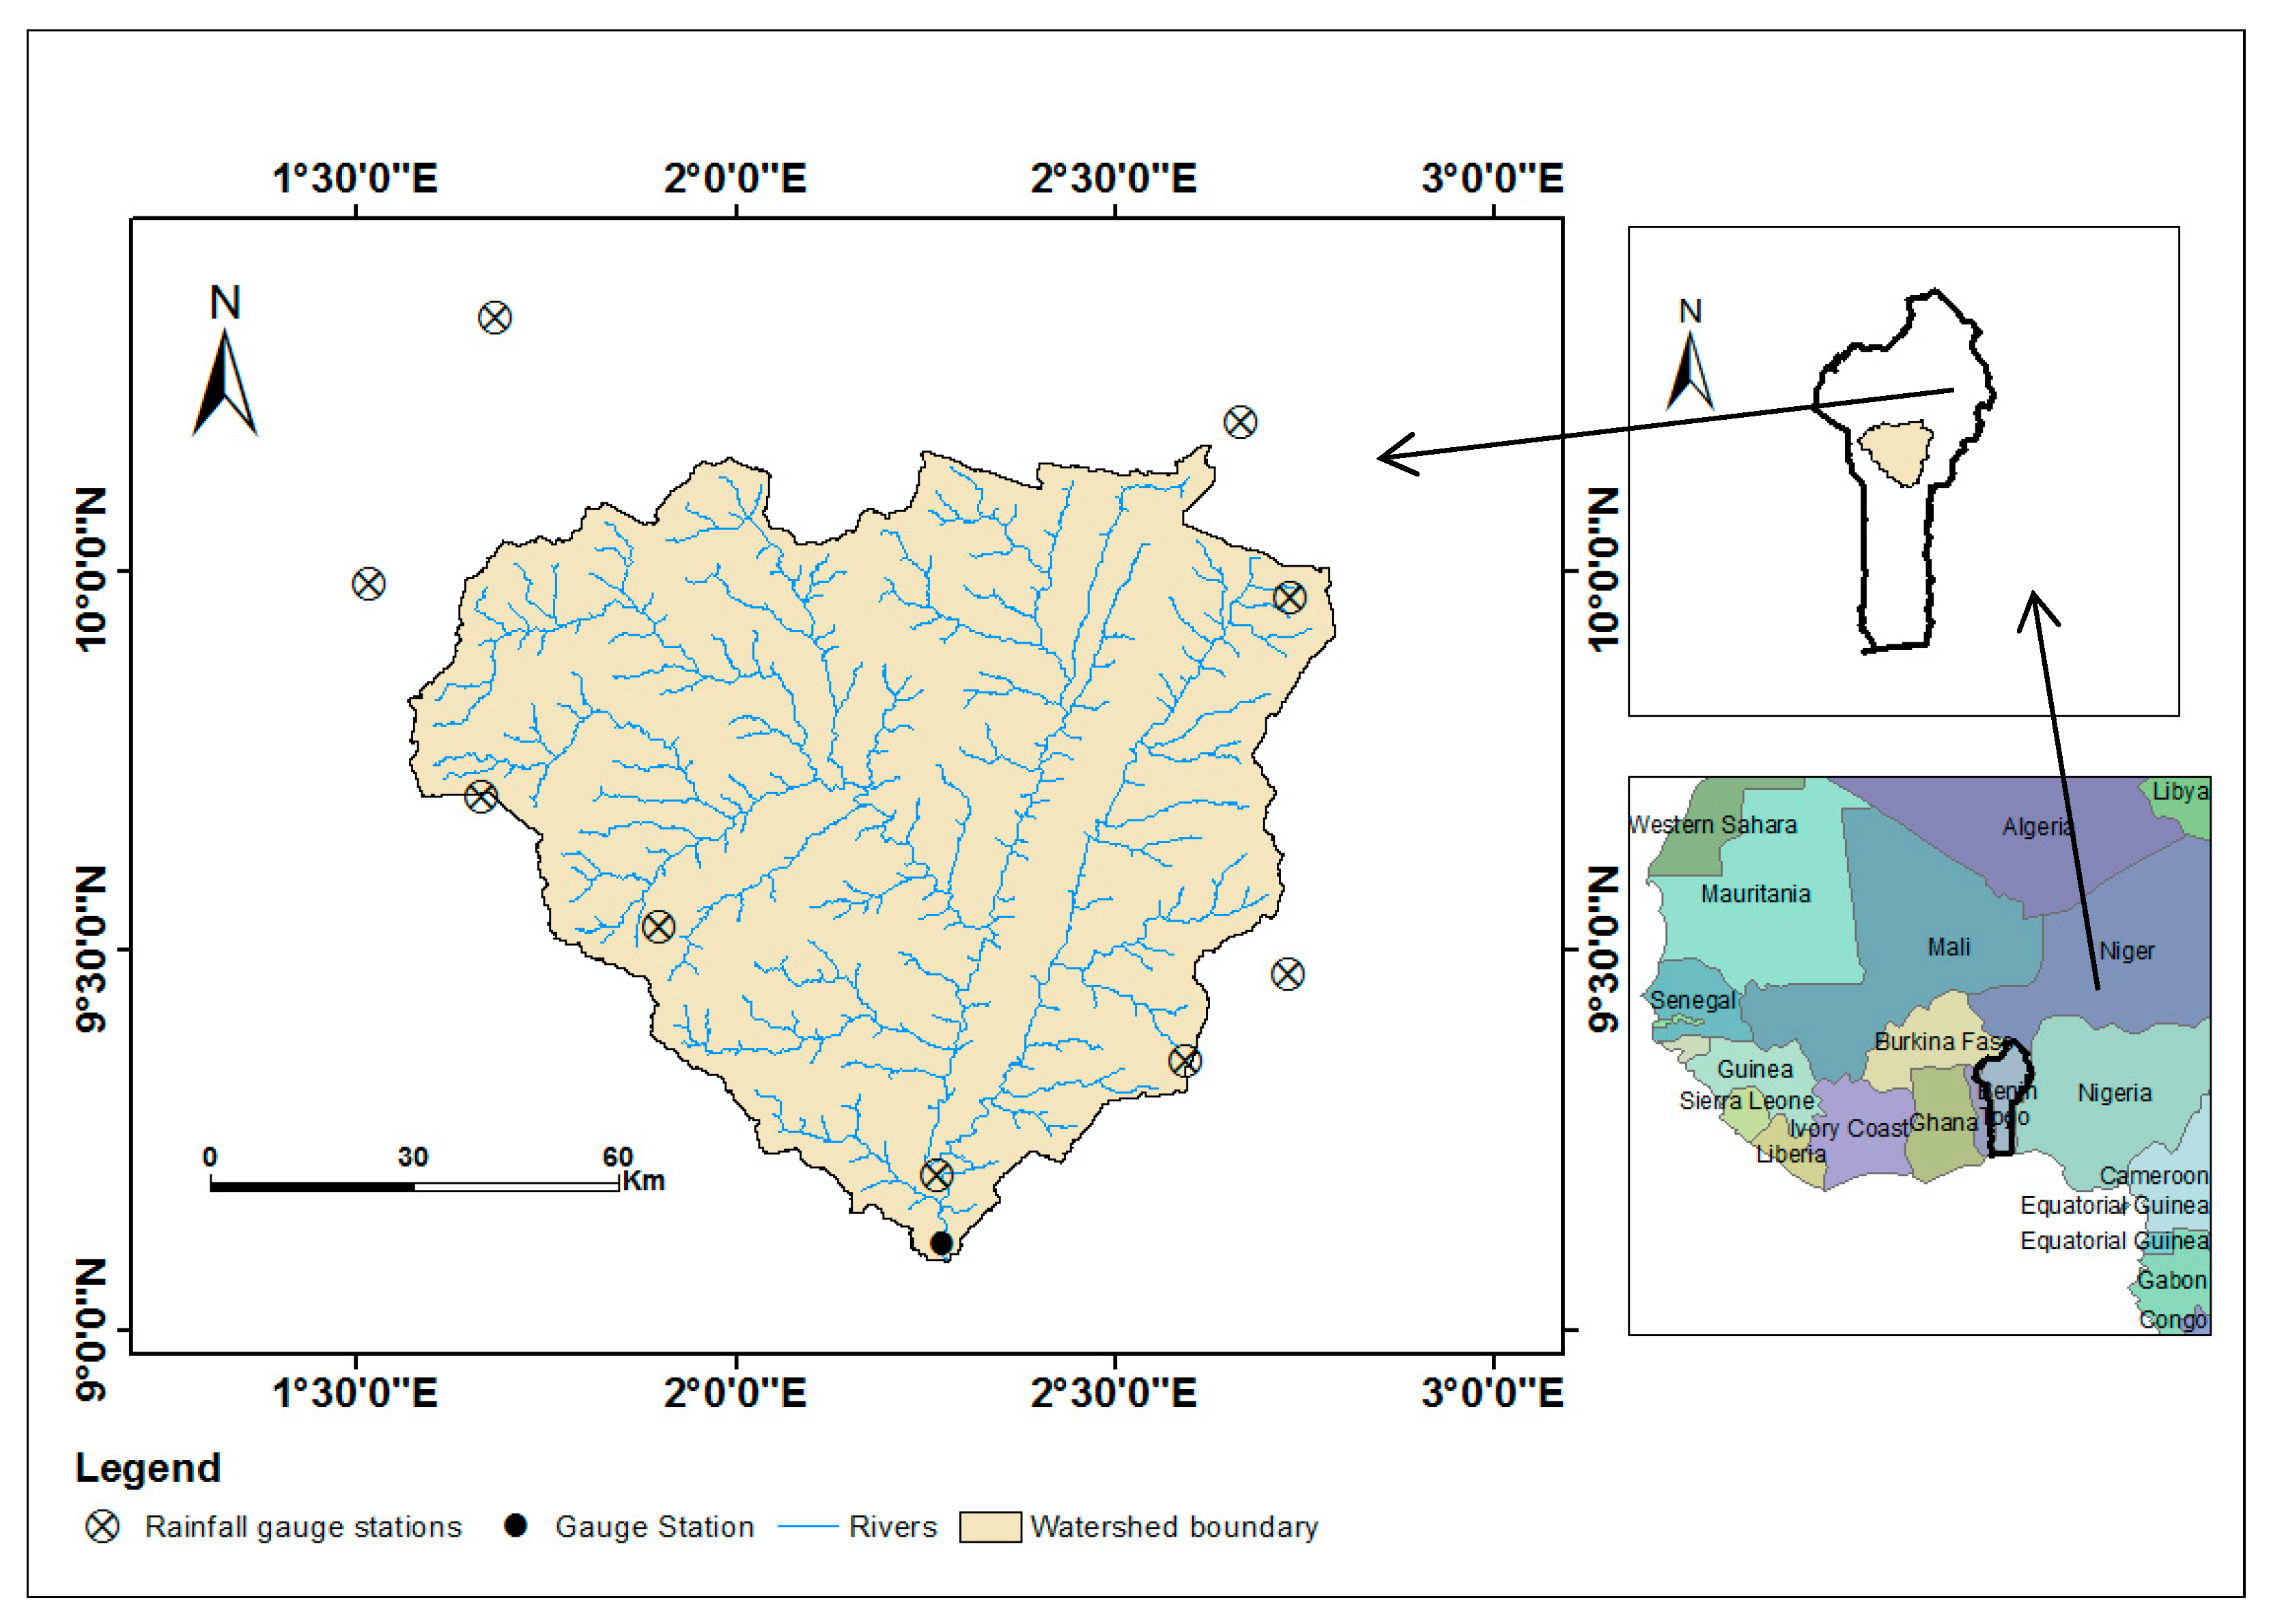
2.1. Study Area

The present study focuses on Ouémé river basin at the outlet of Bétérou (Figure 1). This basin is located between the latitudes 9°12′ North to 10°12′ North and longitudes 1°30′ East to 3° East and covers an area of 10,076 km2. Rainfall is characterized by two seasons: a dry season from November to March and a rainy season from April to October with the peak of rainfall in August. The annual rainfall average is 1200 mm/year from 1960 to 2015. The basin hydrographic network is dense (Figure 1) but many of the rivers have a seasonal flow. Average discharge of the main watercourse of this basin is approximately 50 m3/s at Bétérou hydrometric station from 1960 to 2015.

2.2. Data

This sub-section presents the data used in this study and their sources.

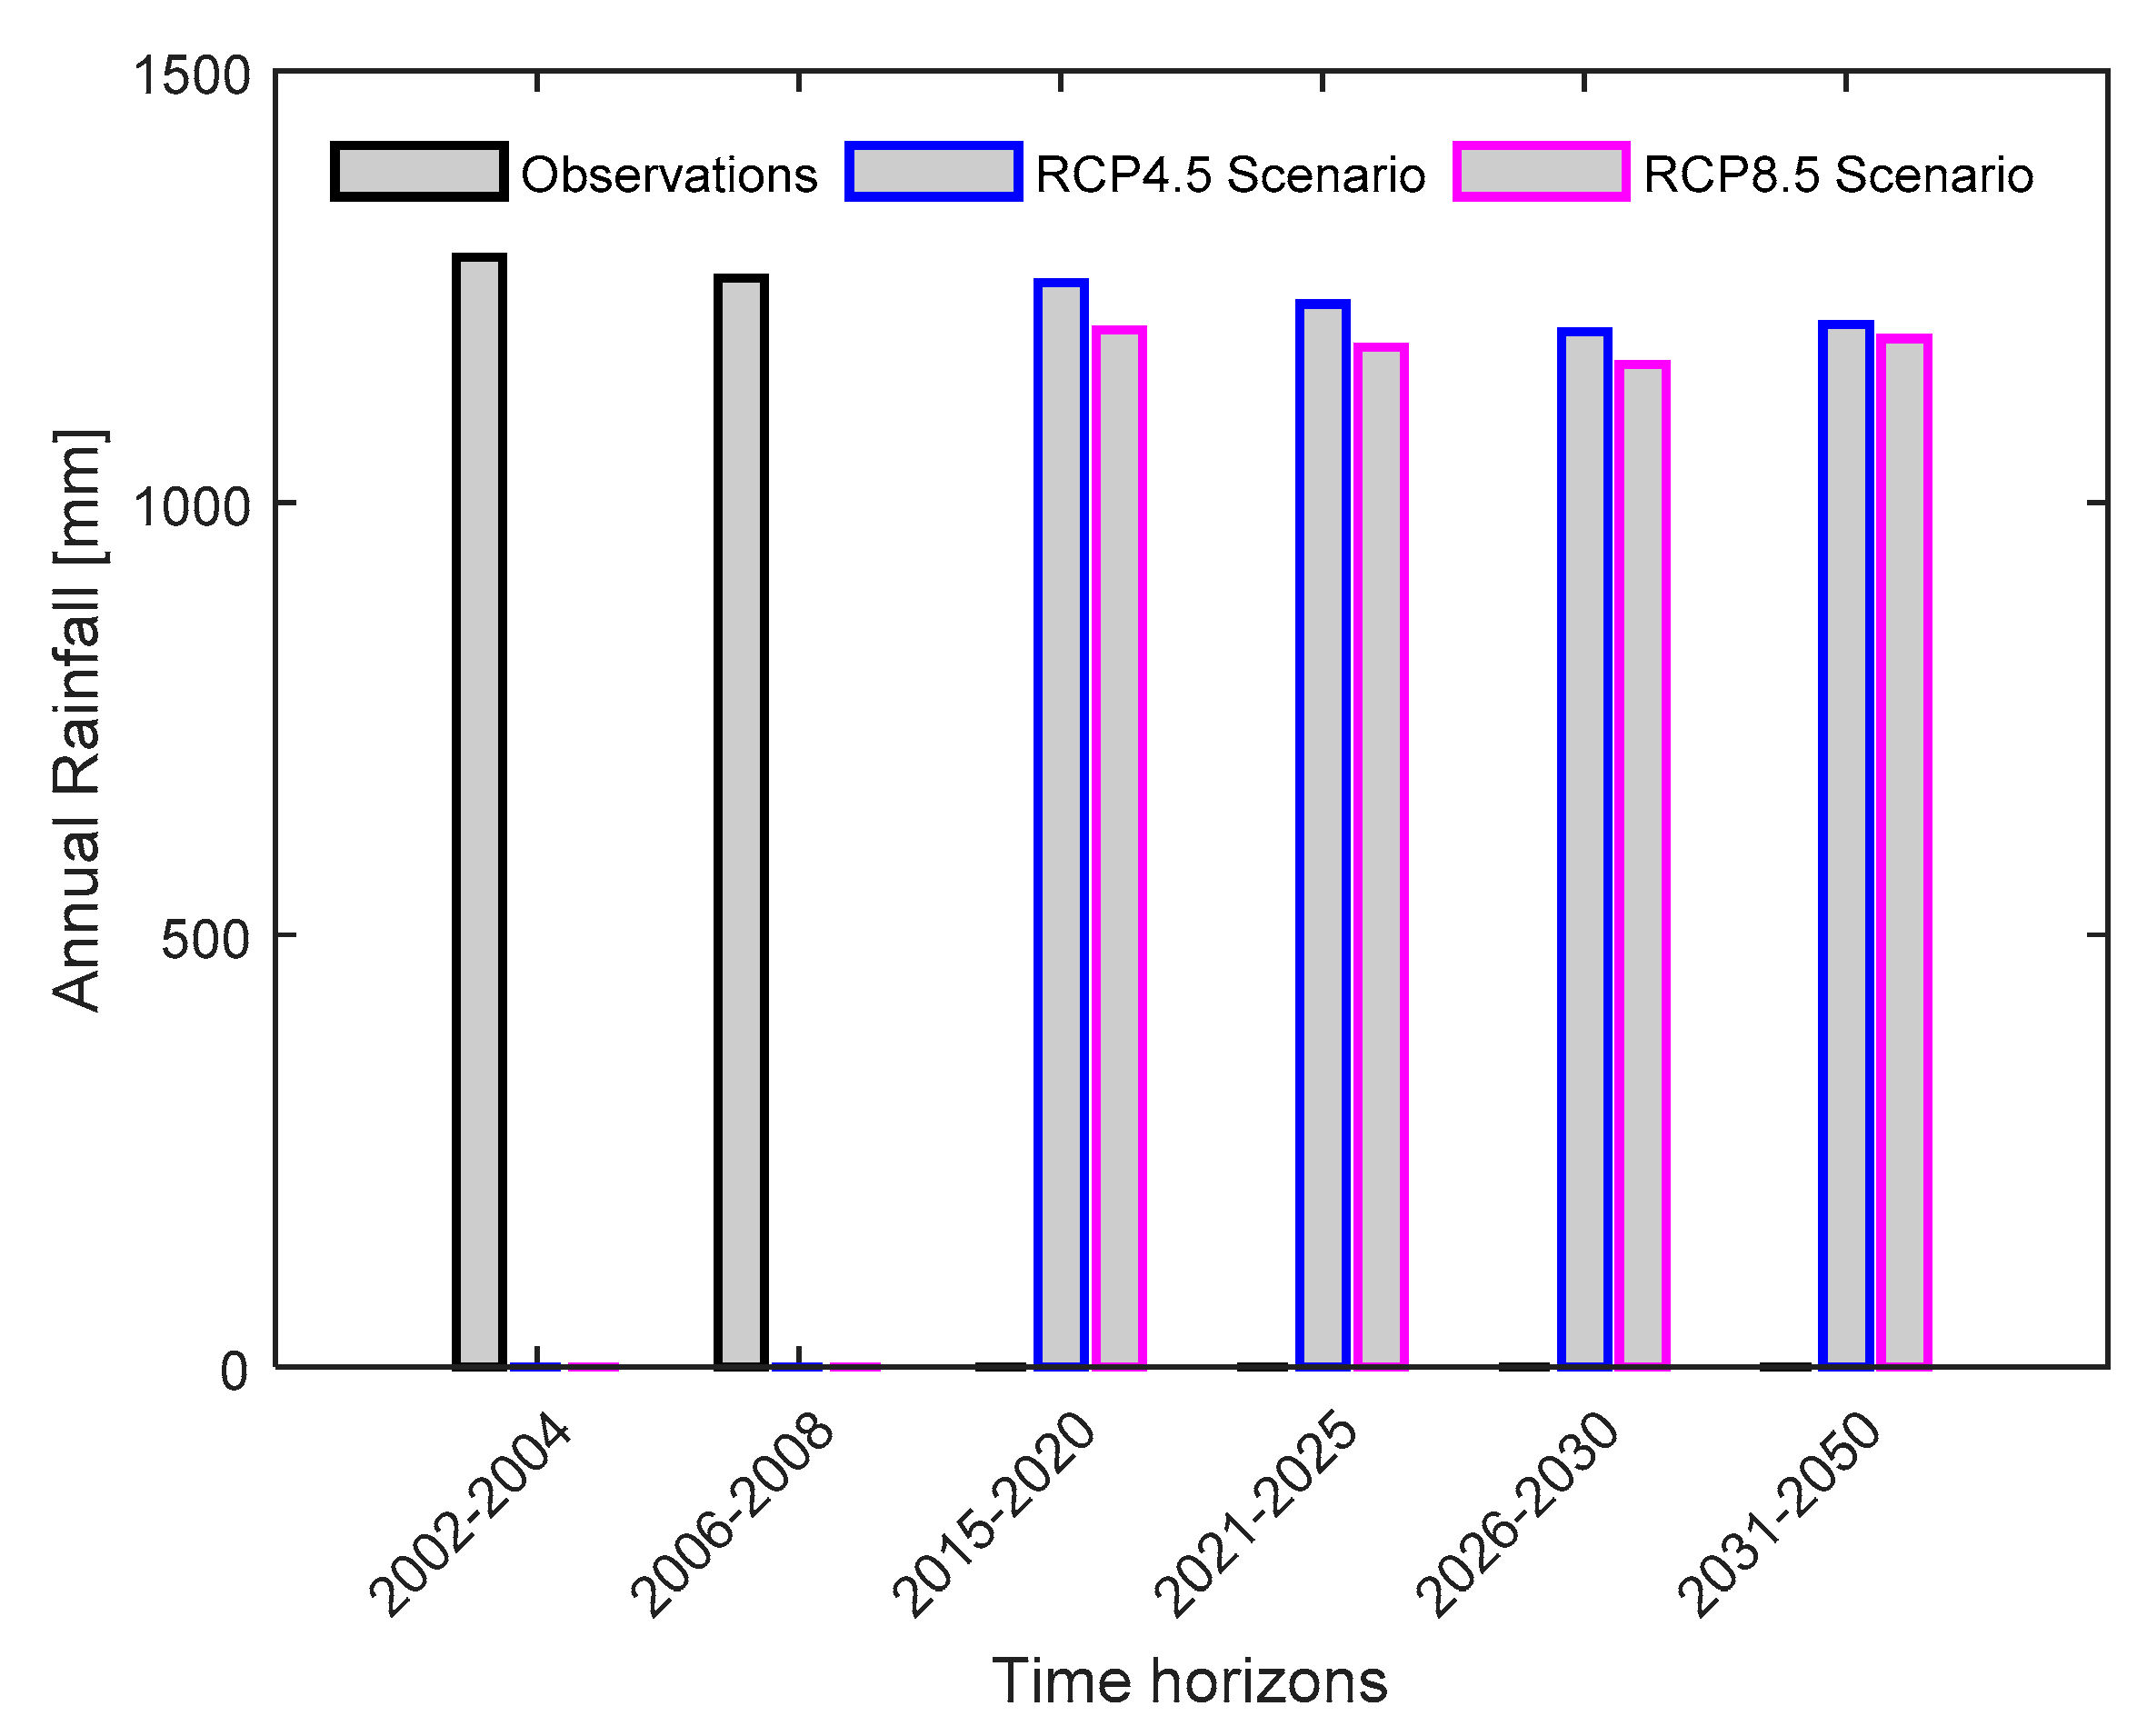
2.2.1. Climate Scenarios

Two types of data were used in this study: (i) daily rainfall and temperature data which were obtained from the National Meteorology Agency of Benin (Météo Bénin) and (ii) daily rainfall and temperature data from a set of simulations (scenario) conducted with REgional climate MOdel (REMO). The REMO simulations are forced with data from the global climate model MPI-ESM-LR following the IPCC Representative Concentration Pathways (RCP). REMO data are available in the context of the Coordinated Regional Climate Downscaling Experiment (CORDEX) over Africa at 0.44° resolution [11] and it has already been used over Africa [6,12] and particularly in Benin for the impact studies [8,9]. We used these predictions following the most extreme IPCC scenario RCP8.5 and the mean RCP4.5. All these data are available in the CORDEX database online (www.cordex.org). Several researchers demonstrated that raw output from regional climate models (RCMs) cannot be used directly as input for impact models because of systematic bias [6,12,13]. So, we used corrected data produced by N’Tcha M’Po et al. [13]. The bias correction method used in this study is a new quantile-quantile calibration method based on a nonparametric function that amends mean, variability, and shape errors in the simulated cumulative distribution functions (CDFs) of the climatic variables, developed by [14]. This bias correction method is already tested in our study area [13] and other basin in Benin [15] and all details can be found in [13,14,15]. Figure 2 and Figure 3 present the global trends of precipitations and temperature for the different time horizons, whereas Figure 4 shows daily precipitation and temperature as corrected by [13].

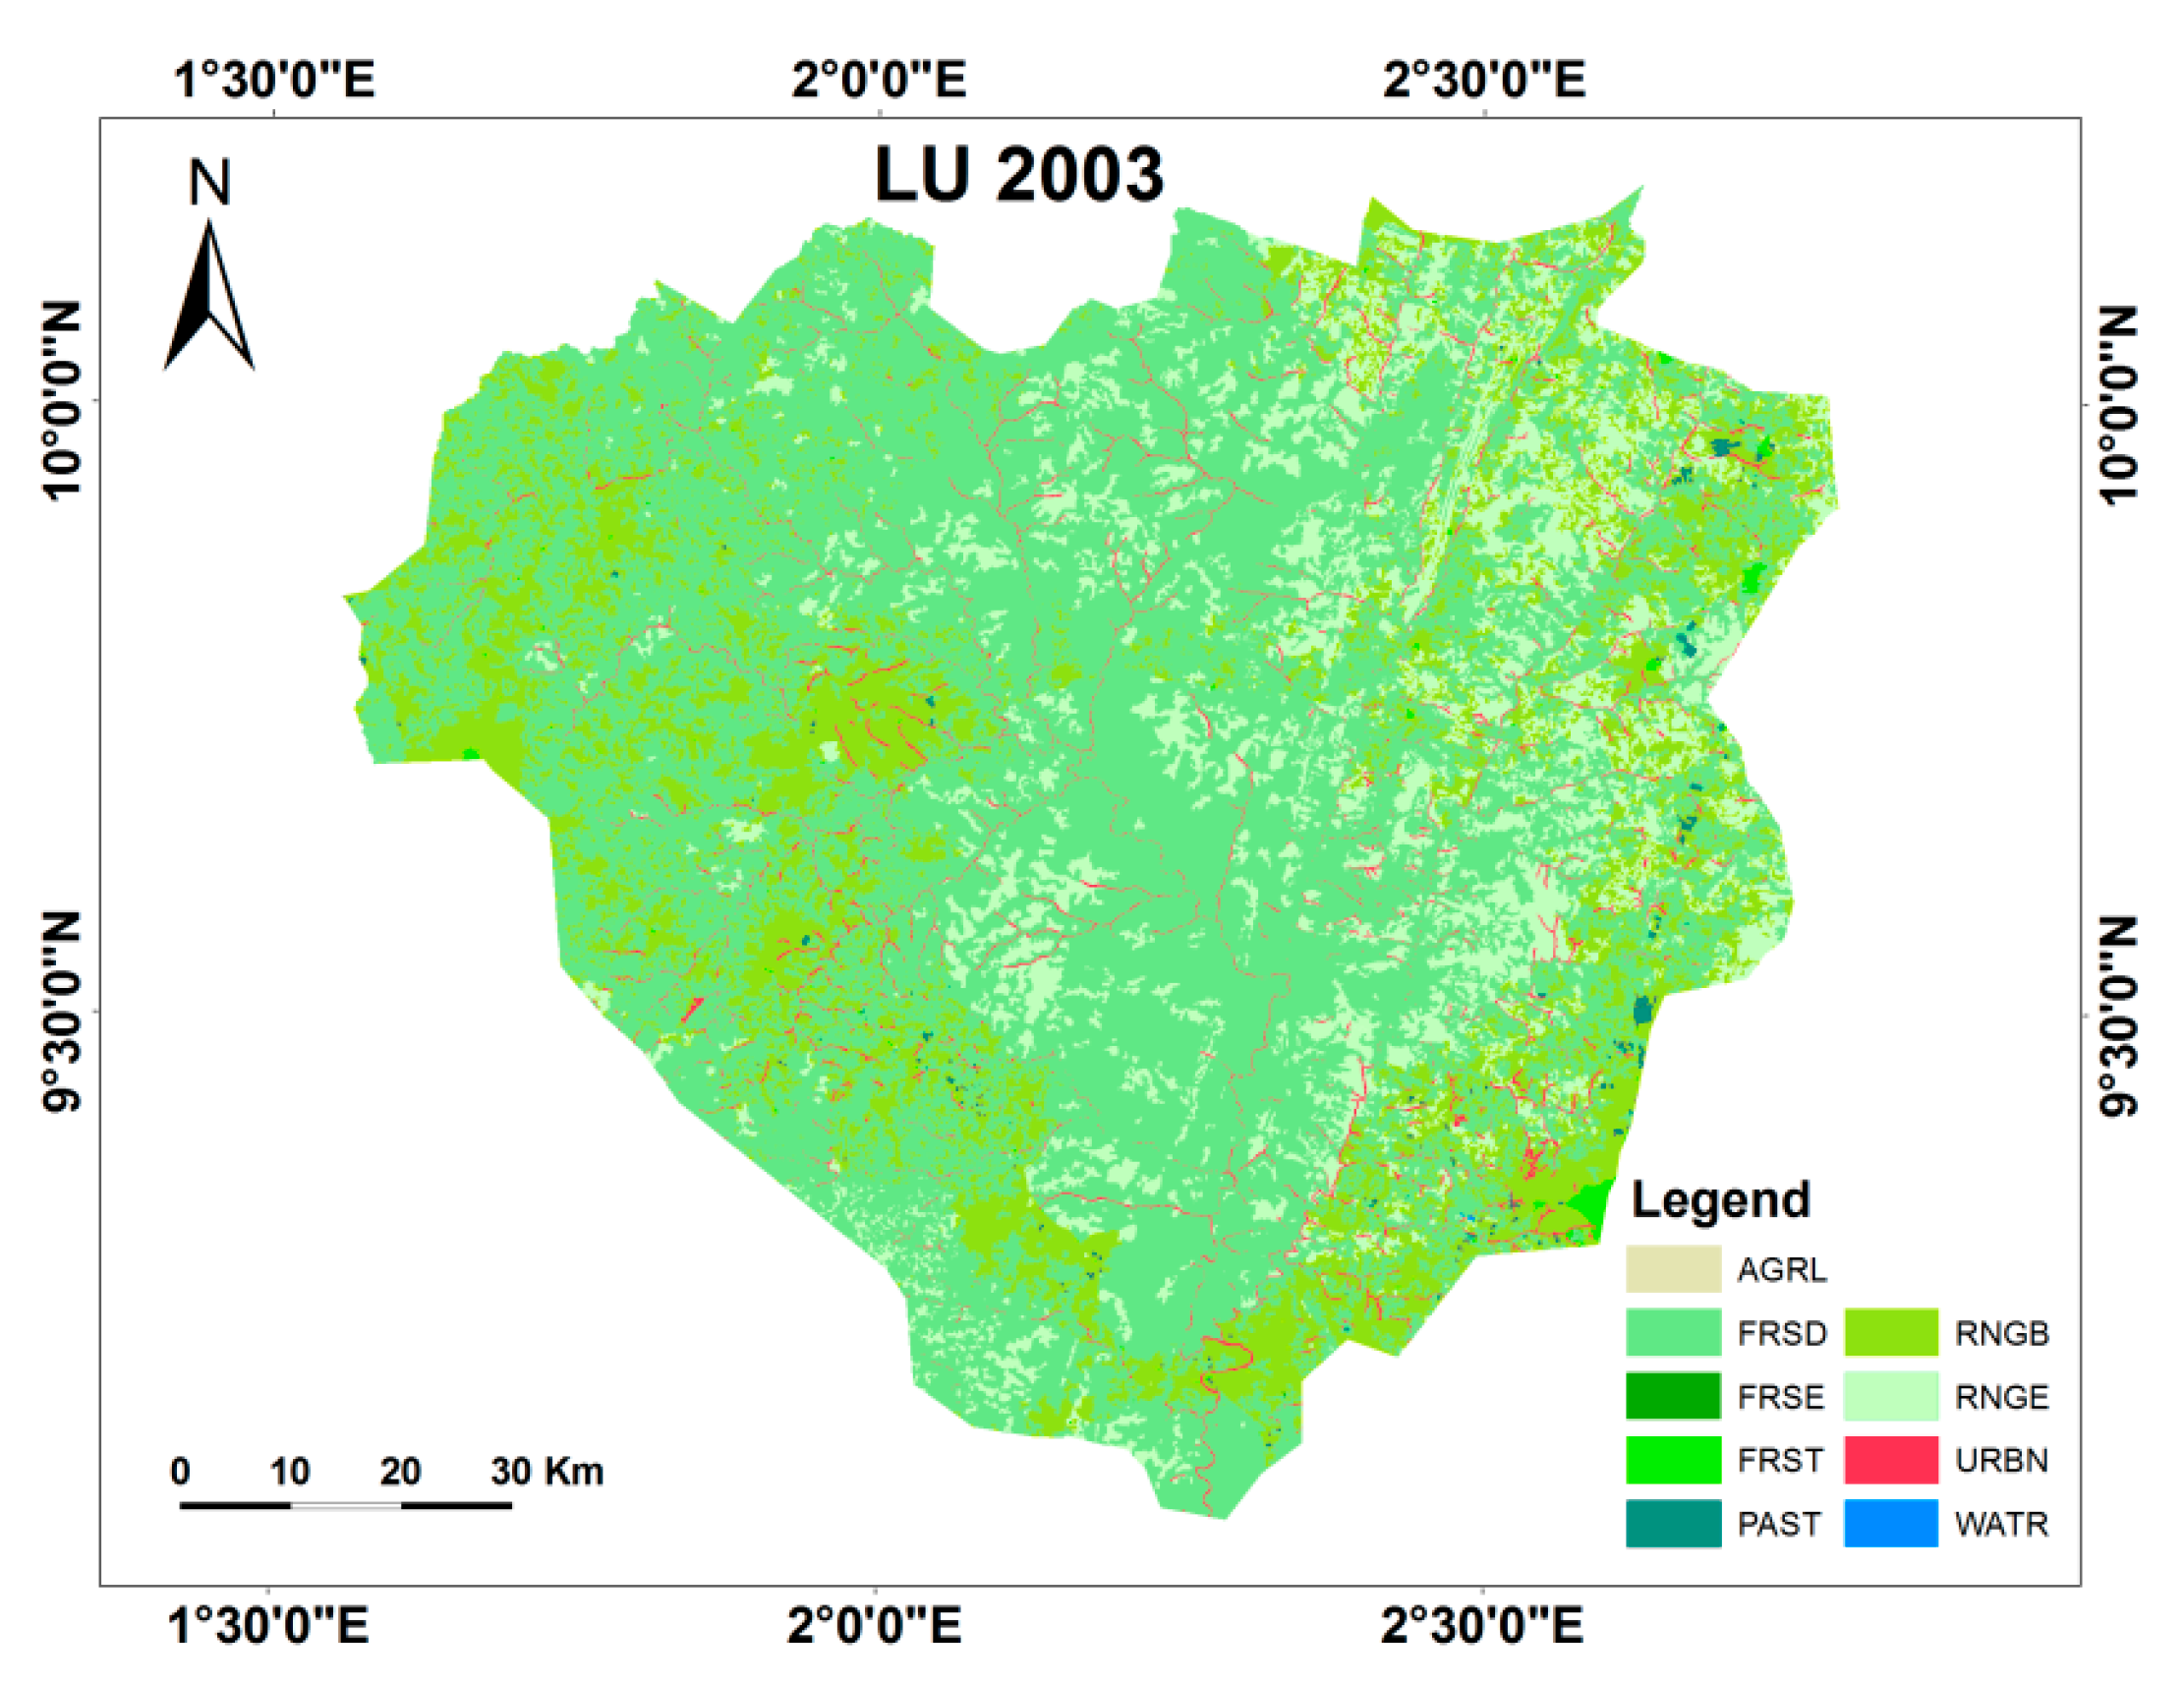
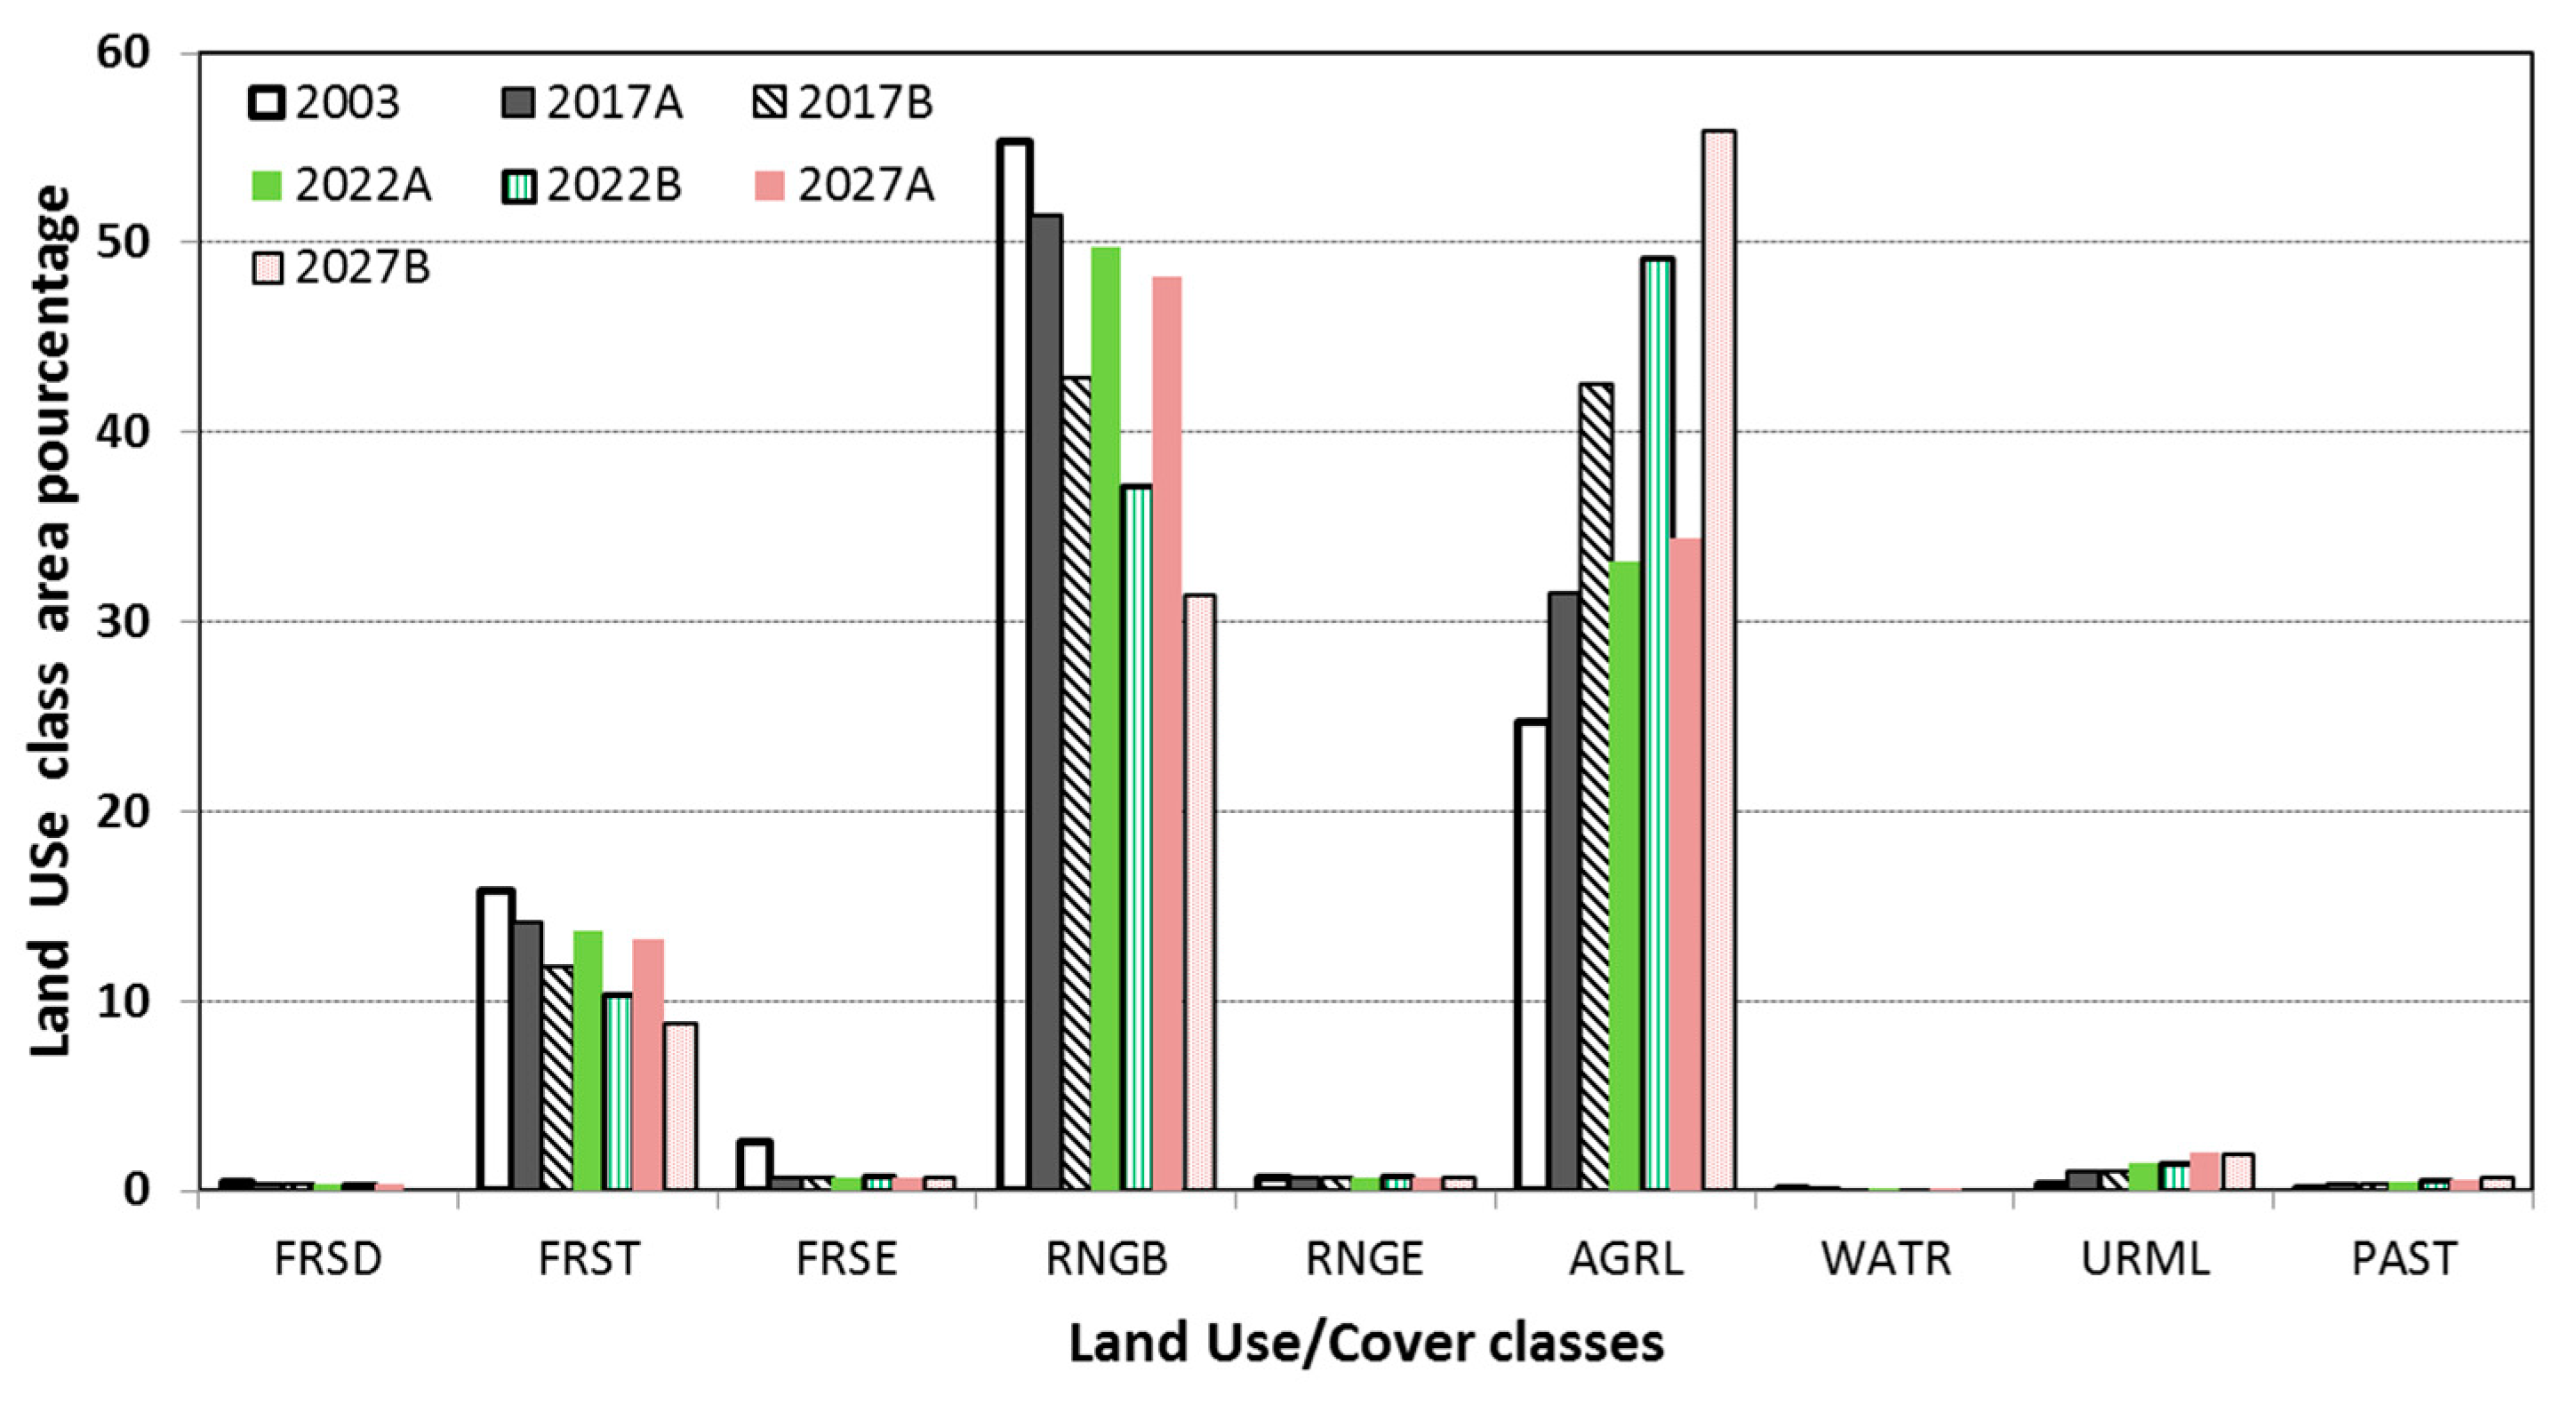
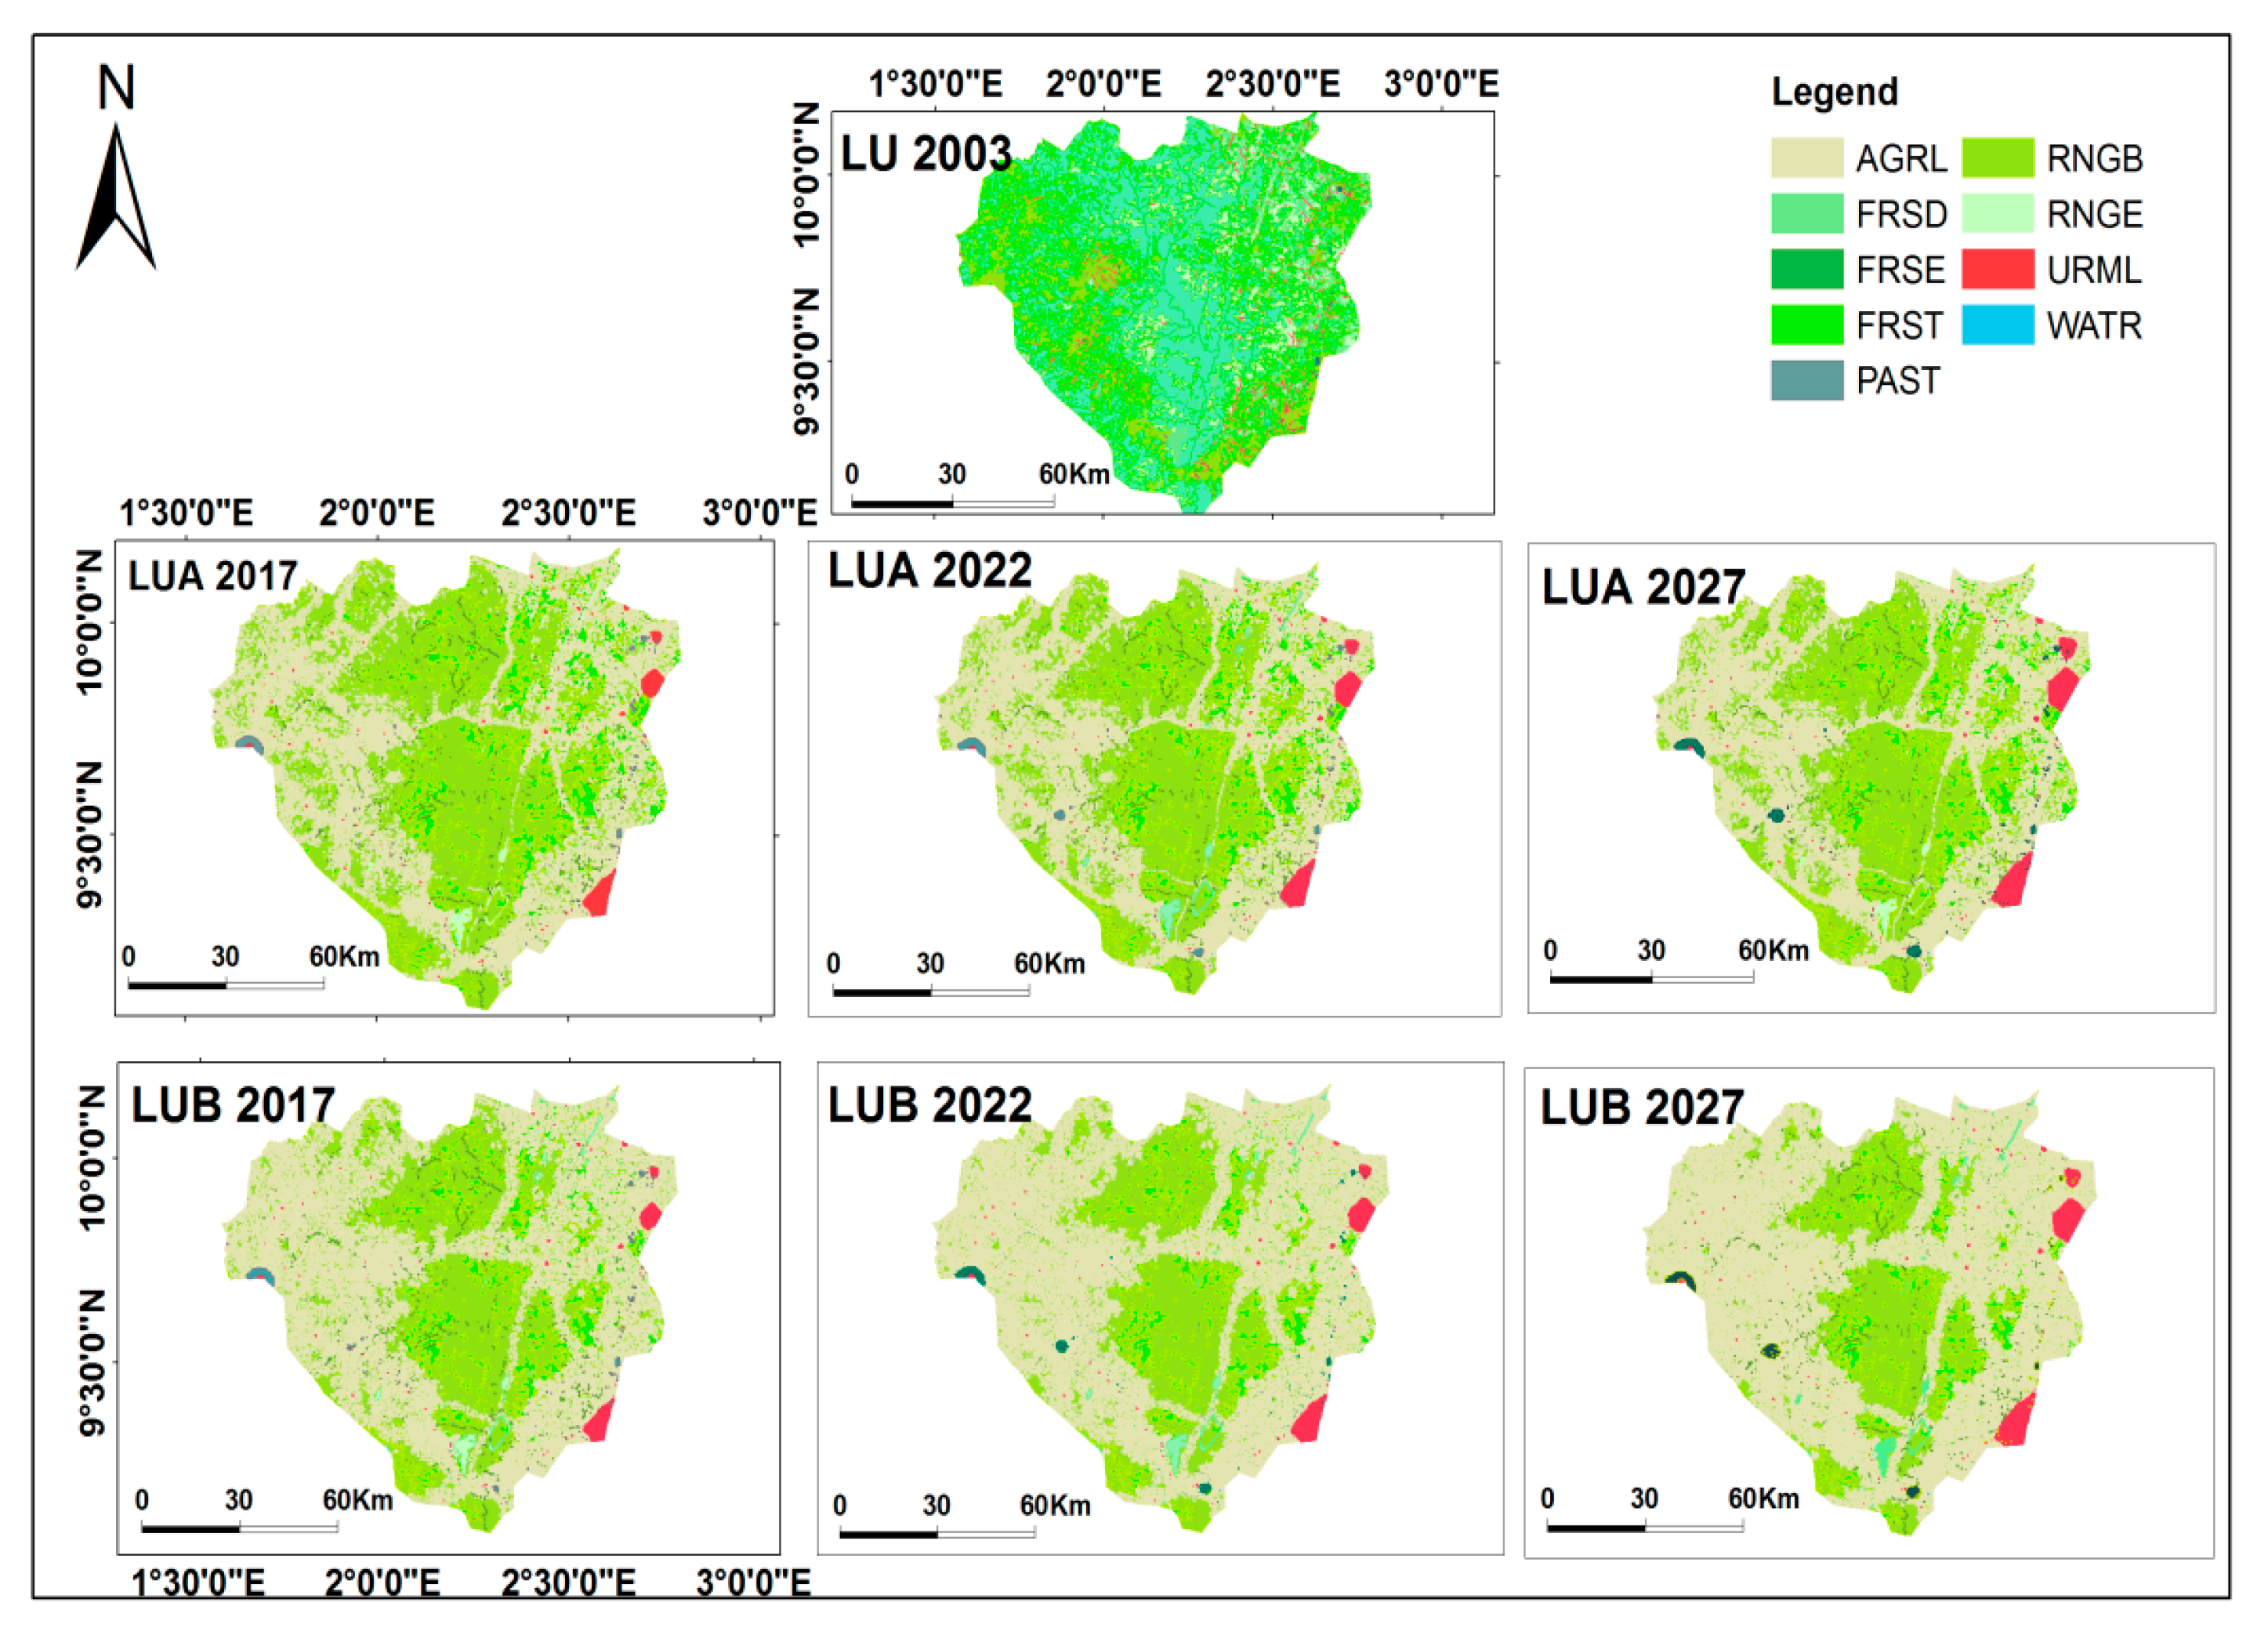
2.2.2. Land Use/Cover Scenario

The land use/land cover map used in this study was established within the RIVERTWIN project at a scale of 1/200,000 from LANDSAT ETM Plus of 2003 using 3 scenes. Figure 5 shows land use/cover map for reference period 2003. In the Ouémé catchment, land use is largely characterized by small-scale agriculture [16]. In the northern part of the catchment, intensive agriculture can be found around the old settlements. Agricultural activities are mostly subsistence based but also partly oriented towards production for regional markets [9]. Characteristic land use patterns for that zone are a mixture of fields, fallows, and patches of forest.
The covered areas by the most important land use/cover classes are presented in Table 1. Agriculture and other human activities have led to large-scale deforestation and fragmentations leaving only small relicts of the natural vegetation types within a matrix of degraded secondary habitats.
As the major factor for land use change is population growth, two socio-economic scenarios were set up: Land Use A (LUA) is characterized by a stronger economic development, controlled urbanization, the implementation of too large-scale irrigation schemes and by 3.2% population growth per year; Land Use B (LUB) is characterized by a weak national economy, uncontrolled settlement and farmland development, and a 3.5% population growth per year [17]. These scenarios are also used in the national planning administration of Benin [9]. Overall, land use scenarios were defined for three horizons (2017, 2022, and 2027) for the watershed [16]. For each scenario, the population growth has been translated into a specific demand for settlements and agricultural area according to the development of the national framework. According to the proximity to roads and existing villages, new settlements and agricultural areas have been created leading to new land use distribution. Therefore, large areas of natural vegetation were also accordingly converted to croplands [9]. In our study area, this consists of natural vegetation conversion into agriculture lands, 24.68% (in 2003) to 34.38% (in 2027) for the scenario LUA and 24.68% (in 2003) to 55.91% (in 2027) for the scenario LUB (Figure 6). The Figure 7 shows the spatial distribution of the different land use/cover classes in the basin. It is worth to note the high increasing of urban area varying to 0.3% (in 2003) to 2.02% (2027) for both scenarios.

2.2.3. Other Data

Meteorological data, such as the reference evapotranspiration, potential evaporation from a bare soil, and potential evaporation from open water, are required to run LISFLOOD, but these data are not available. So, these data were computed as explained using the following theoretical formula. The reference evapotranspiration (ET0) was computed using Hargreaves equations [18].
E T 0 = 0.0023 ( T m e a n + 17.8 ) ( T m i n m a x 0.5 R a )
With Tmean, Tmax, Tmin, and Ra respectively corresponding to the daily mean temperature, the maximum temperature and extraterrestrial radiation. Ra is calculated used using Equation (2) of [19]
R a = 24 × 60 π G s c × d r [ w s sin ( ϕ ) sin ( δ ) + cos ( ϕ ) cos ( δ ) sin ( w s ) ]
where Gsc = 0.0820 MJ m−2 min−1 is the solar constant
d r = 1 + 0.033 cos ( 2 π 365 J ) inverse relative distance Earth–Sun
w s = a r cos ( tan φ tan δ ) sunset hour angle
δ = 0.409 sin ( 2 π 365 J 1.39 ) solar declination
φ the latitude
J is the number of the day in the year between 1 (1 January) and 365 or 366 (31 December).
The evaporation from a bare soil was estimated using an empirical relation between ES0 and ET0 suggested by [19]. This relationship is presented as following:
E S 0 = K e E T 0
The value of Ke depends on the soil moisture. Based on suggestions made by [19], 0.3 and 0.8 were chosen as Ke values for the dry and rainy season, respectively.
Also, the potential evaporation from open water (EW0) was evaluated using the concept of pan evaporation which is linked to the reference evapotranspiration by a pan coefficient [20].
E W 0 = E T 0 / K p a n
where ET0 and K p a n are respectively the reference evapotranspiration and the pan coefficient. K p a n values depend on the relative humidity and the wind speed of the study area. It is equal to 0.85 when the relative humidity is between 40–70% and the wind speed is in the range of 2–5 m/s [20]. For the study area, the wind speed varies between 5 and 8 m/s. As for the relative humidity, it oscillates from 40 to 70% in dry season and greater than 80% in rainy season. Based on these data and according to [20], we used 0.65 and 0.55, respectively, for the rainy and dry seasons.
In addition to meteorological data and land use/cover, other input data are required for the simulation of the LISFLOOD hydrological model. These data are mainly the digital elevation model (DEM) SRTM at 90 m resolution [21] and the soil map extracted from Harmonized World Soil Data HWSD database, Viewer version 1.2. The Leaf Area Index (LAI) is a key variable in many land surface and climate modeling studies such as the present study. Because of LAI data scarcity in Bétérou, and due to the slowly changing of these date over time [22,23], LAI data used here were extracted from the study on an intercomparison of leaf area index products for a gradient of sub-humid to arid environments in West Africa, included Donga basin, an sub-basin of our study area [22].
The main important input data required by LISFLOOD model for channel geometry representation are channels map, channel bottom width map, channel side slope map, channel gradient, channel length, and channel bank full depth map. Except channel gradient and length, these data were extracted from the drainage network map derived using “DEM Hydro-processing’’ operations available in ILWIS (Integrated Land and Water Information System). For channel gradient, it was created from digital elevation model using QGIS, whereas, channels length was created by classifying the local drain direction in QGIS.

2.3. Methods

2.3.1. LISFLOOD Description

LISFLOOD is a GIS and physically based and spatially distributed hydrological rainfall runoff model, which is developed by the Joint Research Centre (JRC) of the European Commission. It is designed to simulate all hydrological processes that occur in a catchment [24]. One of the advantages of using LISFLOOD model is that, it is implemented in the PCRaster Environmental Modeling language wrapped in a Python-based interface, which allows the construction of iterative spatio-temporal environmental models and enables the user to control the model inputs/outputs and the selection of the model modules [24]. Four sub-models make up the LISFLOOD hydrological model. These components are: (i) a sub-model for the simulation of the water balance, (ii) sub-models for the simulation of groundwater and subsurface flow, (iii) a sub-model for the routing of surface runoff, and (iv) a sub-model for the routing of channel flow [24]. The model is mainly based on five calibration parameters, namely: the upper zone time constant, lower zone time constant, groundwater percolation value, power preferential flow, and Xinanjiang parameter Xb [24], following several studies using LISFLOOD in African basins [23,25,26].

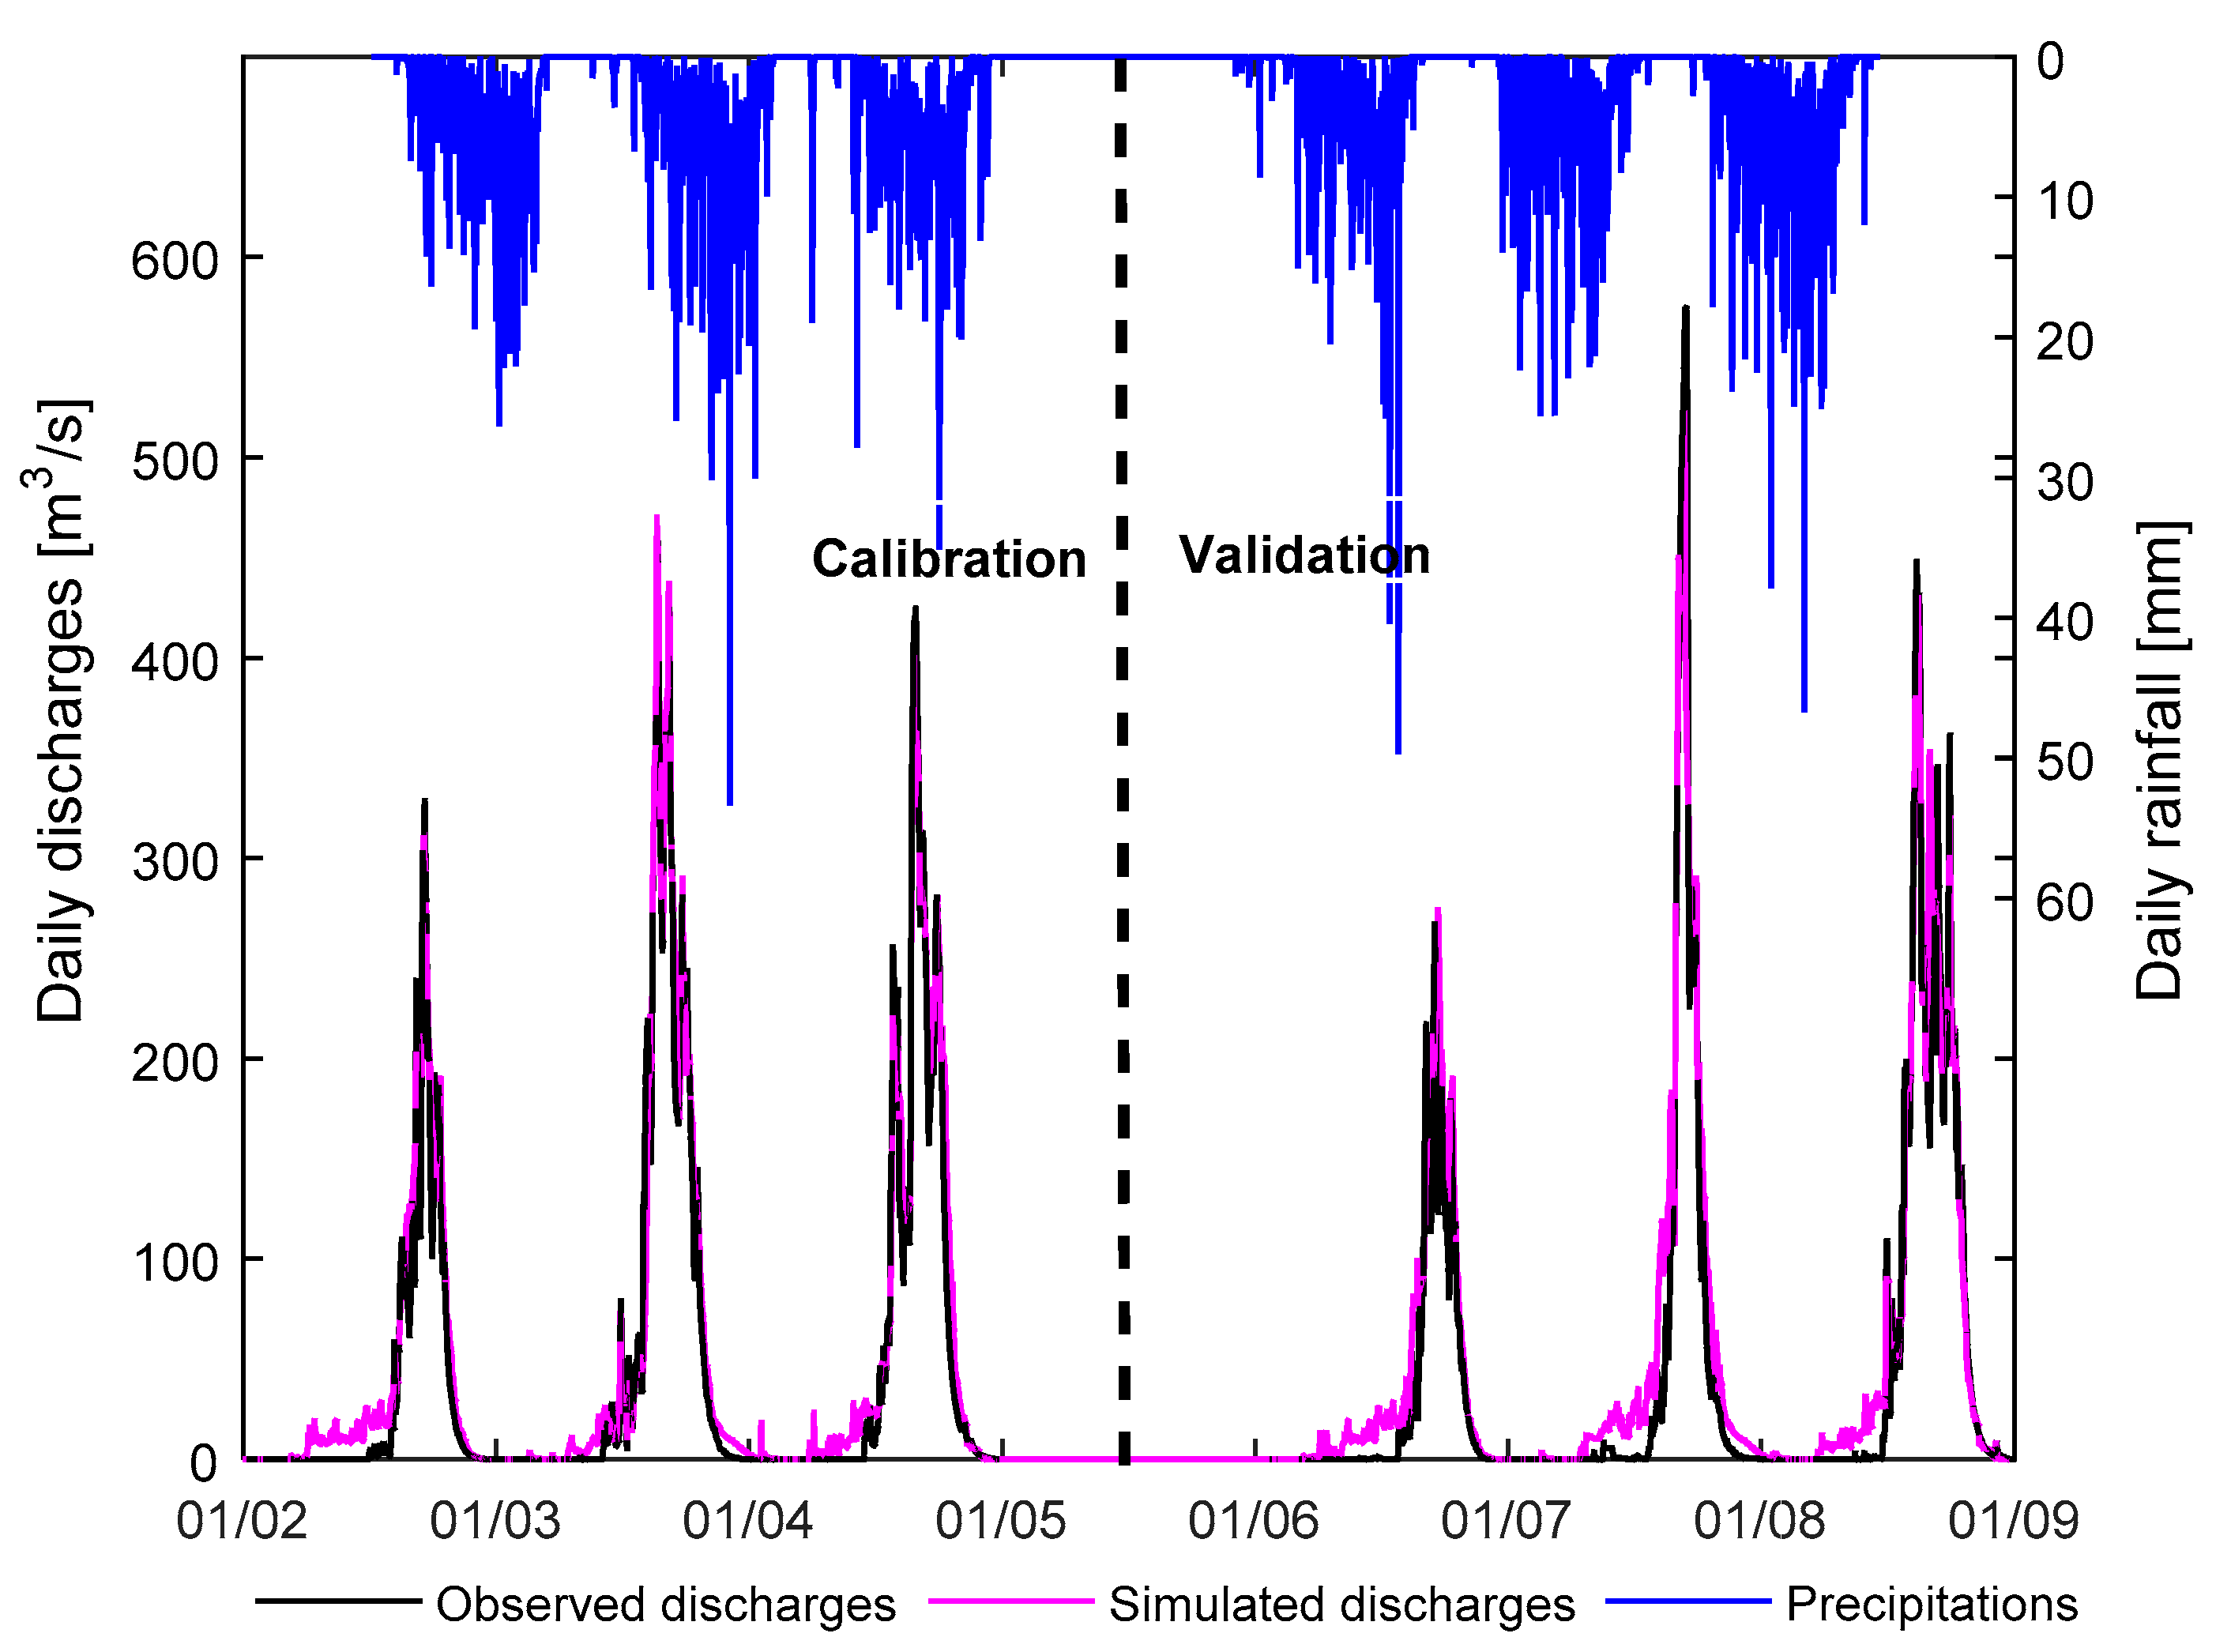
2.3.2. LISFLOOD Calibration and Validation

The LISFLOOD model was run at 5 × 5 km2 spatial resolution. All spatial data (DEM, Land use/cover, soil map) were resampled to this resolution. Due to the low resolution of meteorological observation stations, REMO historical data were extracted at 5 × 5 km2 grid points to complete the observation after bias correction as explained in Section 2.2.1. Similarly, REMO scenarios data for the different time horizons were extracted at these grid points and have been corrected. That means we agree with the bias correction method developed by [14] and implemented by [13]. The meteorological data, such as the reference evapotranspiration, potential evaporation from a bare soil, and potential evaporation from open water, were also computed at 5 × 5 km2 as explained in Section 2.2.1.
Because the land use/cover reference year is 2003; we calibrated the model over the period 2002–2004. The period 2006–2008 was used to test model with land use/cover data of 2007. The calibration was manual (trial and error method) since the available LISFLOOD version does not have the automatic calibration option.
For future discharge assessment, we combined climate change scenarios (RCP4.5 and RCP8.5) with land use/cover change scenarios (LUA and LUB) as explained in Table 2.
So, the future discharges were evaluated for the time horizons H2020 (2015–2020), H2025 (2021–2025), H2030 (2026–2030), and H2050 (2031–2050) following the four climate and land use/cover changes combined scenarios: LUA + RCP4.5, LUA + RCP8.5, LUB + RCP4.5, and LUB + RCP8.5 (Table 2). Discharge computation for time horizons H2020, H2025, H2030 was done using the land use/cover scenario of 2017, 2022, and 2027 respectively. But, for H2050, the discharge scenario was assessed assuming unchanged land use/cover from 2027 until 2050.
Two objective functions were used to evaluate the model’s performance. The first one is the Nash–Sutcliffe coefficient (NSE) and the second one is the Root Mean Square Error (RMSE). These are the common objective functions used to evaluate hydrological models’ performance [23,25,26].

3. Results and Discussion

3.1. Model Calibration and Validation Results

The model was calibrated over the period 2002 to 2004 and the period 2006–2008 was used for validation. The performances in calibration and validation are shown in Table 3 while Figure 4 presents the overview of daily discharge as simulated by the model. LISFLOOD performance in calibration (RMSE = 37.21 m3/s, NSE = 92%) and validation (RMSE = 32.3 m3/s, NSE = 90.5%) are close.
LISFLOOD performs well regarding the daily discharge dynamic as shown by Figure 4. However, the model doesn’t simulate some peaks of discharge well. As for the magnitude of the peak, in general, the model underestimates them and the difference between the observed and simulated peaks is 9.7% for the calibration period. However, in validation, LISFLOOD underestimates peaks less than in calibration. Only the simulated peaks in 2007 and 2008 are higher than the observed peaks of these years (Figure 8). Underestimation of discharge peaks by LISFLOOD was also reported by Koriche [26] in Awash river basin (Ethiopia) and more recently by Komi [27] in Volta river basin (West Africa).
The optimum parameters are indicated (Table 4) and the optimum parameters ranges are indicated by [24], who developed the LISFLOOD model. All calibrated parameters found in the present study are in the intervals indicated by these authors.
In most hydrological modeling studies, the goodness-of-fit measures for calibration are better than for validation. But, for the present study, the performance of LISFLOOD in calibration is very close to validation performance. The source of this similarity may be due the shortest length of calibration and validation period (3 years for each period). The other reason could be precipitation stability in the period 2002–2008 used for calibration and validation. However, many hydrological modeling studies using LISFLOOD reported the model efficiency better (or similar) in validation than in calibration. Komi et al. [23] using LISFLOOD for flood modeling in Oti basin found NSE and RMSE values of 0.87 and 237 m3/s in calibration, while the model validation produced better performance measures (NSE = 0.94 and RMSE = 179 m3/s). The remote sensing-based hydrological modeling for flood early warning in the upper and middle Awash river basin (Ethiopia) conducted by [26] with the LISFLOOD model reported better performance in validation (NSE = 0.89 and RMSE = 29 m3/s) than calibration (NSE = 0.72 and RMSE = 55.29 m3/s). The same behavior of the LISFLOOD hydrological model was observed by [28] for the Olifants River at Loskop North in South Africa: the modified version of the Kling–Gupta Efficiency (KGE’) values obtained by these authors were better for validation (KGE’ = 0.56) than calibration (KGE’ = 0.34) [28]. Mabande [25] found very close LISFLOOD performances between calibration and validation in the application of a satellite-based rainfall-runoff model for Cuvelai basin in Namibia flood simulation. The model efficiency obtained in this study, namely NSE and RMSE of 0.63 (0.59) and 82.63 (83.28) in calibration (validation), respectively. Thus, the model performance may not depend on the climate conditions of the basin.

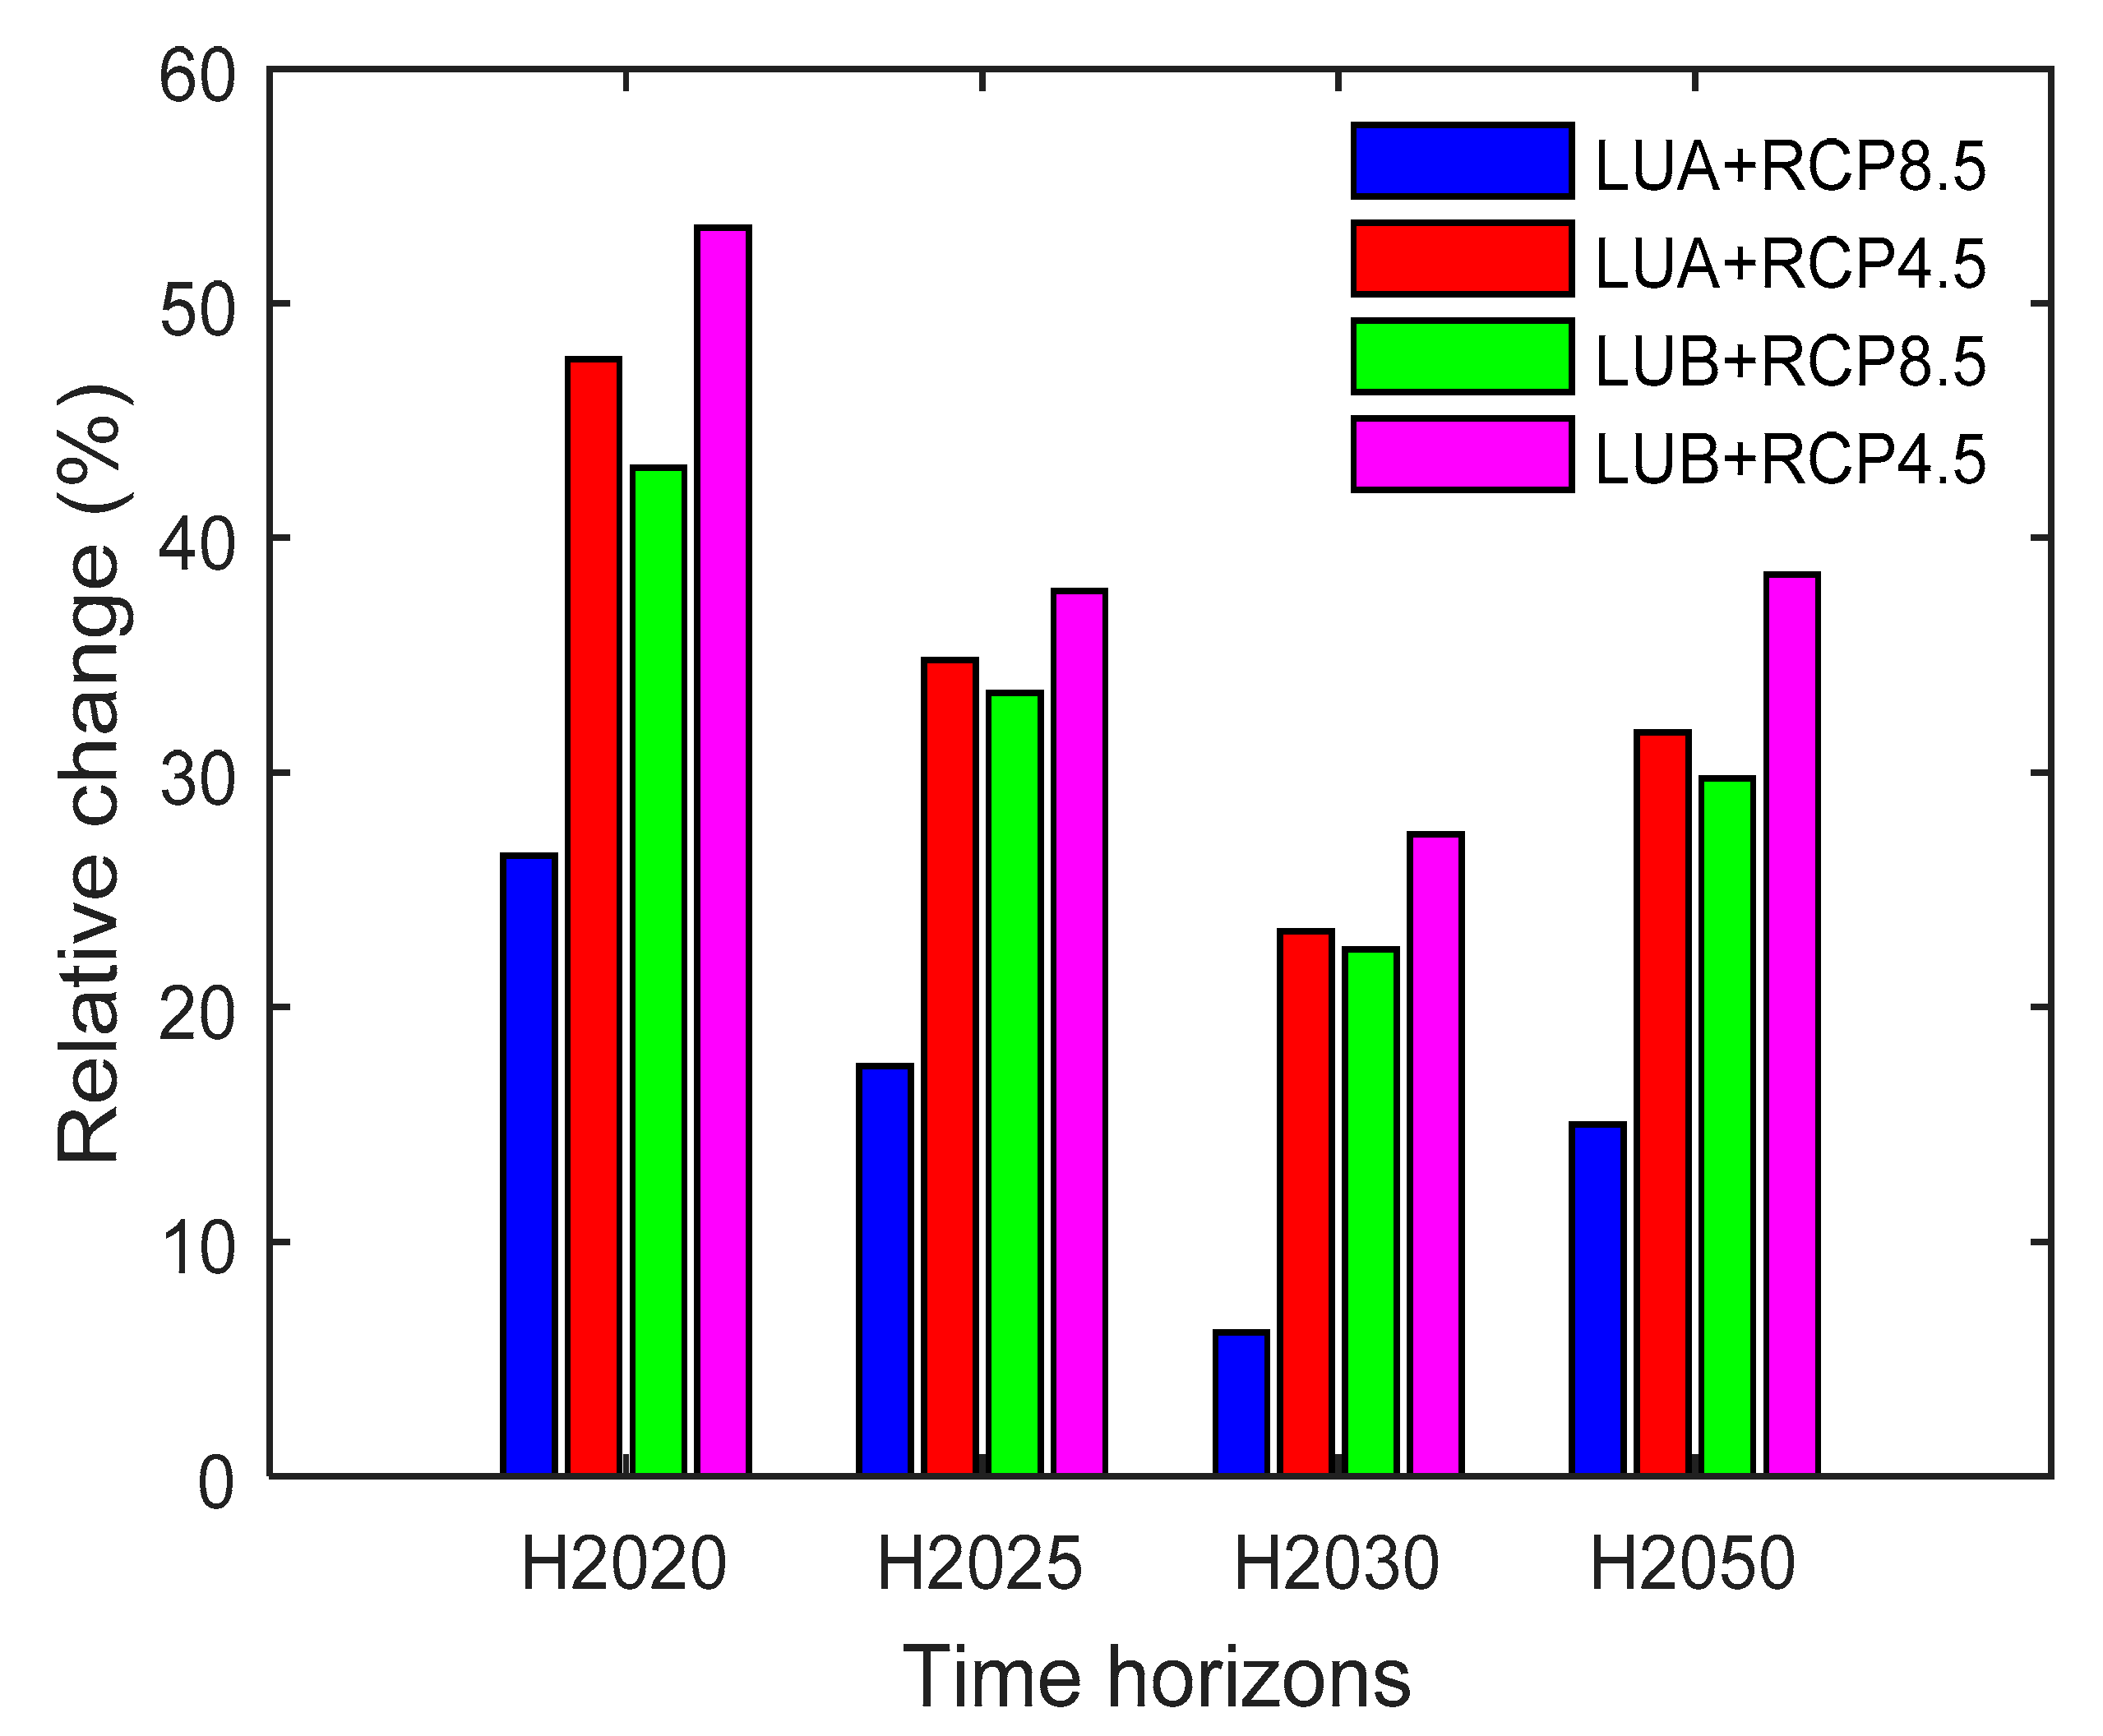
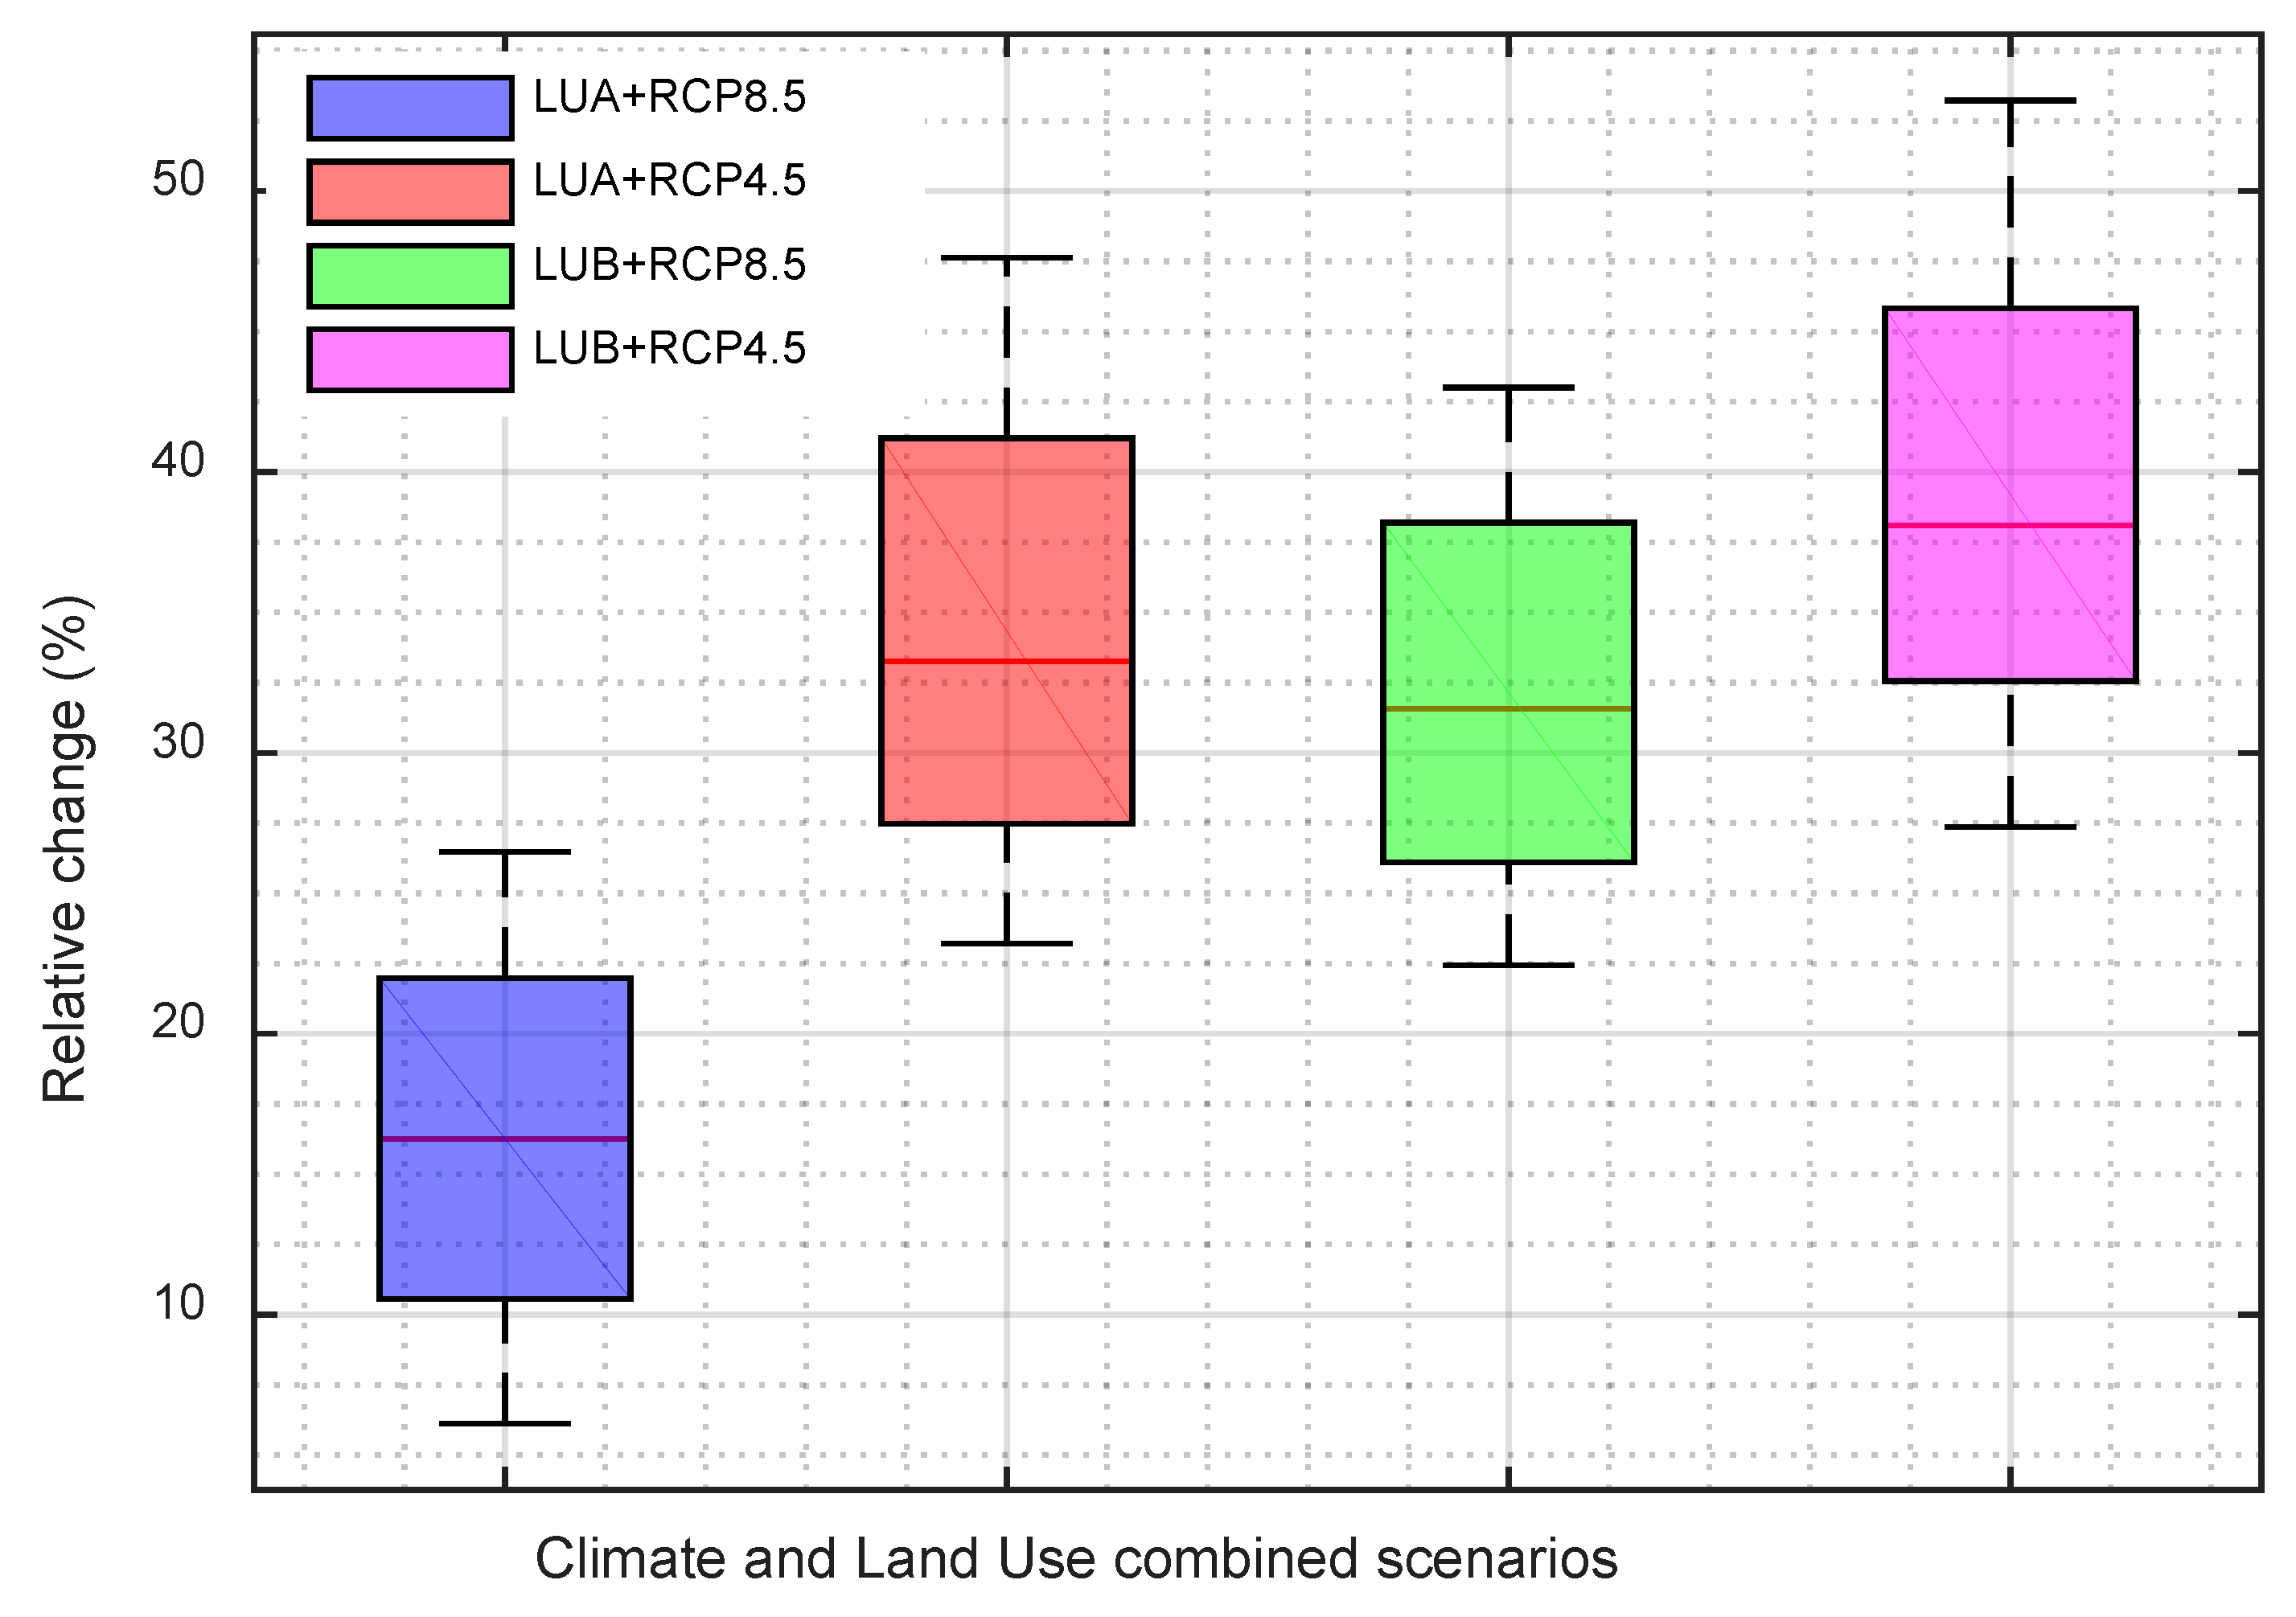
3.2. Daily Discharge Scenarios

From the simulated daily discharge, the monthly and annual means discharges were computed for each scenario and compared to the baseline observed monthly and annual mean discharges. Figure 8 presents the monthly hydrographs while Figure 9 shows the annual mean discharge change for different time horizons following the four climate and land use/cover combined scenarios LUA + RCP4.5, LUA + RCP8.5, LUB + RCP4.5, and LUB + RCP8.5. These figures show a slight decrease over the time horizons according to the four scenarios. But, in spite of rainfall decrease (Figure 2), discharge will increase until 2050 following all climate and land use/cover change scenarios compared to reference period 2002–2004.
The change depends on the scenario and the time horizon. It is worth mentioning that discharge increase is more important following climate scenario RCP4.5 than scenario RCP8.5 (Figure 10 and Figure 11). In fact, discharge increase under scenario LUA + RCP4.5 is more important than discharge simulated following the scenario LUA + RCP8.5. Also, the increasing discharge is more exacerbated under the scenario LUB + RCP4.5 than LUB + RCP8.5. On average, discharge increase following climate scenario RCP4.5 is estimated at 40% versus 25% under the scenario RCP8.5.
Annual surface runoff may change from +17.5% to +37% for all the scenarios (Figure 11), driven by climate and land use change. Figure 10 shows the impact of land use/cover change on discharge. Indeed, compared to reference period, discharge may increase by about 17.5% under scenario LUA + RCP8.5 and this increase is 30.3% for the scenario LUB + RCP8.5. Considering the scenarios LUA + RCP4.5 and LUB + RCP4.5, increasing discharge is estimated as 36% and 48%, respectively. It means that, discharge increase is more exacerbated under land use/cover change scenario LUB.
Considering the main characteristics of LUA and LUB, the higher increase of runoff under LUB is due to strong conversion of natural vegetation to agricultural land. Indeed, increasing agricultural activities is correlated with deforestation and alteration of local soil properties, specifically infiltration [29]. So, land use/cover change leads to infiltration reduction in the soil top layer due to soil crusts at the soil top surface and thus to increasing Hortonian runoff. Runoff increase due to land degradation has already been reported in several basins over West Africa. In Nakambé basin, Burkina Faso, runoff has increased, despite rainfall decreases since 1970 [30]. This increase of flows has been linked to agricultural land area increase. The same observation was made in Niger river basin, where runoff increase was related to increased cultivated area [31].
Assuming an unchanged land use after time horizon 2026–2030, we have produced the discharge scenarios until 2050. Increase of discharge compared to the reference period 2002–2004 was noted. This change varies between 15% and 37.1% depending on the scenario (Figure 9). These findings are in line with of the study of Bossa et al. [9]. Combining IPCC scenarios A1B and B1 with the two land use scenarios (LUA and LUB) in Ouémé watershed at Bonou including our study area, they reported the increase of discharge up to 42% for time horizon 2025–2029 compared to the period 2000–2009. In the specific case of Donga watershed, a sub-basin of our study, they showed that annual surface runoff could increase by up to 17% until 2050.

4. Conclusions

In this study, an assessment of climate and land use change impacts on future flows in Bétérou basin has been carried out. Land use scenarios produced by the RIVERTWIN project and the regional climate model (REMO) corrected outputs were used for forcing LISFLOOD hydrological model to estimate the future discharges in Ouémé River at Bétérou outlet. The ability of the model to reproduce the river discharge was evaluated for the periods 2002–2004 (calibration) and 2006–2008 (validation). The results during these historical periods (2002–2004 and 2006–2008) confirmed the high ability of LISFLOOD to reproduce the past discharge in Bétérou basin with a Nash–Sutcliffe coefficient higher than 0.9 in calibration and validation. Based on the combination of climate change scenario RCP4.5 and RCP8.5 with land use/cover change scenarios LUA on the one hand and climate scenarios RCP8.5 and LUB, the future flows in Ouémé River at Bétérou outlet were estimated. Compared to the reference period of 2002–2004, Ouémé River at Bétérou outlet will experience the increased discharge for all time horizons until 2050 and for all climate and land use change combined scenarios. This increase varies from 7.1% to 52% and is exacerbated in scenario LUB + RCP4.5, confirming the high sensibility of discharge to land degradation due to extension of agricultural areas. This study provides important information about the future of water resources in the basin. It is also an invitation to water resource managers for the design of mitigation strategies to cope with the negative effects of discharge increase, mainly flooding in the study area. These adaptation and mitigation measures must include updating flood protection infrastructure, improving population awareness and preparedness, urban planning, discouraging human settlement in flood-prone areas, and reinforcing flood forecasting systems.

Author Contributions

Y.N.M., L.A.E., C.A.B., K.K., R.H., K.B.Y. and A.A.A. designed the study, developed the methodology and wrote the manuscript. L.A.E. and Y.N.M. performed the field work, collected the data and conducted the computer analysis; meanwhile C.A.B., K.K., R.H., K.B.Y. and A.A.A. supervised this part of the work.

Funding

This study was funded by The Netherlands Initiative for Capacity building in Higher Education (NICHE) through the National Institute of Water of the University of Abomey-Calavi.

Acknowledgments

We thank the ESGF grid (http://esg-dn1.nsc.liu.se/esgf-web-fe/) that provided the CORDEX-Africa future climate projections. We would like to thank Ad De Roo for his contribution in LISFLOOD input data processing.

Conflicts of Interest

The authors declare no conflict of interest.

References

  1. Vos, F.; Rodriguez, J.; Below, R.; Guha-Sapir, D. Annual Disaster Statistical Review 2009, The Numbers and Trends; Centre for Research on the Epidemiology of Disasters: Brussels, Belgium, 2010. [Google Scholar]
  2. Mills, E. Insurance in a climate of change. Science 2005, 309, 1040–1044. [Google Scholar] [CrossRef] [PubMed]
  3. IPCC. Managing the Risks of Extreme Events and Disasters to Advance Climate Change Adaptation; Field, C.B., Barros, V., Stocker, T.F., Qin, D., Dokken, D.J., Ebi, K.L., Mastrandrea, M.D., Mach, K.J., Plattner, G.-K., Allen, S.K., et al., Eds.; Cambridge University Press: Cambridge, UK, 2012. [Google Scholar]
  4. Di Baldassarre, G.; Montanari, A.; Lins, H.; Koutsoyiannis, D.; Brandimarte, L.; Blöschl, G. Flood fatalities in Africa: From diagnosis to mitigation. Geophys. Res. Lett. 2010. [Google Scholar] [CrossRef]
  5. Bates, B.C.; Kundzewicz, Z.W.; Wu, S.; Palutikof, J.P. Climate Change and Water; Technical Paper of the Intergovernmental Panel on Climate Change; IPCC: Geneva, Switzerland, 2008. [Google Scholar]
  6. Mbaye, M.L.; Hagemann, S.; Haensler, A.; Gaye, A.T.; Afouda, A. Assessment of Climate Change Impact on Water Resources in the Upper Senegal Basin (West Africa). Am. J. Clim. Chang. 2015. [Google Scholar] [CrossRef]
  7. Diekkrüger, B.; Diederich, M.; Giertz, S.; Höllermann, B.; Kocher, A.; Reichert, B.; Steup, G. Water availability and water demand under Global Change in Benin, West Africa. In Proceedings of the Global Change and Water Resources in West Africa The German-African GLOWA Projects, Ouagadougou, Burkina Faso, 25–28 August 2008. [Google Scholar]
  8. Giertz, S.; Höllermann, B.; Diekkrüger, B. An interdisciplinary scenario analysis to assess the water availability and water consumption in the Upper Ouémé catchment in Benin. Adv. Geosci. 2006, 9, 3–13. [Google Scholar] [CrossRef] [Green Version]
  9. Bossa, A.Y.; Diekkrüger, B.; Agbossou, E.K. Scenario-Based Impacts of Land Use and Climate Change on Land and Water Degradation from the Meso to Regional Scale. Water 2014, 6, 3152–3181. [Google Scholar] [CrossRef] [Green Version]
  10. Hounkpè, J. Assessing the Climate and Land Use Changes Impact on Flood Hazard in Ouémé River Basin, Benin (West Africa); University of Abomey Calavi: Abomey Calavi, Benin, 2016. [Google Scholar]
  11. Giorgi, F.; Jones, C.; Asrar, G. Addressing climate information needs at the regional level: The CORDEX framework. World Meteorol. Org. Bull. 2009, 58, 175–183. [Google Scholar]
  12. Kaboré, E.; Nikiema, M.; Ibrahim, B.; Helmschrot, J. Merging historical data records with MPI-ESM-LR, CanESM2, AFR MPI and AFR 44 scenarios to assess long-term climate trends for the Massili Basin in central Burkina Faso. Int. J. Curr. Eng. Technol. 2015, 5, 1846–1852. [Google Scholar]
  13. N’Tcha M’Po, Y.; Lawin, A.E.; Oyerinde, G.T.; Yao, K.B.; Afouda, A.A. Comparison of Daily Precipitation Bias Correction Methods Based on Four Regional Climate Model Outputs in Ouémé Basin, Benin. Hydrology 2016, 4, 58–71. [Google Scholar] [CrossRef]
  14. Amengual, A.; Homar, V.; Romero, R.; Alonso, S.; Ramis, C. A Statistical Adjustment of Regional Climate Model Outputs to Local Scales: Application to Platja de Palma, Spain. J. Clim. 2012. [Google Scholar] [CrossRef]
  15. Obada, E.; Alamou, A.E.; Zandagba, E.J.; Biao, I.E.; Chabi, A.; Afouda, A.A. Comparative study of seven bias correction methods applied to three Regional Climate Models in Mekrou catchment (Benin, West Africa). Int. J. Curr. Eng. Technol. 2016, 6, 1831–1840. [Google Scholar]
  16. RIVERTWIN. Regional Model for Integrated Water Management inTwinned River Basins. Adapted and Integrated Model for the Ouémé River Basin; Institute for Landscape Planning and Ecology: Stuttgart, Germany, 2007. [Google Scholar]
  17. Götzinger, J. Distributed Conceptual Hydrological Modelling—Simulation of Climate, Land Use Change Impact and Uncertainty Analysis. Ph.D. Thesis, University of Stuttgart, Stuttgart, Germany, 2007. [Google Scholar]
  18. Aguilar, C.; Polo, M.J. Generating reference evapotranspiration surfaces from the Hargreaves equation at watershed scale. Hydrol. Earth Syst. Sci. 2011, 15. [Google Scholar] [CrossRef]
  19. Allen, R.G.; Pereira, L.S.; Raes, D.; Smith, M. FAO Irrigation and Drainage Paper No. 56: Crop Evapotranspiration (Guidelines for Computing Crop Water Requirements); FAO: Rome, Italy, 1998. [Google Scholar]
  20. Maidment, R.D. Handbook of Hydrology; McG Raw-Hill Inc.: New York, NY, USA, 1992. [Google Scholar]
  21. Jarvis, A.; Reuter, H.I.; Nelson, A.; Guevara, E. Hole-Filled Seamless SRTM Data V4; International Centre for Tropical Agriculture (CIAT): Cali, Colombia, 2008. [Google Scholar]
  22. Gessner, U.; Niklaus, M.; Kuenzer, C.; Dech, S. Intercomparison of Leaf Area Index Products for a Gradient of Sub-Humid to Arid Environments in West Africa. Remote Sens. 2013, 5, 1235–1257. [Google Scholar] [CrossRef] [Green Version]
  23. Komi, K.; Neal, J.; Trigg, M.A.; Diekkrüger, B. Modelling of flood hazard extent in data sparse areas: A case study of the Oti River basin. J. Hydrol. 2017, 10, 122–132. [Google Scholar] [CrossRef]
  24. Van der Knijff, J.; de Roo, A.P.J. LISFLOOD. Distributed Water Balance and Flood Simulation Model; Revised User Manual; JRC Scientific and Technical Reports; JRC: Brussels, Belgium, 2008. [Google Scholar]
  25. Mabande, P.K. Application of a Satellite Based Rainfall-Runoff Model for Large Scale Flood Simulation: A Case Study of Cuvelai Basin in Namibia; University of Twente: Enschede, The Netherlands, 2011. [Google Scholar]
  26. Koriche, S.A. Remote Sensing Based Hydrological Modeling for Flood Early Warning in the Upper and Middle Awash River Basin; University of Twente: Enschede, The Netherlands, 2012. [Google Scholar]
  27. Komi, K. Flood Risk Assessment in Poorly Gauged River Basins—A Case Study of the Oti River Basin, Togo, West Africa. Ph.D. Thesis, University of Abomey-Calavi, Abomey-Calavi, Benin, 2016. [Google Scholar]
  28. Thiemig, V.; Bisselink, B.; Pappenberger, F.; Thielen, J. A pan-African mediumrange ensemble flood forecast system. Hydrol. Earth Syst. Sci. 2015, 19. [Google Scholar] [CrossRef]
  29. Mahé, G. Surface/groundwater interactions in the Bani and Nakambe rivers, tributaries of the Niger and Volta basins, West Africa. Hydrol. Sci. J. 2009, 54, 704–712. [Google Scholar] [CrossRef] [Green Version]
  30. Mahé, G.; Dray, A.; Paturel, J.E.; Cres, A.; Koné, F.; Manga, M.; Crès, F.N.; Djoukam, J.; Maiga, A.A.H.; Ouédraogo, M.; et al. Climatic and anthropogenic impacts on the flow regime of the Nakambé River in Burkina. In Proceedings of the FRIEND 2002 Regional Hydrology: Bridging the Gap between Research and Practice, Cape Town, South Africa, 18–22 March 2002; pp. 69–76. [Google Scholar]
  31. Leduc, C.; Favreau, G.; Schroeter, P. Long terms rise in a Sahelien water-table: The continental Terminal in South-West Niger. J. Hydrol. 2001, 243, 43–54. [Google Scholar] [CrossRef]
Figure 1. Catchment of the Bétérou River.
Hydrology 05 00069 g001
Figure 2. Observed precipitations and regional climate model (REMO) corrected precipitations scenarios.
Hydrology 05 00069 g002
Figure 3. Observed temperature and REMO corrected temperature scenarios.
Hydrology 05 00069 g003
Figure 4. Daily mean precipitation and temperature.
Hydrology 05 00069 g004
Figure 5. Land Use/Cover map for reference period 2003. The different land use types are forest-deciduous (FRSD), forest-mixed (FRST), range-bush (RNGB), agriculture (AGRL), forest-evergreen (FRSE), range-grasses (RNGE), pasture (PAST), and urban area (URML).
Hydrology 05 00069 g005
Figure 6. Change in land use scenario. The different land use types are forest-deciduous (FRSD), forest-mixed (FRST), range-bush (RNGB), agriculture (AGRL), forest-evergreen (FRSE), range-grasses (RNGE), water bodies (WATR), pasture (PAST), and urban area (URML).
Hydrology 05 00069 g006
Figure 7. Land use/cover scenarios. The different land use types are forest-deciduous (FRSD), forest-mixed (FRST), range-bush (RNGB), agriculture (AGRL), forest-evergreen (FRSE), range-grasses (RNGE), water bodies (WATR), pasture (PAST), and urban area (URML).
Hydrology 05 00069 g007
Figure 8. Comparison between simulated and observed hydrographs.
Hydrology 05 00069 g008
Figure 9. Monthly mean discharge scenarios based on climate and land use/cover combined scenarios.
Hydrology 05 00069 g009
Figure 10. Time horizon annual total runoff relative change for different time horizons and following different climate and land use combined scenarios.
Hydrology 05 00069 g010
Figure 11. Annual total runoff change based on climate and land use combined scenarios. In each box, the central mark is the median, the edges of the box are the 25th and 75th percentiles and the whiskers extend to the most extreme data points not considered outliers.
Hydrology 05 00069 g011
Table 1. Land use/cover classes, their area, and percentage of total area for the Ouémé-Bétérou catchment (10,076 km2). Land use categories displayed in table are the most important land classes in the study area.
Land Use CategoriesLand Use CodeArea (km2)Percentage of Total Area
Forest-deciduousFRSD42.980.43
Forest-mixedFRST1580.1415.68
Range-brushRNGB5515.7254.74
Agricultural Land-GenericAGRL2459.2724.41
Forest-evergreenFRSE261.742.60
Range-grassesRNGE72.890.72
ResidentialURML31.240.31
Table 2. Climate and Land use/cover changes scenarios.
RCP4.5RCP8.5
LUALUA + RCP4.5LUA + RCP8.5
LUBLUB + RCP4.5LUB + RCP8.5
Table 3. LISFLOOD performances values.
CalibrationValidation
RMSE [m3/s]NSE [%]RMSE [m3/s]NSE [%]
37.2192%32.390.5%
Table 4. Model calibrated parameters.
Parameter NamesOptimum ValueParameters Range *
Upper zone time constant51–50
Lower zone time constant110050–5000
Ground water percolation value0.350–1.5
Xinanjiang parameter b0.80.1–1
Power preferential flow21–6
* Source: Default values parameters range [24].

