Article

Analysing the Potential of OpenStreetMap Data to Improve the Accuracy of SRTM 30 DEM on Derived Basin Delineation, Slope, and Drainage Networks

by
Elisabete S.V. Monteiro
1,
Cidália C. Fonte
2 and
João L.M.P. de Lima
3,*
1
UDI—Research Unit for Inland Development—Polytechnic Institute of Guarda/Institute for Systems Engineering and Computers at Coimbra, 3030-290 Coimbra, Portugal
2
Department of Mathematics, University of Coimbra/Institute for Systems Engineering and Computers at Coimbra, 3030-290 Coimbra, Portugal
3
Department of Civil Engineering, Faculty of Science and Technology of the University of Coimbra/MARE—Marine and Environmental Sciences Centre at Coimbra, 3004-517 Coimbra, Portugal
*
Author to whom correspondence should be addressed.
Hydrology 2018, 5(3), 34; https://doi.org/10.3390/hydrology5030034
Submission received: 1 June 2018 / Revised: 2 July 2018 / Accepted: 17 July 2018 / Published: 18 July 2018
(This article belongs to the Special Issue Remote Sensing in Hydrological Modelling)

Abstract

:
Terrain slope and drainage networks are useful components to the basins morphometric characterization as well as to hydrologic modelling. One way to obtain the slope, drainage networks, and basins delineation is by their extraction from Digital Elevation Models (DEMs) and, therefore, their accuracy depends on the accuracy of the used DEM. Regional DEMs with high detail and accuracy are produced in many countries by National Mapping Agencies (NMA). However, the use of these products usually has associated costs. An alternative to those DEMs are the Global Digital Elevation Models (GDEMs) that can be accessed freely and cover almost the entire surface of the world. However, they are not as accurate as the regional DEMs obtained with other techniques. This study intends to assess if generating new, modified DEMs using altimetric data from the original GDEMs and the watercourses available for download in the collaborative project OpenStreetMap (OSM) improves the accuracy of the rebuilt DEMs, the slope derived from them, as well as the delineation of basins and the horizontal and vertical accuracy of the extracted drainage networks. The methodology is presented and applied to a study area located in the United Kingdom. The GDEMs used are of 30 m spatial resolution from the Shuttle Radar Topography Mission (SRTM 30). The accuracy of the original data and the data obtained with the proposed methodology is compared with a reference DEM, with a spatial resolution of 50 m, and the rivers network available at the Ordnance Survey website. The results mainly show an improvement of the horizontal accuracy of the drainage networks, but also a decrease of the systematic errors of the new DEMs, the derived slope, and the vertical position of the drainage networks, as well as the basin’s identification for a set of pour points.

1. Introduction

The use of Digital Elevation Models (DEMs) in hydrological analysis is standard procedure nowadays [1]. From DEMs topographic parameters may be extracted, namely drainage networks, slopes, and basins, which are necessary for basin characterization and for hydrologic studies and are normally used for distributed hydrological simulation [2,3,4]. The hydraulic and hydrological models are strongly dependent of the accuracy of elevation data [5] because the behaviour of the water along the physical space is controlled by relief [1,6]. It should be noted that the techniques of data acquisition suffered a rapid evolution in the last decades, which enabled the increase in the accuracy of the DEMs. For example, the satellite sensors in the visible, infrared and microwave ranges can be used to monitor rivers and to delineate flood zones [7]. These methods are generally used only over large rivers or areas of inundation in order to detect changes at the pixel level. Unmanned Aerial Systems (UAS) can describe river dynamics, but with a level of detail that is several orders of magnitude greater and can enable distributed flow measurements over any river system and in difficult-to-access environments [8].
Nevertheless, like all datasets, the DEMs have errors, which propagate to the topographic parameters extracted from them, and in particular to the drainage networks [9]. Therefore, it is relevant to improve the accuracy of the available DEMs, as well as the accuracy of the drainage networks and other topographic parameters extracted from them.
Two Global Digital Elevation Models (GDEMs), covering almost the entire world, are available and can be downloaded with no costs from the Jet Propulsion Laboratory of National Aeronautics and Space Administration (NASA) webpage. These are the Advanced Spaceborn Thermal Emission and Reflection Radiometer (ASTER) [10], with a 30 m spatial resolution, and the Shuttle Radar Topography Mission (SRTM) [11] DEM, with available spatial resolutions of 30 and 90 m [12]. These datasets are in grid format, where the attribute of each cell/pixel is elevation. ASTER is acquired by photogrammetric methods [13] and SRTM is generated using interferometric synthetic aperture radar (InSAR) technology [14]. In previous studies it was shown that the drainage networks extracted from the 90 m resolution SRTM had better positional accuracy than the ones extracted from ASTER, e.g., [15] or [16]. Therefore, as SRTM altimetric data showed to have higher quality and the SRTM DEM is now available with 30 m spatial resolution (SRTM 30), in this work only the SRTM 30 was tested.
Another type of geospatial information freely available for the entire world is the data collected in the collaborative project OpenStreetMap (OSM). The volunteer citizens may create vector data, using a diversity of available feature types, such as rivers, streets, buildings or points of interest, which are represented by points, lines and relations. A list of the features proposed by OSM is available in [17]. OSM data are structured by tags, containing a key and a value. The features that represent watercourses are used in this study, and are characterized by the key “waterway”, which may take several values, such as “rivers”, “streams”, or “riverbank”.
The OSM project became a rapidly growing crowdsourced mapping initiative [18] that has attracted a significant research attention [19]. The data is created by volunteers, which have very different levels of experience and skills in the domain of geographical information. Even though OSM contains approaches to control the quality of the collected data, there are always errors in the data, which may be of several types, e.g., [20,21,22]. Therefore, several aspects related to the quality of OSM data have been studied in different regions of the world. For example, in some regions (mainly central Europe and some regions of North America) OSM is a rich source of data, containing, in some cases, data that is not available in official datasets. However, there are sometimes inconsistencies, as well as heterogeneity of data regarding, for example, data completeness and positional quality, e.g., [23,24,25,26]. Nevertheless, one of the features that the volunteers introduce first in OSM are water bodies, such as rivers, and lakes, as these are important terrain features. Figure 1 illustrates this aspect with two examples, one in Brazil–South America (Figure 1a), and the other in Angola–Africa (Figure 1b), where it can be seen that very few data is available besides water features.
In [16] it was shown that the watercourses of OSM in a few case studies proved to have a better positional accuracy than the drainage networks extracted from the ASTER and the 90 m spatial resolution SRTM DEM. A subsequent study [27] presents a methodology to create a DEMs using the OSM watercourses and elevation points extracted from GDEMs. The study was applied in two study areas and the results showed that the positional accuracy of the drainage networks extracted from the rebuilt DEMs was better than the positional accuracy of the drainage networks extracted from the original GDEMs. This result motivated the present study where it is analysed if a DEM created with the same methodology, using elevation points extracted in this case from SRTM 30 and the OSM water features, not only improves the horizontal positional accuracy of the extracted drainage networks, but also the vertical accuracy of the drainage network, the accuracy of the DEM itself as well as the accuracy of other parameters, including slope and basin delineation.
The article is structured as follows: in Section 2 the study area and data used are presented. The proposed methodology is described in Section 3 and the results are presented and discussed in Section 4. Finally, some conclusions are drawn in Section 5.

2. Study Area and Data

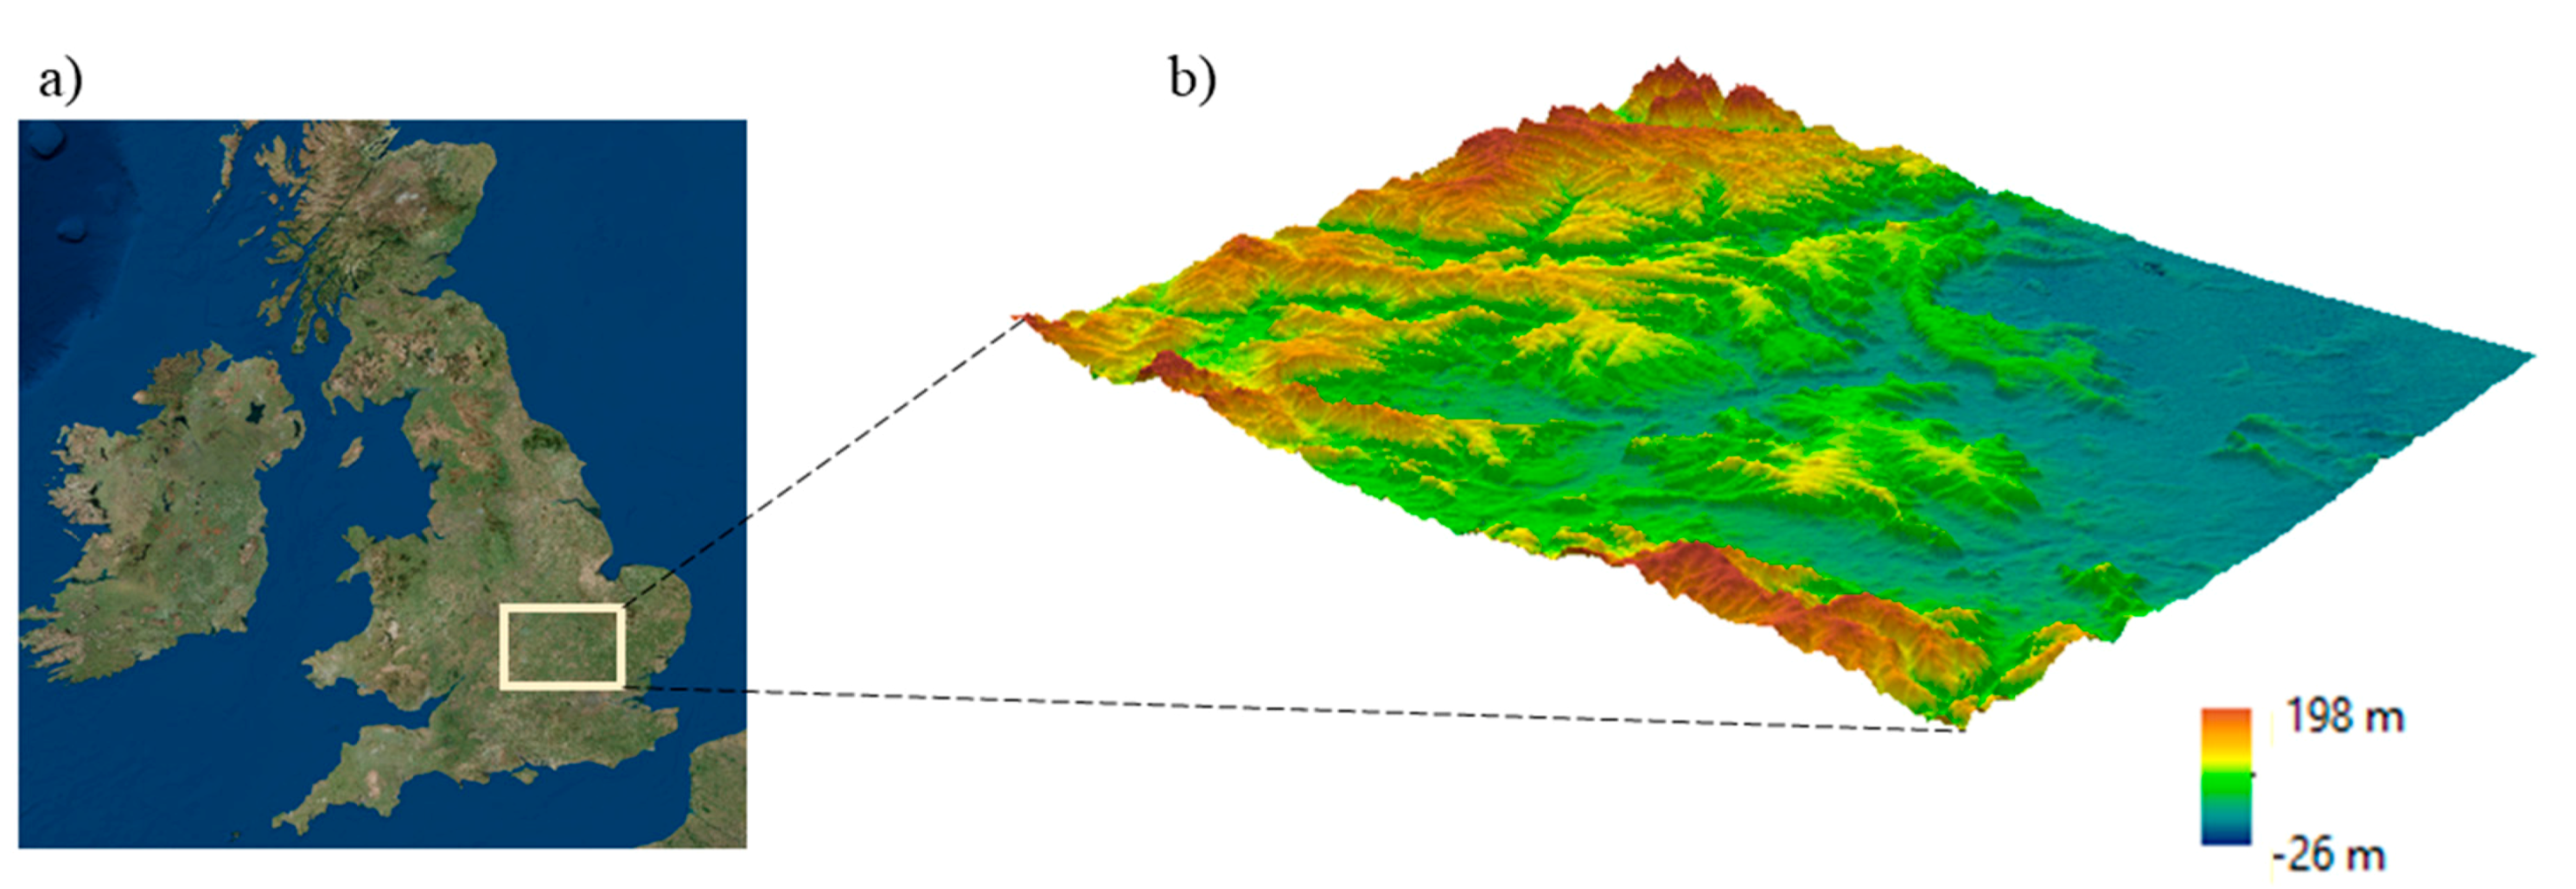
The study was applied to a rectangular region with 13,899 km2, located in the United Kingdom, with a maximum and minimum elevation of 198 m and −26 m, respectively. The region is characterized by zones with different characteristics in terms of relief. Figure 2 shows the location of the study area and a 3D visualization of SRTM 30 for that region.

2.1. Data

The datasets used in the present study are: (1) the SRTM 30 DEM for the study area; (2) the waterways extracted from OSM, corresponding to the key “waterway” and values “rivers” and “streams”; and (3) the drainage network of Great Britain and a DEM, with a spatial resolution of 50 m, both datasets available in Ordnance Survey web page, used as reference data.

2.1.1. Digital Elevation Models

SRTM 30 was downloaded in grid format from the US Geological Survey website [11] and is available in geographic coordinates in the World Geodetic System 1984 (WGS84) and the vertical datum EGN96 (Earth Gravitational Model 1996).
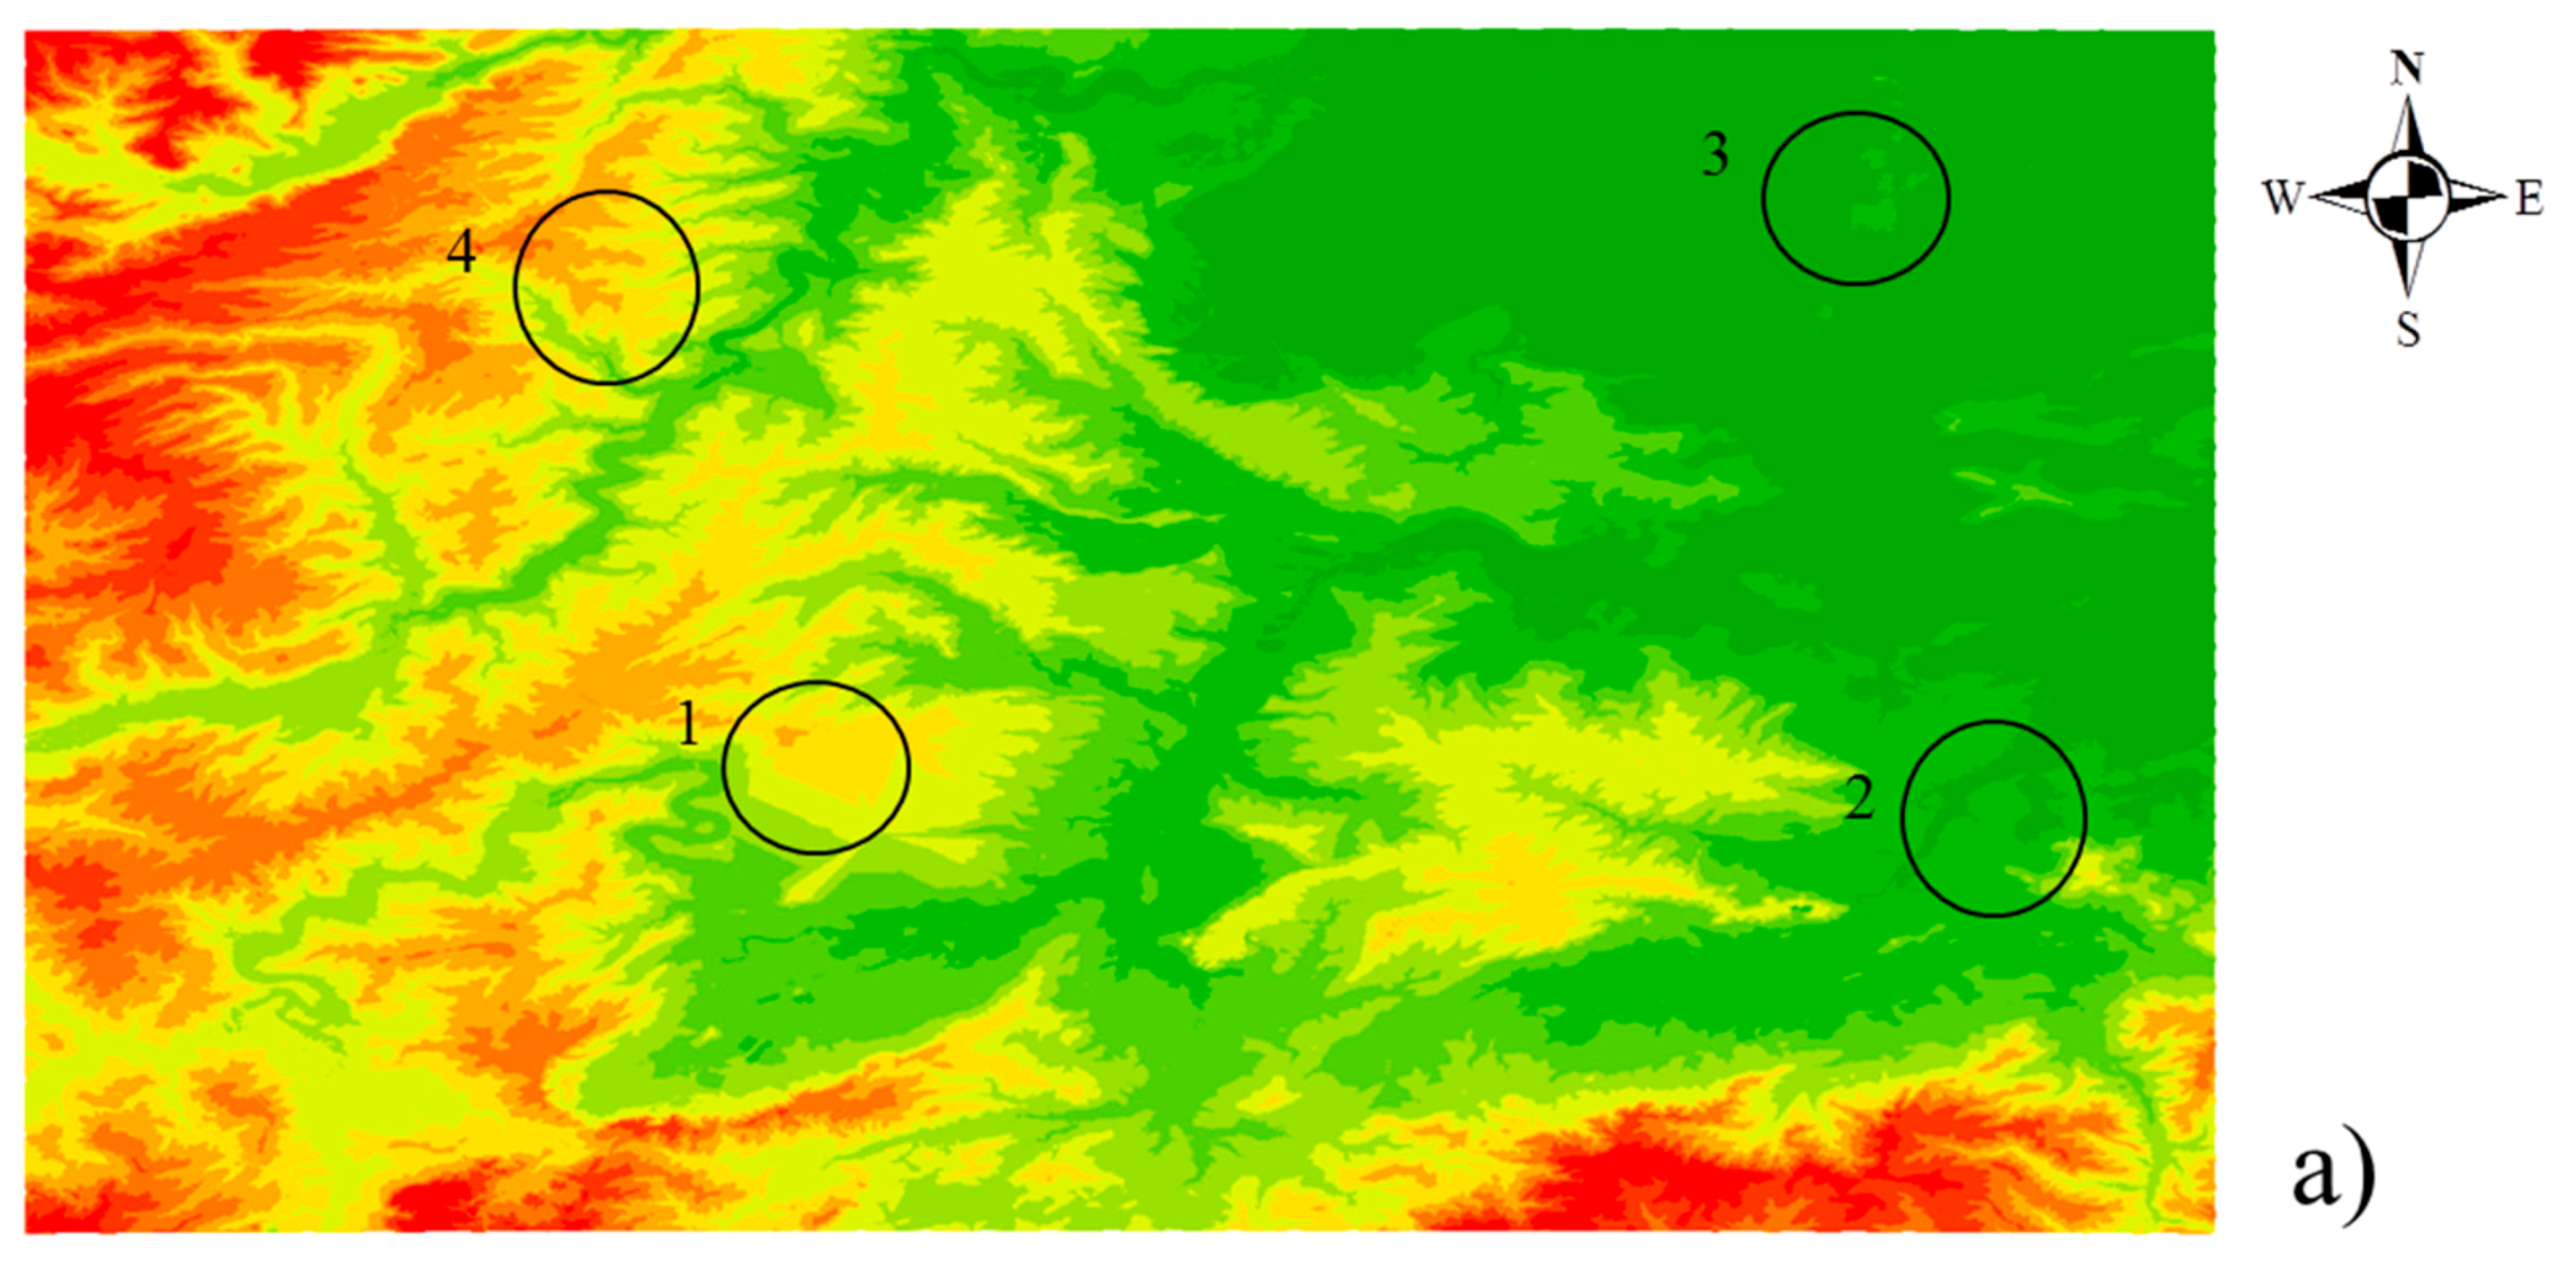
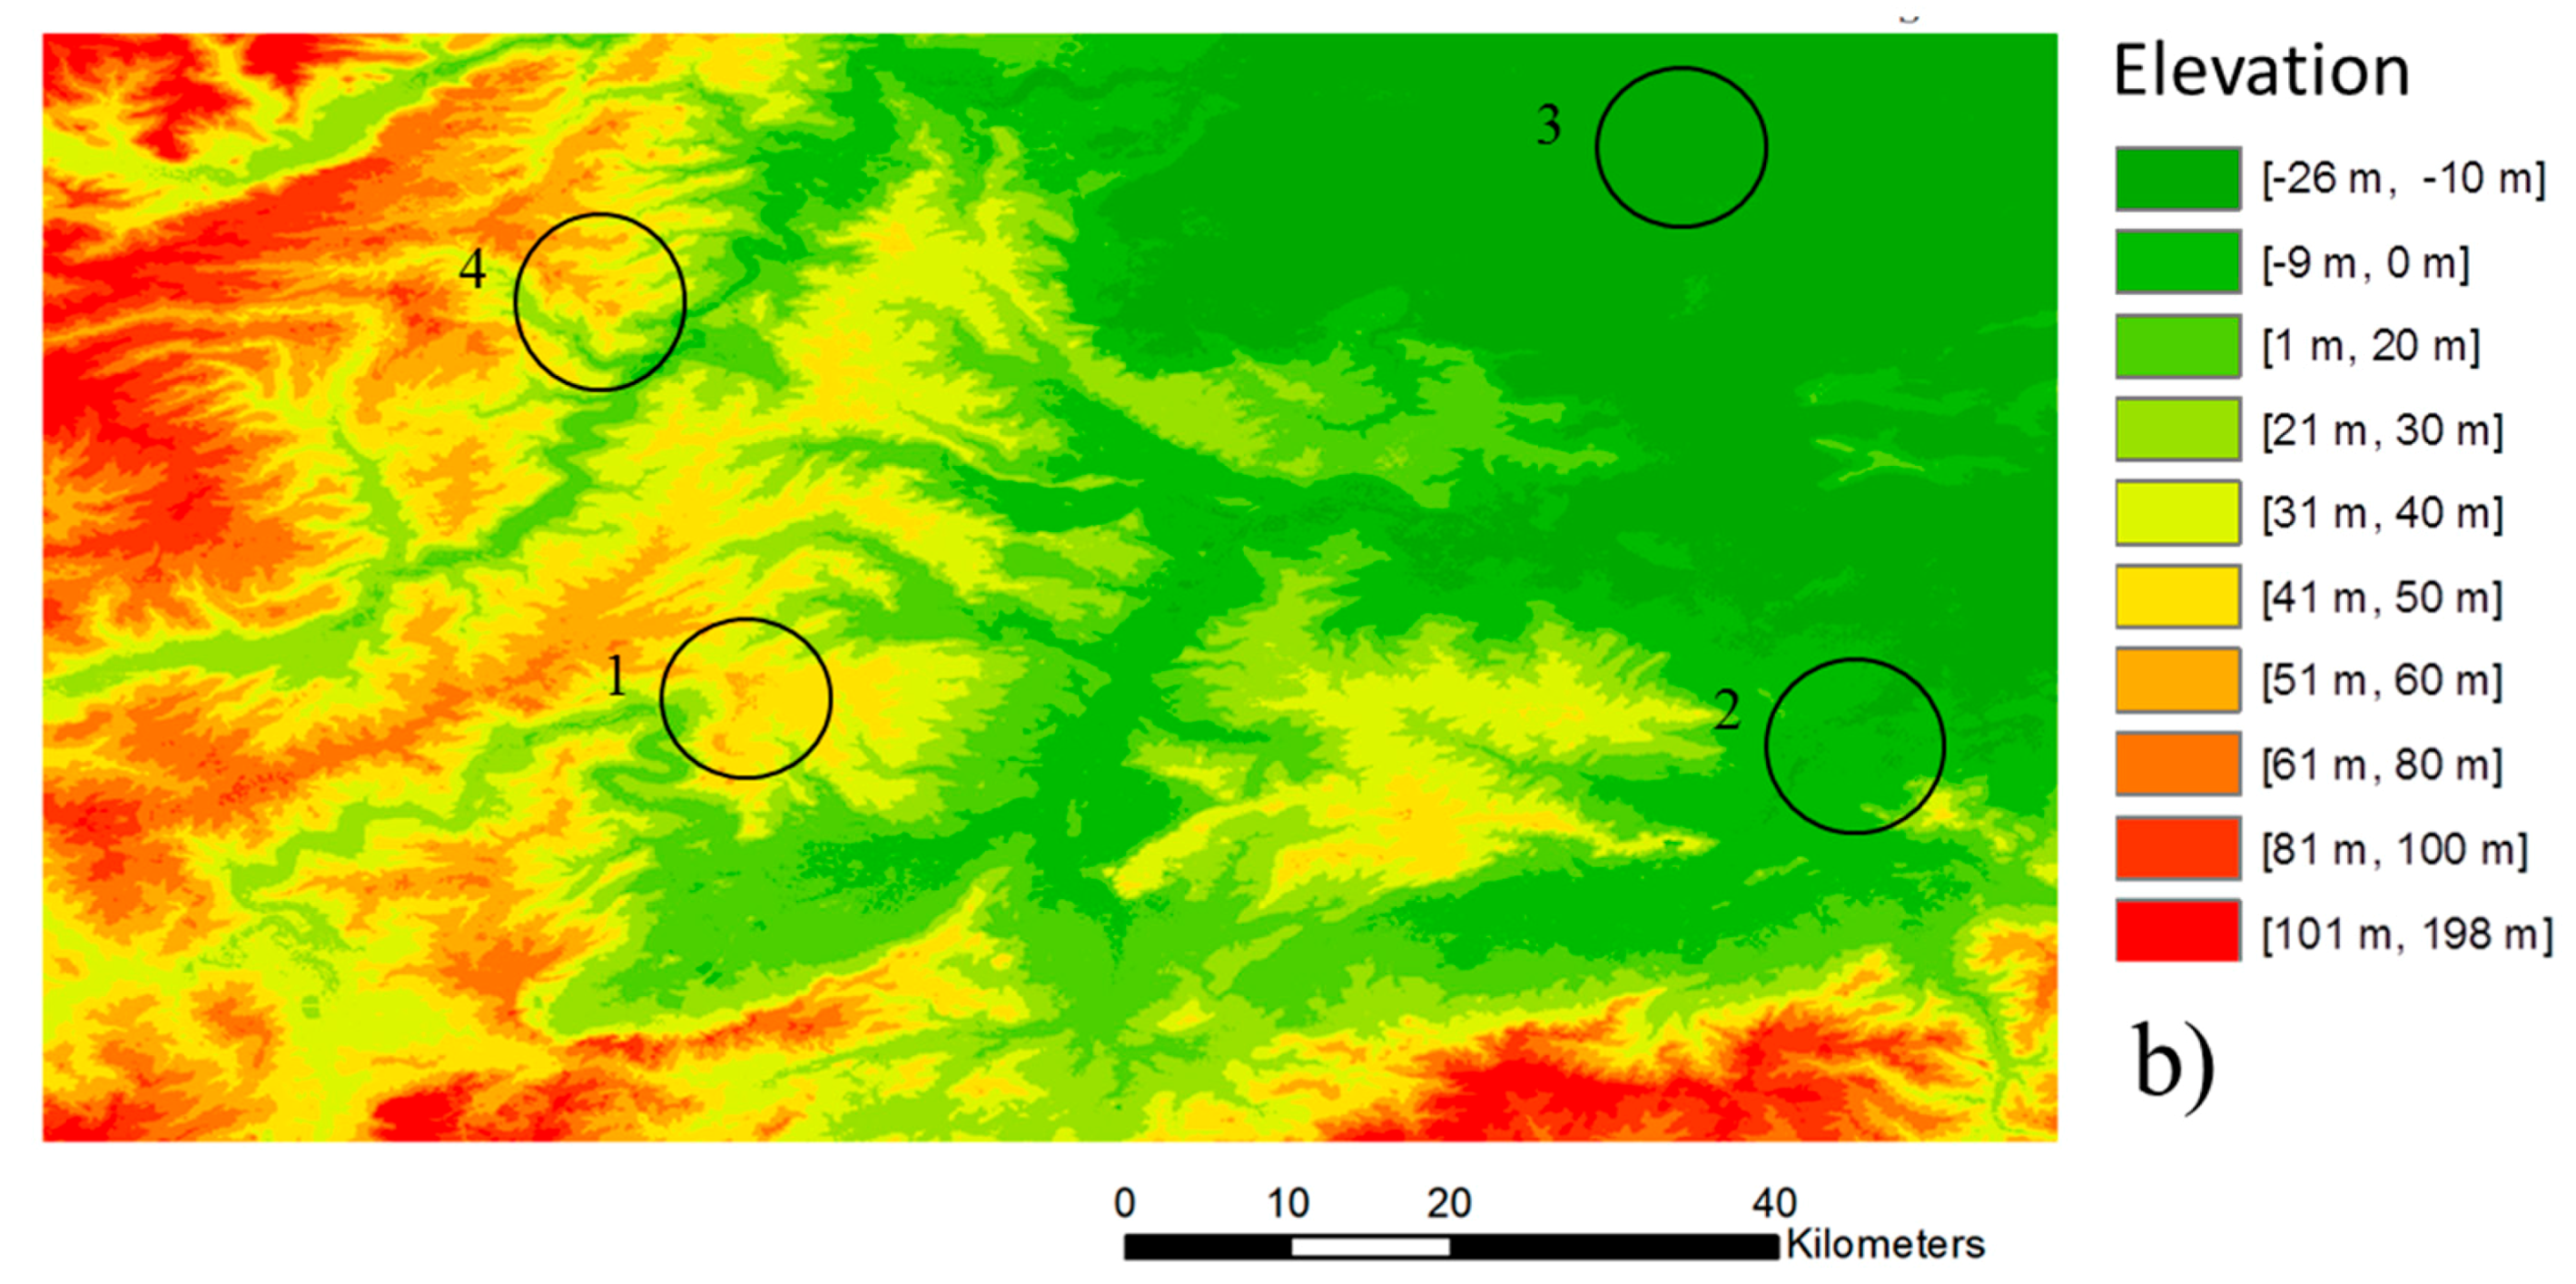
A reference DEM was downloaded from the Ordnance Survey web page [28], which is the National British Mapping Agency of United Kingdom, also in grid format, with a spatial resolution of 50 m and the vertical datum Newlyn 1915. This DEM was used as a reference because, even though it has lower spatial resolution than SRTM 30: (1) it was obtained with photogrammetric approaches using large-scale aerial imagery; and (2) according to information available from the Ordnance Survey web page, it has a root mean square error (RMSE) of 4 m, computed using ground reference points, which is higher than the RMSE of SRTM 30, which was proven to be around 10 m, e.g., [29,30,31]. Figure 3 shows the reference DEM and SRTM 30 for the study area. A closer analysis of Figure 3 enables the identification of some differences in both DEMs, for example, in the regions numbered from 1 to 4 identified by the black circles.

2.1.2. Watercourses

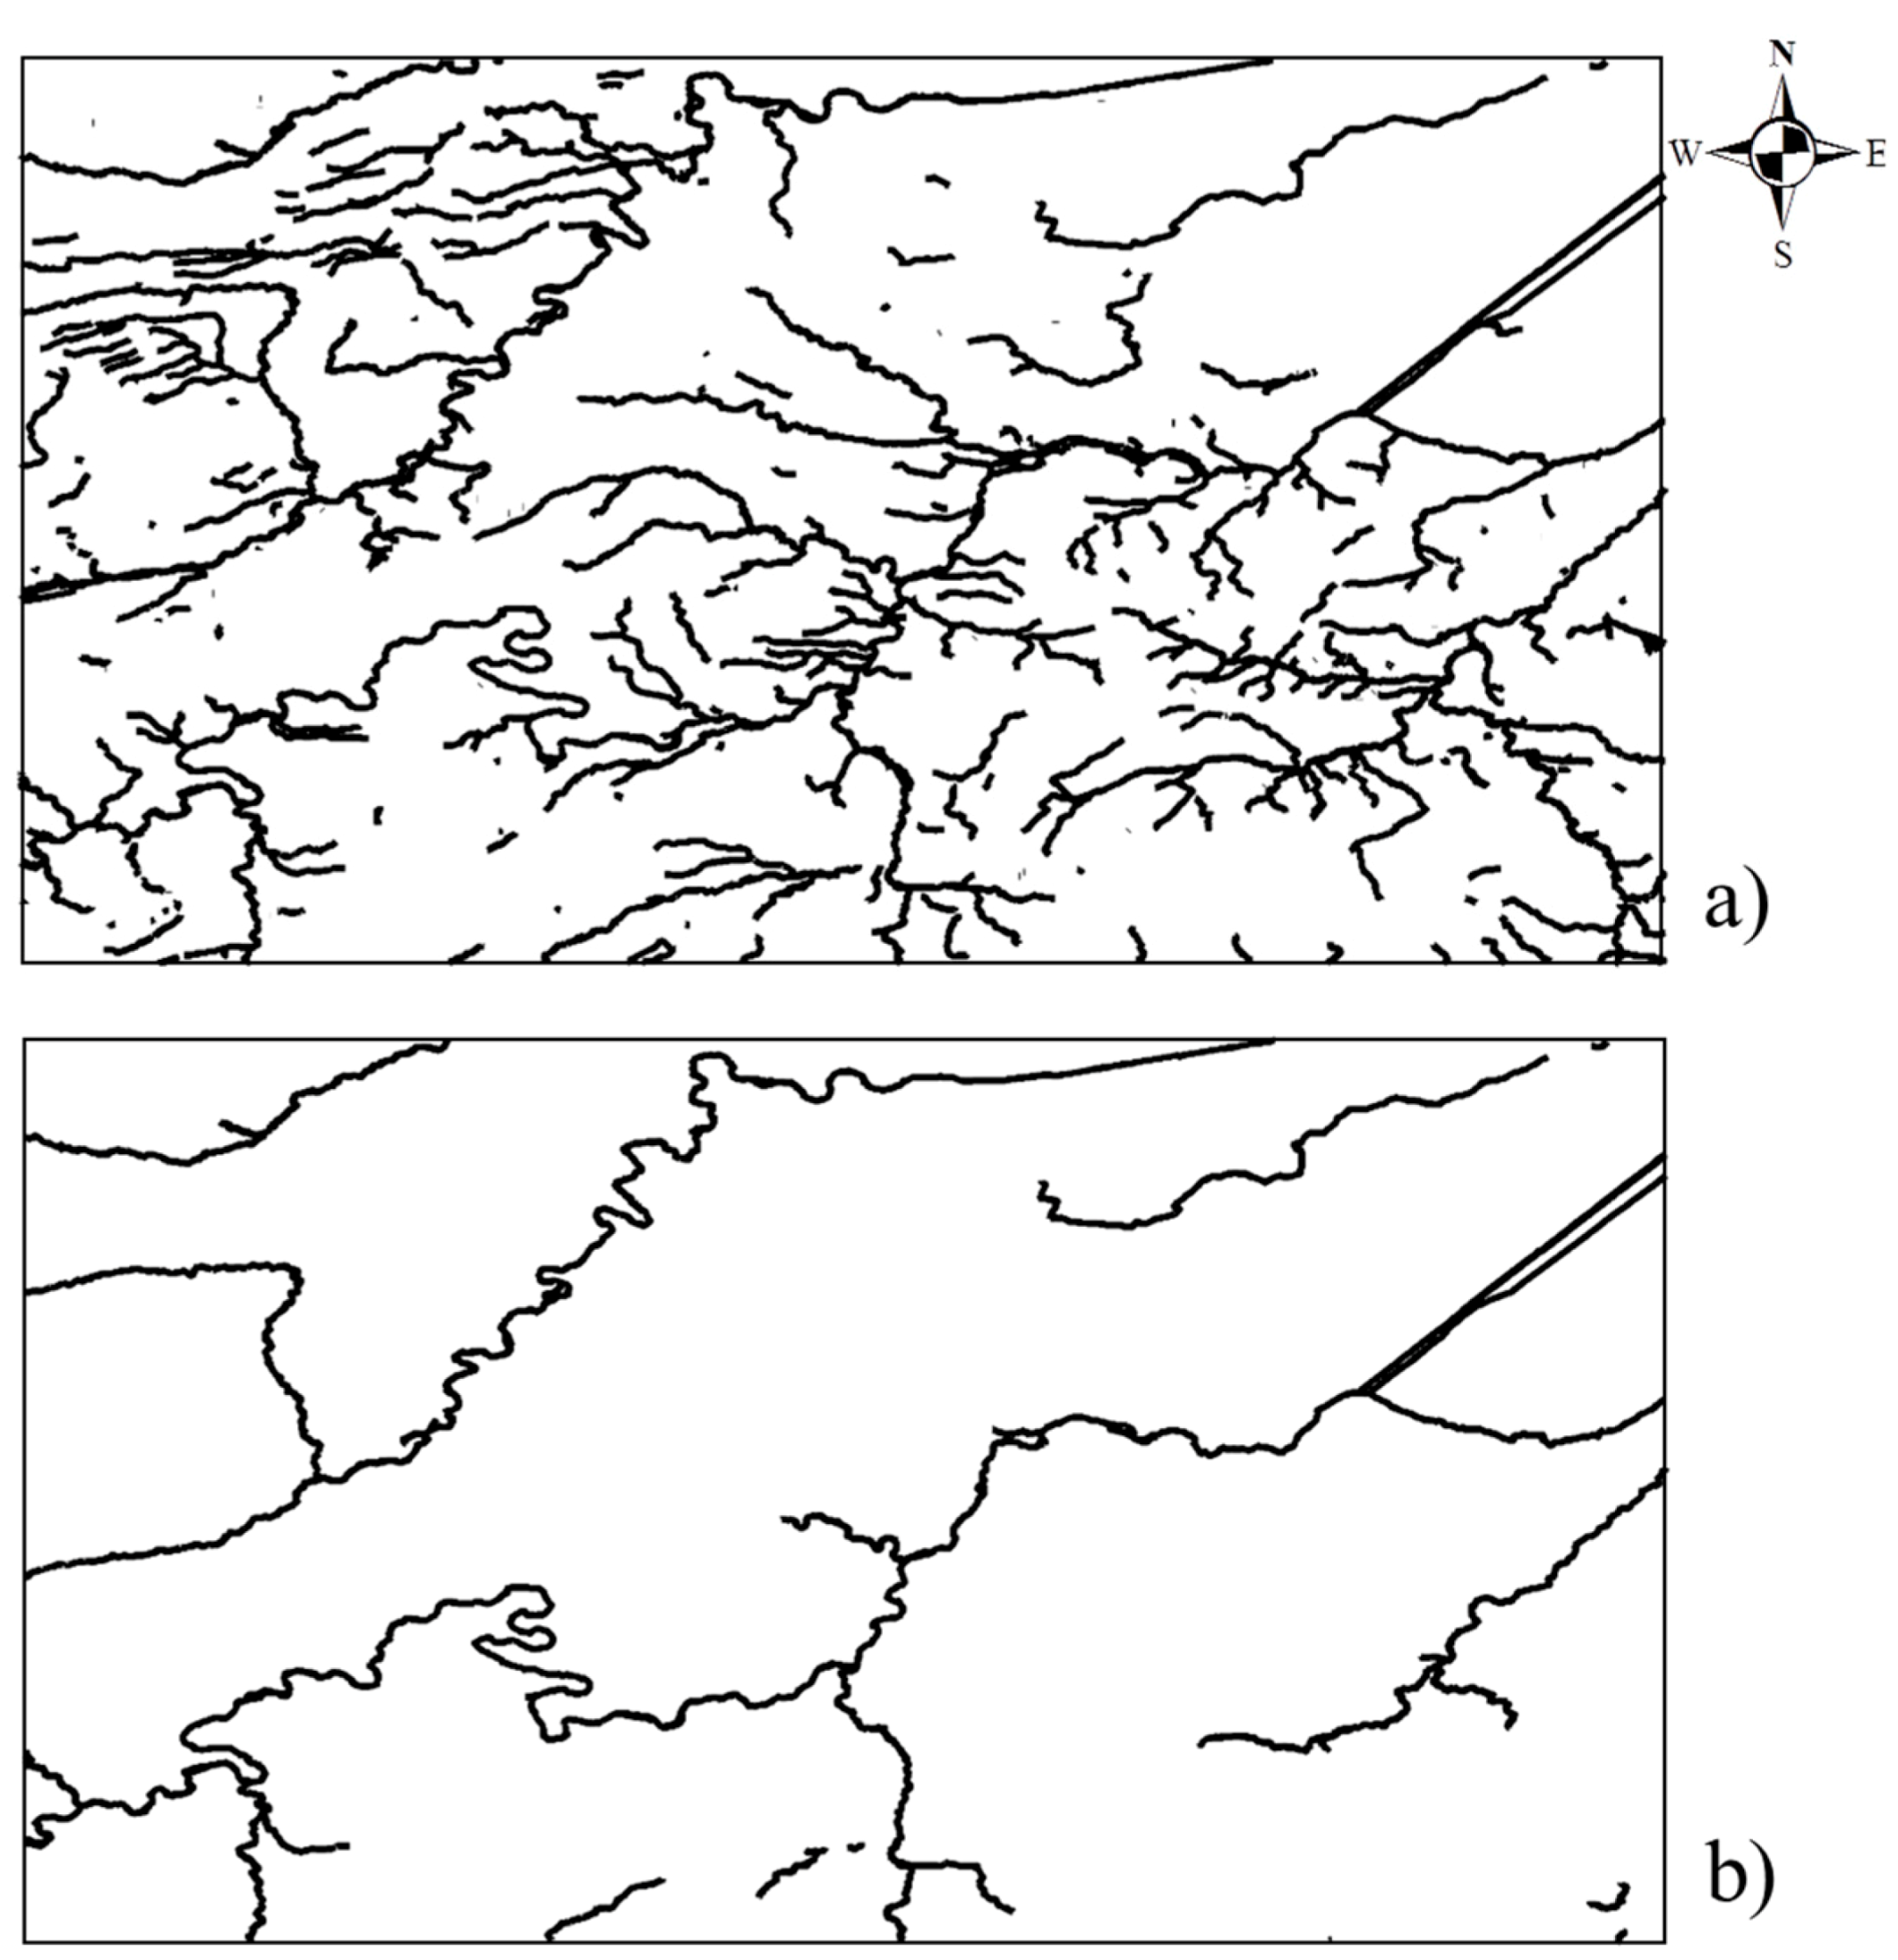
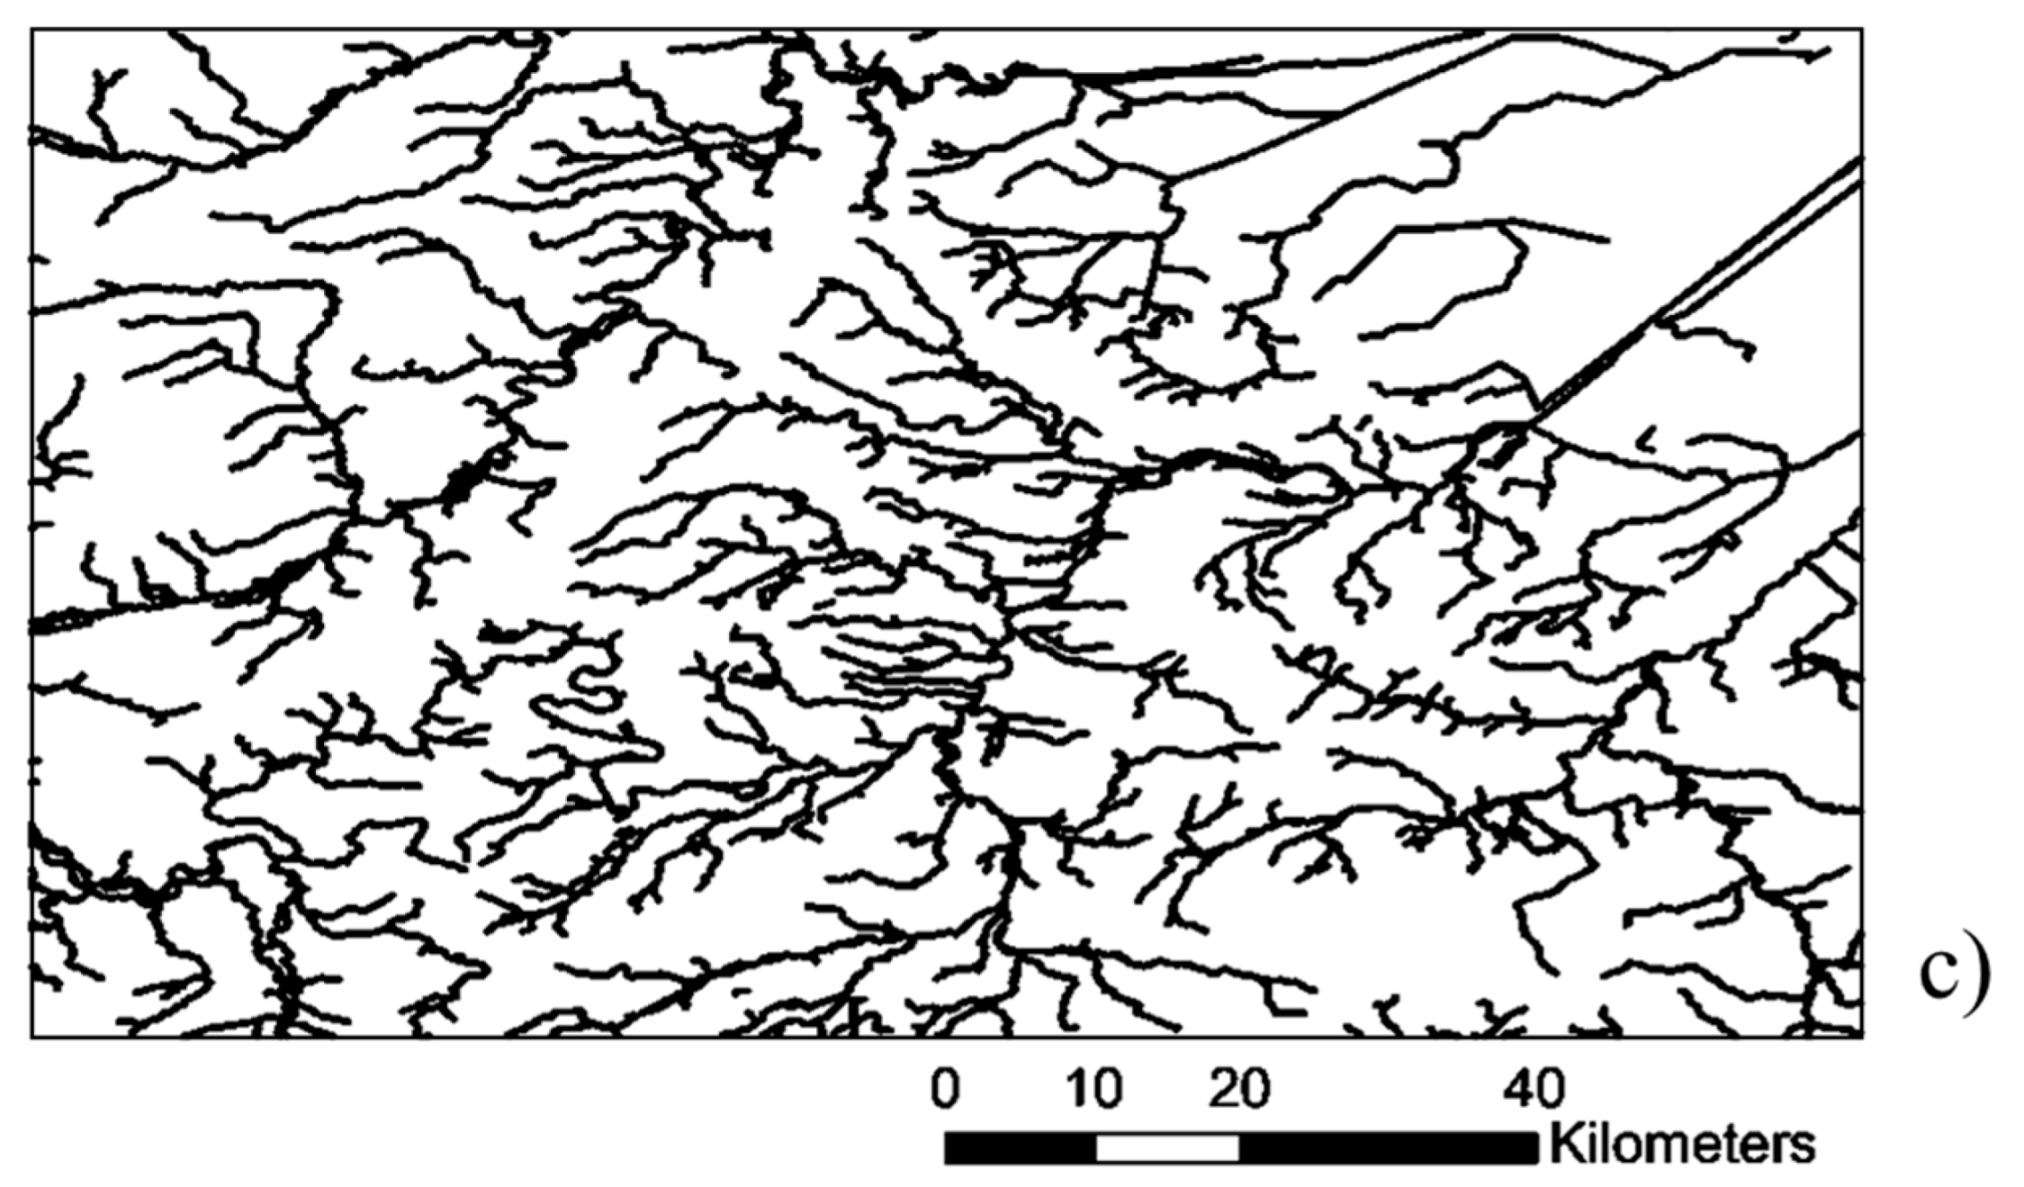
The OSM data was downloaded in shapefile format from Geofabrick on 8 September 2015. The downloaded OSM data contained all features available for the study area. From these, the features corresponding to the key “waterways” and values “rivers” and “streams” were selected, which correspond to natural water courses. Features with other values, such as “canal” or “ditch” were not considered. Figure 4a shows the OSM watercourses corresponding to the keys “rivers” and “streams” and Figure 4b shows only the rivers. It can be seen that the drainage network shown in Figure 4a presents many incomplete discontinuous branches, while the rivers (Figure 4b) are, in most cases, represented by continuous lines.
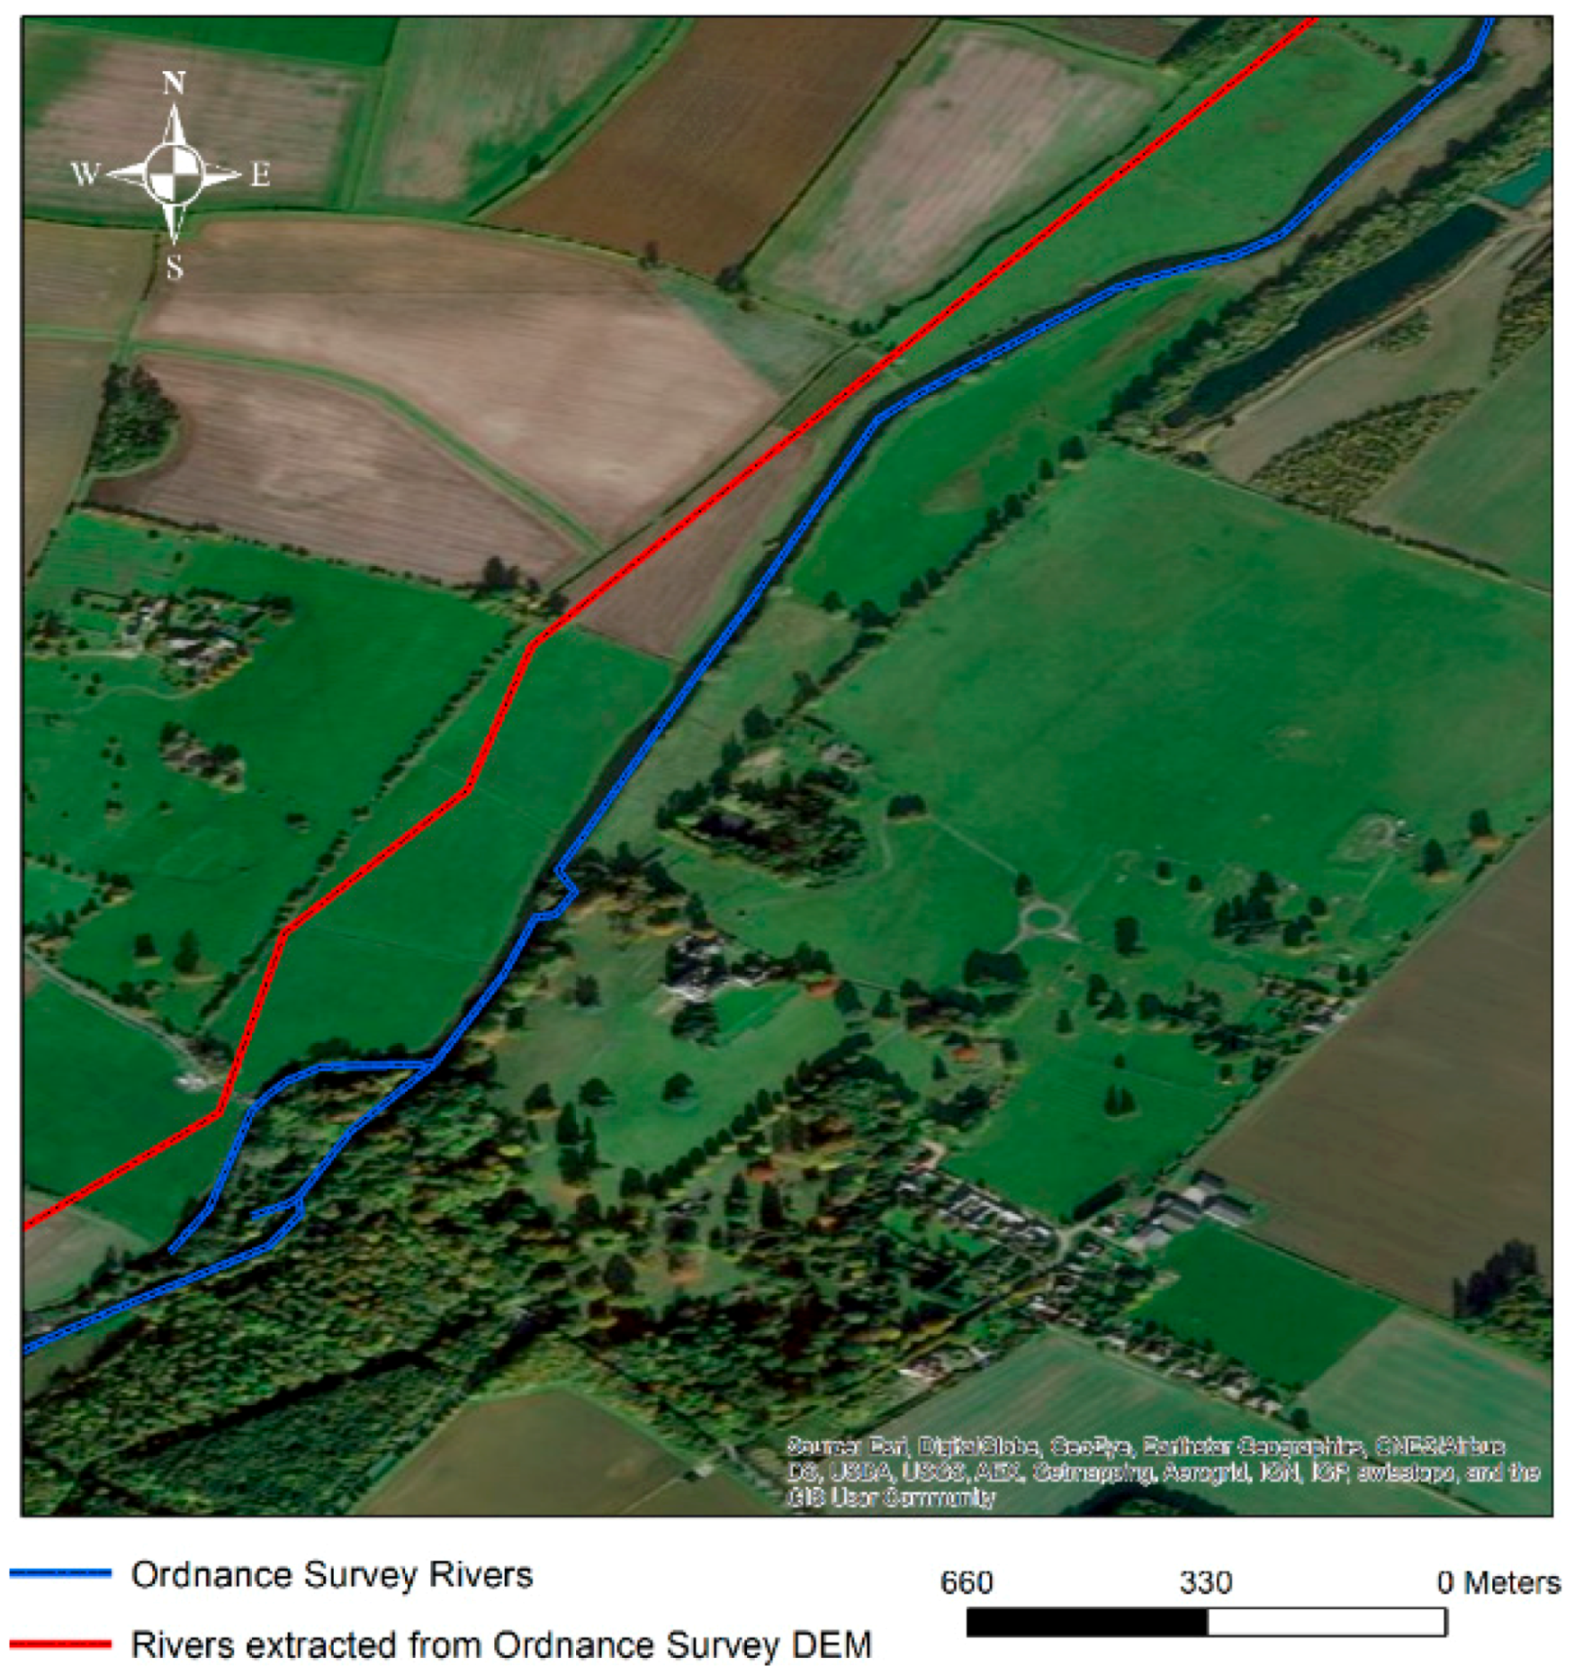
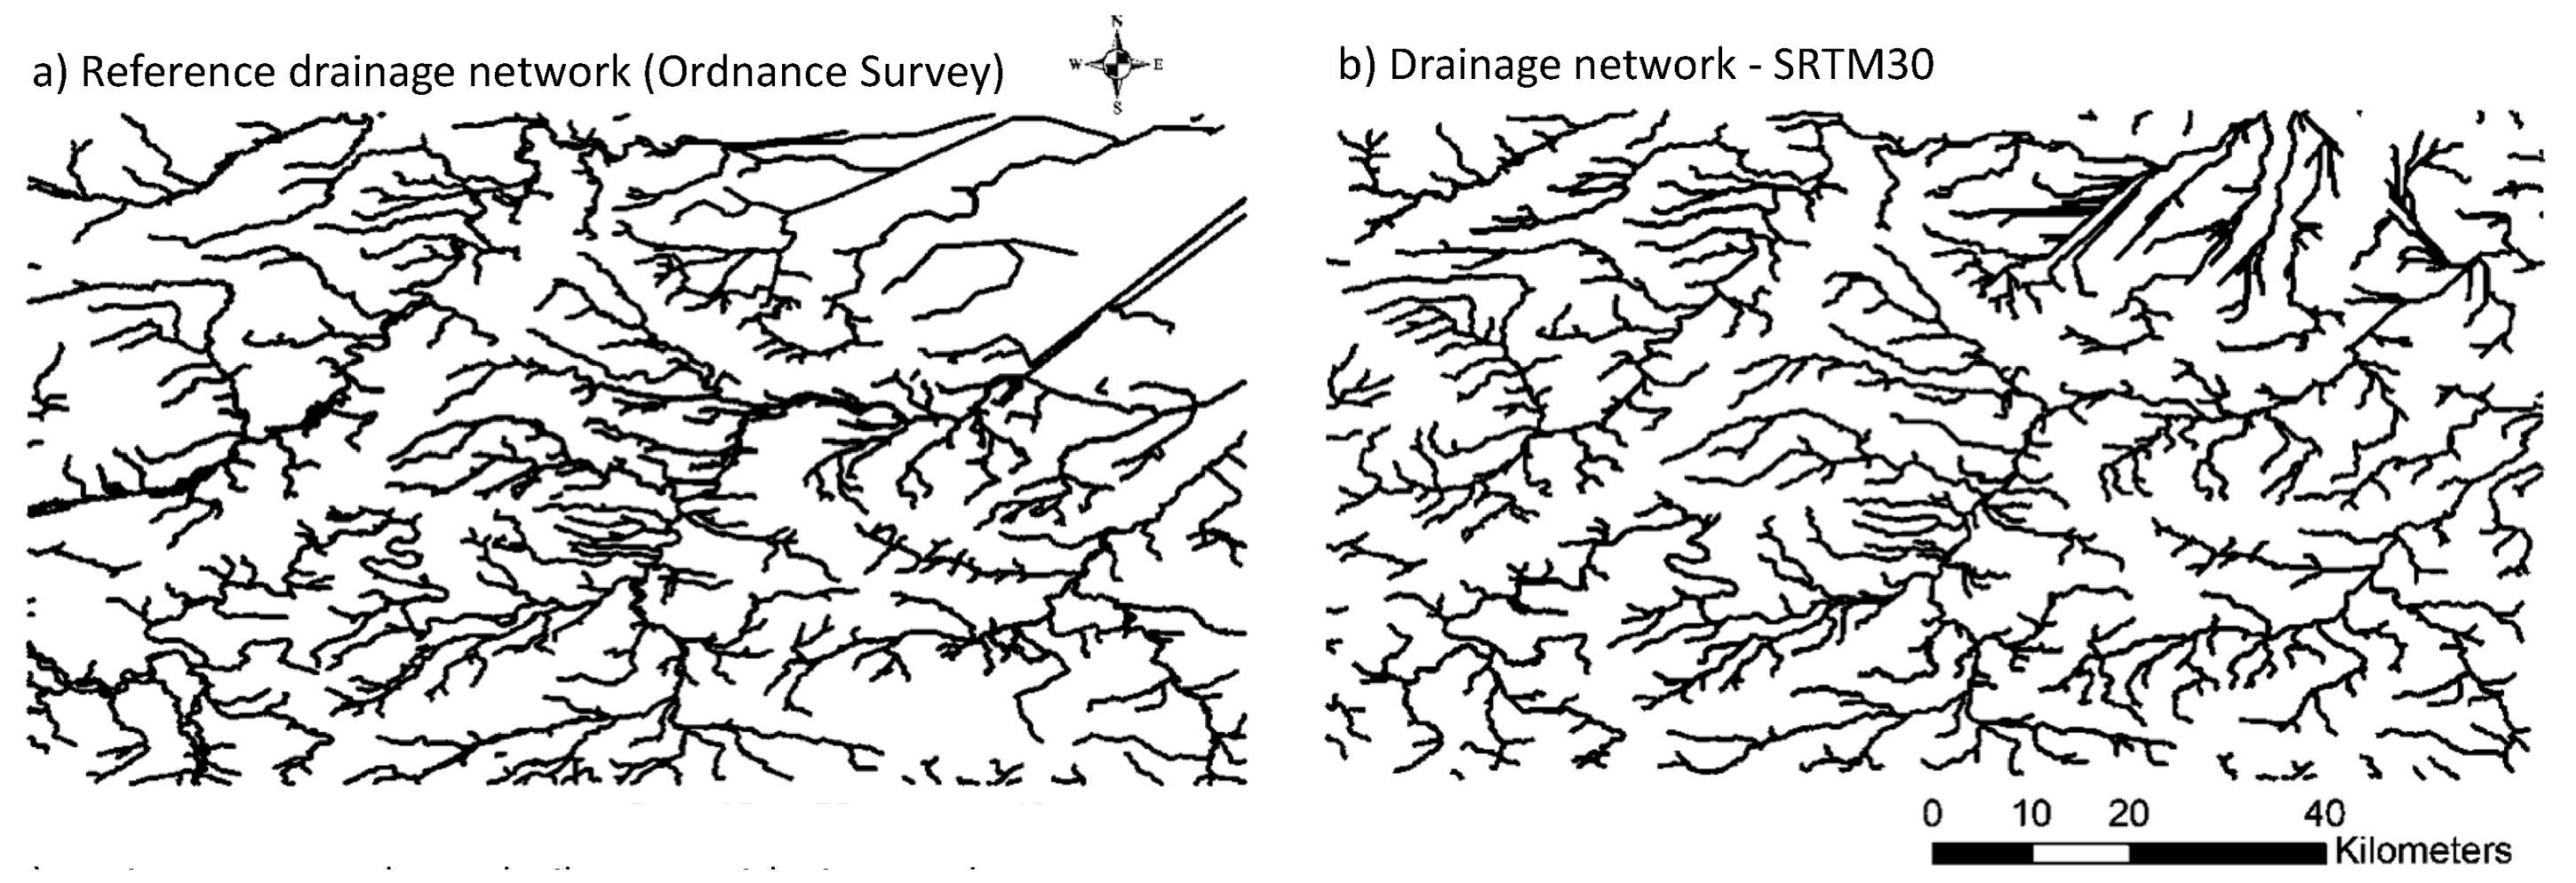
The reference drainage network of the study area, shown in Figure 4c, was downloaded from the Ordnance Survey [32]. This network is formed by 144,000 km of watercourses. These data are in ESRI shapefile format, at scales ranging from 1/15,000 to 1/30,000. The option of using the drainage network available from the Ordnance Survey web page as reference data instead of the one extracted from the reference DEM is justified due to the influence that the spatial resolution of the reference DEM (50 m) has over the accurate horizontal position of the drainage network, as can be seen in Figure 5, which shows a detail of the network extracted from the DEM and the network available in the Ordnance Survey website over a satellite image, showing that the position of the second one is more accurate.

3. Methodology

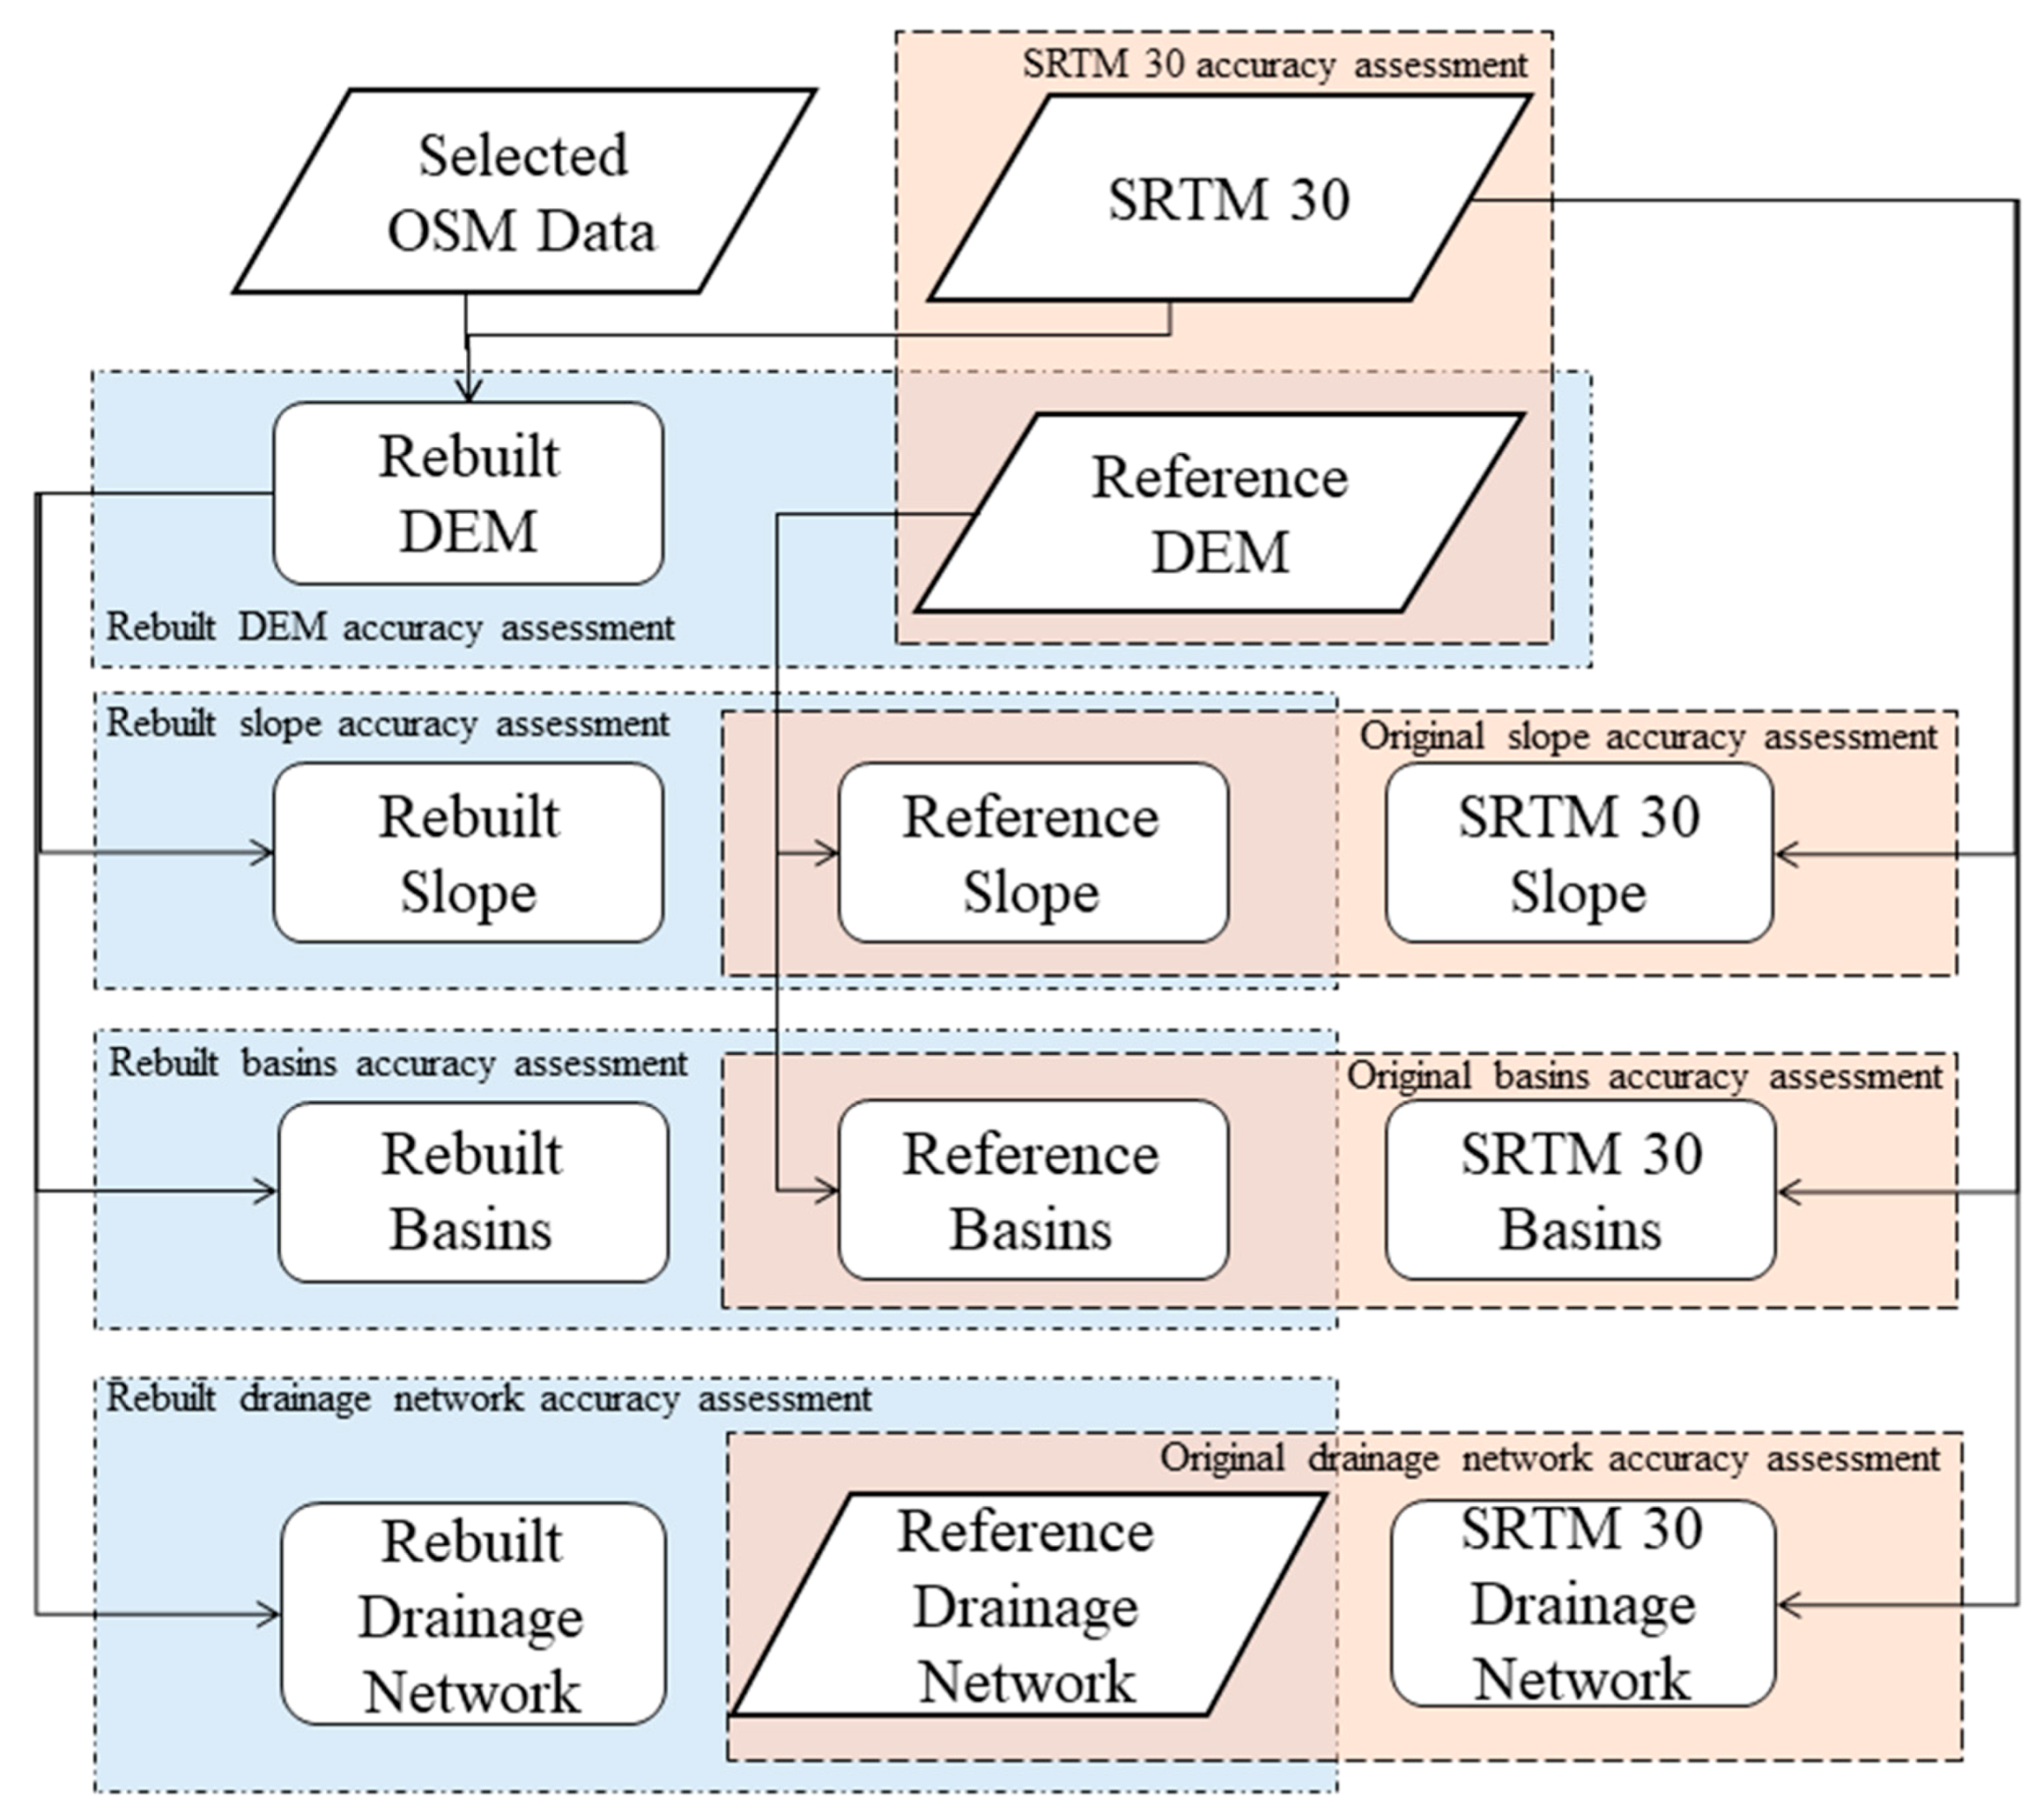
The general methodology applied in this study can be divided into the following sequence of steps: (1) OSM data preparation; (2) creation of a rebuilt DEM using elevation points derived from SRTM 30 and the OSM data; (3) extraction the drainage networks, slopes, and basin limits from the original and rebuilt DEMs; and (4) assess the accuracy of each DEM and of the drainage network, slope and basins delimitation extracted from the original SRTM 30 and the rebuilt DEM, and compare the results obtained with the original SRTM 30 and the rebuilt DEMs. Figure 6 shows the flowchart of the sequence of processes.

3.1. OSM Data Preparation

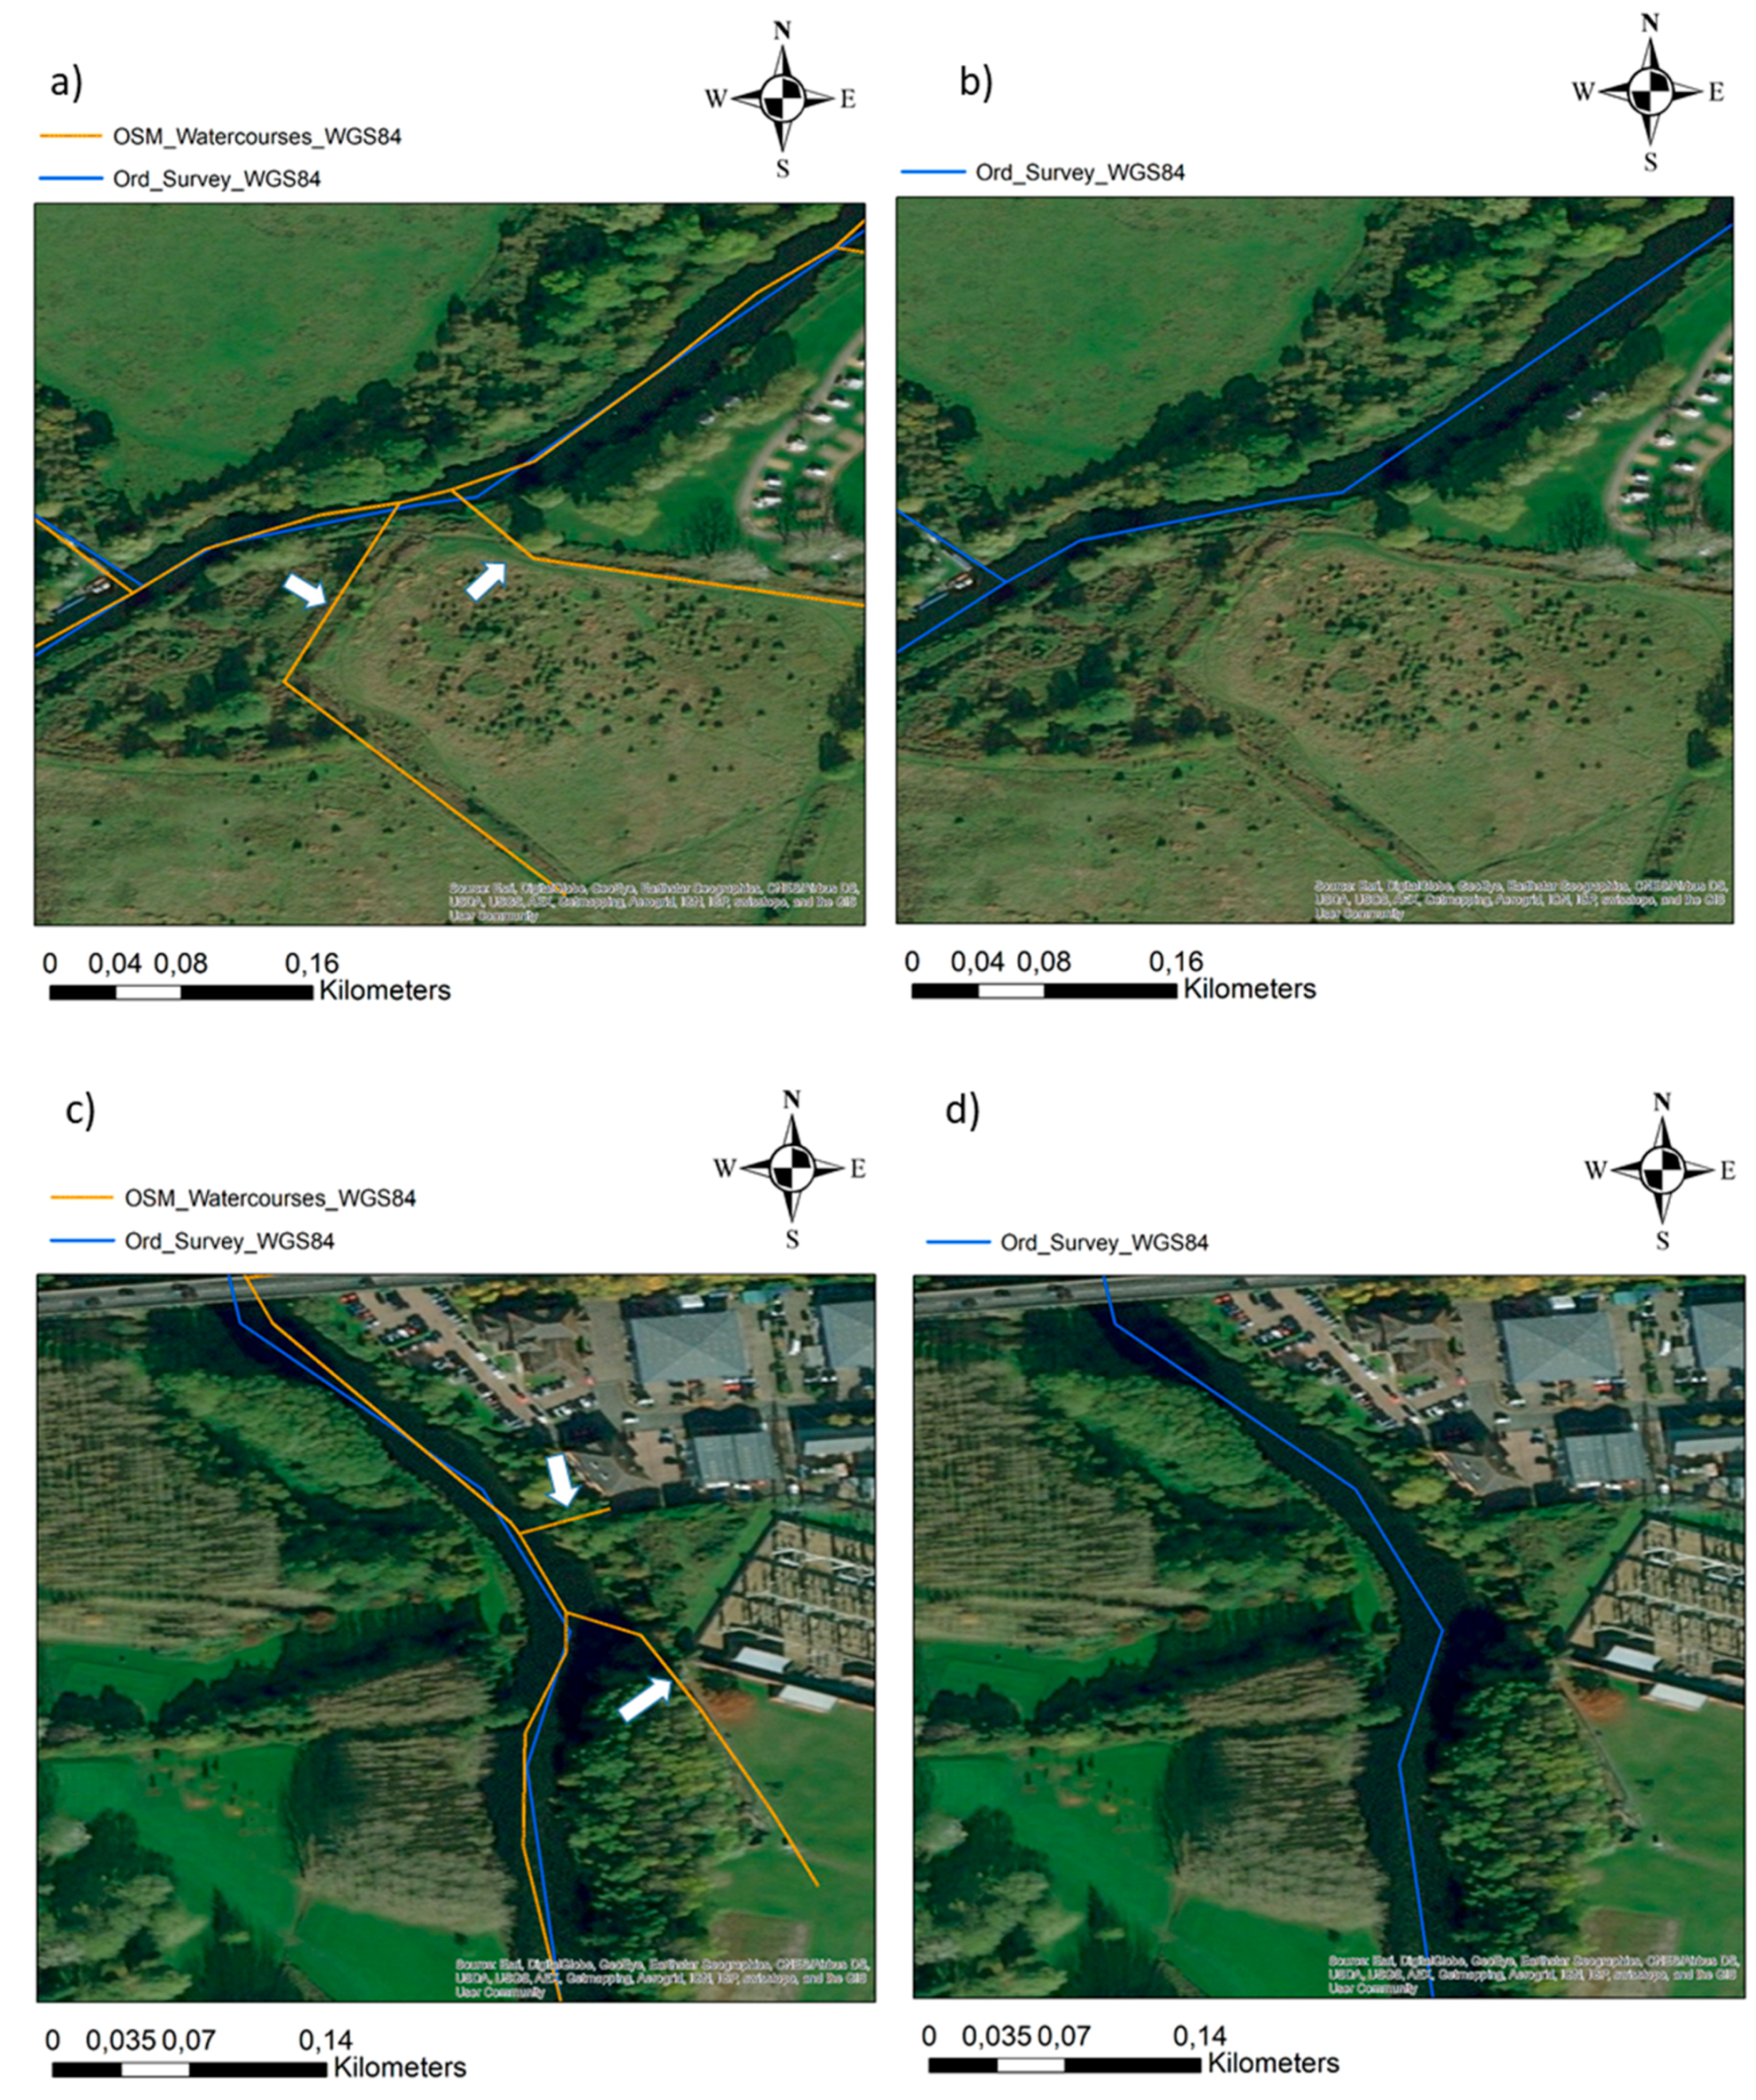
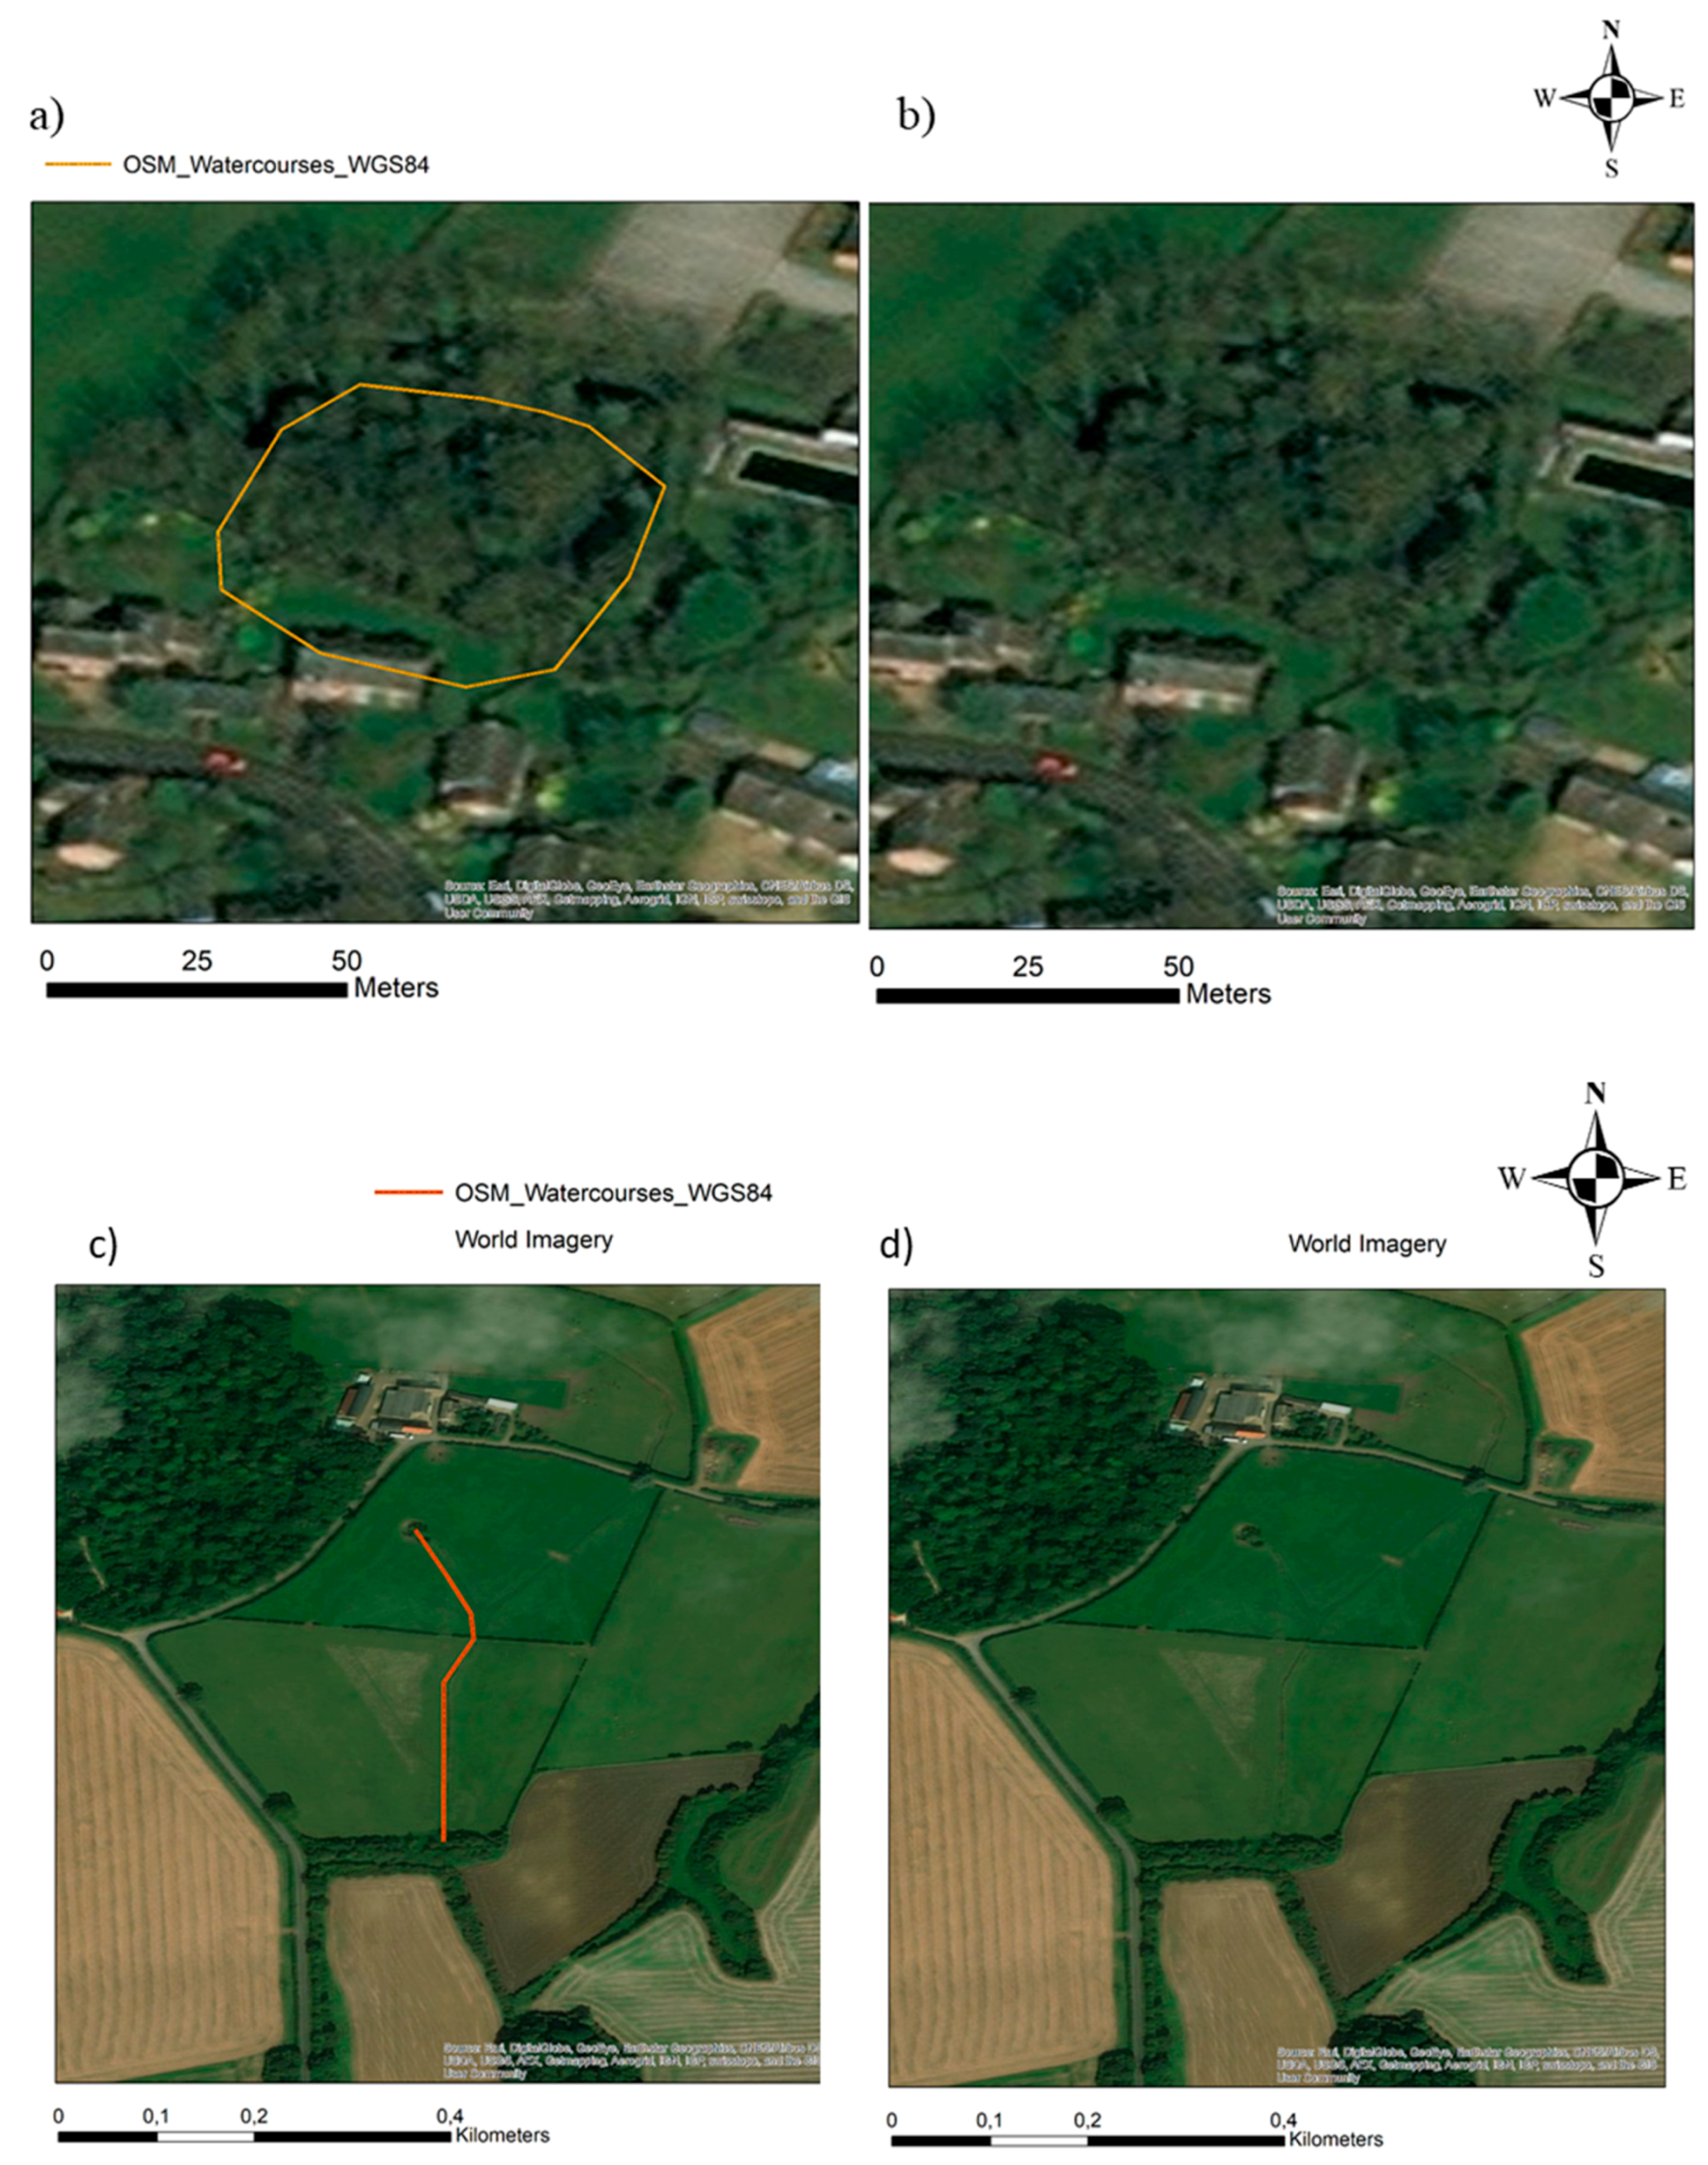
As mentioned in the introduction, OSM data may present geometric and/or thematic errors. For this application it is important to identify if there are any features represented as natural water courses that are misclassified and correspond to artificial water bodies, such as a reservoir, canal, or ditch, if there are misplaced water lines, or even if some lines do not correspond to a water course. Clearly erroneous data needs to be identified and removed so that it is not used in the process. Figure 7 shows examples of water lines (highlighted with white arrows) that, even though connected to the main drainage network, do not appear to be natural streams, but probably artificial irrigation channels or paths separating agricultural fields. In this study this identification was made by a visual analysis over a satellite image. The Ordnance Survey drainage network is shown in Figure 7 for comparison, even though it was not used for this inspection. There may also be missing water lines in OSM data, which, in this study, were not added.
Figure 8 shows additional examples of incorrect OSM waterways that, in this case, are isolated from the drainage network and are not natural water courses.
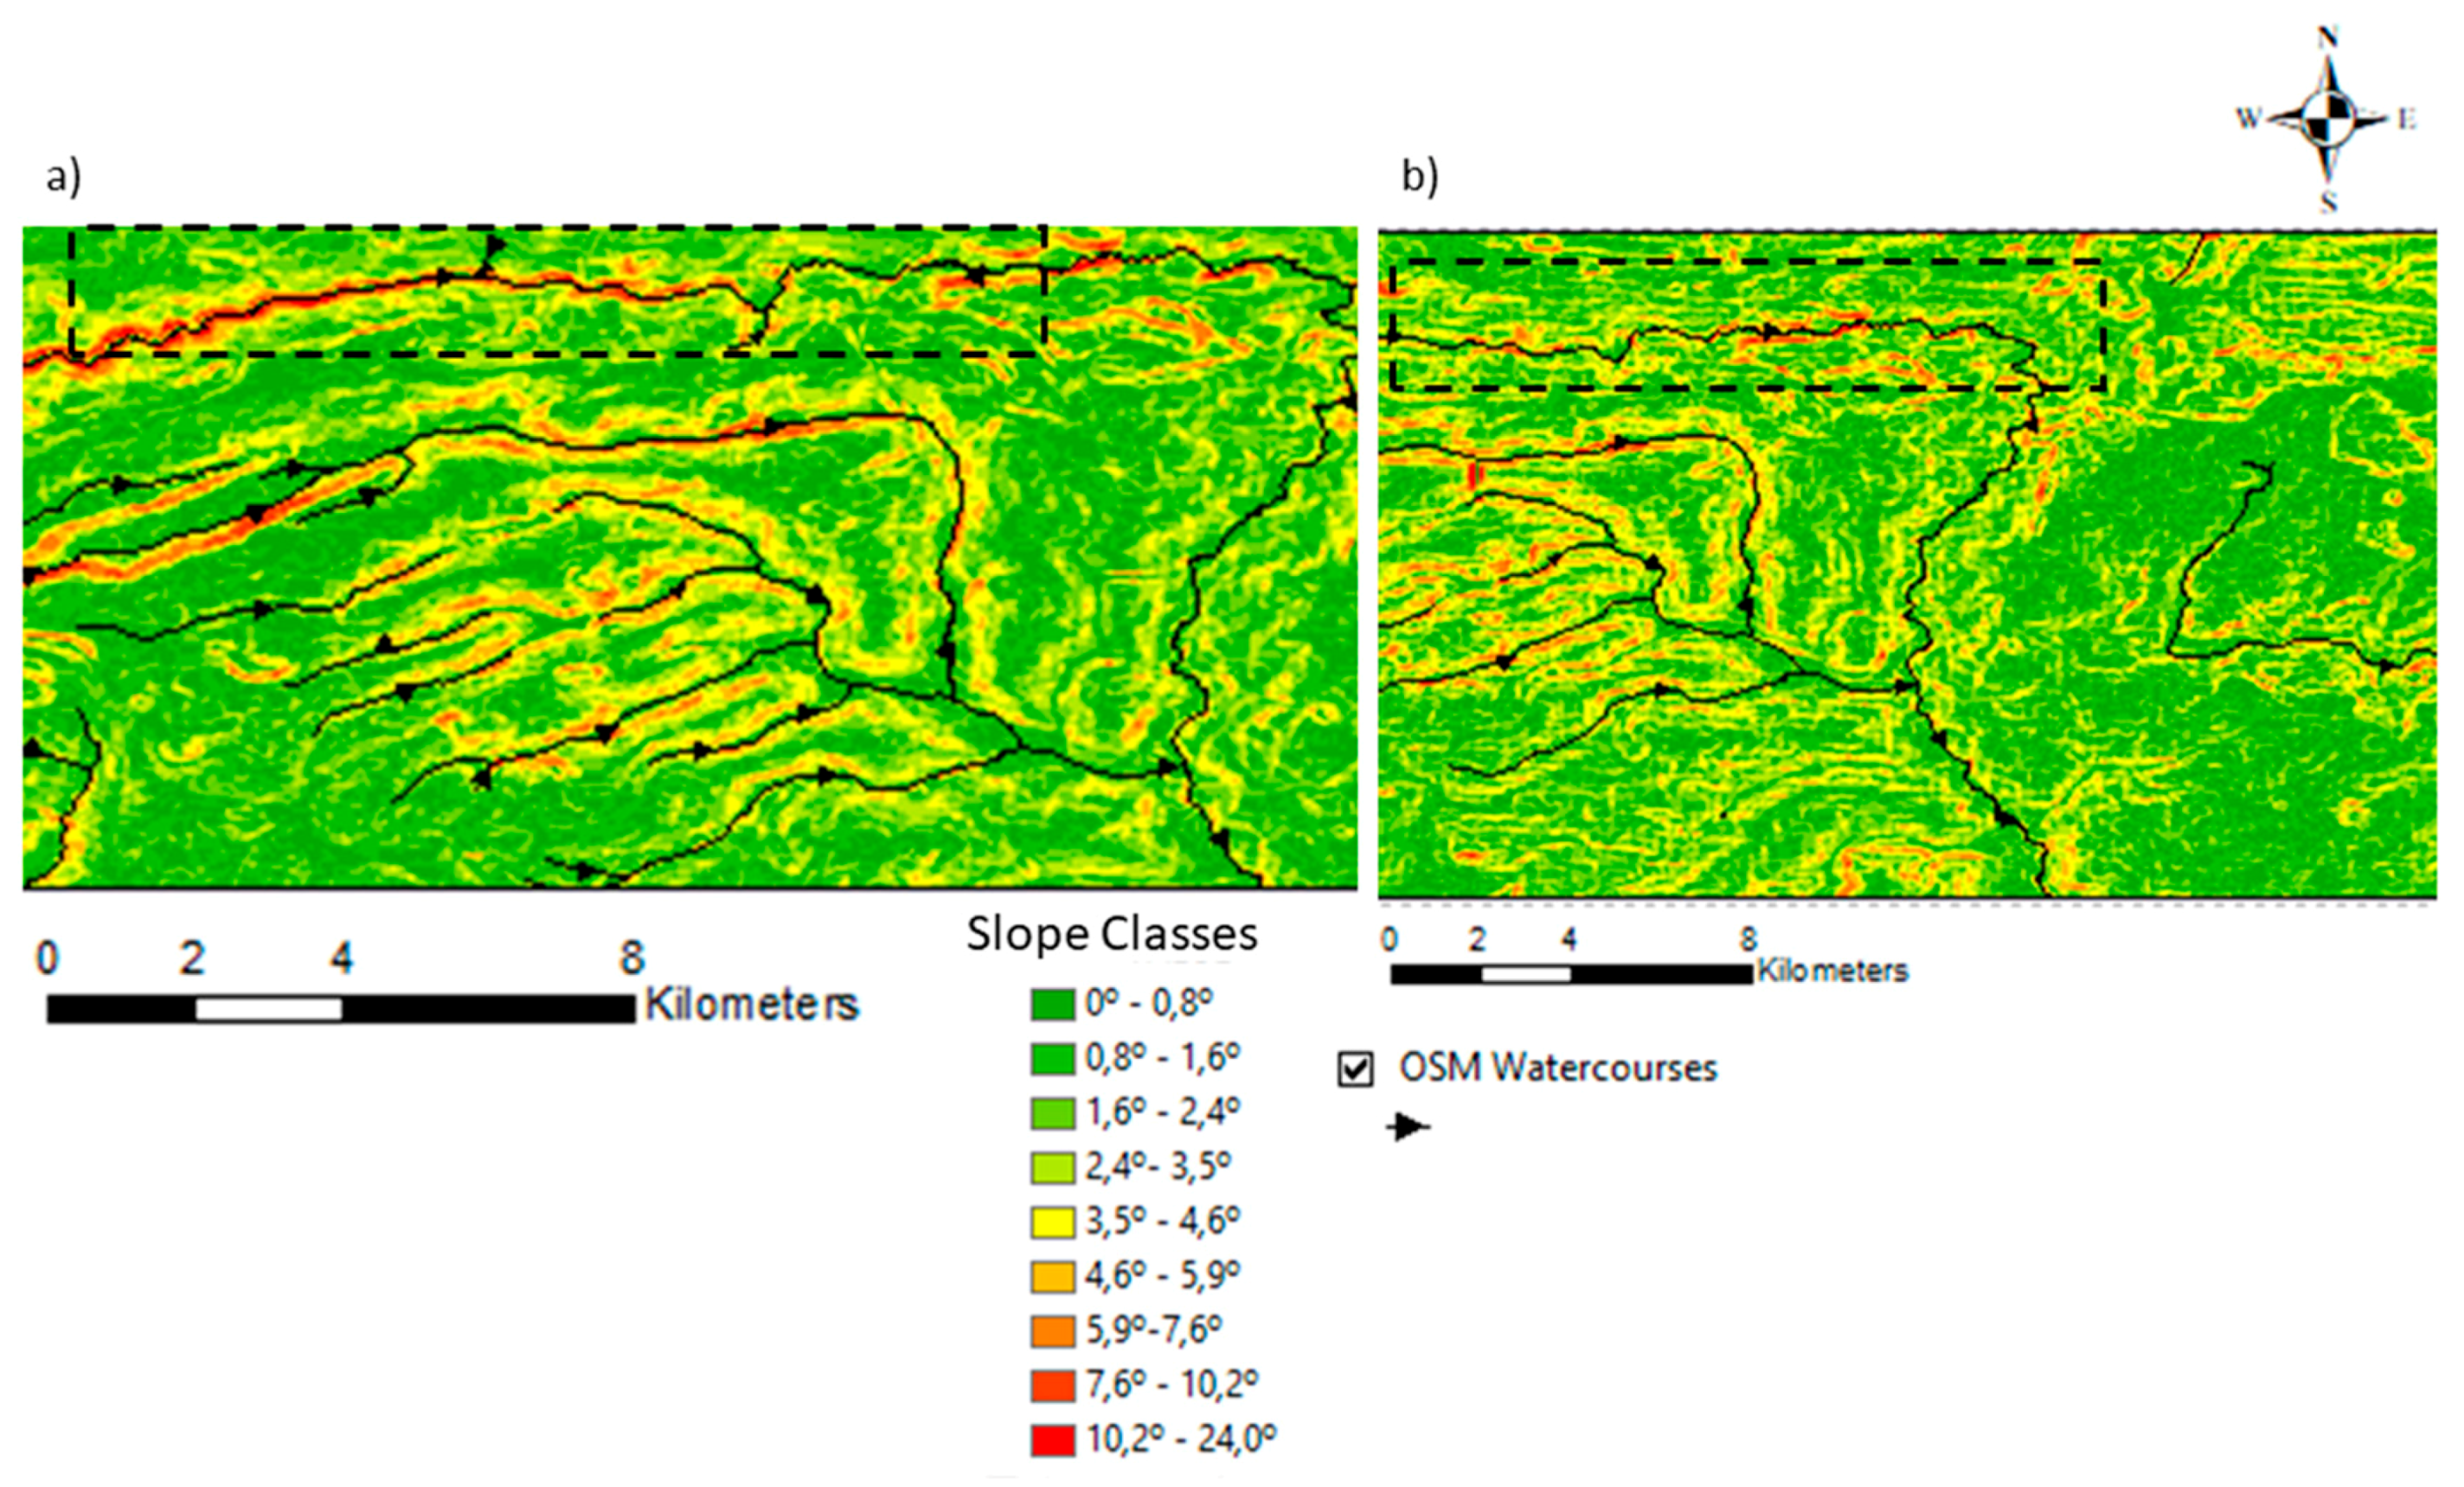
The other aspect that needs to be checked for this application is the orientation of the water lines extracted from OSM, as the ANUDEM interpolation method implemented in ArcGIS software (ESRI, Redlands, CA, USA), which is used to create the new DEM, requires the waterlines to be oriented from upstream to downstream. As this type of restriction does not exist in the protocols used for OSM data collection, the orientation of all waterways used to create the new DEM needs to be checked and, if necessary, inverted. This can be easily done in ArcGIS (ESRI, Redlands, CA, USA), as the orientation of each linear segment can be made visible by selecting a symbology that shows the segments’ orientation (see Figure 9), and inverted using the “Flip” tool available in the “Editor” toolbar. If wrongly-oriented lines are used to create a new DEM, they generate regions with erroneous morphology and elevation. Figure 9a shows a part of a waterline with wrong orientation overlaid with the slope derived from the DEM created with those OSM waterlines (rivers and streams), showing a large slope variation in the region around the waterline. Figure 9b shows the same when the slope is derived from the rebuilt DEM built with properly-oriented waterways, where this problem does not occur.
If during the data preparation process lines with wrong orientation are not detected, this problem can, in most cases, be identified a posteriori by locating regions where very steep slopes were obtained.
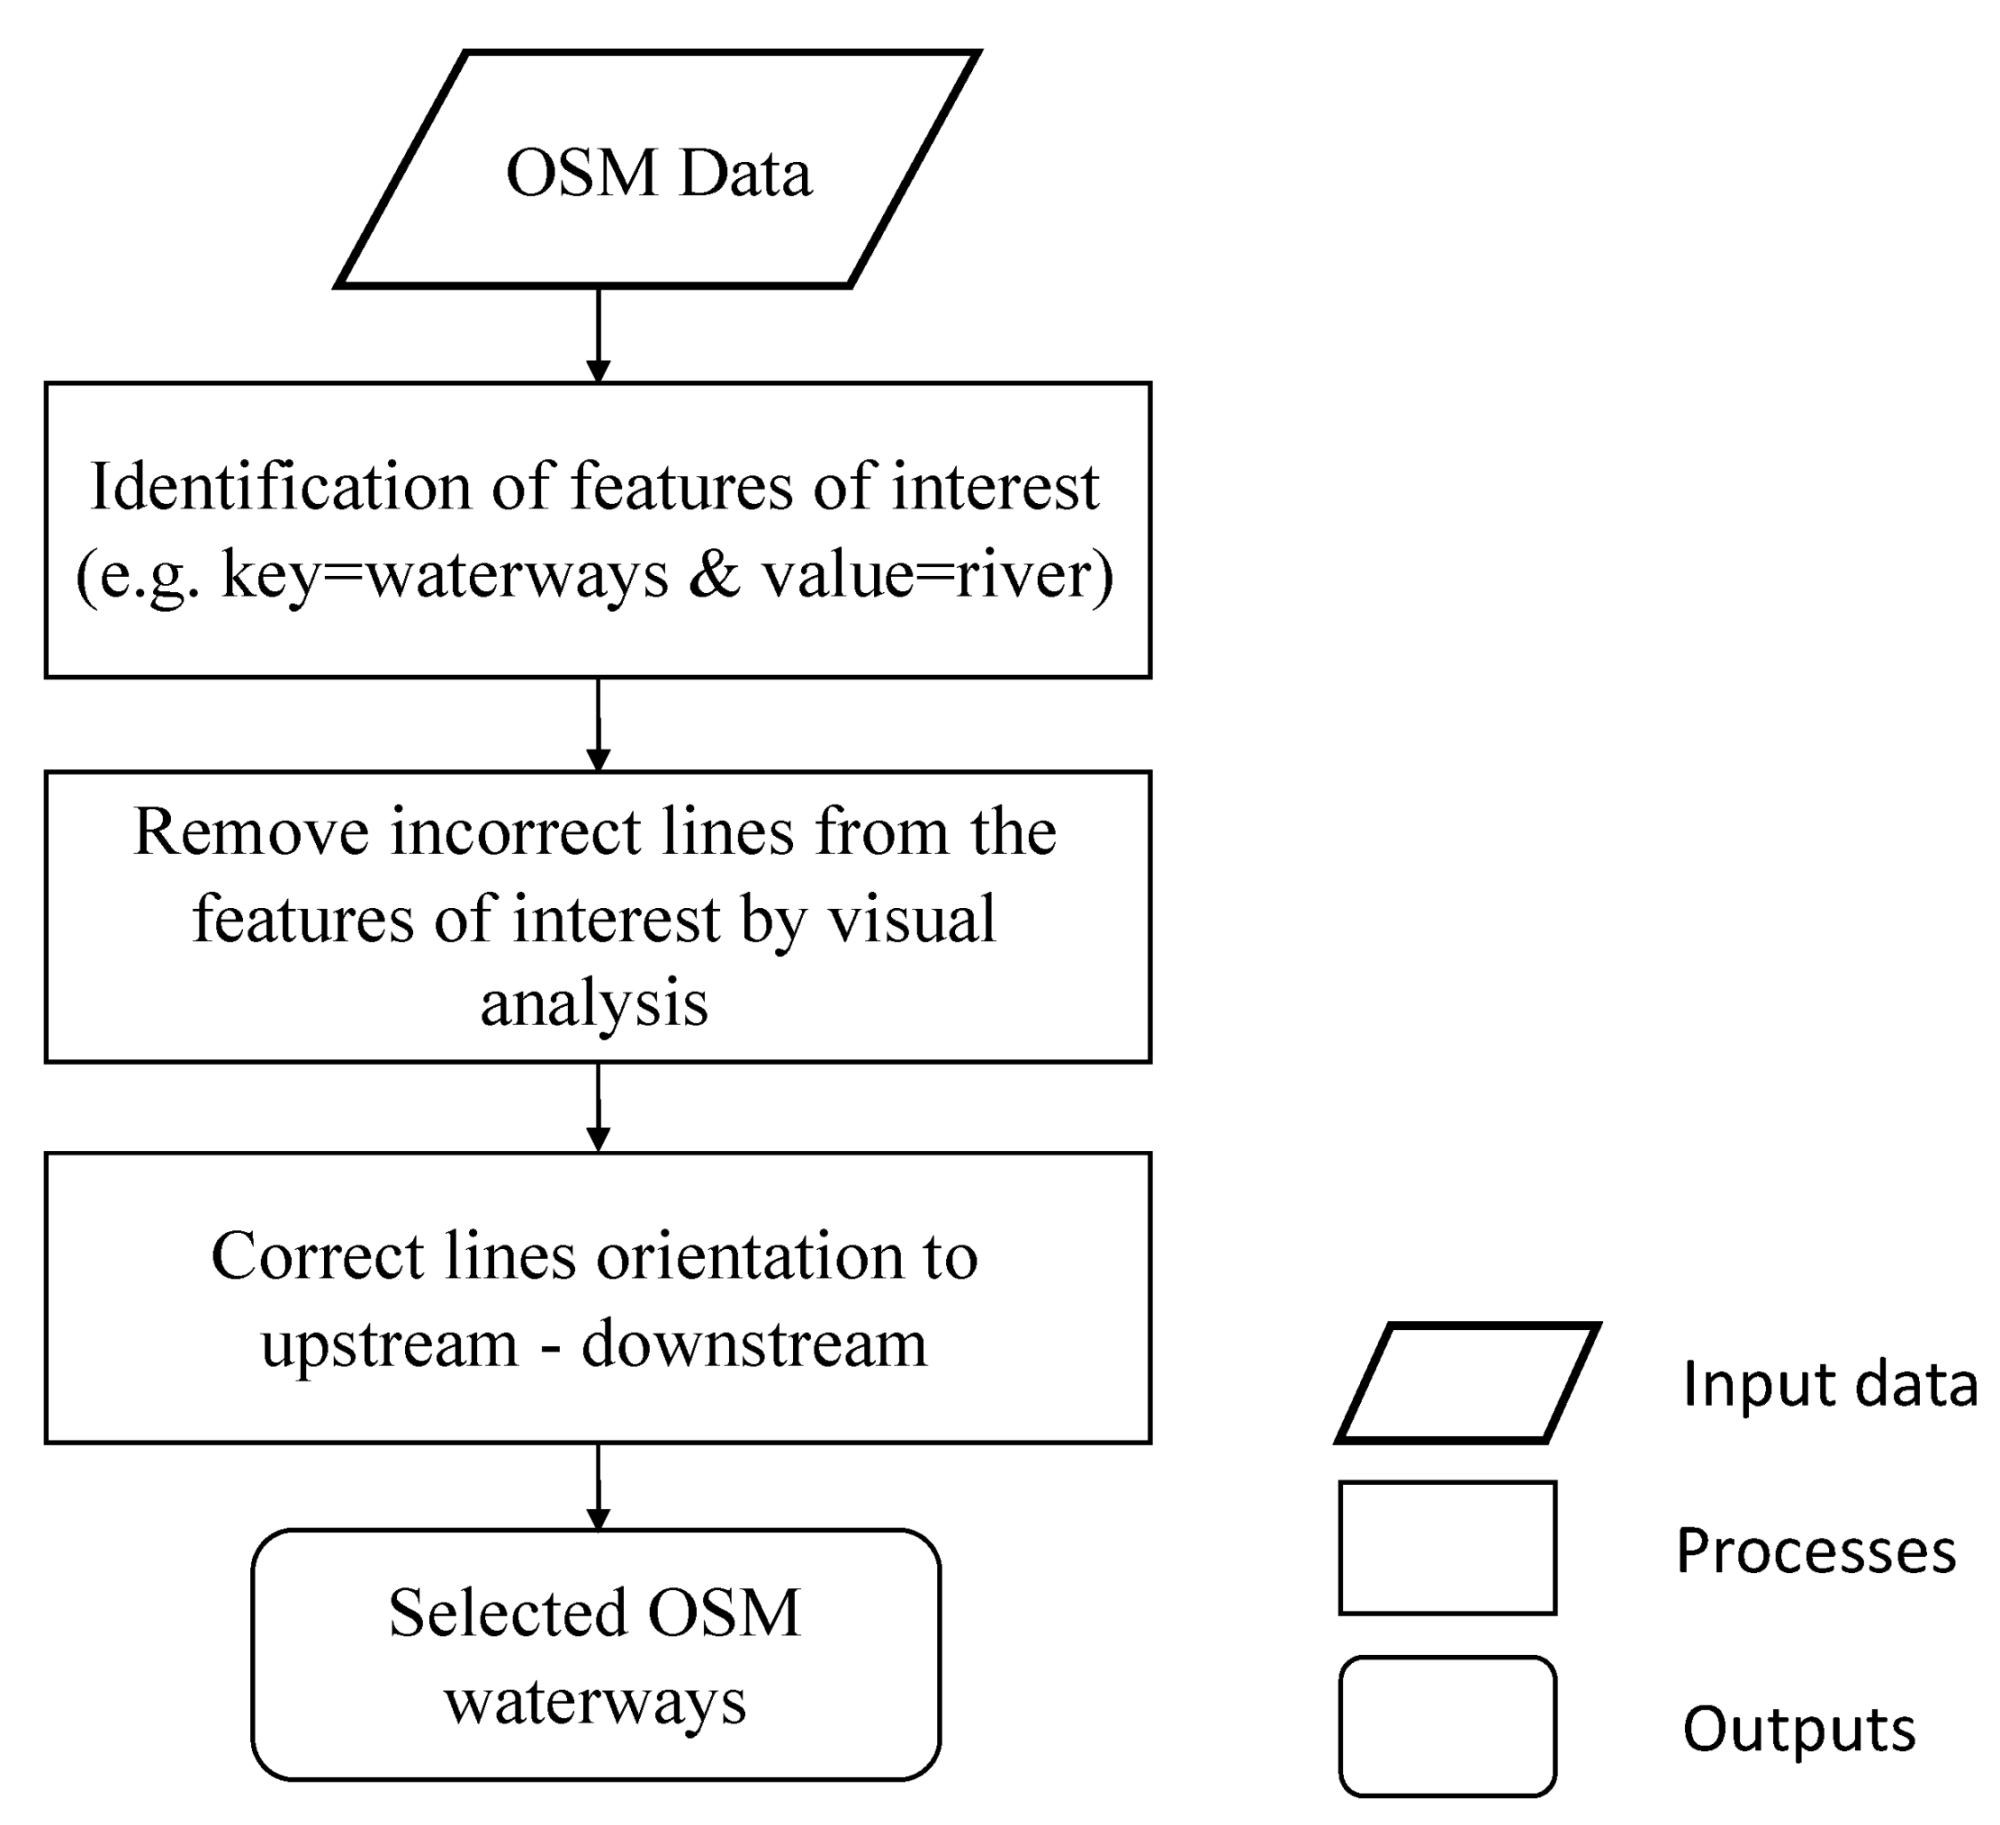
Figure 10 shows the flow of OSM data processing to select the waterways that are used in the creation of the rebuilt DEM.

3.2. Creation of the Rebuilts DEMs

The methodology used to create new DEMs from the global DEMs along with the drainage network extracted from OSM was already presented in [27]. It requires the conversion of the original DEM in grid format into elevation points. In this application this conversion was done using the ArcGIS (ESRI, Redlands, CA, USA) tool “raster to points”. The conversion process generates an elevation point for each cell, positioned in the centre of the cell. These elevation points and the OSM watercourses, as well as the boundary of the study area where the inputs for the ANUDEM interpolation method [33] was applied to create the new surface. The interpolation tool used was “Topo to raster”, available in ArcGIS software (ESRI, Redlands, CA, USA). Figure 11 shows the flowchart of the procedures to create the rebuilt DEM.
As there may be less accuracy in digitizing streams than rivers, two new DEMs were constructed, one using the rivers and streams selected from OSM and the other using only the rivers, to assess if there would be any significant difference in the accuracy of the results.

3.3. Drainage Networks Extraction from the DEMs

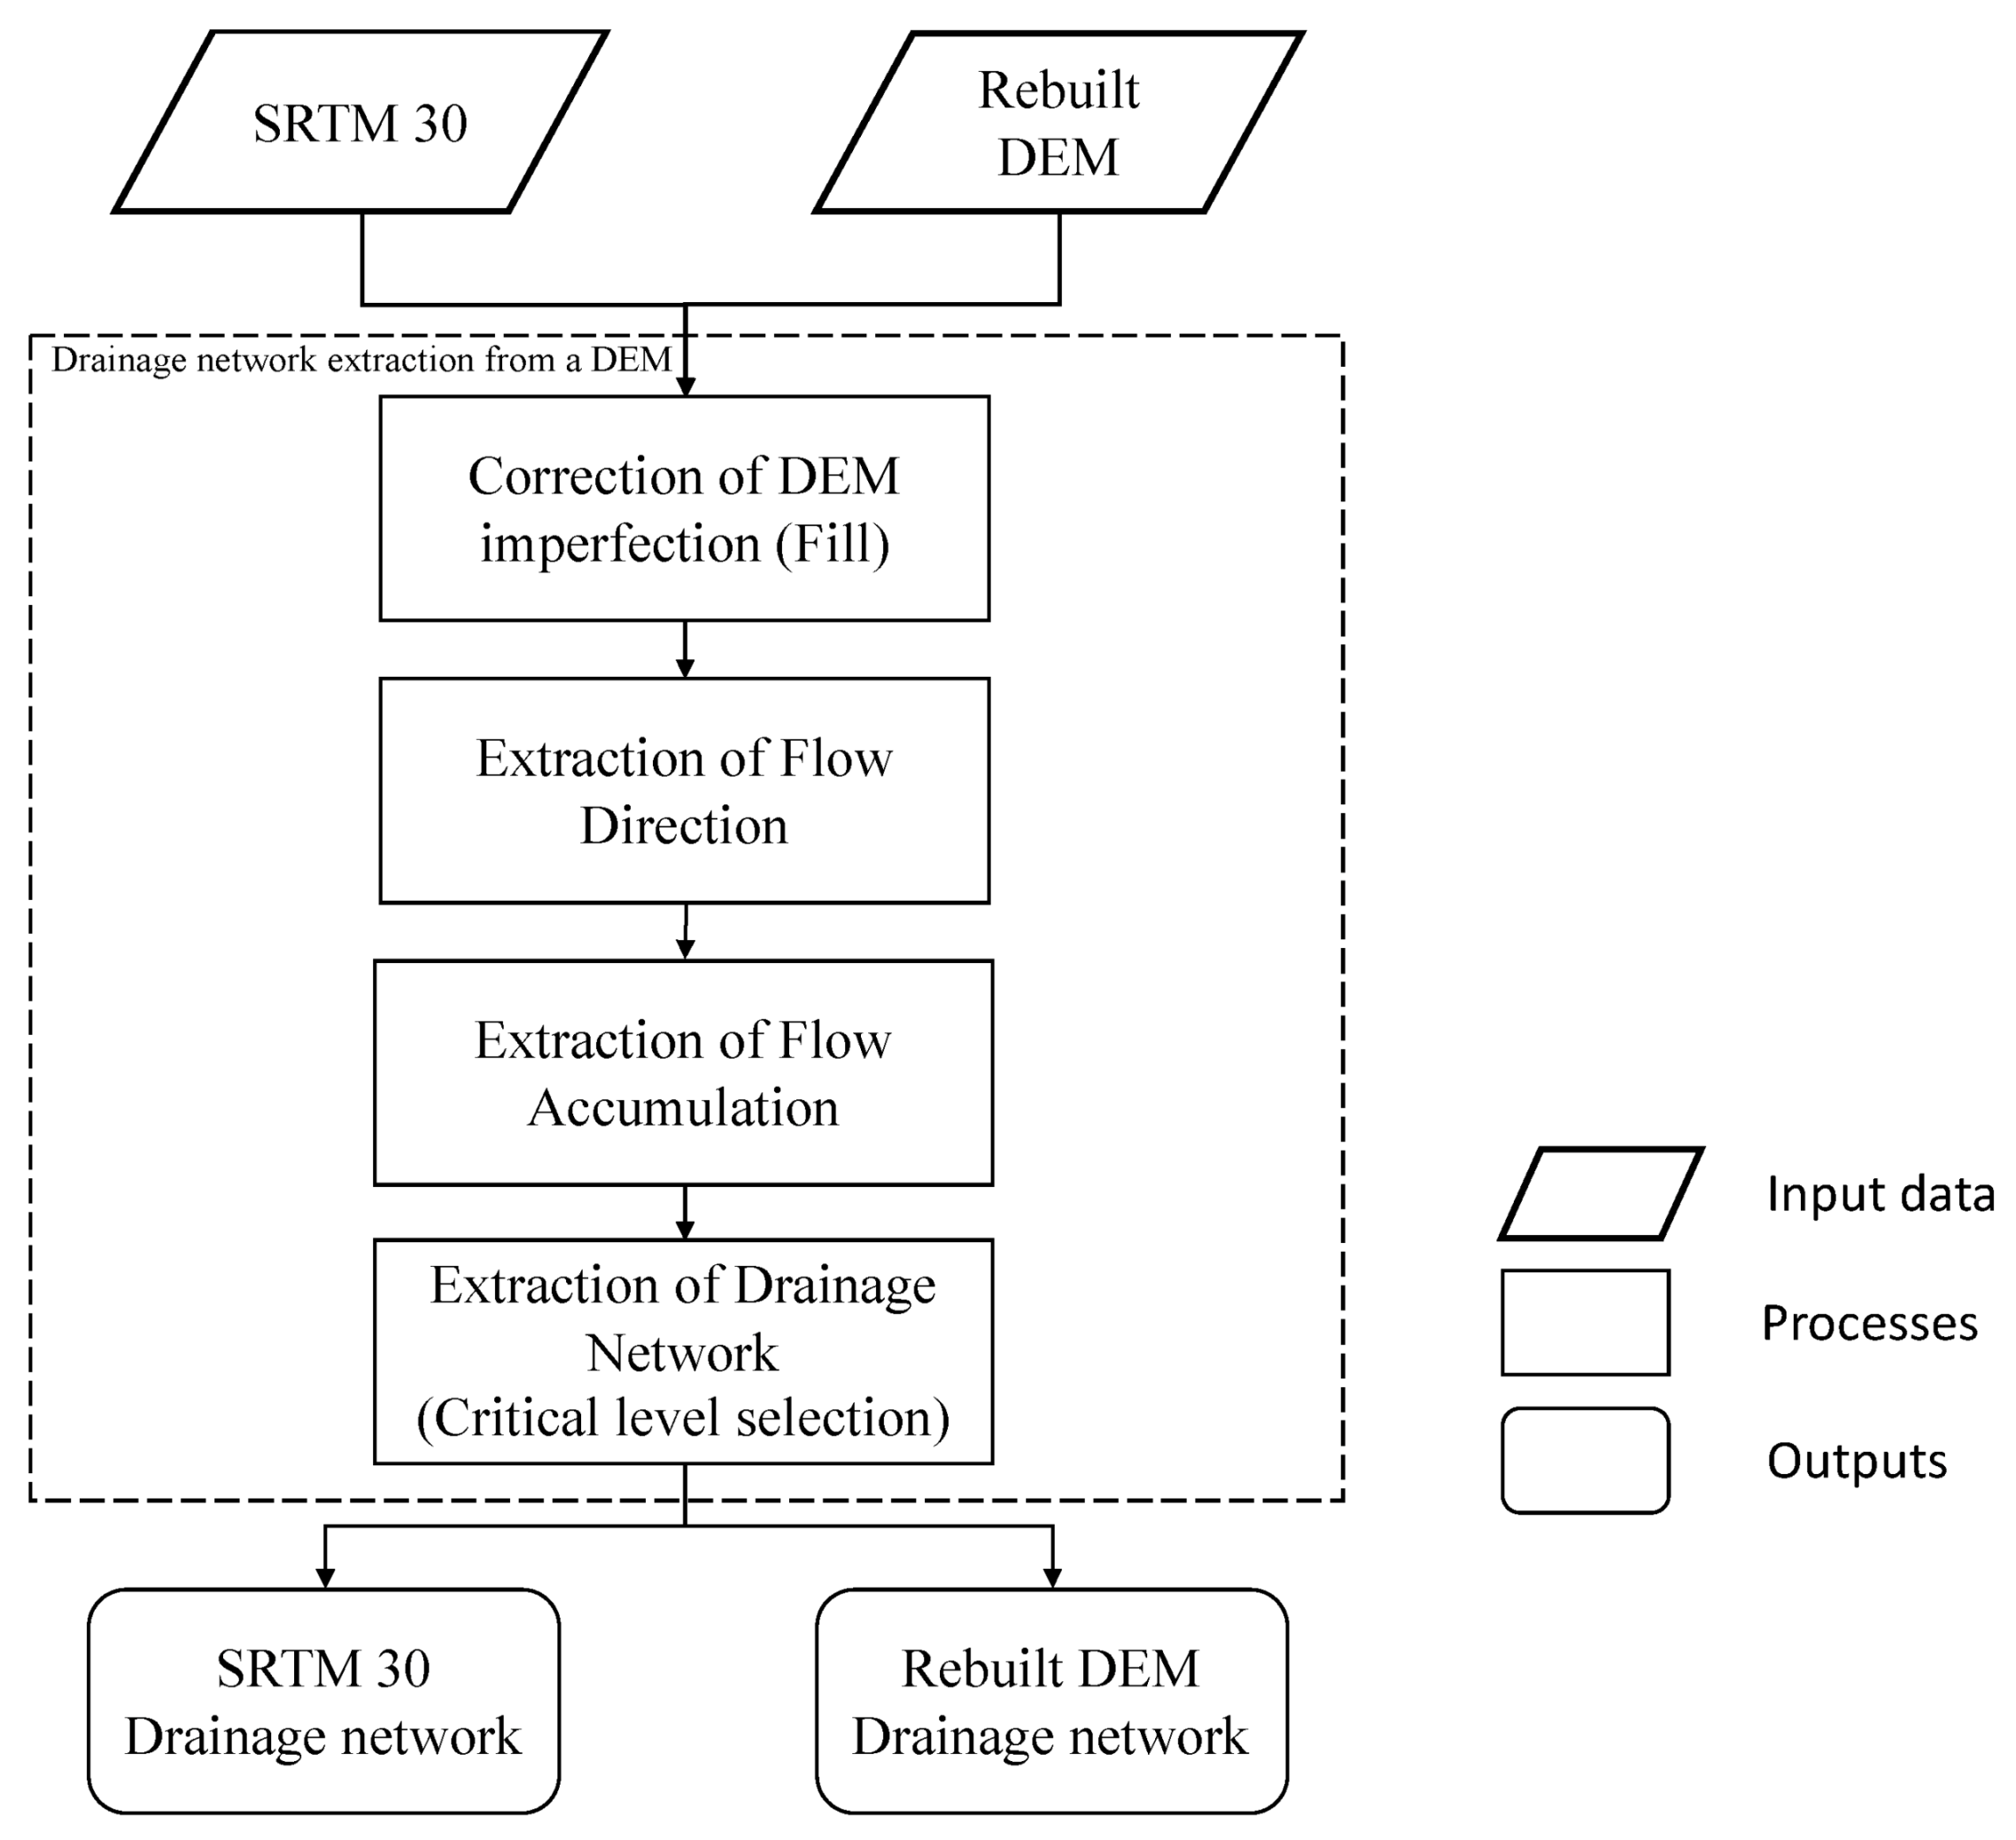
From the original DEM and the rebuilt one, obtained as explained in Section 3.2, the drainage networks were extracted using the D8 algorithm, e.g., [27,33,34,35,36,37,38,39]. The “Fill” tool was applied to correct DEM imperfections. Then, the matrix of the flow direction is generated. In this matrix the value of each cell gives a code for the direction of water flow. The flow accumulation is then computed. The output is a raster file where each pixel has a value that corresponds to the number of pixels that drain to it. To generate a drainage network it is necessary to define a critical level (CL) for the flow accumulation, that is, the number of pixels that define if the pixels belong, or not, to the watercourse. The pixel value must be greater than the CL for the pixels to belong to the drainage networks. The CL value is chosen taking into account the spatial resolution of the DEM and the characteristics of the region. Lower CL values produce more branched networks. The values with flow accumulation larger than the CL were selected using the ArcGIS (ESRI, Redlands, CA, USA) software tool “Raster Calculator”. The flowchart of the drainage networks extraction is presented in Figure 12.

3.4. Slope Computations and Basin Generation

The slope map was computed for each DEM using the ArcGIS (ESRI, Redlands, CA, USA) tool “Slope”. The output can be in percentage or degrees.
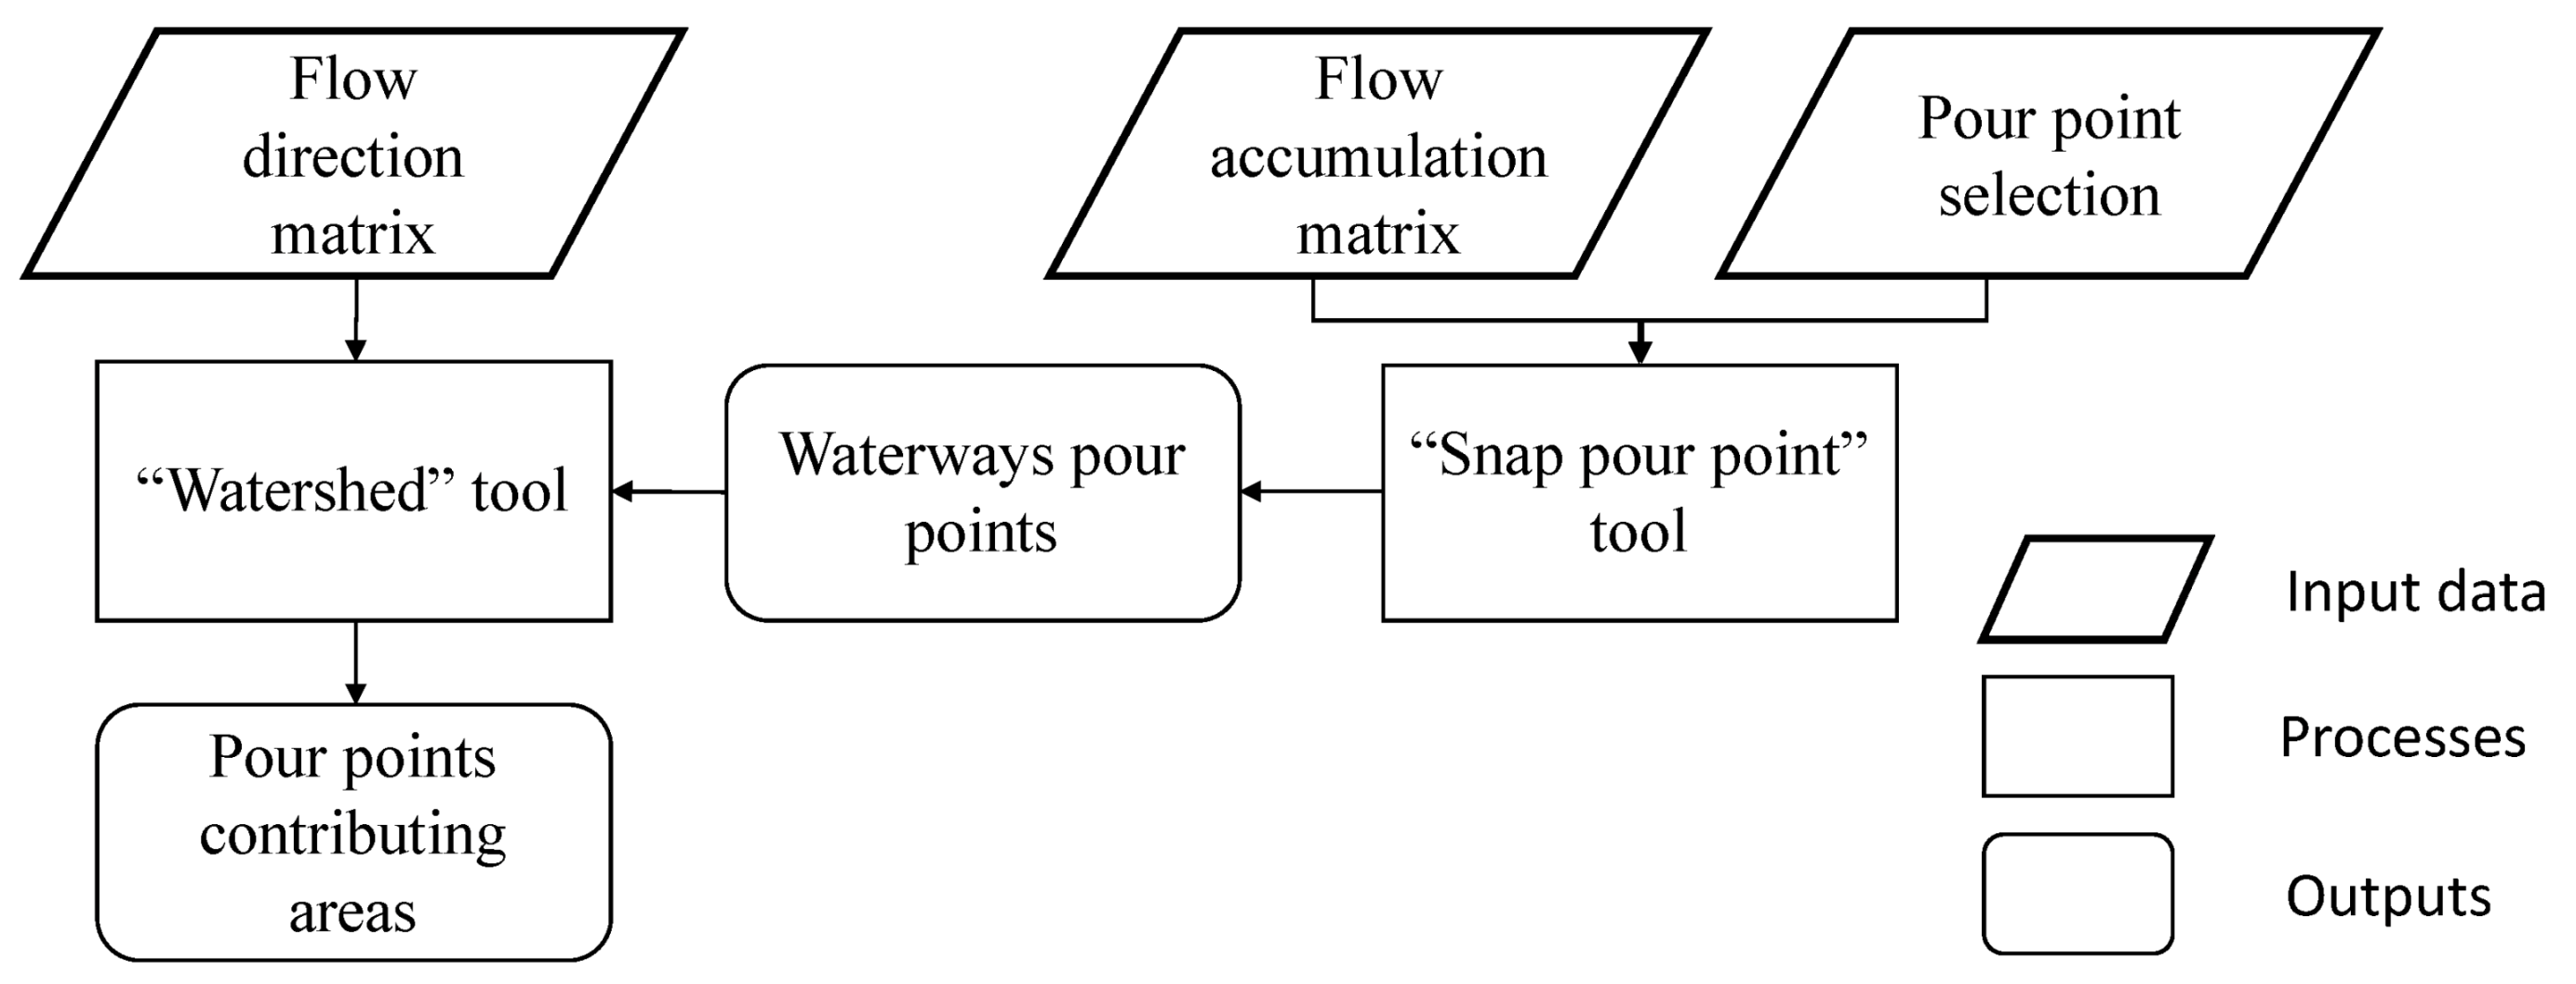
The basins of the study area were generated from the reference DEM and the DEMs under analysis. Contributing upstream areas for the chosen pour points can be generated using the tool “watershed”. Figure 13 illustrates the process for their creation, by using the flow direction matrix and a set of chosen pour points that need to be positioned at the water courses, which is achieved by using the tool “Snap pour point” and the flow accumulation matrix.

3.5. DEMs and Slope Accuracy Assessment

The accuracy of SRTM 30 and the rebuilt DEMs using the OSM rivers and streams and only OSM rivers was evaluated computing the elevation differences for all n pixels P k of the considered DEMs ( k = 1 , , n ) between the reference DEM (DEMRef) and each of the DEMs under analysis (DEMi), where DEMi = DEMOriginalSRTM corresponds to the original SRTM 30, DEMi = DEMReb_rivers/streams corresponds to the rebuilt DEM considering the OSM rivers and streams and DEMi = DEMReb_rivers corresponds to the rebuilt DEM considering only OSM rivers. This analysis was made using the ArcGIS (ESRI, Redlands, CA, USA) software tool “minus”:
  D E M _ D i f i ( P k ) = D E M R e f ( P k ) D E M i ( P k )  
The mean of the vertical differences for each DEM ( D E M _ D i f i ¯ ) was determined as well as the standard deviation ( σ D E M _ D i f i ) and the RMSE ( R M S E D E M D i f i ) using Equations (2)–(4) respectively, where n is the number of pixels of the DEMs (in this case study n = 2,426,720):
  D E M _ D i f i ¯ = k = 1 n D E M _ D i f i ( P k ) n  
  σ D E M _ D i f i = k = 1 n ( D E M _ D i f i ( P k ) D E M _ D i f i ¯ ) 2 n  
  R M S E D E M D i f i = k = 1 n ( D E M _ D i f i ( P k ) ) 2 n  
The accuracy of the slope maps was obtained with the same procedure, that is, by computing the difference between the reference slope map obtained from the Ordnance Survey DEM and the slope maps obtained from the DEMs under analysis using Equation (5). The mean, the standard deviation, and the RMSE of the obtained differences were computed using Equations (6)–(8), respectively:
  S l o p e _ D i f i ( P k ) = S l o p e R e f ( P k ) S l o p e i ( P k )  
  S l o p e _ D i f i ¯ = k = 1 n S l o p e _ D i f i ( P k ) n  
  σ S l o p e _ D i f i = k = 1 n ( S l o p e _ D i f i ( P k ) S l o p e _ D i f i ¯ ) 2 n  
  R M S E S l o p e _ D i f i = K = 1 n ( S l o p e _ D i f i ( P K ) ) 2 n  

3.6. Drainage Network Accuracy Assessment

3.6.1. Horizontal Accuracy

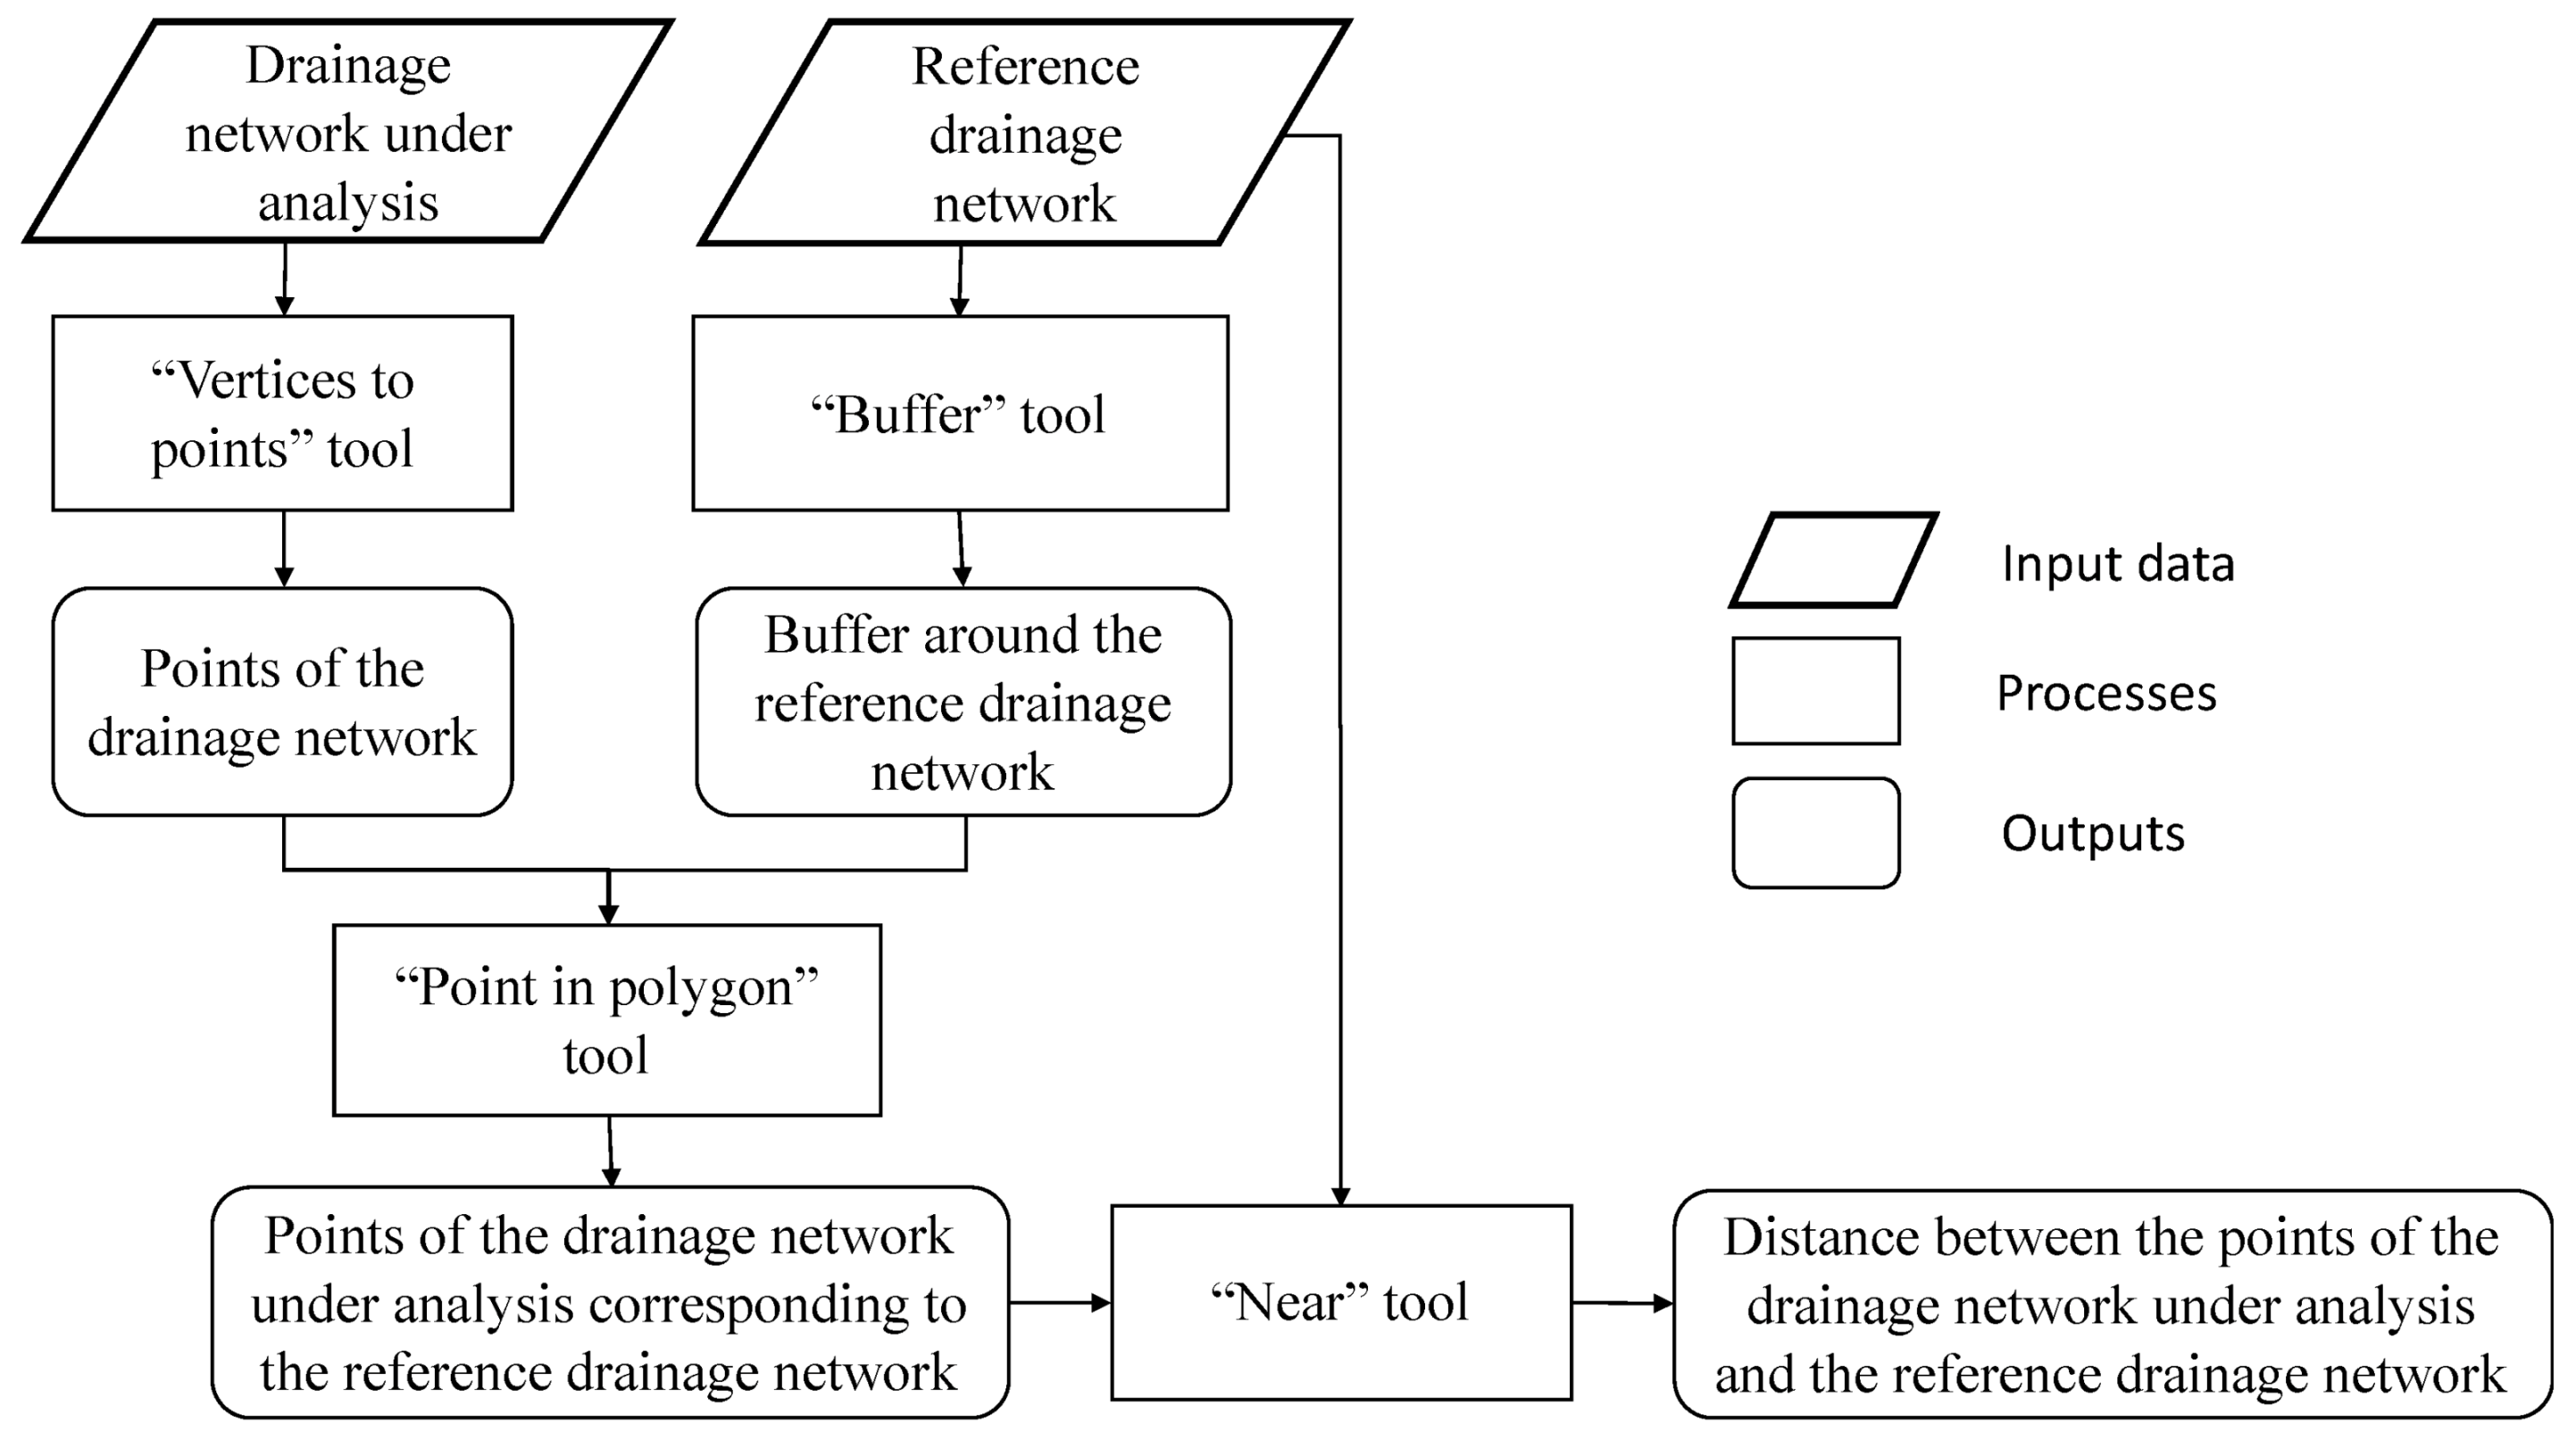
The procedure used to assess the horizontal accuracy of the drainage network extracted from the rebuilt DEMs is the method used in [27], where the comparison is made with a reference drainage network. For this comparison a buffer is generated around the reference drainage network (whose width needs to be identified for each region) in order to identify the sections of the drainage network under analysis that may be considered as corresponding to the reference drainage network sections.
The drainage networks to be analysed are then transformed into points using the tool “Feature vertices to points”. Afterwards the horizontal distances between those points and the reference line are computed using the proximity tool “Near”. Figure 14 shows the flowchart of this process. The mean, the standard deviation, and RMSE of the distances obtained are then computed.

3.6.2. Vertical Accuracy

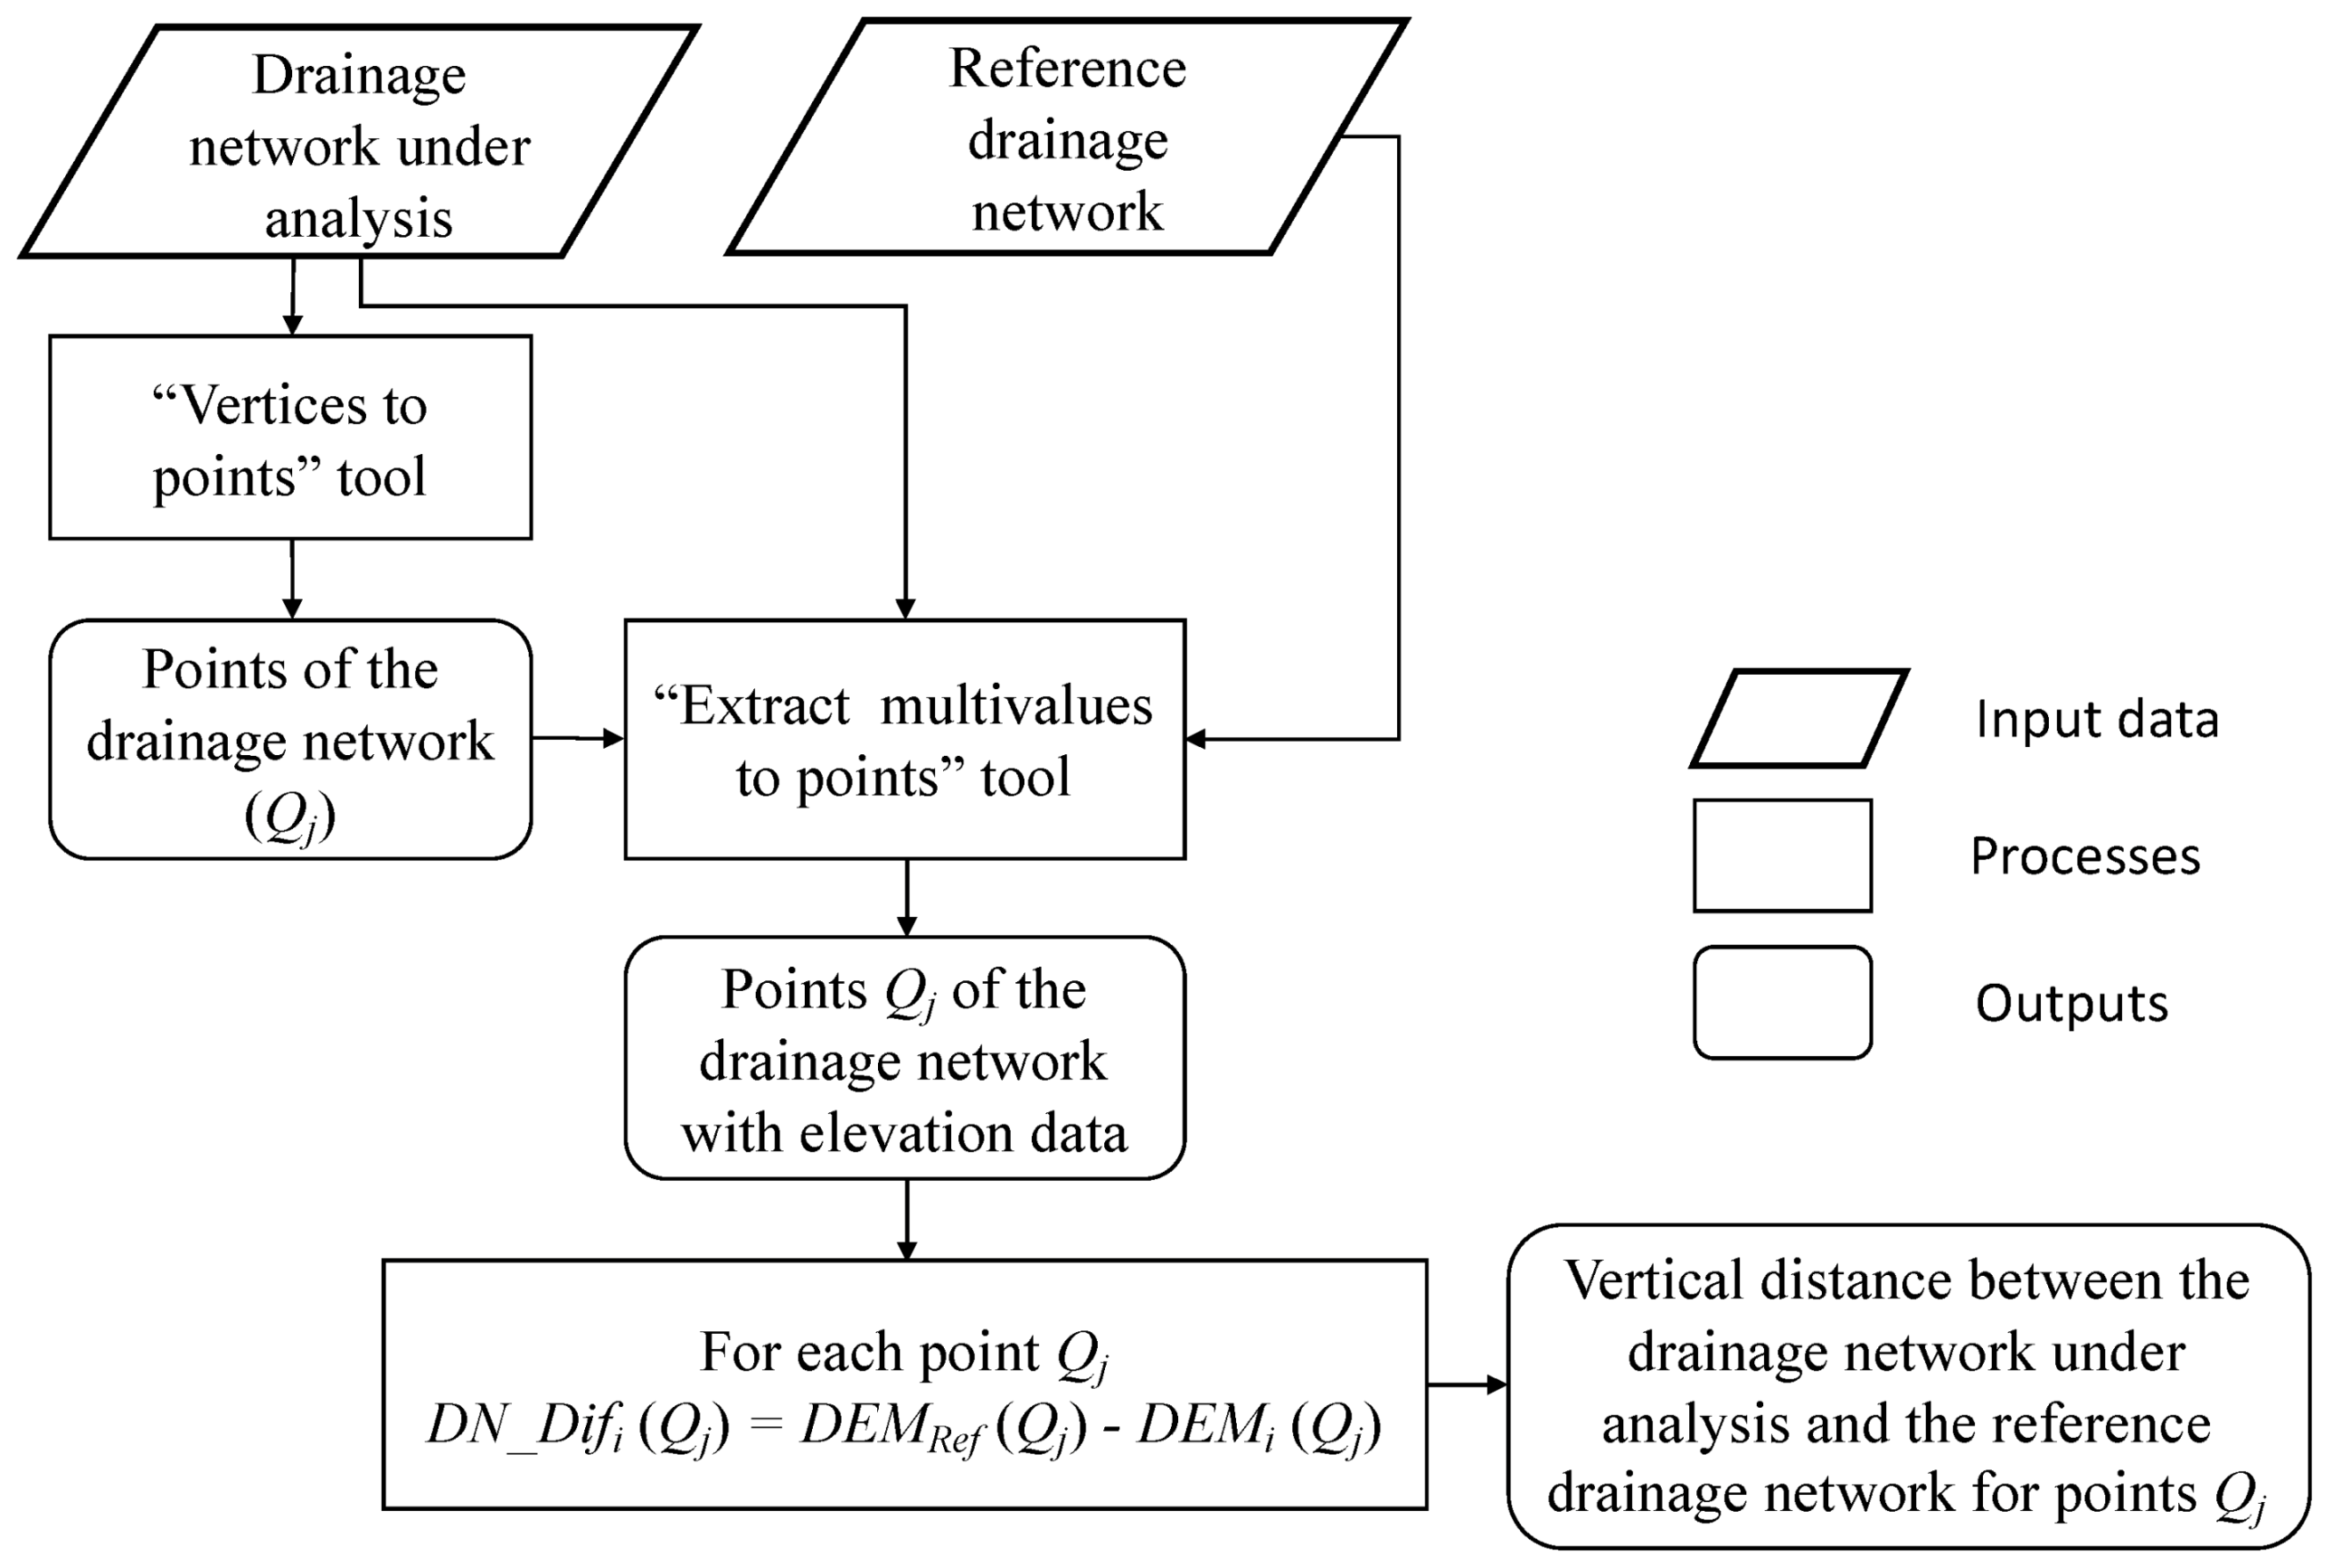
In this article the vertical accuracy of obtained drainage networks is also computed. For this, after the conversion of the drainage networks under analysis into m points Q j , for ( j = 1 , , m ), as explained in the previous section, the elevation at the reference and rebuilt DEMs was associated to the points using the tool “Extract multivalues to points”. This enables the computation at points Q j of the differences of elevation D N _ D i f i between the reference (DEMRef) and the rebuilt DEMs ( D E M i ) , as indicated in Equation (9), where i represents the Original SRTM, Reb_rivers/streams or Reb_rivers, as indicated in Section 3.5. The analysis was made for all study area, but also in some zones with different characteristics selected from the study area:
  D N _ D i f i ( Q j ) = D E M R e f ( Q j ) D E M i ( Q j )  
The mean, the standard deviation, and the RMSE of the obtained distances were then computed using Equations (10)–(12). Figure 15 shows the flowchart to calculate the vertical accuracy of drainages:
  D N _ D i f i ¯ = j = 1 m D N _ D i f i ( Q j ) m  
  σ D N _ D i f i = j = 1 m ( D N _ D i f i ( Q j ) D N _ D i f i ¯ ) 2 m  
  R M S E D N _ D i f i = j = 1 m ( D N _ D i f i ( Q j ) ) 2 m  

3.7. Basins Accuracy Assessment

To assess the accuracy of basin delineation, the pour point-contributing areas were generated considering the reference DEM, the original SRTM 30, and the rebuilt DEMs using OSM rivers and streams and only OSM rivers. The results were compared by computing the total area of each basin, and assessing the differences between the area of the basins obtained from the reference DEM and the ones under analysis.

4. Results

4.1. DEMs Accuracy

The accuracy of the DEMs was evaluated as explained in Section 3.5. Table 1 shows the mean ( D E M _ D i f i ¯ ), the standard deviation ( σ D E M _ D i f i ), the RMSE, and the maximum and the minimum of the differences ( D E M D i f i ) of elevation between the reference DEM, the rebuilt DEM considering the rivers and streams from OSM, and the one obtained using only the rivers. This assessment was performed for the entire study area considering all pixels of the DEMs. It can be seen that the mean difference between the rebuilt DEM obtained with rivers and streams is smaller than the mean of the differences obtained for the original SRTM 30, decreasing from −6.0 m to −4.5 m, while, for the rebuilt DEM using only the rivers, the mean difference is kept unchanged. This shows that the systematic difference between the reference DEM and the rebuilt DEM using rivers and streams decreased. The standard deviations, RMSE, as well as the maximum and minimum values of the differences do not show significant changes, except for a small decrease of the standard deviation, RMSE, and maximum difference for the DEM obtained with only the OSM rivers.
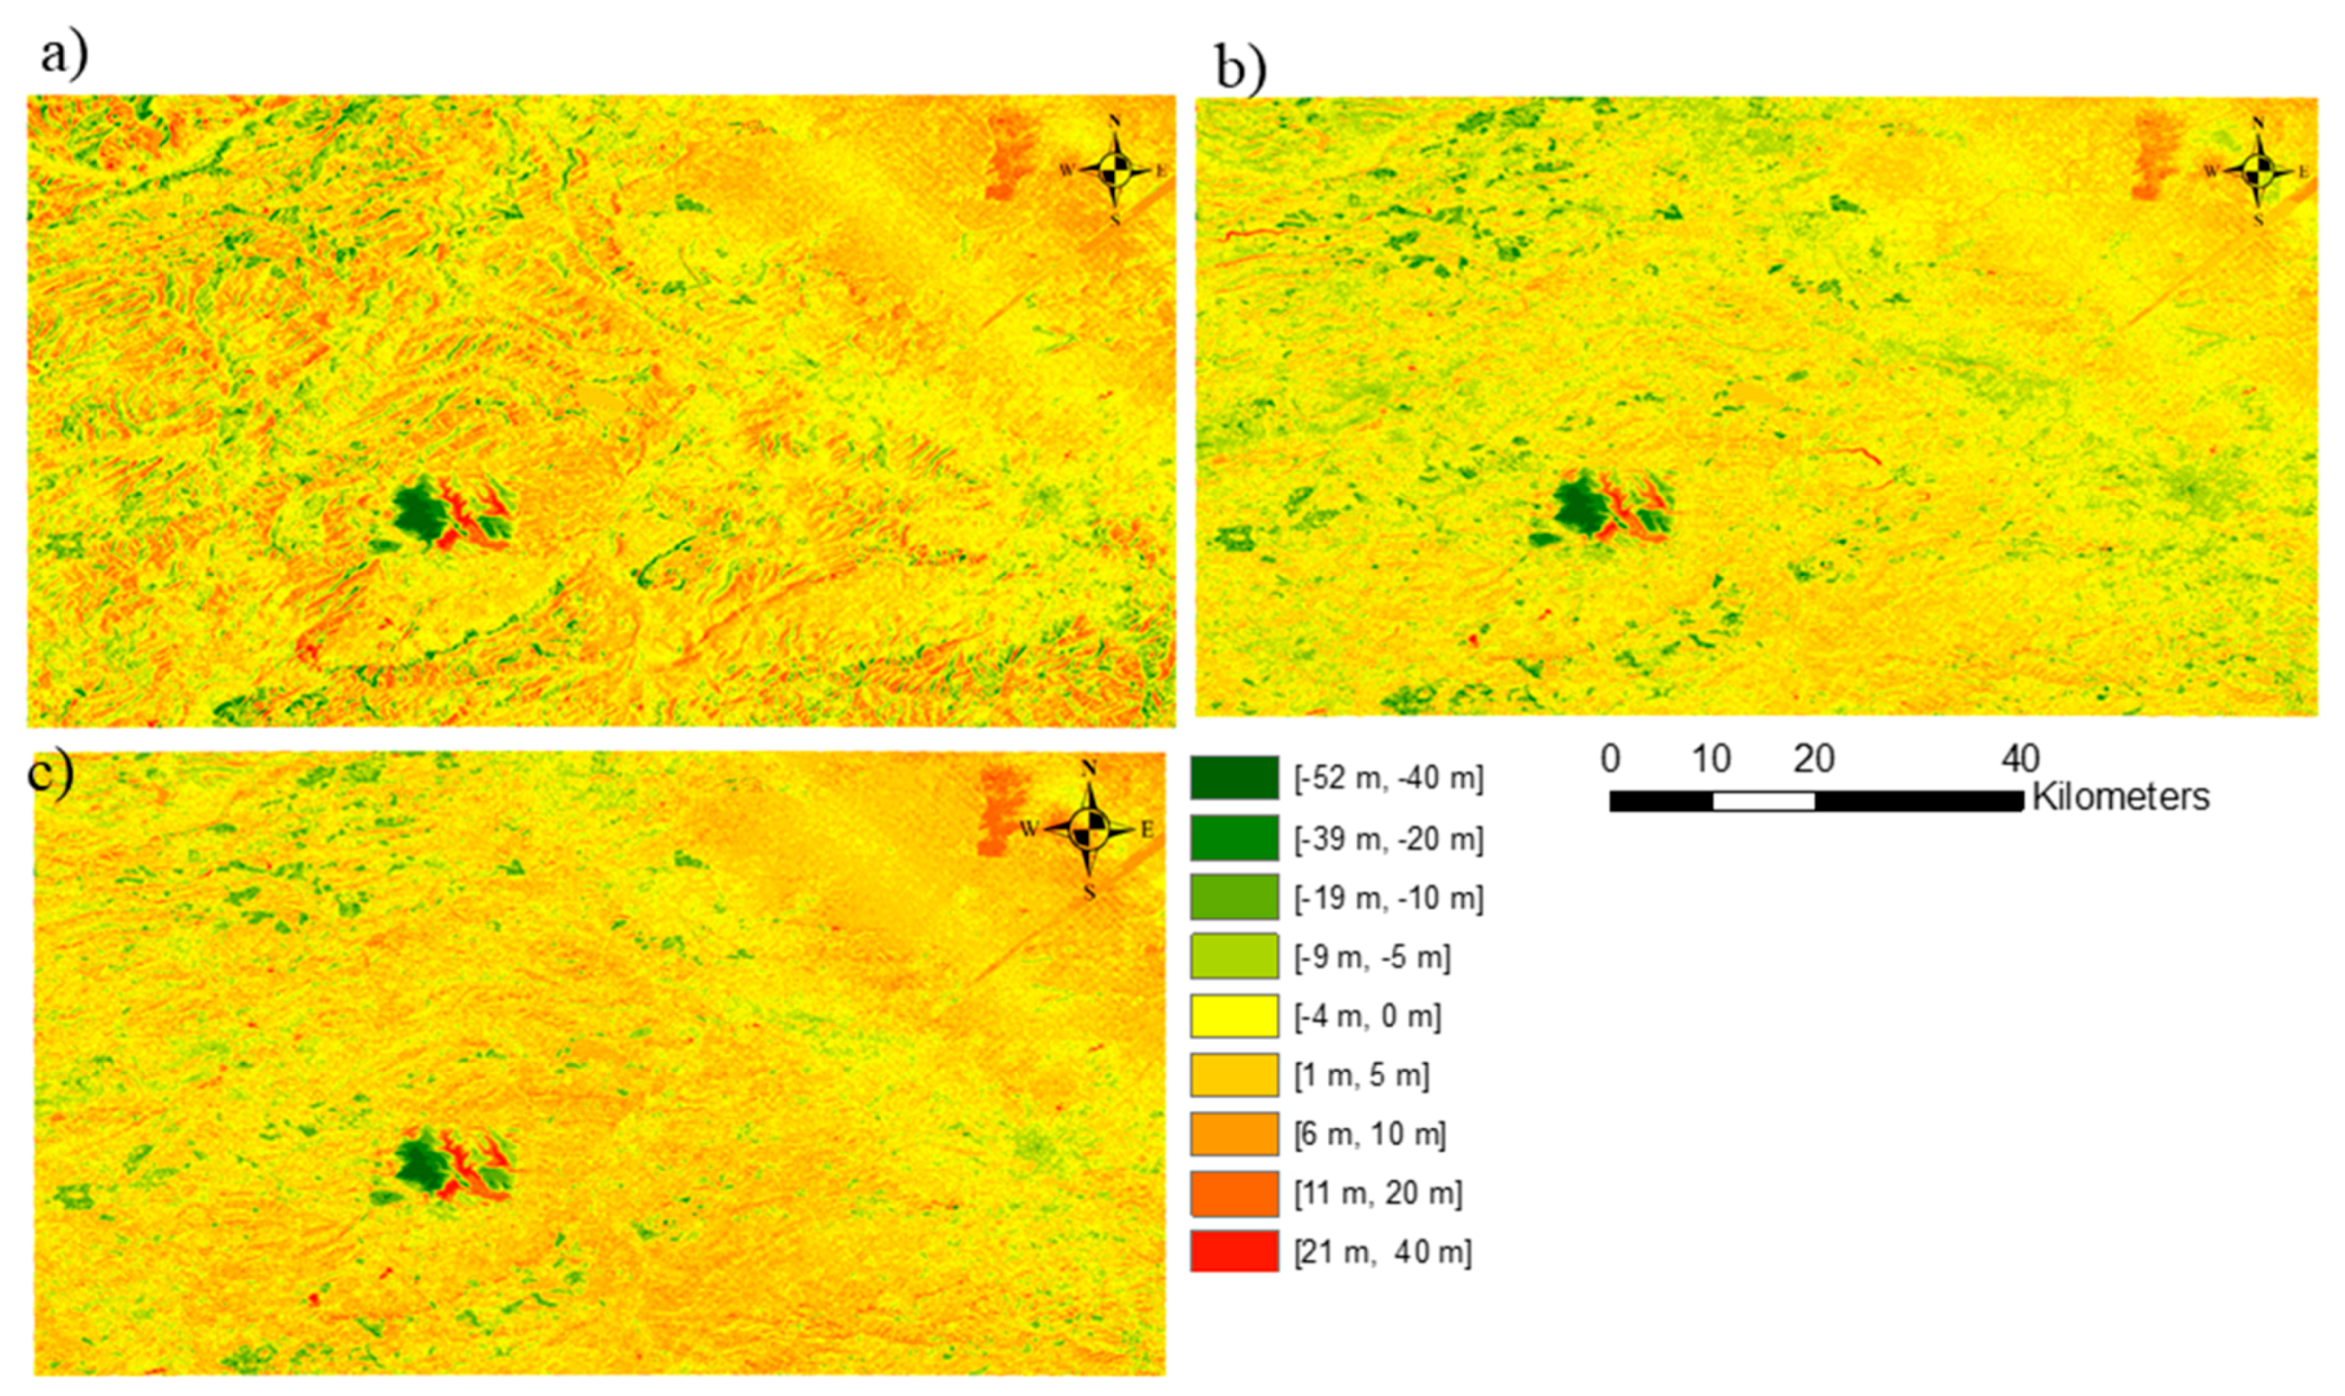
Figure 16 shows the spatial distribution of those differences for the original SRTM (a), the rebuilt DEM using rivers and streams (b), and the rebuilt DEM using only the rivers (c). It can be seen that there are more pixels in (a) and (c) in red, corresponding to positive differences between the reference DEM and the rebuilt DEM, with values in the interval 21 m to 40 m, while in (b) there are more regions in yellow and light orange (corresponding to differences close to zero) and much fewer regions in red. The regions with negative differences (shown in green) correspond to the regions where the rebuilt DEMs are higher than the reference DEM, and these regions are kept more or less unchanged. A closer analysis shows that these regions are located in the more elevated areas, where the drainage network used to rebuild the SRTM has less influence.

4.2. Slope Accuracy

Figure 17 shows the slope of reference DEM (a), of the original SRTM 30 DEM (b), and the slope of the rebuilt DEM using rivers and streams (c). Some differences can be observed, namely in the regions highlighted by black circles. For example, in zone (1) triangles can be easily identified in the data obtained from the reference DEM, clearly resulting from a DEM created using a Triangular Irregular Network (TIN).
Table 2 shows the results of the mean, standard deviation, RMSE, maximum and minimum values of the differences between the slope map derived from the reference DEM and the ones derived from the original SRTM 30, and the rebuilt DEM using OSM rivers and streams.
It can be seen that the mean difference between the slope maps derived from the rebuilt DEM using rivers and streams and the slope map considered as the reference decreases from 2.4 to −0.4 degrees, which is an indicator of a decrease in the systematic difference between the slope derived from the reference DEM and the slope derived from the original SRTM 30 and the rebuilt DEM. As for the other quality indicators, there is no significant change, which means that no additional gains were obtained regarding the spread of the differences. However, it should be mentioned that the differences in resolution between the reference DEM (50 m) and the original and rebuilt DEMs (30 m) may have a considerable influence over slope values, as these depend upon the difference in elevation and the horizontal distance between the considered points (pixels centroids).

4.3. Drainage Networks Accuracy

4.3.1. Horizontal Accuracy

Figure 18 shows the reference drainage network (a), the drainage networks obtained from the original SRTM 30 DEM (b), and the drainage networks obtained from the rebuilt DEM using the OSM rivers and streams (c), and only the OSM rivers (d). With a visual analysis some differences may be observed between the reference drainage network and the drainage networks generated from the original and rebuilt DEMs, particularly in the zone of lower elevation, corresponding to the upper right region. Even though it can be seen that there are a few disconnected lines in the reference drainage network in this region, it can be seen that in the plain zone the rebuilt drainage networks are closer to the reference than the one extracted from the original SRTM 30.
The procedure explained in Section 3.6.1 was used to quantify the closeness of the drainage networks obtained from SRTM 30 and the rebuilt DEMs to the ones used as a reference. Table 3 shows the mean and the standard deviation of the horizontal distance between the networks under analysis and the reference considering 500 m buffers around the reference drainage network. The results show a significant decrease of the distances between the drainage networks extracted from the rebuilt DEMs and the reference drainage networks, when compared to the distance between the drainage networks extracted from the original SRTM 30 and the reference. This decrease is larger for the DEM rebuilt with rivers and streams (the mean distance decreases from 87.0 to 52.9 m) than for the DEM rebuilt considering only the rivers (the mean distance decreases from 87.0 to 76.0 m). A decrease was also observed for the standard deviation and the RMSE, more substantial for this last accuracy indicator (from 143.01 to 111.5 m).
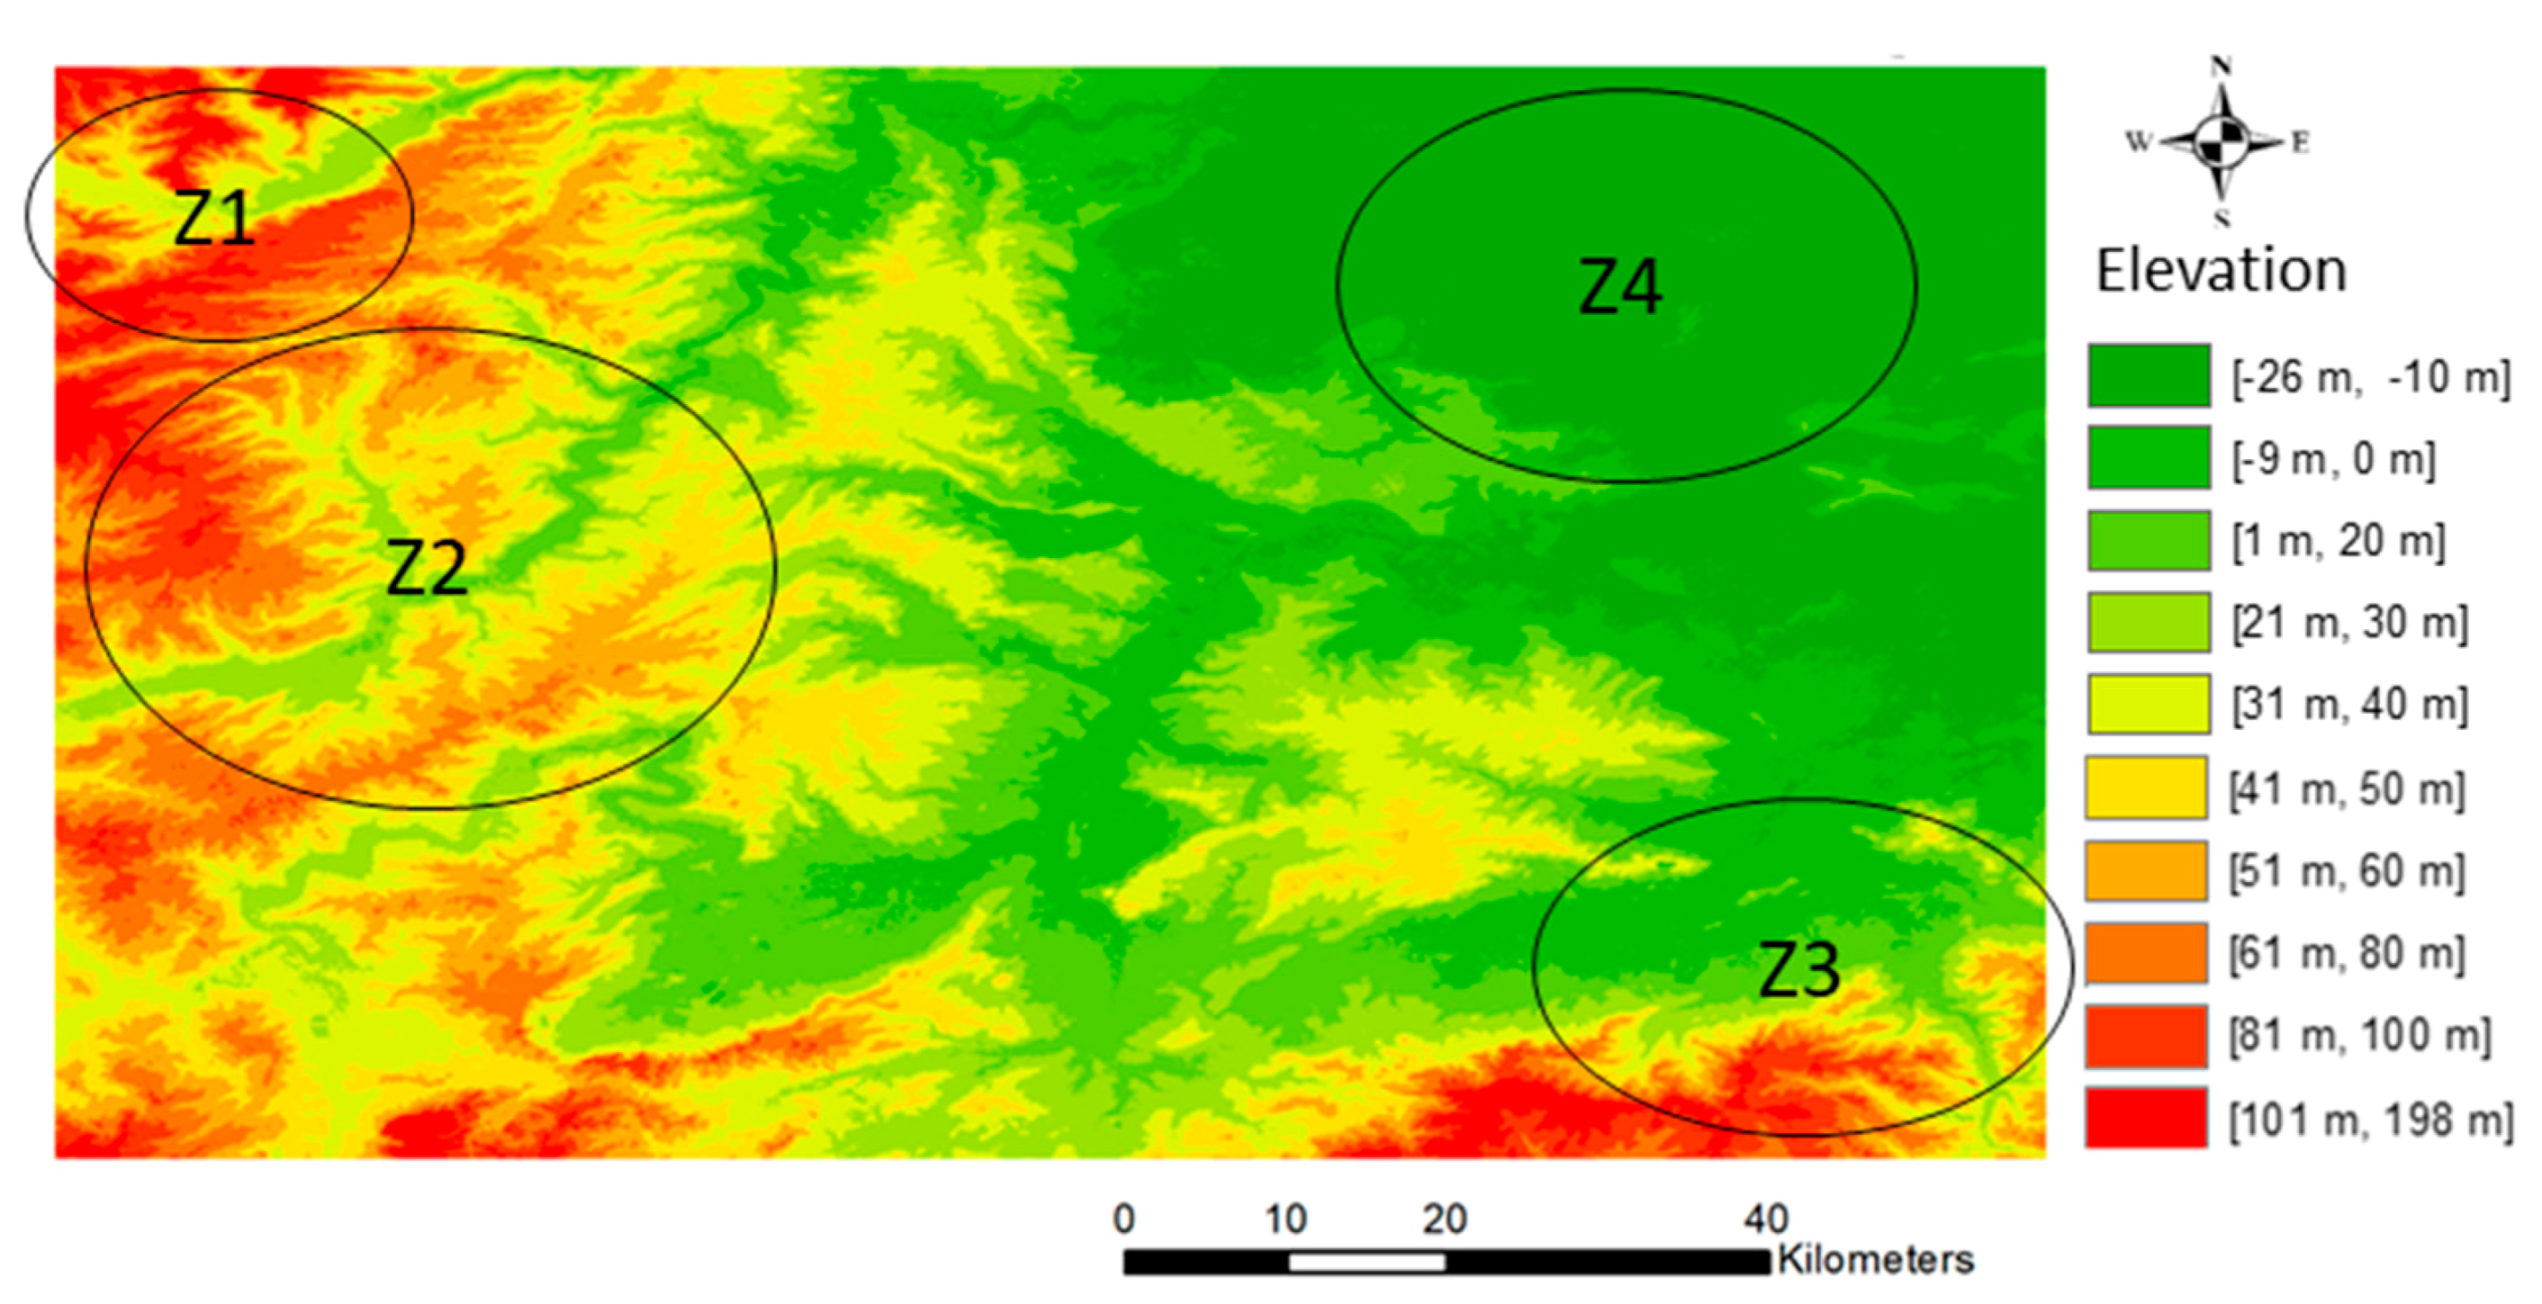
In addition to the analysis of the positional accuracy of the drainage network in the entire study area, an analysis was made for zones with different relief characteristics. Four zones were selected as indicated in Figure 19, referred to by Z1, Z2, Z3, and Z4. Zone Z1 corresponds to the region with higher elevation, zones Z2 and Z3 correspond to transition zones to flat regions, and zone Z4 corresponds to a flat zone.
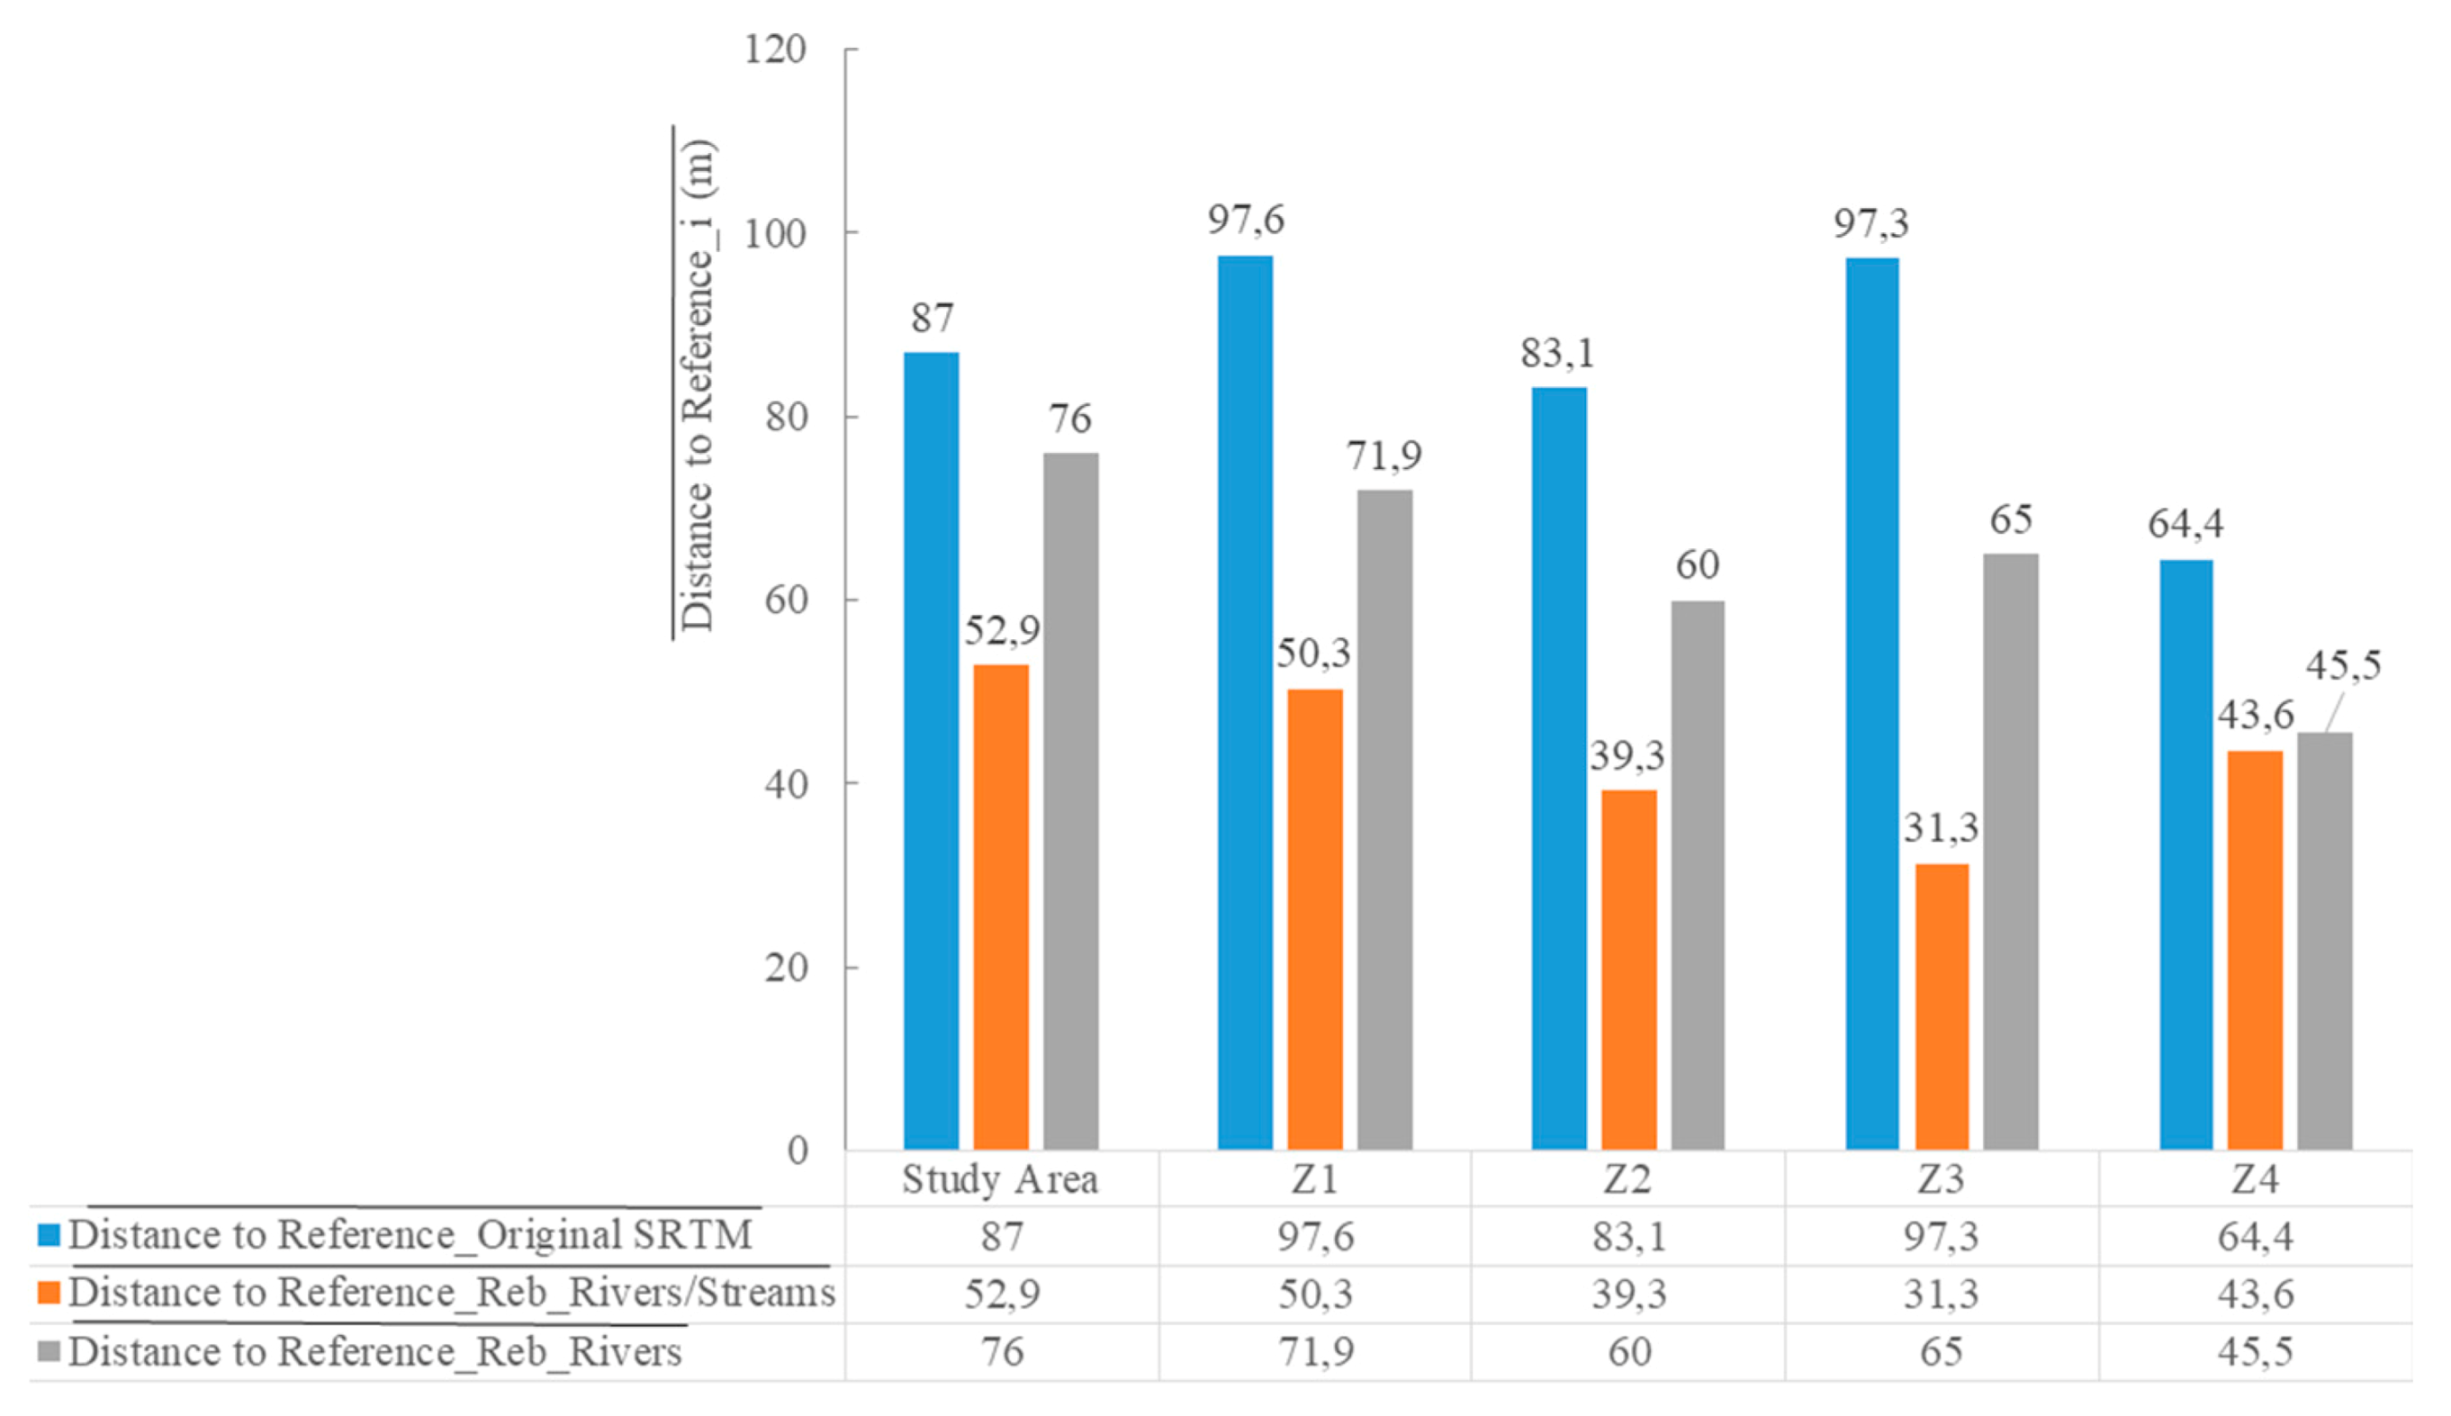
Figure 20 shows the mean, which is the quality indicator showing largest changes, of the horizontal distances between the reference drainage network and each drainage network under study for the whole study area and for zones Z1, Z2, Z3, and Z4.
The results show that for all regions the best results are obtained for the DEM rebuilt with OSM rivers and streams, and that the largest improvements were obtained for zones Z2 and Z3 (transition zones for the flat regions), where, for example for zone Z3 the mean distance to the reference lines decreased from 97.3 m for the networks extracted from the original SRTM 30 to 31.3 m for the network extracted from the rebuilt DEM using OSM rivers and streams.

4.3.2. Vertical Accuracy

The vertical accuracy of the drainage networks was assessed as described in Section 3.6.2. Table 4 shows the mean, standard deviation, and RMSE of the vertical differences between the elevations extracted from the reference DEM and the elevations extracted from each DEM under analysis.
These results show that the mean vertical differences between the drainage networks extracted from the rebuilt DEMs decreased when compared to the values obtained for the drainage networks extracted from the original SRTM 30, corresponding to a reduction of the systematic distance between the reference and the rebuilt DEM drainage networks. However, the values of the standard deviation and RMSE increase slightly, therefore, showing no improvement at all in the spread of values around the mean deviation.
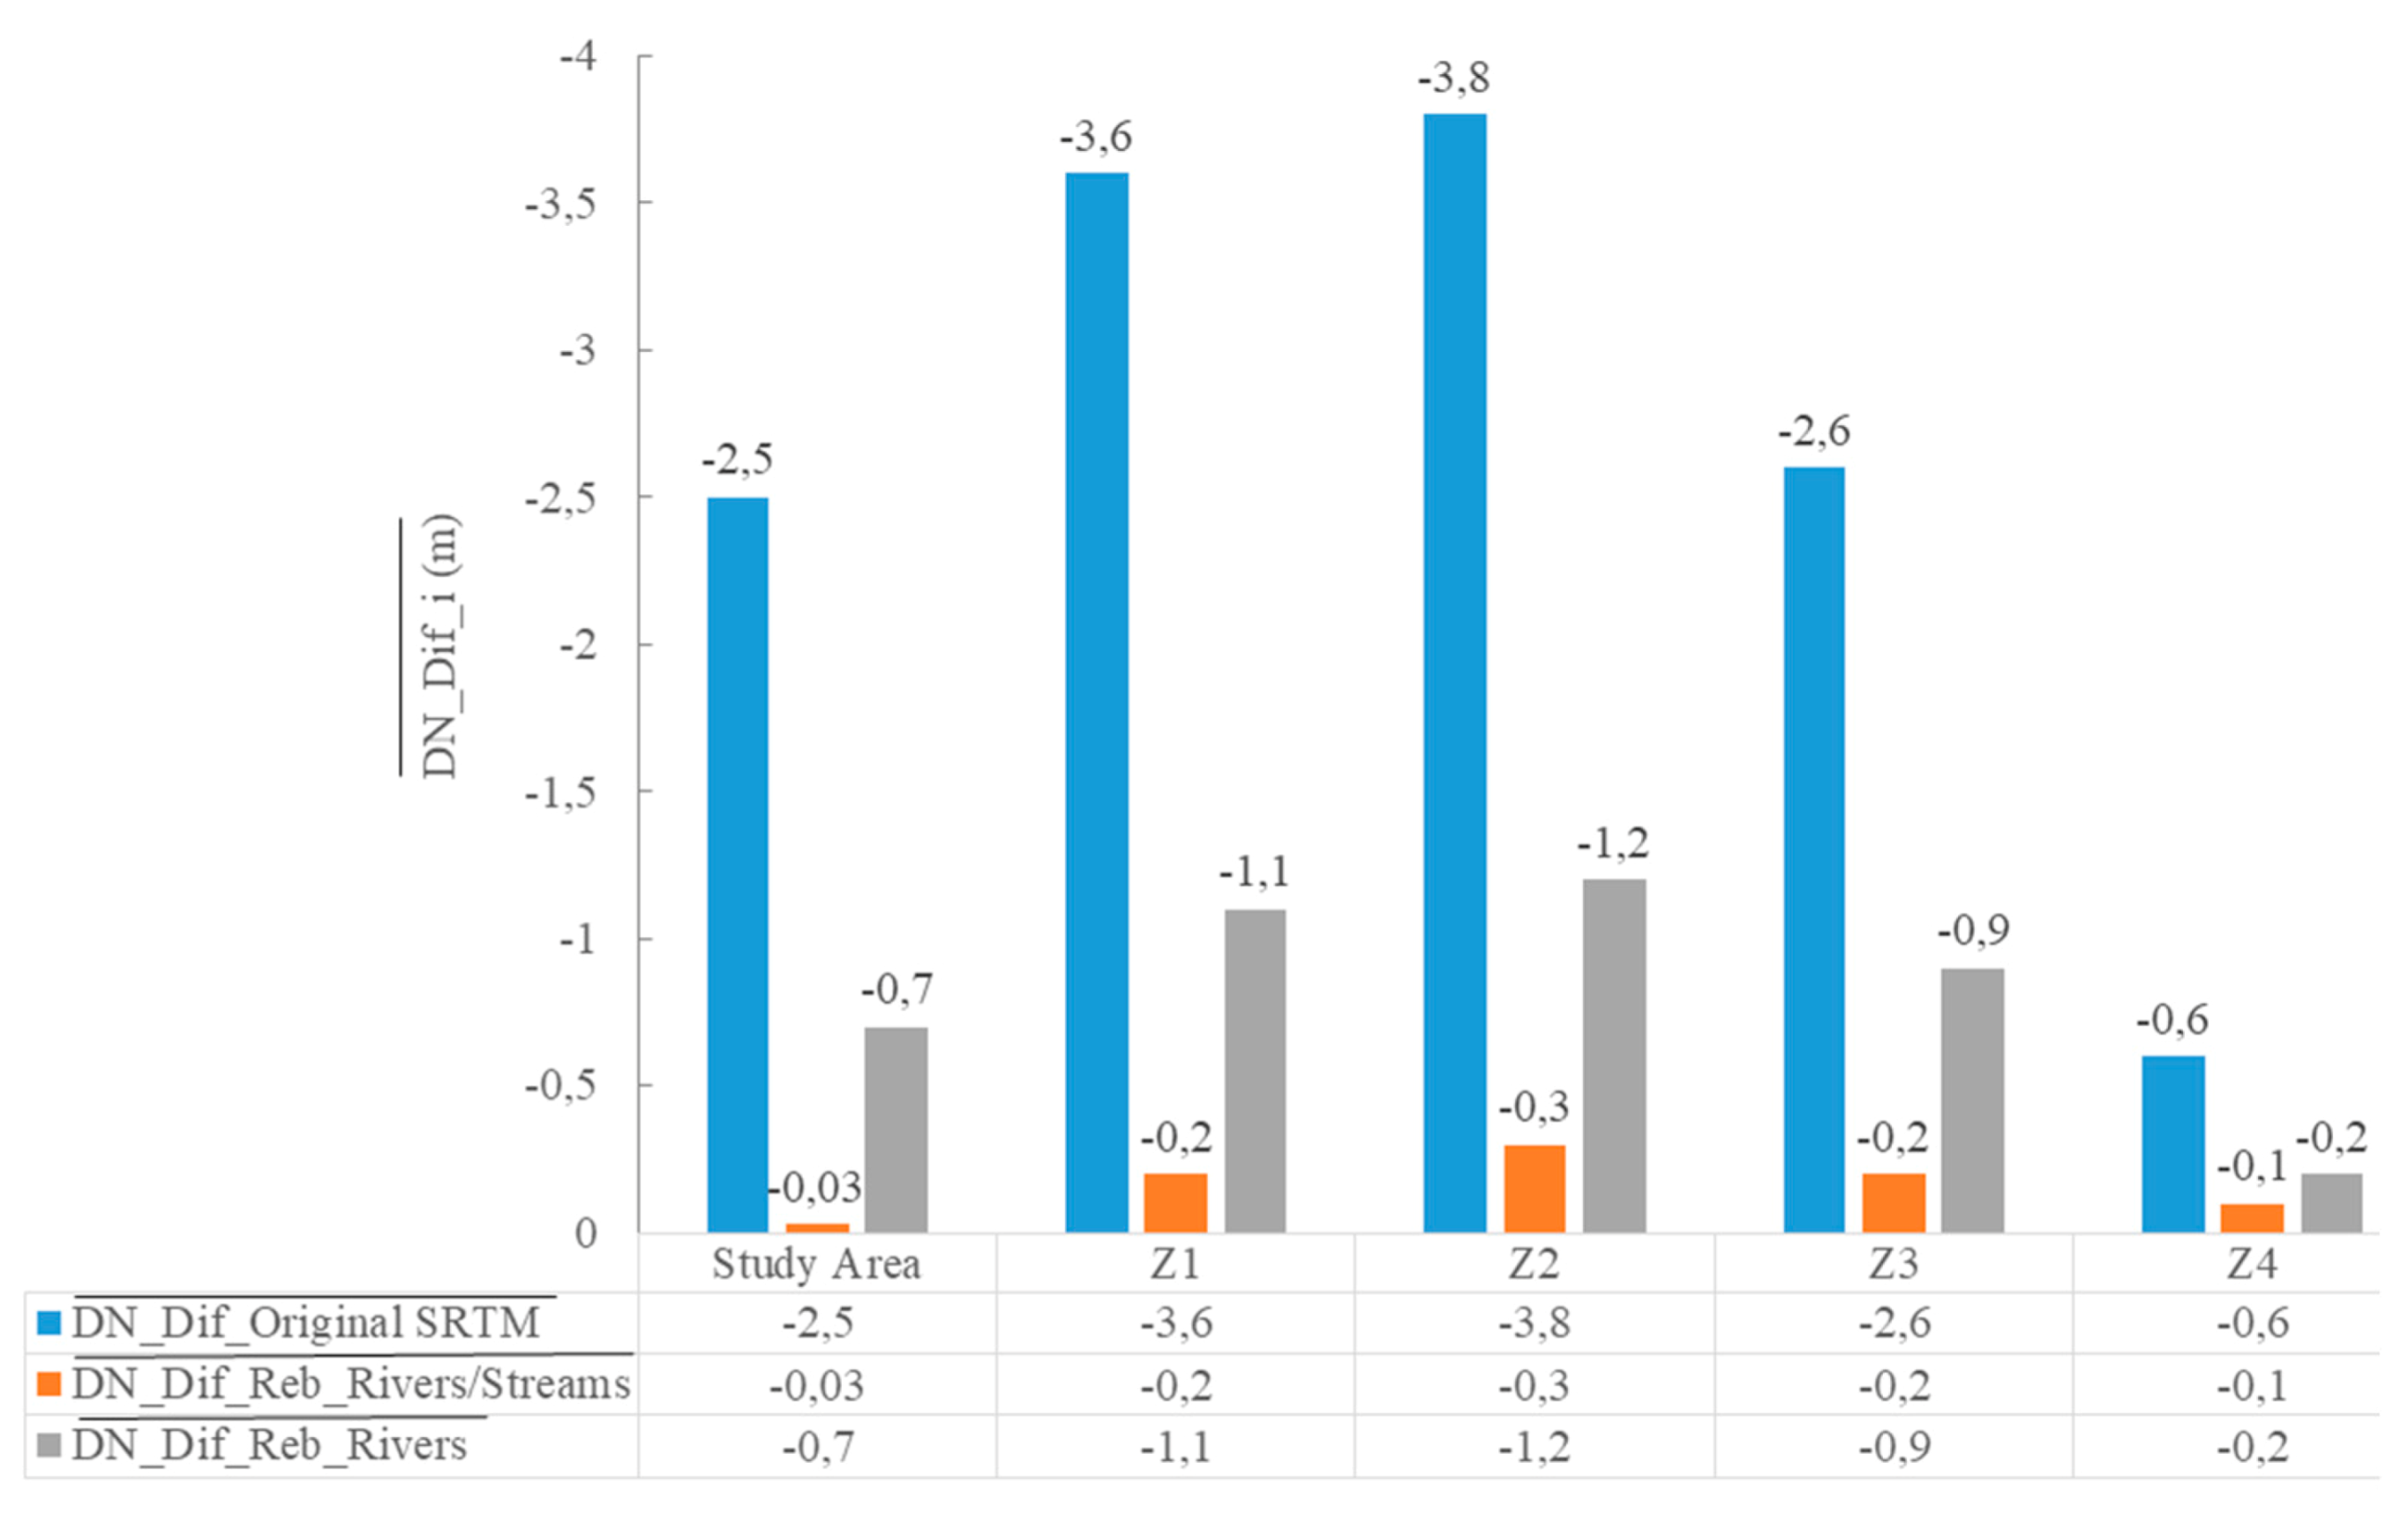
Figure 21 shows a graph where the mean of the vertical differences between the reference drainage network and the drainage networks extracted from the original SRTM 30 and the rebuilt DEMs using OSM rivers and streams and only OSM rivers is represented for the complete study area and for zones Z1, Z2, Z3, and Z4.
A decrease of the mean differences was obtained for the whole study area, where a decrease from −2.5 m to −0.03 m can be observed, and also for all zones. Once again, the results using the DEM created using OSM rivers and streams are better, with the lowest improvement in relation to the rebuilt DEM obtained using only rivers occurring in zone Z4, corresponding to a flat region, where the influence of the streams is less important to correct the DEM. The values of the standard deviation obtained for zones Z1 to Z4 were, however, lower than the ones obtained for the whole study area, respectively 1.9, 2.9, 1.7, and 1.0 for zones Z1 to Z4 for the drainage networks obtained from the rebuilt DEM using rivers and streams, and 1.9, 2.1, 1.5, and 0.9 for the drainage networks obtained from the rebuilt DEM using only OSM rivers. This also shows that there is less spread of values in the flatter regions, as expected.

4.3.3. River Analysis

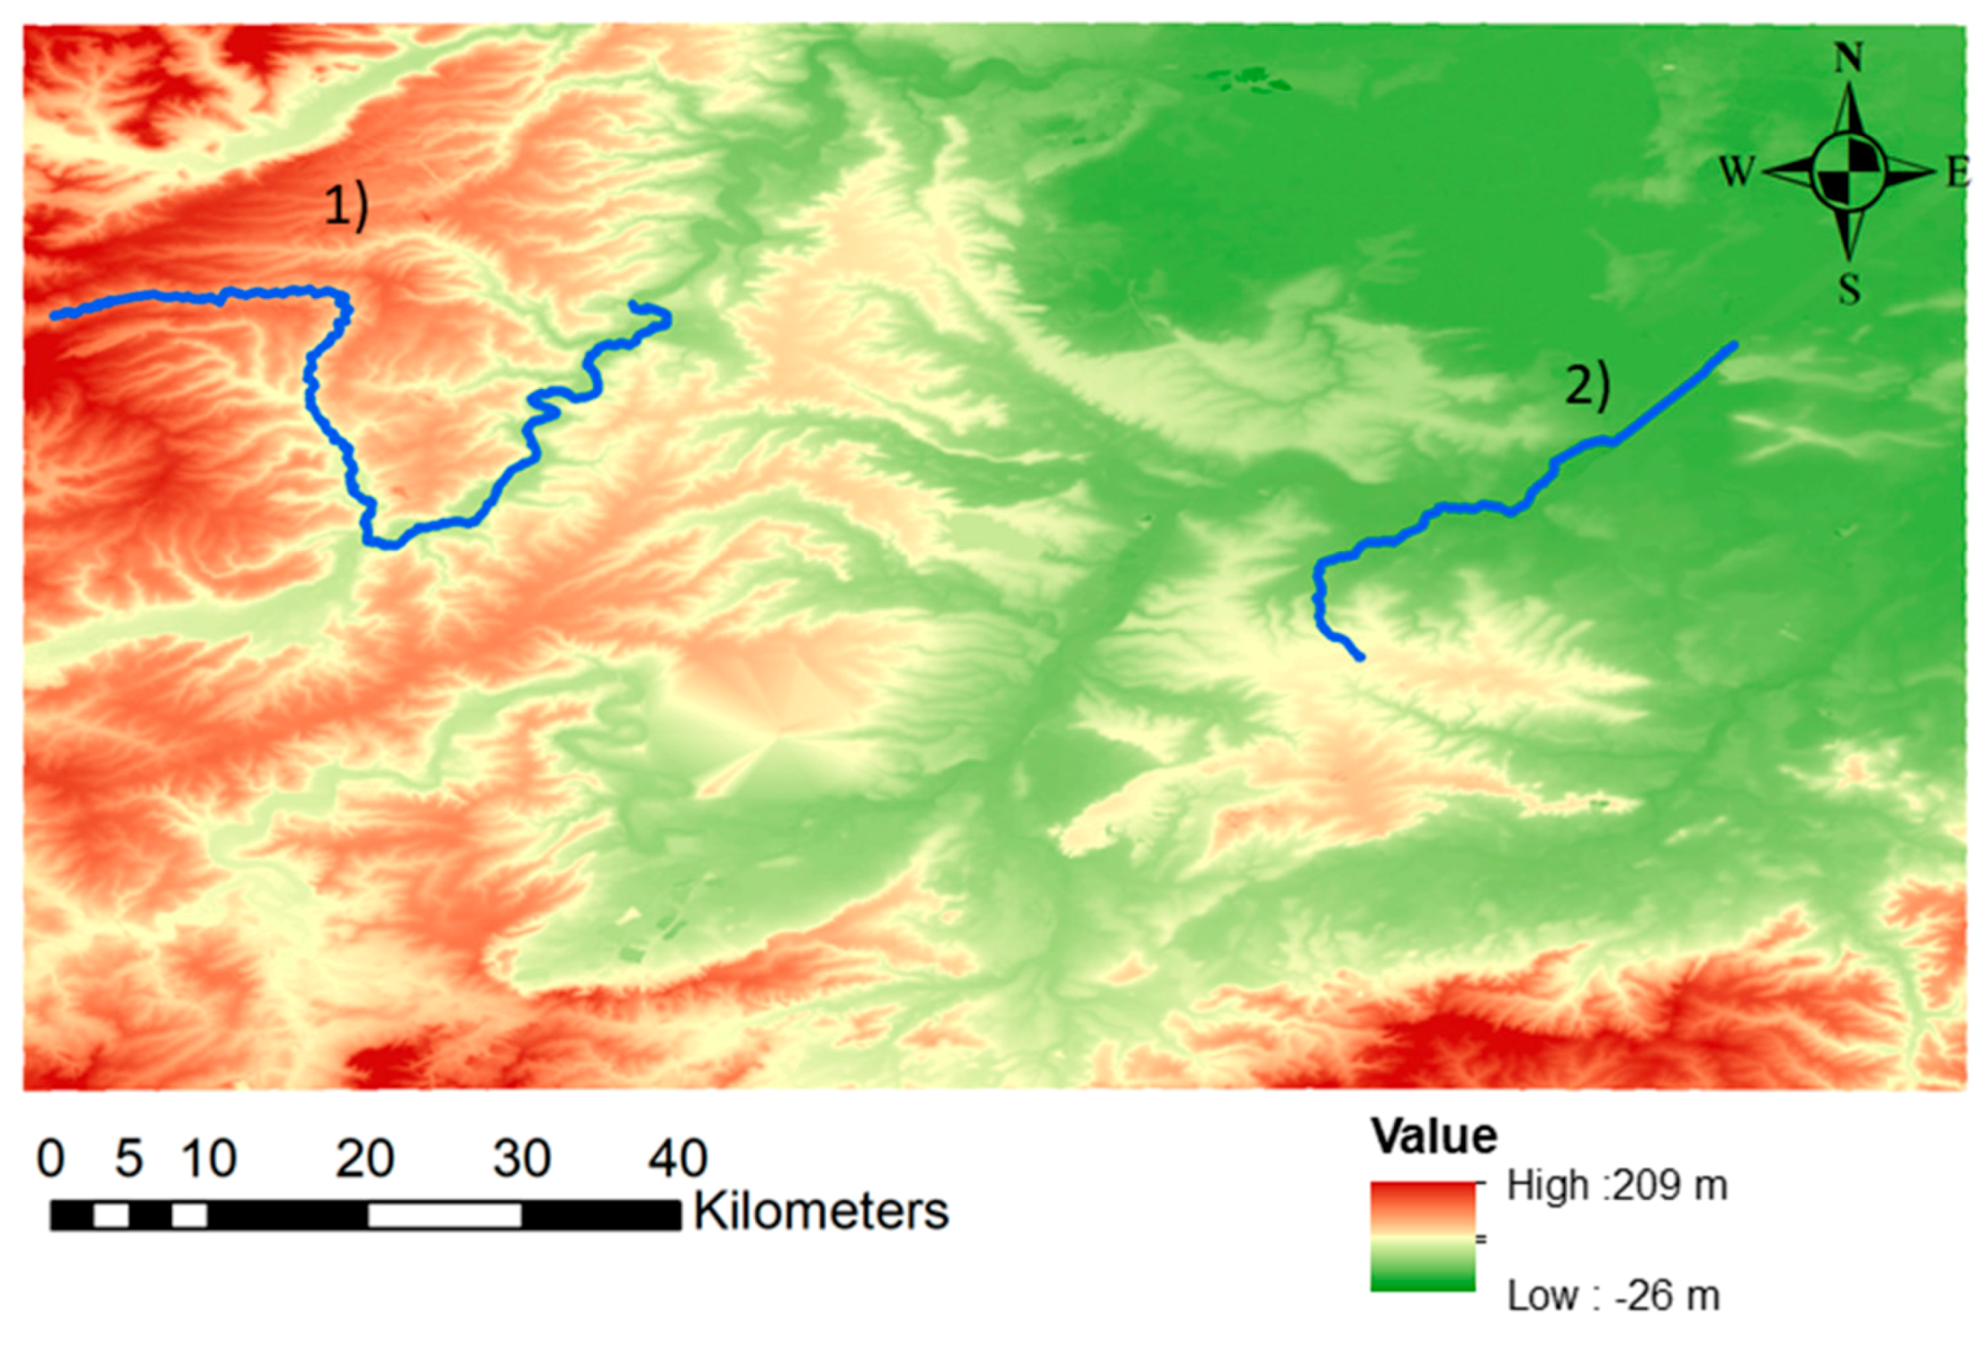
A more detailed analysis of the changes obtained with the rebuilt DEMs was made for two river sections in the study area, located in regions with different types of relief. Figure 22 shows the location of the analysed rivers sections. The one indicated as (1) is located in a region with higher altitude and steepest slopes, and river section (2) is located in a relatively flat region.
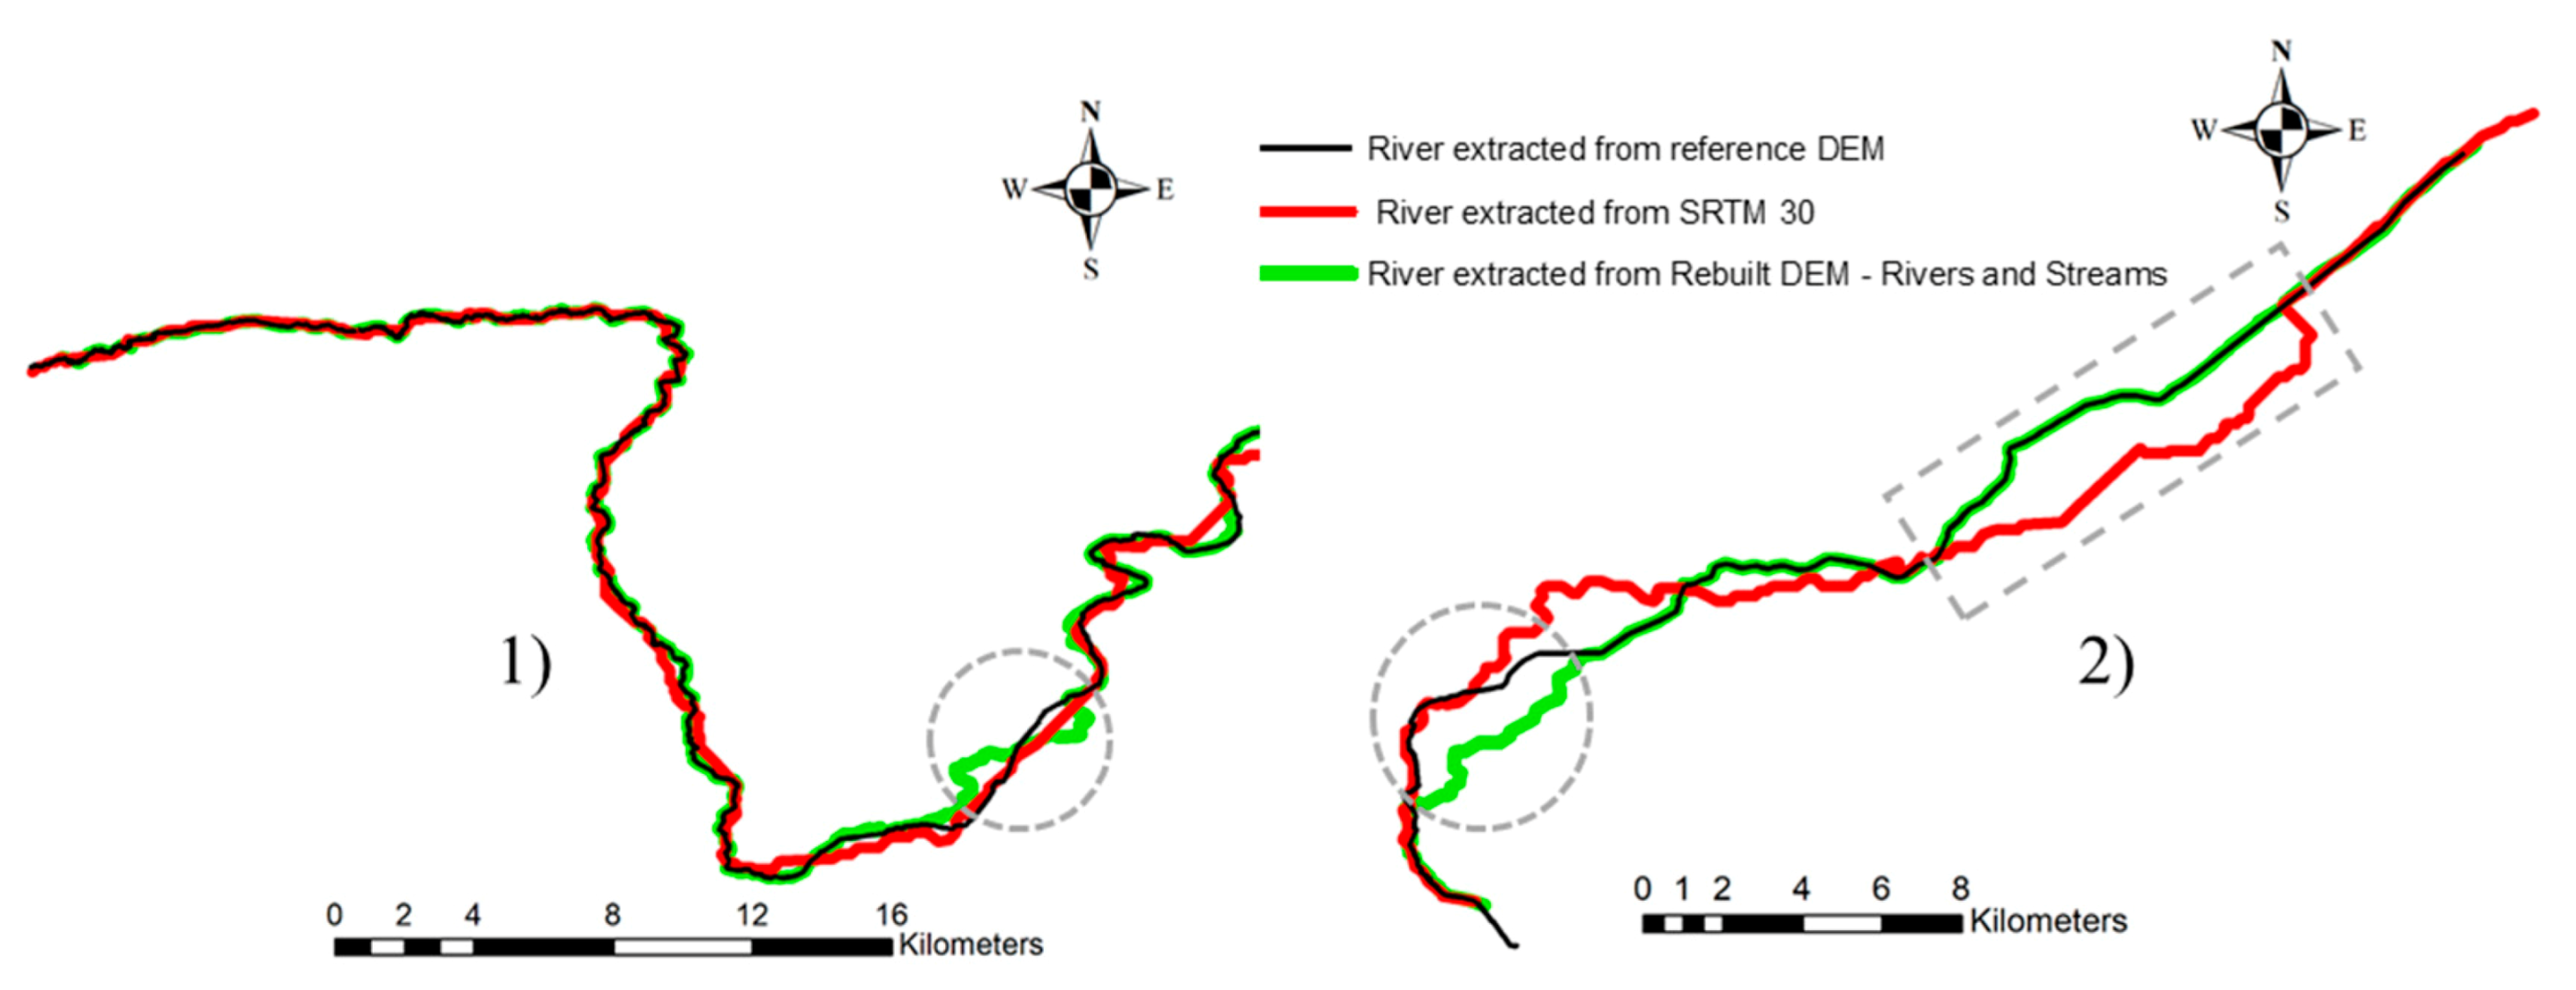
Figure 23 shows the horizontal position of the river sections indicated in Figure 22 extracted from the reference drainage network, from the original SRTM 30, and from the DEM rebuilt with OSM rivers and streams.
Observing Figure 23 it can be seen that in most regions the rivers sections extracted from the rebuilt DEM are coincident with the reference data, except in the regions highlighted with dashed circles. Additionally, for river section (2) the rebuilt DEM enabled correcting the position of a large section of the river when compared to its location extracted from SRTM 30, highlighted with a dashed rectangle, where the horizontal distance between the lines originally reached approximately 1700 m.
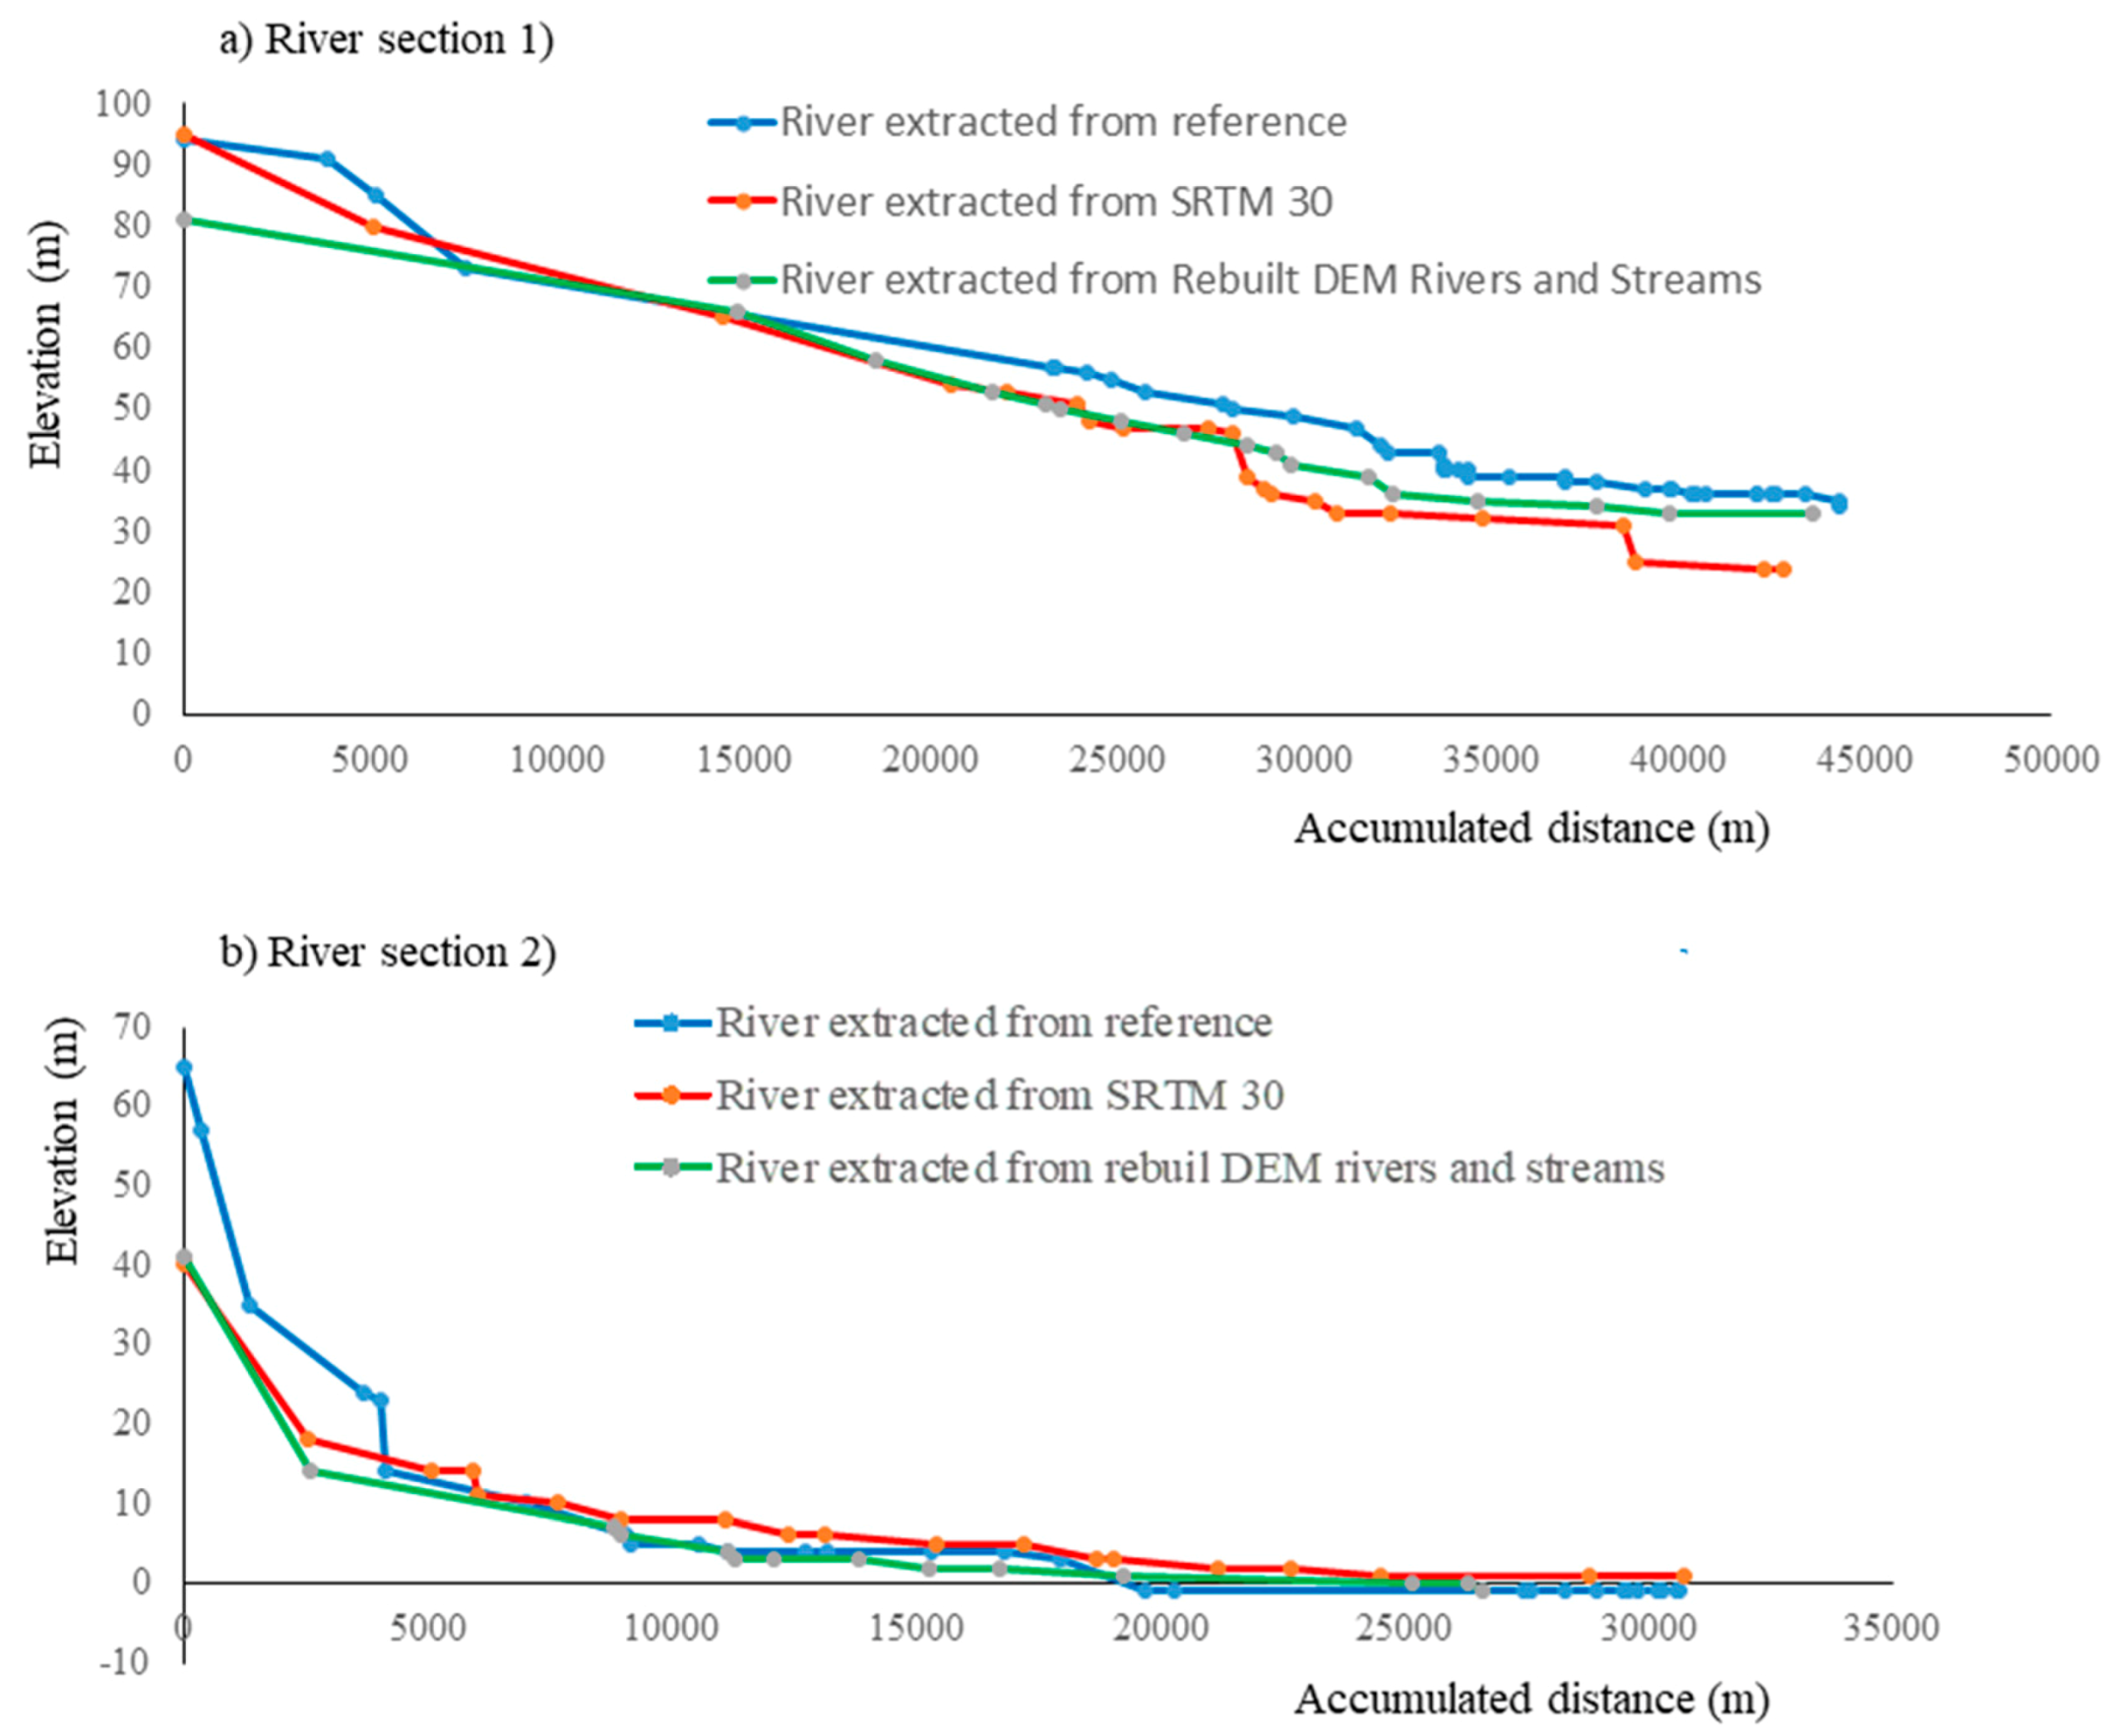
Figure 24 shows the profiles of the river sections indicated in Figure 22 and Figure 23. It can be seen that, in both cases, the drainage network obtained from the rebuilt DEM is, in general, closer to the reference data. The only exception is in the beginning of river section (1) (between 0 m and 5000 m of accumulated distance), where the vertical difference between the reference and the rebuilt line take values near 14 m. It can also be observed that, in this river section, the lower differences take place between the accumulated distances of 7000 m and 16,000 m for the SRTM 30 and rebuilt lines. For river section (2) the largest vertical difference between the reference and the rebuilt line occurs at the beginning of the river section with a value near 25 m. It can also be seen that the major differences of elevation between the reference and the drainage networks extracted from SRTM 30 and the rebuilt DEM occur until 4000 m of accumulated distance, corresponding to the region with a major variation in elevation. In the remaining part of this river section, corresponding to the regions of lowest altitude, both lines showed an increasing approximation to the reference.

4.4. Basin Accuracy

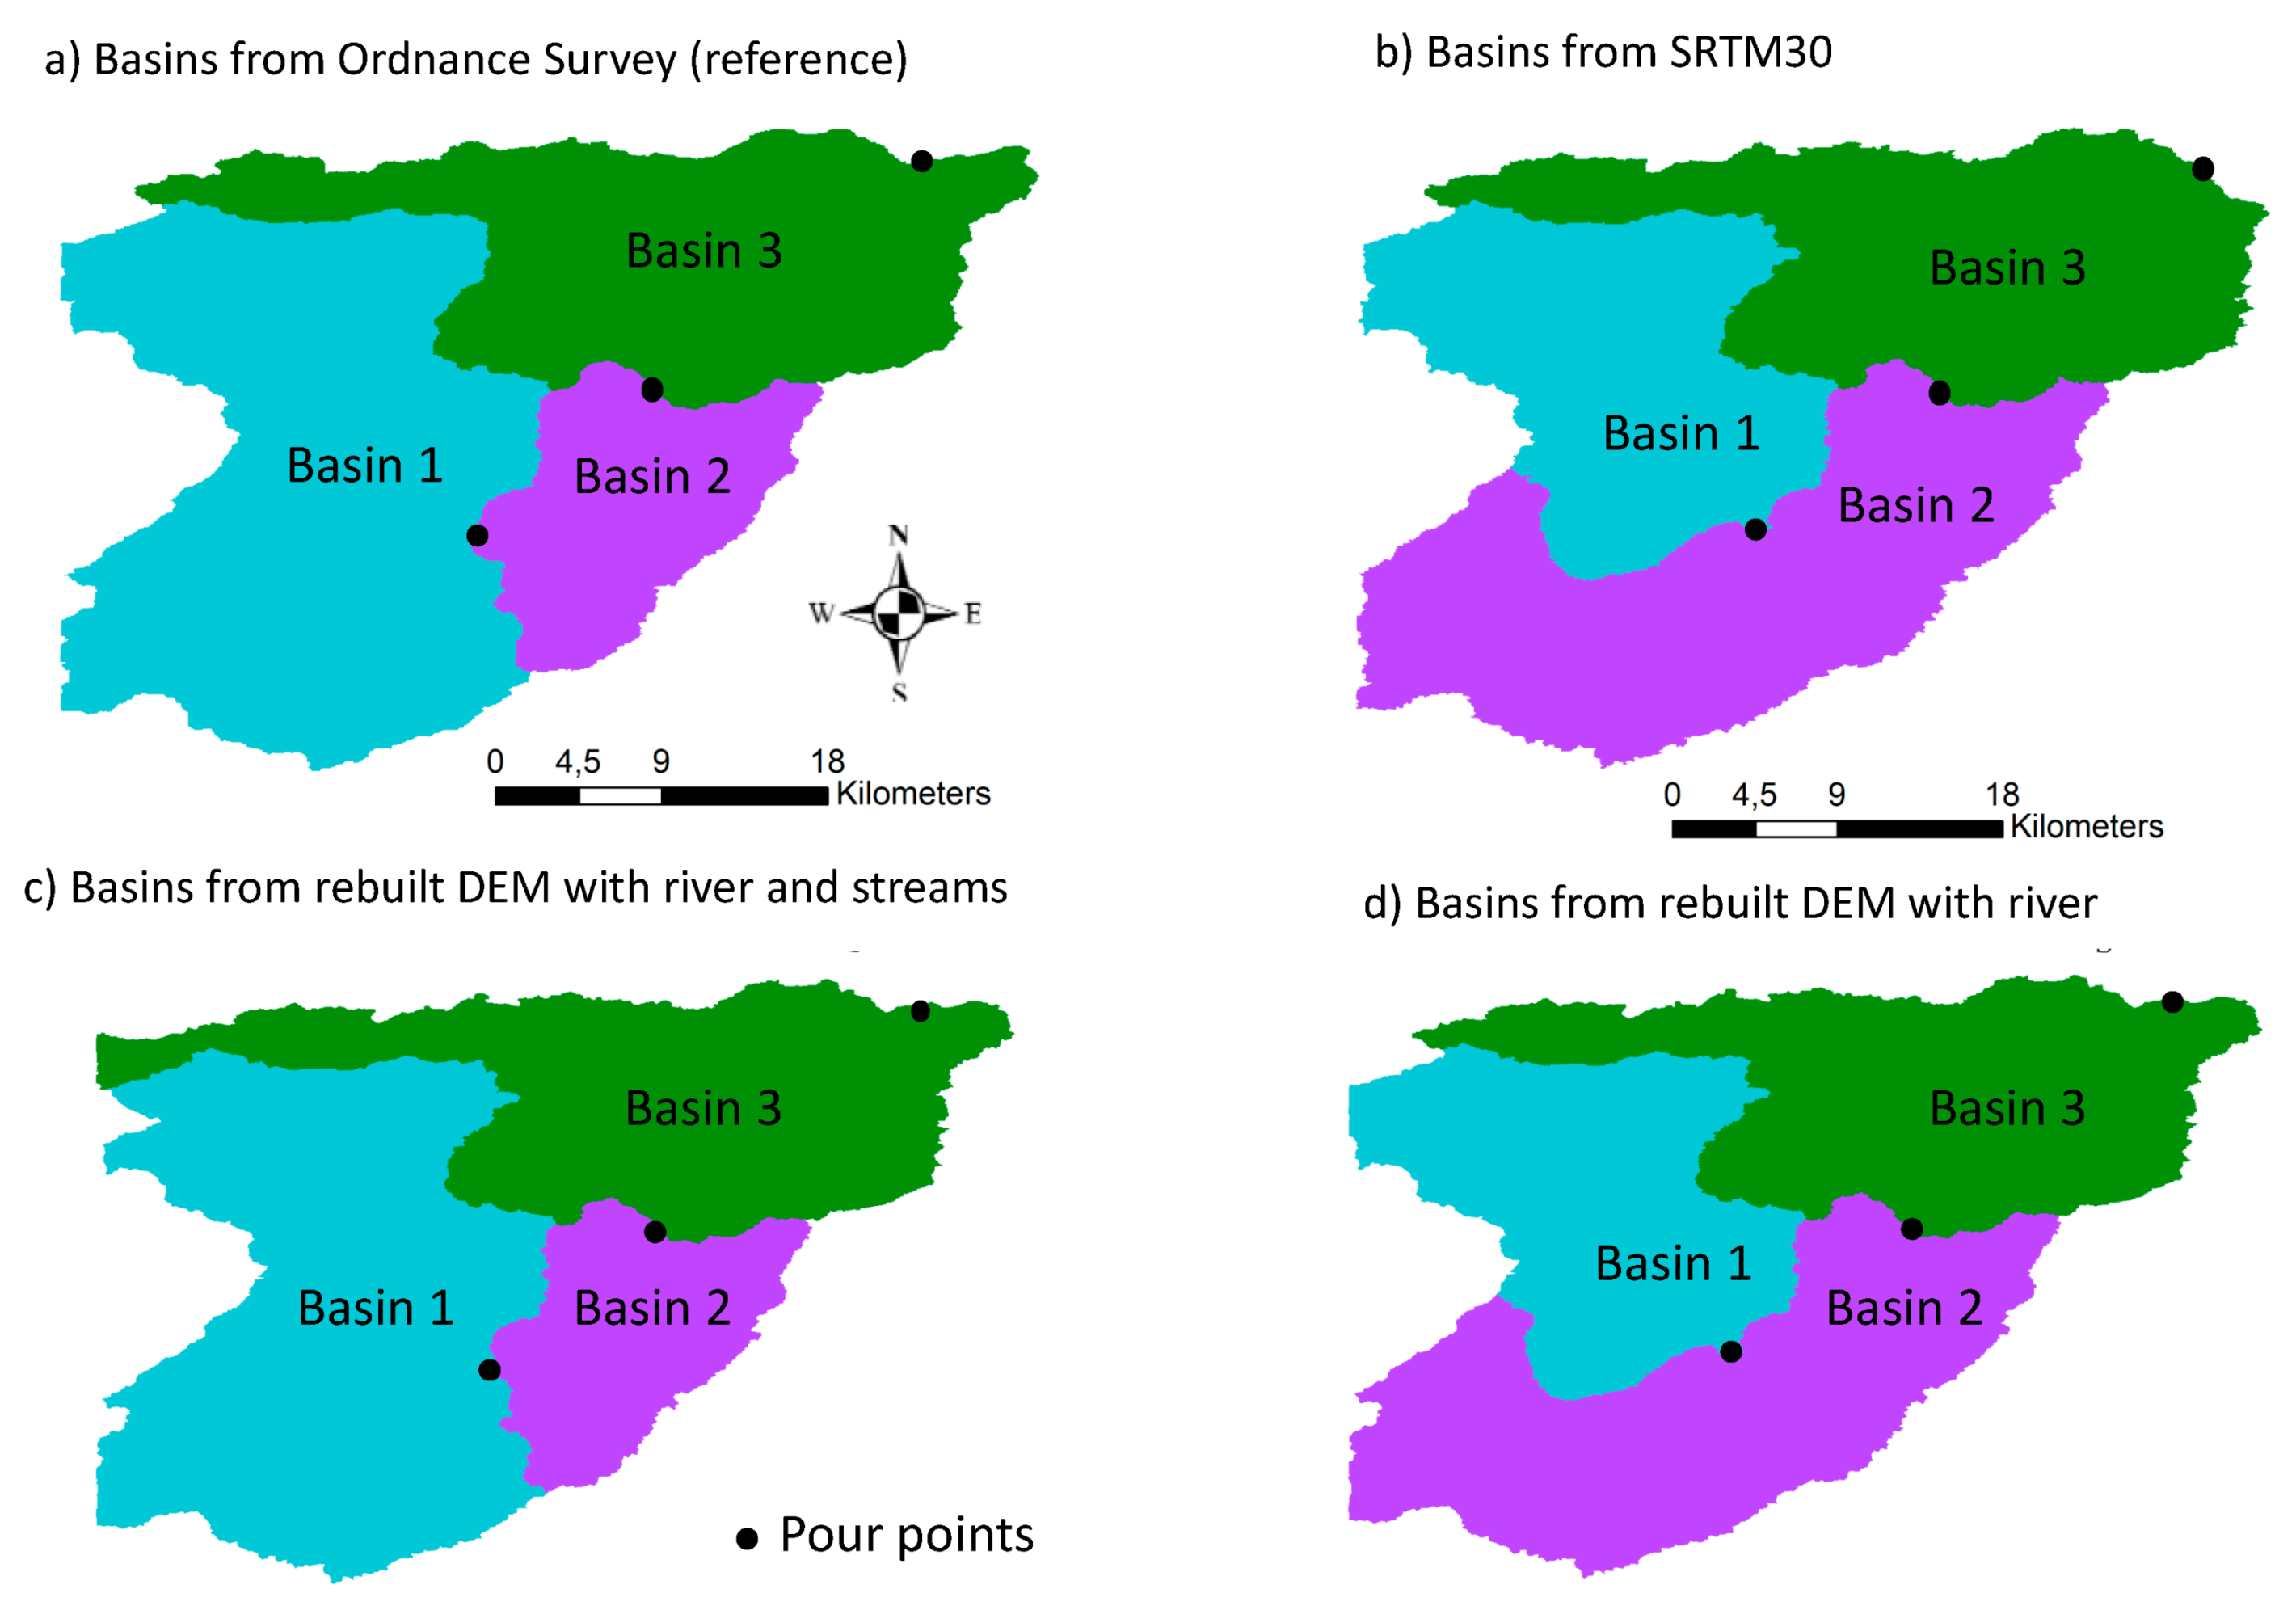
Figure 25 shows the basins obtained for the three pour points selected for the analysis of corresponding basins. It can be seen that the shape and dimension of the basins obtained with the rebuilt DEM considering OSM rivers and streams (c) are very similar to the ones obtained with the reference DEM (a). The basins obtained from the original SRTM 30 (b) present significant differences from the ones obtained from the reference DEM for basins 1 and 2, and the results obtained from the rebuilt DEM using only OSM rivers is very similar to the ones obtained from the original SRTM.
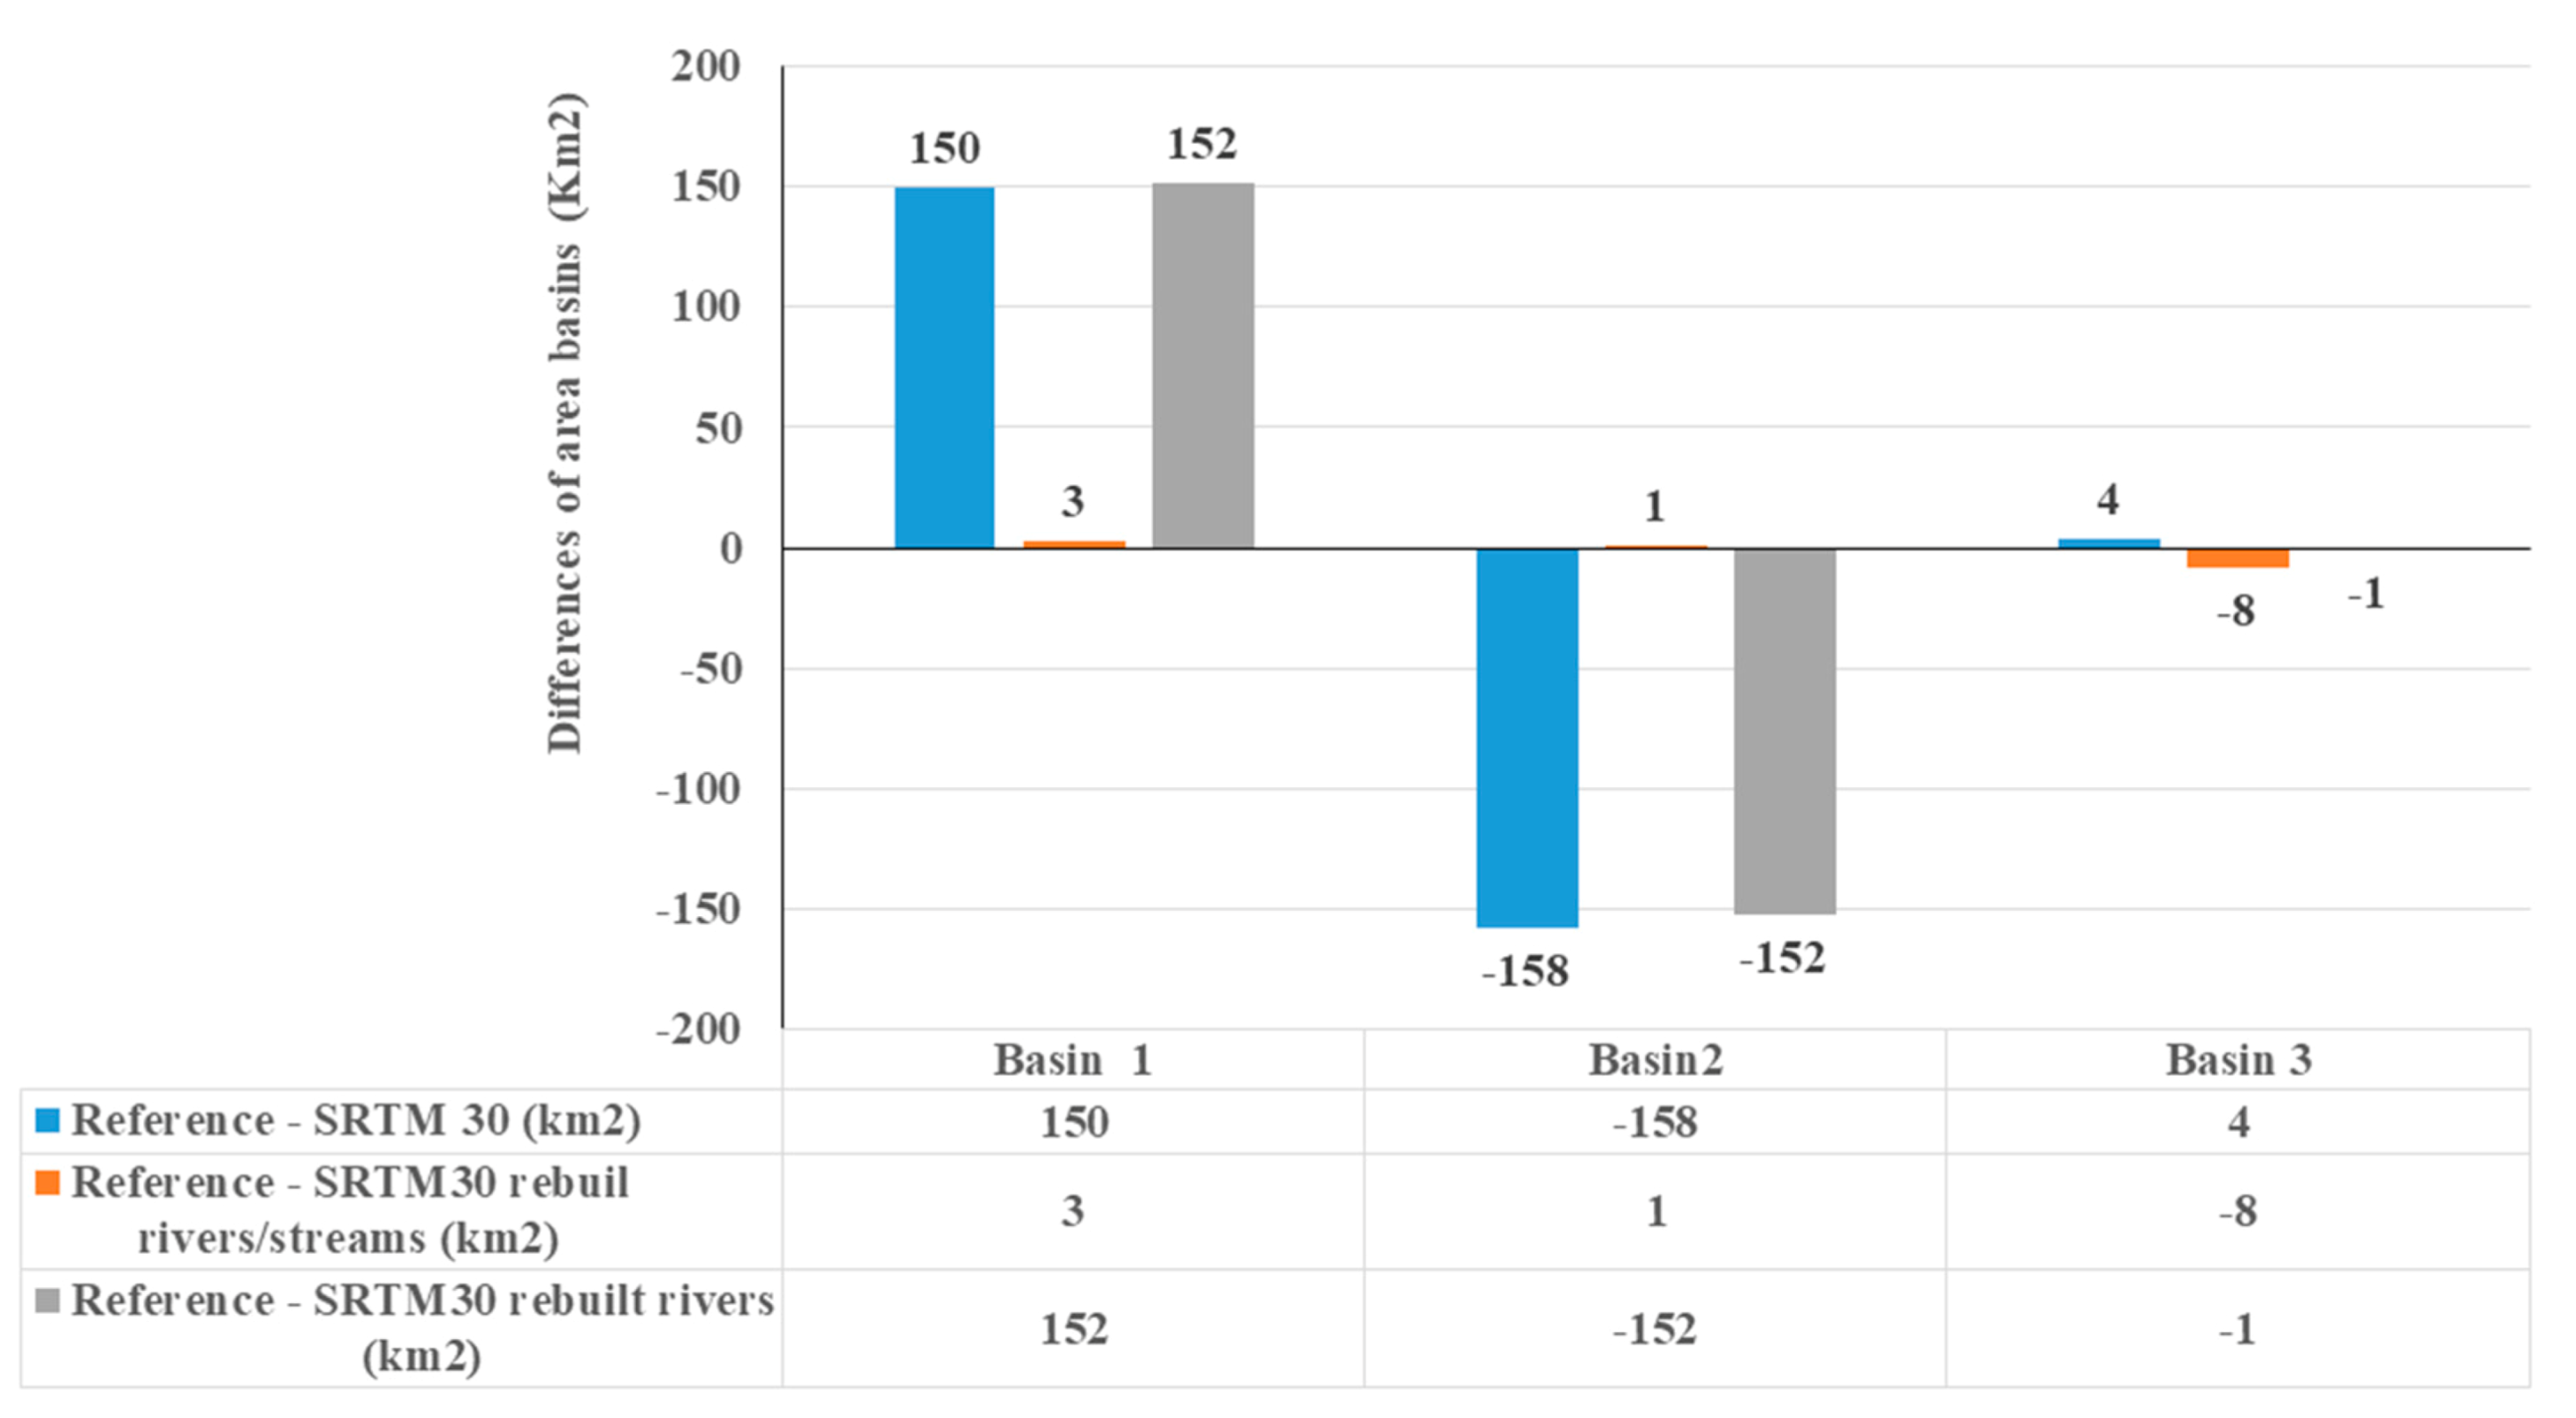
Figure 26 shows the area differences between the basins obtained from the reference DEM and the ones obtained from SRTM and the rebuilt DEMs. It can also be seen that the areas of the basins obtained from the rebuilt DEM with OSM rivers and streams are very similar to the ones obtained from the reference DEM, with a larger difference for Basin 3 (−8 km2), due to the extra region identified at the top left of the study area (Figure 26a,c).

5. Conclusions

A methodology was applied to create a new DEM using elevation data extracted from the GDEM SRTM 30 and waterways extracted from the collaborative project OSM. The conversion process requires the extraction of elevation points from the DEM and the selection in OSM of the feature’s “key” and “values” that correspond to natural waterways. Clearly incorrect OSM features then need to be removed from the data. This was made by visual analysis over a satellite image. The remaining features are then analysed in terms of the line orientation, as the interpolation method used to create the rebuilt DEM requires the use of waterways oriented from upstream to downstream. The orientation of the lines with the opposite orientation needs to be changed before the interpolation is performed to generate the new DEM. An analysis was made using rivers and streams extracted from OSM and only rivers, to determine, on one hand, if using only the rivers would have any improvement over the original, as in many regions of the world only the main waterways may be available in OSM, and, on the other hand, to assess if the streams, which are likely to have more errors, as they are harder to identify on the satellite images used as background for feature digitization in OSM, would introduce additional errors. The methodology was applied to a study area in the United Kingdom, and the DEM and drainage network available from the Ordnance Survey website were used as reference data to assess the accuracy of the obtained results.
The results show that using the rivers and streams extracted from OSM waterways enables to decrease the mean vertical distance between the rebuilt DEM and the reference DEM, which shows a reduction in the systematic error in relation to the original SRTM 30. The same was observed for the slope map extracted from the rebuilt DEM. The drainage networks extracted from the rebuilt DEM have better horizontal accuracy. When the elevation of the reference DEM is associated to the reference drainage network and the elevation of the other DEMs is associate to the drainage networks extracted from them, a slight improvement in the mean vertical distance between the reference data and the elevation of the drainage networks extracted from the rebuilt DEMs in relation to the original SRTM can be observed, even though no improvements were observed in the standard deviation, showing no improvements in the spread of values around the mean. The basins obtained from the rebuilt DEM for selected pour points also showed a higher accuracy than the original ones extracted from SRTM 30. This indicates that even though no altimetric data is usually available is OSM, it is a valuable source of data to improve the information provided by the GDEMs, which may be very useful for parts of the world where accurate local, regional, or national DEMs with higher accuracy are not available.
The use of OSM data, however, raises several problems, which include: (1) few waterways may be available in OSM for some parts of the world; (2) OSM data may have low quality in some regions, including lines that do not correspond to rivers or streams, which were either wrongly classified or digitized by the volunteers. Regarding the first point, it was shown that even if only the main rivers are available, this can already improve some parts of the DEM, resulting in a slight improvement of the data extracted from them. Regarding the existence of wrong data in OSM; these need to be filtered prior to the application of the proposed methodology. The extraction of clearly erroneous data and the correction of the orientation of the segments is extremely important to actually improve the results and not produce erroneous relief artefacts. After creating the rebuilt DEM the analysis of the slope map allows the identification of wrongly-oriented sections of the waterways due to the appearance of very steep slopes around the waterways.
Some additional aspects of the proposed methodology may be identified to raise some accuracy issues, namely the fact that SRTM 30 elevation data was assigned to points to create the rebuilt DEM, when, in fact, the elevation data corresponds to the convolution of terrain elevation over areas and of sensors’ spread function, and also that sub-grid variations are not considered, which will have an impact, for example, over the horizontal position of the drainage networks, as they will be defined by cell centroids, and over slope, which is highly dependent on both the elevation and DEM resolution. However, even with all those limitations, the results showed that the rebuilt DEMs and the derived parameters have less bias when compared to a DEM generated by a national mapping agency, in this case study, Ordnance Survey, than the data extracted from the original SRTM 30. However, the magnitude and type of the improvements are dependent on the terrain characteristics, as the mentioned errors will have less influence over the results in flat regions than in regions with rougher relief, where, for example, slope and elevation will have larger variations over small distances.
Future work includes the use of additional features extracted from OSM, such as lakes and riverbanks. The application of the methodology should also be made to regions of the world where less OSM data are available, in order to show the usefulness of the proposed methodology to produce DEM and hydrologic data extracted from them with higher quality using only freely available data. In this article ArcGIS software (ESRI, Redlands, CA, USA) was used, but the process may also be implemented using open-source software.

Author Contributions

E.M. carried out the methodical work, analyses, assessment and discussion of the results and wrote the initial version of the manuscript. C.C.F. and J.L.M.P.L., provided guidance in the design of the research methodology, and the manuscript writing and revision.

Funding

This research was partly conducted under the project HIRT—“Modelling surface hydrologic processes based on infrared thermography at local and field scales” (PTDC/ECM-HID/4259/2014–POCI-01-0145-FEDER016668), funded by FCT, Portugal, and FEDER, COST Action CA16219 “HARMONIOUS—Harmonization of UAS techniques for agricultural and natural ecosystems monitoring”, and the Portuguese Foundation for Science and Technology (FCT) under project grant UID/MULTI/00308/2013.

Conflicts of Interest

The authors declare no conflicts of interest.

References

  1. Moore, I.D.; Grayson, R.B.; Ladson, A.D. Digital terrain modelling: A review of hydrological, geomorphological and biological applications. Hydrol. Process. 1991, 5, 3–30. [Google Scholar] [CrossRef]
  2. Lin, J.Y.; Cheng, C.T.; Chau, K.W. Using support vector machines for long-term discharge prediction. Hydrol. Sci. J. 2006, 51, 599–612. [Google Scholar] [CrossRef] [Green Version]
  3. Kumar, R.; Samaniego, L.; Attinger, S. Implications of distributed hydrologic model parameterization on water fluxes at multiple scales and locations. Water Resour. Res. 2013, 49, 360–379. [Google Scholar] [CrossRef]
  4. Wu, Y.; Li, T.; Sun, L.; Chen, J. Parallelization of a Hydrological Model using the massage passing Interface. Environ. Model. Softw. 2013, 43, 124–132. [Google Scholar] [CrossRef]
  5. Sanders, B.F. Evaluation of on-line DEMs for flood inundation modelling. Adv. Water Resour. 2007, 30, 1831–1843. [Google Scholar] [CrossRef]
  6. Kenward, T.; Lettenmaier, D.P.; Wood, E.F.; Fielding, E. Effects of Digital Elevation Model Accuracy on Hydrologic Predictions. Remote Sens. Environ. 2000, 3, 432–444. [Google Scholar] [CrossRef]
  7. Adlerab, K.K.; Tianbc, R.F.; Hongd, Y.; Piercebe, H.F. Evaluation of a Satellite-Based Global Flood Monitoring System. Int. J. Remote Sens. 2010, 31, 3763–3782. [Google Scholar]
  8. Manfreda, S.; McCabe, M.F.; Miller, P.E.; Lucas, R.; Pajuelo Madrigal, V.; Mallinis, G.; Ben Dor, E.; Helman, D.; Estes, L.; Ciraolo, G.; et al. On the Use of Unmanned Aerial Systems for Environmental Monitoring. Remote Sens. 2018, 10, 641. [Google Scholar] [CrossRef]
  9. Anornu, G.; Kabo-Bah, A.; Kortatsi, B. Comparability studies of high and low resolution Digital Elevation Models for watershed delineation in the tropics: Case of Densu river Basin of Ghana. Int. J. Coop. Stud. 2012, 1, 9–14. [Google Scholar]
  10. USGS. Elevation Dataset in Grid Format. Available online: https://earthexplorer.usgs.gov/ (accessed on 10 September 2015).
  11. USGS. Elevation Dataset in Grid Format. Available online: https://dds.cr.usgs.gov/srtm/ (accessed on 10 September 2015).
  12. Farr, T.G.; Kobrick, M. Shuttle Radar Topography Mission produces a wealth of data. EOS 2000, 81, 583–585. [Google Scholar] [CrossRef]
  13. American Society for Photogrammetry and Remote Sensing. Digital Photogrammetry—An Addendum to the Manual of Photogrammetry; Greve, C., Ed.; Publication of the American Society for Photogrammetry and Remote Sensing: Bethesda, MD, USA, 1996. [Google Scholar]
  14. Hanssen, R.F. Radar Interferometry: Data Interpretation and Error Analysis; Kluwer Academic Publishers: Dordrecht, The Netherlands, 2001. [Google Scholar]
  15. Sefercik, U.G. Performance estimation of ASTER Global DEM depending upon the terrain inclination. J. Indian Soc. Remote Sens. 2012, 40, 565–576. [Google Scholar] [CrossRef]
  16. Monteiro, E.V.; Fonte, C.C.; de Lima, J.L.M.P. Assessing positional accuracy of drainage networks extracted from ASTER, SRTM and OpenStreetMap. In Proceedings of the AGILE, Lisbon, Portugal, 9–12 June 2015. [Google Scholar]
  17. OpenStreetMap. Feature “Waterway” for a Delimited Region of United Kingdom. Available online: http://wiki.openstreetmap.org/wiki/Map_Features (accessed on 8 September 2015).
  18. Haklay, M.; Weber, P. OpenStreetMap: User-generated street maps. IEEE Pervasive Comput. 2008, 7, 12–18. [Google Scholar] [CrossRef]
  19. Mooney, P. Quality assessment of the contributed land use in information from OpenStreetMap versus authoritative datasets. In OpenStreetMap in GIScience; Jokar Arsanjani, J., Zip, A., Mooney, P., Helbich, M., Eds.; Springer International Publishing: Cham, Switzerland, 2015; pp. 319–324. [Google Scholar]
  20. Goodchild, M.F.; Li, L. Assuring the quality of volunteered geographic information. Spat. Stat. 2012, 1, 110–120. [Google Scholar] [CrossRef]
  21. Ali, A.L.; Sirilertworakul, N.; Zipf, A.; Mobasheri, A. Guided classification system for conceptual overlapping classes in OpenStreetMap. ISPRS Int. J. Geogr. Inf. 2016, 5, 87. [Google Scholar] [CrossRef]
  22. Mooney, P.; Minghini, M. A Review of OpenStreetMap Data. In Mapping and the Citizen Sensor; Foody, G., See, L., Fritz, S., Mooney, P., Olteanu-Raimond, A.-M., Fonte, C.C., Antoniou, V., Eds.; Ubiquity Press: London, UK, 2017; pp. 37–59. [Google Scholar] [Green Version]
  23. Antoniou, V.; Skopeliti, A. The Impact of the Contribution Microenvironment on Data Quality: The Case of OSM. In Mapping and the Citizen Sensor; Foody, G., See, L., Fritz, S., Mooney, P., Olteanu-Raimond, A.-M., Fonte, C.C., Antoniou, V., Eds.; Ubiquity Press: London, UK, 2017; pp. 165–196. [Google Scholar]
  24. Haklay, M. How good is the Volunteered Geographic Information? A Comparative Study of OpenStreetMap and Ordnance Survey datasets. Environ. Plan. B 2010, 37, 682–703. [Google Scholar] [CrossRef]
  25. Zielstra, D.; Zipf, A. A comparative study of proprietary geodata and volunteered Geographic Information for Germany. In Proceedings of the 13th AGILE International Conference on Geographic Information Science, Guimarães, Portugal, 11–14 May 2010. [Google Scholar]
  26. Ribeiro, A.; Fonte, C.C. A methodology for assessing OpenStreetMap degree of coverage for purposes of land cover mapping. ISPRS Ann. Photogramm. Remote Sens. Spat. Inf. Sci. 2015, II-3/W5, 297–303. [Google Scholar]
  27. Monteiro, E.S.V.; Fonte, C.C.; de Lima, J.L.M.P. Improving the positional accuracy of drainage networks extracted from Global Digital Elevation Models using OpenStreetMap data. J. Hydrol. Hydromech. 2017, 66. [Google Scholar] [CrossRef]
  28. Ordnance Survey. Reference DEM of a delimited region of Great Britain. Available online: http://www.ordnancesurvey.co.uk/ (accessed on 11 May 2017).
  29. Mukul, M.; Srivastava, V.; Mukul, M. Analysis of the accuracy of Shuttle Radar Topography Mission (SRTM) height models using International Global Navigation Satellite System Service (IGS) Network. J. Earth Syst. Sci. 2015, 124, 1343–1357. [Google Scholar] [CrossRef]
  30. Santillan, J.R.; Makinano-Santillan, M. Vertical accuracy assessment of 30-m resolution ALOS, ASTER, and SRTM Global DEMs over North-eastern Mindanao, Philippines. In Proceedings of the International Archives of the Photogrammetry, Remote Sensing and Spatial Information Sciences, XXIII ISPRS Congress, Prague, Czech Republic, 12–19 July 2016; Volume XL1-B4. [Google Scholar]
  31. Elkhrachy, I. Vertical accuracy assessment for SRTM and ASTER Digital Elevation Models: A case study of Najran city, Saudi Arabia. Ain Shams Eng. J. 2017. [Google Scholar] [CrossRef]
  32. Ordnance Survey. Rivers of a Delimited Region of Great Britain. Available online: https://www.ordnancesurvey.co.uk/business-and-government/products/os-open-rivers.html (accessed on 15 September 2015).
  33. Hutchinson, M.F.; Xu, T.; Stein, J.A. Recent progress in the ANUDEM Elevation Gridding Procedure. In Proceedings of the Geomorphometry, Redlands, CA, USA, 30 May 2011; pp. 19–22. [Google Scholar]
  34. O’Callaghan, J.F.; Mark, D.M. The extraction of drainage networks from Digital Elevation Data. Comput. Vis. Graph. Image Process. 1984, 28, 323–344. [Google Scholar] [CrossRef]
  35. Tarboton, D.G. A new method for the determination of flow directions and upslope areas in grid digital elevation models. Water Resour. Res. 1997, 33, 309–319. [Google Scholar] [CrossRef] [Green Version]
  36. Martz, L.W.; Garbrech, J. The Treatment of Flat Areas and Depressions in Automated Drainage Analysis of Raster Digital Elevation Models. Hydrol. Process. 1998, 12, 843–855. [Google Scholar] [CrossRef]
  37. Lin, W.T.; Chou, W.C.; Lin, C.Y.; Huang, P.H.; Tsai, J.S. WinBasin: Using Improved Algorithms and the GIS Technic for Automated Watershed Modelling Analysis from Digital Elevation Models. Int. J. Geogr. Inf. Sci. 2008, 22, 47–69. [Google Scholar] [CrossRef]
  38. Azeredo Freitas, H.R.; Freitas, C.C.; Rosim, S. Drainage networks and watersheds delineation derived from TIN—Based digital elevation models. Comput. Geosci. 2016, 92, 21–37. [Google Scholar] [CrossRef]
  39. Pelletier, J.D. A robust two-parameter method for the extraction of drainage networks from high-resolution digital elevation models (DEMs): Evaluation using synthetic and real world DEMs. Water Res. 2013, 49, 75–89. [Google Scholar] [CrossRef]
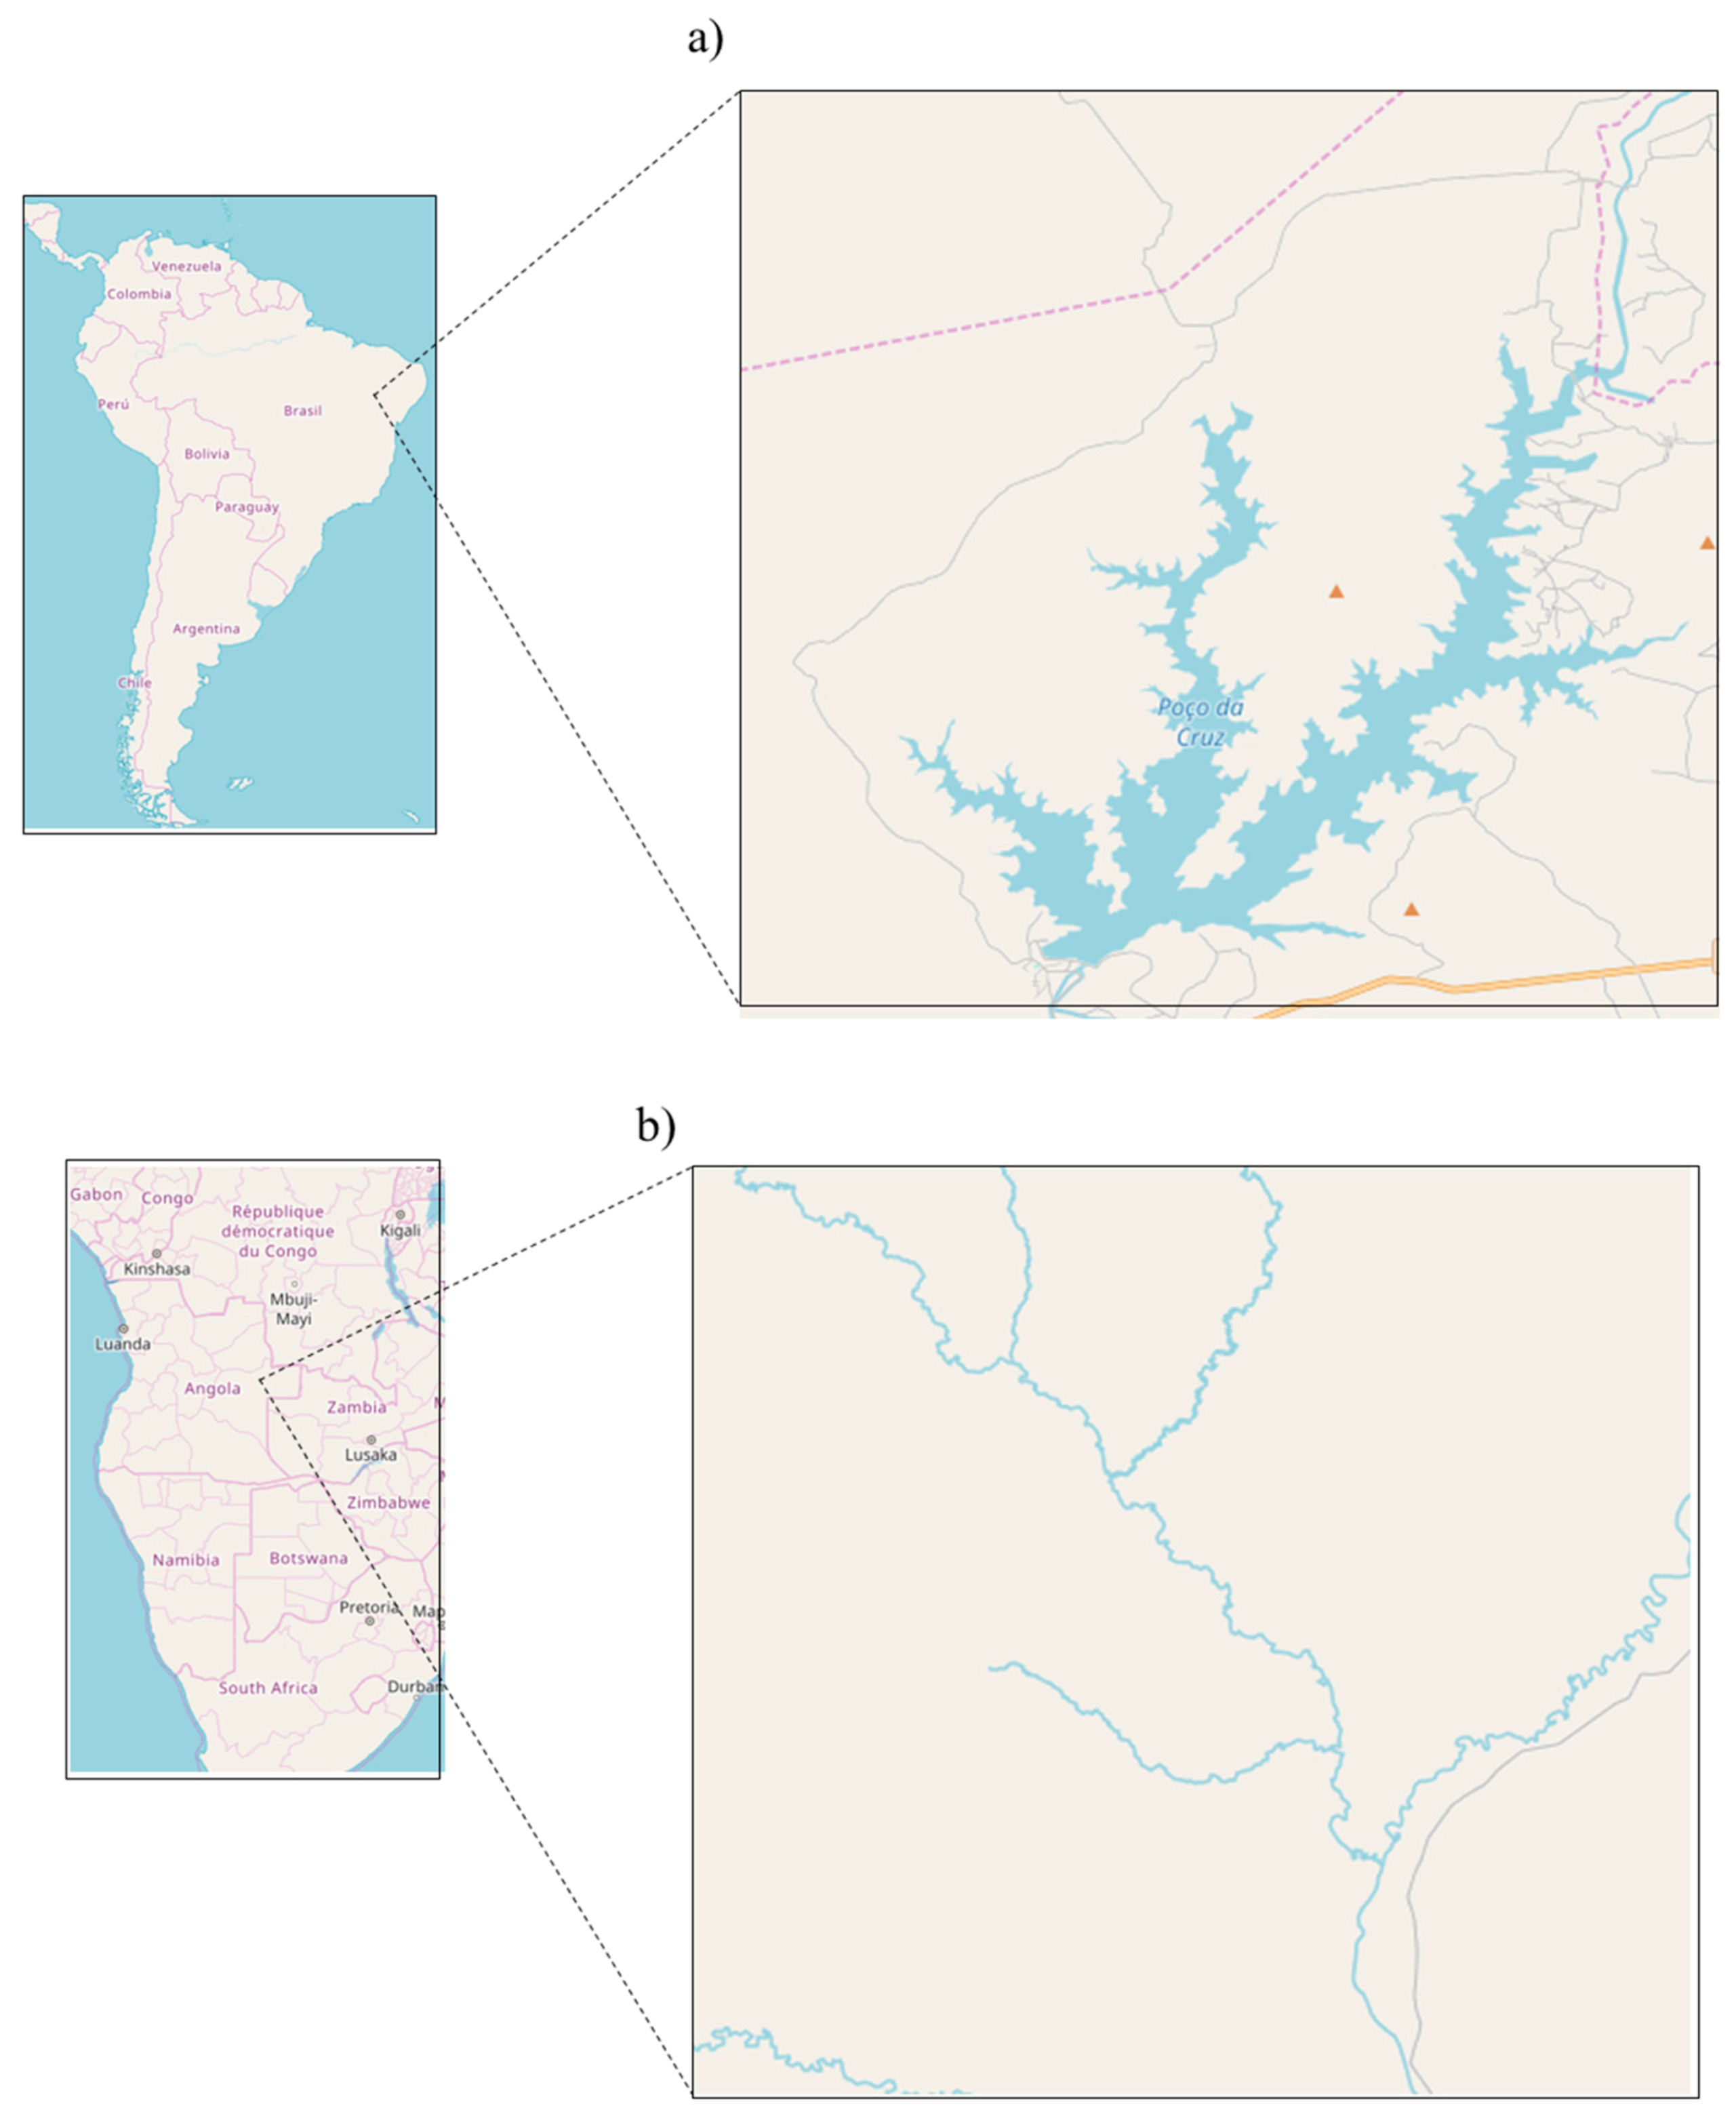
Figure 1. Example of regions of the world with poor coverage of OSM data but where water features are already represented: (a) Brazil and (b) Angola.
Hydrology 05 00034 g001
Figure 2. (a) Location of study area, and (b) 3D visualization of the SRTM 30 DEM.
Hydrology 05 00034 g002
Figure 3. DEMs of the study area: (a) Ordnance Survey DEM; and (b) SRTM 30 DEM.
Hydrology 05 00034 g003aHydrology 05 00034 g003b
Figure 4. Study area drainage network: (a) OSM rivers and streams; (b) OSM rivers; and (c) Ordnance Survey reference drainage network.
Hydrology 05 00034 g004aHydrology 05 00034 g004b
Figure 5. A drainage network of Great Britain extracted from the Ordnance Survey web page (blue colour) and a drainage network extracted from Ordnance Survey 50 m resolution DEM.
Hydrology 05 00034 g005
Figure 6. Flowchart of the processes to obtain the accuracy of SRTM 30 and the rebuilt DEM, as well as the accuracy of the drainage network, slopes, and basin delineation extracted from the original SRTM 30 and the DEM rebuilt using OSM data.
Hydrology 05 00034 g006
Figure 7. (a,c) show OSM watercourses that were removed from the drainage network used to create the rebuilt DEM (highlighted with white arrows); and (b,d) show the image without the OSM watercourses.
Hydrology 05 00034 g007
Figure 8. (a,c) show isolated OSM watercourses that were removed from the drainage network used to create the rebuilt DEM; and (b,d) show the image without these watercourses.
Hydrology 05 00034 g008
Figure 9. (a) OSM watercourses with incorrect orientation overlaid with the slope map derived from the rebuilt DEM using the incorrectly-oriented OSM waterways; (b) OSM watercourses with corrected orientation overlaid with the slope map derived from the rebuilt DEM using the corrected OSM waterways.
Hydrology 05 00034 g009
Figure 10. Flowchart of OSM data processing to select the waterways that are used in the creation of the rebuilt DEM.
Hydrology 05 00034 g010
Figure 11. Flowchart of processes to create the rebuilt DEM.
Hydrology 05 00034 g011
Figure 12. Flowchart of the drainage networks extraction process from SRTM 30 and the rebuilt DEM.
Hydrology 05 00034 g012
Figure 13. Generating the pour point contributing areas with the “Watershed” tool.
Hydrology 05 00034 g013
Figure 14. Flowchart for the calculation of the distance between sections of drainage networks under analysis identified as corresponding to the reference data.
Hydrology 05 00034 g014
Figure 15. Flowchart of the procedure to assess the vertical accuracy of the drainage networks.
Hydrology 05 00034 g015
Figure 16. Difference of elevations between the reference DEM and (a) the original SRTM 30 DEM, (b) the rebuilt DEM using rivers and streams, and (c) the rebuilt DEM using the rivers.
Hydrology 05 00034 g016
Figure 17. Slope of the study area derived from: (a) the Ordnance Survey reference DEM, (b) the original SRTM 30, and (c) rebuilt DEM using rivers and streams. The black circles 1) and 2) highlight regions where differences between maps can be observed.
Hydrology 05 00034 g017aHydrology 05 00034 g017b
Figure 18. The Ordnance Survey reference drainage network (a), the drainage network extracted from the original SRTM 30 (b), from the rebuilt DEM using OSM rivers and streams (c), and from the rebuilt DEM using only the rivers (d).
Hydrology 05 00034 g018aHydrology 05 00034 g018b
Figure 19. Zones defined inside the study area.
Hydrology 05 00034 g019
Figure 20. Graph showing the variation of the mean horizontal distance between the reference drainage network and the drainage network obtained from the original SRTM 30, and the rebuilt DEM using OSM rivers and streams and only rivers.
Hydrology 05 00034 g020
Figure 21. Graph showing the mean vertical distance between the elevations of the drainage networks extracted from the reference and the original SRTM 30, and the rebuilt DEM using OSM rivers and streams, and only OSM rivers.
Hydrology 05 00034 g021
Figure 22. Location of rivers section (1) and (2) in the study area.
Hydrology 05 00034 g022
Figure 23. Horizontal positional of the river sections indicated in Figure 22 extracted from the reference (in black), from SRTM 30 (in red) and from the rebuild DEM using OSM rivers and streams (in green).
Hydrology 05 00034 g023
Figure 24. Profiles of a river sections indicated as (1) and (2) in Figure 22.
Hydrology 05 00034 g024
Figure 25. Basins generated for the indicated pour points from: (a) the reference DEM, (b) the original SRTM 30, (c) the rebuilt DEM with OSM rivers and streams, and (d) the rebuilt DEM with OSM rivers.
Hydrology 05 00034 g025
Figure 26. Graph showing the area differences between the basins obtained from the reference DEM and the ones obtained from SRTM 30 and the rebuilt DEMs (the SRTM 30 DEM rebuilt with OSM rivers and streams and the SRTM 30 rebuilt with OSM rivers).
Hydrology 05 00034 g026
Table 1. Mean ( D E M _ D i f i ¯ ), standard deviation ( σ D E M _ D i f i ), RMSE, and maximum and minimum values of the differences D E M _ D i f i between the reference DEM and each DEM under analysis.
DEM i D E M _ D i f i ¯
( m )  
σ D E M _ D i f i
( m )  
R M S E D E M D i f i
( m )  
m a x ( D E M _ D i f i )
( m )  
m i n ( D E M _ D i f i )
( m )  
SRTM 30−6.027.528.1443−53
Rebuilt DEM (rivers and streams)−4.527.728.0643−52
Rebuilt DEM (rivers)−6.026.827.4640−52
Table 2. Mean ( S l o p e _ D i f i ¯ ), standard deviation ( σ S l o p e _ D i f i ), maximum and minimum, and RMSE ( R M S E S l o p e D i f i ) of differences ( S l o p e _ D i f i ) between the slope map derived from the reference DEM and the slope maps obtained from the original and rebuilt DEM using OSM rivers and streams.
Slope Map Extracted from DEM i S l o p e _ D i f i ¯
(degrees)
σ S l o p e _ D i f i
(degrees)
R M S E S l o p e D i f i
(degrees)
m a x ( S l o p e _ D i f i )
(degrees)
m i n ( S l o p e _ D i f i )
(degrees)
SRTM 302.410.010.2819−15
Rebuilt DEM (rivers and streams)−0.410.510.5118−18
Table 3. Mean, standard deviation ( σ ), and RMSE of the horizontal distances between the points of each drainage under study (the original, the rebuilt with OSM rivers and streams, and the rebuilt with OSM rivers), and the reference drainage network.
Drainage Network Extracted from DEM i m e a n   ( m )   σ ( m )   RMSE (m)
SRTM 3087.0113.5143.01
Rebuilt DEM (rivers and streams)52.998.1111.5
Rebuilt DEM (rivers)76.0108.9132.8
Table 4. Mean, standard deviation ( σ ), and root mean square error (RMSE) of the vertical distances between the points of each drainage under study (the original, the rebuilt with OSM rivers and streams and the rebuilt with OSM rivers) and the reference drainage network.
Drainage Network Extracted from DEM i D N D i f i ¯
(m)
σ D N D i f i
(m)
R M S E D N _ D i f i
(m)
SRTM 302.53.94.6
Rebuilt DEM (rivers and streams)−0.034.84.8
Rebuilt DEM (rivers)−0.74.74.8