Abstract
The growth and spread of impervious surfaces within urbanizing catchment areas pose signiificant threats to the quality of natural and built-up environments. Impervious surfaces prevent water infiltration into the soil, resulting in increased runoff generation. The Erbil Sub-basin was selected because the impervious cover is increasing rapidly and is affecting the hydrological condition of the watershed. The overall aim of this study is to examine the impact of urban growth and other changes in land use on runoff response during the study period of 1984 to 2014. The study describes long-term hydrologic responses within the rapidly developing catchment area of Erbil city, in the Kurdistan Region of Iraq. Data from six rainfall stations in and around the Erbil Sub-basin were used. A Digital Elevation Model (DEM) was also used to extract the distribution of the drainage network. Historical levels of urban growth and the corresponding impervious areas, as well as land use/land cover changes were mapped from 1984 to 2014 using a temporal satellite image (Landsat) to determine land use/land cover changes. Land use/land cover was combined with a hydrological model (SCS-CN) to estimate the volume of runoff from the watershed. The study indicates that the urbanization of the watershed has increased the impervious land cover by 71% for the period from 1984 to 2004 and by 51% from 2004 to 2014. The volume of runoff was 85% higher in 2014 as compared to 1984 due to the increase in the impervious surface area; this is attributed to urban growth. The study also points out that the slope of the watershed in the Erbil sub-basin should be taken into account in surface runoff estimation as the upstream part of the watershed has a high gradient and the land is almost barren with very little vegetation cover; this causes an increase in the velocity of the flow and increases the risk of flooding in Erbil city.
1. Introduction
The world population has increased rapidly over the last 150 years and continues to do so, which affects hydrologic resources on both a local and a global scale. An assessment of the impact of land use changes on water resources is one of the recent thrusts in hydrological modelling [1,2,3]. It is expected that approximately 60% of the world’s population will be living in urban areas by 2030. There are 8000 km2 of land converted to urban growth every year [4]. The studies of Braer and Sherill demonstrated that, as population density changes from 100 to 13,000 people per sq. mile in the city, the increased rate of surface runoff will be ten times greater than in rural areas [5].
The impact of urban growth is one of the significant land use changes affecting surface runoff within the catchment area [6]. Land use changes could have several influences on the hydrological cycle, water quality and quantity, which will result in flooding and droughts as well as changes in groundwater and river regimes in addition to an impact on runoff quality and quantity. There are also indirect effects on the watershed by climate change, urbanization, and the development of other land uses associated with population growth and economy [7]. Urban expansion is a significant change in land use, particularly in modern history. The nature of runoff and other hydrological characteristics is influenced by the process of urbanization, delivering pollutants to rivers and groundwater as well as increasing erosion. Urban growth includes the replacement of vegetated soils with impermeable surfaces; this process can impact the hydrologic processes, and the biogeochemical cycle at multiple scales [6,8,9]. Urban expansion also leads to the removal of trees and vegetation, causing a decrease in evapotranspiration. The construction of roads and culverts has effects which may include reduction of infiltration, decline in the groundwater table, increased surface runoff and a reduction of base flows [5,10,11]. Built-up areas lead to an increase in impervious surfaces which in turn reduces the runoff concentration time. Accordingly, higher peak discharge rates occur sooner after rainfall in the catchment area [12]. In addition-n, the runoff volume and potential flood risk greatly increases [8,13,14].
In order to quantify the impact of land use/land cover changes on runoff, a simple hydrological model directly considering land use/land cover is required. The Soil Conservation Service Curve Number (SCS-CN) method has been widely used to estimate surface runoff volume for a given rainfall event for small catchment area [15,16,17,18,19]. SCS-CN is simple to apply and only needs basic descriptive input data which are transformed into numeric values for the assessment of direct runoff volume. The Curve Number represents the surface runoff potential of a land use/land cover complex and is a function of Hydrologic Soil Group (HSG), antecedent precipitation, land use/land cover patterns, density of vegetation cover and the conservation practices followed in the land area [20,21]. Engineers, watershed managers and hydrologists widely use the SCS-CN method as a simple watershed model [22,23,24].
The integration of a Geographic Information System and Remote Sensing has been widely used and is recognized as a useful and effective tool in locating urban expansion [13,14]. Remote sensing has multi-resolution, multispectral and multi-temporal data, transforming them into information valuable for understanding the processes and monitoring of land use/land cover changes. GIS technology includes an array of powerful tools for entering, analyzing and displaying digital data from the various sources necessary to detect urban phenomena changes, identification and dataset development as well as an important tool in the analysis of parameters such as land cover, land use, soils, topographical and hydrological conditions [13,20,23,24,25,26,27,28,29].
The main aim of this study focuses on pattern changes of land use/land cover due to urban growth (also including other land use/land cover categories including: farmland, vegetation and barren soil) in the Erbil sub-basin, as well as their impact on rainfall surface runoff. The study endeavours to examine the effect of the urban landscape pattern changes at a local level on the volume of runoff, based on a satellite imagery time series from 1984 to 2014 and using the city of Erbil as a case study. The present study aims to achieve the following: (1) to explain the temporal and spatial changes of urbanization in the Erbil sub-basin area and (2) to assess the effect of urban growth on surface runoff.
2. Materials and Methodology
2.1. Study Area and Data
The Erbil sub-basin is located between 43°52′44″ and 44°12′54″ E longitude and 36°08′23″ and 36°16′22″ N latitude. It has an area of 177 km2; the elevation of the sub-basin ranges from 322 to 1073 m above Mean Sea Level (MSL). The city of Erbil is located in the sub-basin area as shown in Figure 1. The Erbil sub-basin has semi-arid climate conditions (Warm Climate Region of the Steppes) with cool winters and hot dry summers. The average annual temperature is around 21 °C. The average annual rainfall is approximately 400 mm, which is concentrated mostly between October and the end of May [30]. The main soil types of the study area are divided into three groups illustrated in Figure 2:
- (1)
- Lithosolic soil in lime stone (sandstone, claystone and gypsum).
- (2)
- Brown soil medium and shallow phase over Bakhtiari gravel (sand, silt and partly clay).
- (3)
- Brown soil deep phase (sand, clay and silt) as shown in Figure 2.
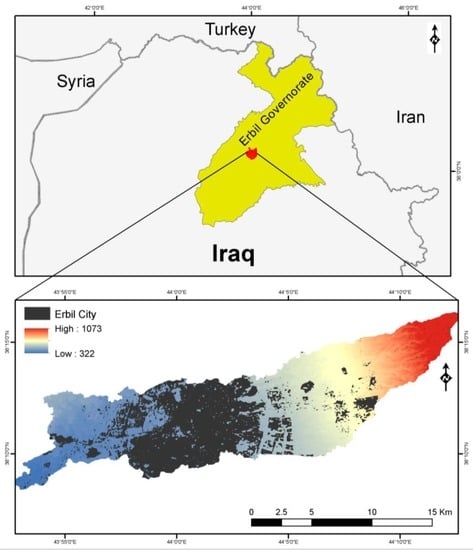
Figure 1.
Location of the study area.
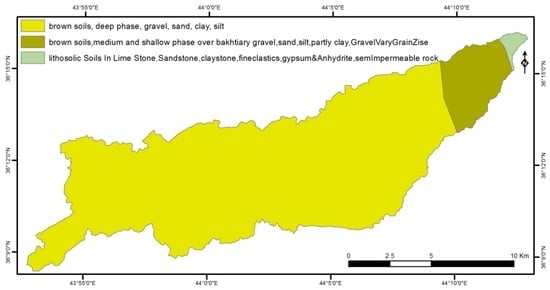
Figure 2.
Soil map of the watershed.
Major farm land in this watershed is located in the centre and downstream section of the watershed. The main vegetation types are dense green vegetation, middle density green vegetation and poor green vegetation which is located upstream of the watershed. The density of green vegetation changes throughout the season as it consists of grassland, pasture and shrubs which are directly dependent on the amount of precipitation. Built-up areas, which include urban areas with roads, pavement etc., are located in the centre as well as downstream of the watershed.
The data used in this study were multi-spectral satellite images. Multi-temporal and multi-spectral satellite images were used to generate historical land use/land cover. Digital land use maps were generated to estimate the impact of land use changes on the hydrologic evaluation. Satellite Imagery (Landsat 7 ETM+) was downloaded from Earth Science Data Interface (ESDI) (http://glcfapp.glcf.umd.edu:8080/esdi/index.jsp). The resolution of the six bands, including bands number 1 to 5 and band number 7, as raster layers is 30 m and the geo-reference of the satellite image is WGS_84 Datum project 38N. Landsat Thematic maps from 1984, 2004 and 2014 were used in this study. Image pre-processing was applied in Idrisi selva 17.0 software. The satellite images were processed by carrying out radiometric calibration, geometric rectification, and projection to the Universal Transverse Mercator (UTM, 38N) system. The boundary of the sub-basin was used to extract by mask the satellite images for the study area. The supervised classification method, with maximum likelihood clustering, was applied to classify the images and generate land use maps. Land use categories were identified as impervious surfaces (built up area), farm land, vegetation and barren soil as shown in Figure 3. Overall accuracy and kappa values were used as assessment criteria for the classification. An error matrix was produced dependent on the observed samples for each land use map. The overall classification accuracy of each image was over 88 in this study, with a kappa value of more than 79. Six meteorological stations in and around the study area are used to interpolate the rainfall data (Erbil, Ainkaua, Bnaslawa, Salahaddin, Qushtapa and Khabat). The stations of Erbil and Salahaddin have recorded continuous data from the early 1970s, but data from Ainkaua, Bnaslawa, Qushtapa and Khabat have only been recorded from 2001. Daily, monthly and yearly rainfall totals are available for every year. The minimum rainfall recorded in Khabat station is 304 mm, and the maximum rainfall recorded in Salahaddin station is 566 mm, as shown in Figure 4. ArcGIS was used to determine the spatial distribution of rainfall. Grids of rainfall were computed and mapped for a selected rainfall depth per pixel. Inverse Distance Weighting (IDW) was applied to estimate the spatial distribution of rainfall and convert the data to raster layer in 30 m resolution.
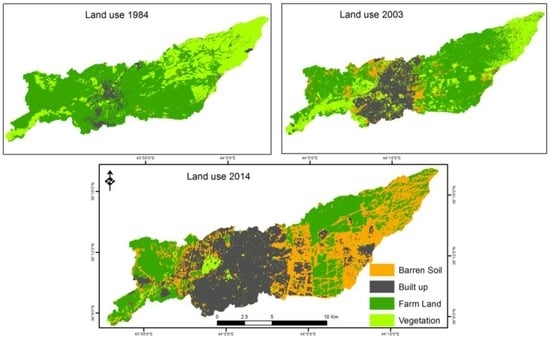
Figure 3.
Land use change of the study area in 1984, 2003 and 2014.
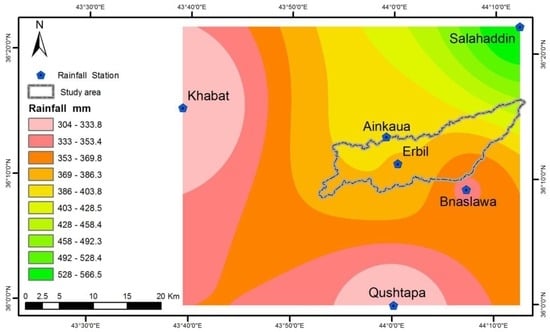
Figure 4.
Spatial distribution of rainfall and rainfall station positions in the study area.
2.2. Runoff Depth Estimation
The SCS-CN formula for the estimation of direct runoff depth is obtained as follows [18,31,32,33].
Based on the water balance equation and on the fundamental assumption that the ratio of runoff to effective rainfall is the same as the ratio of actual retention to potential retention,
where P is the total rainfall, Ia is the initial abstraction, F is the cumulative infiltration excluding Ia, Q is the direct runoff and S is the potential maximum retention. Combining Equations (1) and (2) yields the basic form of the SCS-CN method
which is valid for a P ≥ I; otherwise Q = 0.
P + Ia + F + Q
Considering also a second assumption, that the amount of initial abstraction is a fraction of the potential maximum retention
Iₐ = λ S,
Equation (3) becomes
The potential retention S is expressed in terms of the dimensionless curve number (CN) through the relationship
where S is expressed in mm, taking values from 0, when S → ∞, to 100, when S = 0. Furthermore, the initial abstraction rate is normally set to a constant value (λ = 0.2) in order for S to be the only parameter of the method. CN values can be obtained from tables and they are dependent on the hydrologic soil group (HSG), land treatment, hydrologic condition and land use/land cover. Higher values of CN refer to higher surface runoff while lower values of the Curve Number indicate lower runoff [34,35]. In this study, CN values have been estimated based on the soil texture and land use/land cover.
Soil data for the study area were extracted from the existing Soil Survey Map of north Iraq. The different soil textures of the study area were digitized and each polygon of the soil map was assigned the corresponding Hydrologic Soil Group according to the NRCS (2009) classification. The corresponding criteria are presented in Table 1. The soil map and land use/land cover maps were then intersected. The result of the intersection gave new polygons representing the amalgamation of HSG with land use/land cover. The appropriate CN value for each polygon was then estimated using the corresponding NRCS (2009) lookup tables. The obtained vector layer of CN values was finally converted to raster with 30 m resolution. Figure 5 illustrates the CN spatial distribution in the study area for the three examined periods.

Table 1.
Hydrologic Soil Groups and corresponding soil texture. From: [36].
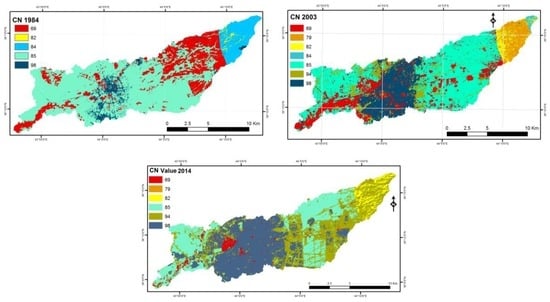
Figure 5.
Curve number maps for the years 1984, 2003 and 2014 for the study area.
The methodology used for estimating the spatial and temporal variations of runoff depth for every pixel of the study area using the Soil Conservation Service Curve Number SCS-CN model is shown in Figure 6. The rainfall layer was extracted from six rainfall stations. Inverse Distance Weighting (IDW) was used to interpolate determined cell values using a linearly weighted combination of a set of rainfall station points. As can be seen in Figure 6, the runoff depths for each pixel and for each studied year were calculated by applying the SCS-CN model using, as inputs, the corresponding CN and rainfall depth raster layers. The resultant runoff depth raster layers were then overlaid with the land cover layers in order to estimate the runoff volumes corresponding to each land cover category for each year.
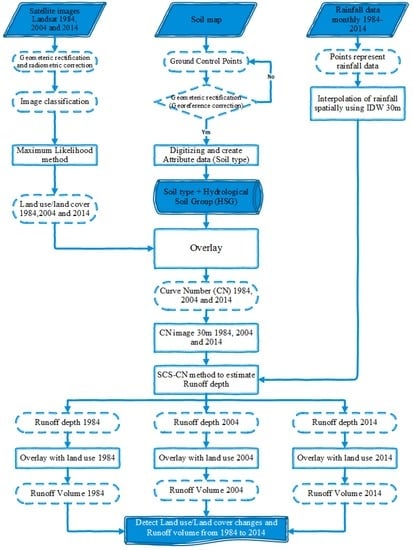
Figure 6.
Flowchart of the methodology used to estimate the spatial and temporal variations of runoff depth.
3. Results
The spatial distribution of land use changes in the Erbil basin illustrated in Figure 3 shows that the urban land use occupied nearly 35% of the study area in 2014. Figure 7 shows the change of the various land use. The built-up area of Erbil city increased by 71% from 1984 to 2004 and by 51% from 2004 to 2014, whilst the areas covered by farmland decreased by 20% and 39%, respectively. As shown in Figure 7, most of the land cover was converted to built-up areas from 1984 to 2014. Most areas of farmland and vegetation were converted to alternative land uses. Farmland and vegetation presented the largest net loss from 1984 to 2014 (−50 and −57.72 km2, respectively), whereas the largest gains were observed in the built-up areas and barren soil. Most of these gains originated from the farmland and vegetated land cover as shown in Table 2. The cultivated farmland surface changes were approximately one third of the area from 1984 to 2014. Much of the urbanization in the earlier period was at the expense of farmland and vegetation land cover. Unlike data from 1984 to 2004, the barren soil area increased by approximately 88%, whilst the barren soil increased by 76% from 2004 to 2014. However, the barren soil area that was previously covered by farmland and vegetation mainly increased in the latter period. Overall, the larger part of the area having farmland and vegetation land cover was replaced by urban and barren soil from 1984 to 2014.
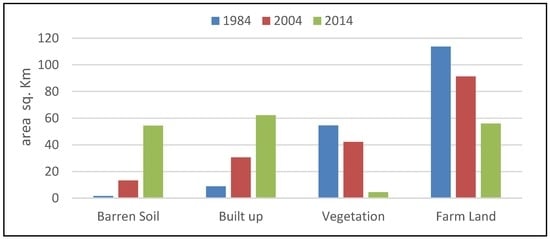
Figure 7.
Land use change from 1984 to 2014.

Table 2.
Changes in urban land use area in the Erbil basin from 1984 to 2014.
Many studies have shown that urban green spaces can play a positive role in decreasing surface runoff. The spatial distribution of impervious areas in the watershed had a significant impact on the generation of runoff. Figure 8 shows the effect of urban area increase on the volume of runoff (increased from 58.45 to 63.68 million m3 between 1984 and 2014). In the same period, the average rainfall depth decreased from 398.3 mm in 1984, to 327.15 mm in 2014. The impervious area provided most of the runoff. The increased urbanized area in the study area led to a decrease in farmland and vegetation areas; therefore, the decline of the green spaces resulted in increased runoff. The green land decreased from 168.3 km2 in 1984 to 60.50 km2 in 2014.
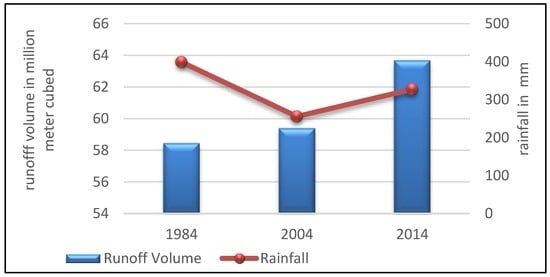
Figure 8.
Average rainfall depth and runoff volume from 1984 to 2014.
The changes in built-up areas from 1984 to 2014, that are shown in Figure 9, indicate the changing trends of urban growth in the Erbil basin and their role in runoff increment. As it can be seen, the increase in runoff volume is largely correlated with the change in land cover. Specifically, the impervious area increased from 8.9 km2 to 62.18 km2. This variation is primarily attributed to the changes in the type and area of land cover.
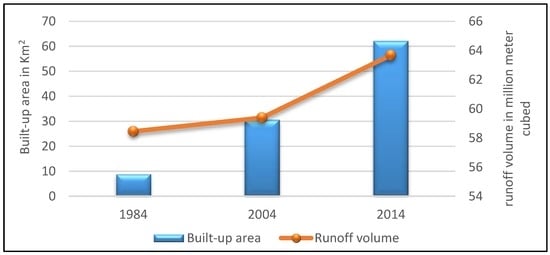
Figure 9.
Comparison between the increase of impervious areas and the volume of runoff.
Figure 10 illustrates the runoff volume produced in each land cover type and each year. From the results of the analysis in Figure 10 below, it was observed that the runoff from farmland cover decreased from 65% in 1984 to 30% in 2014, and the runoff of vegetation cover also decreased from 28% in 1984 to 2% in 2014, while the runoff from built-up cover increased from 6% in 1984 to 37% in 2014.
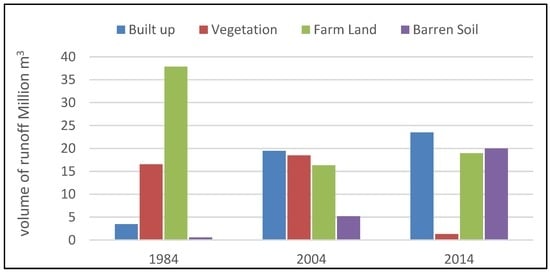
Figure 10.
Volume of runoff across different land use/land cover types.
4. Discussion
The Erbil sub-basin was subjected to significant land use changes (mainly urbanization) in the period from 1984 to 2014. The study is consistent with several previous studies which highlighted the significant increases in urban growth and its effect on runoff production [10,20,37,38,39,40,41]. The hydrological processes, over a range of temporal and spatial scales, are impacted by land use changes [21,42,43]. The land use/land cover had clearly changed over the study period. Farmland and vegetation decreased from 64% to 32% and from 31% to 3%, respectively, in the watershed area from 1984 to 2014, while impervious areas and barren soil increased from 5% to 35% and 1% to 31%, respectively, from 1984 to 2014. Both impervious areas and barren soil caused an increase in runoff volume by approximately 67%. Part of the observed land cover/land use changes can be attributed to the fact that people migrated from villages to the city and did not continue to work in the agriculture sector.
There is a positive correlation between runoff simulation results and the increase in urban areas. Previous studies indicated that an increased proportion of impervious areas cause shorter lag times between rainfall and runoff rates as well as higher runoff peaks and total runoff volume in receiving water bodies [27]. Furthermore, increased built-up areas may lead to obstructions in the drainage network that also lead to many environmental problems such as flooding. The current study found that 28% of the drainage network in the Erbil sub-basin was reduced or removed from 1984 to 2014, due to urban growth. Urbanization increased three times (278%) more than that of population growth (95%) only from 2004 to 2014 [44]. This indicates that the average of land growth is faster than population growth, which illustrated that the investment in land for building has increased significantly over the period of the study.
The study area was prone to the risk of flooding several times over the period of the study. The disaster affected the population of more than one million. Numerous studies have shown that the risk of storm flooding in an urban centre can be partly attributed to the increased replacement of natural land cover by built up areas [1,45]. The risk of flooding to Erbil city is also increased due to the slope of the watershed. The elevation of the city centre is 425 m, while the elevation of the watershed upstream is around 1000 m as depicted by Figure 11. Other studies also report that the topography of the watershed may significantly contribute to increased storm runoff [1].
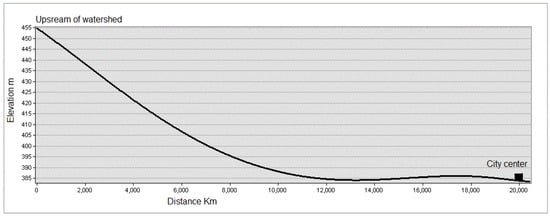
Figure 11.
Comparison of upstream elevation and the centre of Erbil city.
In order to illustrate the effect of the land cover change on runoff production, the raster layer of runoff depth values in 2014 was divided by the layer of runoff depth values in 1984. The obtained results were classified into three categories as illustrated in Figure 12. The first category represents values less than one which indicate decreasing runoff depth due to the expansion of farmland and vegetation land, whilst the second zone indicates no change in runoff depth from 1984 to 2014. The third category indicates increasing runoff depth due to land cover change to impervious areas and barren soil. The study indicated that 71% of the Erbil sub-basin belongs to the third category. These changes will directly impact the risk of flooding; particularly as Erbil city dominates the lower portion of the watershed.
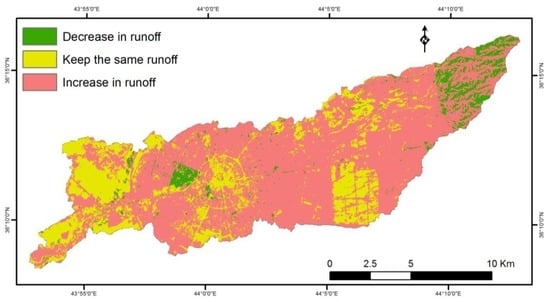
Figure 12.
Runoff volume changes from 1984 to 2014.
5. Conclusions
This study has attempted to examine the long-term effects of urban growth on runoff in the Erbil sub-basin. Land use changes for 30 years have been quantified and the runoff changes during these years have been analyzed (1984–2014). This is mainly due to the fact that the built-up area is the predominant factor contributing to runoff in urban cities. Satellite images were regrouped into four classes (built up, farmland, vegetation and barren soil). This study interprets the results from the application of the SCS-CN model to analyze the relationship between urban growth and runoff depth in the Erbil Sub-basin.
The land use/land cover has presented an increase in built-up areas and a reduction in farmland and vegetation from 1984 to 2014. The built-up area has expanded from 8.9 km2 to 62.2 km2 over the period of 30 years. The research has also shown that the annual runoff volume of the built-up area has increased from 8.6 to 23.5 million m3. The barren soil area also increased from 0.5 to 12.4 million m3 during the study period. Therefore, urbanization cover changes led to the deterioration of the drainage network with a decrease in stream lengths and disconnected streams at many locations. This study has identified that vegetation cover has been clearly reduced from 54.4 km2 to 4.5 km2. The result of this study indicates that the study area has passed through major changes which have clearly affected the environment of the catchment area and changed the land cover pattern. The result of this research supports the idea that decision makers would be well advised to improve plans for increased vegetation growth or increased vegetation cover particularly upstream of the watershed to decrease surface runoff and reduce the risk of flooding.
Conflicts of Interest
The author declare no conflict of interest.
References
- Du, J.; Qian, L.; Rui, H.; Zuo, T.; Zheng, D.; Xu, Y.; Xu, C.-Y. Assessing the effects of urbanization on annual runoff and flood events using an integrated hydrological modeling system for Qinhuai River basin, China. J. Hydrol. 2012, 464–465, 127–139. [Google Scholar] [CrossRef]
- Gwenzi, W.; Nyamadzawo, G. Hydrological Impacts of Urbanization and Urban Roof Water Harvesting in Water-limited Catchments: A Review. Environ. Process. 2014, 1, 573–593. [Google Scholar] [CrossRef]
- Chinen, K.; Lau, S.; Nonezyan, M.; Mcelroy, E.; Wolfe, B.; Suffet, I.H.; Stenstrom, M.K. Predicting runoff induced mass loads in urban watersheds: Linking land use and pyrethroid contamination. Water Res. 2016, 102, 607–618. [Google Scholar] [CrossRef] [PubMed]
- Cervantes, L. The Effects of Dry-season Urban Runoff on Normalized Differential Vegetation Index by Riparian Vegetation in San Diego County, California. Master’s Thesis, Department of Biology, California State University San Marcos, San Marcos, CA, USA, 2013. [Google Scholar]
- Kibler, D.F. Urban stormwater hydrology. Water Resour. Monogr. 1982, 7, 1–271. [Google Scholar]
- Zhang, B.; Xie, G.; Li, N.; Wang, S. Effect of urban green space changes on the role of rainwater runoff reduction in Beijing, China. Landsc. Urban Plan. 2015, 140, 8–16. [Google Scholar] [CrossRef]
- O’Driscoll, M.; Clinton, S.; Jefferson, A.; Manda, A.; McMillan, S. Urbanization Effects on Watershed Hydrology and In-Stream Processes in the Southern United States. Water 2010, 2, 605–648. [Google Scholar] [CrossRef]
- Goudie, A. The Human Impact on the Natural Environment: Past, Present, and Future; John Wiley & Sons, Ltd.: San Francisco, CA, USA, 2006. [Google Scholar]
- Abas, A.A.; Hashim, M. Change detection of runoff-urban growth relationship in urbanised watershed. IOP Conf. Ser. Earth Environ. Sci. 2014, 18, 012040. [Google Scholar] [CrossRef]
- Cheng, S.; Wang, R. An approach for evaluating the hydrological effects of urbanization and its application. Hydrol. Process. 2002, 16, 1403–1418. [Google Scholar] [CrossRef]
- Soulis, K.X.; Dercas, N.; Papadaki, C.H. Effects of forest roads on the hydrological response of a small-scale mountain watershed in Greece. Hydrol. Process. 2015, 29, 1772–1782. [Google Scholar] [CrossRef]
- Mitsova, D. Coupling Land Use Change Modeling with Climate Projections Catchment Near Cincinnati, Ohio. Int. J. Geo-Inf. 2014, 3, 1256–1277. [Google Scholar] [CrossRef]
- Weng, Q. Modeling Urban Growth Effects on Surface Runoff with the Integration of Remote Sensing and GIS. Environ. Manag. 2001, 28, 737–748. [Google Scholar] [CrossRef]
- Sheng, J.; Wilson, J.P. Watershed urbanization and changing flood behavior across the Los Angeles metropolitan region. Nat. Hazards 2009, 48, 41–57. [Google Scholar] [CrossRef]
- United States Department of Agriculture. Urban Hydrology for Small Watersheds, TR-55, 2nd ed.The U.S. Department of Agriculture (USDA): Washington, DC, USA, 1986.
- Ponce, V.M.; Hawkins, R.H. Runoff curve number: Has it reached maturity? J. Hydrol. Eng. ASCE 1996, 1, 11–18. [Google Scholar] [CrossRef]
- Soulis, K.X.; Valiantzas, J.D.; Dercas, N.; Londra, P.A. SCS-CN method applicability to a partial area watershed Analysis of the runoff generation mechanism for the investigation of the SCS-CN method applicability to a partial area experimental watershed SCS-CN method applicability to a partial area watershed. HESSD Earth Syst. Sci. Discuss. 2009, 6, 373–400. [Google Scholar] [CrossRef]
- Soulis, K.X.; Valiantzas, J.D.; Dercas, N.; Londra, P.A. Investigation of the direct runoff generation mechanism for the analysis of the SCS-CN method applicability to a partial area experimental watershed. Hydrol. Earth Syst. Sci. 2009, 13, 605–615. [Google Scholar] [CrossRef]
- Soulis, K.X.; Valiantzas, J.D. Identification of the SCS-CN parameter spatial distribution using rainfall-runoff data in heterogeneous watersheds. Water Resour. Manag. 2013, 27, 1737–1749. [Google Scholar] [CrossRef]
- Bhaskar, J.; Suribabu, C.R. Estimation of surface run-off for urban area using integrated remote sensing and GIS approach. Jordan J. Civ. Eng. 2014, 8, 70–80. [Google Scholar] [CrossRef]
- Ke, C. Modeling urban growth effects on surface runoff: A case study of Qinhuaihe watershed, east China. In Proceedings of the 2005 IEEE International Geoscience Remote Sensing Symposium, Seoul, Korea, 25–29 July 2005; Volume 6, pp. 4407–4410.
- Xiao, B.; Wang, Q.H.; Fan, J.; Han, F.P.; Dai, Q.H. Application of the SCS-CN model to runoff estimation in a small watershed with high spatial heterogeneity. Pedosphere 2011, 21, 738–749. [Google Scholar] [CrossRef]
- Suresh, D.; Chandra, U.; Ekube, A.; Aberra, D.; Tegene, M. Estimation and comparision of curve numbers based on dynamic land use land cover change, observed rainfall-runoff data and land slope. J. Hydrol. 2013, 492, 89–101. [Google Scholar]
- Soulis, Κ.; Dercas, Ν. Development of a GIS-based Spatially Distributed Continuous Hydrological Model and its First Application. Water Int. 2007, 32, 177–192. [Google Scholar] [CrossRef]
- Liu, Y.B.; De Smedt, F. WetSpa Extension, A GIS-based Hydrologic Model for Flood Prediction and Watershed Management. In Documentation and User Manual; Department of Hydrology and Hydraulic Engineering, Vrije Universiteit Brussel: Brussel, Belgium, 2004; pp. 1–126. [Google Scholar]
- Zhan, Y.; Wang, C.; Niu, Z.; Cong, P. Remote Sensing and GIS in Runoff Coefficient Estimation in Binjiang Basin. In Proceedings of the 2005 IEEE International Geoscience and Remote Sensing Symposium, Seoul, Korea, 25–29 July 2005; Volume 6, pp. 4403–4406.
- Jat, M.K.; Khare, D.; Garg, P.K.; Shankar, V. Remote sensing and GIS-based assessment of urbanisation and degradation of watershed health. Urban Water J. 2009, 6, 251–263. [Google Scholar] [CrossRef]
- Rui, H.; Du, J.; Zheng, D.; Li, Q. GIS-based Hydrologic Modeling in the Qinhuai River Basin Associated with Land Use Changes. In Proceedings of the 19th International Conference on Geoinformatics, Shanghai, China, 24–26 June 2011; pp. 1–4.
- Gitika, T.; Ranjan, S. Estimation of Surface Runoff using NRCS Curve number procedure in Buriganga Watershed, Assam, India—A Geospatial Approach. Int. Res. J. Earth Sci. ISSN Int. Res.J. Earth Sci. 2014, 2, 2321–2527. [Google Scholar]
- Hameed, H.M. Water harvesting in Erbil Governorate, Kurdistan region, Iraq Detection of suitable sites using Geographic Information System and Remote Sensing. Master’s Thesis, Department of Physical Geography and Ecosystems Science, Lund University, Sweden, 2013. [Google Scholar]
- Kowalik, T.; Walega, A. Estimation of CN parameter for small agricultural watersheds using asymptotic functions. Water 2015, 7, 939–955. [Google Scholar] [CrossRef]
- Soulis, K.X.; Valiantzas, J.D. SCS-CN parameter determination using rainfall-runoff data in heterogeneous watersheds-the two-CN system approach. Hydrol. Earth Syst. Sci. Discuss. 2011, 8. [Google Scholar] [CrossRef]
- Soulis, K.X.; Valiantzas, J.D. Variation of Runoff Curve Number with Rainfall in Heterogeneous Watersheds. The Two-CN system approach. Hydrol. Earth Syst. Sci. 2012, 16, 1001–1015. [Google Scholar] [CrossRef]
- Lim, K.J.; Engel, B.A.; Muthukrishnan, S.; Harbor, J. Effects of initial abstraction and urbanization on estimated runoff using CN technology. J. Am. Water Resour. Assoc. 2006, 42, 629–643. [Google Scholar] [CrossRef]
- Melesse, A.M.; Shih, S.F. Spatially distributed storm runoff depth estimation using Landsat images and GIS. Comput. Electron. Agric. 2002, 37, 173–183. [Google Scholar] [CrossRef]
- McCutcheon, S.C.; Martin, J.L.; Barnwell, T.O.J. Water quality. Handb. Hydrol. 1993, 346–414. [Google Scholar]
- Miller, J.D.; Kim, H.; Kjeldsen, T.R.; Packman, J.; Grebby, S.; Dearden, R. Assessing the impact of urbanization on storm runoff in a peri-urban catchment using historical change in impervious cover. J. Hydrol. 2014, 515, 59–70. [Google Scholar] [CrossRef]
- Jamwal, P.; Mittal, A.K.; Mouchel, J.-M. Effects of urbanisation on the quality of the urban runoff for Delhi watershed. Urban Water J. 2008, 5, 247–257. [Google Scholar] [CrossRef]
- Lin, B.; Chen, X.; Yao, H.; Chen, Y.; Liu, M.; Gao, L.; James, A. Analyses of landuse change impacts on catchment runoff using different time indicators based on SWAT model. Ecol. Indic. 2015, 58, 55–63. [Google Scholar] [CrossRef]
- Sahoo, S.N.; Sreeja, P. A methodology for determining runoff based on imperviousness in an ungauged peri-urban catchment. Urban Water J. 2014, 11, 42–54. [Google Scholar] [CrossRef]
- Verbeiren, B.; Van De Voorde, T.; Canters, F.; Binard, M.; Cornet, Y.; Batelaan, O. Assessing urbanisation effects on rainfall-runoff using a remote sensing supported modelling strategy. Int. J. Appl. Earth Obs. Geoinf. 2012, 21, 92–102. [Google Scholar] [CrossRef]
- Verbeiren, B.; Van De Voorde, T.; Canters, F.; Binard, M.; Cornet, Y.; van der Kwast, J.; Engelen, G.; Batelaan, O. 06—Impact Assessment of Urbanisation on Hydrology for the River Tolka in Dublin, Ireland: A Case Study of Remote Sensing Supported Hydrological Modelling. In Proceeding of Irish National Hydrology Conference 2011, Athlone, Ireland, 15 November 2011; pp. 64–75.
- Sajikumar, N.; Remya, R.S. Impact of land cover and land use change on runoff characteristics. J. Environ. Manag. 2015, 161, 460–468. [Google Scholar] [CrossRef] [PubMed]
- Hameed, H.M. Impact of Urban Growth on Groundwater Levels using Remote Sensing—Case Study: Erbil City, Kurdistan Region of Iraq. J. Nat. Sci. Res. 2015, 5, 72–85. [Google Scholar]
- Chen, Y.; Zhou, H.; Zhang, H.; Du, G.; Zhou, J. Urban flood risk warning under rapid urbanization. Environ. Res. 2015, 139, 3–10. [Google Scholar] [CrossRef] [PubMed]
© 2017 by the author; licensee MDPI, Basel, Switzerland. This article is an open access article distributed under the terms and conditions of the Creative Commons Attribution (CC BY) license (http://creativecommons.org/licenses/by/4.0/).