Article

Total Water Storage Change in Cameroon: Calculation, Variability and Link with Onset and Retreat Dates of the Rainy Season

by
Guy Merlin Guenang
*,†,
Derbetini A. Vondou
and
Francois Mkankam Kamga
Laboratory for Environmental Modeling and Atmospheric Physics, Department of Physics, University of Yaounde 1, Yaounde, Cameroon
*
Author to whom correspondence should be addressed.
These authors contributed equally to this work.
Hydrology 2016, 3(4), 36; https://doi.org/10.3390/hydrology3040036
Submission received: 31 December 2015 / Revised: 20 September 2016 / Accepted: 21 October 2016 / Published: 14 November 2016

Abstract

:
Total water storage change (TWSC) was calculated using CRU (Climatic Research Unit) monthly gridded data for the period 1962–1993 over Cameroon. Investigations were conducted to link its annual cycle with both the beginning and the end of the rainy season. A method was derived as an alternative to determine onset and retreat dates of the rainy season. Two methods were used for the calculation of TWSC. The first method used potential evapotranspiration (PET) from the Thornthwaite formula (PET T H ) and the second, CRU gridded PET data estimated from the Penman–Monteith formula (PET P M ). A comparative study of the corresponding TWSC, namely TWSC T H and TWSC P M , respectively, was done. According to the preliminary results, the study area is classified as humid below latitude 8 N and semiarid above. The results of the spatial and temporal variations showed a close correlation between the two methods, but with a slight gap between their different values, those of TWSC P M being larger and fluctuating less. The annual cycles of TWSC and PR generally showed similar patterns, and their intensities decreased from the southern part of the area (Equatorial forest zone) to the northern part (Sahelian zone). For mean T W S C = 0 , two different points were identified: the first and the second corresponding dates matching the onset and retreat months of the rainy season, respectively, except in the arid area (Sahelian zone), where only the retreat month of the rainy season was perfectly determined. The delay observed in the determination of rainfall onset date in that area is assigned to PET formulas that are defined only for humid areas and to the influence of high temperature just before the beginning of the rainy season, promoting the rapid evaporation of soil water immediately after the first rains. Application of the same method ( T W S C = 0 ) for the individual year showed similar performances. Although TWSC is always negative in Zone 3 and positive in Zones 1 and 2, the study of the interannual variabilities revealed an overall declining trend due to a stronger decrease in precipitation compared with PET. Moreover, the decrease during dry months is more remarkable than during wet months.

1. Introduction

In many African countries, ignorance of total water storage change is the main cause of the depletion of agricultural productivity and mismanagement of hydro-electric energy. Urbanism, civil engineering works and many other activities depending on hydrology also suffer severe damage. According to Indrani and Abir [1], any change in the hydrological cycle directly affects the availability and quality of fresh water, and the hydrological cycle is driven by the variety of complex processes and interactions closely linked to the atmospheric circulation and to temperature. Small changes in precipitation or evapotranspiration also imply changes in streamflows, water quality and ecosystem processes [2]. Thus, as declared by Alexandris et al. [3], knowledge about the period of available soil/ground water and its quantity can determine optimum sowing and groundwater exploitation times. Given such interest, many scientists are committed to the study of water storage and related parameters like potential evapotranspiration, actual evaporation, total water storage, etc, and their environmental impacts under a changing climate [4,5,6,7,8,9,10].
Potential evapotranspiration is water likely to be lost in conditions where water is abundant in the soil [11]. It is calculated using mathematical formulas [12,13,14,15]. Among these formulas, that of Penman–Monteith [16] shows good results in several areas [13] and is recommended by the Food and Agriculture Organisation (FAO) [13,14]. The disadvantage of this method is that it requires a significant number of climatic data, which is not always available in several regions of poor countries. In the contrary, the empirical method of Thornthwaite, which is still used, is one that needs only the temperature data. Actual evapotranspiration is the water actually dissipated into the atmosphere as vapor [11]. It is difficult to measure accurately, but can be estimated through empirical mathematical equations [17,18] and Satellite estimates [19,20]. According to Brutsaert [21], actual evapotranspiration and potential evapotranspiration have the same value under conditions of ample water availability at the surface. The total water storage change, which is defined in the simplest form as precipitation minus evapotranspiration, is difficult to measure due to the absence of observations of evapotranspiration [22]. However, it can be estimated through satellite observations [5,23,24,25], which were demonstrated to be efficient [26,27]. However, despite this efficiency, it was found that the spatial concentration and distribution of water masses (reservoirs, lakes, glaciers and small-scale groundwater systems with spatial scales well below GRACE nominal resolution) affect GRACE (Gravity Recovery and Climate Experiment) water storage estimates [23]. Because the installation and maintenance of evapotranspiration measurement networks are very expensive for poor countries, empirical formulas are often used to estimate the total water storage change. The most used include the atmospheric water balance [28,29], land water balance [17] and model simulations [19]. Some authors [1] underline that the management of water resources is crucially important for seasonally arid countries, especially those whose rainfall is driven by monsoon because they are likely to experience dramatic changes in land use patterns. Therefore, the investigation on total water storage change over recent decades is necessary for understanding the large-scale water storage variation process. Using the approximation that inter-basin groundwater flow is limited, Cao et al. [17] modified the basin-scale water balance equation [28,29] to evaluate the evapotranspiration variations and the feedback of groundwater storage during the past 50 years in the North of China Plain.
In the scientific literature in general, studies have not been carried out on the link between total water storage change and the dates of the beginning and end of rains. The objectives of this work are to study the variabilities of total water storage change and to investigate its link with the onset and retreat dates of the rainy season. We focus our study on the Cameroon territory, one of the Sub-Saharan countries that has experienced problems of water scarcity during recent decades, and its northern part (arid-area), moreover affected by frequent extreme climate events. It is hoped that the results of this work will contribute to the understanding of the large-scale water storage variation process and provide guidance to farmers, hydrologists, agronomists, civil engineers and researchers. The next section (Section 2) describes the study area, and Section 3 presents the data used and defines the methodology. The results are shown in Section 4, and the work ends with the discussion and conclusion in Section 5.

2. Study Area

The study area chosen is in Central Africa and comprises Cameroon and some neighboring areas delimited by the coordinates 0 –14 N and 5 –20 E (Figure 1).
This area was classified into three climatic zones according to Guenang and Mkankam [30]: the Equatorial forest zone (Zone 1), the midland zone (Zone 2), which predominantly covers highlands, and the Sahelian zone (Zone 3). In each of these zones, all stations have roughly the same onset and retreat dates of the rainy season. Rainfall onset and retreat dates in the area follow the northward (from Zone 1 to Zone 3) and the southward (from Zone 3 to Zone 1) direction, respectively [30]. These movements are connected to those of the inter-tropical discontinuity (ITD) [30]. The climate in Cameroon varies greatly with terrain, ranging from tropical rain along the coastal region through the hot semiarid northern plains to the arid Sahelian region in the far North. Most of the high intensity rainfall events in Cameroon are from convective clouds. Annually, there are several cases of extreme precipitation events. Major consequences are heavy rains, floods and landslides. Agriculture is the main economic activity (generally done at subsistence levels), and electricity is mostly produced by hydro-electric dams. The productivity of these activities is strongly dependent on the available soil moisture and water level of the rivers, respectively.

3. Data and Methodology

3.1. Data Used

The data used in this study are monthly precipitation (PR), surface temperature (TAS), potential evapotranspiration (PET), mean temperature (T m e a n ) and minimum and maximum temperatures (T m i n and T m a x ) covering the time period 1962–1993. They are from CRU (Climatic Research Unit) grid data Version 3.0 [14] with a 0.5 × 0.5 longitude/latitude spatial resolution. All of these data are downloadable free of charge from the CRU website (http://badc.nerc.ac.uk/data/cru/). CRU precipitation data have already been applied in the area. They were used to compute the multi-scalar Standardized Precipitation Index (SPI), and the results were compared to those from observation data [31]. The results showed that CRU precipitation quite well corroborates the observations.

3.2. Methodology

Calculations are made for the three different zones of the study area. Beforehand, the aridity index ( I a ) adopted by the United Nations [32,33] is calculated to characterize each part of the area. It is defined as the ratio of the climatological annual mean values of precipitation (PR) and potential evapotranspiration (PET) [6,32,34,35]:
I a = P R / P E T
Depending on the values of this index, the areas are classified as follows [32,33]:
hyper-arid for I a < 0 . 05 , arid for 0 . 05 < I a < 0 . 2 , semi-arid for 0 . 2 < I a < 0 . 5 , dry sub-humid for 0 . 5 < I a < 0 . 65 and humid for I a > 0 . 65 .
Under the hydrological assumption that runoff in the basin has been reduced to an insignificant level [36], Cao [17] proposes the following balanced equation to define the total water storage change Δ S (including soil water storage change and groundwater storage change):
Δ S = P R E T
where E T is the evapotranspiration.
In the current study, the absence of evapotranspiration data in the study area forces us to use potential evapotranspiration instead of actual evapotranspiration. This substitution is rational given that the largest part of the study area satisfies conditions so that the two parameters match. This assumption is discussed in the manuscript. Therefore, we define total water storage change (TWSC) as:
T W S C = P R P E T
Monthly surface temperatures were used to compute potential evapotranspiration (PET) according to the Thornthwaite equation (PET T H ) [37]:
P E T T H = 16 L 12 N 30 10 T a I α
where:
PET T H is the estimated potential evapotranspiration (mm·month 1 );
T a is the average daily temperature (degrees Celsius; if this is negative, use 0) of the month being calculated;
N is the number of days in the month being calculated;
L is the average day length (hours) of the month being calculated.
α = ( 6 . 75 × 10 7 ) I 3 ( 7 . 71 × 10 5 ) I 2 + ( 1 . 792 × 10 2 ) I + 0 . 49239
I = i = 1 12 T a i 5 1 . 514
is a heat index which depends on the 12 monthly mean temperatures T a i .
For a comparative study, monthly CRU PET calculated from Penman–Monteith equation (PET P M ) [3,13,16] was used. PET P M or E T 0 is defined by the following formula:
E T 0 = 0 . 408 Δ ( R n G ) + γ 900 T + 273 u 2 ( e s e a ) Δ + γ ( 1 + 0 . 34 u 2 )
E T 0 is also called the reference evapotranspiration (mm·day 1 );
  • Δ: slope vapor pressure curve (kPa· C 1 );
  • R n : net radiation at the crop surface (MJ·m 2 ·day 1 );
  • G: soil heat flux density (MJ·m 2 ·day 1 );
  • γ: psychrometric constant (kPa· C 1 );
  • T: mean daily air temperature at 2-m height ( C);
  • u 2 : wind speed at 2-m height (m·s 1 );
  • e s : saturation vapor pressure (kPa);
  • e a : actual vapor pressure (kPa);
  • e s e a : saturation vapor pressure deficit (kPa).
For more details, see Allen et al. [16].
Removing PET T H and PET P M from PR leads to defining two parameters, namely TWSC P M (PR − PET P M ) and TWSC T H (PR − PET T H ), respectively. In a given area, the computation of each parameter was done for each grid point, per month and per year. Results were spatially averaged giving one data time series. The mean annual cycles of all parameters were computed, and an investigation was undertaken on the link between TWSC annual cycle and the onset and retreat dates of the rainy season computed by Guenang and Mkankam [30] using the cumulative percentage mean rainfall amount method [38]. The study of interannual variabilities was also part of this work.
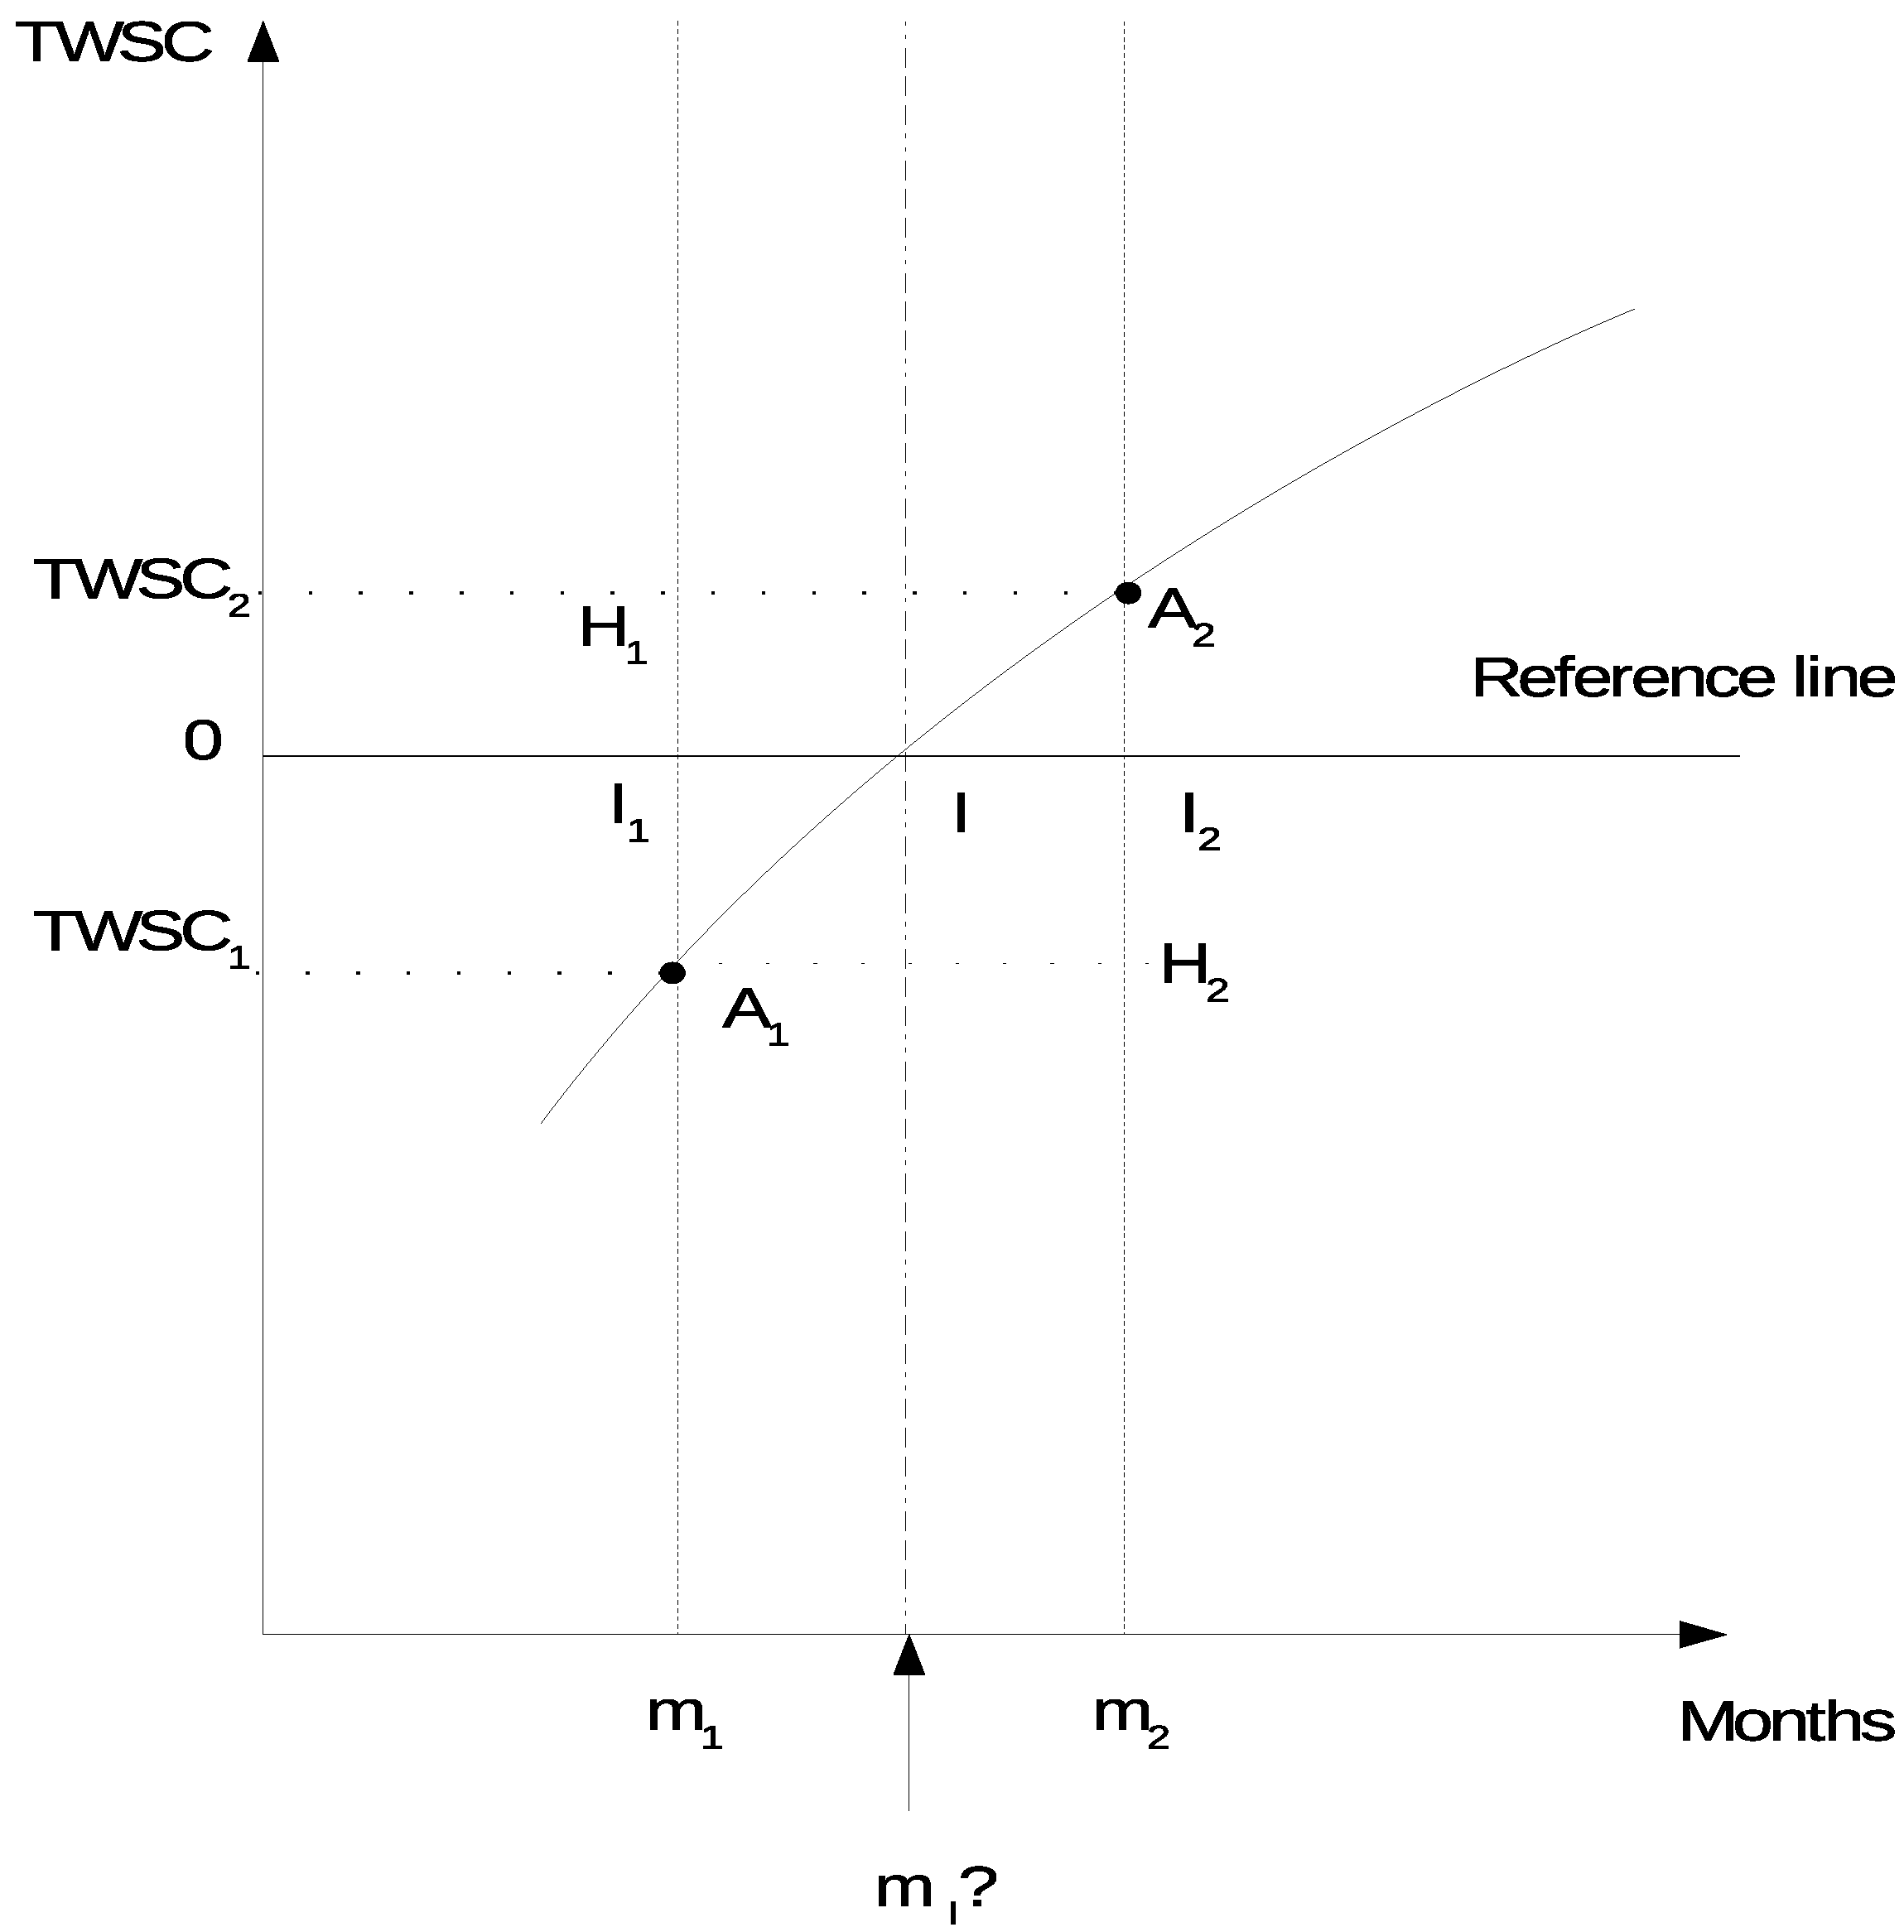
For each year, the onset and retreat dates were determined as those corresponding to the first and the second intercept, respectively, between the curve of TWSC and the reference line for TWSC = 0. Figure 2 illustrates this interpolation where m I is the unknown month.
Considering the property of Thales in the approximative triangles II 1 A 1 and II 2 A 2 , the following relation can be written:
I 2 A 2 I I 2 = I 1 A 1 I I 1
This leads to the following equation:
T W S C 2 m 2 m I = T W S C 1 m 1 m I
Finally, the date is deduced as followed:
m I = m 1 · T W S C 2 m 2 · T W S C 1 T W S C 2 T W S C 1

4. Results

4.1. Classification of Parts of the Study Area According to the Aridity Index

The following table (Table 1) shows the results of the calculation of the aridity index for the three different zones of the study area.
From these results, Zones 1 and 2 below 8 N are classified as humid, while Zone 3 above this latitude is classified as semiarid.

4.2. Annual Cycles of PR, PET, TWSC and Their Usefulness

4.2.1. Annual Cycle of PR

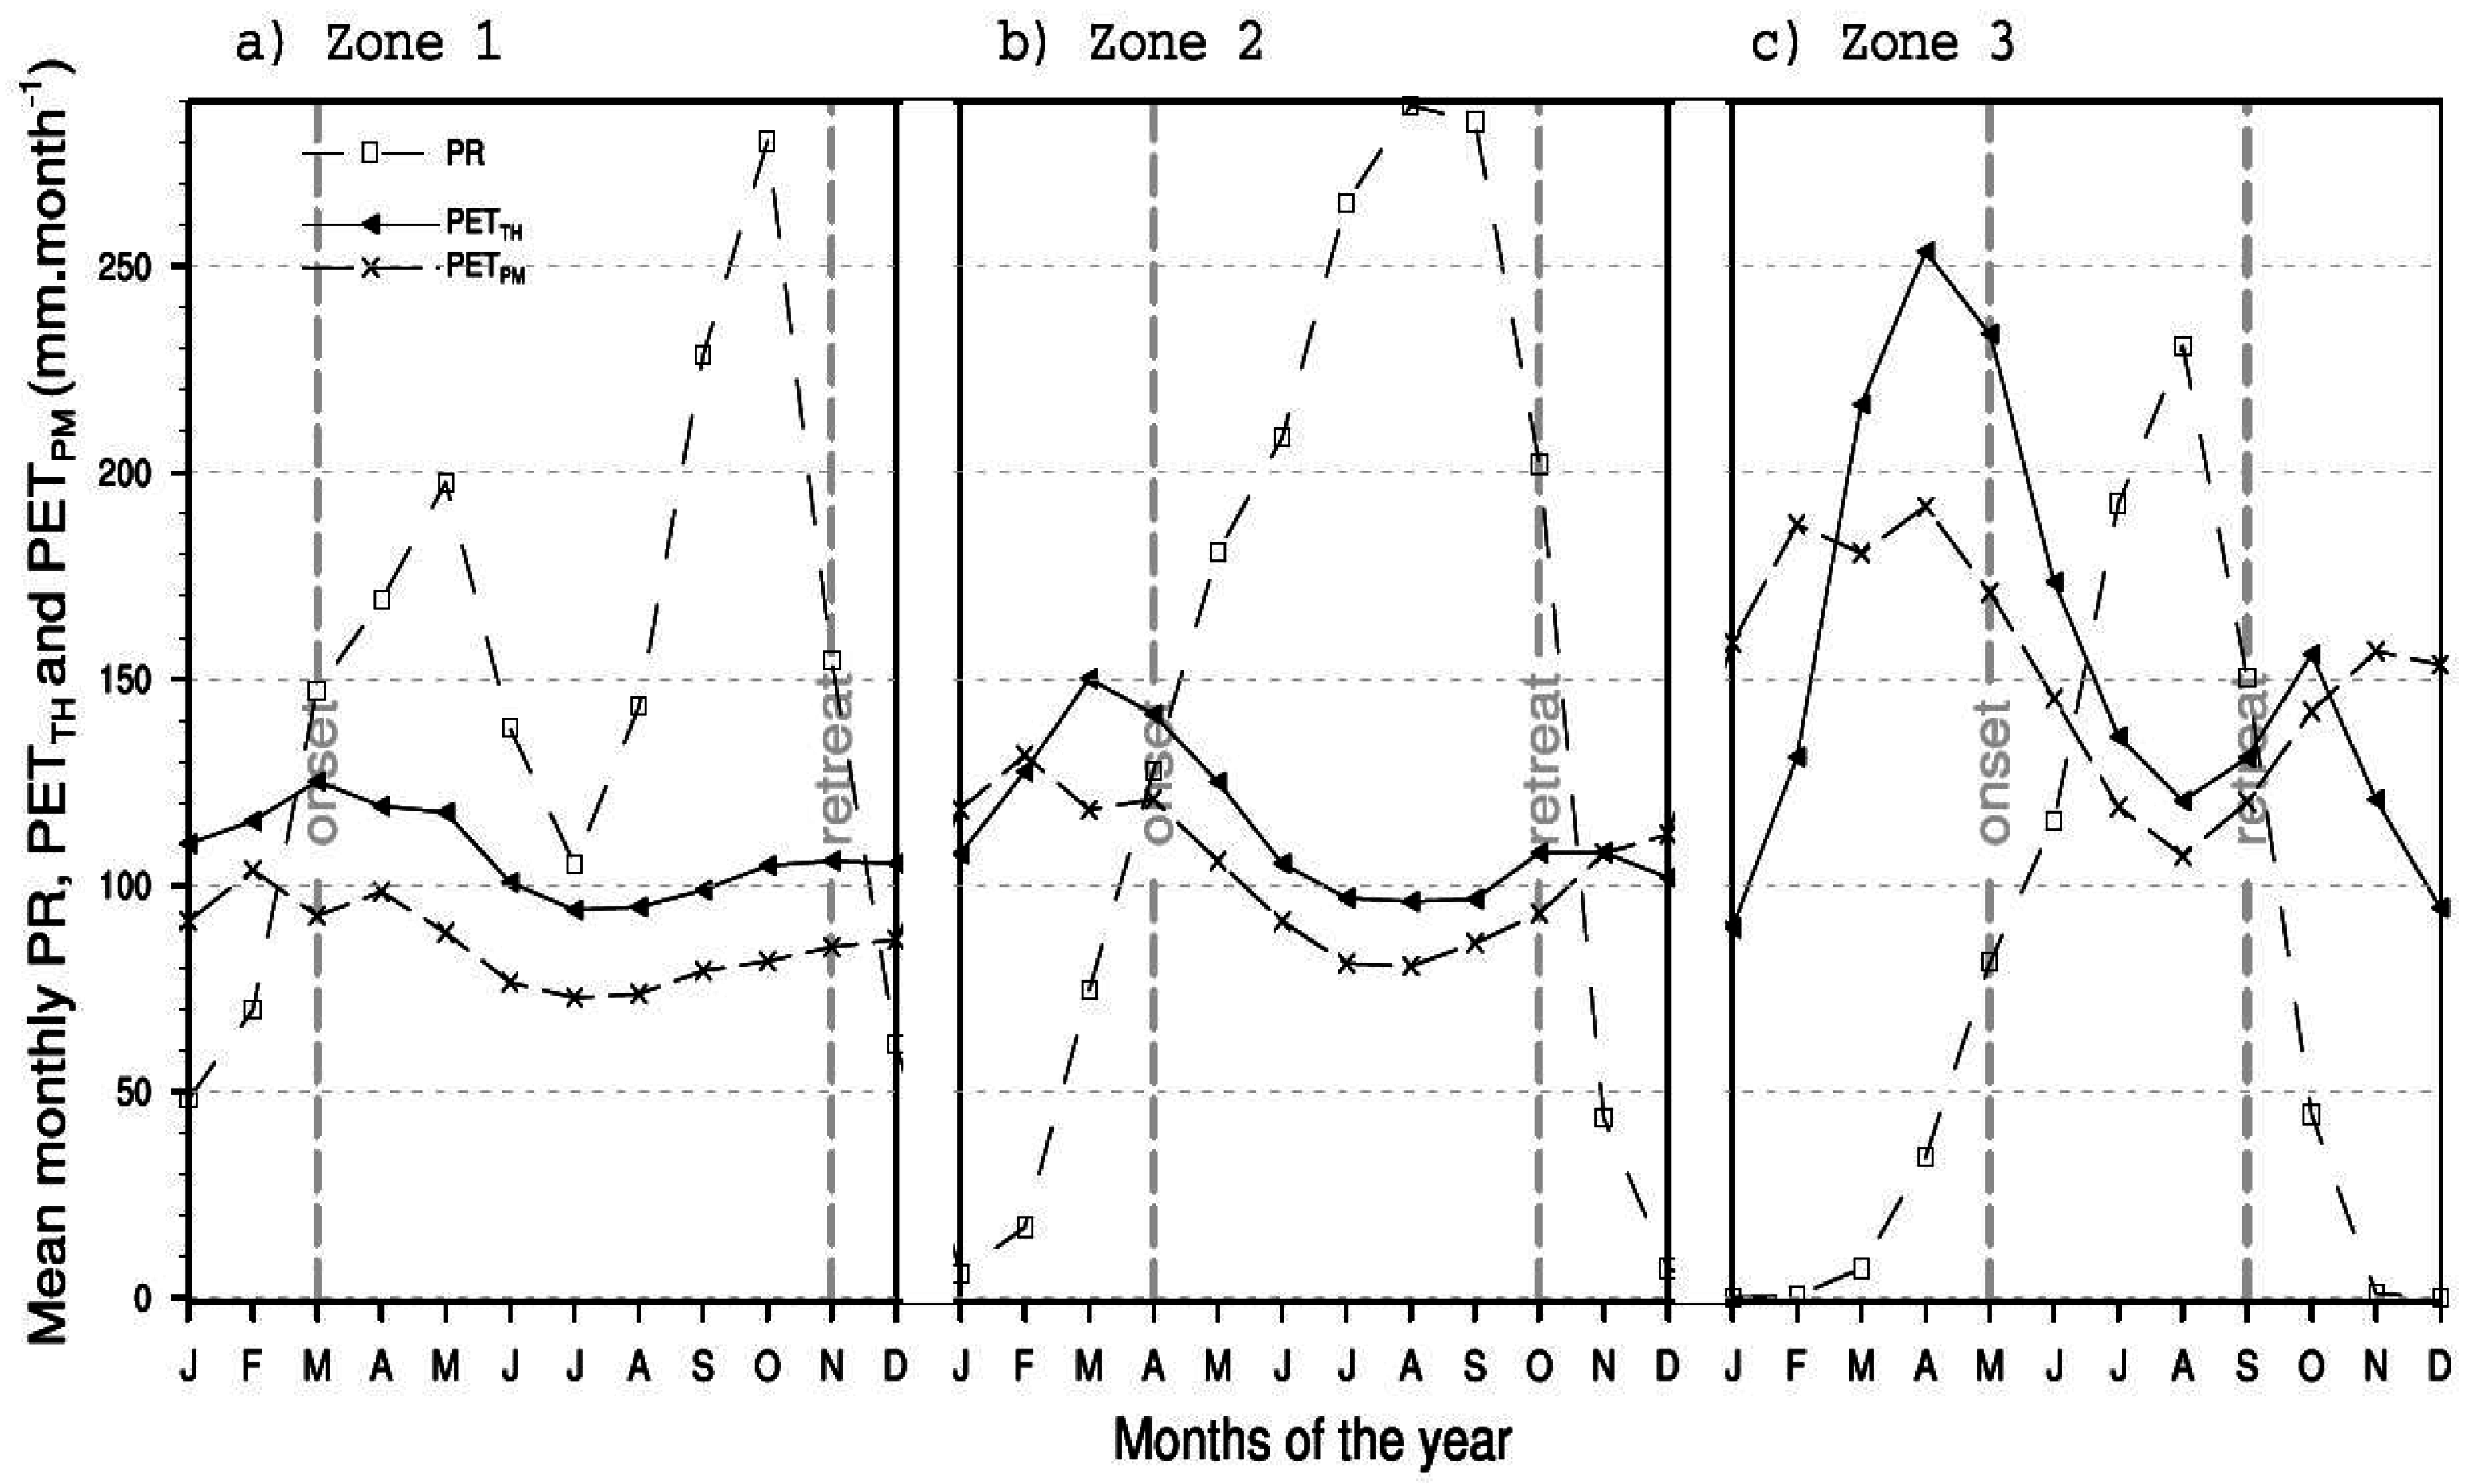
The annual cycle of PR for all three zones of the study area is shown in Figure 3; the onset and retreat months of the rainy season are shaded.
Overall, PR shows three different regimes for the three zones. In Zone 1 (Figure 3a), PR shows two modes, the first one during the period MAMJ (March–April–May-June) (a peak observed in May) and the second one during ASON (August–September–October–November) (a peak observed in October). These two modes are alternated with a dry season DJF (December–January–February) (the shortest of the study area) where the most severe period is from December–January and an intermediate season (June–July–August) recording rainfall ranging between 100 and 140 mm·month 1 . We note that during the year, the minimum PR is 50 mm·month 1 (Figure 3a). Furthermore, it is shown that the soil of this zone is mainly yellow ferralitic, characterized by a green forest vegetation and low water holding capacity, which is however not an important limitation since it rains almost all year long, and many rivers cross the area [39,40]. Thus, the soil is always wet and promotes evapotranspiration. In Zone 2 (Figure 3b), PR only shows one mode ranging from April–October. It is the longest mode of the area (seven months long). Furthermore, the highest rainfall is recorded during August and September. The soil is slightly wet during the dry period NDJFM (November–December–January–February–March) compared with Zone 1. The abundance of PR in Zones 1 and 2 is due to the fact that they are influenced by the West African monsoon activity and are bordered in their western parts by the Atlantic coast. Zone 3, a part of the Sahelian area is the driest. It has the shortest rainy season May–June–July–August–September (with a peak observed during August) followed by a dry period, the longest of the area during which the period of DJF does not record any rain. This lack of PR is an unfavorable condition for the application of PET formulas that are established on the basis of a soil still provided with water.

4.2.2. Annual Cycle of PET

Annual cycles of PET T H and PET P M are shown in Figure 3. Their patterns are similar in each zone, but with a gap of about 20 mm·month 1 , the values of PET T H being the largest. Overall, PET increases from Zone 1 (southern part of the area) to Zone 3 (northern part of the area).

4.2.3. Annual Cycle of TWSC and Its Link with Onset and Retreat Months of the Rainy Season

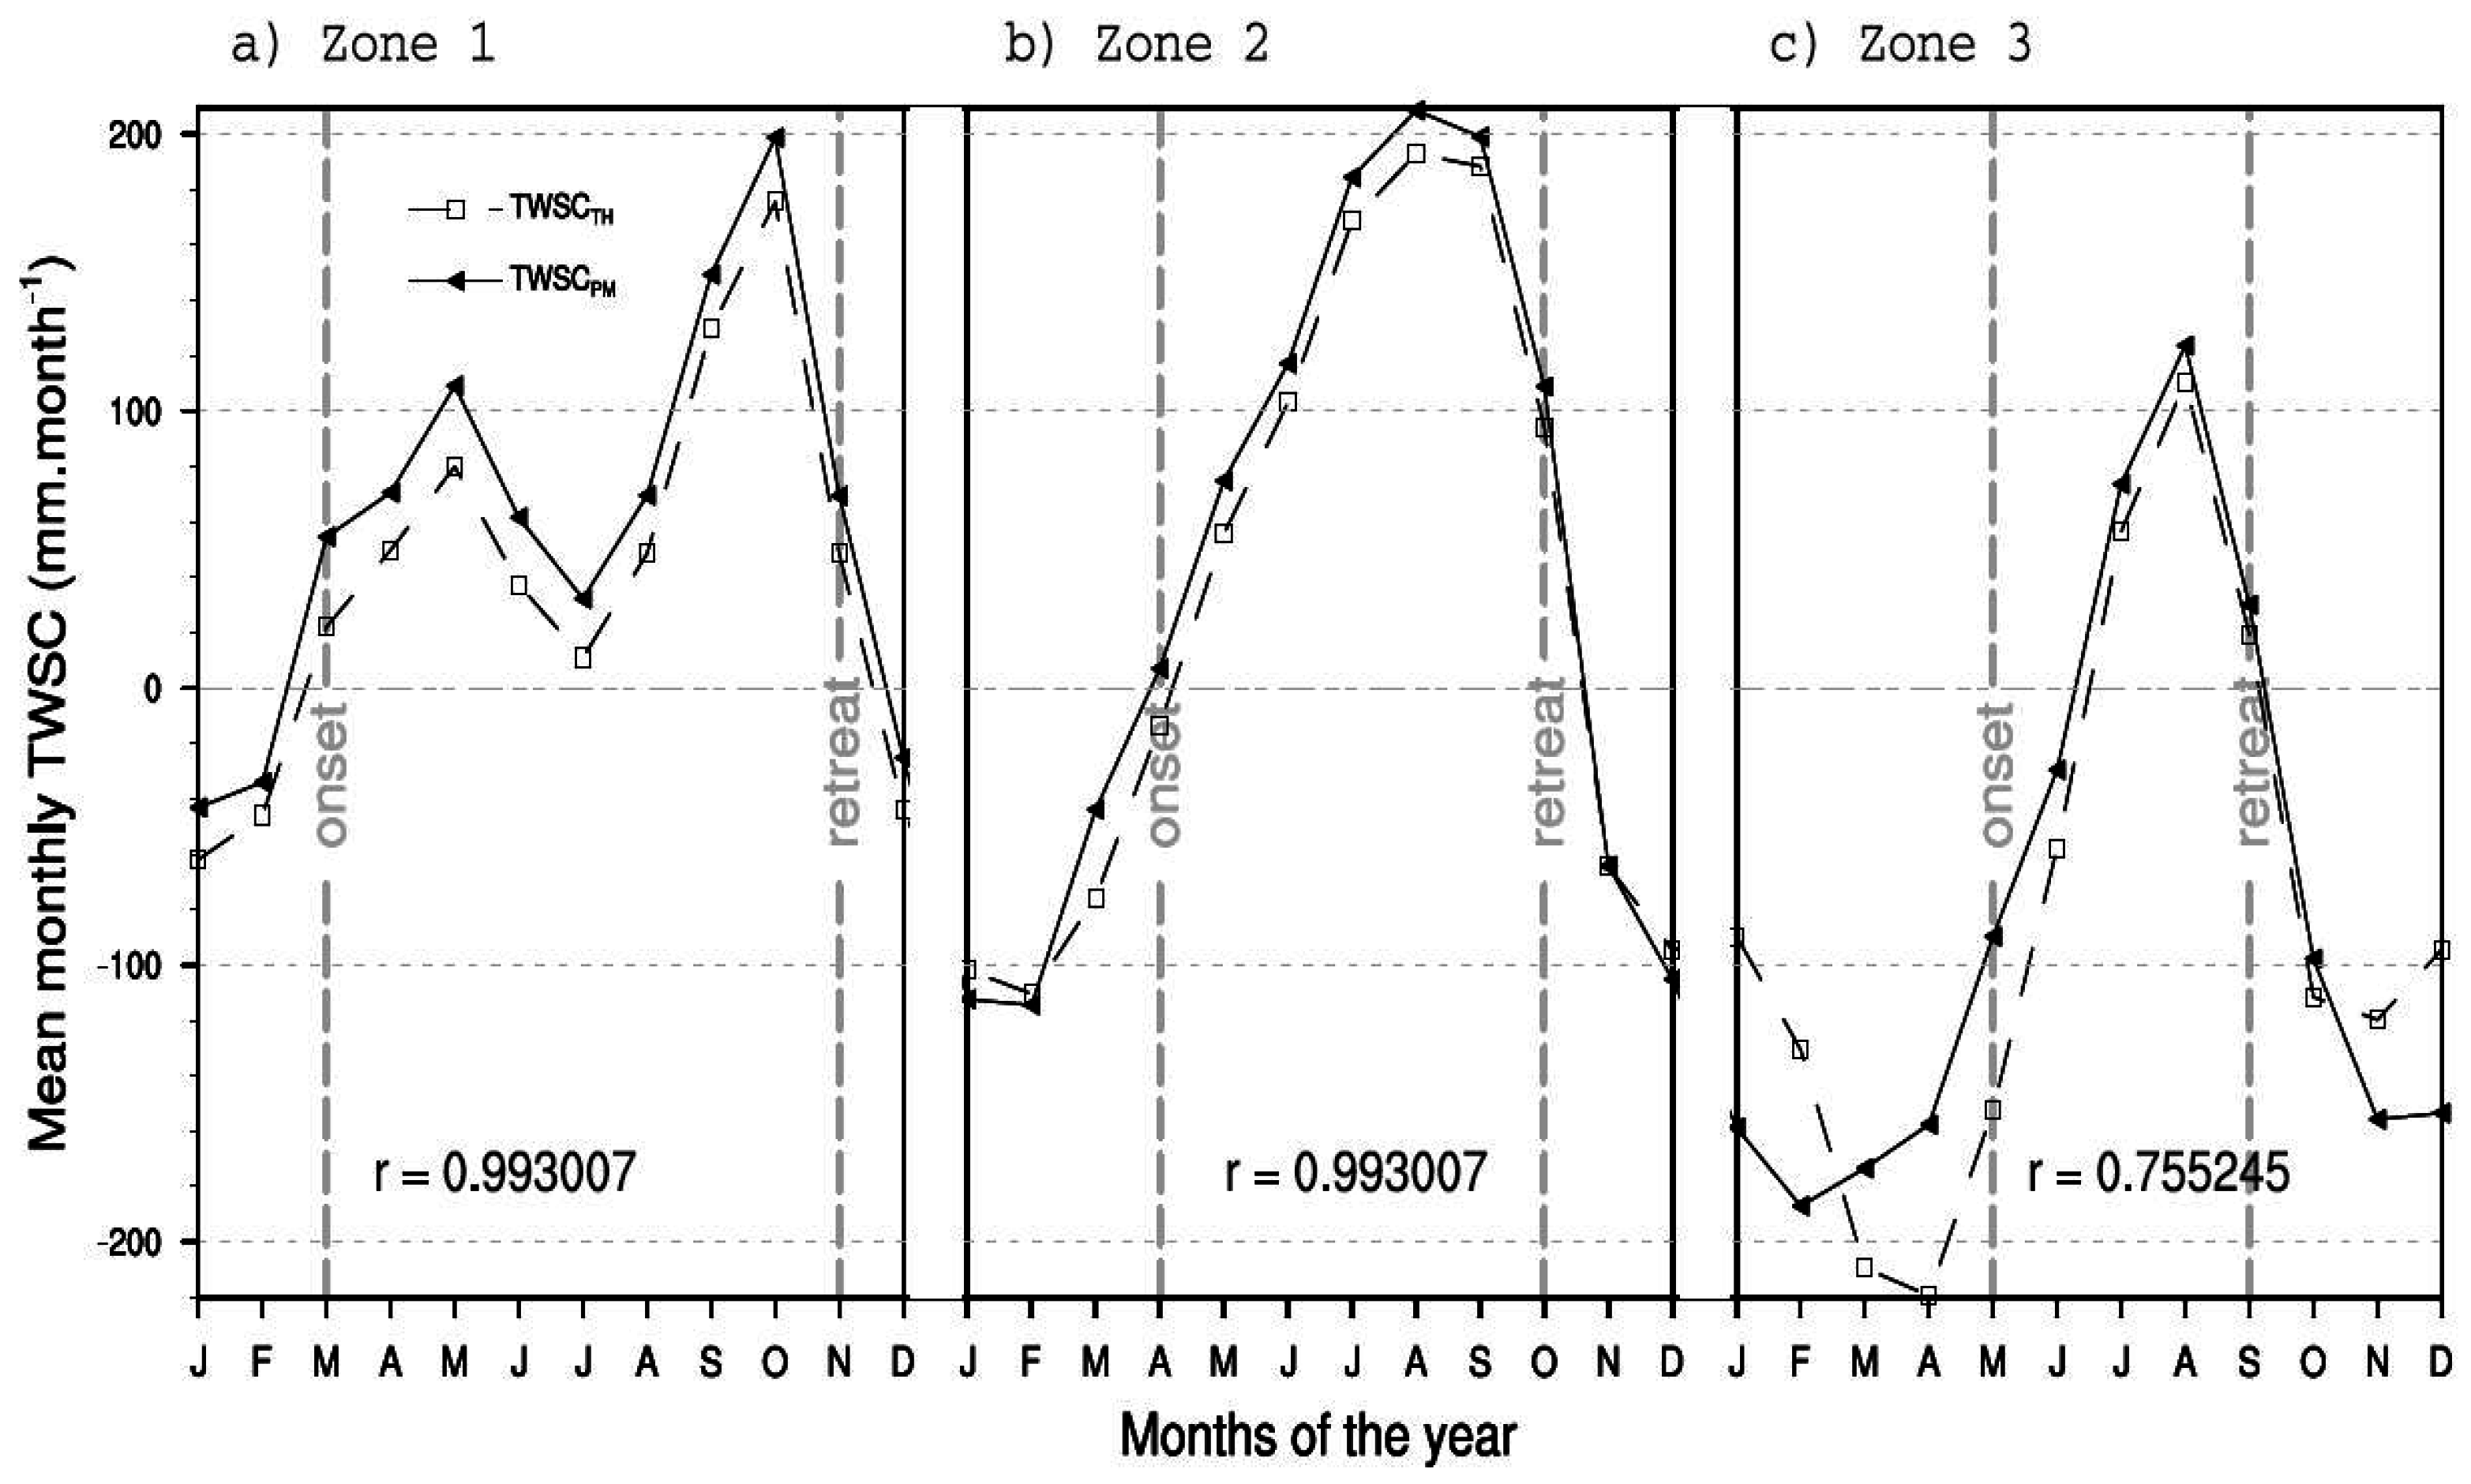
Figure 4 shows the mean monthly annual cycle of TWSC for all zones of the study area.
TWSC T H and TWSC P M show similar patterns with the best correlation coefficients in Zones 1 and 2 ( r = 0 . 993007 ). Overall, each pattern shows two points where TWSC is zero. These two points correspond to those of Figure 3 where there is an intersection between the PR curves and those of PET. The corresponding months of these two points match in many cases the months of beginning and end of the rains. The following table (Table 2) shows the lag between the months when TWSC is zero and those of the onset and retreat months of the rainy season. The estimates are for TWSC T H and TWSC P M .
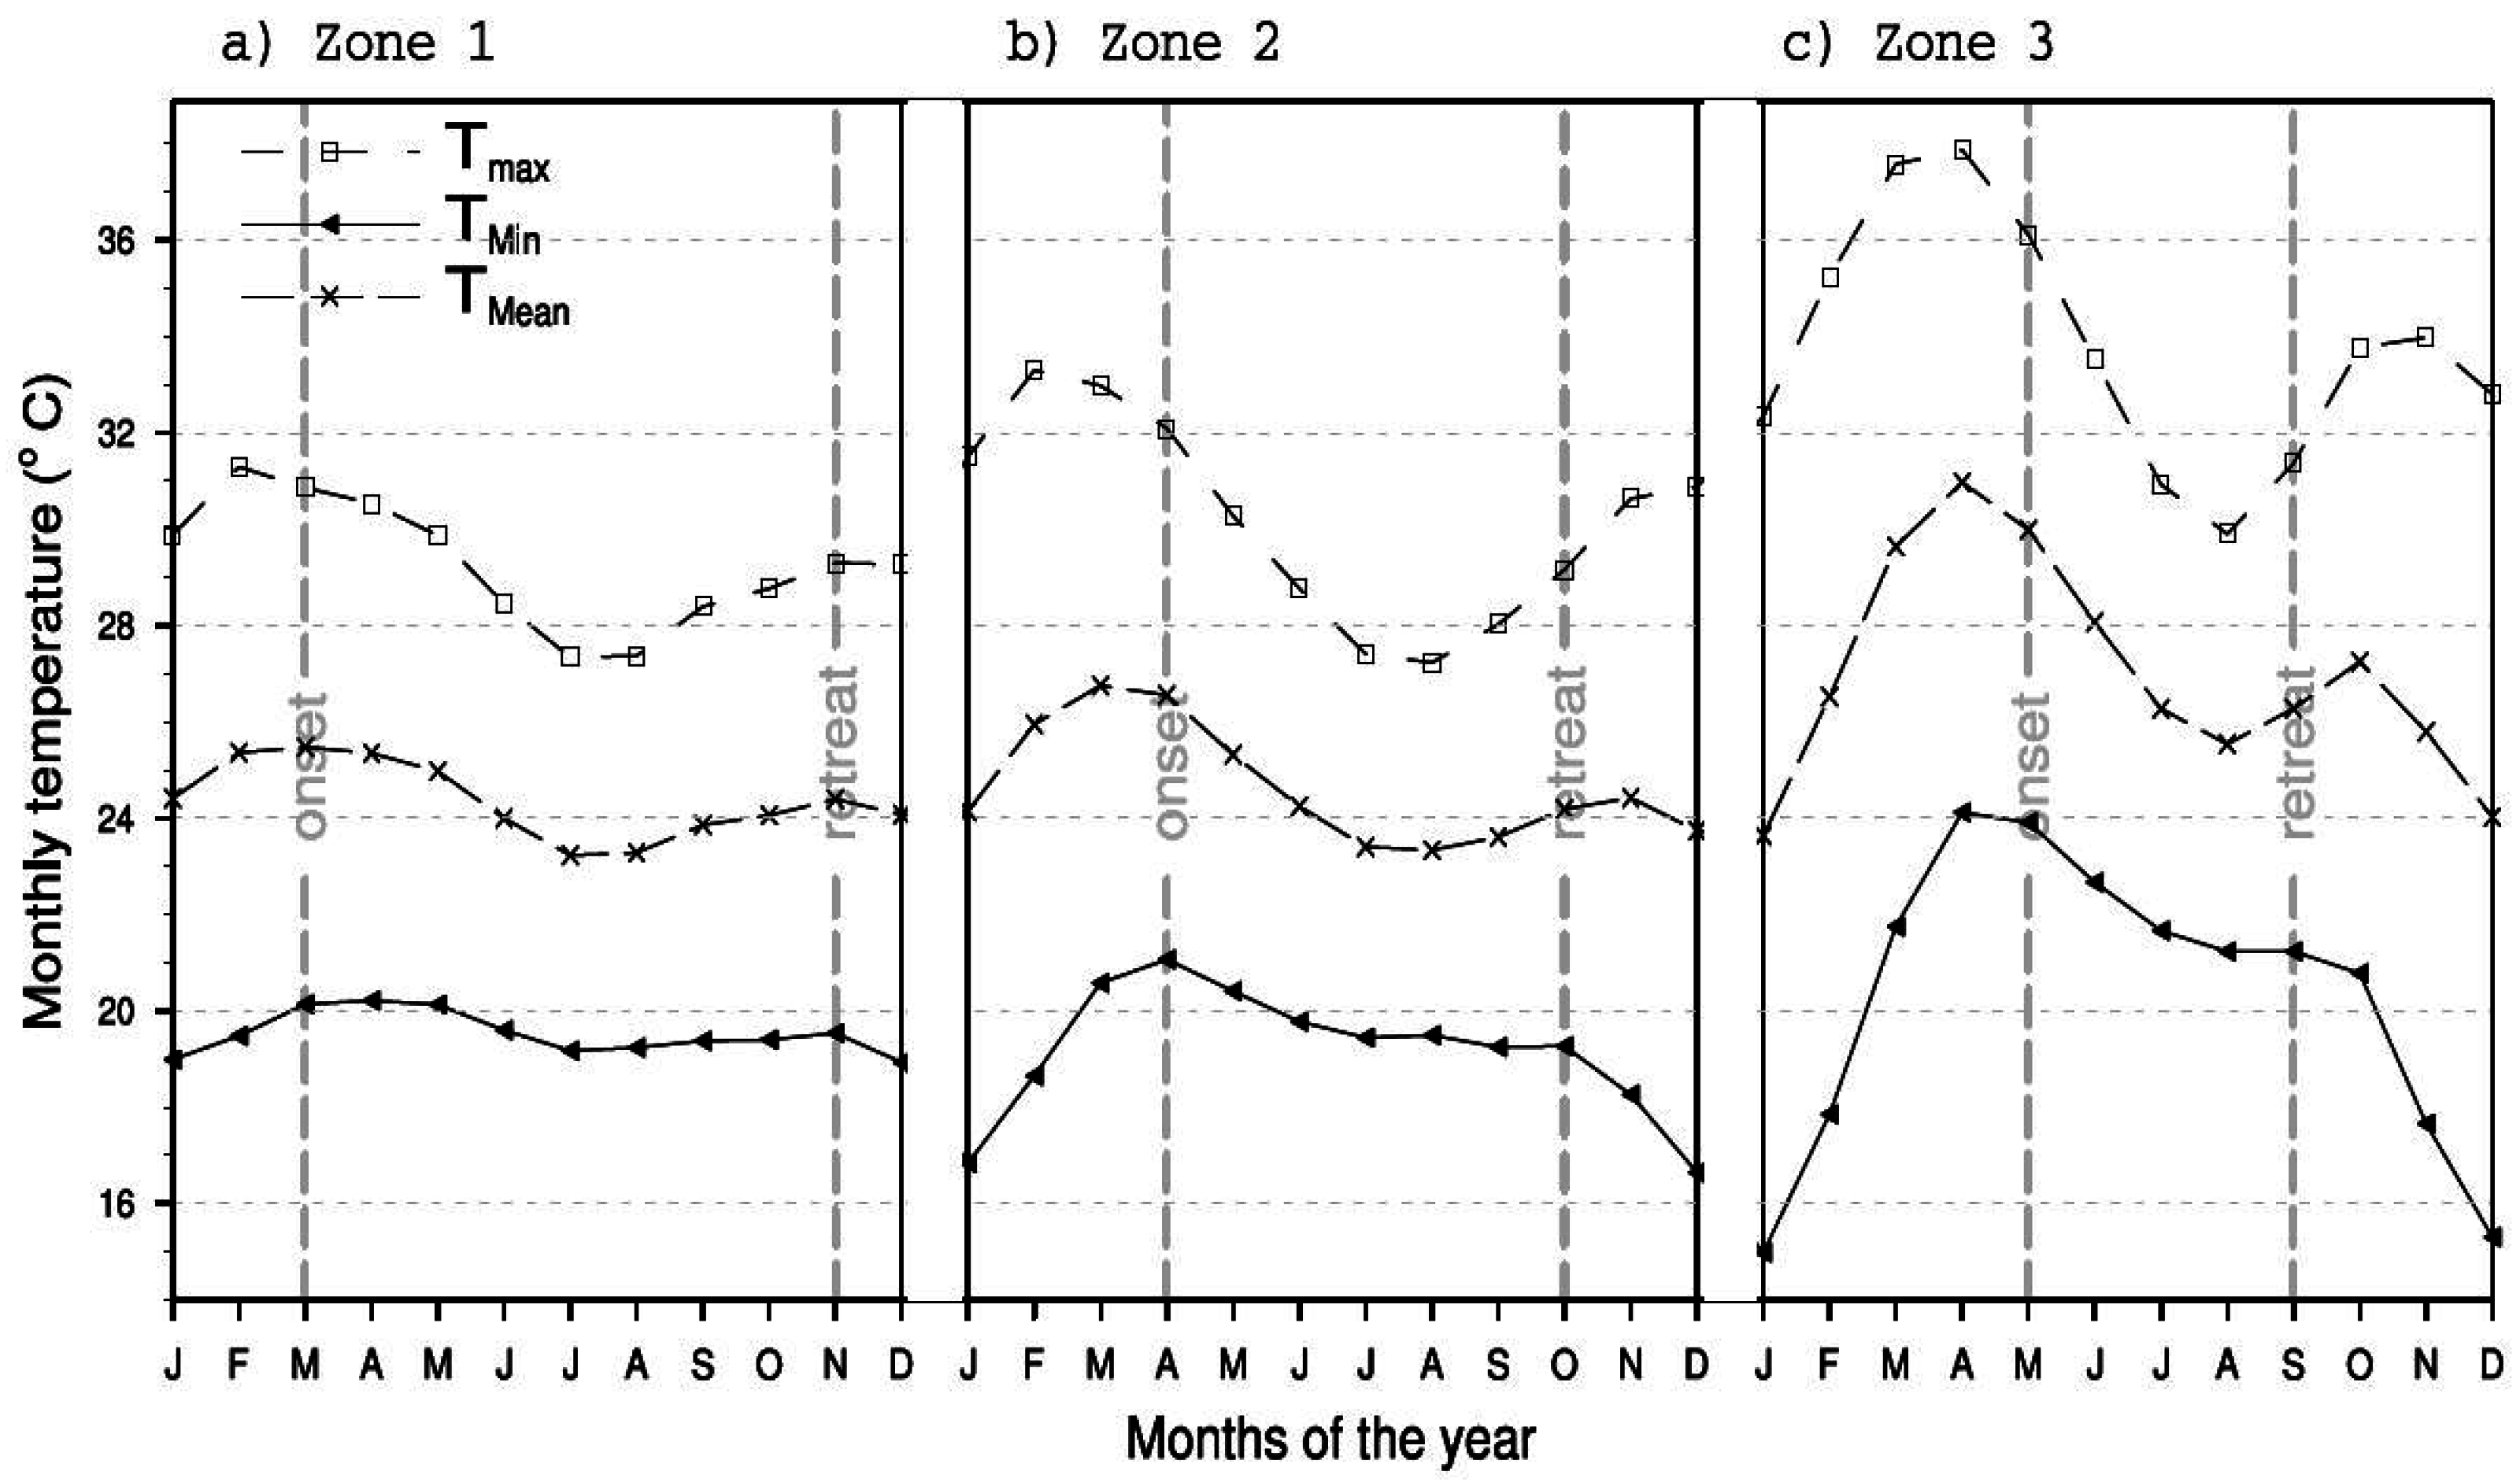
It is observed that the two methods give similar results, but with a slight difference as a consequence of the difference between the values of PET T H and PET P M . For T W S C = 0 and comparing the corresponding first and second months to those of the onset and retreat months of the rainy season, respectively, we accurately obtain the same results for the onset month of the rainy season in Zone 2 and the retreat month in Zone 3. For the others, the onset and retreat months of the rainy season are obtained with a difference less than a unit of time in data (one month), except in Zone 3, where the difference between the two onset months is greater. The first cause of these errors is attributed to PET formulas that are limited to areas where the soil should be wet enough. These formulas become less efficient in arid areas and during dry periods, as is the case in the Sahelian zone (Zone 3) and especially during the period NDJFMA (November–December–January–February–March–April) when the deficit in soil water (TWSC < 0) is high, hence the delay observed in the onset determination of the rainy season. These formulas put things right when the rains begin to achieve a perfect determination of the retreat month of the rainy season in the arid area (Figure 4c). Second, the effect of temperature is to be taken into account in these errors. Indeed, Figure 5 showing the annual cycles of average maximum and minimum temperatures in the three zones highlights the highest temperatures in the Sahelian zone (Figure 5c).
Analysis of Figure 3 and Figure 5 shows a strong correlation between PET and extreme temperatures (especially maximum temperature). They follow the same patterns. Consequently, the rise of air temperature contributes mostly to soil heat and therefore facilitates soil water evaporation.

4.2.4. Favorable Periods for Rainwater-Dependent Activities

The above analysis shows that months with TWSC equal to zero (PR − PET = 0) are very close to the onset and retreat months of the rainy season. When TWSC is greater than zero (PR − PET > 0), it is the rainy season, and the amount of rainwater is important enough to sustain evaporation and provide a water reserve to the area. This represents favorable conditions for plants to grow and for activities depending on the availability of soil/ground water storage. For TWSC less than zero (PR − PET < 0), rainwater is not sufficient to assure potential evapotranspiration, then the ground water reserve is requested to contribute for evaporation and will consequently decrease during the corresponding period (dry season).
Table 3 recapitulates the means of T W S C for each zone and for the two methods used. The differences between results from the two methods ( T W S C P M T W S C T H ) are added.
These results reveal that the two methods agree in determining humid periods except in Zone 2, where TWSC P M indicates eight months long against six for TWSC T H . In fact, the longest period with T W S C > 0 is observed in Zone 1, while Zone 3 shows the shortest one. These periods extend from March–November (nine months) in the Equatorial forest zone (Zone 1), from March–October (eight months) and from May–October (six months) according to TWSC P M and TWSC T H , respectively, in Zone 2 (transition zone), and from July–September (three months) in the Sahelian zone (Zone 3). Standard deviations on TWSC in most cases are higher in arid areas (Zone 3) and during dry months, while those from TWSC T H are most often slightly larger. This indicates stronger inconsistency of the Thornthwaite formula in determining PET in arid areas comparatively to the Penman–Monteith formula. The main cause is the unsatisfied potential conditions in arid areas and during dry periods in such a way that PET formulas become less efficient. For T W S C P M > 0 , the difference between T W S C P M and T W S C T H (Table 4) shows a gap ranging from 19.58–32.55 mm·month 1 , 10.64–20.61 mm·month 1 and 10.73–17.05 mm·month 1 in Zones 1, 2 and 3, respectively.
In Zone 1, TWSC P M is greater than TWSC T H along the year. In Zones 2 and 3, it is greater during the rainy season or when it approaches.

4.3. Onset and Retreat Dates of the Rainy Season for an Individual Year Applying the TWSC Method

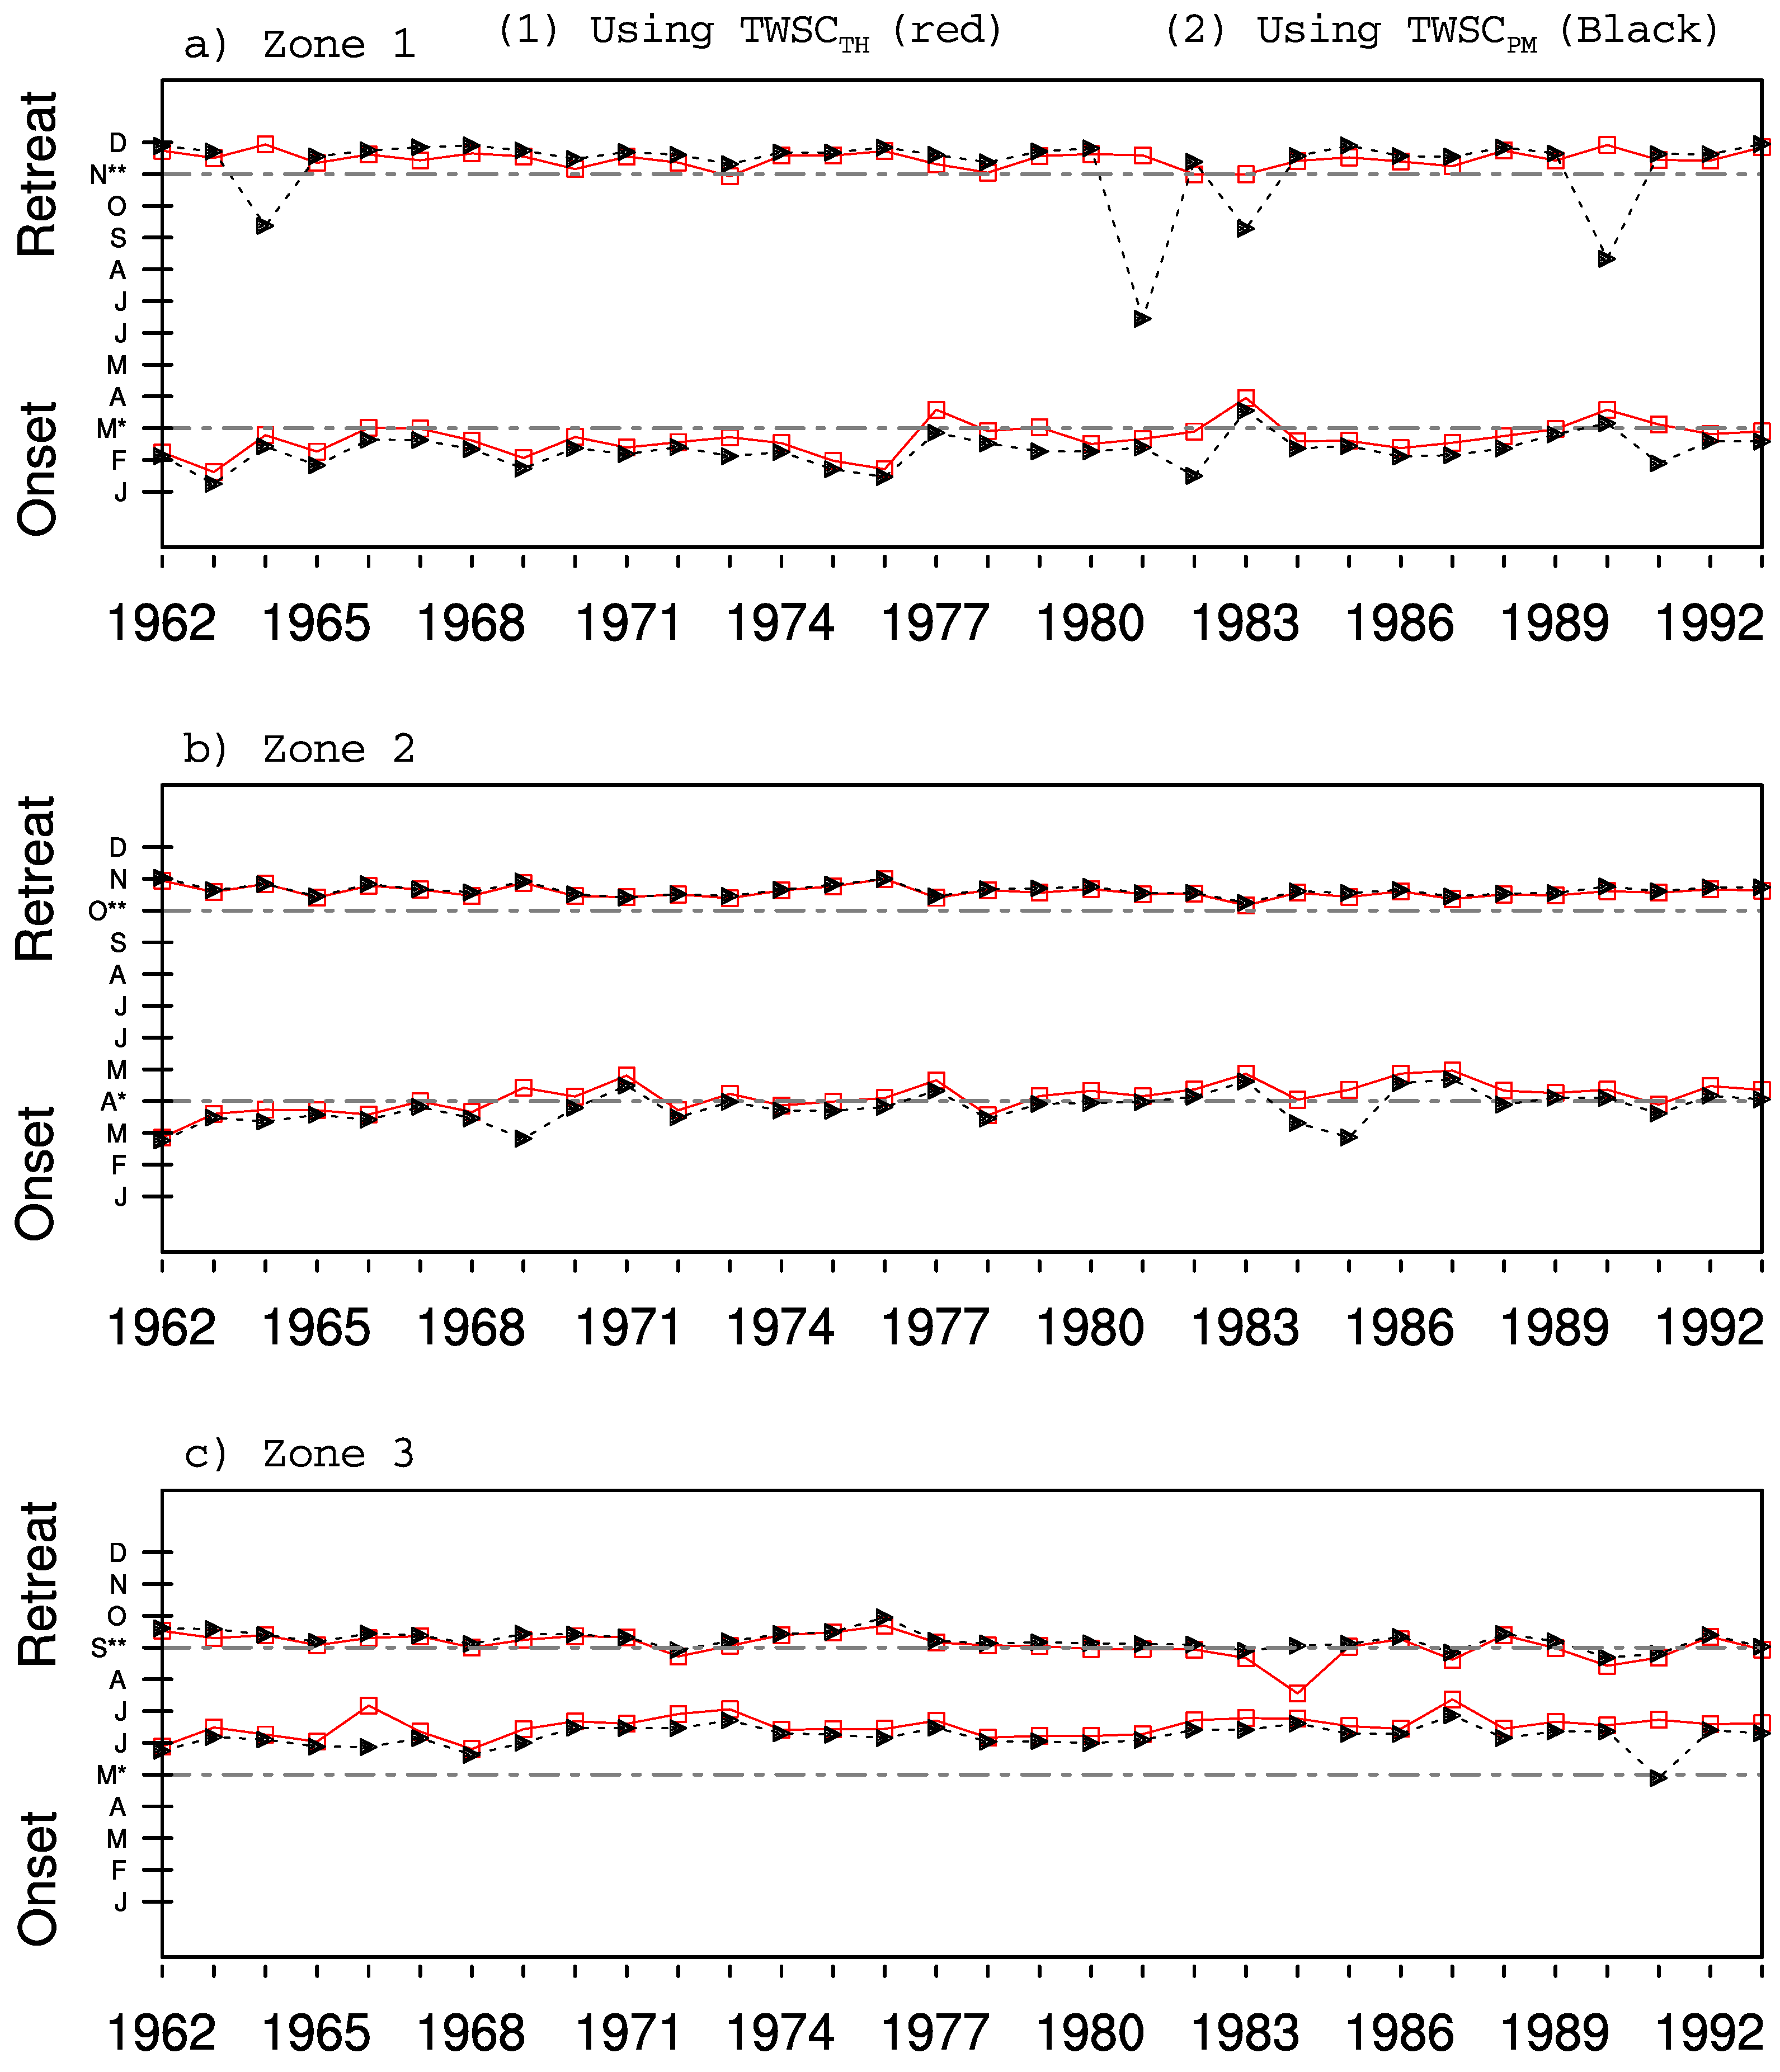
It is important to check how the method of TWSC behaves for a given year so that it can be used for projection, yearly planning activities or decision making. Figure 6 shows time series of the onset and retreat dates of the rainy season in each of the three zones applying the TWSC method.
Results show that the dates obtained from TWSC T H = 0 and TWSC P M = 0 corroborate in most years, except very few cases where the discordance is height (retreat date in Zone 1 in 1964, 1981, 1983 and 1990). In general, the calculated dates are consistent with the reference months and are slightly earlier for onset and later for retreat, except with onset in Zone 3 (Sahelian zone), where the dates are the latest. The reasons for these weakness were mentioned in Section 4.2.3.

4.4. Interannual Variability of TWSC

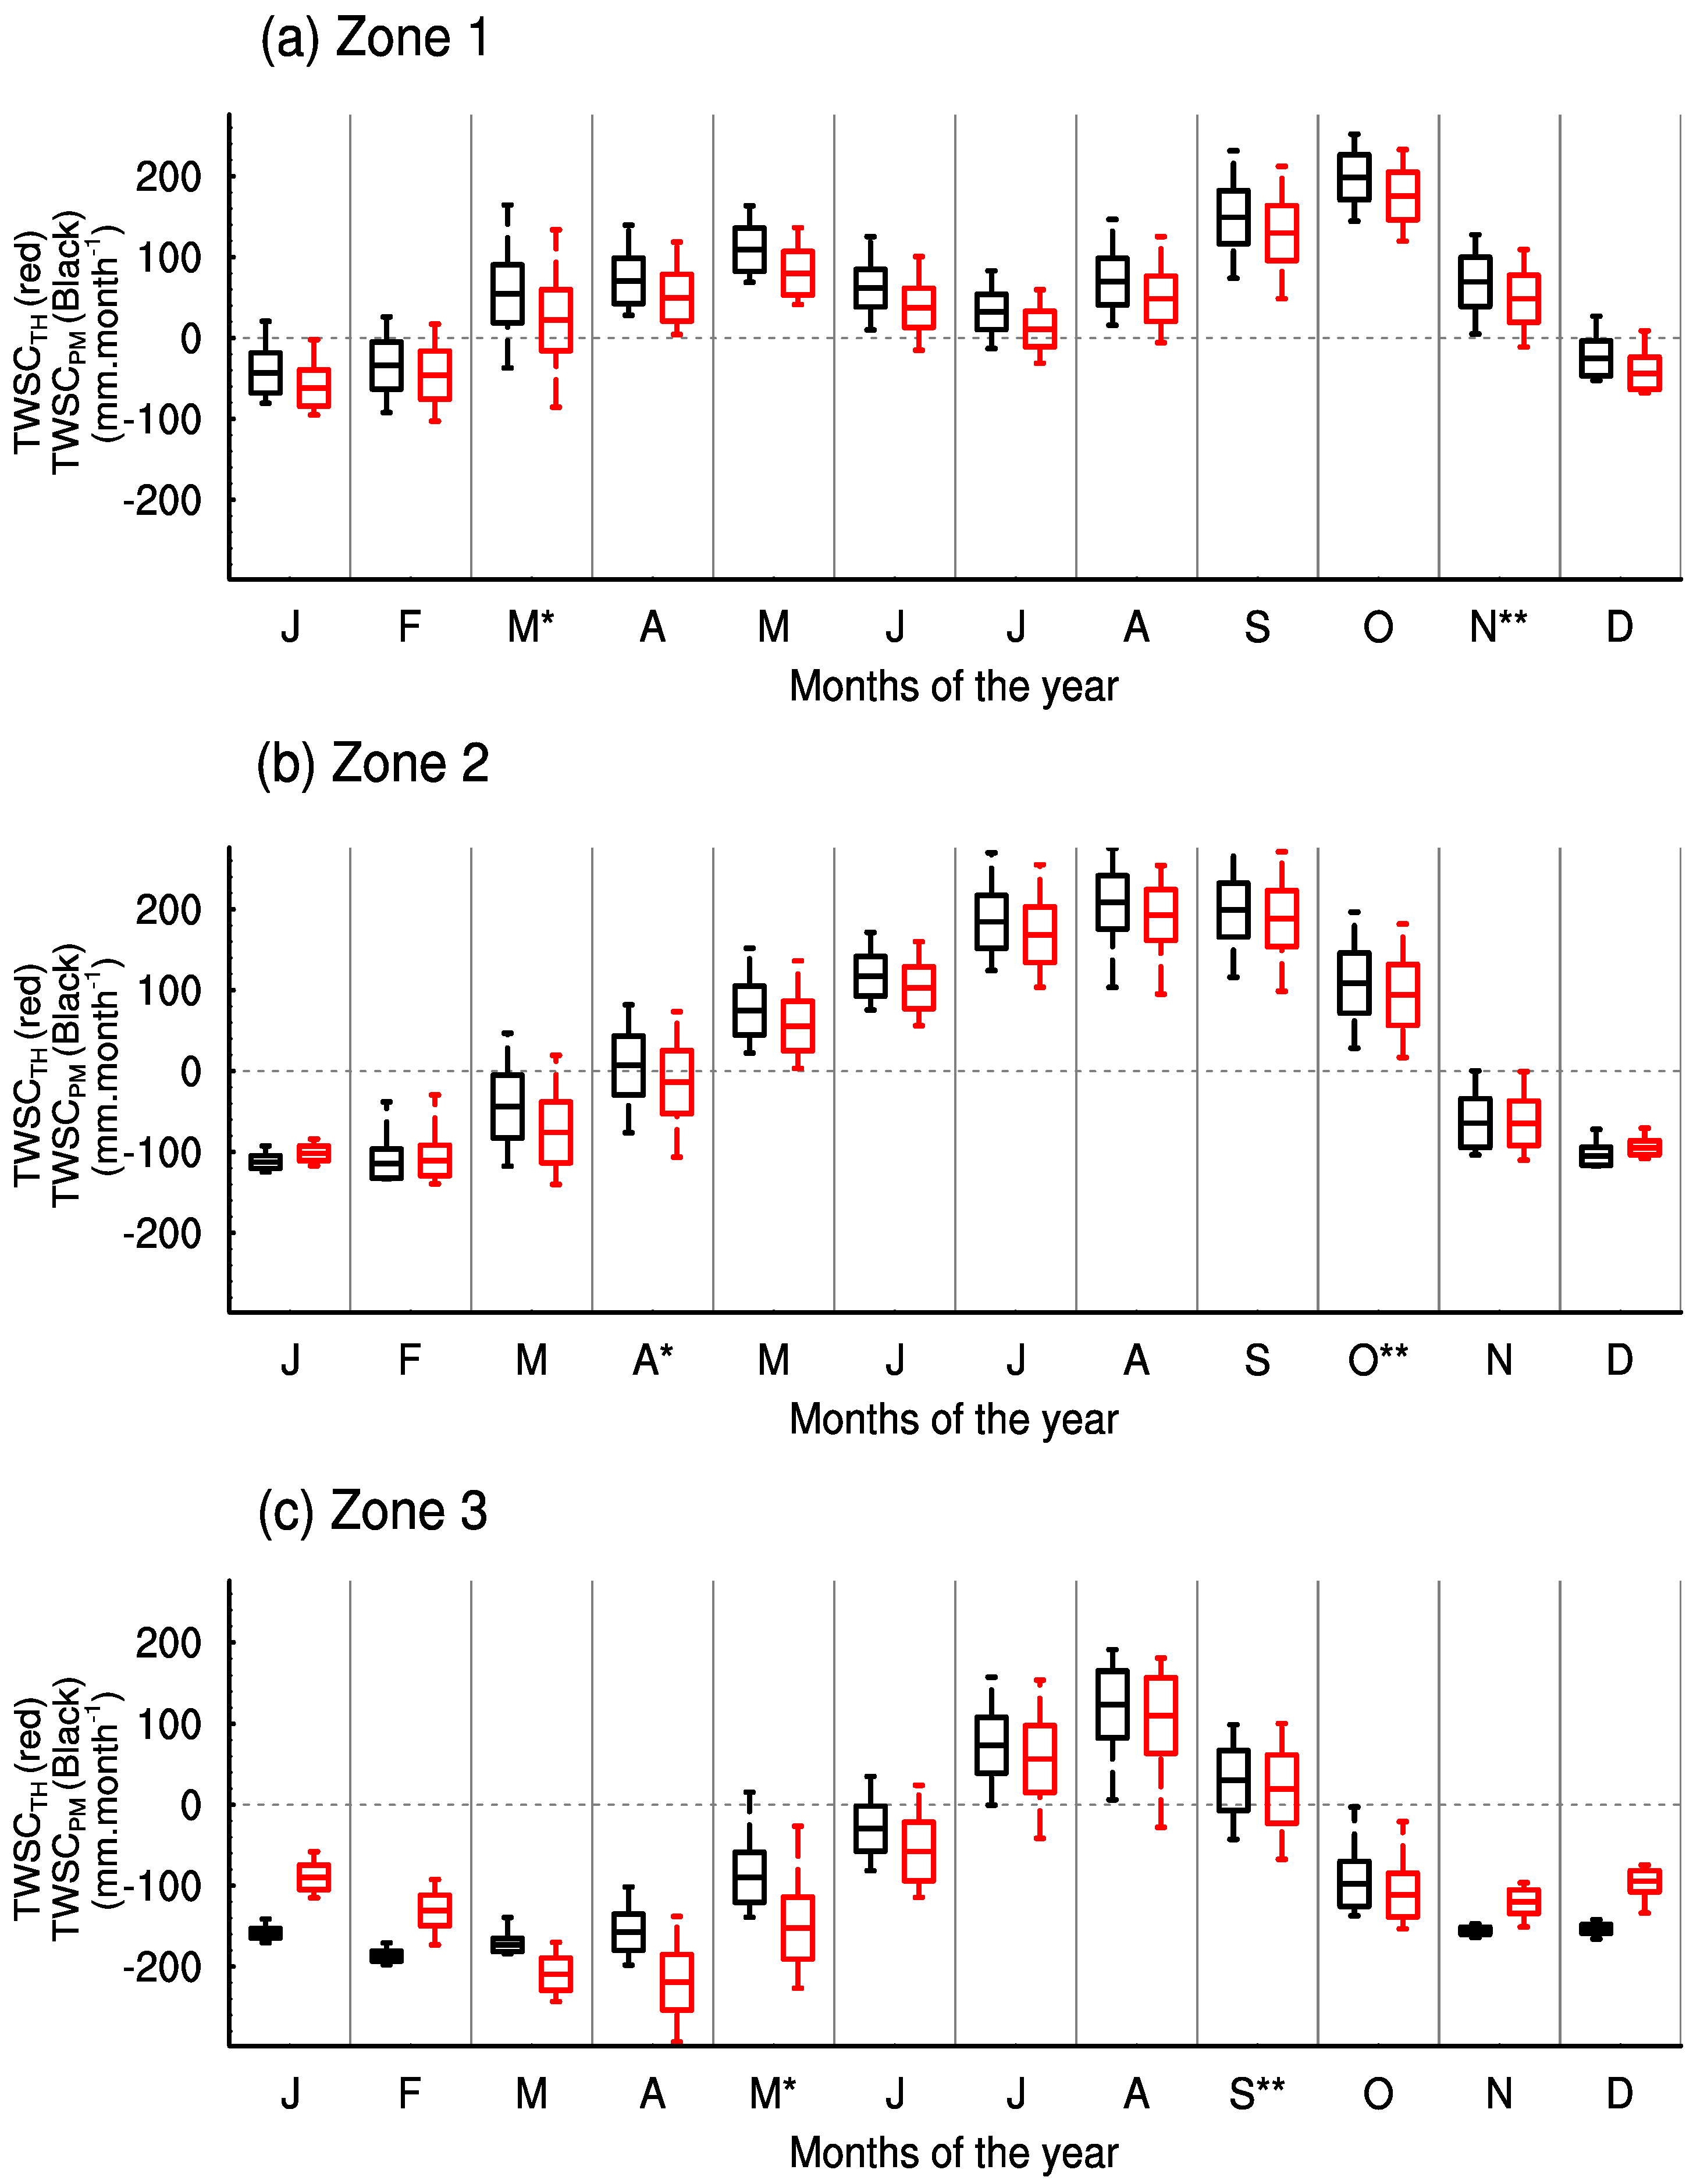
Figure 7 shows the annual cycle of box-plots carrying some statistical information on the values of TWSC (TWSC T H and TWSC P M ) for the different zones of the study area. These boxes provide information about the TWSC mean, standard deviation and extreme values.
The box-plots representing TWSC T H and TWSC P M have similar patterns, both following the shape of annual precipitation cycles, except in Zone 3, where TWSC shows an unexpected convex shape during the dry period. This deformation highlights the inconsistency of PET formulas for arid areas and especially during dry periods. From these figures, it is also noted that deficit in precipitation increases (TWSC decreasing) northward. The standard deviation between the interannual values of TWSC is generally greater during the rainy season in view of the importance of the height of box-plots during this season. The intersection with the reference line ( T W S C = 0 ) is observed during the onset months of the rainy season in Zones 1 and 2 and during the retreat month in Zone 3. The other intersection points with the reference line match the onset and retreat months if the extreme values of TWSC are considered. In any case, mean TWSC T H is closer to the reference line than mean TWSC P M , except for onset date in Zones 2 and 3, where TWSC P M outperforms.
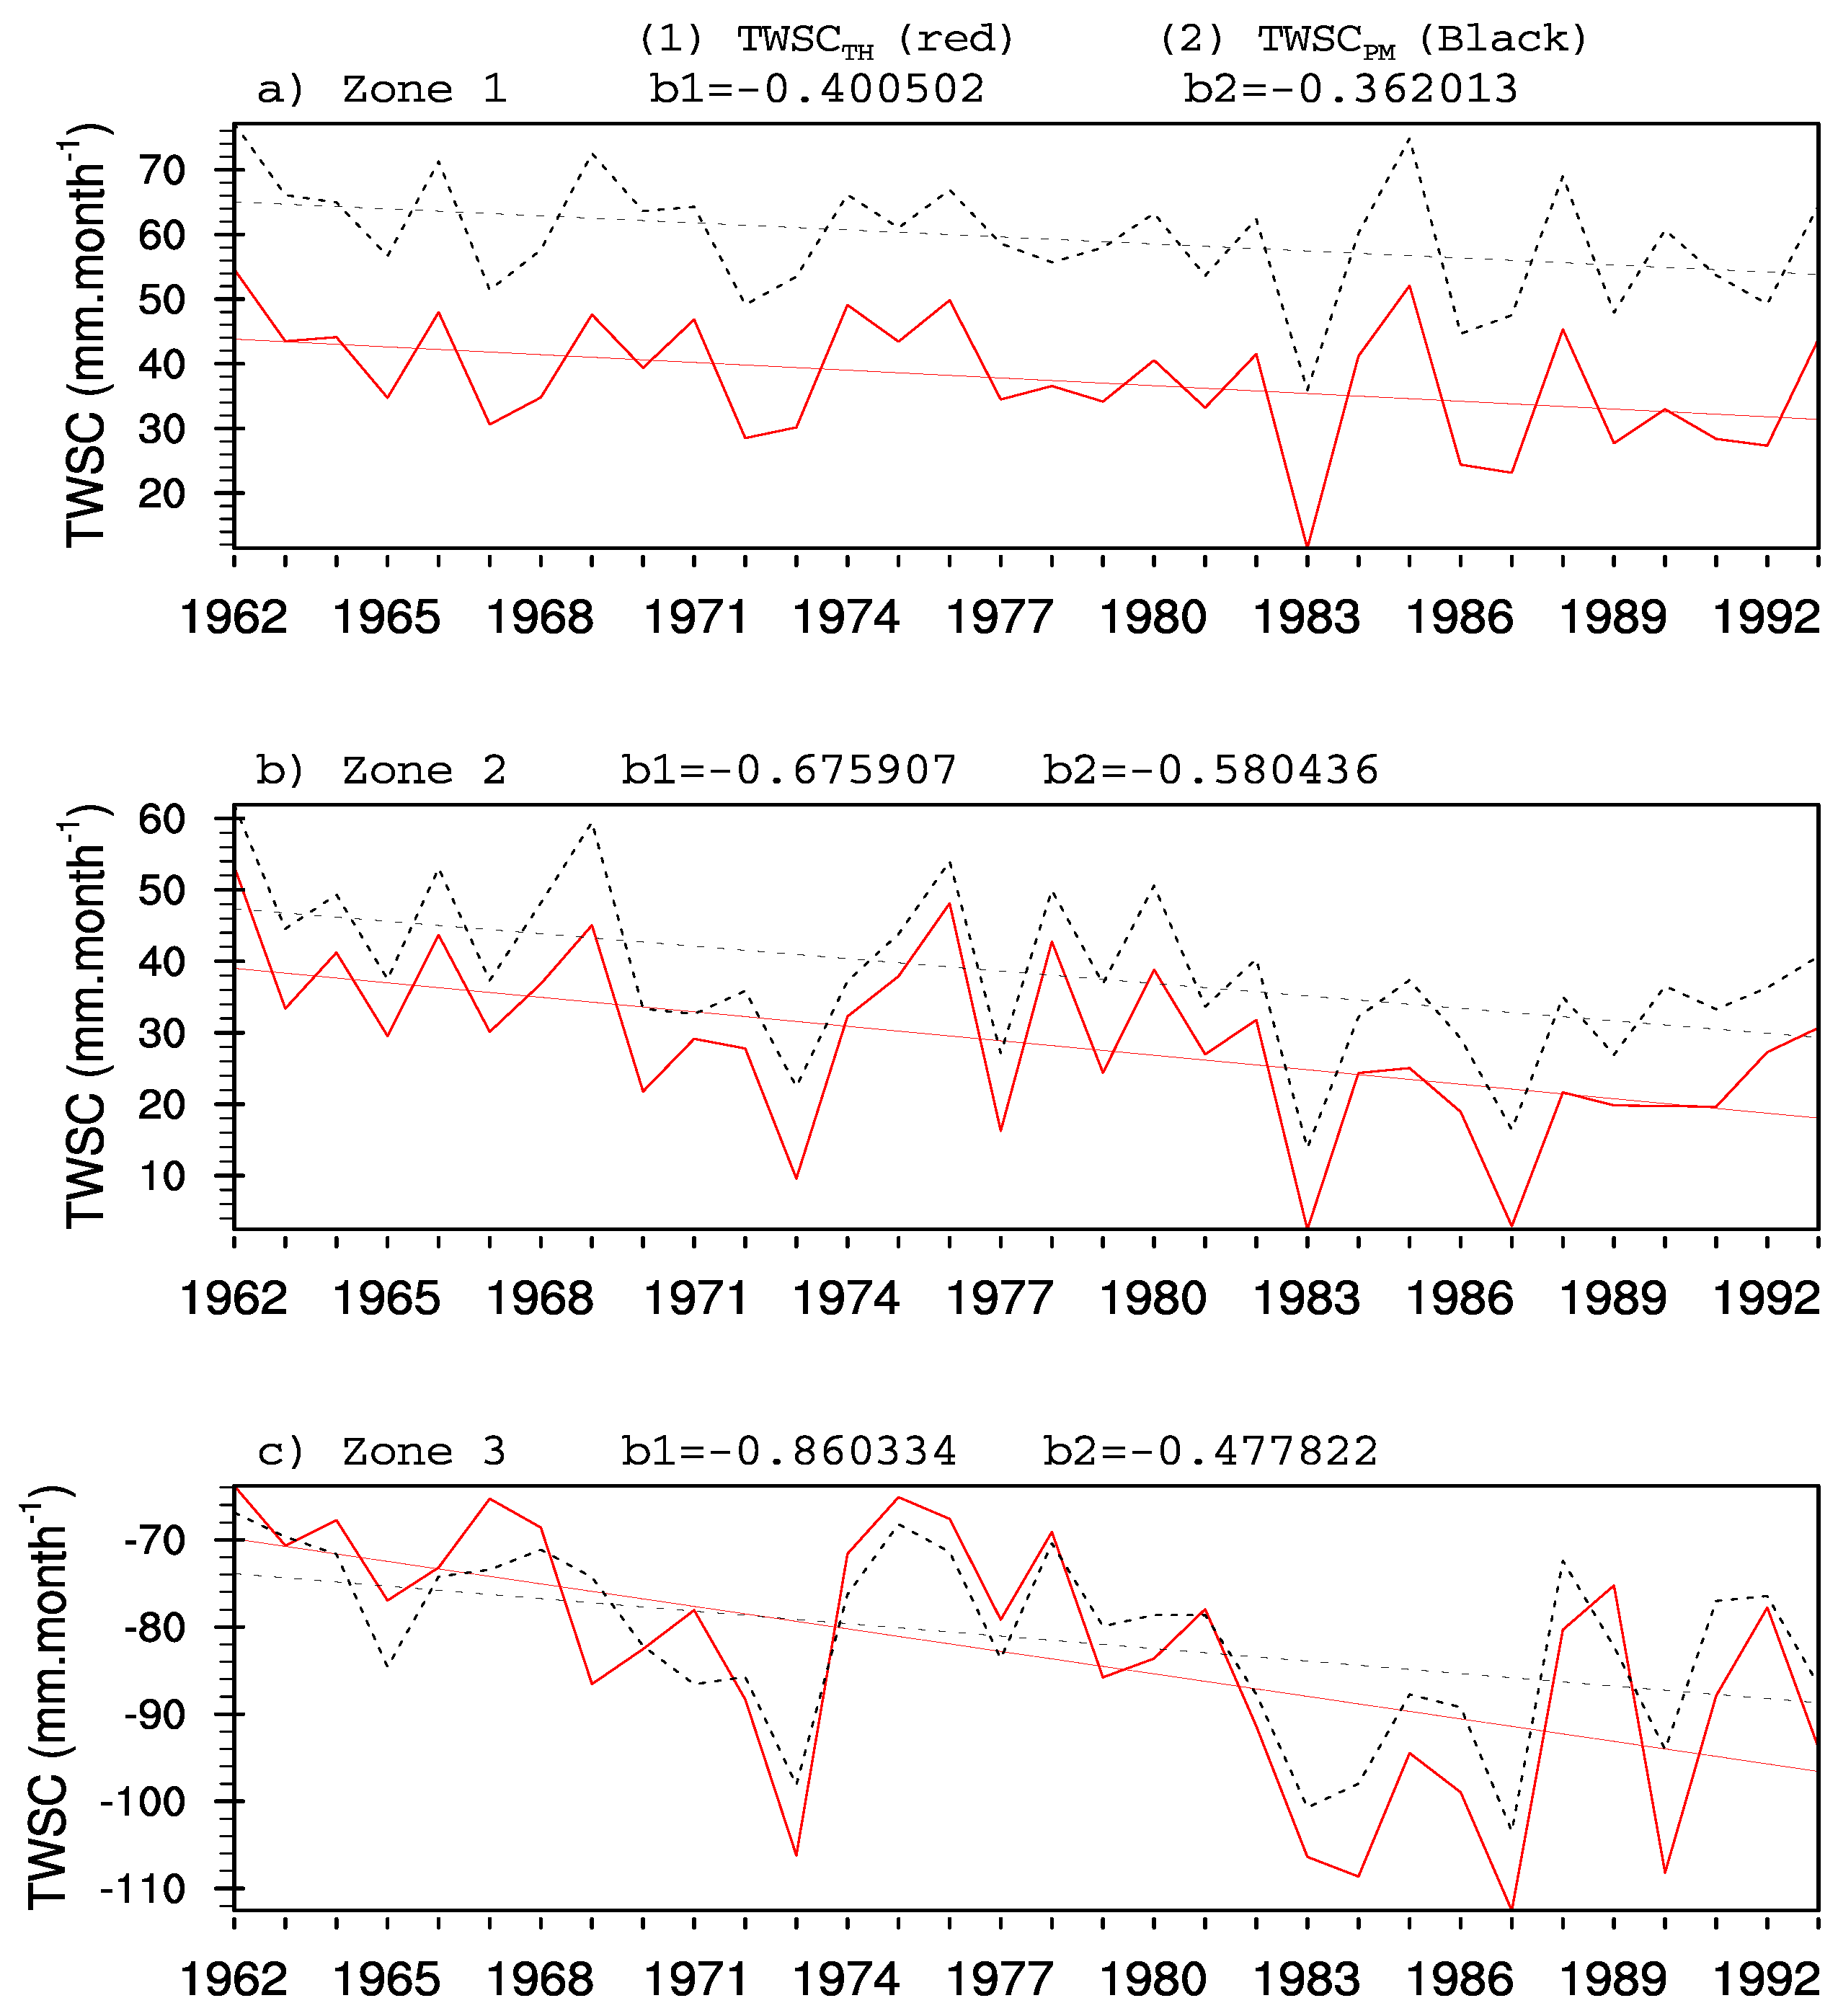
Figure 8 shows the time series of TWSC T H and TWSC P M for each zone of the study domain. The goal is to examine the effects of climate change on the interannual values of TWSC.
Once again, we note that patterns of both TWSC T H and TWSC P M corroborate and that TWSC P M values remain somewhat larger over the years. The trends are all negative, with amplitudes increasing from Zone 1 to Zone 3, showing a decrease in TWSC with the magnitudes increasing northward, TWSC P M underestimating the decline in Zone 3 (Figure 8c). With regard to the positive values of TWSC in Zones 1 and 2, and negative in Zone 3 for most years, one is tempted to conclude that Zones 1 and 2 have not witnessed deficits in soil water (although declining) and that Zone 3 has almost always been in deficit; worse still, these deficits continue to decline.
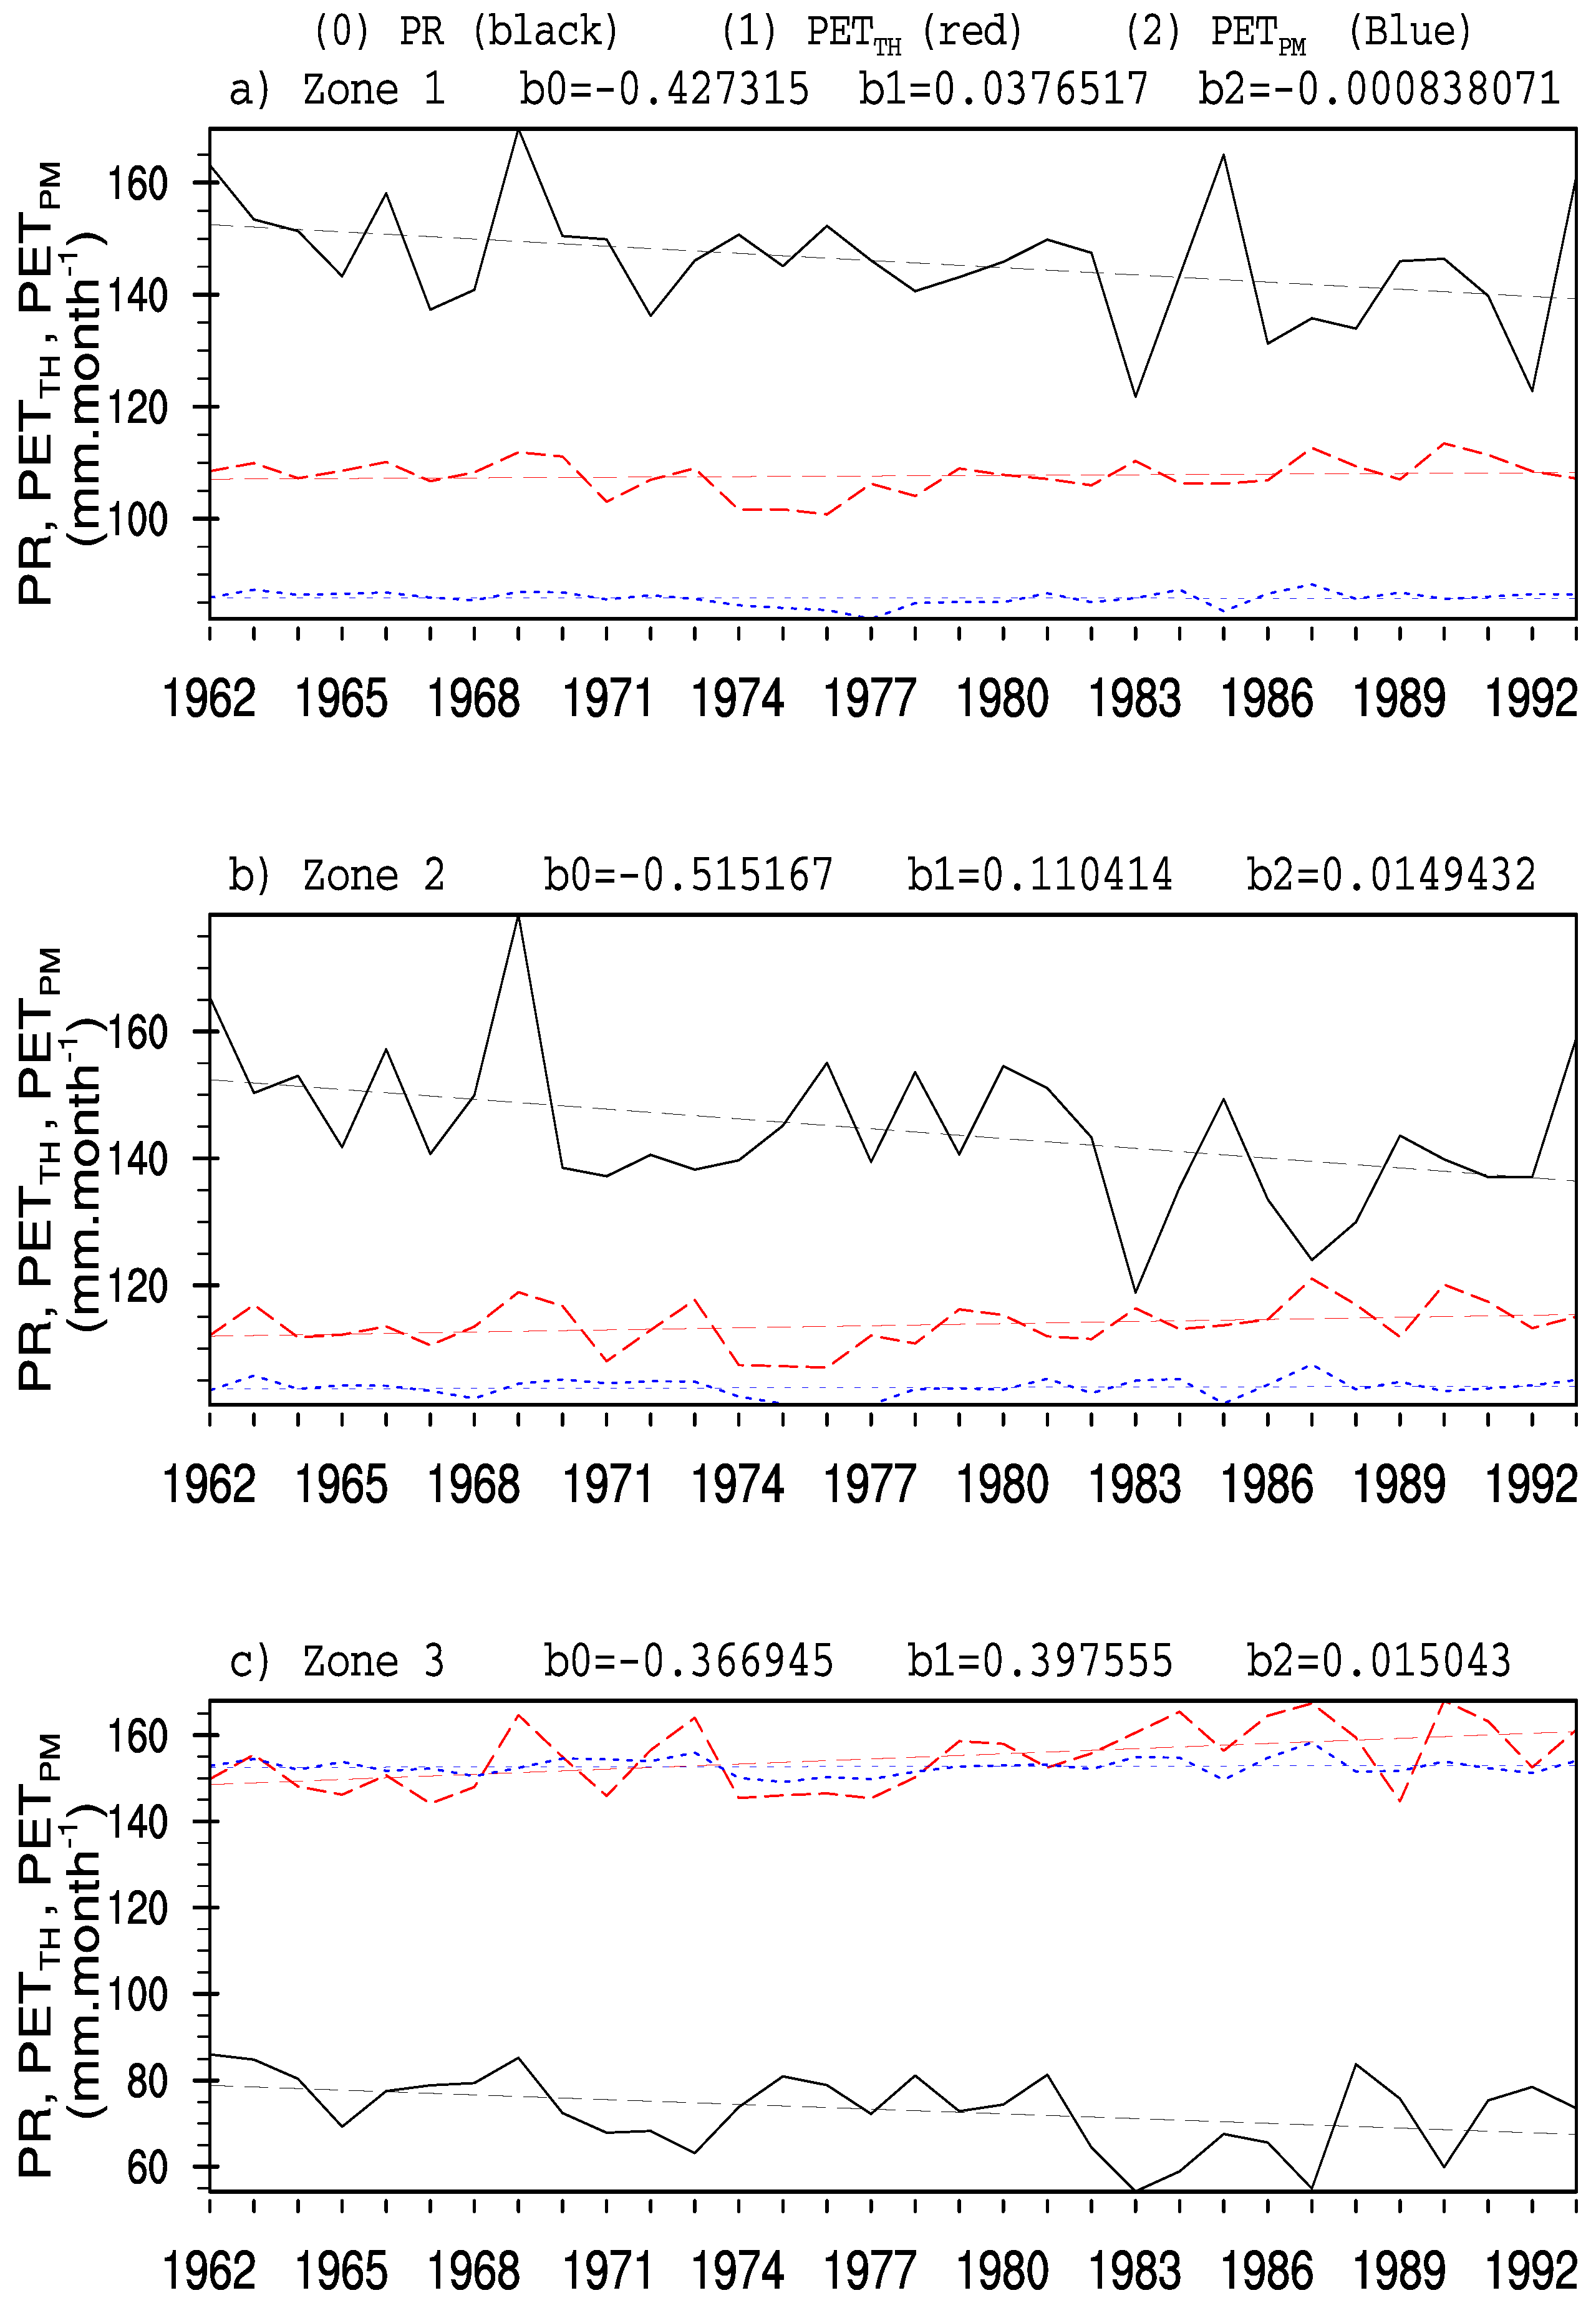
In order to understand the reason why TWSC, although decreasing, was always positive in Zones 1 and 2 and negative in Zone 3, interannual PR, PET T H and PET P M were studied (Figure 9).
The following statements were deduced from this figure: (a) precipitation amounts (PR) were always higher than PET T H and PET P M in Zones 1 and 2 and lower in Zone 3; (b) In the three zones, PR decreased with slopes in Zones 1 and 2 (−0.43 and −0.52, respectively) stronger than in Zone 3 (−0.37). In the meantime, trends in PET T H and PET P M , although increasing in most cases, remained too weak. Consequently, the difference P R P E T = T W S C decreased in all zones and remains positive in Zones 1 and 2 and negative in Zone 3.
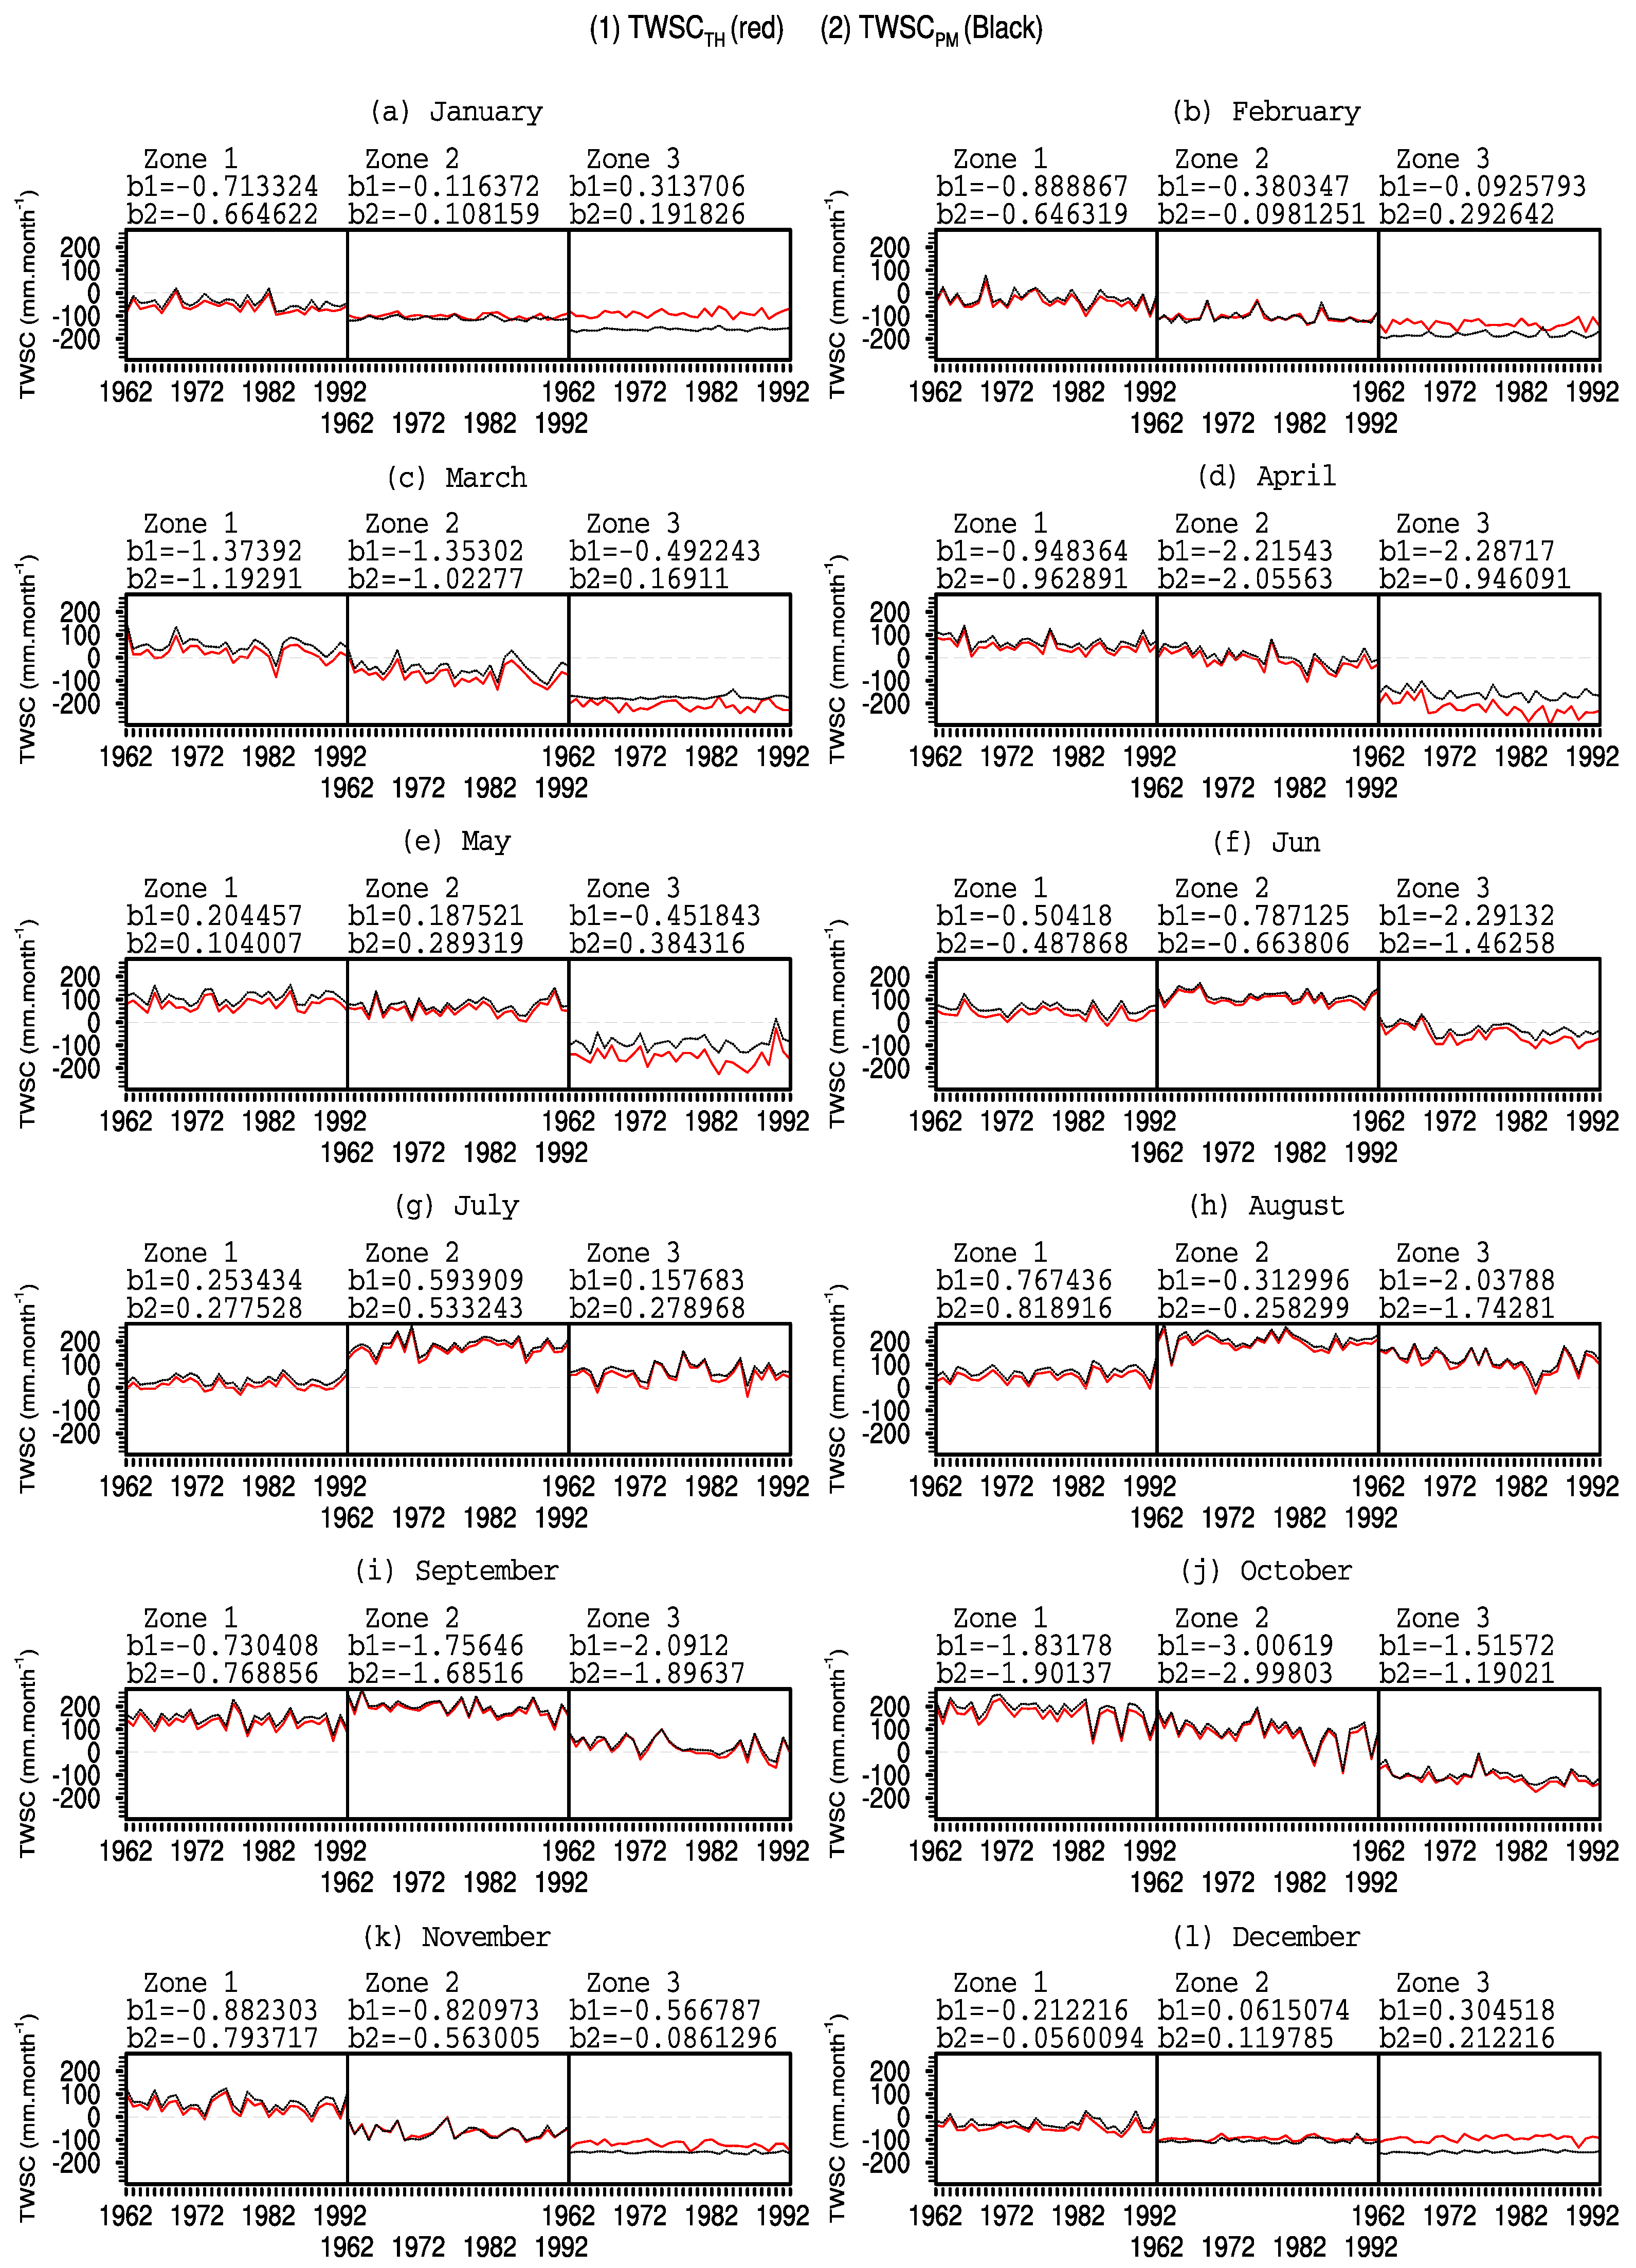
A careful examination of interannual TWSC at the monthly scale (for each month of the year) (Figure 10) reveals more details.
Zones 1 and 2 have indeed actually witnessed some deficits (TWSC < 0) in the months of January, February, March (less frequent in Zone 1), April and November (Zone 2 only) and December. These deficits that have been of low frequency and amplitude are masked by the high frequency and amplitude of the interannual accumulation of water in the soil during the other months. The opposite situation is observed in Zone 3 where overall soil water deficit outweighs soil water accumulation. The months when TWSC is positive are July, August and September, corresponding to the rainy season.

5. Discussion and Conclusions

We have calculated total water storage (TWSC) in three defined climatic zones over Cameroon by subtracting potential evapotranspiration from precipitation. Data used were CRU precipitation (PR), CRU PET from the Penman–Monteith formula (PET P M ) and PET T H that we calculated from the Thornthwaite formula using CRU precipitation and temperatures. Therefore, two parameters defined as TWSC P M ( P R P E T P M ) and TWSC T H ( P R P E T T H ) were derived and analyzed based on annual cycle and interannual variability for each climatic zone of the study area.
The aridity index helped us to determine that the area is humid below 8 N of latitude and semiarid above. This classification led to better appreciation of the correlation that exists between PET calculated from mathematical formulas and actual evapotranspiration. Indeed, both values are equal in humid areas, while PET becomes greater than actual evapotranspiration when tending to arid areas.
It was found that TWSC and PR both decreased northward and showed similar patterns. The values of TWSC P M remained slightly higher and more consistent. This consistency of the Penman–Monteith PET formula confirms its efficiency compared to other formulas [13]. By setting TWSC equal to zero, a close link was observed between the corresponding months and onset and retreat dates of the rainy season calculated by Guenang and Mkankam [30] using the cumulative percentage mean rainfall amount method [38], except in the Sahelian area (Zone 3), where a lag of about 1.5 months is observed in rainfall onset month determination. This delay is due firstly to PET formulas, which are defined only for humid areas. Therefore, they become less efficient in arid areas (Sahelian zone, e.g., Zone 3) and during the dry period when the soil is in deficit of water (TWSC < 0). These formulas put things right when the rains begin to achieve a perfect determination of the retreat date of the rainy season. All in all, the success of the method in Zones 1 and 2 comes from the fact that the condition of sufficient water availability at the surface is satisfied in such a way that the PET is equal to actual evapotranspiration [21], whereas that condition is not satisfied in semiarid area (Zone 3), especially during the dry season. Secondly, it is due to strong evaporation in arid areas (e.g., Zone 3) as the consequence of high temperatures during dry periods, especially at the approach of the rainy season. In fact, this high difference between the two dates occurred only in the hottest part of the study area (Zone 3), where monthly temperatures were generally higher and oscillated between 15 C and 38 C. During the period of the lag, intense soil heat facilitates strong evaporation of soil water after the first rains, letting the soil dry. Furthermore, it was observed that the interannual variabilities of rainfall onset in this zone are higher [30].
The study of the interannual variabilities revealed an overall declining trend of TWSC change as the result of the sharp interannual decrease (with a strong contribution of the decline during dry months) of yearly precipitation compared to PET. In many areas of the world, negative trends were also found in TWSC change estimated from different methods. For instance, Moiwo et al. [25] used satellite-based (GRACE and GLDAS) and ground-measured (precipitation) hydrological data to show water storage depletion in the North China Region [25]. A study using a simple empirical climate model (ECM) and the Gravity Recovery and Climate Experiment (GRACE) satellite data found an overall negative storage change in the Himalayas and Tibetan Plateau [19]; they attributed the possible causes of this storage loss to human activities (e.g., farm irrigation) and climate change (e.g., temperature rise and global warming). Agriculture is expected to suffer from this change given that the availability of water resources is closely linked to precipitation and therefore to the rainy season.
This study brings more useful information for water resources management in the sense that it specifies the periods when the water can be available in the soil/ground. Taking these periods into account can avoid seed losses and may be of benefit to farmers. This can also help to plan activities that are rain-fed or hydrologically dependent, like agriculture, civil engineering works (bridge and road construction, etc.) or optimization of the hydro-electric energy production. The study also found that setting TWSC to zero and determining the corresponding dates can be used as an alternative method for the onset and retreat dates’ determination of the rainy season. However, the use of potential evapotranspiration instead of actual evapotranspiration to calculate TWSC leads to a biased onset date in arid areas. In future investigations, it would be interesting to focus on the correction of this bias and to go further into the establishment of the link between TWSC and the onset and retreat dates of the rainy season; for instance, the use of data at finer scale (weekly means, pentad means or daily means) in order to increase the accuracy of the connection between these parameters. It would also be of great interest to use actual evapotranspiration if available.

Acknowledgments

The authors thank the Climatic Research Unit of the University of East Anglia that produced the CRU monthly data. Many thanks also go to the anonymous reviewers for their suggestions and to the editor who gave us the opportunity to improve this work.

Author Contributions

Guy Merlin Guenang and Francois Mkankam Kamga conceived the objectives and defined the steps of the work; Guy Merlin Guenang and Derbetini A. Vondou performed the calculations and analyzed the data; Guy Merlin Guenang and Francois Mkankam Kamga wrote the paper.

Conflicts of Interest

The authors declare no conflict of interest.

Abbreviations

The following abbreviations are used in this manuscript:
CRUClimatic Research Unit
ETEvapotranspiration
GRACEGravity Recovery and Climate Experiment
ITDInter-Tropical Discontinuity
PETPotential evapotranspiration
PRMonthly precipitation
SPIStandardized Precipitation Index
TASSurface temperature
T m a x Maximum temperatures
T m e a n Average temperatures
T m i n Minimum temperatures
TWSCTotal water storage change

References

  1. Indrani, P.; Abir, A.-T. Assessing seasonal precipitation trends in India using parametric and non-parametric statistical techniques. Theor. Appl. Climatol. 2011, 103, 1–11. [Google Scholar]
  2. Lu, J.; Sun, G.; McNulty, S.G.; Amatya, D.M. A comparison of six potential evapotranspiration methods for regional use in the southeastern United States. J. Am. Water Resour. Assoc. 2005, 41, 621–633. [Google Scholar] [CrossRef]
  3. Alexandris, S.; Stricevic, R.; Petkovic, S. Comparative analysis of reference evapotranspiration from the surface of rainfed grass in central Serbia, calculated by six empirical methods against the Penman-Monteith formula. Eur. Water 2008, 21/22, 17–28. [Google Scholar]
  4. Brutsaert, W.; Stricker, H. An advection-aridity approach to estimate actual regional evapotranspiration. Water Resour. Res. 1979, 15, 443–450. [Google Scholar] [CrossRef]
  5. Chen, J.L.; Wilson, C.R.; Famiglietti, J.S.; Rodell, M. Attenuation effect on seasonal basin-scale water storage changes from GRACE time-variable gravity. J. Geod. 2007, 81, 237–245. [Google Scholar] [CrossRef]
  6. Feng, W.; Zhong, M.; Lemoine, J.-M.; Biancale, R.; Hsu, H.-T.; Xia, J. Evaluation of groundwater depletion in North China using the Gravity Recovery and Climate Experiment (GRACE) data and ground-based measurements. Water Resour. Res. 2013, 49, 2110–2118. [Google Scholar] [CrossRef]
  7. Long, D.; Longuevergne, L.; Scanlon, B.R. Global analysis of approaches for deriving total water storage changes from GRACE satellites. Water Resour. Res. 2015, 51, 2574–2594. [Google Scholar] [CrossRef] [Green Version]
  8. Piao, S.; Ciais, P.; Huang, Y.; Shen, Z.; Peng, S.; Li, J.; Zhou, L.; Liu, H.; Ma, Y.; Ding, Y. The impacts of climate change on water resources and agriculture in China. Nature 2010, 467, 43–51. [Google Scholar] [CrossRef] [PubMed]
  9. Sadek, M.F.; Shahin, M.M.; Stigter, C.J. Evaporation from the reservoir of the High Aswan Dam, Egypt: A new comparison of relevant methods with limited data. Theor. Appl. Climatol. 1997, 56, 57–66. [Google Scholar] [CrossRef]
  10. Wang, D. Evaluating interannual water storage changes at watersheds in Illinois based on long-term soil moisture and groundwater level data. Water Resour. Res. 2012, 48, W03502. [Google Scholar] [CrossRef]
  11. Bouchet, R.J. Evapotranspiration réelle, évapotranspiration potentielle, et production agricole. Ann. Agron. 1963, 14, 543–824. [Google Scholar]
  12. Bouteldjaoui, F.; Bessenasse, M.; Guendouz, A. Etude comparative des différentes méthodes d’estimation de l’évapotranspiration en zone semi-aride (cas de la région de Djelfa). Nat. Technol. 2012, 2012, 109–116. [Google Scholar]
  13. Chen, D.; Gao, G.; Xu, C.Y.; Guo, J.; Ren, G. Comparison of the Thornthwaite method and pan data with the standard Penman-Monteith estimates of reference evapotranspiration in China. Clim. Res. 2016, 28, 123–132. [Google Scholar] [CrossRef]
  14. Harris, I.; Jones, P.; Osborn, T.; Lister, D. Updated high-resolution grids of monthly climatic observations - the CRU TS3.10 dataset. Int. J. Climatol. 2012. [Google Scholar] [CrossRef] [Green Version]
  15. McMahon, T.A.; Peel, M.C.; Lowe, L.; Srikanthan, R.; McVicar, T.R. Estimating actual, potential, reference crop and pan evaporation using standard meteorological data: A pragmatic synthesis. Hydrol. Earth Syst. Sci. 2013, 17, 1331–1363. [Google Scholar] [CrossRef]
  16. Allen, R.G.; Pereira, L.S.; Raes, D.; Smith, M. Crop Evapotranspiration—Guidelines for Computing Crop Water Requirements; FAO Irrigation and Drainage Paper 56; FAO: Rome, Italy, 1998. [Google Scholar]
  17. Cao, G.; Han, D.; Song, X. Evaluating actual evapotranspiration and impacts of groundwater storage change in the North China Plain. Hydrol. Process. 2013. [Google Scholar] [CrossRef]
  18. Katerji, N.; Perrier, A.; Renard, D.; Kerim, A.; Aissa, O. Modélisation de l’évapotranspiration réelle ETR d’une parcelle de luzerne : rôle d’un coefficient cultural. Agron. EDP Sci. 1983, 3, 513–521. [Google Scholar] [CrossRef]
  19. Moiwo, J.P.; Yang, Y.; Tao, F.; Lu, W.; Han, S. Water storage change in the Himalayas from the Gravity Recovery and Climate Experiment (GRACE) and an empirical climate model. Water Resour. Res. 2011, 47, W07521. [Google Scholar] [CrossRef]
  20. Sharma, V.; Kilic, A.; Irmak, S. Impact of scale/resolution on evapotranspiration from Landsat and Modis images. Water Resour. Res. 2016. [Google Scholar] [CrossRef]
  21. Brutsaert, W. A generalized complementary principle with physical constraints for land-surface evaporation. Water Resour. Res. 2015, 51, 8087–8093. [Google Scholar] [CrossRef]
  22. Sean, S.; Wahr, J. Estimating Large-Scale Precipitation Minus Evapotranspiration from GRACE Satellite Gravity Measurements. J. Hydrometeorol. 2005, 7, 252–270. [Google Scholar]
  23. Longuevergne, L.; Wilson, C.R.; Scanlon, B.R.; Cretaux, J.F. GRACE water storage estimates for the Middle East and other regions with significant reservoir and lake storage. Hydrol. Earth Syst. Sci. 2013, 17, 4817–4830. [Google Scholar] [CrossRef] [Green Version]
  24. Mo, X.; Wu, J.J.; Wang, Q.; Zhou, H. Variations in water storage in China over recent decades from GRACE observations and GLDAS. Nat. Hazards Earth Syst. Sci. 2016, 16, 469–482. [Google Scholar] [CrossRef]
  25. Moiwo, J.P.; Tao, F.; Lu, W. Analysis of satellite-based and in situ hydro-climatic data depicts water storage depletion in North China Region. Hydrol. Process. 2012. [Google Scholar] [CrossRef]
  26. Yirdaw, S.Z.; Snelgrove, K.R.; Agboma, C.O. GRACE satellite observations of terrestrial moisture changes for drought characterization in the Canadian Prairie. J. Hydrol. 2008, 356, 84–92. [Google Scholar] [CrossRef]
  27. Zeng, N.; Yoon, J.H.; Mariotti, A.; Swenson, S. Variability of basin-scale terrestrial water storage from a P-E-R water budget method: the Amazon and the Mississippi. J. Clim. 2008, 21, 248–265. [Google Scholar] [CrossRef]
  28. Moiwo, J.P.; Yang, Y.; Han, S.; Lu, W.; Yan, N.; Wu, B. A method for estimating soil moisture storage in regions under water stress and storage depletion: A case study of Hai River Basin, North China. Hydrol. Process. 2011, 25, 2275–2287. [Google Scholar] [CrossRef]
  29. Zhang, L.; Dawes, W.R.; Walker, G.R. Response of mean annual evapotranspiration to vegetation changes at catchment scale. Water Resour. Res. 2001, 37, 701–708. [Google Scholar] [CrossRef]
  30. Guenang, G.M.; Mkankam, K.F. Onset, retreat and length of the rainy season over Cameroon. Atmos. Sci. Lett. 2012, 13, 120–127. [Google Scholar] [CrossRef]
  31. Guenang, G.M.; Mkankam Kamga, F. Computation of the Standardized Precipitation Index (SPI) and its use to assess drought occurrences in Cameroon over recent decades. J. Appl. Meteorol. Climatol. 2014, 53, 2310–2324. [Google Scholar] [CrossRef]
  32. Mortimore, M.; Anderson, S.; Cotula, L.; Davies, J.; Faccer, K.; Hesse, C.; Morton, J.; Nyangena, W.; Skinner, J.; Wolfangel, C. Dryland Opportunities: A New Paradigm for People, Ecosystems and Development; IUCN: Gland, Switzerland; IIED: London, UK; UNDP/DDC: Nairobi, Kenya, 2009; p. 86. [Google Scholar]
  33. Scheff, J.; Frierson, D. Terrestrial aridity and its response to greenhouse warming across CMIP5 climate models. J. Clim. 2015. [Google Scholar] [CrossRef]
  34. Middleton, N.; Thomas, D.S.G. World Atlas of Desertification, 2nd ed.; Wiley: Hoboken, NJ, USA, 1997; p. 182. [Google Scholar]
  35. Safriel, U.; Adeel, Z.; Niemeijer, D.; Puigdefabregas, J.; White, R.; Lal, R.; Winslow, M.; Ziedler, J.; Prince, S.; Archer, E.; et al. Dryland Systems. In Millennium Ecosystem Assessment; Hassan, R., Scholes, R., Ash, N., Eds.; World Resources Institute: Washington, DC, USA, 2005; Volume 1, Charpter 22; pp. 623–662. [Google Scholar]
  36. Wu, G.; Chen, S.; Su, R.; Jia, M.; Li, W. Temporal trend in surface water resources in Tianjin in the Haihe River Basin, China. Hydrol. Process. 2011, 25, 2141–2151. [Google Scholar] [CrossRef]
  37. Thornthwaite, C. An Approach Toward a Rational Classification of Climate. Geograph. Rev. 1948, 38, 55–94. [Google Scholar] [CrossRef]
  38. Ilesanmi, O.O. An ampirical formulation of the onset, advance and retreat of rainfall in Nigeria. J. Trop. Geogr. 1972, 34, 17–24. [Google Scholar]
  39. Ngachie, V. A general assessment of soil resources and soil fertility constraints in Cameroon on the basis of FAO-UNESCO soil map analysis. Tropicultura 1992, 10, 61–63. [Google Scholar]
  40. Yerima, B.P.K.; Van Ranst, E. Major Soil Classification Systems Used in the Tropics: Soils of Cameroon; Trafford Publishing: Victoria, BC, Canada, 2005; p. 315. [Google Scholar]
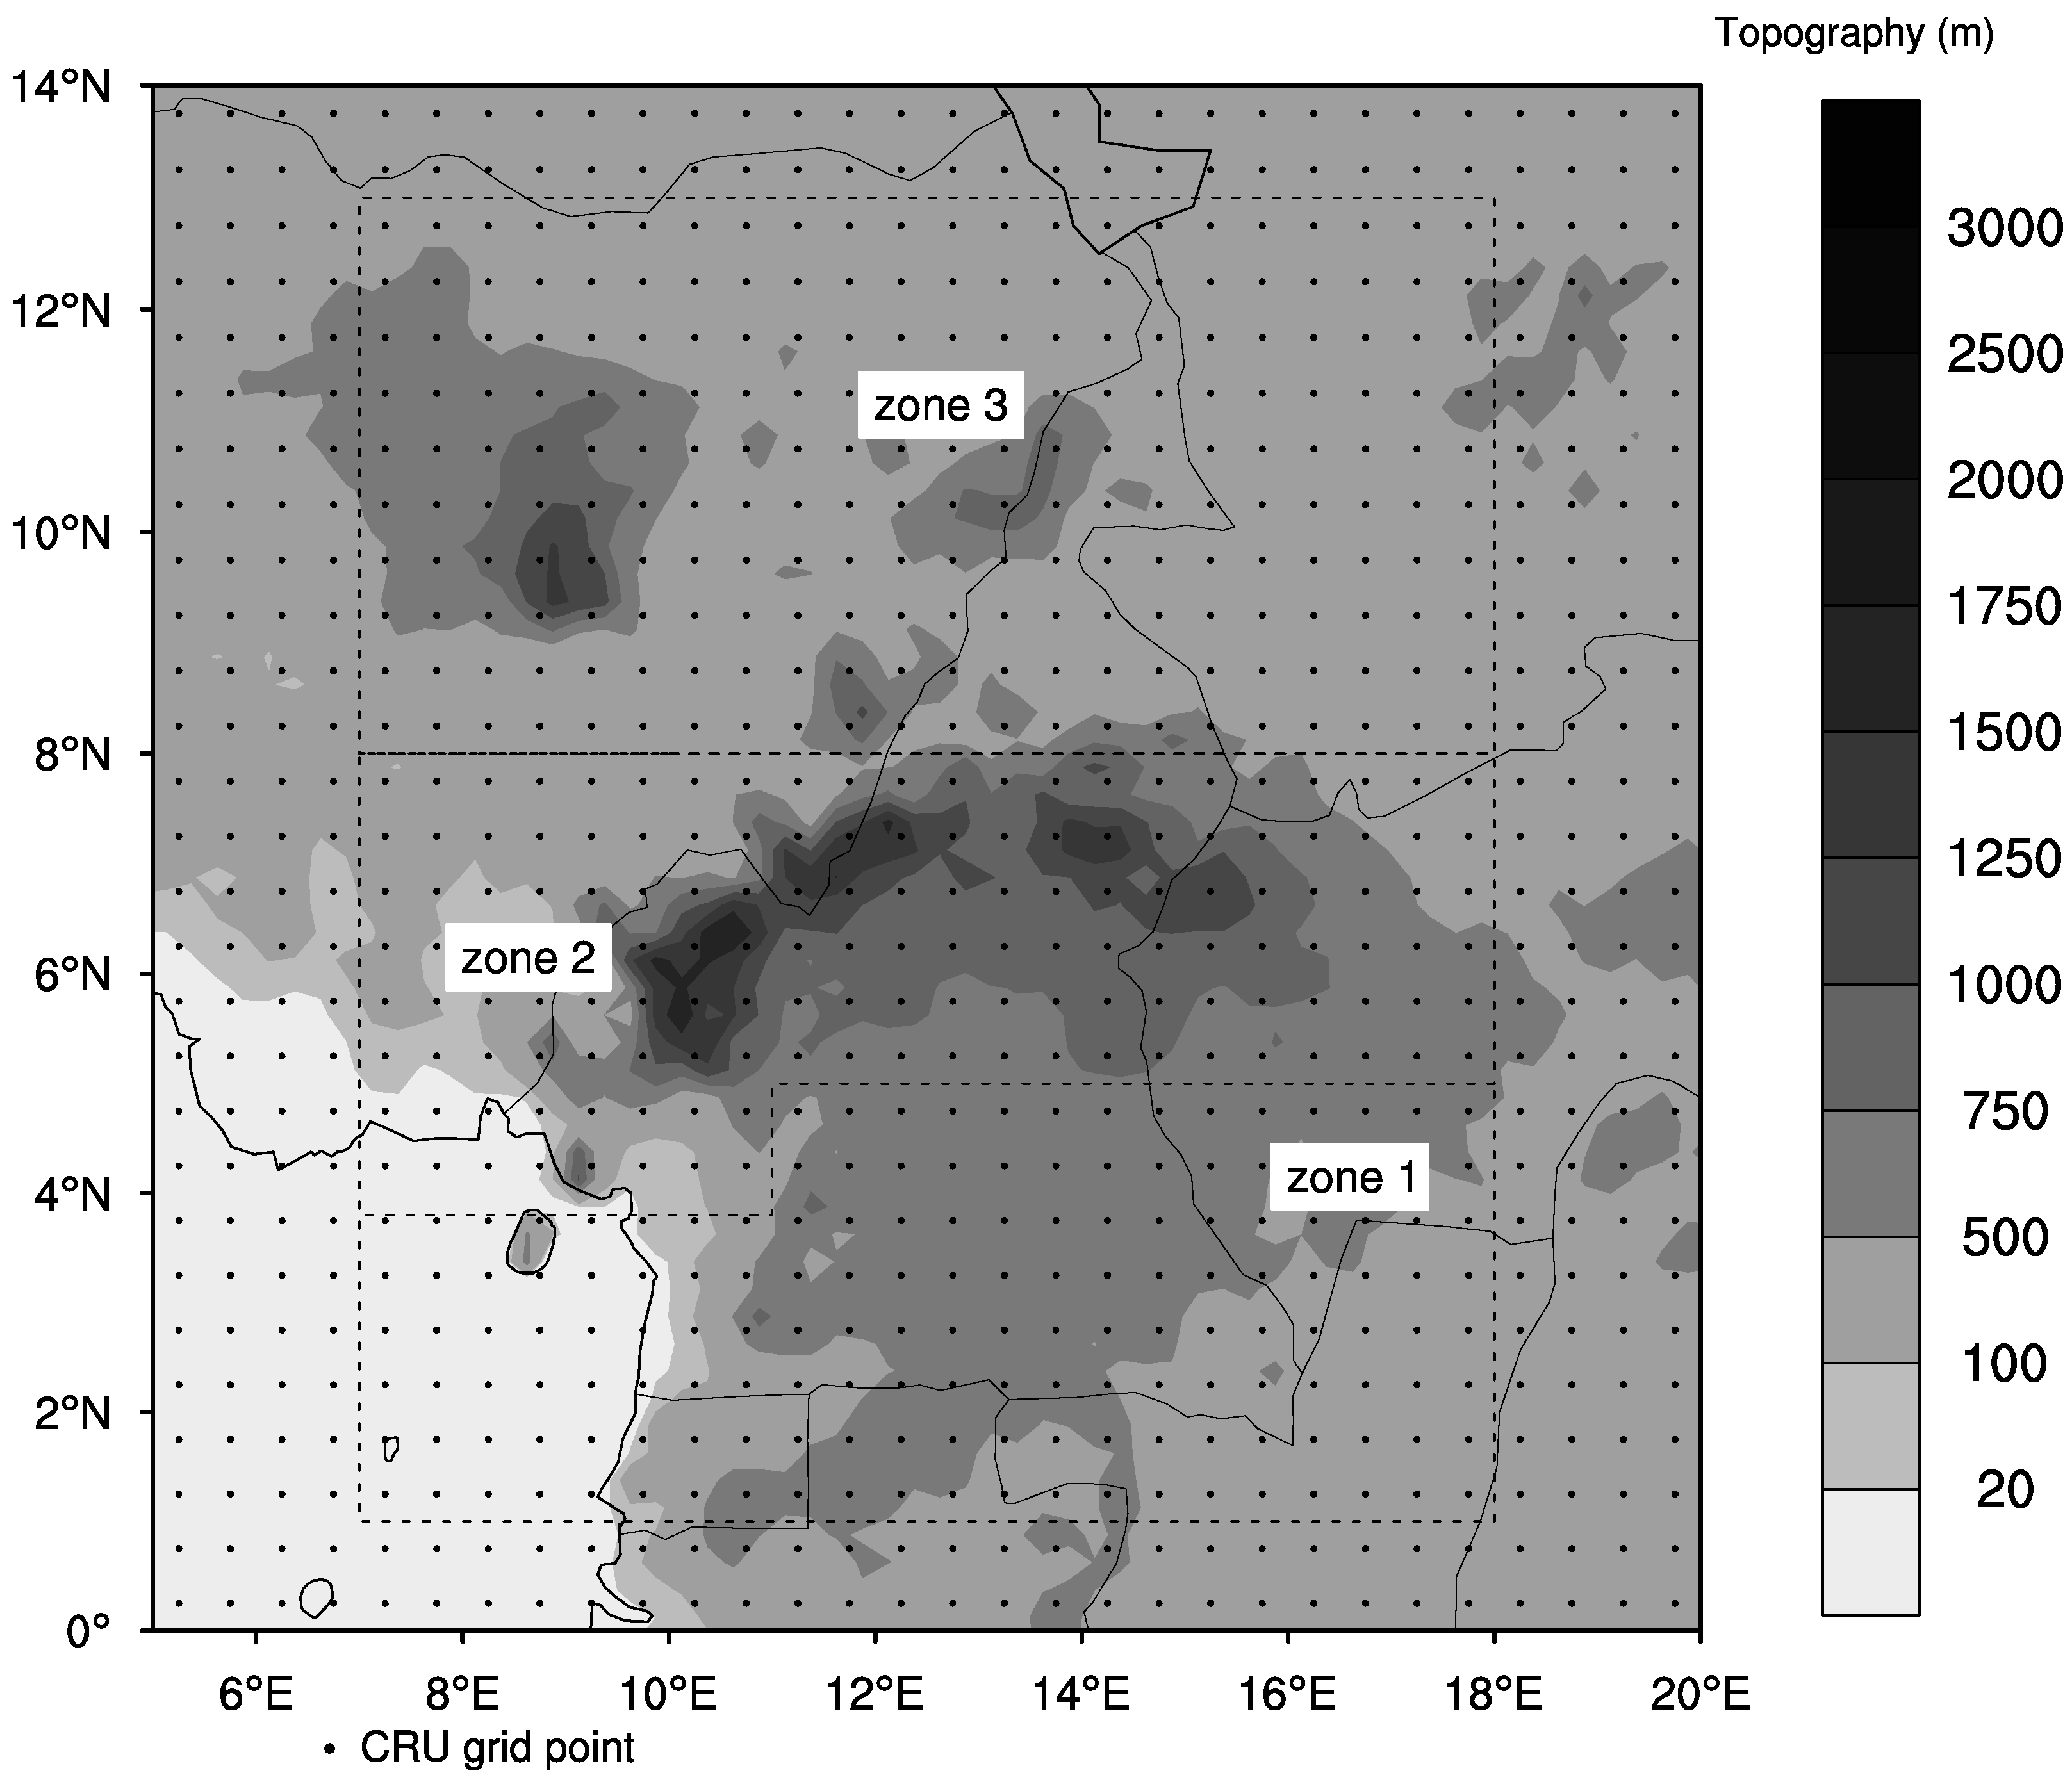
Figure 1. Study area with CRU grid points. The topography is shaded, and the area is divided into three climatic zones as classified by Guenang and Mkankam [30].
Hydrology 03 00036 g001
Figure 2. Illustration of the interpolation method used to deduce onset and retreat dates of the rainy season applying the TWSC method.
Hydrology 03 00036 g002
Figure 3. Annual cycles of mean monthly PR and PET (expressed in mm·month 1 ) for the period 1962–1993: (a) for the Equatorial forest zone named Zone 1 (south of study area); (b) for the transition zone between the Equatorial forest zone and the Sahel zone named Zone 2; and (c) for the Sahelian zone named Zone 3 (north of study area). For each zone, there are two gray vertical dashed lines representing the mean onset and retreat month of the rainy season [30]. These months are absolutes and correspond to those containing onset and retreat dates in terms of pentads and their variabilities (not more than six pentads for the highest range). PET are from the Thornthwaite and Penman–Monteith methods. The labels on the x-axis (J, F, ..., D) indicate the months of the year (January, February, ..., December) respectively.
Hydrology 03 00036 g003
Figure 4. Annual cycles of mean monthly TWSC T H and TWSC P M (expressed in mm·month 1 ) for the period 1962–1993: (a) for the Equatorial forest zone named Zone 1 (south of study area); (b) for the transition zone between the Equatorial forest zone and the Sahel zone named Zone 2; and (c) for the Sahelian zone named Zone 3 (north of study area). For each zone, there are two gray vertical dashed lines representing the mean onset and retreat month of the rainy season [30]. These months are absolutes and correspond to those containing onset and retreat dates in terms of pentads and their variabilities (not more than six pentads for the highest range). The labels on the x-axis (J, F, ..., D) indicate the months of the year (January, February, ..., December) respectively. r indicates the Spearman rank order correlation coefficient between TWSC T H and TWSC P M .
Hydrology 03 00036 g004
Figure 5. Annual cycles of average, minimum and maximum temperatures (T m e a n , T m i n and T m a x respectively, expressed in C) for the period 1962–1993: (a) for the Equatorial forest zone named Zone 1 (south of study area); (b) for the transition zone between the Equatorial forest zone and the Sahel zone named Zone 2; and (c) for the Sahelian zone named Zone 3 (north of study area). For each zone, there are two gray vertical dashed lines representing the mean onset and retreat month of the rainy season [30]. These months are absolutes and correspond to those containing onset and retreat dates in terms of pentads and their variabilities (not more than six pentads for the highest range). The labels on the x-axis (J, F, ..., D) indicate the months of the year (January, February, ..., December) respectively.
Hydrology 03 00036 g005
Figure 6. Onset and retreat dates of the rainy season for an individual year and using the TWSC method. TWSC T H and TWSC P M were considered for the three defined zones: (a) for the Equatorial forest zone named Zone 1 (south of study area); (b) for the transition zone between the Equatorial forest zone and the Sahel zone named Zone 2; and (c) for the Sahelian zone named Zone 3 (north of study area). The labels on the y-axis (J, F, ..., D) indicate the months of the year (January, February, ..., December) respectively. For each zone, there are two horizontal dashed lines representing the mean onset and retreat month of the rainy season [30] and labeled by one and two stars, respectively. These reference months are absolutes and correspond to those containing onset and retreat dates in terms of pentads and their variabilities (not more than six pentads for the highest range).
Hydrology 03 00036 g006
Figure 7. Box-plots showing annual cycles of TWSC T H and TWSC P M (expressed in mm·month 1 ) for the period 1962–1993: (a) for the Equatorial forest zone named Zone 1 (south of study area); (b) for the transition zone between the Equatorial forest zone and the Sahel zone named Zone 2; and (c) for the Sahelian zone named Zone 3 (north of study area). The labels on the x-axis (J, F, ..., D) indicate the months of the year (January, February, ..., December) respectively. The months marked by one and two stars indicate the onset and retreat months of the rainy season, respectively. The parameters used to build a box are: mean TWSC (mid-value of box), mean + standard deviation (top value of box), mean − standard deviation (bottom value of box) and minimum and maximum TWSC (bottom and top values, respectively).
Hydrology 03 00036 g007
Figure 8. Time series of mean monthly TWSC (expressed in mm·month 1 ), calculated using PET obtained from the Thornthwaite and Penman–Monteith methods: (a) for the Equatorial forest zone named Zone 1 (south of study area); (b) for the transition zone between the Equatorial forest zone and the Sahel zone named Zone 2; and (c) for the Sahelian zone named Zone 3 (north of study area). The regression lines are shaded and trend coefficients indicated by b1 and b2 for TWSC T H and TWSC P M , respectively.
Hydrology 03 00036 g008
Figure 9. Time series of mean monthly PR, PET T H and PET P M per zone (expressed in mm·month 1 ): (a) for the Equatorial forest zone named Zone 1 (south of study area); (b) for the transition zone between the Equatorial forest zone and the Sahel zone named Zone 2; and (c) for the Sahelian zone named Zone 3 (north of study area). The regression lines are shaded and trend coefficients indicated by b0, b1 and b2 for PR, PET T H and PET P M , respectively.
Hydrology 03 00036 g009
Figure 10. Time series of mean TWSC (expressed in mm·month 1 ) for each month (al) of the year and for each zone, calculated using PET obtained from the Thornthwaite and Penman–Monteith methods: for the Equatorial forest zone named Zone 1 (south of study area); for the transition zone between the Equatorial forest zone and the Sahel zone named Zone 2; and for the Sahelian zone named Zone 3 (north of study area). The trend coefficients are indicated by b1 and b2 for TWSC T H and TWSC P M , respectively.
Hydrology 03 00036 g010
Table 1. Aridity index calculated for each zone of the area and from PET using the Thornthwaite and Penman–Monteith mathematical formulas.
ZoneAridity IndexClassification
PR/PET TH PR/PET PM
11.319191.65474humid
21.236781.35346humid
30.4603940.466259semiarid
Table 2. Errors on the estimated onset and retreat month of the rainy season using the TWSC method.
ZoneError on Onset MonthError on Retreat Month
Using TWSC T H Using TWSC P M Using TWSC T H Using TWSC P M
1<1 month<1 month<1 month<1 month
2≃0≃0<1 month<1 month
3>1 month>1 month≃0≃0
Table 3. Total water storage change (TWSC) from PET calculated using the Thornthwaite and Penman–Monteith formulas. Positive and negative values indicate the availability and deficit of rainwater in the area, respectively. Standard deviations are added to each value.
TWSC PM = PR PET PM (mm·month 1 ) TWSC TH = PR PET TH (mm·month 1 )
MonthZone 1Zone 2Zone 3Zone 1Zone 2Zone 3
January−41.58 ± 26−111.50 ± 9−158.70 ± 6−60.35 ± 25−100.75 ± 10−89.64 ± 15
February−30.87 ± 28−112.48 ± 19−187.16 ± 6−42.96 ± 30−109.13 ± 21−131.84 ± 18
March54.64 ± 36−43.86 ± 39−173.40 ± 822.09 ± 38−75.70 ± 38−209.44 ± 20
April70.64 ± 287.04 ± 36−157.61 ± 2249.83 ± 29−13.58 ± 39−219.38 ± 34
May109.14 ± 2774.89 ± 30−89.66 ± 3179.96 ± 2755.68 ± 31−152.44 ± 38
June61.62 ± 23117.18 ± 24−29.51 ± 2837.37 ± 24103.16 ± 26−57.72 ± 36
July32.27 ± 22184.49 ± 3373.62 ± 3511.04 ± 22168.61 ± 3456.57 ± 41
August69.59 ± 29208.63 ± 33123.69 ± 4148.53 ± 28192.96 ± 31110.37 ± 47
September149.33 ± 33199.08 ± 3330.12 ± 37129.75 ± 34188.44 ± 3519.39 ± 42
October187.38 ± 4795.50 ± 60−100.62 ± 31164.19 ± 4780.80 ± 60−114.47 ± 30
November70.00 ± 32−64.20 ± 30−155.51 ± 448.91 ± 30−64.61 ± 28−119.79 ± 15
December−27.18 ± 23−105.48 ± 10−153.47 ± 5−45.65 ± 22−95.01 ± 9−94.47 ± 13
Table 4. Difference between T W S C P M and T W S C T H .
TWSC PM TWSC TH (mm·month 1 )
MonthZone 1Zone 2Zone 3
January18.77 ± 7−10.74 ± 10−69.07 ± 12
February12.09 ± 5−3.35 ± 7−55.32 ± 14
March32.55 ± 631.83 ± 736.04 ± 21
April20.81 ± 620.61 ± 861.77 ± 23
May29.18 ±519.20 ± 462.77 ± 17
June24.26 ± 414.01 ± 428.21 ± 12
July21.24 ± 315.88 ± 317.05 ± 9
August21.06 ± 415.66 ± 513.31 ± 9
September19.58 ± 310.64 ± 410.73 ± 8
October23.19 ± 414.70 ± 413.85 ± 9
November21.09 ± 50.41 ± 8−35.72 ± 14
December18.47 ± 6−10.47 ± 8−58.99 ± 10