Article

Non-Stationary Flood Frequency Analysis in the Ouémé River Basin, Benin Republic

1
West Africa Science Service Centre on Climate change and Adapted Land Use, University of Abomey-Calavi, Abomey-Calavi BP 2008, Benin
2
Laboratory of Applied Hydrology, University of Abomey-Calavi, Abomey-Calavi, 01 BP 4521 Cotonou, Benin
3
Department of Geography, University of Bonn, Meckenheimer Allee 166, Bonn 53115, Germany
*
Author to whom correspondence should be addressed.
Hydrology 2015, 2(4), 210-229; https://doi.org/10.3390/hydrology2040210
Submission received: 31 August 2015 / Revised: 13 October 2015 / Accepted: 26 October 2015 / Published: 2 November 2015

Abstract

:
A statistical model to predict the probability and magnitude of floods in non-stationary conditions is presented. The model uses a time-dependent and/or covariate-dependent generalized extreme value (GEV) distribution to fit the annual maximal (AM) discharge, and it is applied to five gauging stations in the Ouémé River Basin in Benin Republic, West Africa. Different combinations of the model parameters, which vary with respect to time and/or climate covariates, were explored with the stationary model based on three criteria of goodness of fit. The non-stationary model more adequately explains a substantial amount of variation in the data. The GEV-1 model, which incorporates a linear trend in its location parameter, surpasses the other models. Non-stationary return levels for different return periods have been proposed for the study area. This case study tested the hypothesis of stationarity in estimating flood events in the basin and it demonstrated the strong need to account for changes over time when performing flood frequency analyses.

1. Introduction

Recently, many countries in West Africa have suffered from catastrophic floods (Burkina Faso, Senegal, Togo, Benin, Cote d’Ivoire, and Niger). These floods affected thousands of people through property damage and fatalities [1]. From population perception, floods have become increasingly frequent, and it is unknown whether they are caused by an increasing frequency in heavy rainfall, consequent change in discharge magnitude, or changes in land use. These devastating floods call for improvement in hydrological forecasts to reduce the vulnerability of local communities [2].
Di Baldassarre et al. examined the recent flooding events over Africa and concluded that most of the recent deadly floods have occurred where the population has been increasing [3]. They note that while the total population has increased by a factor of 4, the urban population has increased by one order of magnitude; approximately the same magnitude as the increase in fatalities caused by floods. In fact, the intensive and unplanned urbanization and populations living in floodplains that are unwilling to relocate have increased flood vulnerability. The government’s failure to provide appropriate maintenance for public infrastructure, such as highways, secondary roads, and bridges, can contribute to flood vulnerability [4]. An analysis of the Ivory Coast [5] reveals that the recrudescence of the inundation over the last three recent decades is due to nonexistent land use planning and unregulated urbanization. Similar conclusions were attained regarding the 2012 inundation in Niamey, the capital of the Niger Republic [6], and in Lusaka, the capital of Zambia [7], where the flood risk has strongly increased because of the fast growth of the city in a flood-prone area.
Within the context of global warming, more intense and frequent heavy rainfall events are expected at the global scale as a result of enhanced water vapor in the atmosphere [8]. Therefore, traditional statistical tools for flood risk assessments and infrastructure designs that are based on stationary heavy rainfalls series are inadequate; these tools should be adapted to climate projections and trends [9]. A stationary series is relatively easy to forecast: one simply predicts that statistical properties will be the same in the future as they were in the past [10]. However, these authors highlight that anthropogenic climate change and a better understanding of decadal and multi-decadal climate variability challenge the validity of this assumption. There is a need to update stationary risk assessment models for more robust and resilient predictions. For more than a decade, non-stationary distributions have been used to overcome these issues and provide accurate results. Non-stationary extreme value distributions are a powerful and useful tool for characterizing extremes in a changing climate [11]. If the rate of climate change increases, as is expected in the future, the need for such approaches will increase, and accurate information on the changing risk of extremes must be provided.
Through comparative studies, many researchers [9,12,13,14] show that non-stationary models are more suitable for the data than classical stationary models based on the deviance test. In another catchment situated in the same climate conditions, Tramblay et al. [15] show that the non-stationary distribution surpasses the stationary distribution. Some authors [16,17] focus on flood frequency analysis (FFA) in the Ouémé catchment, but non-stationarity was not considered in their analyses. Based on current knowledge, it is essential to account for non-stationarity when studying flood frequency.
To account for the non-stationarity in the GEV model, different expressions of the parameters have been proposed and analyzed in the literature [14,18,19,20,21,22,23,24,25,26,27]. Mostly, the shape parameter is assumed to be constant (see, for instance, [12,13,18]), while the location and shape parameters are assumed to be time- or covariant-dependent (the covariant also depends on time). Different expressions of the location parameter have been proposed in the literature, such as linear, quadratic, and exponential functions, sine wave functions of time, and covariates. As far as the scale parameter is concerned, few expressions are used in the literature. This is mainly because this parameter must be positive; to preserve the value, the exponential function is widely used [12,13,20,28,29].
A comparison of these models based on statistical tests of the standard deviation show that the quadratic form of the location parameter more appropriately represents the standard deviation in the annual maximal rainfall [23]. In contrast, at 5% of the significance level and based on the deviance statistical test, it was found that the linear function in the location parameter more accurately represents the dependency between the annual maximal precipitation and the covariant SOI (Southern Oscillation Index) than the quadratic form or the constant location parameter [13]. Brown et al. used a location parameter that depends on time, covariates, or both when investigating stationary and non-stationary extreme value distributions fitted to observations of daily maximum and minimum temperatures to determine whether such extreme daily temperatures have changed since 1950 [11]. They found that the introduction of a trend covariate does not have a significant effect on the magnitude of the NAO (North Atlantic Oscillation) coefficient. Accounting for the diversity of the results obtained by these authors, we propose several model parameter combinations to cover the possible variance in the data.
An important research question is whether non-stationary probabilistic models can be suitably used while assessing extreme events in a changing climate. The objective of this research is to improve modeling tools for flood events in the context of climate change and to investigate possible changes in extreme discharges, which may explain the recent flooding events observed in the basin.

2. Materials and Methods

2.1. Study Area and Data
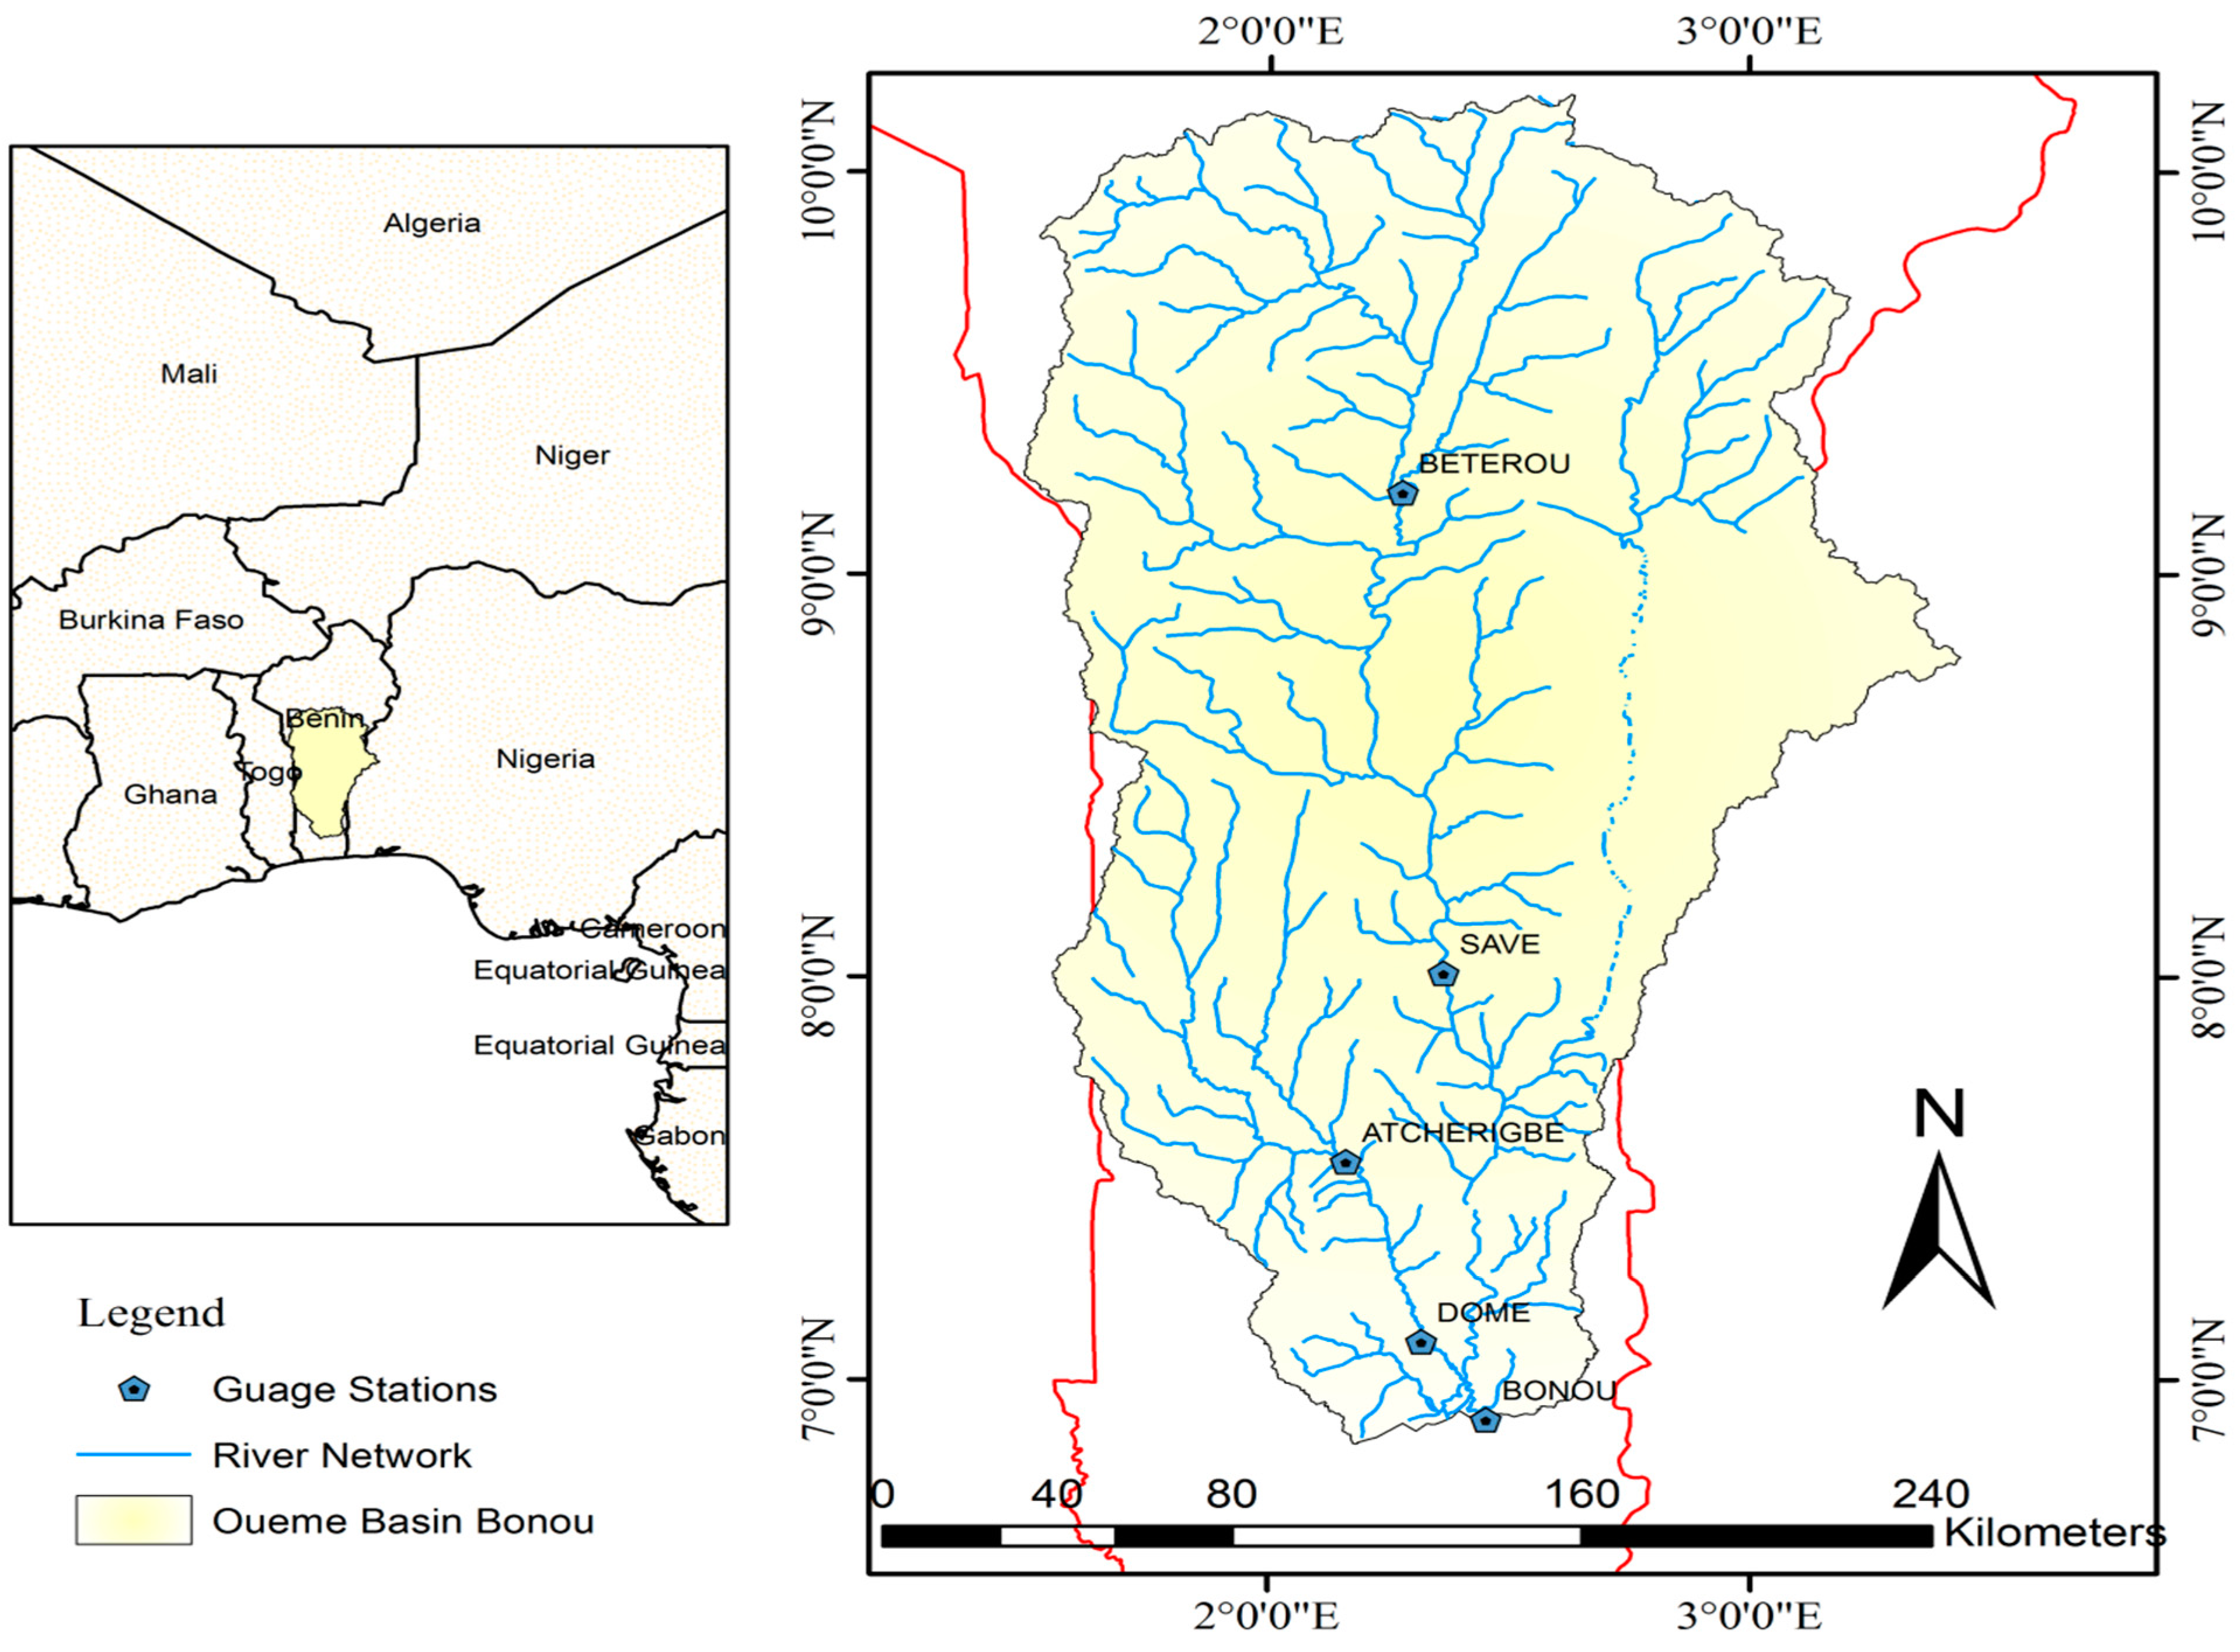
Benin is located in the inter-tropical zone (between 06°10ʹN and 12°25ʹN), and has a wet and dry tropical climate. Depending on the latitude and the distance from the Atlantic Ocean, the degree of aridity increases from south to north and, to a lesser extent, from west to east [30].
The Ouémé Basin, which is approximately 49,256 km2 (at the Bonou gauging station, see Figure 1) and 500 km in length, has a tropical climate that can be subdivided into three climatic zones according to the different rainfall regimes [31]: (1) the unimodal rainfall regime in North Ouémé comprising two seasons, i.e., the rainy season from May to October, and the dry and hot season; (2) the bimodal rainfall regime in South Ouémé comprising two wet seasons, i.e., a long season between March and July and a short season between September and mid-November, and a long dry season between November and March; and (3) the transitional rainfall regime in Central Ouémé comprising a rainy season between March and October, with or without a short dry season in August. The rain mostly originates from the Guinean Coast. The average annual precipitation varies between 960 mm in the north and 1340 mm in the south. Thus, the rainfall decreases northward and results in a strong natural vegetation gradient.
The Ouémé Basin flows southward, where it is joined by its main effluents, the Okpara on the left bank and the Zou on the right (Figure 1). Rainfall-runoff variability is high in this basin and leads to runoff coefficients that vary from 0.10 to 0.26 (of the total annual rainfall), with the lowest values in the savannahs and forest landscapes [32]. For all studied sub-catchments, the highest runoff coefficients were obtained in the years with the highest annual rainfall.
The data used in this part of the work are from the National Water Directorate (Direction Générale de l’Eau, DGEau). Twenty river gauges are available from the national observatory network in the Ouémé catchment (including the French Institute for Research and Development (IRD) river gauges). Five of the gauges that have at least 50 years of records and minimal missing data (particularly in the high discharge period) are considered in this study. In this study, discharge data for the period 1952–2009 are used.
Figure 1. Ouémé River Basin and the five gauging stations.
Hydrology 02 00210 g001

2.2. Preliminary Analysis

As a first approach to study trends in extreme discharges during the study period 1952–2009, the Mann–Kendall and Spearman’s rho trend tests were applied. A trend is considered to be present if it has been detected by both tests. The results show that at the 10% significance level, the annual maximum flood series of Bonou station (the main outlet of the basin) exhibited a statistically significant trend, while the other stations did not have any statistically significant trend when we considered the entire study period. Similar results were obtained by Robson et al., where any trend in the annual peak flow was not detected for a dataset of the UK [33]. Similarly, no site in Canada was found with upward trends (but they did detect some downward trends) in the annual peak flow or high quantiles of daily mean flow [12]. Likewise, no statistically significant trend was observed in the annual maximal series of the Yangtze River at the Yichang hydrological station [34]. In the work performed by Amoussou et al. on a basin with almost the same climatic conditions, no trend was found in annual maximal discharge over the period of 1988–2010, which is in accordance with our findings [2].
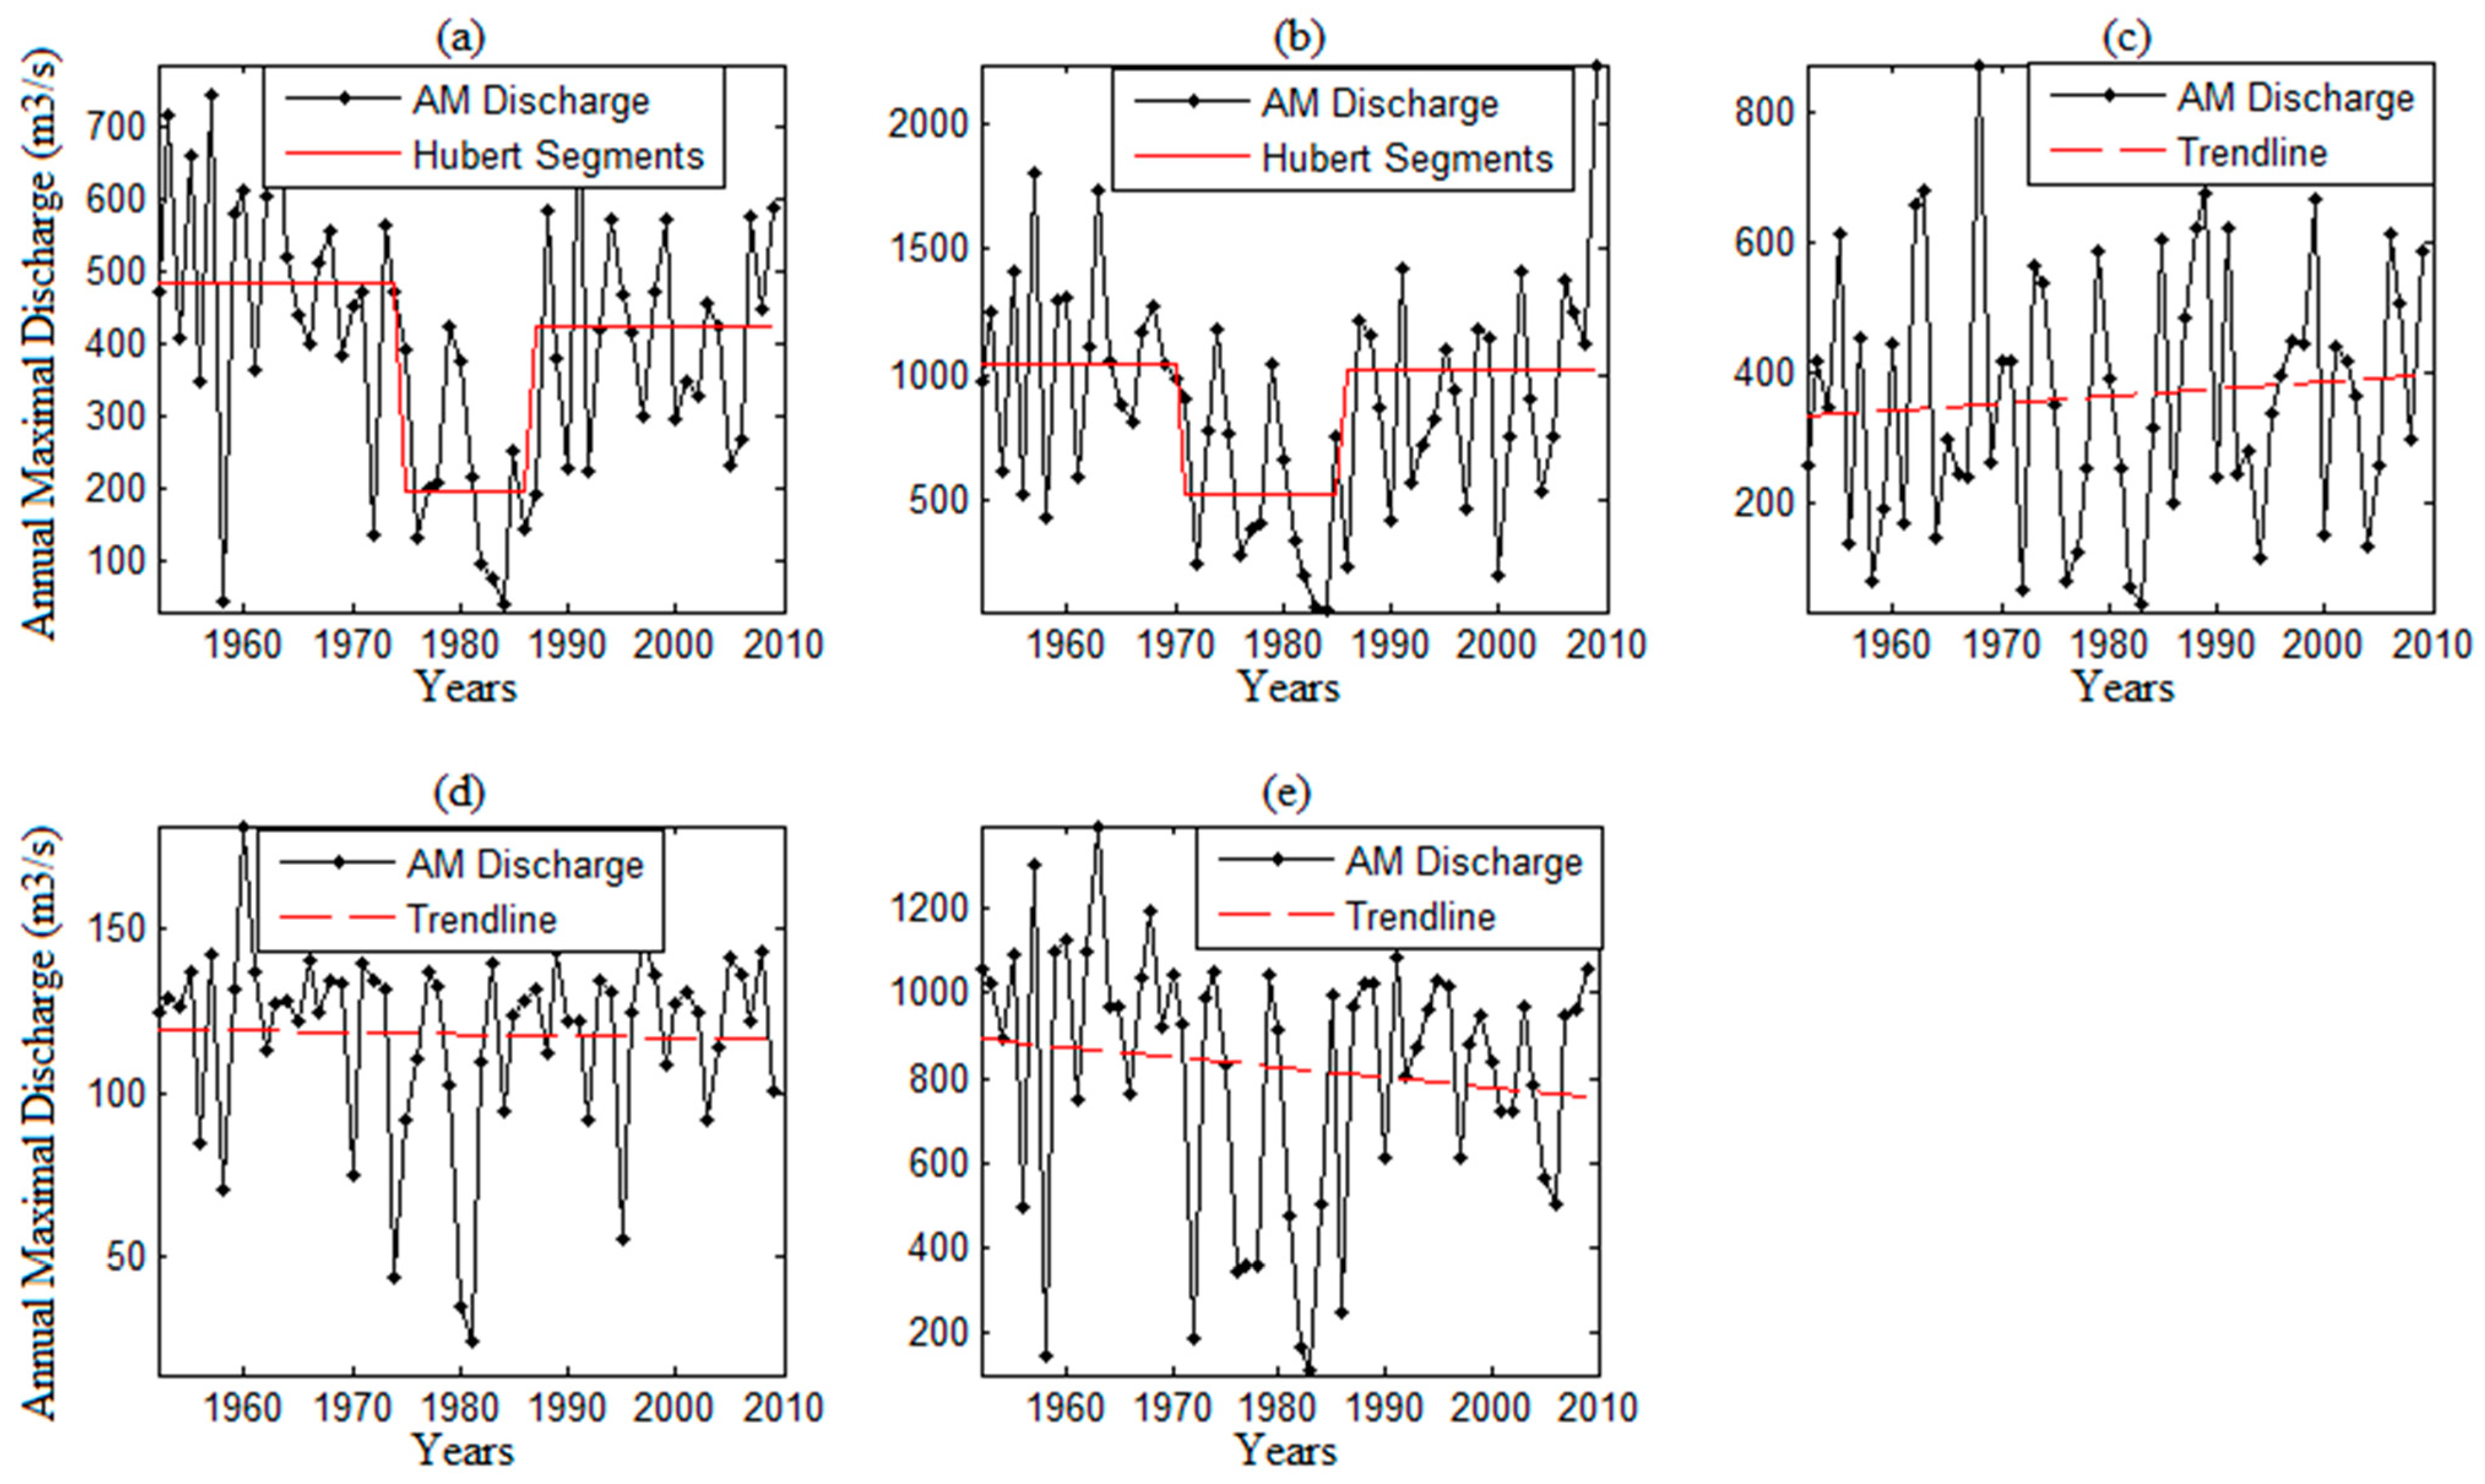
Figure 2. Plot of the annual maximal discharge and the corresponding linear trend line or Hubert segments at each station: (a) Bétérou; (b) Savè; (c) Atchérigbé; (d) Domè; (e) Bonou.
Hydrology 02 00210 g002
Another approach was to assess change points. The breakpoint analysis in the annual maximal discharge using the non-parametric Pettitt test [35] shows that there is a break point at 1974 in the data for Bétérou and Bonou, but there is no clear pattern for the other gauging stations. Considering the segmentation test of Hubert [36], which verifies whether differences in averages and standard deviations among periods are significant, we found change points in the data of Bétérou and Savè in somewhat similar periods (Figure 2a,b). The three sub-periods found by the Hubert segmentation for the Bétérou and Savè gauge stations are in accordance with the three rainfall periods in West Africa [37,38]: the wet period (up to 1970), the dry period 1971–1989, and the recovery period (1990 to present), assuming that land use is not the main driver of the discharge. Similar results were obtained in the Beninese part of the Niger Basin [38]. In fact, the Bétérou and Savè gauging stations are the closest to the Niger Basin and share nearly the same climatic pattern. The important runoff deficit during the period of 1971–1989 corresponds to the drought period in West Africa. There are many different ways in which changes in hydrological series can take place [39]: a change may occur abruptly (Bétérou and Savè, Figure 2a,b) or gradually (Bonou, Figure 2e), or may take more complex forms. The most widely used tests for changes look for one of the following: trend in the mean or median of a series; or step-change in the mean or median of a series. The existence of abrupt changes or trends is a valid hypothesis for introducing non-stationarity into the estimation [18].

2.3. Climate Indexes

Floods are influenced by the climate, and the connection between annual maximum floods and leading indicators of the current climate can be identified [40]. Previous studies have applied the generalized extreme value (GEV) distribution, among other methods, to analyze extreme stream flow [12,41,42], and the results suggest that parameters of the GEV distribution can be a function of covariates, such as climate indexes and time. In this study, the correlation between different sets of climate indexes and AM discharge were explored to evaluate the strength of the relationship between the two variables and to study the conditional distribution of the annual maximal discharge as a function of climate indexes. Among other regions, the Gulf of Guinea (GG) climate indexes––sea surface temperature (SST) and sea level pressure (SLP) [43]––were found to be significantly well correlated at the 5% level with the observed data (Table 1). In fact, there is a well-known teleconnection between the GG climate conditions and the West Africa monsoon dynamics (and the associated precipitation) [44]. Positive SST (SLP) anomalies in the eastern equatorial Atlantic are accompanied by a southward shift of the inter-tropical convergence zone, along with positive (negative) rainfall anomalies in the Guinean region. This is consistent with the results previously obtained [45,46] for West African monsoon dynamics and eastern equatorial Atlantic SST anomalies.
Table 1. Correlation (significant at the 5% level) between Ouémé River annual maximum discharge series and climate indexes. The longitude and latitude are given for the SST (sea surface temperature) and SLP (sea level pressure) grid cell.
StationsBonouBétérouSavèAtchérigbéDomè
SST or SLPSLPSLPSLPSSTSST
PeriodAnnual AverageAnnual AverageAugustJulyAugust
Longitude357°357°357°351°
Latitude−4°−4°−4°−4°
Correlation coefficient−0.6−0.6−0.50.6−0.3

2.4. Method for Modeling Extreme Stream Flows

The generalized extreme value (GEV) distribution is a flexible three-parameter model that combines the Gumbel, Fréchet, and Weibull extreme value distributions. Its cumulative distribution function is Equation (1):
f ( x ) = { exp ( ( 1 + κ x μ σ ) 1 κ )   κ 0   exp ( exp ( 1 x μ σ ) )   κ = 0
where μ, σ and κ are location, scale and shape parameters, respectively. The location parameter μ indicates where the distribution is centered; the scale parameter σ ≠ 0 indicates the spread of the distribution; and the shape parameter κ indicates the behavior of the distribution’s upper tail [47]. Distributions associated with κ < 0 are called Fréchet, and they include well-known long-tailed distributions, such as the Pareto, Cauchy, Student-t, and mixture distributions. If κ = 0, the GEV distribution is the Gumbel class and includes the normal, exponential, gamma, and lognormal distributions where the lognormal distribution has a moderately heavy tail [48]. Finally, in the case where κ > 0, the distribution class is Weibull. These are short-tailed distributions with finite lower bounds and include distributions such as uniform and beta distributions. To estimate a design value (or return level), the quantile function f−1(1−p) with 0 < p < 1 can be expressed as [47]:
f 1 ( 1 p ) = { μ + ( σ κ ) { [ ln ( 1 p ) ] κ 1 } ;   κ 0   μ + σ { l n [ ln ( 1 p ) ]   } ;   κ = 0 .
If the shape parameter κ > 0, then the GEV distribution is said to be heavy tailed [12]. Because its probability density function decreases at a slow rate in the upper tail, moments of the GEV are infinite for orders greater than 1/κ (e.g., the variance is infinite if κ > 1/2; and the mean is infinite if κ > 1). If κ < 0, then the distribution has a bounded upper tail. The case of κ = 0 (Equation (2)), obtained by taking the limit of the general expression as κ → 0, is called the Gumbel distribution (i.e., an unbounded, thin tail).
Seven GEV models are considered in this study to cover a variety of combinations of model parameters. The shape parameter for all models is constant. Table 2 shows the different GEV models and their parameters. It is interesting that GEV-0 is nested in GEV-1, which is also included in GEV-2. Similarly, the GEV-0 model is nested in GEV-3, which is also included in GEV-4.
Table 2. Different GEV model parameters. Cov (t) represents the covariate, which may be SST (sea surface temperature) or SLP (sea level pressure) (Adapted from [49]).
ModelsLocation ParameterScale ParameterShape Parameter
GEV-0μ = constantσ = constantκ = constant
GEV-1μ(t) = μ0 + μ1*Cov(t)σ = constantκ = constant
GEV-2μ(t) = μ0 + μ1*Cov(t)log(σ) = σ0+ σ1*Cov(t)κ = constant
GEV-3μ(t) = μ0 + μ1*tσ = constantκ = constant
GEV-4μ(t) = μ0 + μ1*tlog(σ) = σ0 + σ1*tκ = constant
GEV-5μ(t) = μ0 + μ1*t + μ2*Cov(t)σ = constantκ = constant
GEV-6μ(t) = μ0 + μ1*Cov(t)log(σ) = σ0+ σ 1*tκ = constant
The parameters were estimated in this study using the Maximum Log-likelihood Estimator (MLE) from R [50] and the Extremes Toolkit [51]. The Nelder-Mead algorithm was used as the optimization method. Three criteria of goodness of fit were chosen to identify the optimum model: the likelihood ratio Test (LRT) [47], the Akaike Information Criterion (AIC) [52], and the Bayesian Information Criteria (BIC) [53].
Additionally, Latin Hypercube sampling [54], which is a statistical method for generating a sample of plausible collections of parameter values from multidimensional distribution, is used to determine the non-stationary return levels from the different parameters ranges of the non-stationary GEV distribution obtained for each station. Five hundred parameter samples were obtained for each fitted GEV distribution and the different return levels corresponding to each sample computed for a given return period. Since the return level is a function of the year, an ensemble of 500 × 58 years = 29,000 realizations obtained for each return period. The uncertainty bounds of the computed return level is derived based on 0.05 and 0.95 posterior probability intervals of the ensemble [55]. In this study, the 50th percentile is considered as high risk, the 75th percentile (high quartile) is medium risk and the 95th percentile is low risk. If the return level computed for a given return period is underestimated (for instance the 50th percentile), higher will be the risk (the likeliness of getting flooded) associated to that estimation. This is why the 95th percentile is associated with a low risk meaning lesser chance (low probability) for the infrastructure designed to be underestimated.

3. Results and Discussions

The synthesis of the non-stationary model performances compared to the stationary case is given in Table 3. The models are ranked according to the goodness of fit and “ns” (non-significant) is used to note that the model did not show significant and strong improvement compared to GEV-0 (the stationary model). This classification is performed for models that have p-values less than or equal to 0.01 (1% significance level). The rank “1” is given to the model with the smallest value of AIC and BIC. According to these criteria, the GEV-1 model, whose location parameter is a linear function of covariates (SST or SLP) and whose other parameters are constant, is the best model for explaining change in the extreme AM streamflow at the different stations. This finding is explained by the high correlation between the annual maximum discharge (AMD) and the climate index.
When incorporating a linear time trend into the location parameter (GEV-3) and/or a linear covariate-dependent trend into the scale parameter (GEV-2), the model performances are not satisfactory; they exhibit the highest values of the AIC and BIC and the p-value is nearly 1. The same conclusion can be drawn for the GEV-4 model.
Table 3. Model ranking; “ns” (non-significant) is used to note that the model did not show significant and strong improvements compared with GEV-0.
ModelGEV-0GEV-1GEV-2GEV-3GEV-4GEV-5GEV-6
Atchérigbéns1nsnsns23
Bétérou31nsnsns2ns
Bonou31nsnsns2ns
Domè21nsnsnsnsns
Savè41nsnsns23
The GEV-5 model, whose location parameter depends on both time and covariates, exhibits an improvement compared with the stationary case. For the different stations, except for Domè, the p-values were small, similar to the results of GEV-1. The second rank given to this model (GEV-5) was due to its number of parameters (five) compared with GEV-1, which has four parameters. The basic principle is parsimony, i.e., obtaining the simplest model that explains as much of the variation in the data as possible. The addition of one or more parameters must be justified in terms of the performance and accuracy in describing variations in the observed data compared with the model with fewer parameters. The model requires a description of the process that generated the data, rather than the actual data; thus, it is necessary to assess the strength of the evidence for the more complex model structures [47]. Therefore, if the evidence is not particularly strong, the simpler model should be chosen.
Table 4 presents the model parameters and values of the performance criteria for all of the stations. The location and scale parameters are high for Savè and Bonou. The scale parameter is a gradient of the extreme discharge, which is a characteristic of the flood risk for a given station. Savè has the highest value of this parameter. An analysis of the shape parameter obtained for all of the models and all of the gauge stations shows that this parameter is negative everywhere, even when considering the uncertainty; thus, the distribution class corresponding to the data is the Fréchet distribution. This parameter varies very slowly from −0.5 (GEV-1 at Bonou) to −0.2 (GEV-1 at Atchérigbé), excluding the case of Domè. A greater absolute value of this parameter corresponds to a greater extreme discharge. This is the case with the Bonou gauge station, which is located at the principal outlet of the Ouémé River Basin. As κ < 0, the distribution has an unbounded upper tail.
Table 4. Parameters of the GEV-1 model and the performance criteria; AIC: Akaike Information Criteria and BIC: Bayesian Information Criteria. Values in bracket are the standard deviation of the corresponding parameter and −ln(L) is the log-likelihood.
StationsModelsLocationScaleShapePerformance Criteria
μ0μ0)μ1μ1)σ0σ0)κκ)ln(L)Deviance Statisticp-valueAICBIC
AtchérigbéGEV-14par.317.7 (22.5)148.0 (28.8)151.2 (16.1)−0.2 (0.1)375.722.13e−06759.5767.7
BétérouGEV-1347.5 (21.2)−270 (49.3)149.6 (14.7)−0.3 (0.1)370.326.3<1e−06748.6756.9
BonouGEV-1749.2 (36.8)−389 (75.7)259.7 (27.0)−0.5 (0.1)398.523.71e−06805.0813.2
DomèGEV-1122.6−24.634.2−1.2260.129.6<1e−06528.2536.5
SavèGEV-1812.4 (57.7)−357 (88.5)374.2 (36.1)−0.2 (0.1)426.817.13.5e−05861.6869.8

3.1. GEV-1 Model

The GEV-1 model presents a linear trend in the covariates of the location parameter while the other parameters remained constant. The likelihood ratio test is a more analytical method of determining the best fit. The GEV-1 model is said to be appropriate to the detriment of GEV-0 for a given station if the p-value is less than or equal to 0.01 and if the deviance statistic is greater than the χ 1 2 distribution, which is 3.8. The deviance statistic D for comparing these models for all stations varies from 17.1 to 26.3 (Table 4), while the 95% quantile of the χ 1 2 distribution is only 3.8. Thus, GEV-0 is rejected at the 0.05 level of significance and GEV-1 is preferred. These values are overpoweringly large, meaning that the model with a location parameter that is linearly related to SST or SLP explains a substantial amount of the variation in the data. Strong evidence supports the use of the GEV-1 model, i.e., the statistic of the p-value varies from nearly 0 to 3.5e–05 (Table 4), versus the null hypothesis that the GEV-0 model is a fit better for the data than GEV-1. Furthermore, the Akaike Information Criteria (AIC), as well as the Bayesian Information Criteria (BIC), applied to all the models produced the lowest values for GEV-1 and confirmed that GEV-1 is the most appropriate model for analyzingflood data in the study area. The SST and SLP in the Gulf of Guinea appear to have a significant teleconnection with the AM discharge, and the use of related climate indexes could help explain the behavior of the extreme discharge. These results are consistent with previous findings [13], where it was stated that the linear function of the location parameter more accurately represents the dependency between the annual maximal precipitation and the SOI covariant than the quadratic form or constant location parameter.
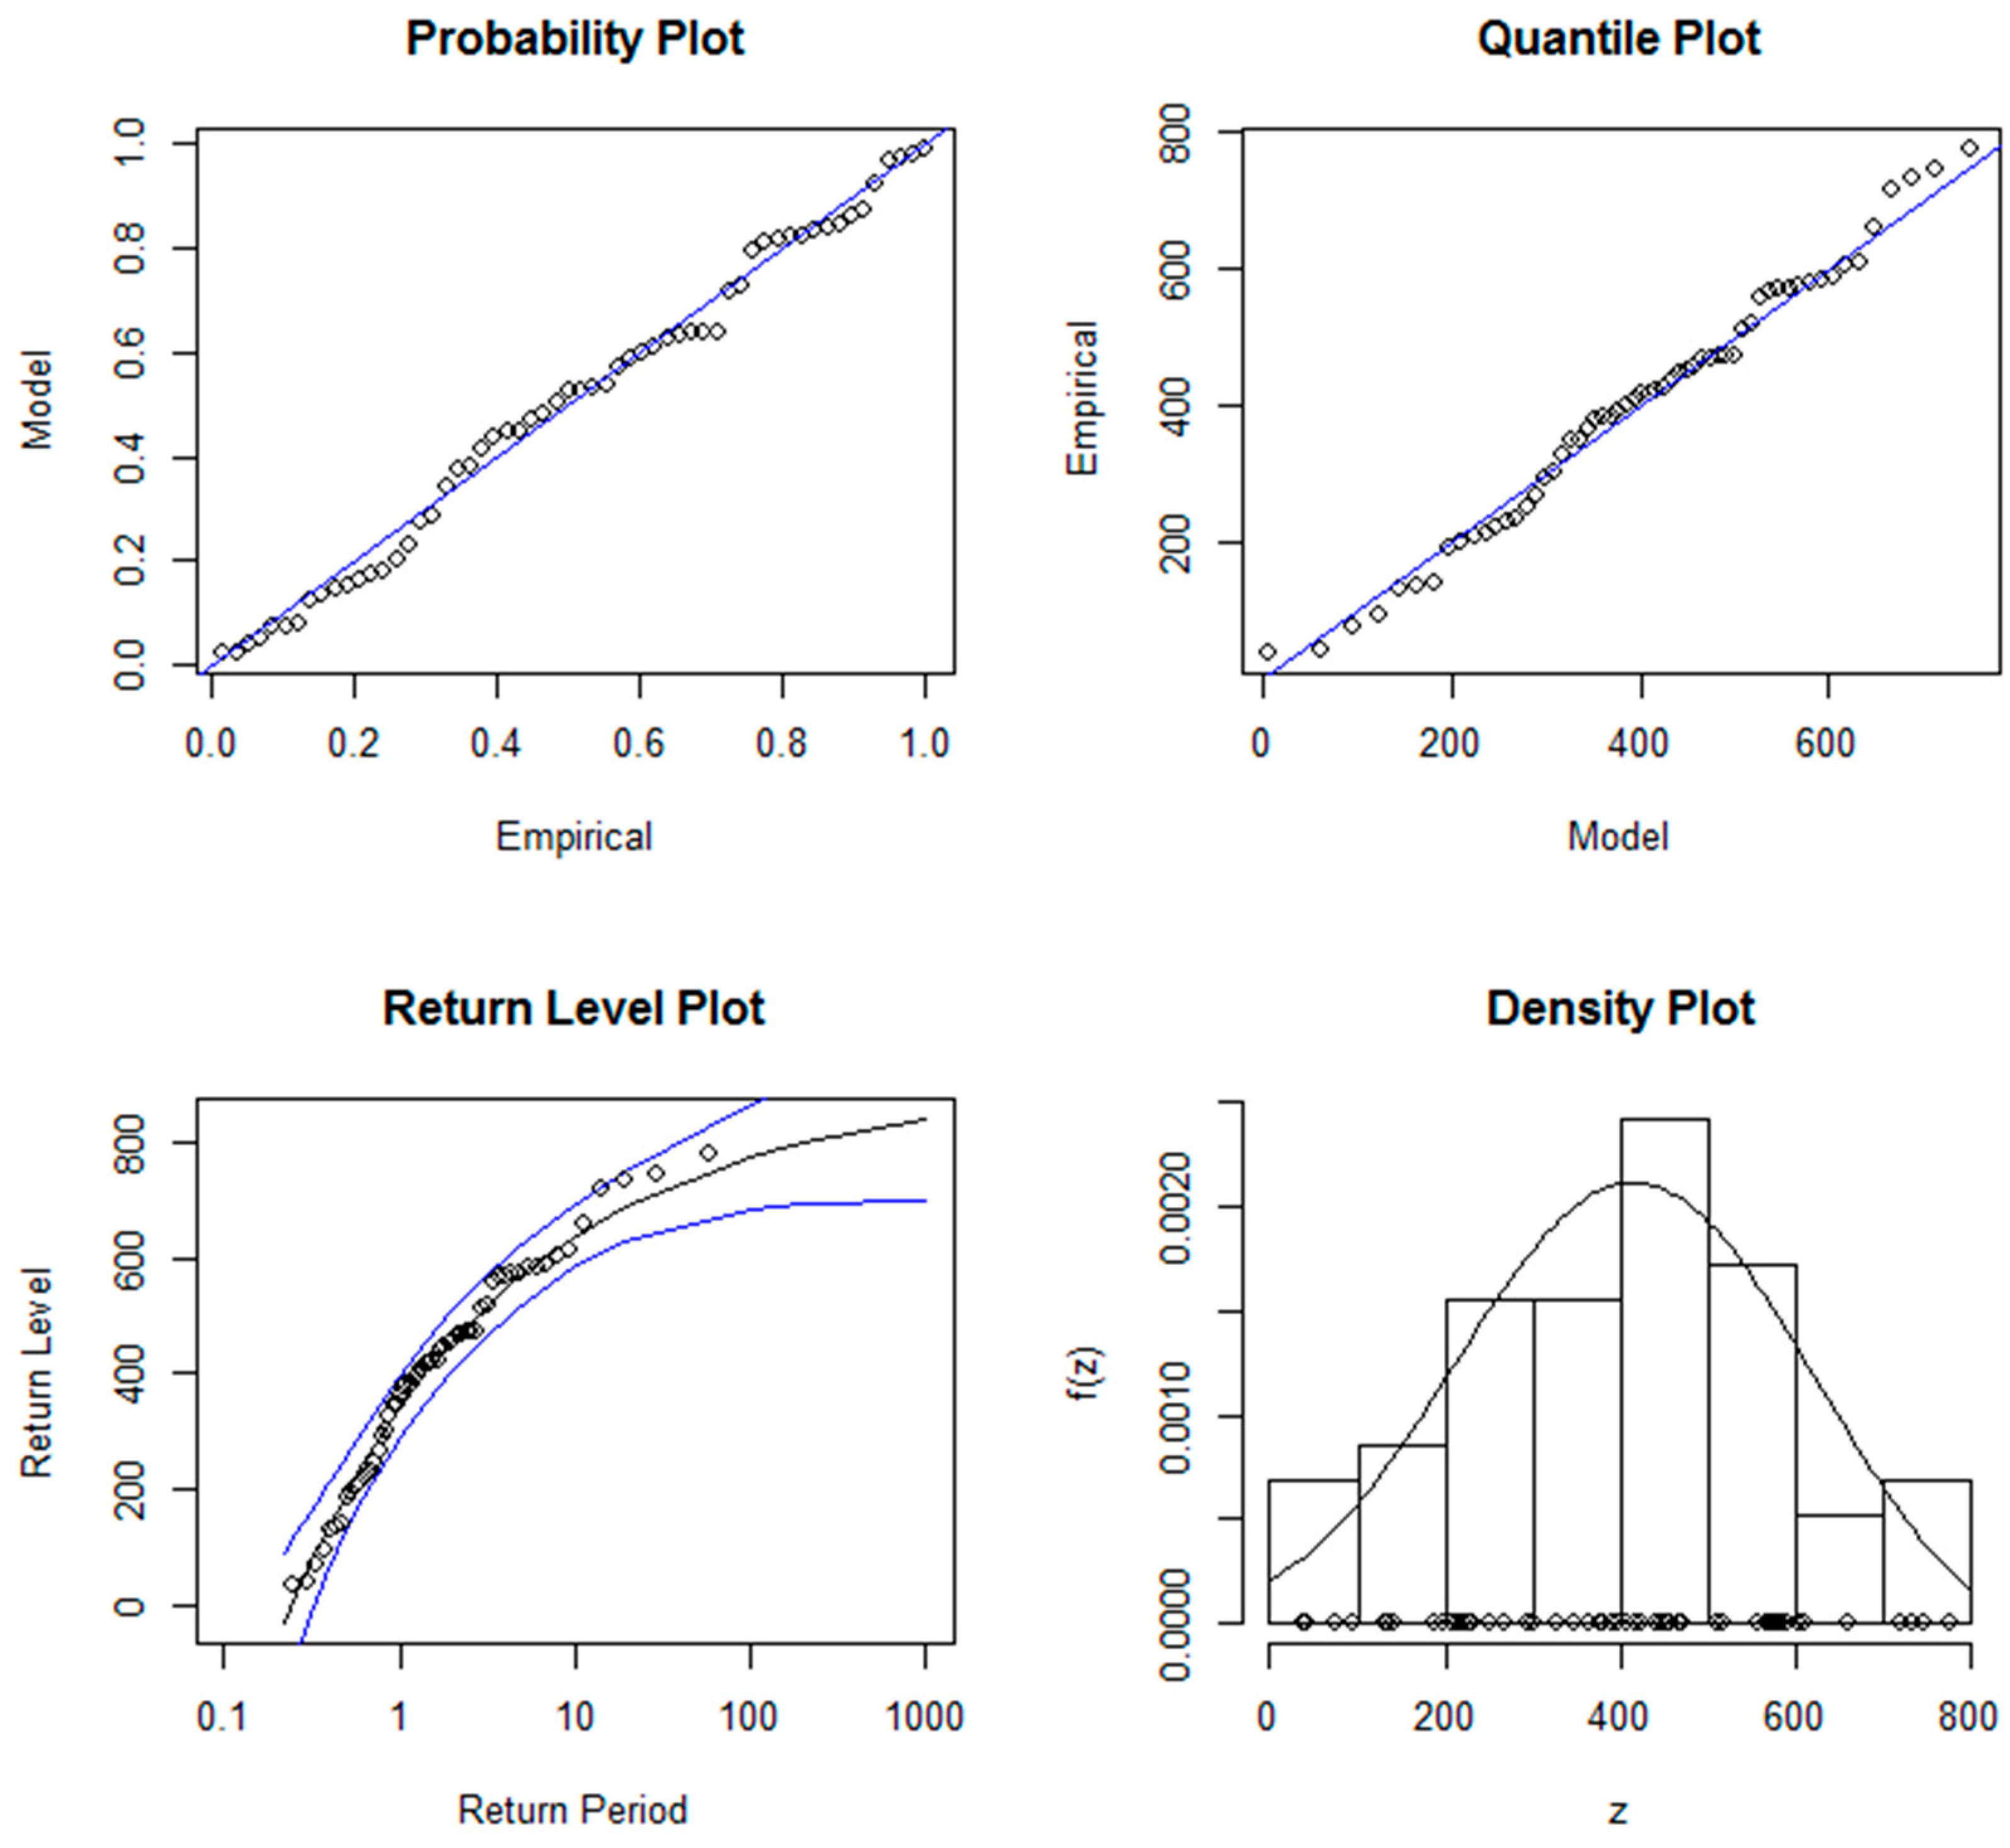
Figure 3 displays the probability and quantile plots, the return-level plot, and the density estimate plot for the GEV-0 fit to the Bétérou station. In the case of a perfect fit, the data would line up on the diagonal of the probability and quantile plots. The quantile plot compares the model quantiles against the data (empirical) quantiles. A quantile plot that deviates greatly from a straight line suggests that the model assumptions may be invalid for the data plotted [51]. In the present case, the data mostly line up on the first diagonal of the probability and quantile plot, with some deviations from the straight line. The return level plot shows the return period compared with the return level with an estimated 95% confidence interval.
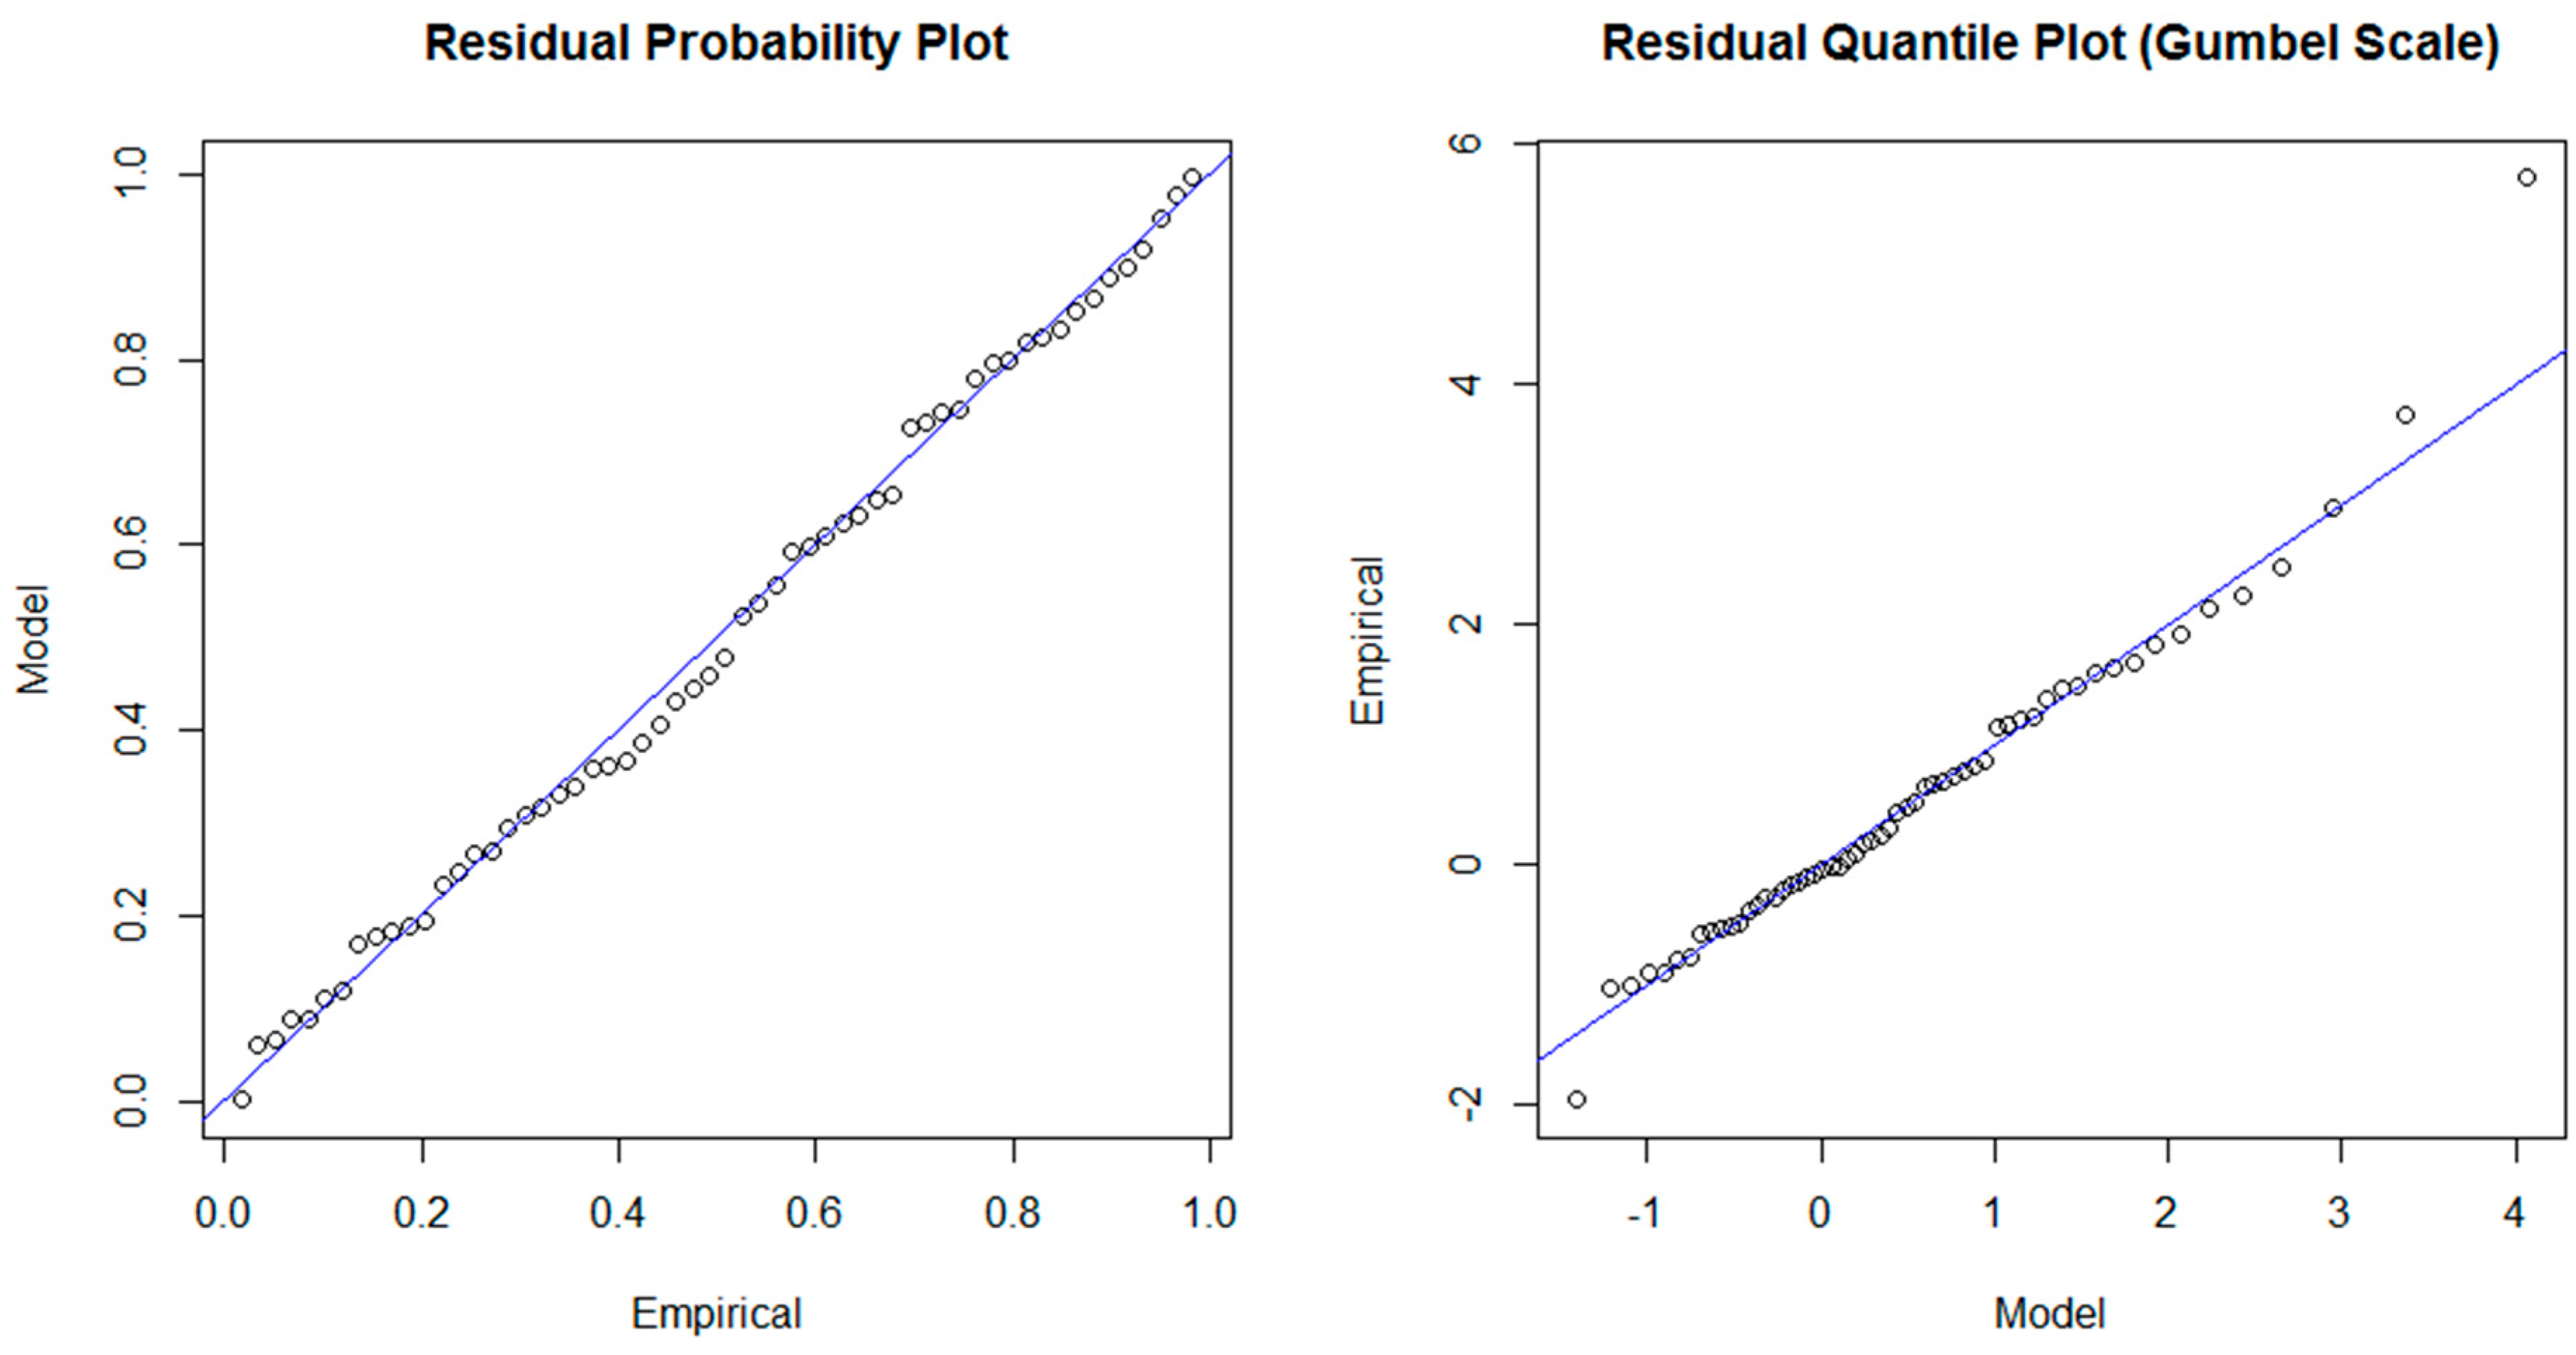
When incorporating covariates in the location parameter (GEV-1, GEV-3), the fit appears to be better (Figure 4), with the residual probability plot and quantile plot adjusting satisfactorily to the diagonal at the Bétérou station.
Figure 3. Diagnostic plots for the GEV-0 fit to the Bétérou station annual maximum discharge.
Hydrology 02 00210 g003
Figure 4. GEV fit diagnostics for the GEV-3 to the Bétérou station’s annual maximal discharge.
Hydrology 02 00210 g004

3.2. Non-Stationarity in the Location Parameter
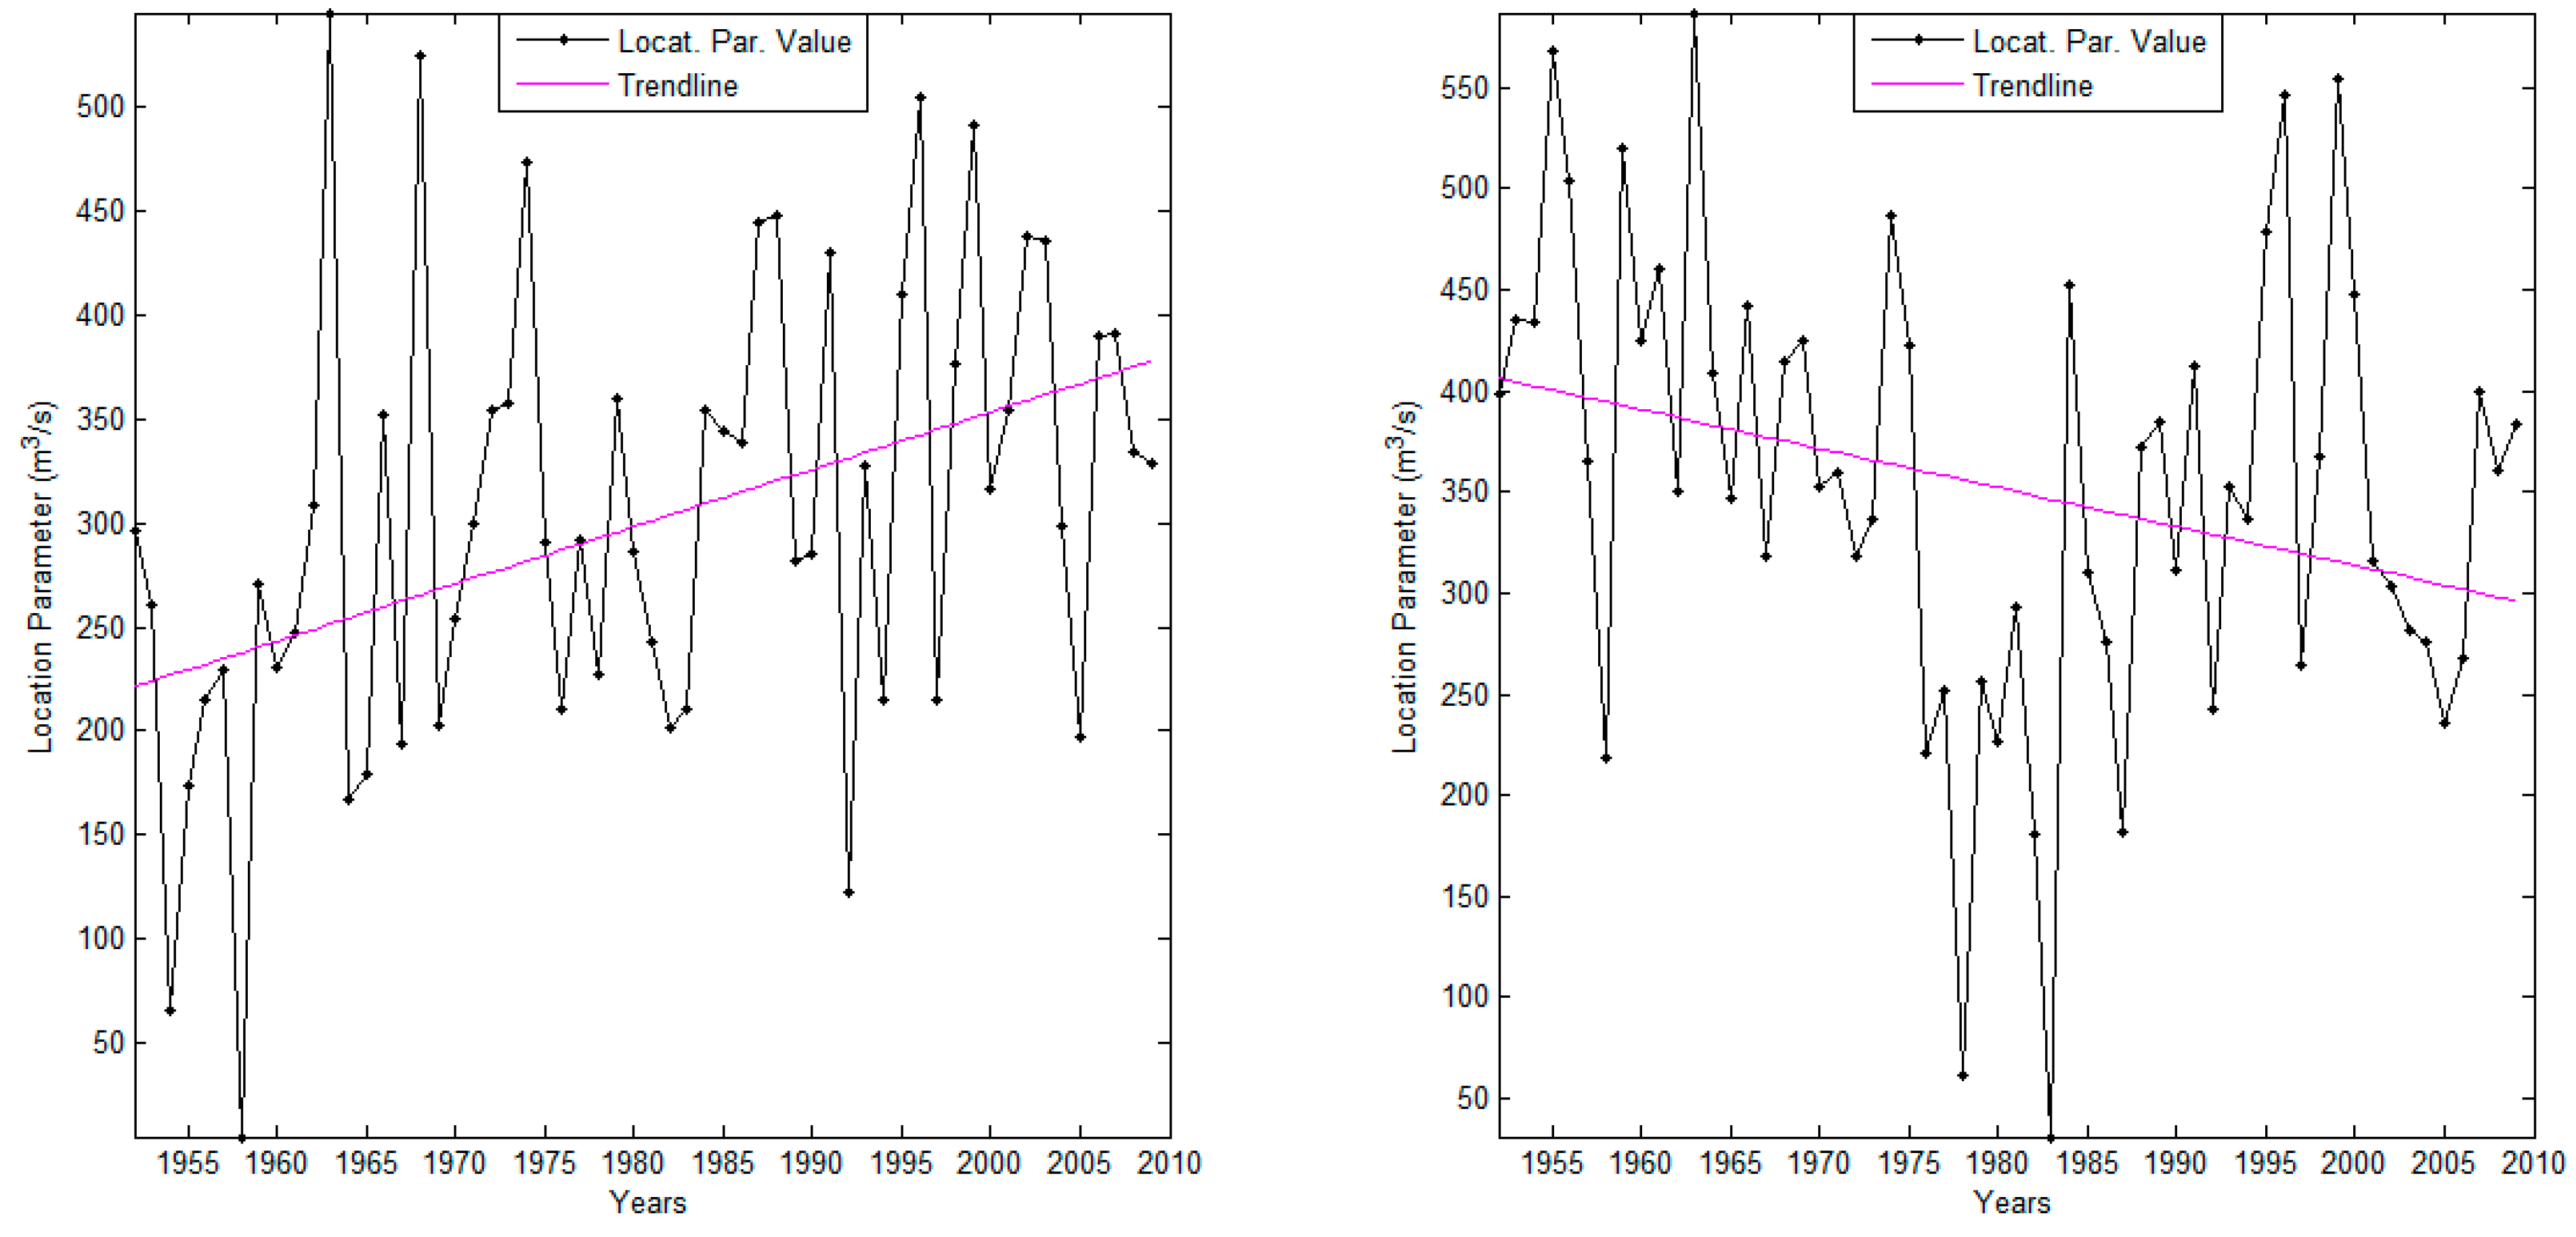
The evolution of the location parameter and its trend at the Atchérigbé and Bétérou stations as a function of time is displayed in Figure 5. In fact, the location parameter is a function of SST or SLP, which are also functions of time. To facilitate the understanding of the location parameter, which specifies where the distribution is centered, it is plotted as a function of time. Notably, there is high variation in the location parameter with time. This finding is an improvement compared with the work previously performed by Alamou [16], where this parameter was assumed to be constant.
Linear regression was used to describe the possible linear trend in the location parameter series quantitatively. The linear regression method used is the non-parametric Sen’s slope estimator. It is a robust method that selects the median slope among all lines through pairs of two-dimensional sample points [56]. The slopes, i.e., the change per unit time, obtained are negative, except for Atchérigbé, and vary from −3.0 at Savè to −0.3 at Domè. Therefore, the parameter experiences a downward trend. Considering the study period, the mean value of the location parameter or the mean value of the AM discharges decreased by 2.98 × ( 2009 1952 ) = 169.9   m 3 / s at Savè to 0.26 × ( 2009 1952 ) = 14.8   m 3 / s at Domè. To test the significance of this trend, we applied the Mann-Kendall and Spearman Rho trend tests. At the 5% significance level, the downward trends observed in the location parameter series are statistically significant for the study period. The significance of the trend in the location parameter should be carefully considered because the relationship between the AM Discharge and the SST or the SLP is not perfect. Atchérigbé is the only station where an upward trend in the location parameter is observed.
This result also introduces the possibility for the future prediction of floods in the study area. In fact, using a climate model, it is possible to obtain SLP or SST data in the Gulf of Guinea for a future time period. Knowing that a statistical distribution is characterized by its parameters, the use of covariates in a given statistical distribution is effective by writing its parameters as a function of the covariates. Modeling the parameters as functions of time or covariates helps us to better understand the trends regarding extreme climate events, and it allows predictions to be made (for example, up to 2020) regarding the probability of future occurrences of a particular flood event. In doing so, the non-stationary distribution model can be an efficient tool to (1) account for dependencies between extreme value randomness and temporal evolution of the climate and (2) forecast the future evolution of the random variable. This finding justifies the use of climate indexes to predict seasonal forecasts of precipitation and discharge over West Africa [57]. The evaluation of possible future change in flood frequencies analyses using future climate data is beyond the scope of this study. Nevertheless, this evaluation will be done in future studies.
Figure 5. Evolution of the location parameter and its trend as a function of time at the Atchérigbé (left) and Bétérou (right) stations. The trend line is plotted using a non-parametric Sen’s slope estimator.
Hydrology 02 00210 g005

3.3. Stationary and Non-Stationary Effective Return Level Estimation
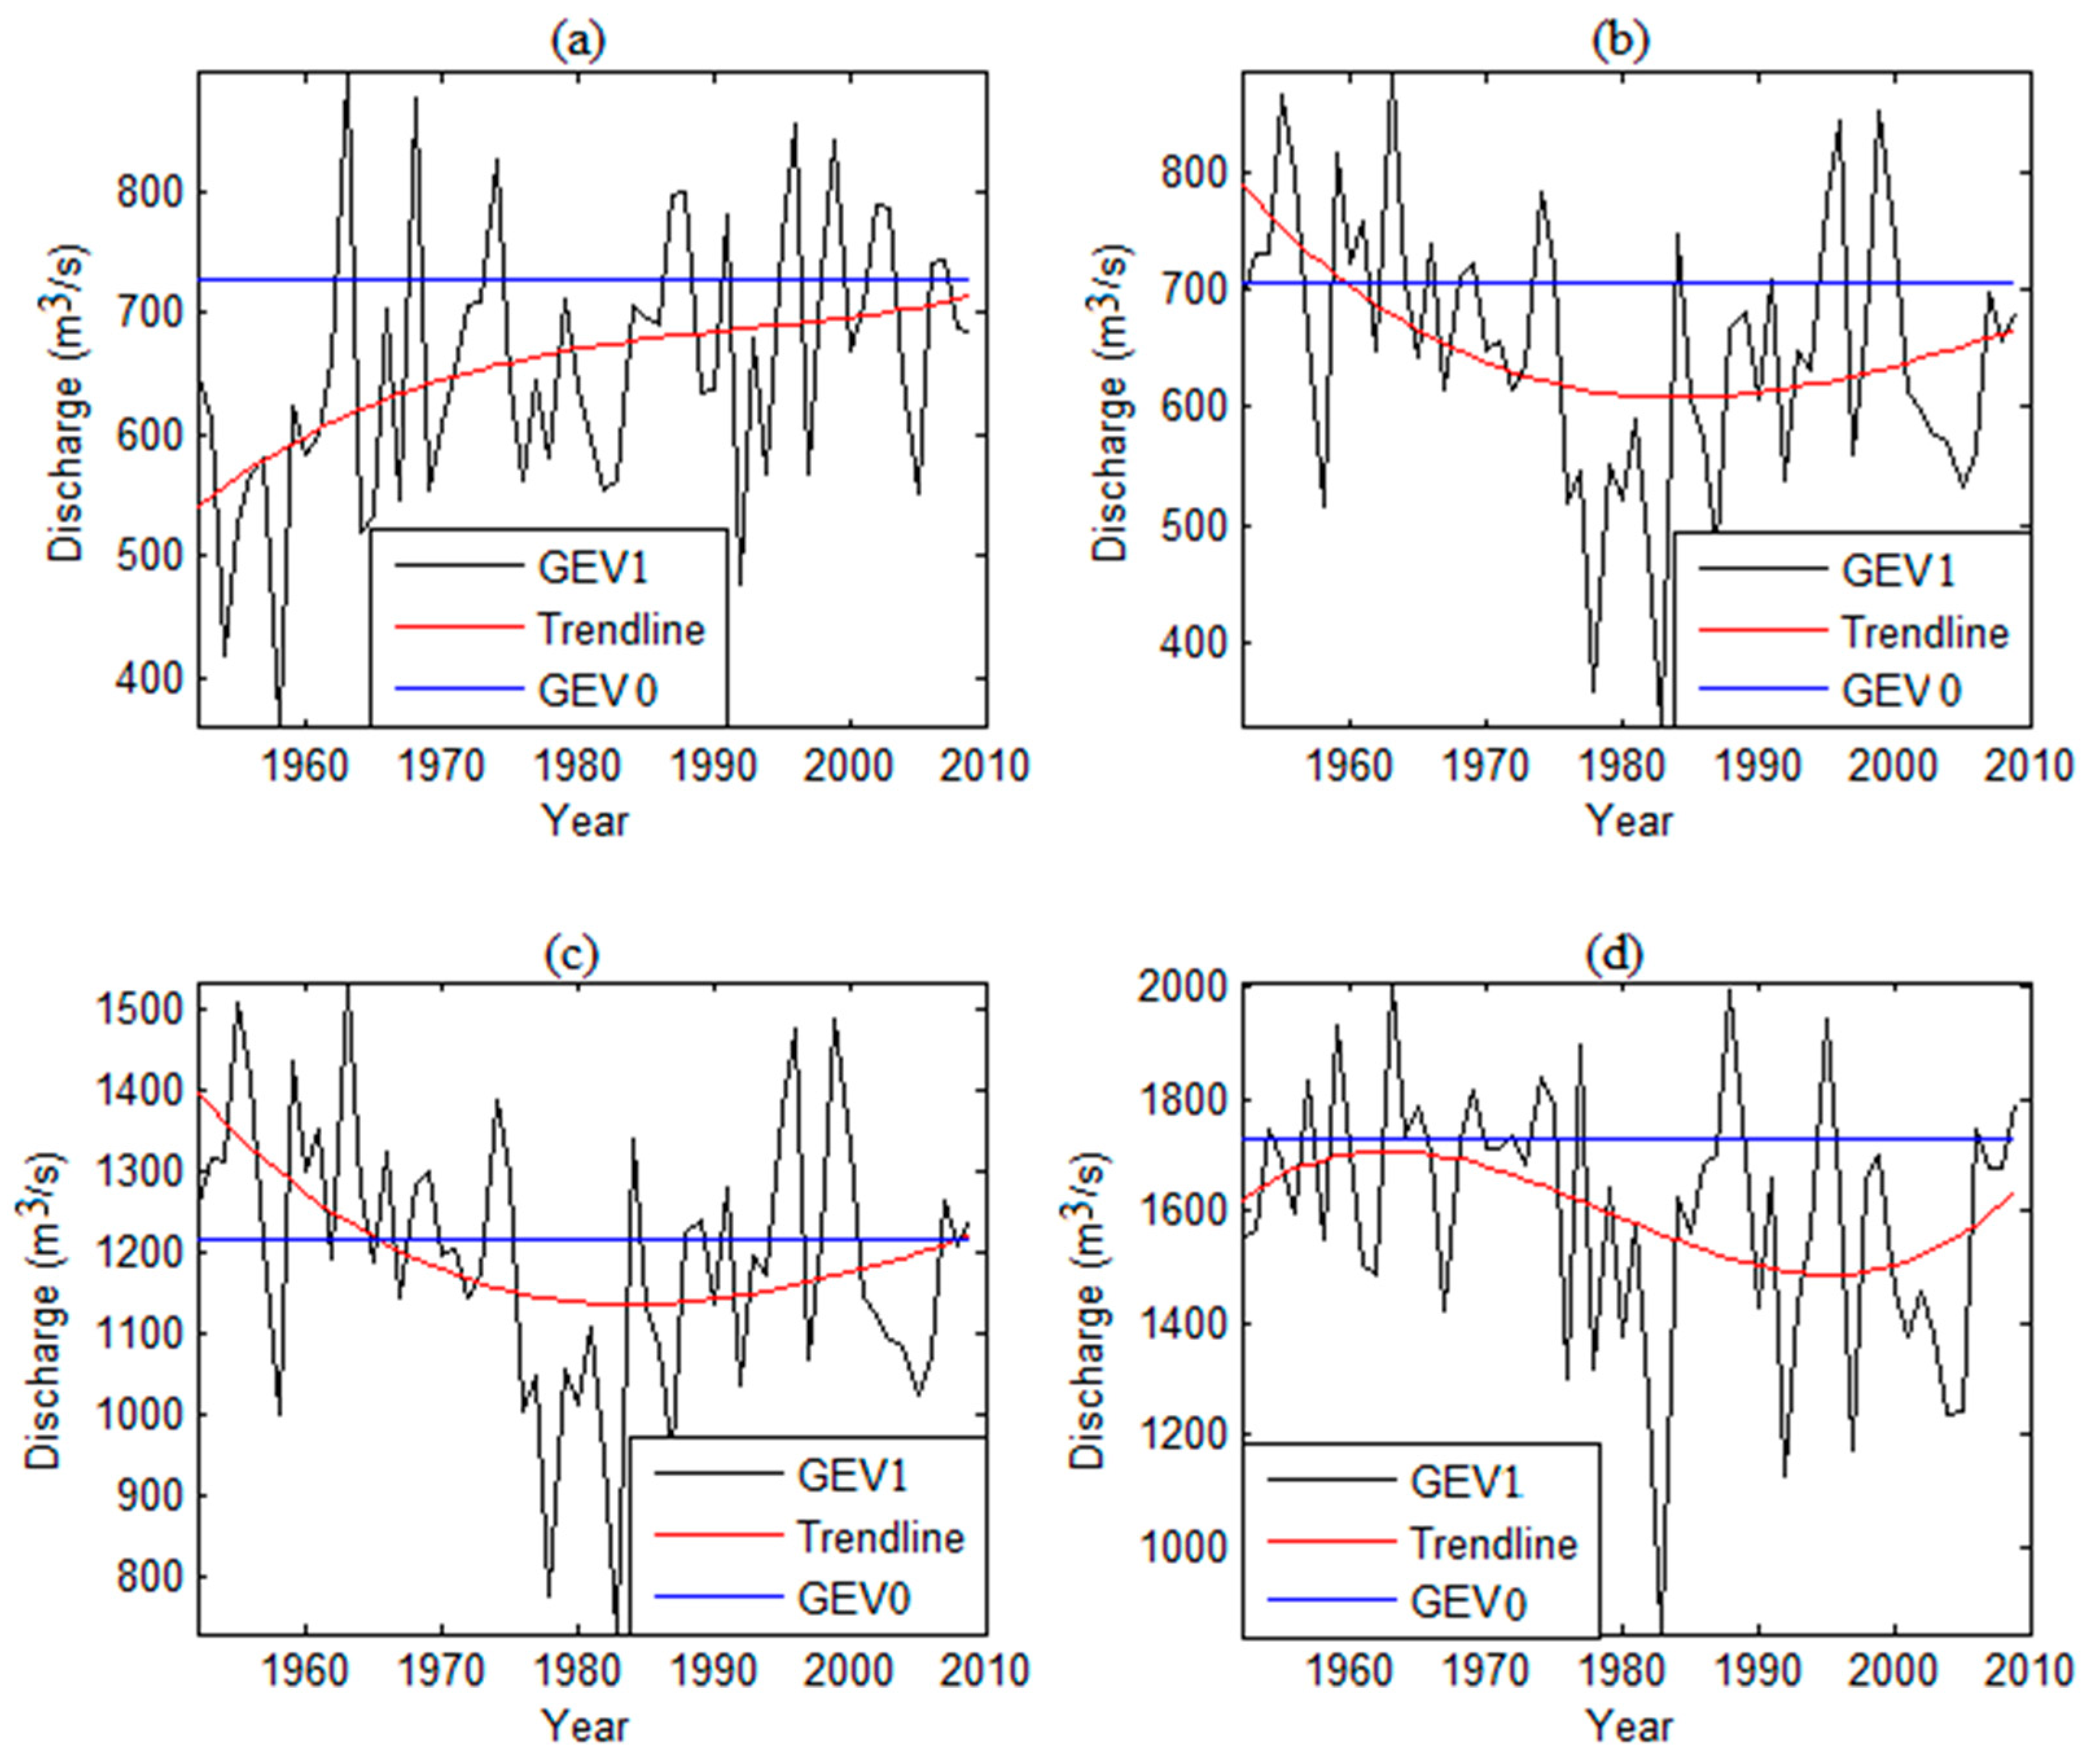
The study of floods in operational hydrology aims to estimate flood events for a given a priori probability to obtain flood maps, design protective measures, or plan flood risk management [18]. It is possible to find the quantile corresponding to a specified probability of exceedance or return period for the non-stationary case, except here the return value varies depending on the year. These estimated return values are obtained by substituting the parameter estimates into Equation (2) for the quantile function of the GEV distribution. Figure 6 shows the effective design value for the 25-year return period under non-stationary conditions (GEV-1) at different stations. Generally, the plots of the return values preserve the initial trend in the AM discharge. It is interesting to note that the non-stationarity models indicate the existence of periods when the flood risk experiences upward or downward trends following different rainfall regimes during the second half of the century over West Africa [37]. For example, until the 1990s, there is a decreasing flood risk, which may be due to the droughts in the early 1980s; after the 1990s, there is a recovery to the normal conditions. In contrast, for Atchérigbé, an increase was observed during the entire study period. This was already observed in the annual maximal discharge series. This station was the only one with an increase in the AM discharge. The high variability in the 25-year and 50-year design floods shows that using a constant return discharge could lead to high errors in the estimations. This approach is an improvement compared with previous works performed on the same basin [17].
This result shows that treating the flood events as stationary may lead to high uncertainties, which may be manifested in two ways: underestimation of the flood risk or over-sizing of the flood design structures. At the Savè station, during the 58 years in the records, the 25-year flood has varied from 846 m3/s to 2009 m3/s. The maximal value recorded is much greater than that estimated for stationary conditions (1727 m3/s). A similar conclusion was found for the other stations. These results test the hypothesis of stationarity in estimating flood events and show the strong need to account for the change over time in the flood frequency analysis. Because of the probability of excess changes from year to year in the context of non-stationarity, the concept of “return period” should be re-examined.
Figure 6. The 25-year effective flood values of the annual maximal discharge for the study period (1952–2009) at (a) Atchérigbé, (b) Bétérou, (c) Bonou, and (d) Savè based on the GEV1 (non-stationary) and GEV0 (stationary) models.
Hydrology 02 00210 g006

3.4. Non-Stationary Design Values Estimation

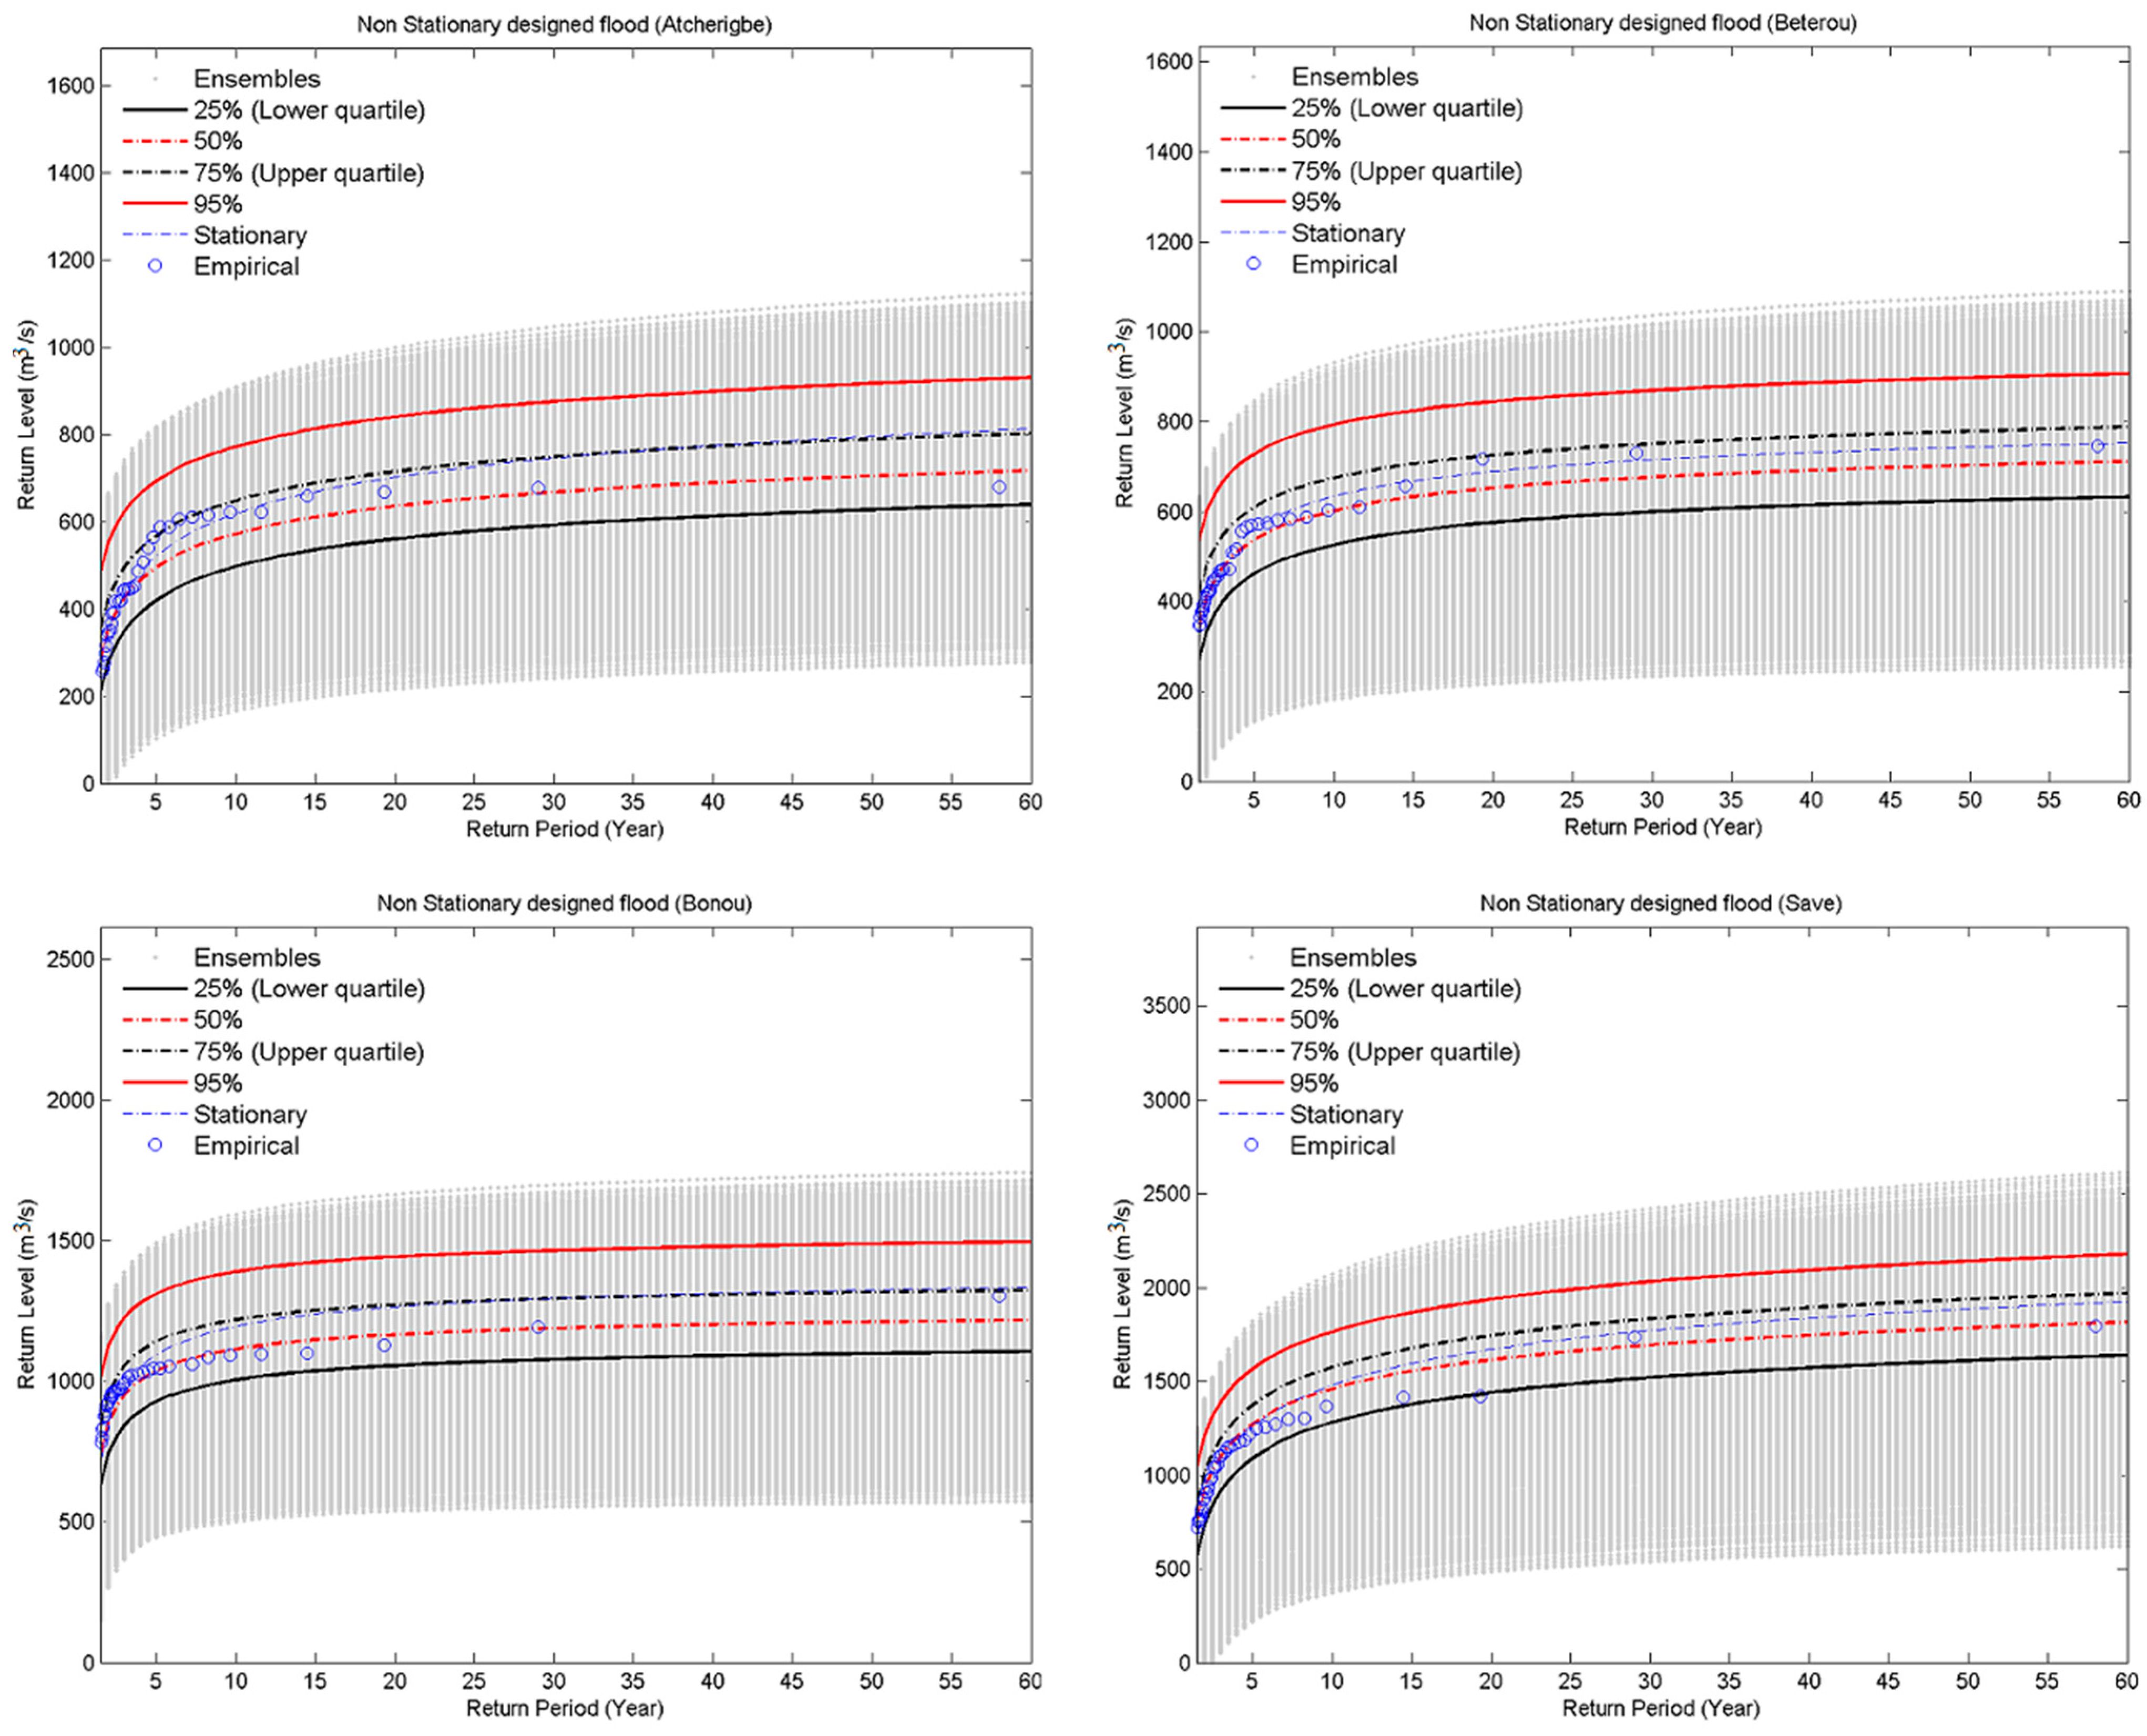
For design and risk assessment purposes under environmental change, estimates of the non-stationary return periods are needed. The plot of the return levels versus the corresponding return periods at four stations is displayed in Figure 7. This is computed from an ensemble of 29,000 realizations for each return period. As can be seen on this figure, the interquartile bounds encompass the empirical return levels, indicating acceptable simulation. Cheng et al. used the median of an ensemble as a measure of non-stationary return temperature [55]. As can be seen in Figure 7, the median of the ensemble is representative of the trend in the empirical quantile and could be used as a measure for the non-stationary return discharge. For infrastructure design purposes, using the median of the ensemble may result in underestimation of the flood risk. Therefore, to minimize the flood risk, the high quartile of the ensemble is used as the final return level. This choice is also supported by the fact that the high discharges are often underestimated when using the rating curve [58]. The estimated return level should therefore be slightly higher than the empirical return values. This approach is similar to the stationary approach but it has the advantage of accounting for change in the location parameter. For Atchérigbé and Bonou, the 75 quantile curve is similar to the one of the stationary approach but for Bétérou and Savè, the 75 quantile overtakes the stationary curve. Table 5 shows some stationary and non-stationary return values for different return periods. Domé is not considered in the rest of the work giving that its covariate explains less than 50% of the behavior of the annual maximal discharge at this station. Due to the limited length of data, it was not possible to carry out a proper validation of the stationary and non-stationary models (e.g., by splitting the observation period into calibration and validation).
Table 5. Stationary and non-stationary return levels for Atchérigbé, Bétérou, Bonou, and Savè under different risk levels.
Return Period251015253040455060Risk Level
Non-stationary return level
Atchérigbé353495572635653667689697704717High Risk
423567648714734749772781789802Medium Risk
551693772840860875898908916930Low Risk
Bétérou408537602652666676692698703711High Risk
480610674725739750767773779788Medium Risk
599728793844858869886892897907Low Risk
Bonou849103711141166117911891202120712111218High Risk
953114112191272128512941308131313171324Medium Risk
1123131113901443145614651479148414891496Low Risk
Savè922127014591614165816931745176617841814High Risk
1014137215731743179318331892191519361970Medium Risk
1210156517631936198820312092211821392178Low Risk
Stationary return level
Atchérigbé348521619702726745774786796813
Bétérou406560634689704716732738743752
Bonou853109411951265128212951313132013261335
Savè851125314801671172717711837186318861924
Figure 7. Annual maximal discharge (return levels) versus return period for Atchérigbé, Bétérou, Bonou, and Savè for the period 1952–2010. Plotted are the ensemble, the median, the upper and lower quartiles (25 and 75 percentiles), the 95 percentiles of the ensemble, and the stationary and empirical return levels.
Hydrology 02 00210 g007

4. Conclusions

An extreme-value non-stationary probabilistic model was improved in this study to assess its suitability for frequency analysis of floods in the main sub-basins of the Ouémé River and to investigate possible changes in the extreme discharge, which may explain the recent flooding events observed throughout the country.
Different GEV models have been applied to estimate the quantiles at five gauging stations in the Ouémé Basin. A comparative study of these models based on three performance criteria showed that GEV-1 is the most adequate model for explaining the variance in discharge observations over the Ouémé Basin. These criteria were the deviance statistic, the AIC, and the BIC. This case study shows that it is necessary to incorporate non-stationarity into extreme flood frequency analyses by linking climate variables or time with the distribution parameters to improve estimations.
An analysis of 25- and 50-year floods shows that considering flood events as stationary leads to high uncertainties, which can have two effects: underestimation of the flood risk or over-sizing of the flood design structures. Structural measures remain important elements, and their designs should be updated by considering non-stationarity to reduce the vulnerability of human beings and goods exposed to flood risks. Based on the previously achieved results, non-stationary return values have been proposed for the basin base on the 75 percentile of an ensemble of 29,000 realizations using the Latin hypercube sampling method.
Strategic options to reduce the flooding risk in Benin must strike a balance between infrastructural and non-infrastructural interventions, including cross-cutting measures, plans for their implementation, and updates over time based on available resources [59]. In particular, introduction of flood forecasting systems, improving population awareness and preparedness, urban planning, and discouraging human settlements in flood-prone areas, along with the development of local institutional capacities, are effective and socially sustainable actions that should be pursued [3]. Strengthening the capacities of the various actors concerned with the implementation of the strategy, as well as the integration of flood and disaster risk management, could help reduce flood impacts on the population. Structural measures will remain important elements, and their design should be updated by considering non-stationarity to reduce the vulnerability of human beings and goods exposed to flood risks. Taking into account the evolution of this natural hazard and its trends, one must shift from defensive action against hazards to management of the risk and living with floods. Further, flood prevention should not be limited to flood events, which occur often, but should also consider rare hydrological events.
This generalization of the classical model based on the hypothesis of stationarity and normality allows climate change to affect the evolution of the distribution parameters and provides predictions of the probability of future occurrences of a particular flood event. Further investigations that consider land use change are required for a better understanding of flood risks in the basin.

Acknowledgments

This work has been funded by the German Federal Ministry of Education and Research (BMBF) through the West African Science Service Centre on Climate Change and Adapted Land Use (WASCAL).

Author Contributions

Jean Hounkpè, Bernd Diekkrüger, Abel A. Afouda, and Djigbo F. Badou designed the study, developed the methodology, and wrote the manuscript. Jean Hounkpè performed the field work, collected the data, and conducted the computer analysis with Djigbo F. Badou, while Abel A. Afouda and Bernd Diekkrüger supervised this part of the work.

Conflict of Interest

The authors declare no conflict of interest.

References and Notes

  1. EM-DAT The OFDA/CRED International Disaster Database. Available online: http://www.emdat.be (accessed on 23 September 2013).
  2. Amoussou, E.; Tramblay, Y.; Totin, H.S.V.; Mahé, G.; Camberlin, P. Dynamics and modelling of floods in the river basin of Mono in Nangbeto, Togo/Benin. Hydrol. Sci. J. 2014, 59, 2060–2071. [Google Scholar] [CrossRef]
  3. Di Baldassarre, G.; Montanari, A.; Lins, H.; Koutsoyiannis, D.; Brandimarte, L.; Blöschl, G. Flood fatalities in Africa: From diagnosis to mitigation. Geophys. Res. Lett. 2010. [Google Scholar] [CrossRef]
  4. World Meteorological Organization (WMO). Flood Management in a Changing Climate: A Tool for Integrated Flood Management. Available online: http://www.apfm.info/publications/tools/Tool_09_FM_in_a_changing_climate.pdf (accessed on 13 October 2013).
  5. Goula, B.T.A.; Soro, E.G.; Kouassi, W.; Srohourou, B. Tendances et ruptures au niveau des pluies journalières extrêmes en Côte d ’ Ivoire (Afrique de l ’ Ouest). Hydrol. Sci. J. 2011, 57, 1067–1080. (In French) [Google Scholar] [CrossRef]
  6. Sighomnou, D.; Descroix, L.; Genthon, P.; Gil, M.; Emmanuele, G. La crue de 2012 a Niamey : un paroxysme du paradoxe du Sahel? Secheresse 2013, 24, 3–13. (In French) [Google Scholar]
  7. Nchito, W.S. Flood risk in unplanned settlements in Lusaka. Environ. Urban. 2007, 19, 539–551. [Google Scholar] [CrossRef]
  8. Kunkel, K.E.; Carolina, N. North American Trends in Extreme Precipitation. Nat. Hazards 2003, 29, 291–305. [Google Scholar] [CrossRef]
  9. Re, M.; Barros, V.R. Extreme rainfalls in SE South America. Clim. Change 2009, 96, 119–136. [Google Scholar] [CrossRef]
  10. Kiang, J.; Rolf, O.; Waskom, R. Workshop on Nonstationarity, Hydrologic Frequency Analysis, and Water Management. Available online: http://www.usbr.gov/research/climate/Workshop_ Nonstat.pdf (accessed on 5 July 2013).
  11. Brown, S.J.; Caesar, J.; Ferro, C.T. Global changes in extreme daily temperature since 1950. J. Geophys. Res. 2008. [Google Scholar] [CrossRef]
  12. Katz, R.W.; Parlange, M.B.; Naveau, P. Statistics of extremes in hydrology. Adv. Water Resour. 2002, 25, 1287–1304. [Google Scholar] [CrossRef]
  13. Aissaoui-Fqayeh, I.; El-Adlouni, S.; Ouarda, T.B.M.J.; St-Hilaire, A. Développement du modèle log-normal non-stationnaire et comparaison avec le modèle GEV non-stationnaire. Hydrol. Sci. J. 2009, 54, 1141–1156. (In French) [Google Scholar] [CrossRef]
  14. Tramblay, Y.; Neppel, L.; Carreau, J.; Kenza, N. Non-stationary frequency analysis of heavy rainfall events in Southern France. Hydrol. Sci. J. 2013, 58, 1–15. [Google Scholar] [CrossRef]
  15. Tramblay, Y.; Amoussou, E.; Dorigo, W.; Mahé, G. Flood risk under future climate in data sparse regions: Linking extreme value models and flood generating processes. J. Hydrol. 2014, 519, 549–558. [Google Scholar] [CrossRef]
  16. Alamou, E. Application du Principe de Moindre Action à la Modélisation Pluie-débit. Ph.D. Thesis, Université d’Abomey-Calavi, Abomey Calavi, Benin, 2011. [Google Scholar]
  17. Avahounlin, F.R.; Lawin, A.E.; Alamou, E.; Chabi, A.; Afouda, A. Analyse Fréquentielle des Séries de Pluies et Débits Maximaux de L’ ouémé et Estimation des Débits de Pointe. Eur. J. Sci. Res. 2013, 107, 355–369. (In French) [Google Scholar]
  18. Lopez, J.; Frances, F. Non-stationary flood frequency analysis in continental Spanish rivers, using climate and reservoir indices as external covariates. Hydrol. Earth Syst. Sci. 2013, 10, 3103–3142. [Google Scholar] [CrossRef]
  19. Sugahara, S.; Porfirio, R.; Silveira, R. Non-stationary frequency analysis of extreme daily rainfall in Sao Paulo, Brazil. Int. J. Climatol. 2009, 1349, 1339–1349. [Google Scholar] [CrossRef]
  20. Hanel, M.; Buishand, T.A.; Ferro, C.A.T. A non-stationary index-flood model for precipitation extremes in transient Regional Climate Model simulations. J. Geophys. Res. Atmos. 2009, 114, 1–61. [Google Scholar] [CrossRef]
  21. Khaliq, M.N.; Ha, C. Frequency analysis of a sequence of dependent and/or non-stationary hydro-meteorological observations: A review. J. Hydrol. 2006, 329, 534–552. [Google Scholar] [CrossRef]
  22. Osorio, J.D.G.; Galiano, S.G.G. Non-stationary analysis of dry spells in monsoon season of Senegal River Basin using data from Regional Climate Models (RCMs). J. Hydrol. 2012, 450-451, 82–92. [Google Scholar] [CrossRef]
  23. El-Adlouni, S.; Ouarda, T. Comparaison des méthodes d’estimation des paramètres du modèle GEV non stationnaire. Rev. des Sci. l’eau 2008, 21, 35–50. (In French) [Google Scholar] [CrossRef] [Green Version]
  24. Zenoni, E.; Pecora, S.; de Michele, C.; Vezzoli, R. Maximum Annual Flood Peaks Distribution in non-Stationary Conditions. In Comprehensive Flood Risk Management Research for Policy and Practice; Schweckendiek, T., Ed.; Taylor and Francis Group: London, UK, 2013. [Google Scholar]
  25. Conway, D.; Mah, G. River flow modelling in two large river basins with non-stationary behaviour : The Paraná and the Niger. 2009, 23, 3186–3192. [Google Scholar] [CrossRef]
  26. Rath, A.B.; Astellarin, A.C.; Ontanari, A.M. Detecting non-Stationarity in Extreme Rainfall Data Observed in Northern Italy. Available online: http://www.idrologia.polito.it/~claps/pliniusonline/pdf_proceedings/Plinius/Brath1/BRATH1.pdf (accessed on 27 October 2014).
  27. Ribereau, P.; Guillou, A.; Naveau, P. Estimating return levels from maxima of non-stationary random sequences using the Generalized PWM method. Nonlin. Processes Geophys. 2008, 15, 1033–1039. [Google Scholar] [CrossRef]
  28. Kharim, V.V.; Zwiers, F.W. Estimating Extremes in Transient Climate Change Simulations. J. Clim. 2004, 18, 1156–1173. [Google Scholar] [CrossRef]
  29. Coles, S.; Davison, A. Statistical Modelling of Extreme Values. Available online: http://www.cces.ethz.ch/projects/hazri/EXTREMES/talks/colesDavisonDavosJan08.pdf (accessed on 4 Feburary 2013).
  30. Fink, A.; Christoph, M.; Born, K.; Bruecher, T.; Piecha, K.; Pohle, S.; Schulz, O.; Ermert, V. Climate. In Impacts of Global Change on the Hydrological Cycle in West and Northwest Africa; Speth, P., Christoph, M., Diekkrüger, B., Eds.; Springer: Heidelberg, Germany, 2010. [Google Scholar]
  31. Deng, Z. Vegetation Dynamics in Oueme Basin, Benin, West Africa; Cuvillier Verlag: Göttingen, Germany, 2007. [Google Scholar]
  32. Diekkrüger, B.; Busche, H.; Giertz, S.; Steup, G. Hydrology. In Impacts of Global Change on the Hydrological Cycle in West and Northwest Africa; Speth, P., Christoph, M., Diekkrüger, B., Eds.; Springer: Heidelberg, Germany, 2010. [Google Scholar]
  33. Robson, A.J.; Jones, T.K.; Reed, D.W.; Bayliss, A.C. A study of national trend and variation in UK floods. Int. J. Climatol. 1998, 18, 165–182. [Google Scholar] [CrossRef]
  34. Xiong, L.; Guo, S. Trend test and change-point detection for the annual discharge series of the Yangtze River at the Yichang hydrological station. Hydrol. Sci. 2004, 49, 99–112. [Google Scholar] [CrossRef]
  35. Pettitt, A.N. A Non-Parametric Approach to the Change-Point Problem. J. R. Stat. Soc. Ser. C. Appl. Stat. 1979, 28, 126–135. [Google Scholar] [CrossRef]
  36. Hubert, P.; Carbonnel, J.P.; Chaouche, A. Segmentation des séries hydrométéorologiques—Application à des séries de précipitations et de débits de l’afrique de l'ouest. J. Hydrol. 1989, 110, 349–367. (In French) [Google Scholar] [CrossRef]
  37. Servat, E.; Paturel, J.E.; Lubes-Niel, H.; Kouamé, B.; Masson, J.M.; Travaglio, M.; Marieu, B. De différents aspects de la variabilité de la pluviométrie en Afrique de l’ouest et centrale non sahélienne. Rev. des Sci. l’eau 1999, 12, 363–387. (In French) [Google Scholar] [CrossRef]
  38. Vissin, E.; Boko, M.; Houndenou, C.; Perard, J. Recherche de ruptures dans les séries pluviométriques et hydrologiques du bassin beninois du fleuve niger (Bénin, Afrique de l’ouest). Available online: http://www.climato.be/aic/colloques/actes/PubAIC/art_2003_vol15/Article% 2045 E Vissin.pdf (accessed on 5 August 2013). (In French)
  39. Detecting Trend And Other Changes In Hydrological Data. Available online: http://water.usgs.gov/osw/wcp-water/detecting-trend.pdf (accessed on 23 September 2013).
  40. Jain, S.; Lall, U. Floods in a changing climate: does the past represent the future? Water Resour. Res. 2001, 37, 3193–3205. [Google Scholar] [CrossRef]
  41. McKerchar, M.E.; Moss, C.P.; Pearson, A. The Southern Oscillation index as a predictor of the probability of low streamflows in New Zealand. Water Resour. Res. 1994, 30, 2717–2723. [Google Scholar]
  42. Yang, C.; Hill, D. Modeling Stream Flow Extremes under Non-Time-Stationary Conditions. Available online: http://cmwr2012.cee.illinois.edu/Papers/Special%20Sessions/Data-driven%20Approaches%20for%20Water%20Resources%20Forecasting%20and%20Knowledge/Yang_Ci_CMWR2012_Final%20version.pdf (accessed on 3 September 2014).
  43. Mitchell, T. 4 by 6-Degree Latititude-Longitude Resolution Anomalies of ICOADS SST, SLP, Surface Air Temperature, Winds, and Cloudiness. Available online: http://jisao.washington.edu/data_sets/sstanom_4by6/ (accessed on 17 July 2014).
  44. Janicot, S.; Thorncroft, C.D.; Ali, A.; Asencio, N.; Berry, G.; Bock, O.; Bourles, B.; Caniaux, G.; Chauvin, F.; Deme, A.; et al. Large-scale overview of the summer monsoon over West Africa during the AMMA field experiment in 2006. Ann. Geophys. 2008, 26, 2569–2595. [Google Scholar] [CrossRef] [Green Version]
  45. Janicot, S.; Ali, H.; Fontaine, B.; Vincent, M. West African Monsoon Dynamics and Eastern Equatorial Atlantic and Pacific SST Anomalies (1970–88). J. Clim. 1998, 11, 1874–1883. [Google Scholar] [CrossRef]
  46. Losada, T.; Rodriguez-Fonseca, B.; Janicot, S.; Gervois, S.; Chauvin, F.; Ruti, P. A multimodel approach to the Atlantic ecuatorial mode. Impact on the West African monsoon. Clim. Dyn. 2010, 35, 29–43. [Google Scholar] [CrossRef]
  47. Coles, S. An Introduction to Statistical Modeling of Extreme Values; Springer: Bristol, UK, 2001. [Google Scholar]
  48. Markose, S.; Alentorn, A. The Generalized Extreme Value (GEV) Distribution, Implied Tail Index and Option Pricing. J. Deriv. 2011, 18, 35–60. [Google Scholar] [CrossRef]
  49. Hounkpè, J.; Afouda, A.A.; Diekkrüger, B.; Hountondji, F. Modelling extreme streamflows under non-stationary conditions in Ouémé river basin, Benin, West Africa. In Hydrological Sciences and Water Security: Past, Present and Future; IAHS (International Association of Hydrological Sciences): Paris, France, 2015; pp. 143–144. [Google Scholar]
  50. R Development Core Team. R: A Language and Environment for Statistical Computing; R Foundation for Statistical Computing: Vienna, Austria, 2009. [Google Scholar]
  51. Gilleland, E.; Katz, R.W. Extremes Toolkit (extRemes): Weather and Climate Applications of Extreme Value. Available online: www.isse.ucar.edu/extremevalues/extreme.pdf (accessed on 23 December 2014).
  52. Akaike, H. A New Look at the Statistical Model Identification. IEEE Trans. Autom. Control 1974, 19, 716–723. [Google Scholar] [CrossRef]
  53. Schwarz, G. Estimating the Dimension of a Model. Ann. Stat. 1978, 6, 461–464. [Google Scholar] [CrossRef]
  54. McKay, M.D.; Beckman, R.J.; Conover, W.J. A comparison of three methods for selecting values of input variables in the analysis of output from a computer code. Technometrics 2000, 42, 55–61. [Google Scholar] [CrossRef]
  55. Cheng, L.; Aghakouchak, A.; Gilleland, E.; Katz, R.W. Non-stationary extreme value analysis in a changing climate. Clim. Change 2014, 127, 353–369. [Google Scholar] [CrossRef]
  56. Sen, P.K. Estimates of the Regression Coefficient Based on Kendall’s Tau. J. Am. Stat. Assoc. 1968, 63, 1379–1389. [Google Scholar] [CrossRef]
  57. Philippon, N. Une nouvelle approche pour la prévision statistique des précipitations saisonnières en Afrique de l’ Ouest et de l'est: méthodes, diagnostics et application. Available online: http://climatologie.u-bourgogne.fr/perso/nphilipp/thesis/Thesis.pdf (accessed on 27 March 2014). (In French)
  58. Di Baldassarre, G.; Claps, P. A hydraulic study on the applicability of flood rating curves. Hydrol. Res. 2010. [Google Scholar] [CrossRef]
  59. World Bank. Inondation au Benin: Rapport d’evaluation des Besoins Post Catastrophe. Available online: http://www.gfdrr.org/sites/gfdrr.org/files/GFDRR_Benin_PDNA_2010.pdf (access on 1 December 2013). (In French)