
Assessment of Hydrogeochemistry and Environmental Isotopes in Karst Springs of Makook Anticline, Kurdistan Region, Iraq


Abstract
:1. Introduction
2. Study Area
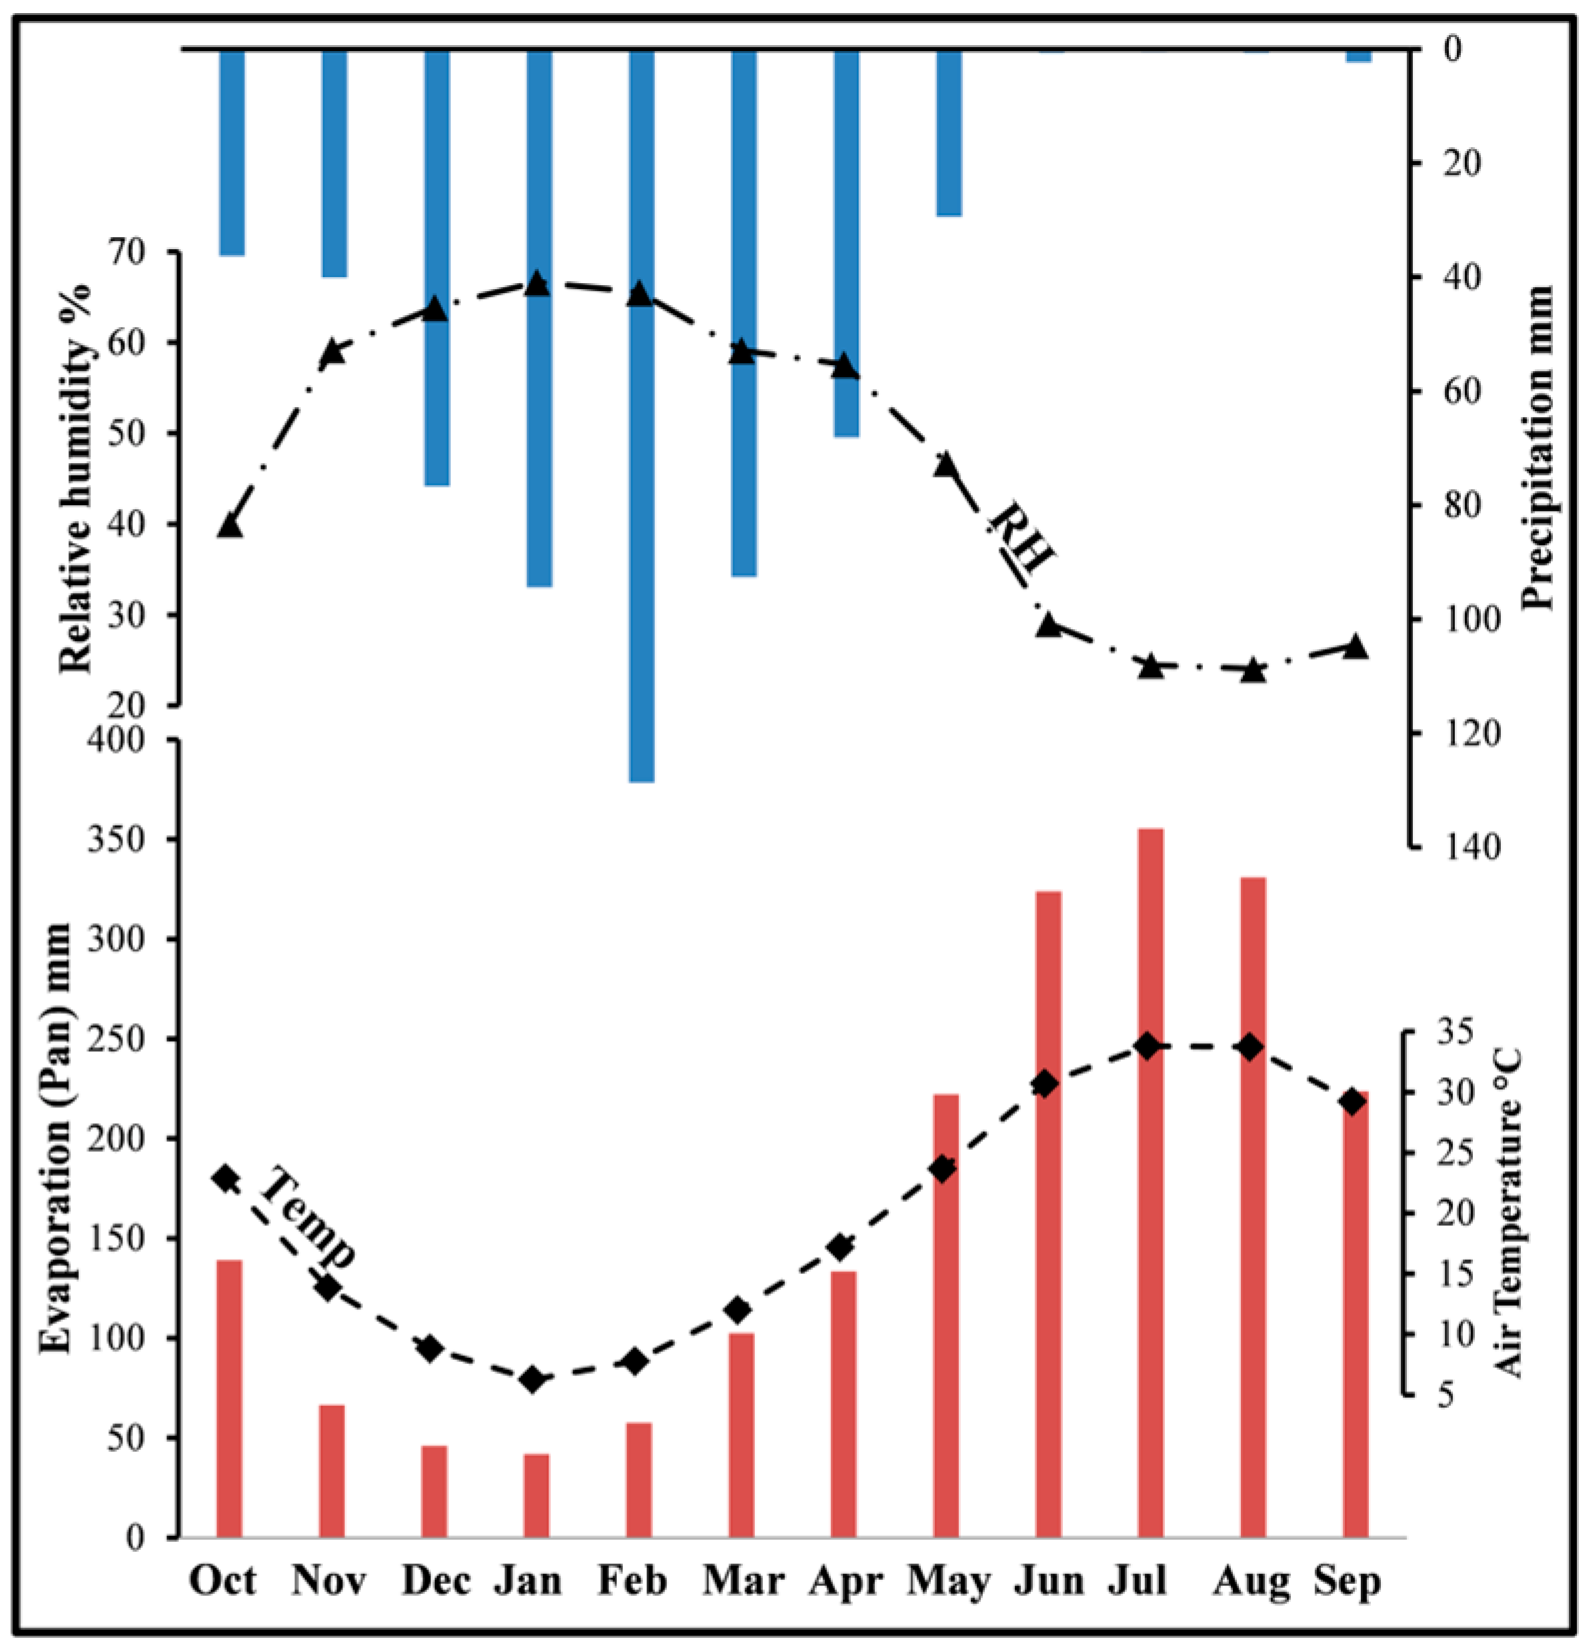
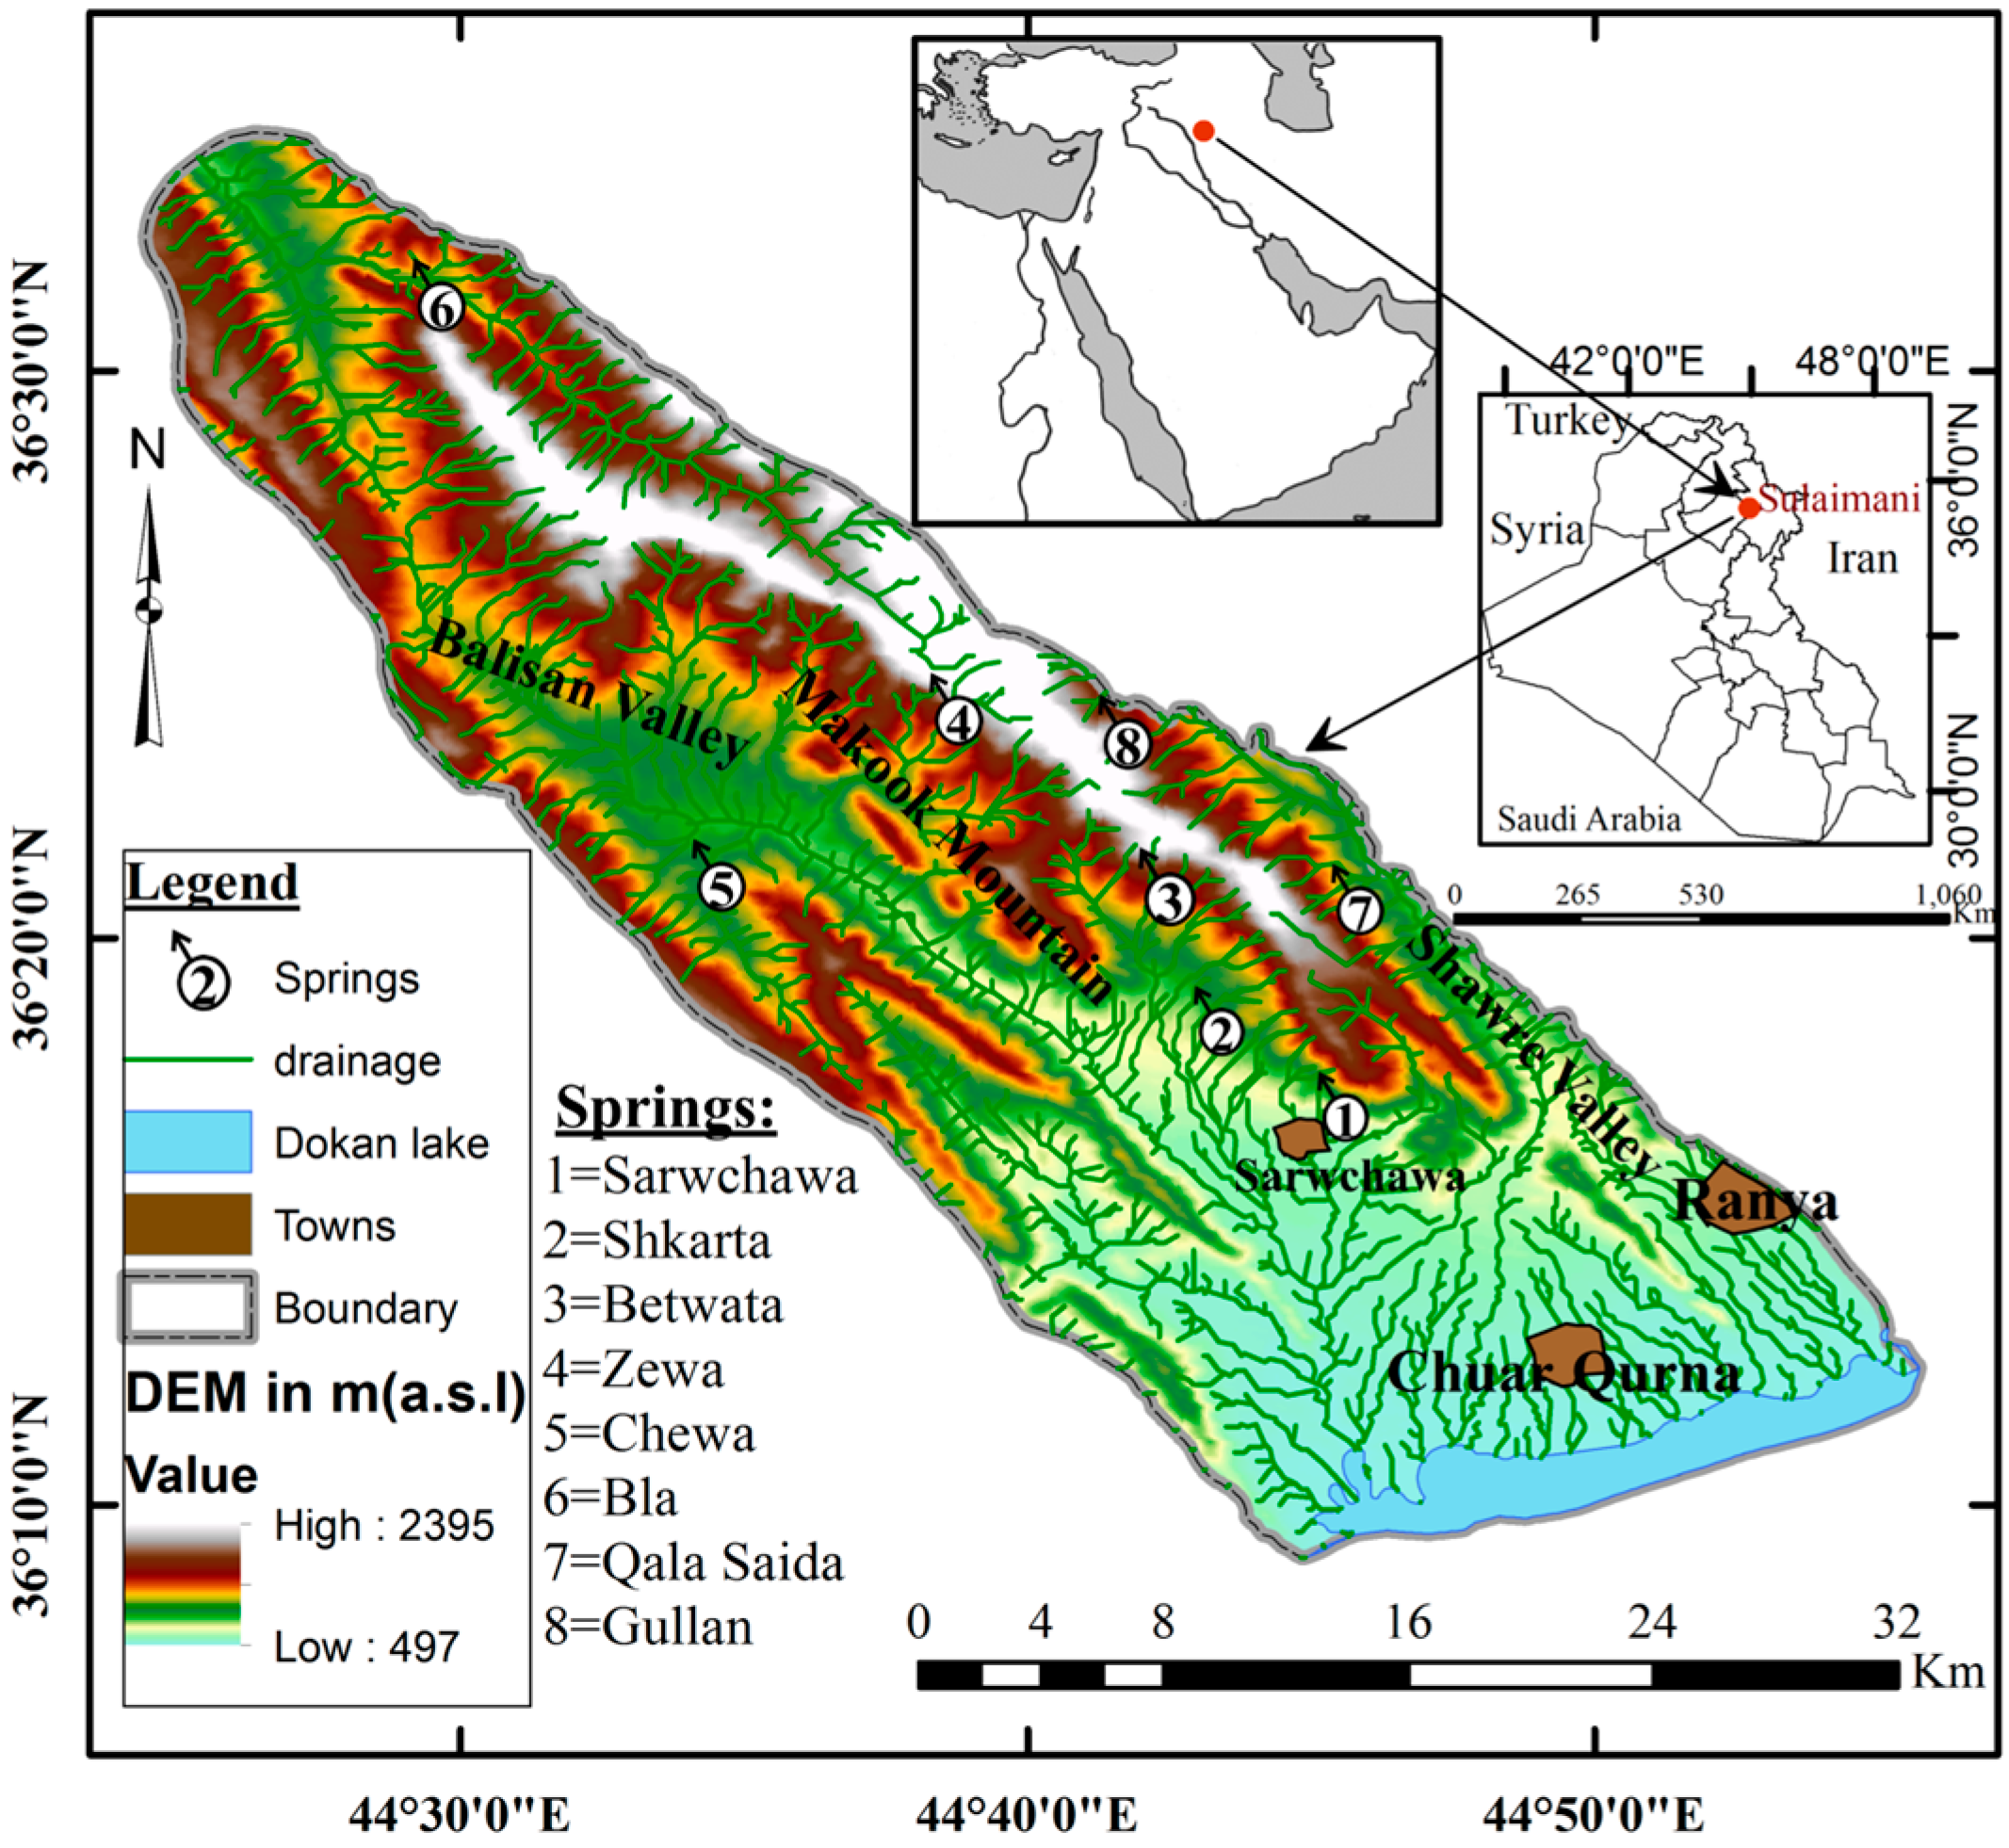
2.1. Geography

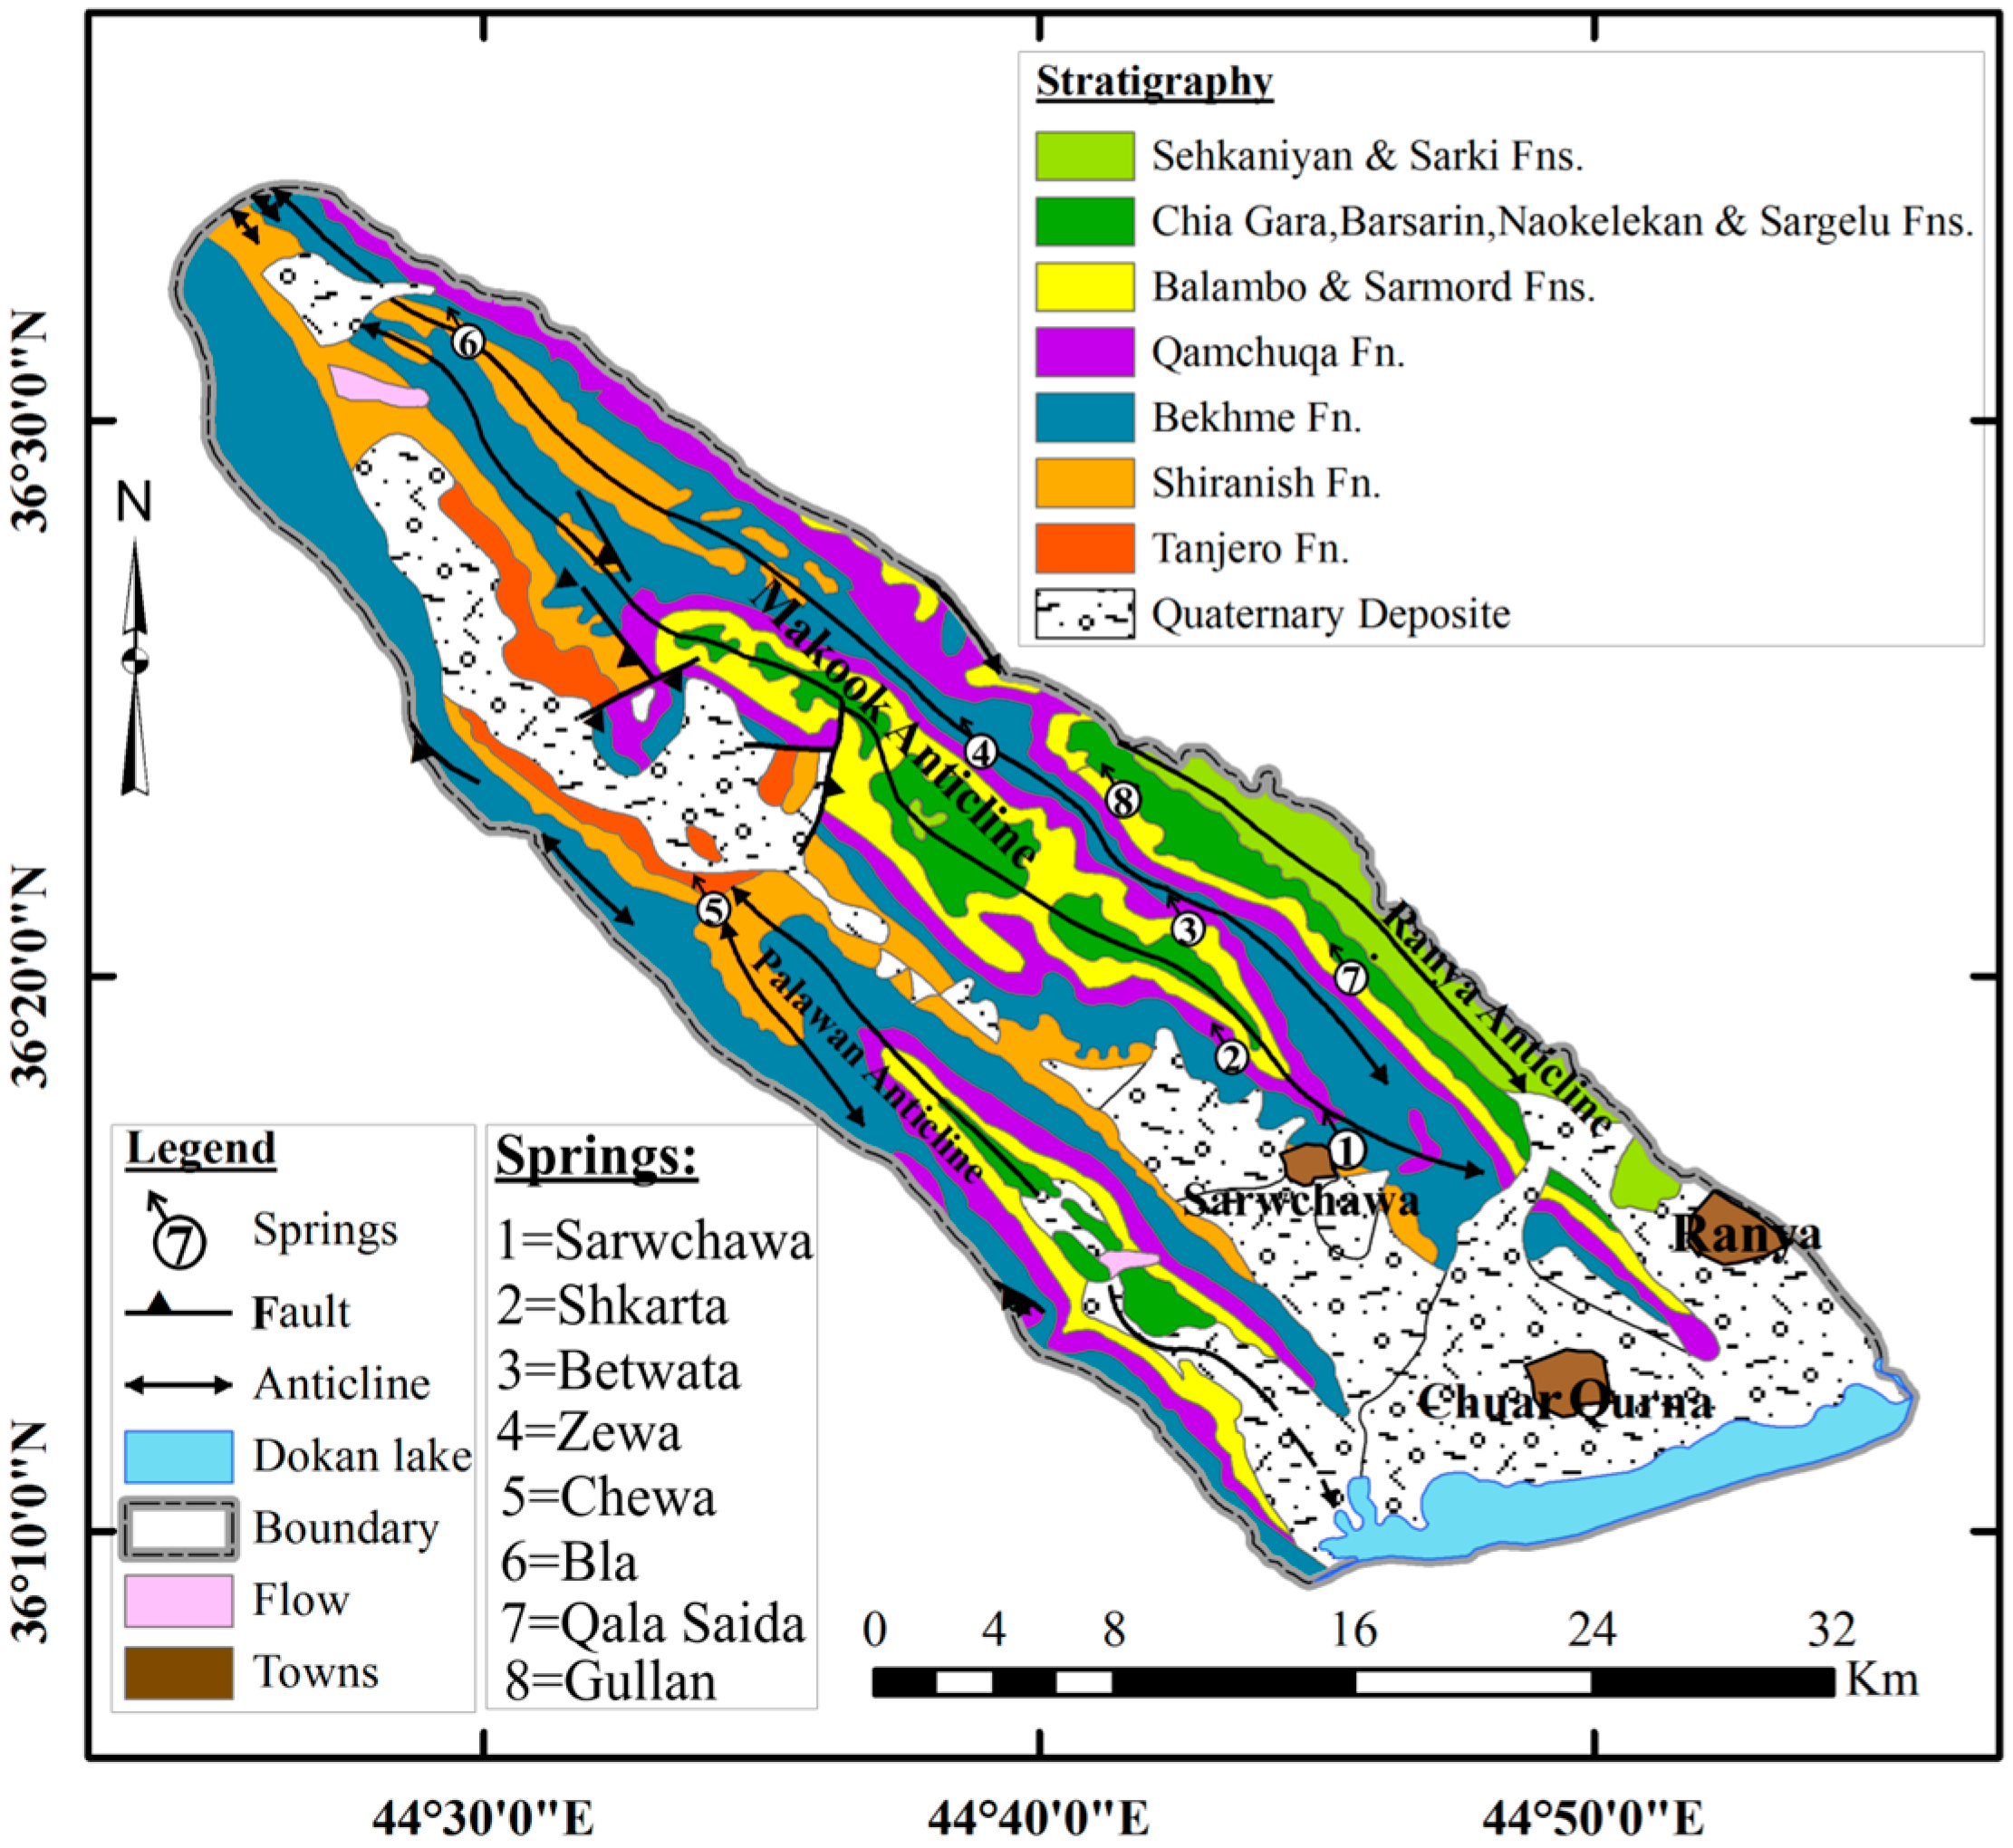
2.2. Geologic Setting

2.3. Hydrogeology
3. Methodology
4. Results and Discussion
4.1. Discharge and Recharge Estimations

| Sample Code | Date of Sampling | δ18O | δD | d-Excess ‰ | Altitude m.a.s.l | TAir °C | Evap. mm | Precip. mm | pH | Cl (mg/L) | Na (mg/L) | ||
|---|---|---|---|---|---|---|---|---|---|---|---|---|---|
| ‰ | StD | ‰ | StD | ||||||||||
| R-1 | 25.11.11 | −5.18 | 0.05 | −23.07 | 0.34 | 18.4 | 882 | 11 | 1.4 | 0.2 | 6.3 | 1.9 | 0.41 |
| R-2 | 31.12.11 | −9.18 | 0.08 | −52.8 | 0.16 | 20.6 | 882 | 8.5 | 1.4 | 12.5 | 6.5 | 3.2 | 0.2 |
| R-3 | 18.01.12 | −3.35 | 0.08 | −1.95 | 0.29 | 24.8 | 882 | 7.5 | 0.6 | 9 | 6.2 | 2.4 | 0.1 |
| R-4 | 31.01.12 | −12.29 | 0.07 | −82.31 | 0.18 | 16 | 882 | 7.5 | 1 | 45 | 6.3 | 2.8 | 0.17 |
| R-5 | 07.02.12 | −7.91 | 0.11 | −44.95 | 0.52 | 18.3 | 882 | 7 | 2 | 20.2 | 6.1 | 1.9 | 0.06 |
| R-6 | 18.02.12 | −9.5 | 0.12 | −57.6 | 0.57 | 18.4 | 882 | 8.5 | 2.1 | 9 | 6.4 | 2.5 | 0.43 |
| R-7 * | 18.02.12 | −8.27 | 0.08 | −39.17 | 0.27 | 27 | 1460 | 8.5 | 2.1 | 9 | 6.3 | 2.5 | 0.7 |
| R-8 | 02.04.12 | −9.27 | 0.08 | −54.57 | 0.38 | 19.6 | 882 | 7.5 | 1.1 | 15 | 6.5 | 2.4 | 0.76 |
| R-9 * | 04.04.12 | −10.66 | 0.03 | −55.77 | 0.25 | 29.5 | 845 | 3.5 | 1.3 | 25 | 6.5 | 2.3 | 0.22 |
| R-10 | 15.04.12 | −5.38 | 0.04 | −28.85 | 0.24 | 14.1 | 845 | 12.5 | 4.3 | 29 | 6.5 | 4.2 | 0.43 |
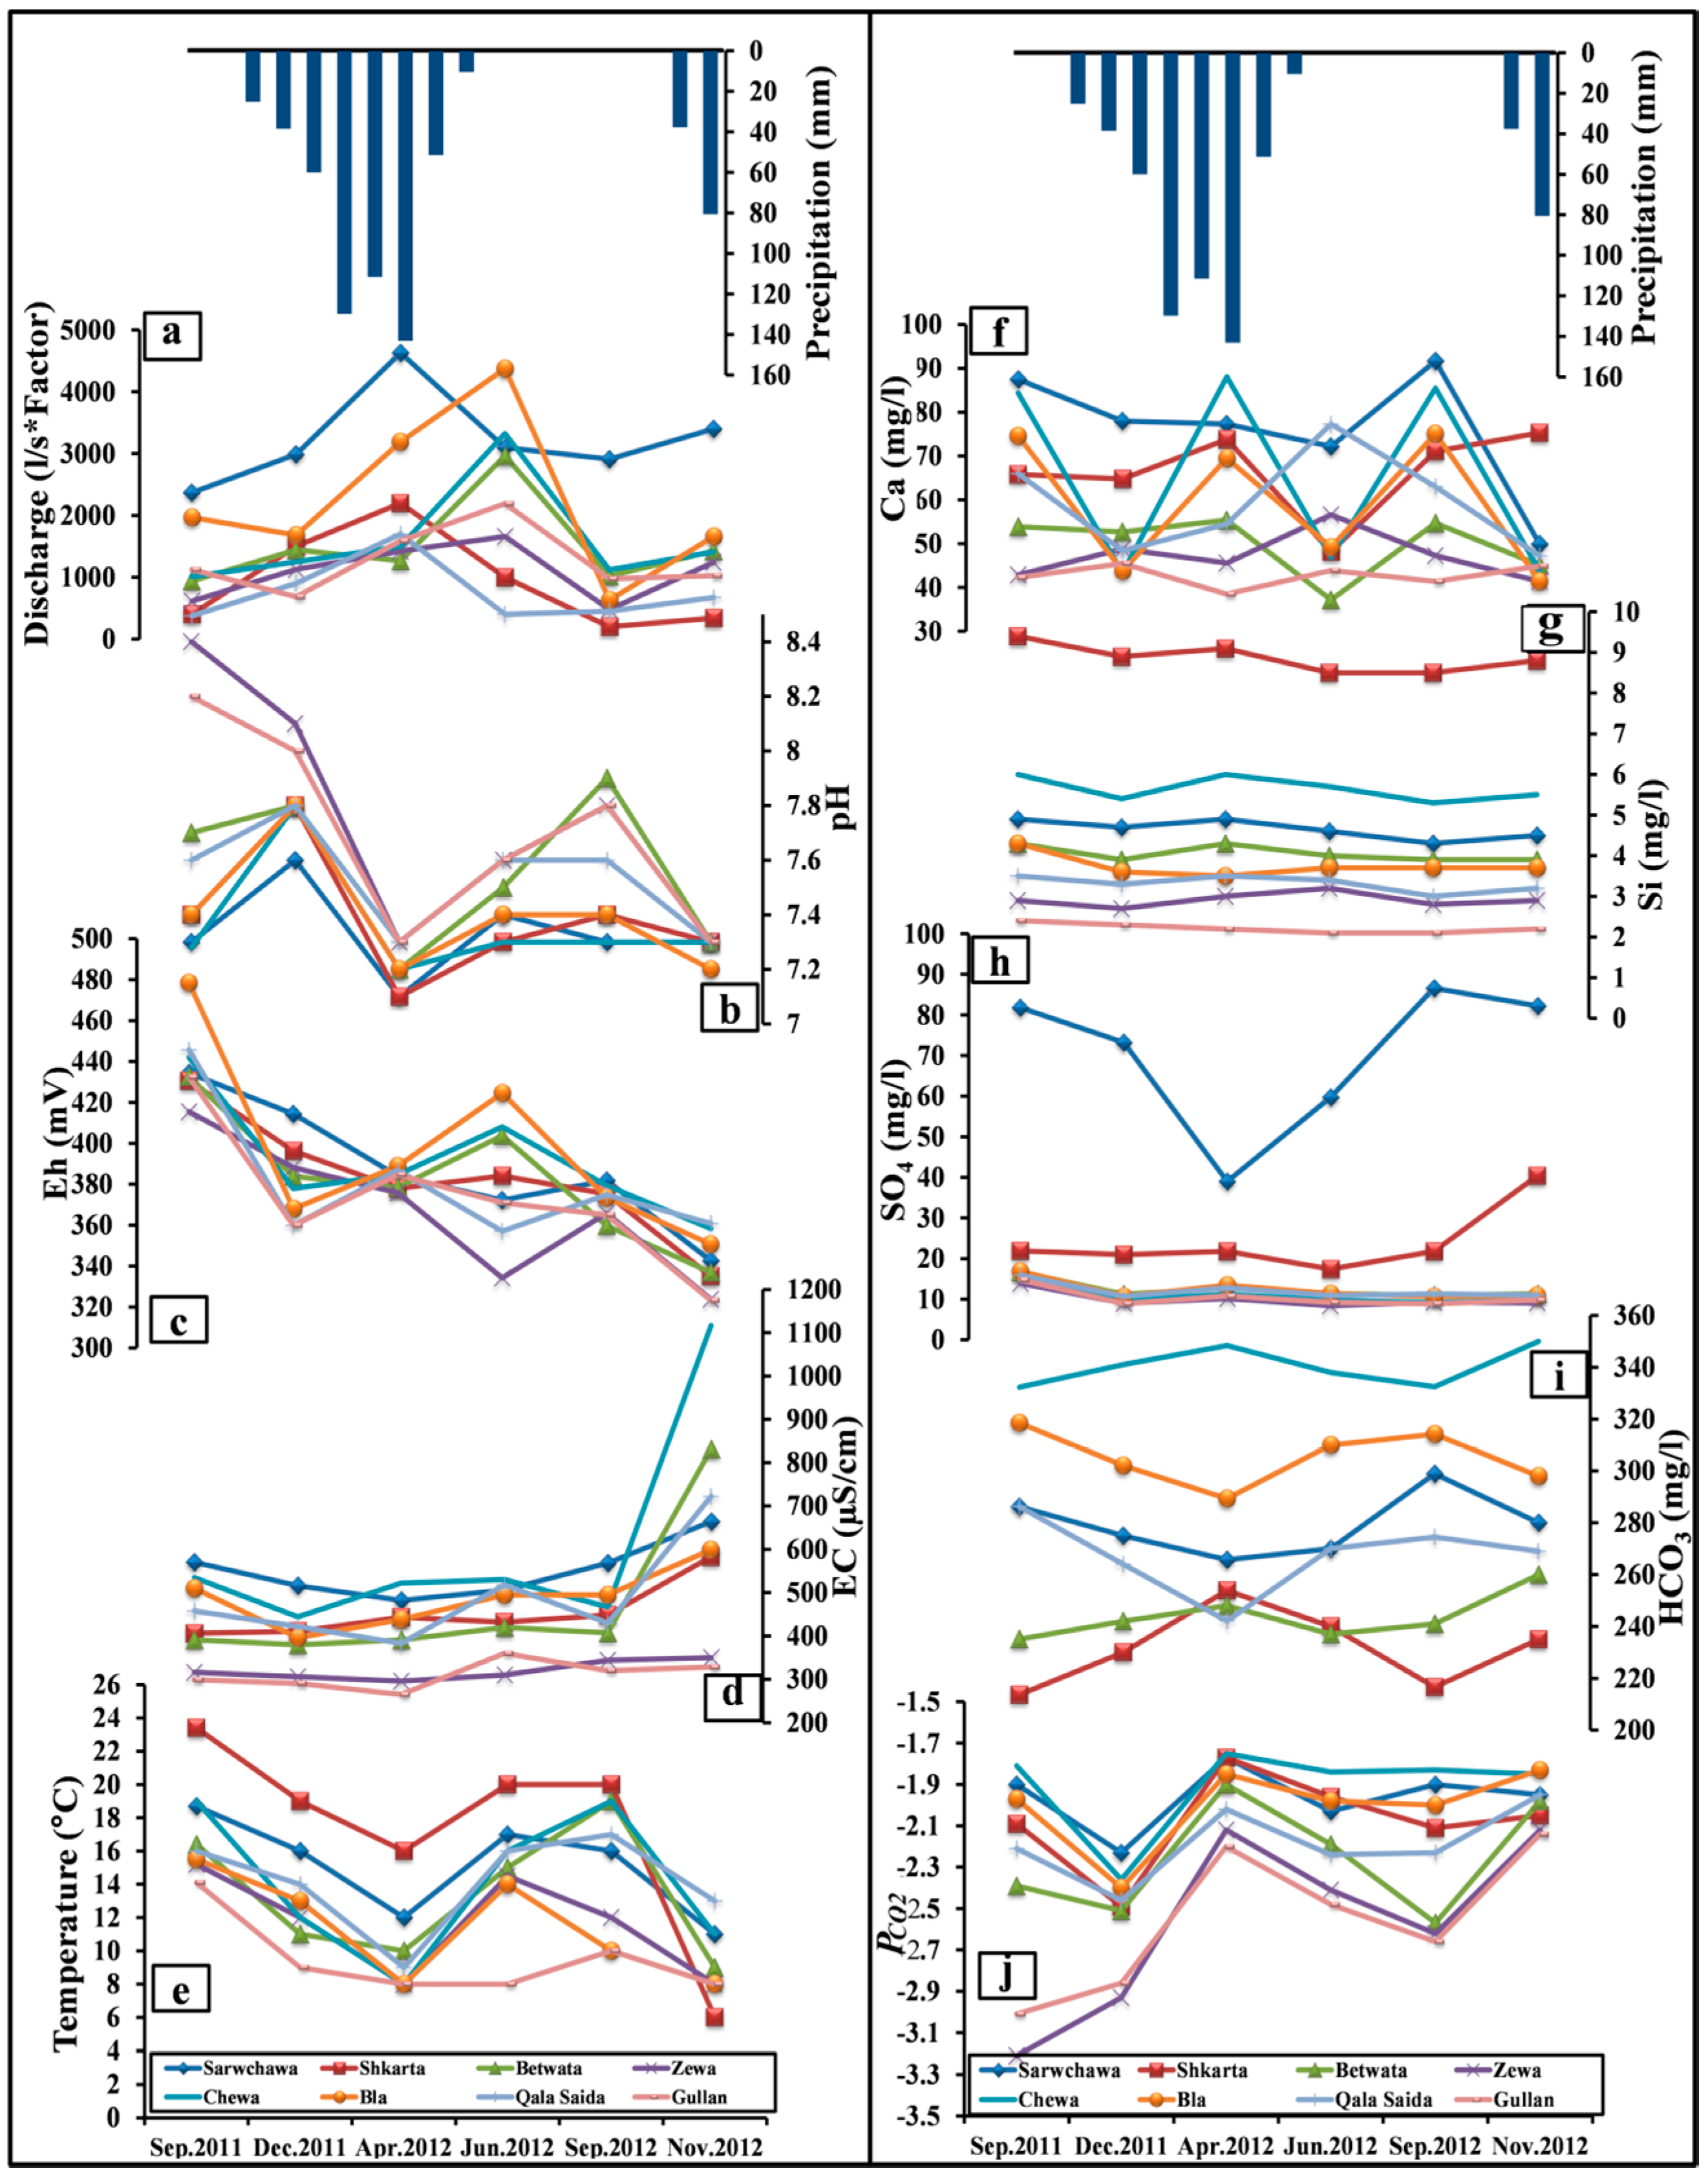
4.2. Springs Hydro-Chemograph Analysis

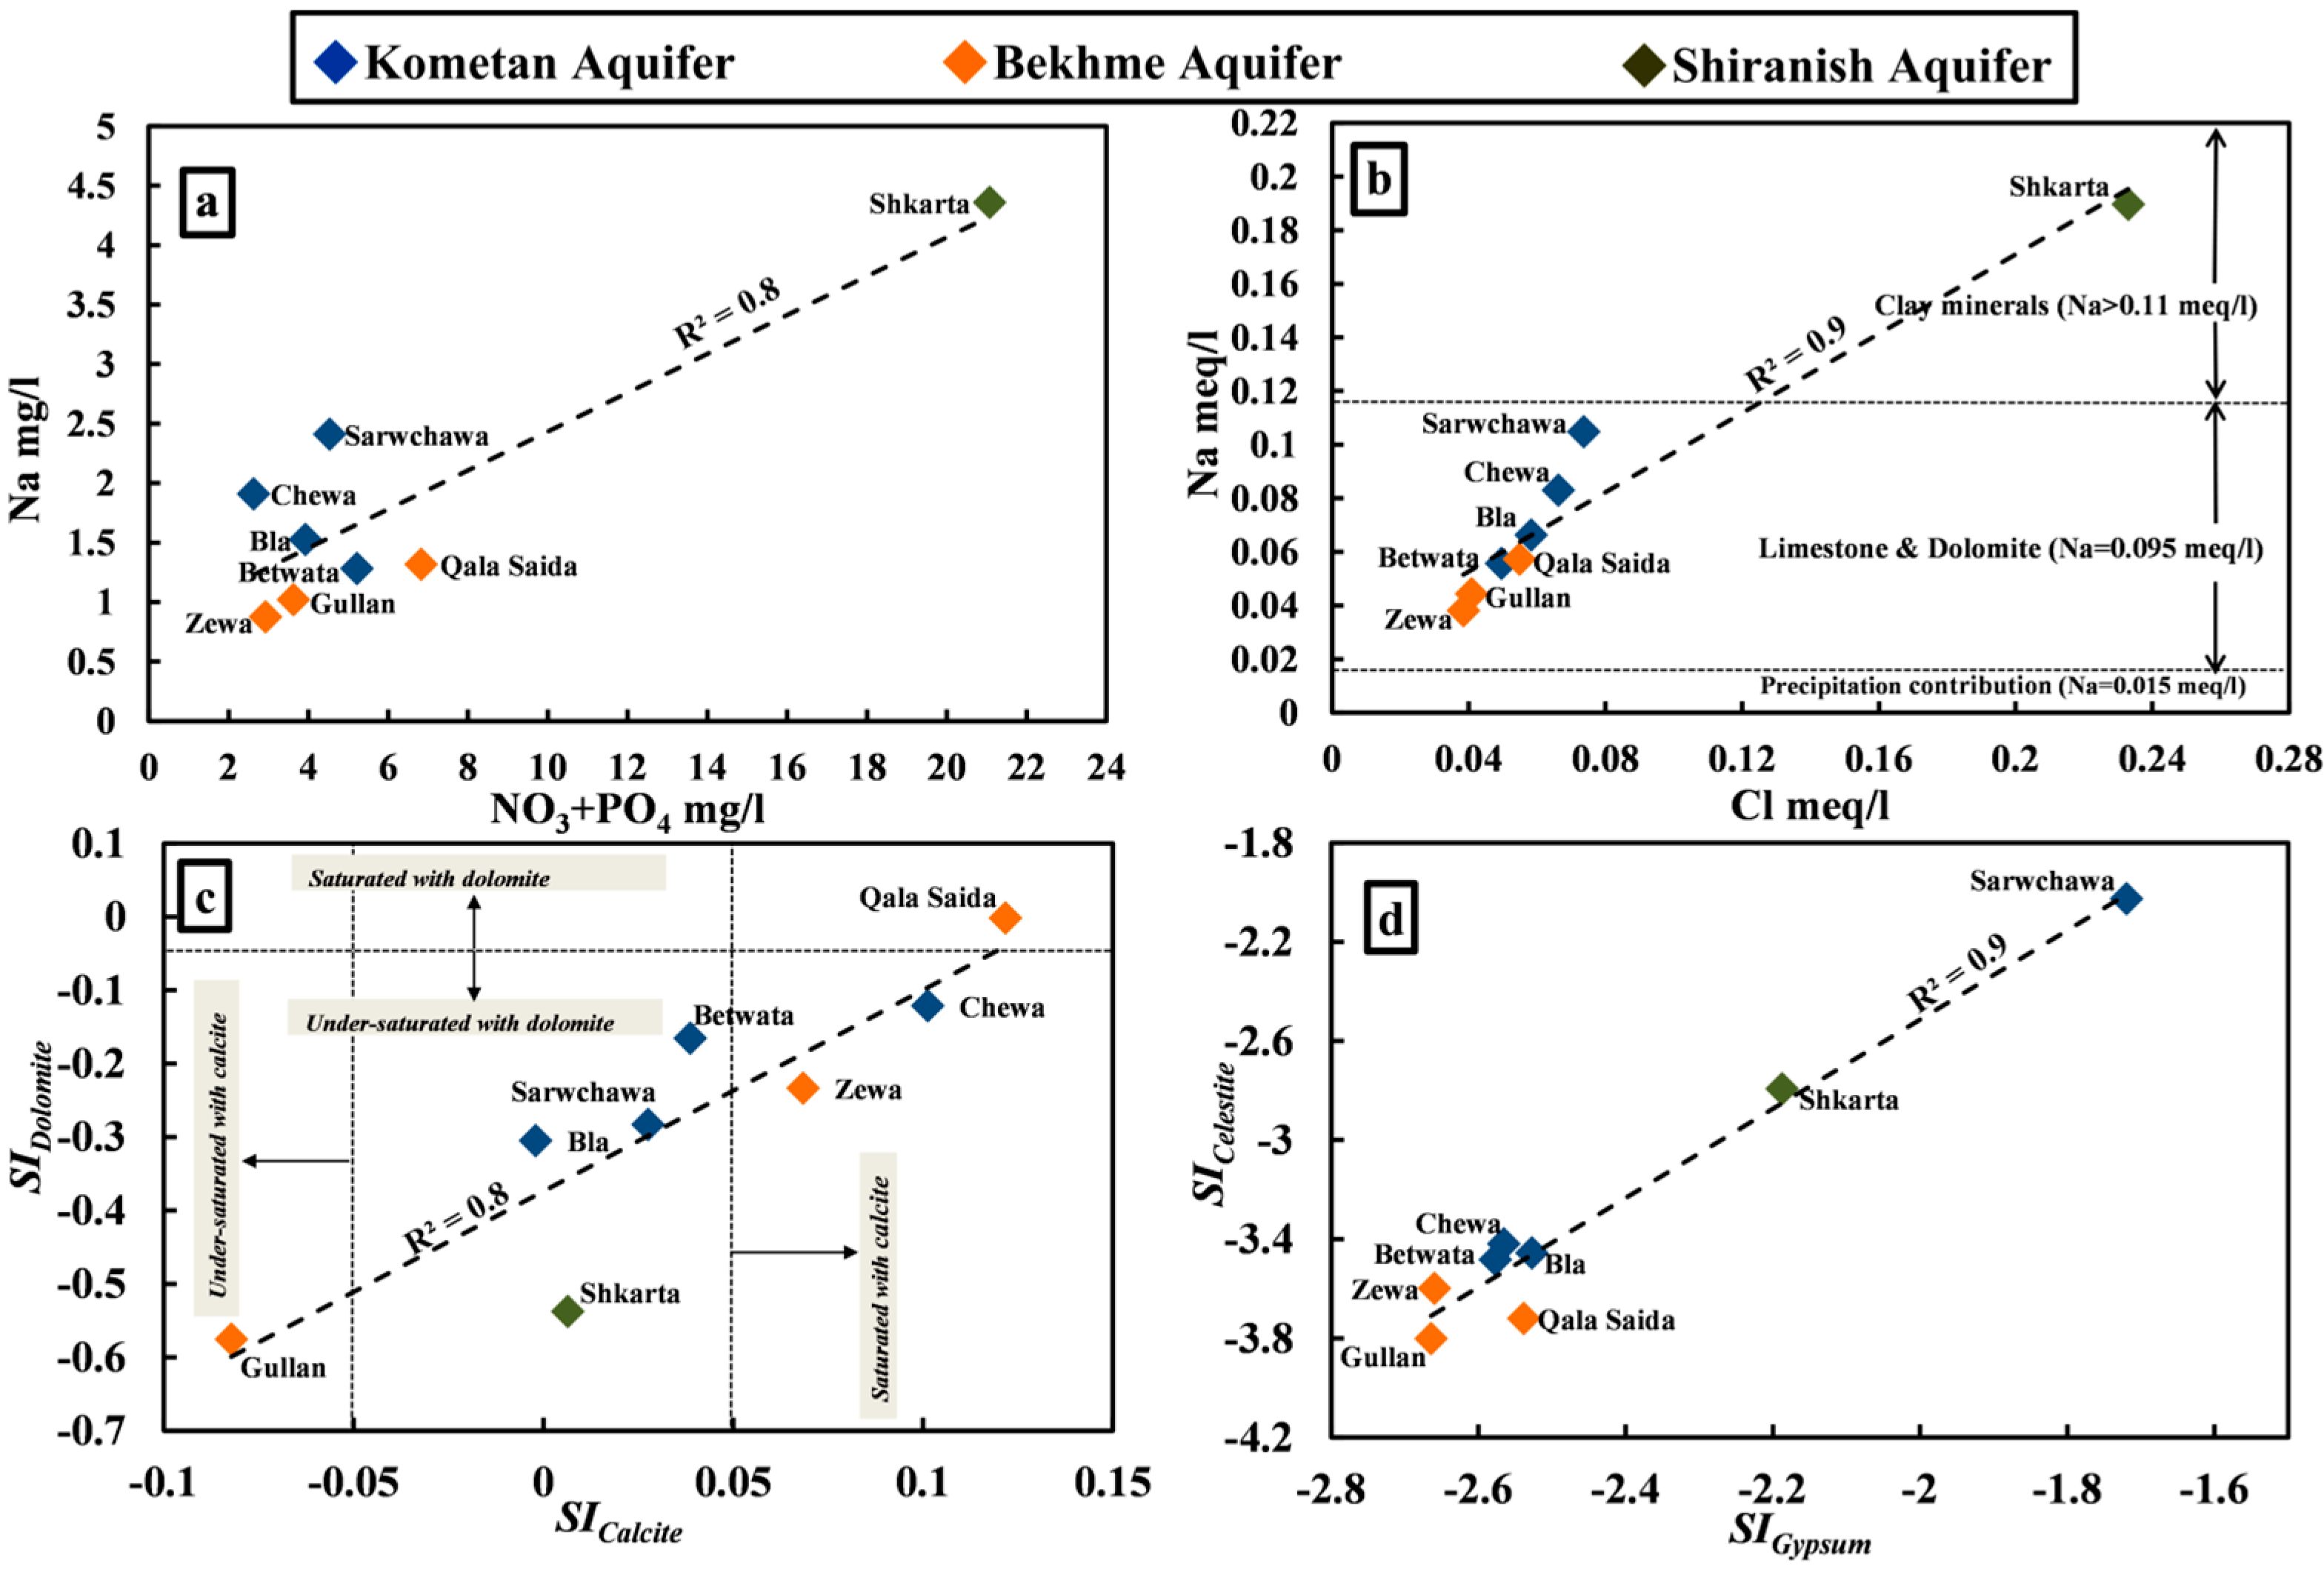
4.3. Water–Rock Interaction and Geochemical Processes
4.4. Isotopes in Precipitation and Karst Springs
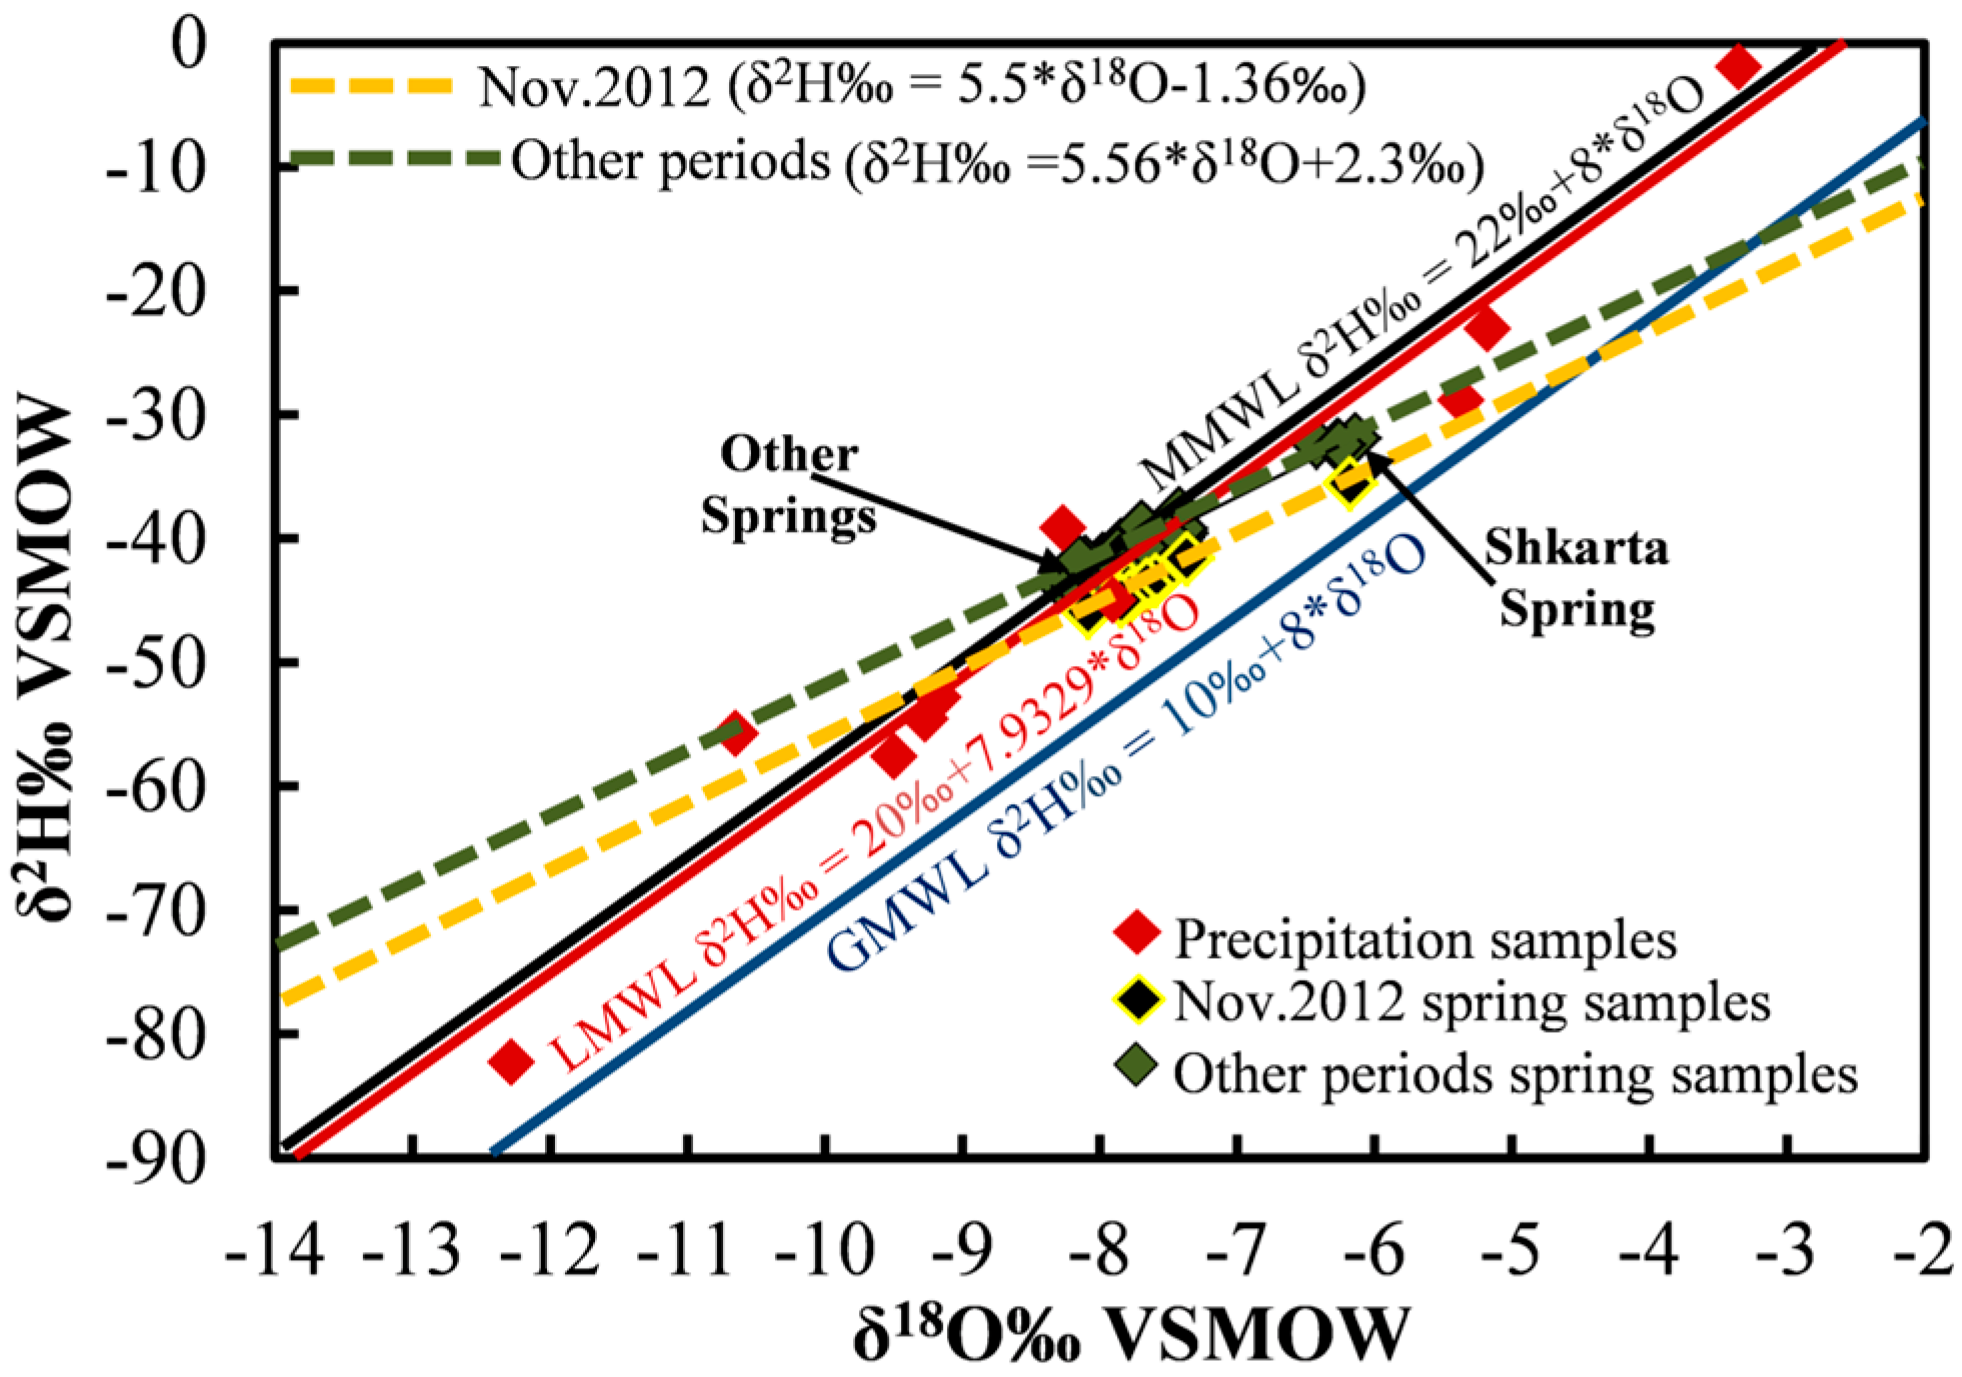
4.4.1. Development of a Local Meteoric Line
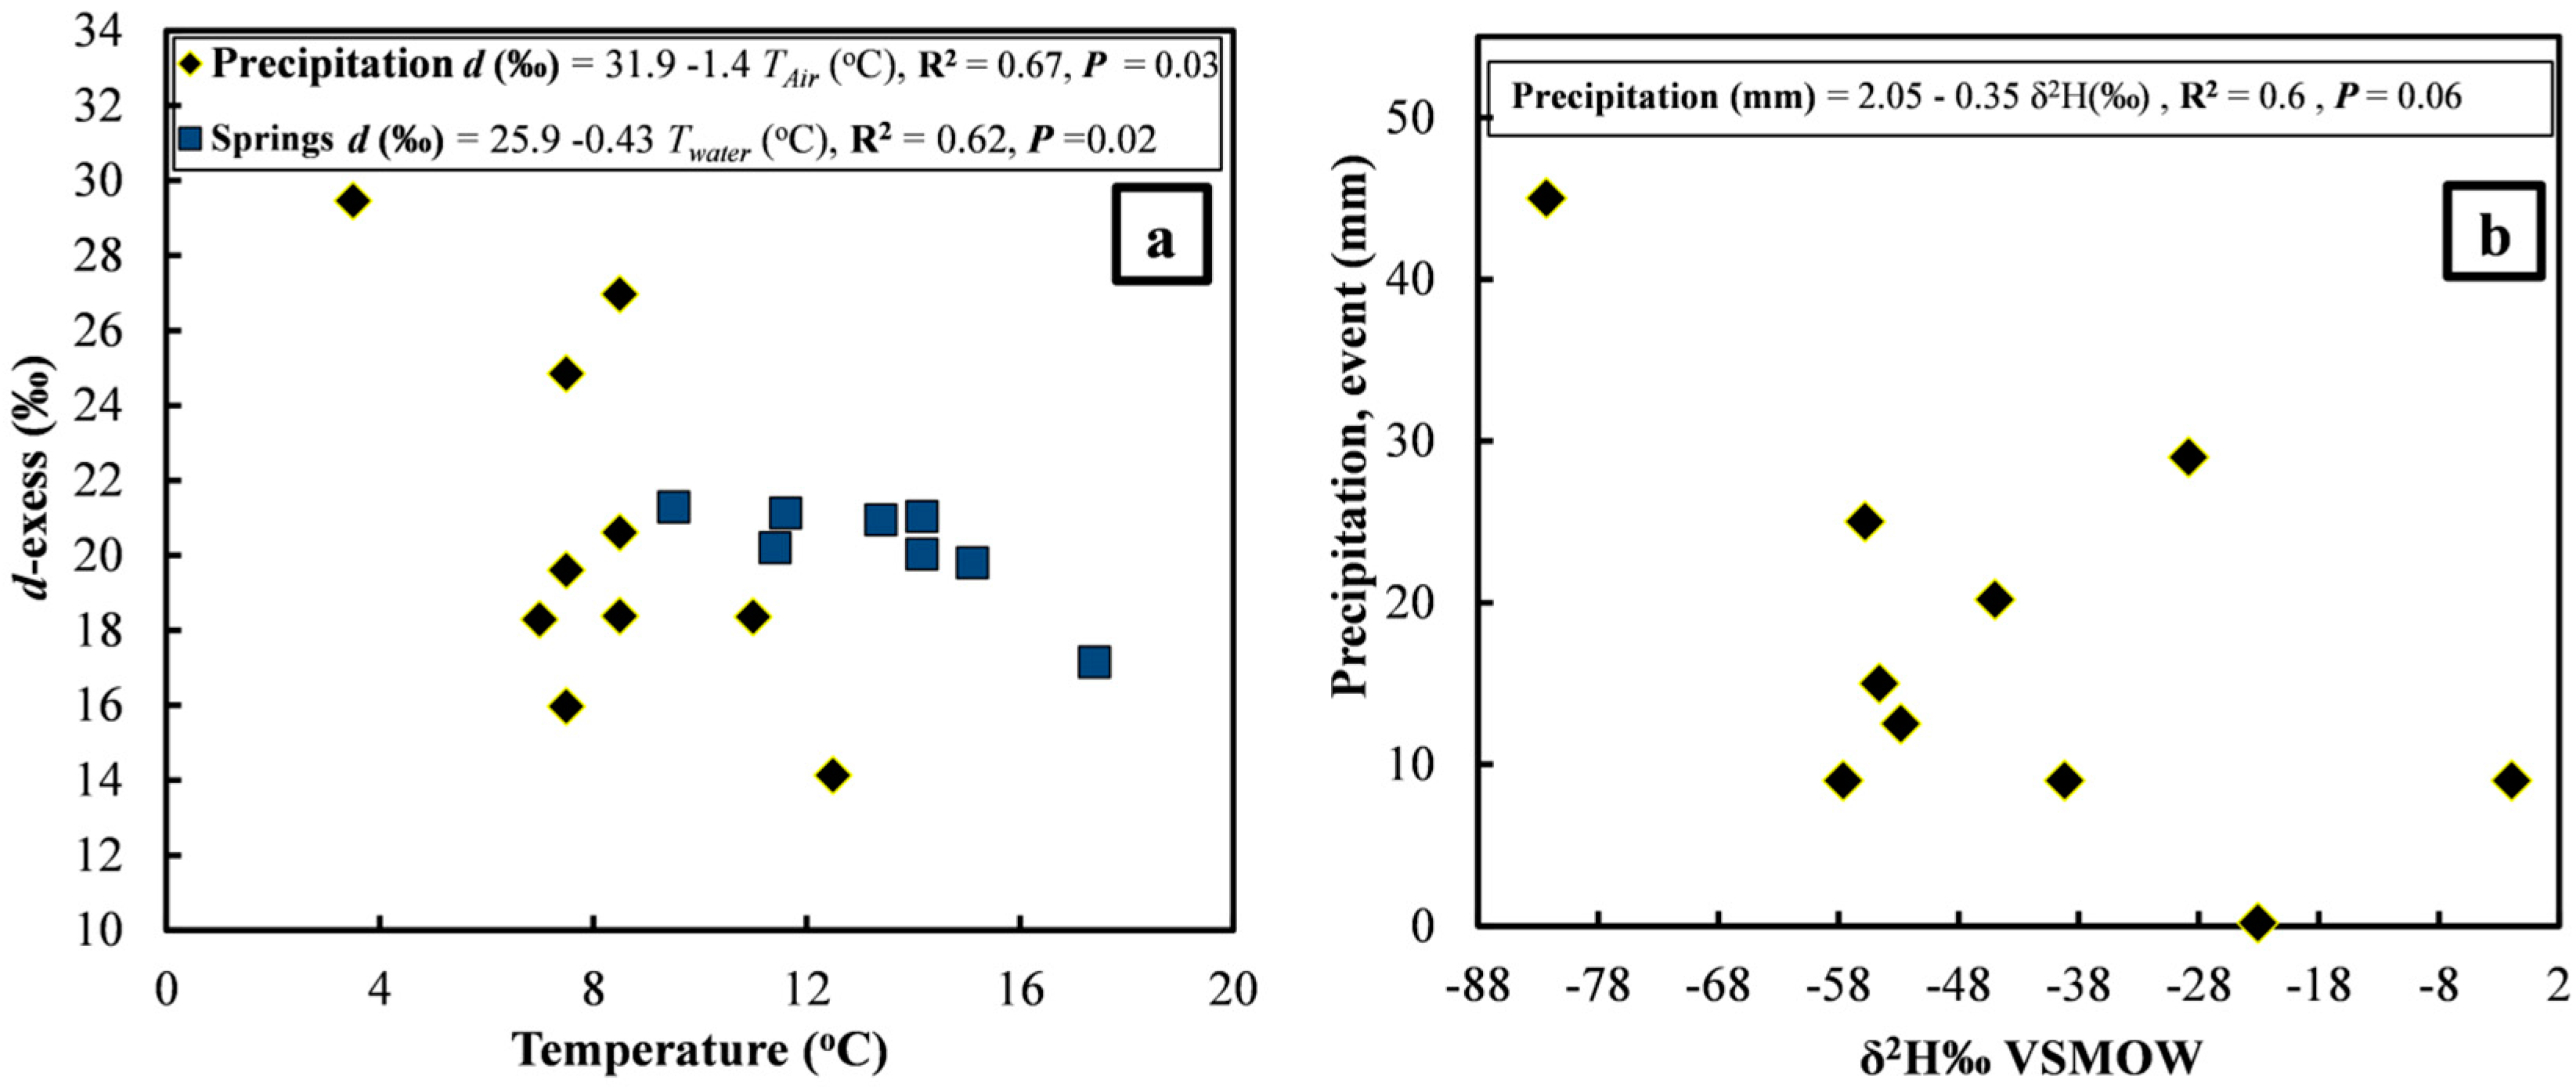
4.4.2. Factors Affecting Stable Isotopes in Precipitation
| Sample Code | δ18O ‰ | δ2H ‰ | d-Excess (Mean) ‰ | ||||||||||||
|---|---|---|---|---|---|---|---|---|---|---|---|---|---|---|---|
| 2011 | 2012 | 2011 | 2012 | ||||||||||||
| 15-Sep. | 6-Dec. | 26-Apr. | 4-Jun. | 5-Sep. | 11-Nov. | Mean ‰ | 15-Sep. | 6-Dec. | 26-Mar. | 4-Jun. | 5-Sep. | 11-Nov. | Mean ‰ | ||
| Sarwchawa (1) | −7.42 | −7.63 | −7.47 | −7.41 | −7.51 | −7.59 | −7.42 | −39.91 | −40.02 | −39.18 | −39.2 | −39.81 | −43.39 | −40.25 | 19.8 |
| Shkarta (2) | −6.27 | −6.42 | −6.26 | −6.14 | −6.26 | −6.18 | −6.25 | −32.33 | −32.35 | −32.7 | −31.9 | −32.43 | −35.57 | −32.88 | 17.1 |
| Betwata (3) | −7.8 | −7.85 | −7.68 | −7.74 | −7.73 | −7.79 | −7.77 | −40.95 | −40.42 | −40.39 | −40.92 | −40.56 | −43.87 | −41.18 | 20.9 |
| Zewa (4) | −8.29 | −7.98 | −8.07 | −8.1 | −8.19 | −8.08 | −8.12 | −43.57 | −42.79 | −43.14 | −44.03 | −43.59 | −45.93 | −43.84 | 21.1 |
| Chewa (5) | −7.67 | −7.4 | −7.91 | −7.51 | −7.69 | −7.66 | −7.64 | −40.26 | −39.57 | −41.84 | −40.38 | −40.7 | −43.75 | −41.08 | 20 |
| Bla (6) | −7.98 | −7.68 | −7.44 | −7.86 | −7.88 | −7.78 | −7.77 | −41.57 | −41.42 | −40.2 | −41.79 | −42.08 | −44.71 | −41.96 | 20.2 |
| Qala Saida (7) | −7.86 | −7.51 | −7.42 | −7.66 | −7.7 | −7.36 | −7.59 | −40.64 | −39.55 | −37.9 | −39.28 | −38.95 | −41.62 | −39.65 | 21 |
| Gullan (8) | −8.16 | −7.55 | −7.87 | −8.1 | −8.15 | −7.84 | −7.95 | −42.64 | −41.32 | −41.1 | −41.79 | −41.81 | −45.02 | −42.28 | 21.3 |
| StD | 0.05 | 0.05 | 0.06 | 0.05 | 0.08 | 0.11 | 0.07 | 0.31 | 0.33 | 0.41 | 0.33 | 0.63 | 1.16 | 0.53 | 1.6 |
4.4.3. Isotopic Pattern of the Karst Springs
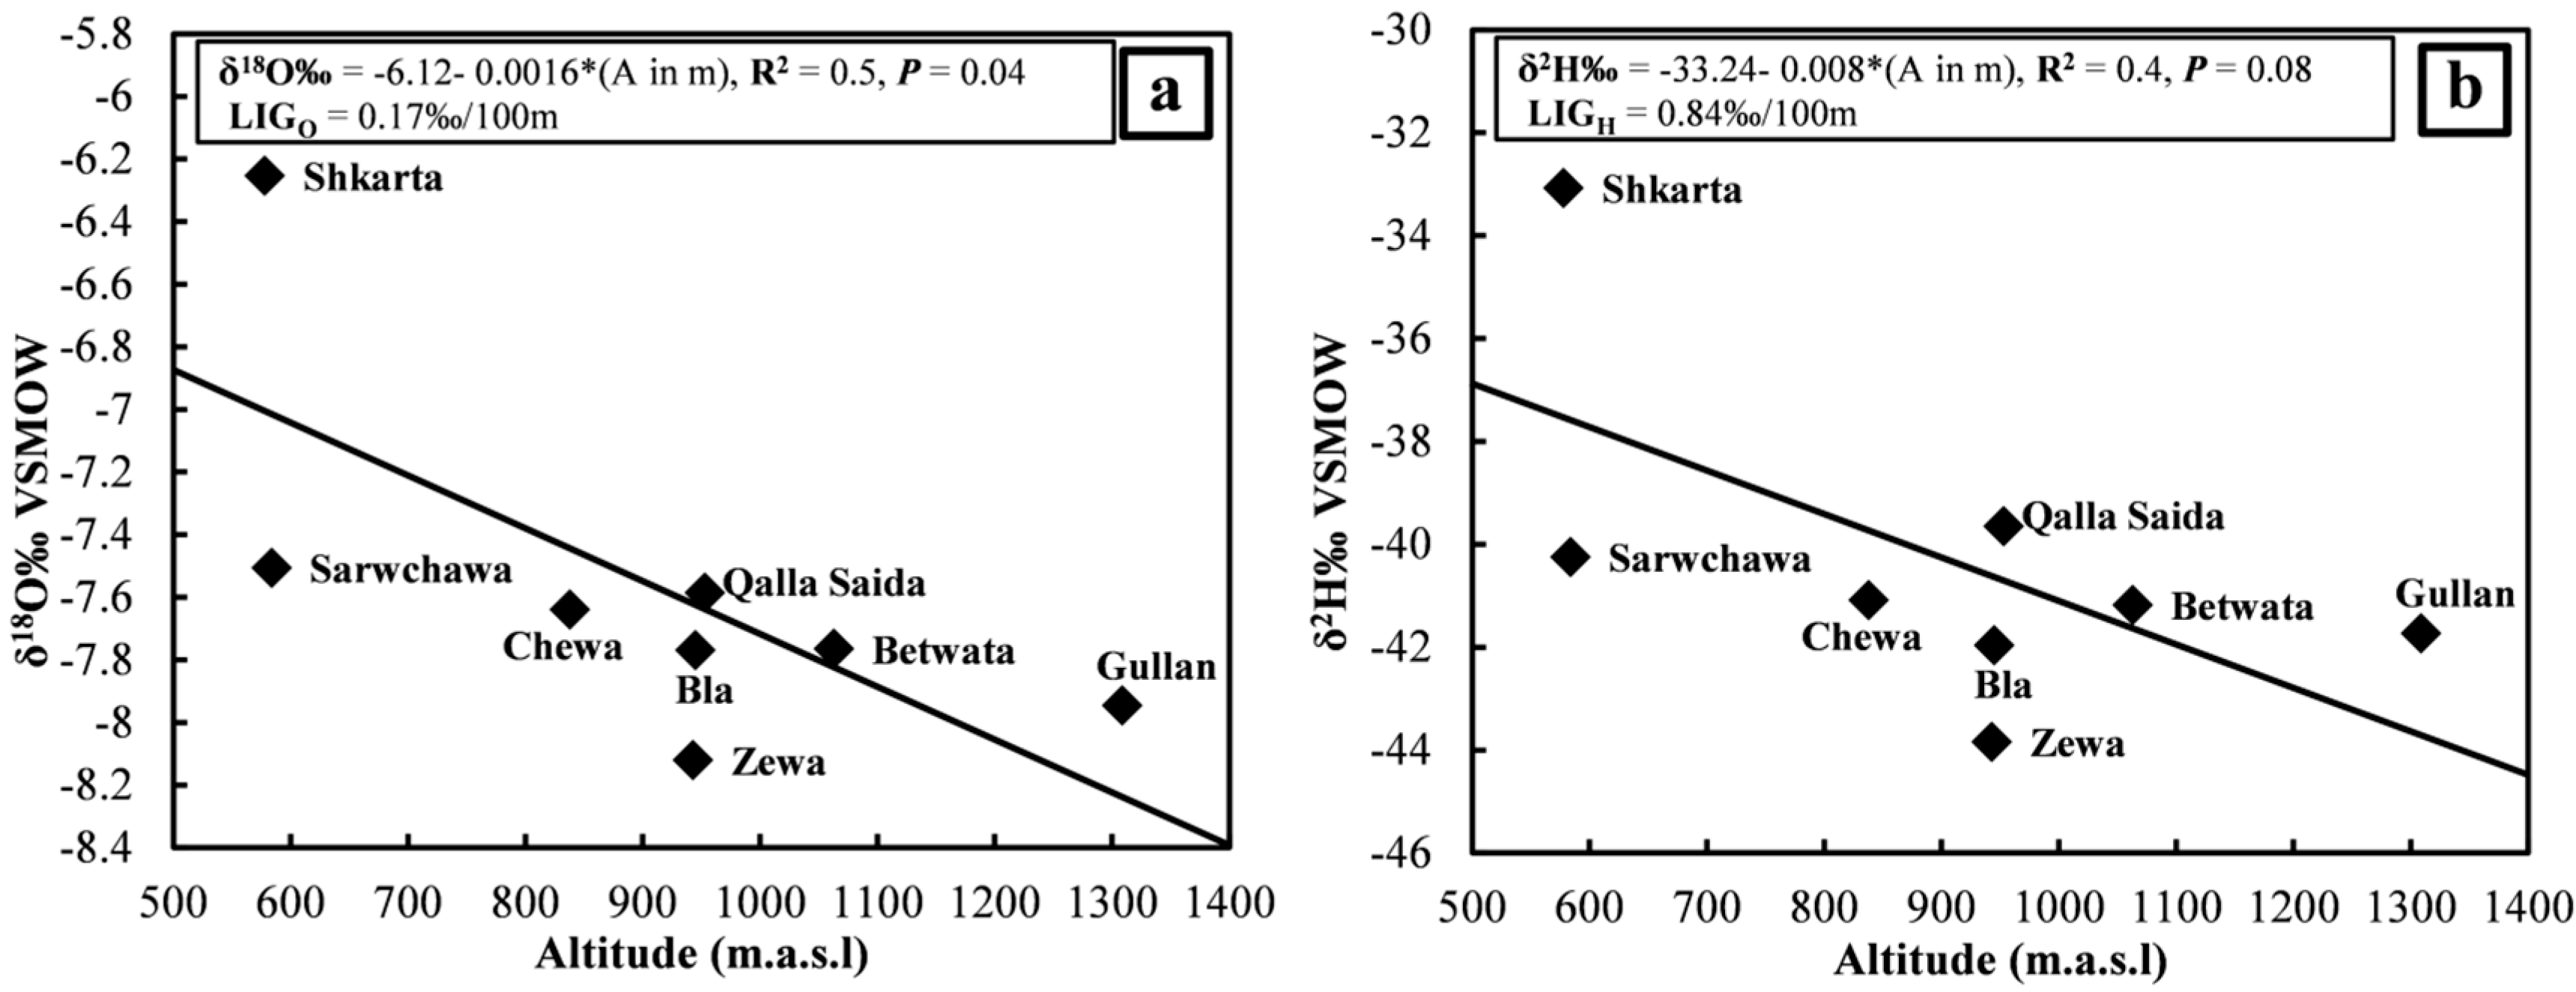
4.4.4. Altitude Effect
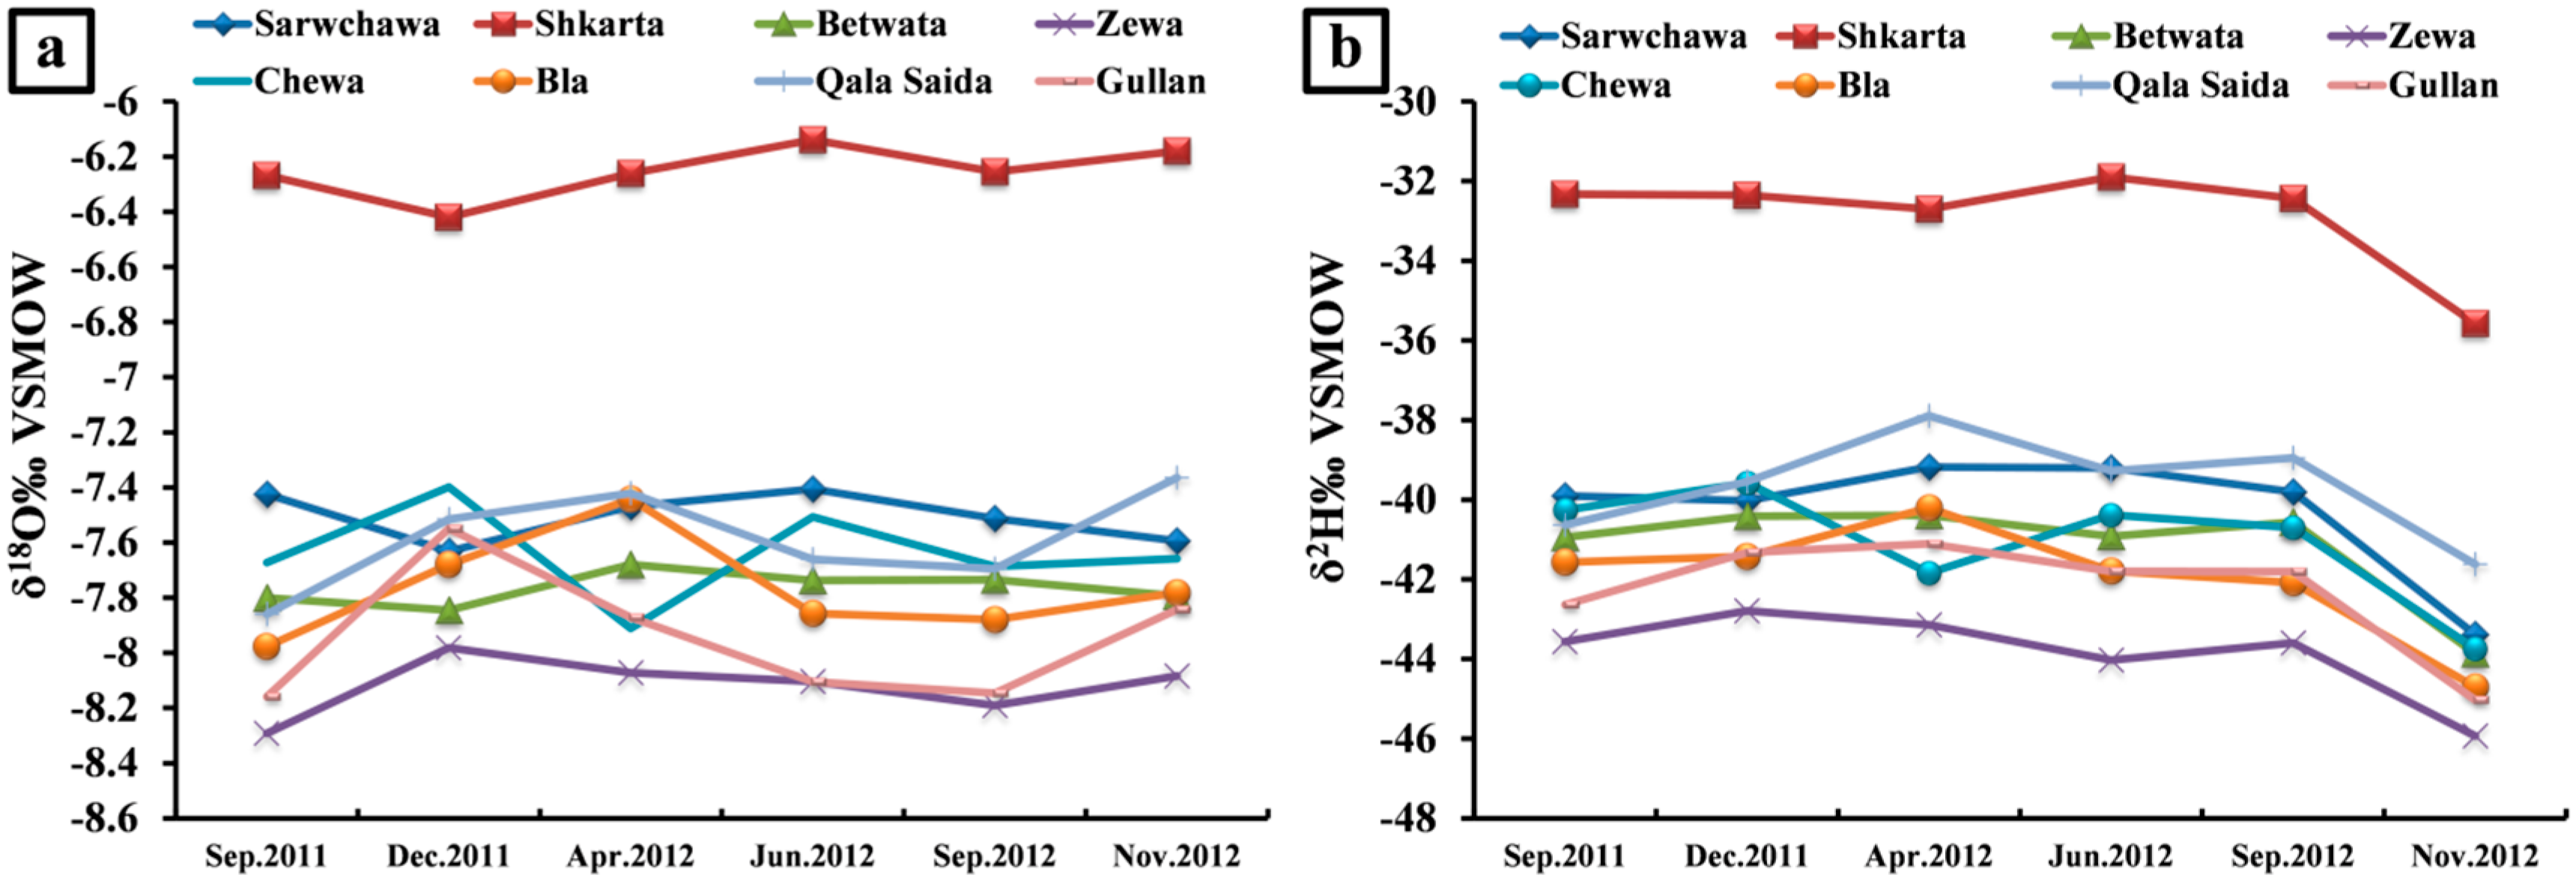
4.4.5. Temporal Variation


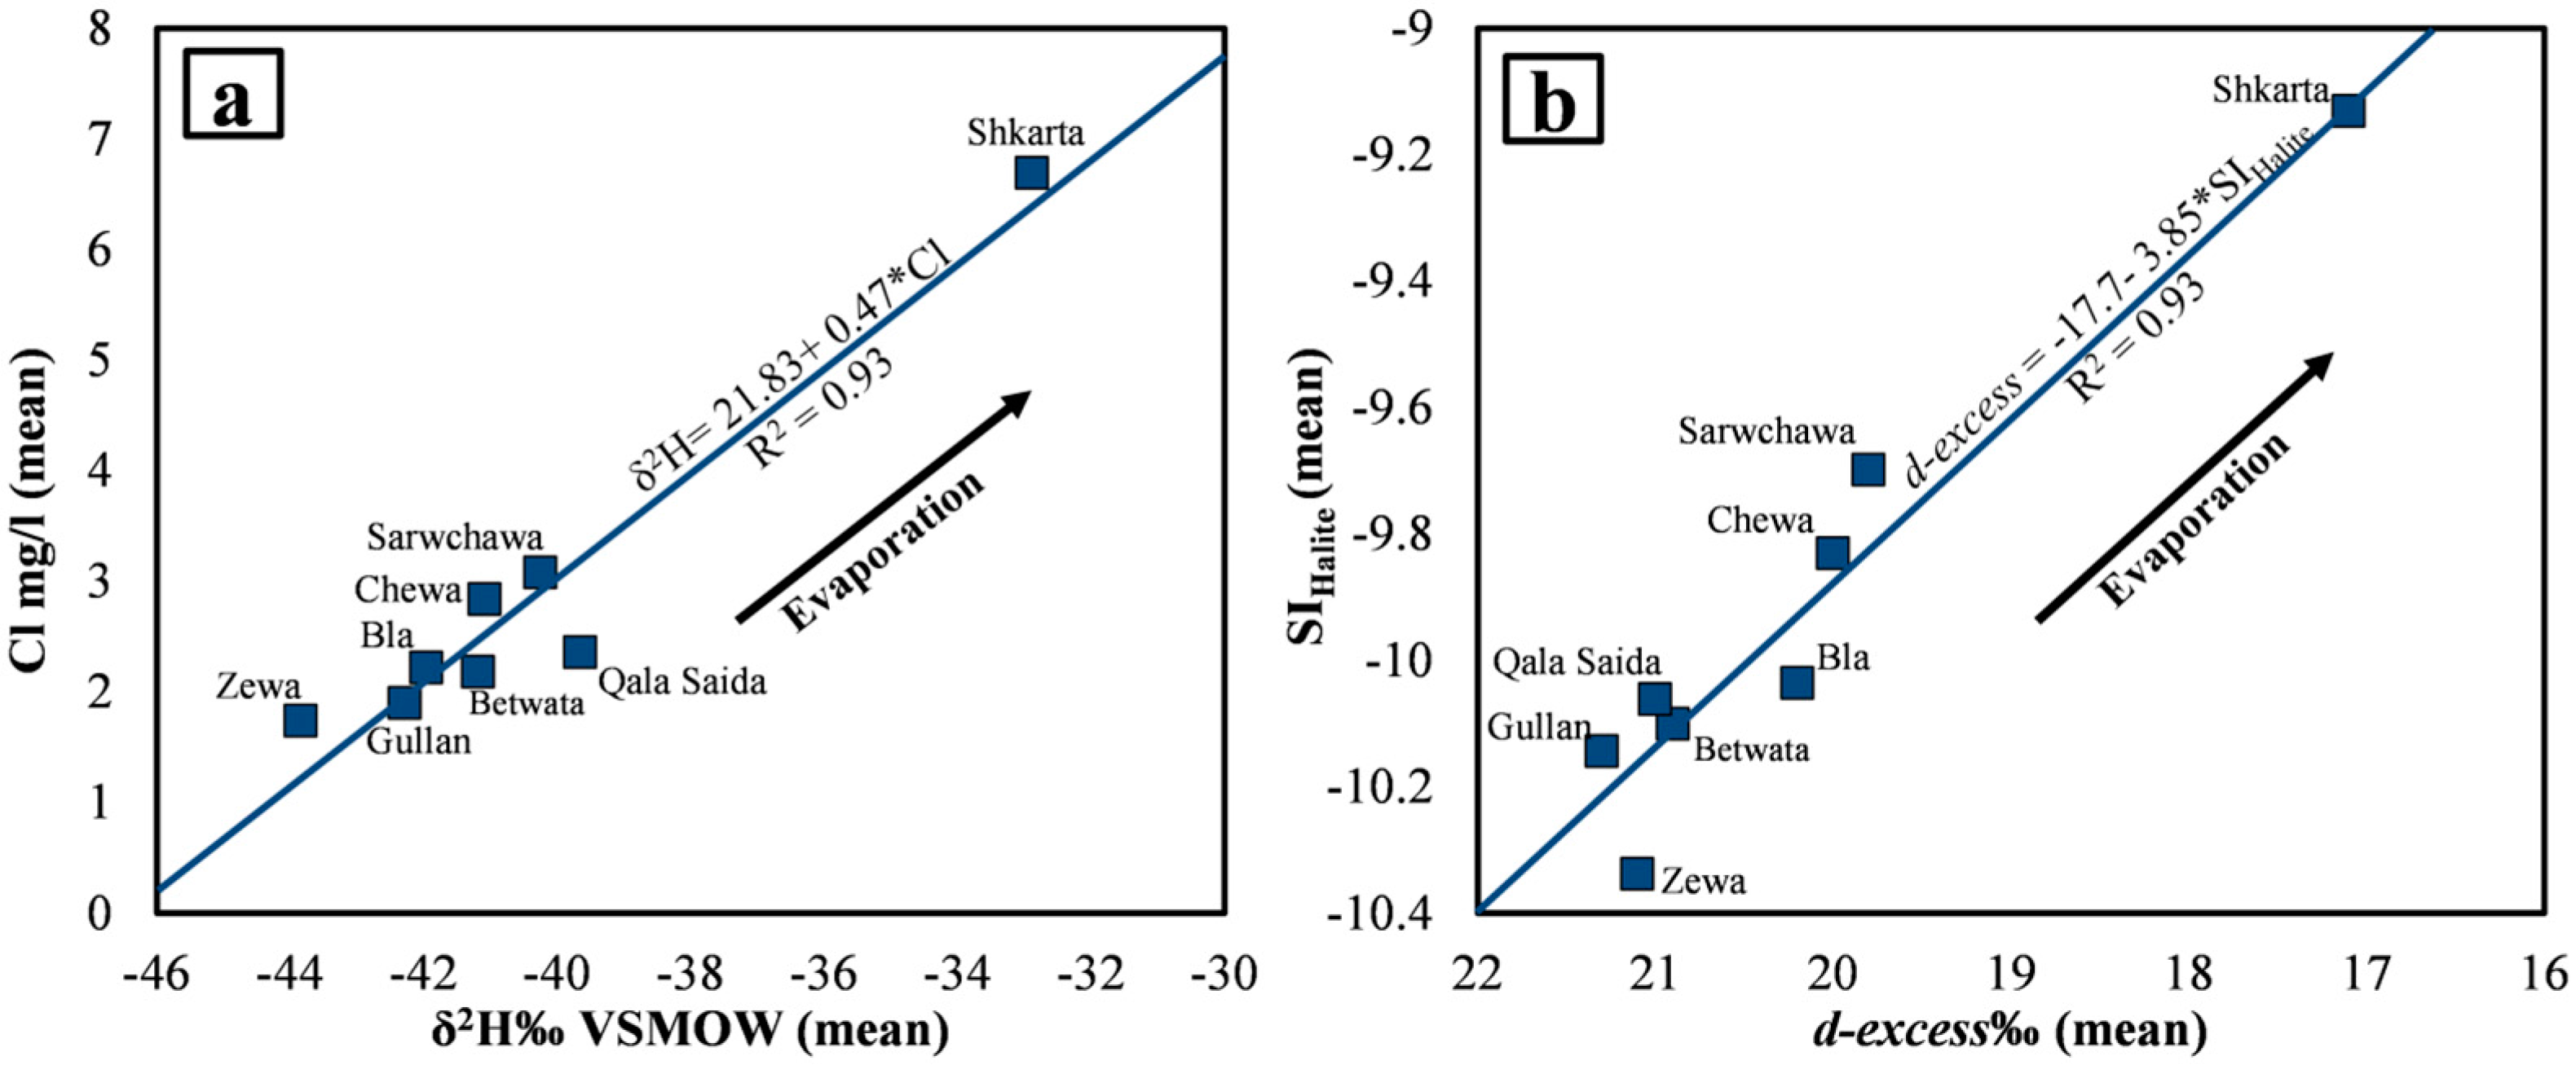
4.4.6. Factors Affecting Stable Isotopes in Spring Waters
5. Conclusions
Acknowledgments
Author Contributions
Conflict of Interest
References
- Luhmann, A.; Covington, M.; Peters, A.; Alexander, S.; Anger, C.; Green, J.; Runkel, A.C.; Alexander, E. Classification of thermal patterns at karst springs and cave streams. Ground Water 2011, 49, 324–335. [Google Scholar] [CrossRef] [PubMed]
- López-Chicano, M.; Bouamama, M.; Vallejos, A.; Pulido-Bosch, A. Factors which determine the hydrogeochemical behaviour of karstic springs. A case study from the Betic Cordilleras, Spain. Appl. Geochem. 2001, 16, 1179–1192. [Google Scholar] [CrossRef]
- Liñán Baena, C.; Andreo, B.; Mudry, J.; Carrasco, C.F. Groundwater temperature and electrical conductivity as tools to characterize flow patterns in carbonate aquifers: The Sierra de las Nieves karst aquifer, southern Spain. Hydrogeol. J. 2009, 17, 843–853. [Google Scholar]
- Mawlood, D. Application of Isotope Hydrology Studies Considering the Specific Climate, Hydrogeological and Geological Conditions in Order to Research Underground Water Resources in a Specific Area in the Near East. Ph.D. Thesis, Vienna University of Technology, Vienna, Austria, 2003. [Google Scholar]
- Hamamin, D.; Ali, S. Hydrodynamic study of karstic and intergranular aquifers using isotope geochemistry in Basara basin, Sulaimani, North-Eastern Iraq. Arab. J. Geosci. 2013, 6, 2933–2940. [Google Scholar] [CrossRef]
- Al Manmi, D. Water Resources Management in Rania Area, Sulaimaniyah NE-Iraq. Ph.D. Thesis, University of Baghdad, Baghdad, Iraq, 2008. [Google Scholar]
- Stevanovic, Z.; Marcovic, M. Hydrogeology of northern Iraq. In General Hydrogeology and Aquifer System, 1st ed.; FAO: Rome, Italy, 2004; Volume 2, pp. 42–47. [Google Scholar]
- Ministry of Transportation and Communication (MTC). Directorate of Meteorology and Seismology; Kurdistan Regional Government: Sulaimani, KR, Iraq, 2012.
- Jassim, S.Z.; Goff, J.C. Geology of Iraq, 1st ed.; Dolin, Prague and Moravian Museum: Prague, Czech Republic, 2006. [Google Scholar]
- Bellen, R.C.; Dunnington, H.V.; Wetzel, R.; Morton, D.M.; Dubertret, L. Stratigraphic Lexicon of Iraq; Gulf PetroLink: Manama, Bahrain, 2005. [Google Scholar]
- Karim, K.H.; Al-Hamadani, R.K.; Ahmad, S.H. Relations between deep and shallow stratigraphic units of Northern Iraq during Cretaceous. Iran. J. Earth Sci. 2012, 4, 95–103. [Google Scholar]
- Sisakian, V. The Geology of Erbil and Mahabad Quadrangle Sheet NJ-38-14 and NJ-38-15, Scale 1:250 000; Iraq Geological Survey: Baghdad, Iraq, 1998. [Google Scholar]
- Stevanovic, Z.; Iurkiewicz, A.; Maran, A. New insights into karst and caves of Northwestern Zagros (Northern Iraq). Acta Carsol. 2009, 38, 83–96. [Google Scholar]
- APHA. Standard Methods for the Examination of Water and Wastewater, 20th ed.; American Public Health Association: Washington, DC, USA, 1998. [Google Scholar]
- Parkhurst, D.; Appelo, C. Description of Input and Examples for PHREEQC (Version 3)-A Computer Program for Speciation, Batch-Reaction, One-Dimensional Transport, and Inverse Geochemical Calculations. Available online: http://pubs.usgs.gov/tm/06/a43/pdf/tm6-A43.pdf (accessed on 12 March 2015).
- Bonacci, O. Analysis of the maximum discharge of karst springs. Hydrogeol. J. 2001, 9, 328–338. [Google Scholar] [CrossRef]
- Wood, W. Use and misuse of the chloride-mass balance method in estimating ground water recharge. Ground Water 1999, 37, 2–3. [Google Scholar] [CrossRef]
- Scanlon, R.; Healy, W.; Cook, G. Choosing appropriate techniques for quantifying groundwater recharge. Hydrogeol. J. 2002, 10, 18–39. [Google Scholar] [CrossRef]
- Bazuhair, S.; Wood, W. Chloride mass-balance method for estimating groundwater recharge in arid areas: Examples from western Saudi Arabia. J. Hydrol. 1996, 186, 153–159. [Google Scholar] [CrossRef]
- Marei, A.; Khayat, S.; Weise, S.; Ghannam, S.; Sbaih, M.; Geyer, S. Estimating groundwater recharge using the chloride mass-balance method in the West Bank, Palestine. Hydrol. Sci. J. 2010, 55, 780–791. [Google Scholar] [CrossRef]
- Kessler, H. Water Balance Investigations in the Karst Regions of Hungary; Act Coll Dubrovnik, AIHS-UNESCO: Paris, France, 1967. [Google Scholar]
- Andreo, B.; Vías, J.; Durán, J.; Jiménez, P.; López-Geta, J.; Carrasco, F. Methodology for groundwater recharge assessment in carbonate aquifers: Application to pilot sites in southern Spain. Hydrogeol. J. 2008, 16, 911–925. [Google Scholar] [CrossRef]
- Pearson, F.; Scholtis, A. Controls on the chemistry of pore water in a marl of very low permeability. In Proceedings of the 8th International Symposium on Water-Rock Interaction (WRI-8), Vladivostok, Russia, 15–19 August 1995.
- Parisi, S.; Paternoster, M.; Kohfahl, C.; Pekdeger, A.; Meyer, H.; Hubberten, H.W.; Spilotro, G.; Mongelli, G. Groundwater recharge areas of a volcanic aquifer system inferred from hydraulic, hydrogeochemical and stable isotope data: Mount Vulture, southern Italy. Hydrogeol. J. 2011, 19, 133–153. [Google Scholar] [CrossRef]
- Emblanch, C.; Zuppi, G.; Mudry, J.; Blavoux, B.; Batiot, C. Carbon 13 of TIDC to quantify the role of the unsaturated zone: The example of the Vaucluse karst system (southeastern France). J. Hydrol. 2003, 279, 262–274. [Google Scholar] [CrossRef]
- Guo, H.; Zhang, B.; Wang, G.; Shen, Z. Geochemical controls on arsenic and rare earth elements approximately along a groundwater flow path in the shallow aquifer of the Hetao Basin, Inner Mongolia. Chem. Geol. 2010, 270, 117–125. [Google Scholar] [CrossRef]
- Bundschuh, J. Modeling annual variations of spring and groundwater temperatures associated with shallow aquifer systems. J. Hydrol. 1993, 142, 427–444. [Google Scholar] [CrossRef]
- Anderson, M. Heat as a ground water tracer. Groundwater 2005, 43, 951–968. [Google Scholar] [CrossRef]
- Vesper, D.; White, W. Storm pulse chemographs of saturation index and carbon dioxide pressure: implications for shifting recharge sources during storm events in the karst aquifer at Fort Campbell, Kentucky/Tennessee, USA. Hydrogeol. J. 2004, 12, 135–143. [Google Scholar]
- Eberts, S.; George, L. Regional Ground-Water Flow and Geochemistry in the Midwestern Basins and Arches Aquifer System in Parts of Indiana, Ohio, Michigan, and Illinois (Vol. 1423); US Geological Survey: Denver, CO, USA, 2000.
- Al Manmi, D. Chemical and Environmental Study of Groundwater in Sulaimaniyah City and Its Outskirts. Master’s Thesis, University of Baghdad, Baghdad, Iraq, 2002. [Google Scholar]
- Mustafa, O. Impact of Sewage Wastewater on the Environment of Tanjero River and Its Basin within Sulaimaniyah City, NE Iraq. Master’s Thesis, University of Baghdad, Baghdad, Iraq, 2007. [Google Scholar]
- Shuster, E.; White, W. Seasonal fluctuations in the chemistry of lime-stone springs: A possible means for characterizing carbonate aquifers. J. Hydrol. 1971, 14, 93–128. [Google Scholar] [CrossRef]
- Jacobson, R.; Langmuir, D. Controls on the quality variations of some carbonate spring waters. J. Hydrol. 1974, 23, 247–265. [Google Scholar] [CrossRef]
- Raeisi, E.; Karami, G. Hydrochemographs of Berghan karst spring as indicators of aquifer characteristics. J. Cave Karst Stud. 1997, 59, 112–118. [Google Scholar]
- Delbart, C.; Barbecot, F.; Valdes, D.; Tognelli, A.; Fourre, E.; Purtschert; Couchoux, R.; Jean-Baptiste, P. Investigation of young water inflow in karst aquifers using SF6-CFC-3H/He-85Kr-39Ar and stable isotope components. Appl. Geochem. 2014, 50, 164–176. [Google Scholar] [CrossRef]
- Drever, J. The geochemistry of natural waters. In Surface and Groundwater Environments, 3rd ed.; Prentice Hall: Upper Saddle River, NJ, USA, 1997; p. 436. [Google Scholar]
- Chadha, D. A proposed new diagram for geochemical classification of natural waters and interpretation of chemical data. Hydrogeol. J. 1999, 7, 431–439. [Google Scholar] [CrossRef]
- Han, D.M.; Liang, X.; Jin, M.G.; Currell, M.J.; Song, X.F.; Liu, C.M. Evaluation of groundwater hydrochemical characteristics and mixing behavior in the Daying and Qicun geothermal systems, Xinzhou Basin. J. Volcanol. Geotherm. Res. 2010, 189, 92–104. [Google Scholar] [CrossRef]
- Pavlovskiy, I.; Selle, B. Integrating hydrogeochemical, hydrogeological, and environmental tracer data to understand groundwater flow for a karstified aquifer system. Groundwater 2014. [Google Scholar] [CrossRef]
- Caetano Bicalho, C.; Batiot-Guilhe, C.; Seidel, L.; van Exter, S.; Jourde, H. Geochemical evidence of water source characterization and hydrodynamic responses in a karst aquifer. J. Hydrol. 2012, 450–451, 206–218. [Google Scholar] [CrossRef]
- Craig, H. Isotopic variations in meteoric waters. Science 1961, 133, 1702–1703. [Google Scholar] [CrossRef] [PubMed]
- Gat, J.R.; Carmi, I. Evolution of the isotopic composition of atmospheric waters in the Mediterranean Sea area. J. Geophys. Res. 1970, 75, 3039–3048. [Google Scholar] [CrossRef]
- Florea, L.J.; McGee, D.K. Isotopic and geochemical variability within shallow groundwater beneath a hardwood hammock and surface water in an adjoining slough (Everglades National Park, Florida, USA). Isot. Environ. Health Stud. 2010, 46, 190–209. [Google Scholar] [CrossRef]
- Fröhlich, K.; Gibson, J.J.; Aggarwal, P. Deuterium Excess in Precipitation and Its Climatological Significance. Available online: http://www.iaea.org/inis/collection/NCLCollectionStore/_Public/34/017/34017972.pdf (accessed on 12 March 2015).
- Pang, Z.; Kong, Y.; Fröhlich, K.; Huang, T.; Yuan, L.; Li, Z.; Wang, F. Processes affecting isotopes in precipitation of an arid region. Tellus B 2011, 63, 352–359. [Google Scholar] [CrossRef]
- Dansgaard, W. Stable isotopes in precipitation. Tellus 1964, 16, 460–468. [Google Scholar] [CrossRef]
- Hamed, Y.; Dhahri, F. Hydro-geochemical and isotopic composition of groundwater, with emphasis on sources of salinity, in the aquifer system in northwestern Tunisia. J. Afr. Earth Sci. 2013, 83, 10–24. [Google Scholar] [CrossRef]
- Appelo, C.; Postma, D. Geochemistry, Groundwater and Pollution, 2nd ed.; Balkema: New York, NY, USA, 2005; p. 683. [Google Scholar]
- Pierre, C. Isotopic evidence for the dynamic redox cycle of dissolved sulphur compounds between free and interstitial solutions in marine salt pans. Chem. Geol. 1985, 53, 191–196. [Google Scholar] [CrossRef]
- Mazor, I. Chemical and Isotopic Groundwater Hydrology, 3rd ed.; M Dekker: New York, NY, USA, 2004; p. 352. [Google Scholar]
- Dafny, E.; Burg, A.; Gvirtzman, H. Deduction of groundwater flow regime in a basaltic aquifer using geochemical and isotopic data: The Golan Heights, Israel case study. J. Hydrol. 2006, 330, 506–524. [Google Scholar] [CrossRef]
- Kattan, Z. Environmental isotope study of the major karst springs in Damascus limestone aquifer systems: Case of the Figeh and Barada springs. J. Hydrol. 1997, 193, 161–182. [Google Scholar] [CrossRef]
© 2015 by the authors; licensee MDPI, Basel, Switzerland. This article is an open access article distributed under the terms and conditions of the Creative Commons Attribution license (http://creativecommons.org/licenses/by/4.0/).
Share and Cite
Mustafa, O.; Merkel, B.; Weise, S.M. Assessment of Hydrogeochemistry and Environmental Isotopes in Karst Springs of Makook Anticline, Kurdistan Region, Iraq. Hydrology 2015, 2, 48-68. https://doi.org/10.3390/hydrology2020048
Mustafa O, Merkel B, Weise SM. Assessment of Hydrogeochemistry and Environmental Isotopes in Karst Springs of Makook Anticline, Kurdistan Region, Iraq. Hydrology. 2015; 2(2):48-68. https://doi.org/10.3390/hydrology2020048
Chicago/Turabian StyleMustafa, Omed, Broder Merkel, and Stephan M. Weise. 2015. "Assessment of Hydrogeochemistry and Environmental Isotopes in Karst Springs of Makook Anticline, Kurdistan Region, Iraq" Hydrology 2, no. 2: 48-68. https://doi.org/10.3390/hydrology2020048
APA StyleMustafa, O., Merkel, B., & Weise, S. M. (2015). Assessment of Hydrogeochemistry and Environmental Isotopes in Karst Springs of Makook Anticline, Kurdistan Region, Iraq. Hydrology, 2(2), 48-68. https://doi.org/10.3390/hydrology2020048