1. Introduction
The scientific results presented in the Sixth Assessment Report (AR6) of the Intergovernmental Panel on Climate Change [
1] allow us to state with confidence that the Earth’s atmosphere, hydrosphere, and biosphere have undergone rapid and almost ubiquitous changes. Their scales are unprecedented in many respects for many millennia, and these changes have been influenced by direct and indirect human activities. According to the World Meteorological Organization (WMO), the period 2015–2020 was the warmest six-year period on record, and 2011–2020 was the warmest decade on record [
2]. The average rate of near-surface air warming during 1976–2020 was 0.18 °C/10 years globally, and during this period alone, global near-surface air temperature increased by 0.8 °C. Air temperature increased especially rapidly in the North Polar Region, where a linear increment in the annual average air temperature was about 2.64 °C over 30 years (1991–2020) [
2]. Modern global warming, which is also clearly detectable in Russia, has some important features. The warming of the lowest layer of the troposphere over Russia is occurring most than twice as fast as the average on Earth’s land surface—0.51 °C per decade. Each decade since 1981–1990 has been warmer than the previous one, and 9 of the 10 warmest years were observed in the 21st century [
2]. The warming in Russia has occurred and continues to occur in all seasons. However, significant interdecadal fluctuations were superimposed on seasonal trends, which were/are especially clearly evident in winter (December–February), when, after rapid warming in the period from the mid-1970s to the mid-1990s, a slight cooling occurred over most of Russia. It lasted until about 2010 and was caused by changes in the atmospheric circulation of the Atlantic-European sector [
2]. Along with the noted increase in air temperature, there has been and continues to be a reduction in the duration of snow cover, observed across Russia during 1976–2020 at an average rate of 1.17 days per 10 years. However, significant descending trends were detected mainly in European Russia and also partially in Asian Russia (in the south of Western Siberia and the north of Central Siberia) [
2]. At the same time, compared with the period 1966–1990 [
3], the average linear trend coefficient of the maximum snow reserve grew from 2 cm/10 years to 6–8 cm/10 years, with the maximum rates of this change revealed in Western Siberia. In essence, the snow cover period tends to be shorter; the first snowfall occurs later, and spring snowmelt occurs earlier in most of Russia. However, the amount of snowfall has increased overall, particularly in the western part of Russia [
4].
In Russia, the phase of active climate change in the Anthropocene (a term not yet generally accepted, denoting a hypothetical new geological epoch in which the main driving force of change on Earth is human activity, influencing geological, climatic, and biotic processes since the end of World War II) coincided with significant changes in land use. Following the collapse of the former Soviet Union at the very end of 1991, Russia experienced significant degradation of agriculture. This was manifested, first of all, in the abandonment of cultivated land, a reduction in the fleet of agricultural machinery, and unprecedented changes in livestock farming. Regional characteristics and reasons for the noted changes in the post-Soviet space have been analyzed in numerous studies [
5,
6,
7,
8,
9,
10,
11,
12]. For example, according to our estimates [
5], the area of cropland in the country reduced by more than a third between 1971–1991 and 2005–2017; despite this, there has been small growth (recovery) of cropland area across the country since the mid-2000s. It has also been noted that the most significant and sustainable (beginning long before 1991) reduction in the area of cropland occurred in the administrative regions of Russia located primarily in the forest zone, which was especially evident in the European territory of the country [
5,
12]. Along with the noted reduction in cropland area, significant changes in crop rotation have also occurred [
5].
Even this brief overview of changes in climate and human activity leaves no doubt that they could be reflected in changes in the hydrosphere objects on land in Russia, primarily in the flow of river water. Moreover, the complexity of the “mechanism” of these changes, caused by the combined influence of these two noted main factors, led to different trends in the change of annual and seasonal river water flow in various physiographic regions of the country. Thus, according to [
2], during the period of active climate warming, an increase in the annual river flow occurred in Russia as a whole. However, in some rivers of the Ob River and Yenisei River basins, in the extreme northeast of Russia and in the rivers of the south of European Russia (in general, the annual runoff in European Russia has tended to rise in recent decades, associated with a general increase in the humidity of the territory [
13]), a statistically significant decline in the annual flow was found. Changes in maximum water discharges for the majority of the territory of Russia were insignificant. In recent decades, a decrease in maximum water flow has been observed in the rivers of the south and southwest of European Russia. In the basins of the lower Volga River and the Don River, as well as the south part of the Oka River basin, a decrease in maximum water discharges of 40–70% has been traced on most rivers since 1979–1983 [
2,
13,
14]. In the Don River basin and the east of the Volga River basin, the contribution of snowmelt flood water flow has reduced to 50% or less of the annual flow [
14,
15] (50% is a critical level for rivers of the Eastern European type of water regime). As a comparison, in the first half of the 20th century, the snowmelt flood flow in these basins averaged 60–70% and more of the annual values [
16,
17,
18]. These processes were accompanied by changes in the timing of the onset of floods in the rivers [
19]. It is noteworthy that in the western part of the forest (coniferous–broad-leaved) zone of the East European Plain, in the Baltic countries, there has also been a predominant reduction in flood runoff caused by snowmelt in recent decades [
20]. At the same time, the winter low-water runoff of rivers has increased significantly. For example, in the Volga River basin, the share of this runoff in the annual water runoff has increased by up to 40–60% and more in most of the basin between the periods 1946–1977 and 1978–2010 [
16]. The change in the share of summer–autumn low-water flow has also been quite significant over recent decades [
14]. In the rivers of the north of European Russia, in general, no significant changes in the intra-annual distribution of runoff were detected [
14].
From the above it follows that the trend variability of river water flow in recent decades has been subject, to one degree or another, to physiographical (landscape) zonality, following changes in climate and human activity. The East European, or Russian, Plain is one of the most extensive plains on Earth’s land and the largest natural-geographical region of Europe, being one of the best expressions of the latitudinal zonality of natural landscapes and their anthropogenic transformation. Previous studies have either avoided considering contemporary landscape-level directional changes in water flow or considered this issue for only one of its components (for example, the minimum or base water flow of the warm or cold seasons of the year). Below, using the example of small and medium-sized rivers in the east sector of the forest-steppe and steppe zones of the plain, we examine the transformations of their annual and extreme seasonal water flow (discharges) since the beginning of the 1960s and provide a preliminary and mostly qualitative assessment of some natural local factors that could affect these transformations. These transformations of river water flow in the indicated landscape zones are analyzed in a comparative context.
3. Results
3.1. Homogeneity and Stationarity
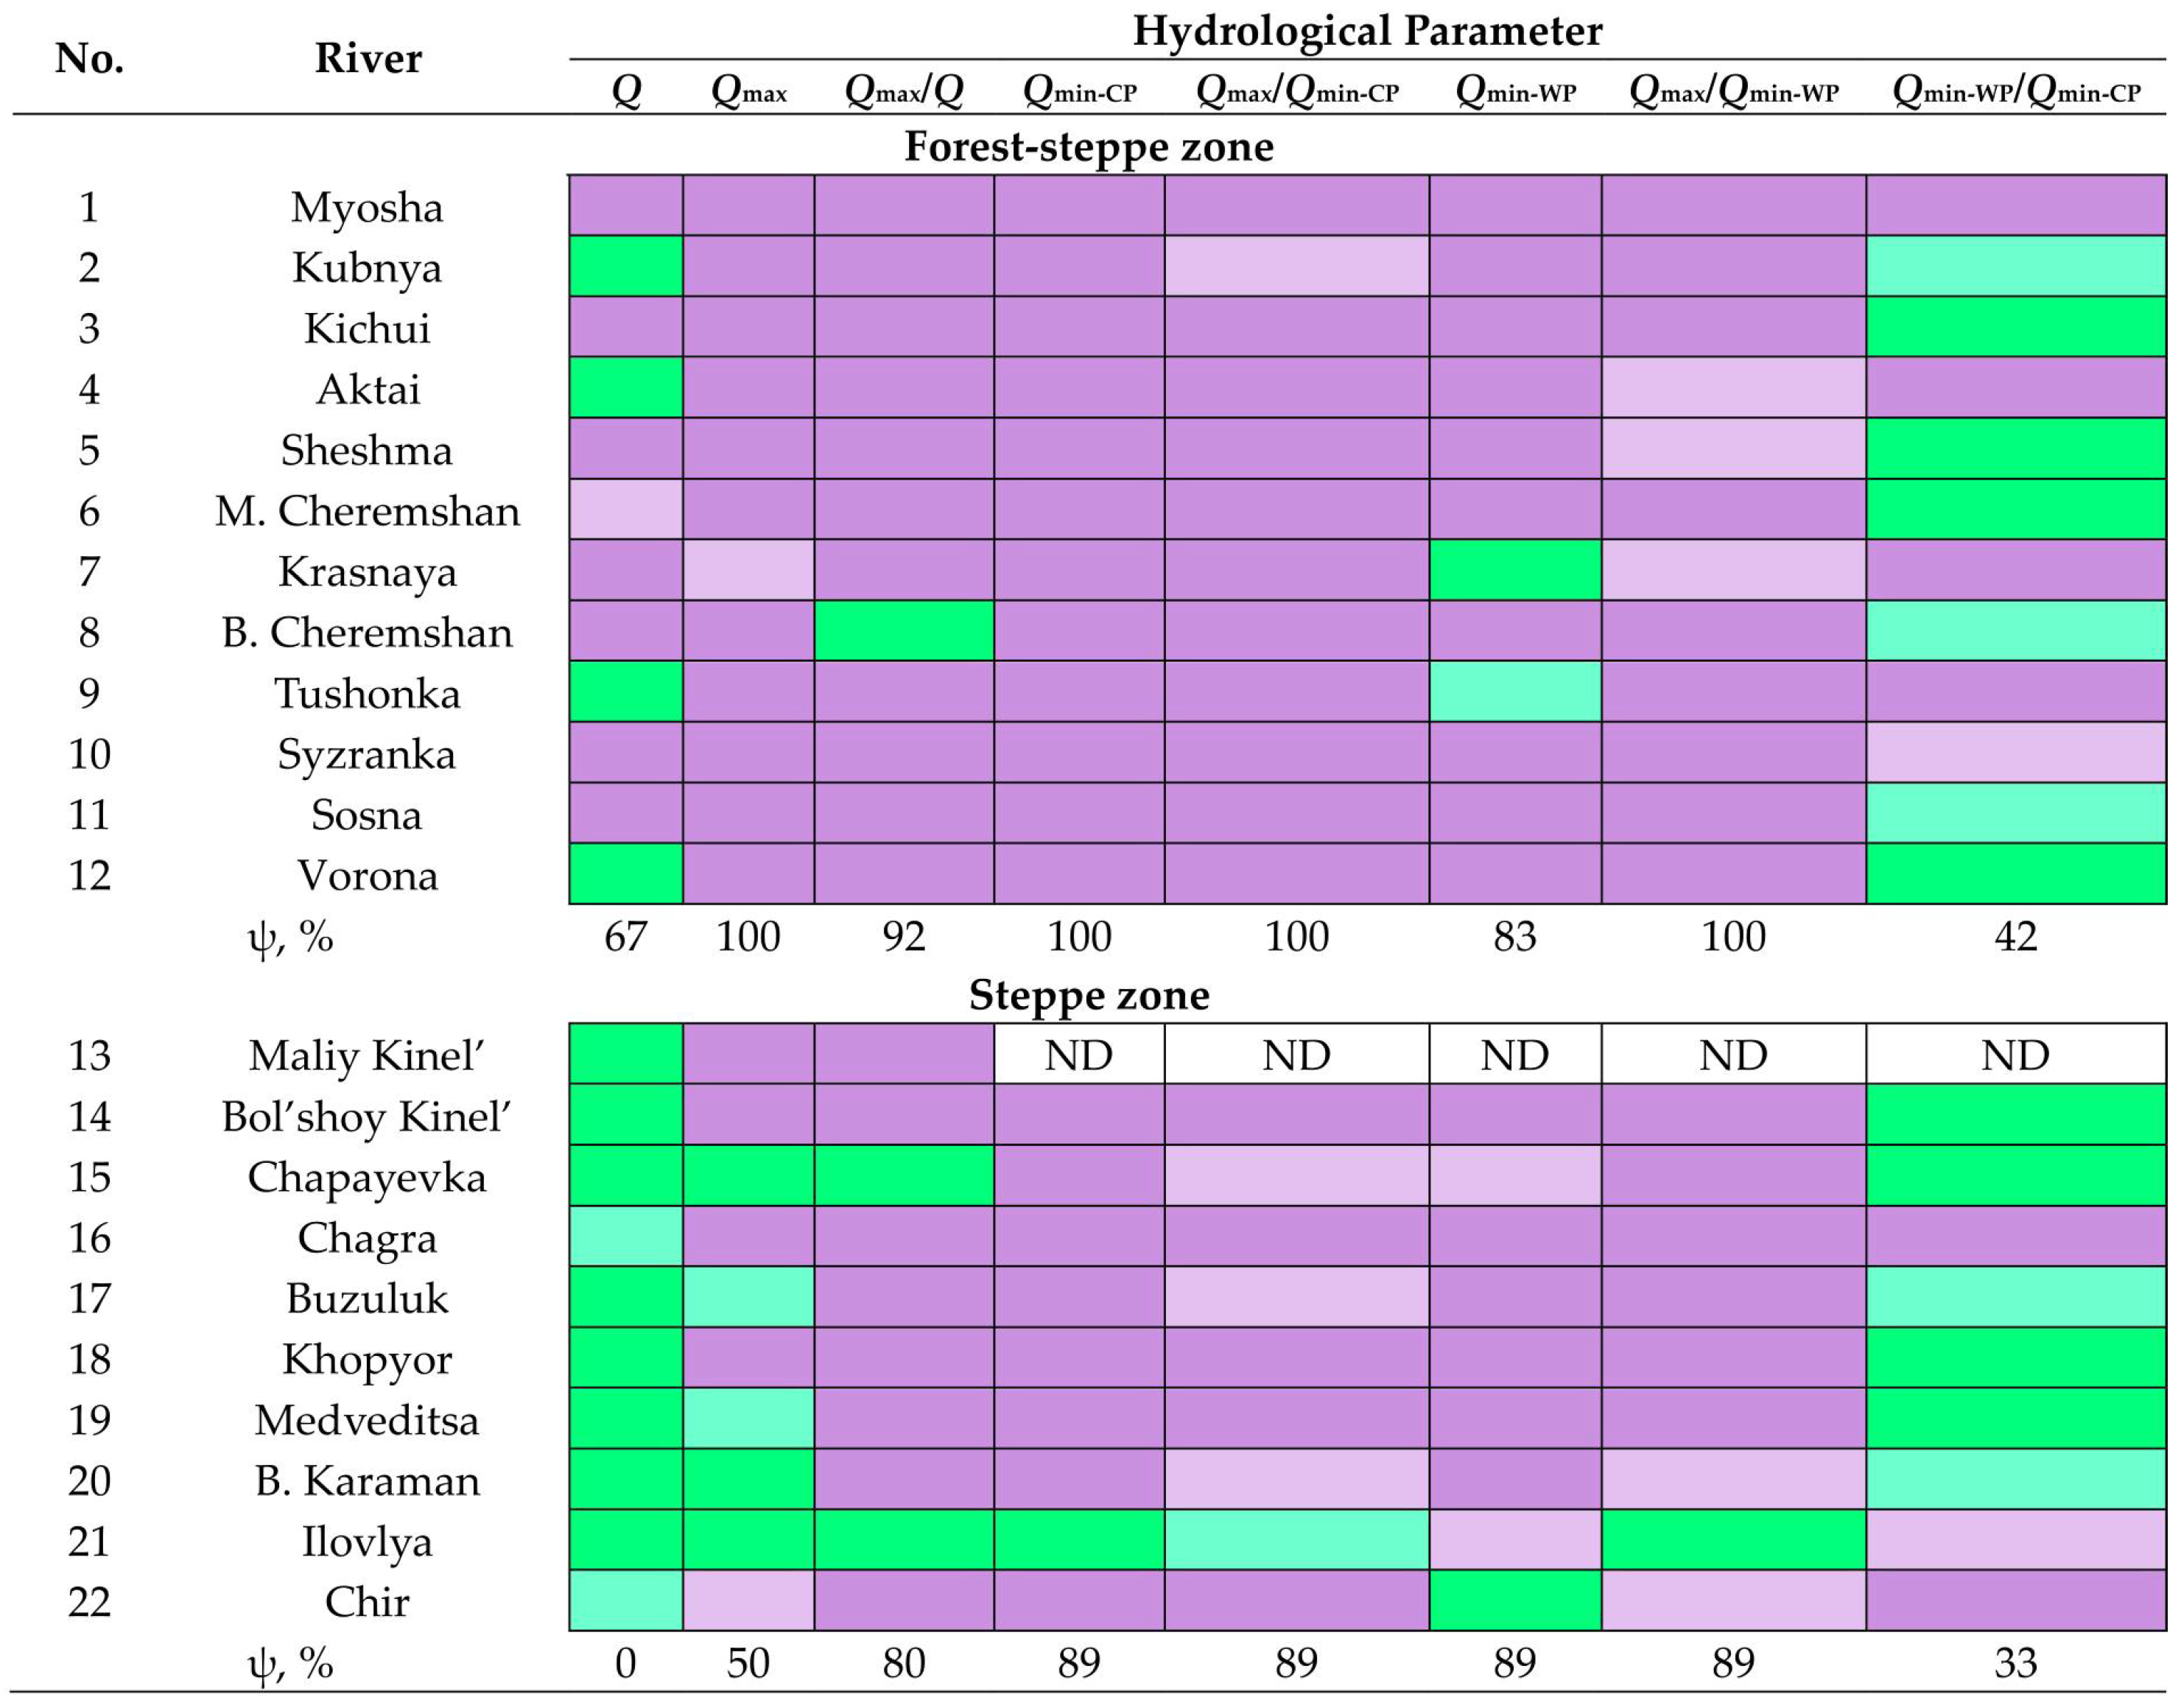
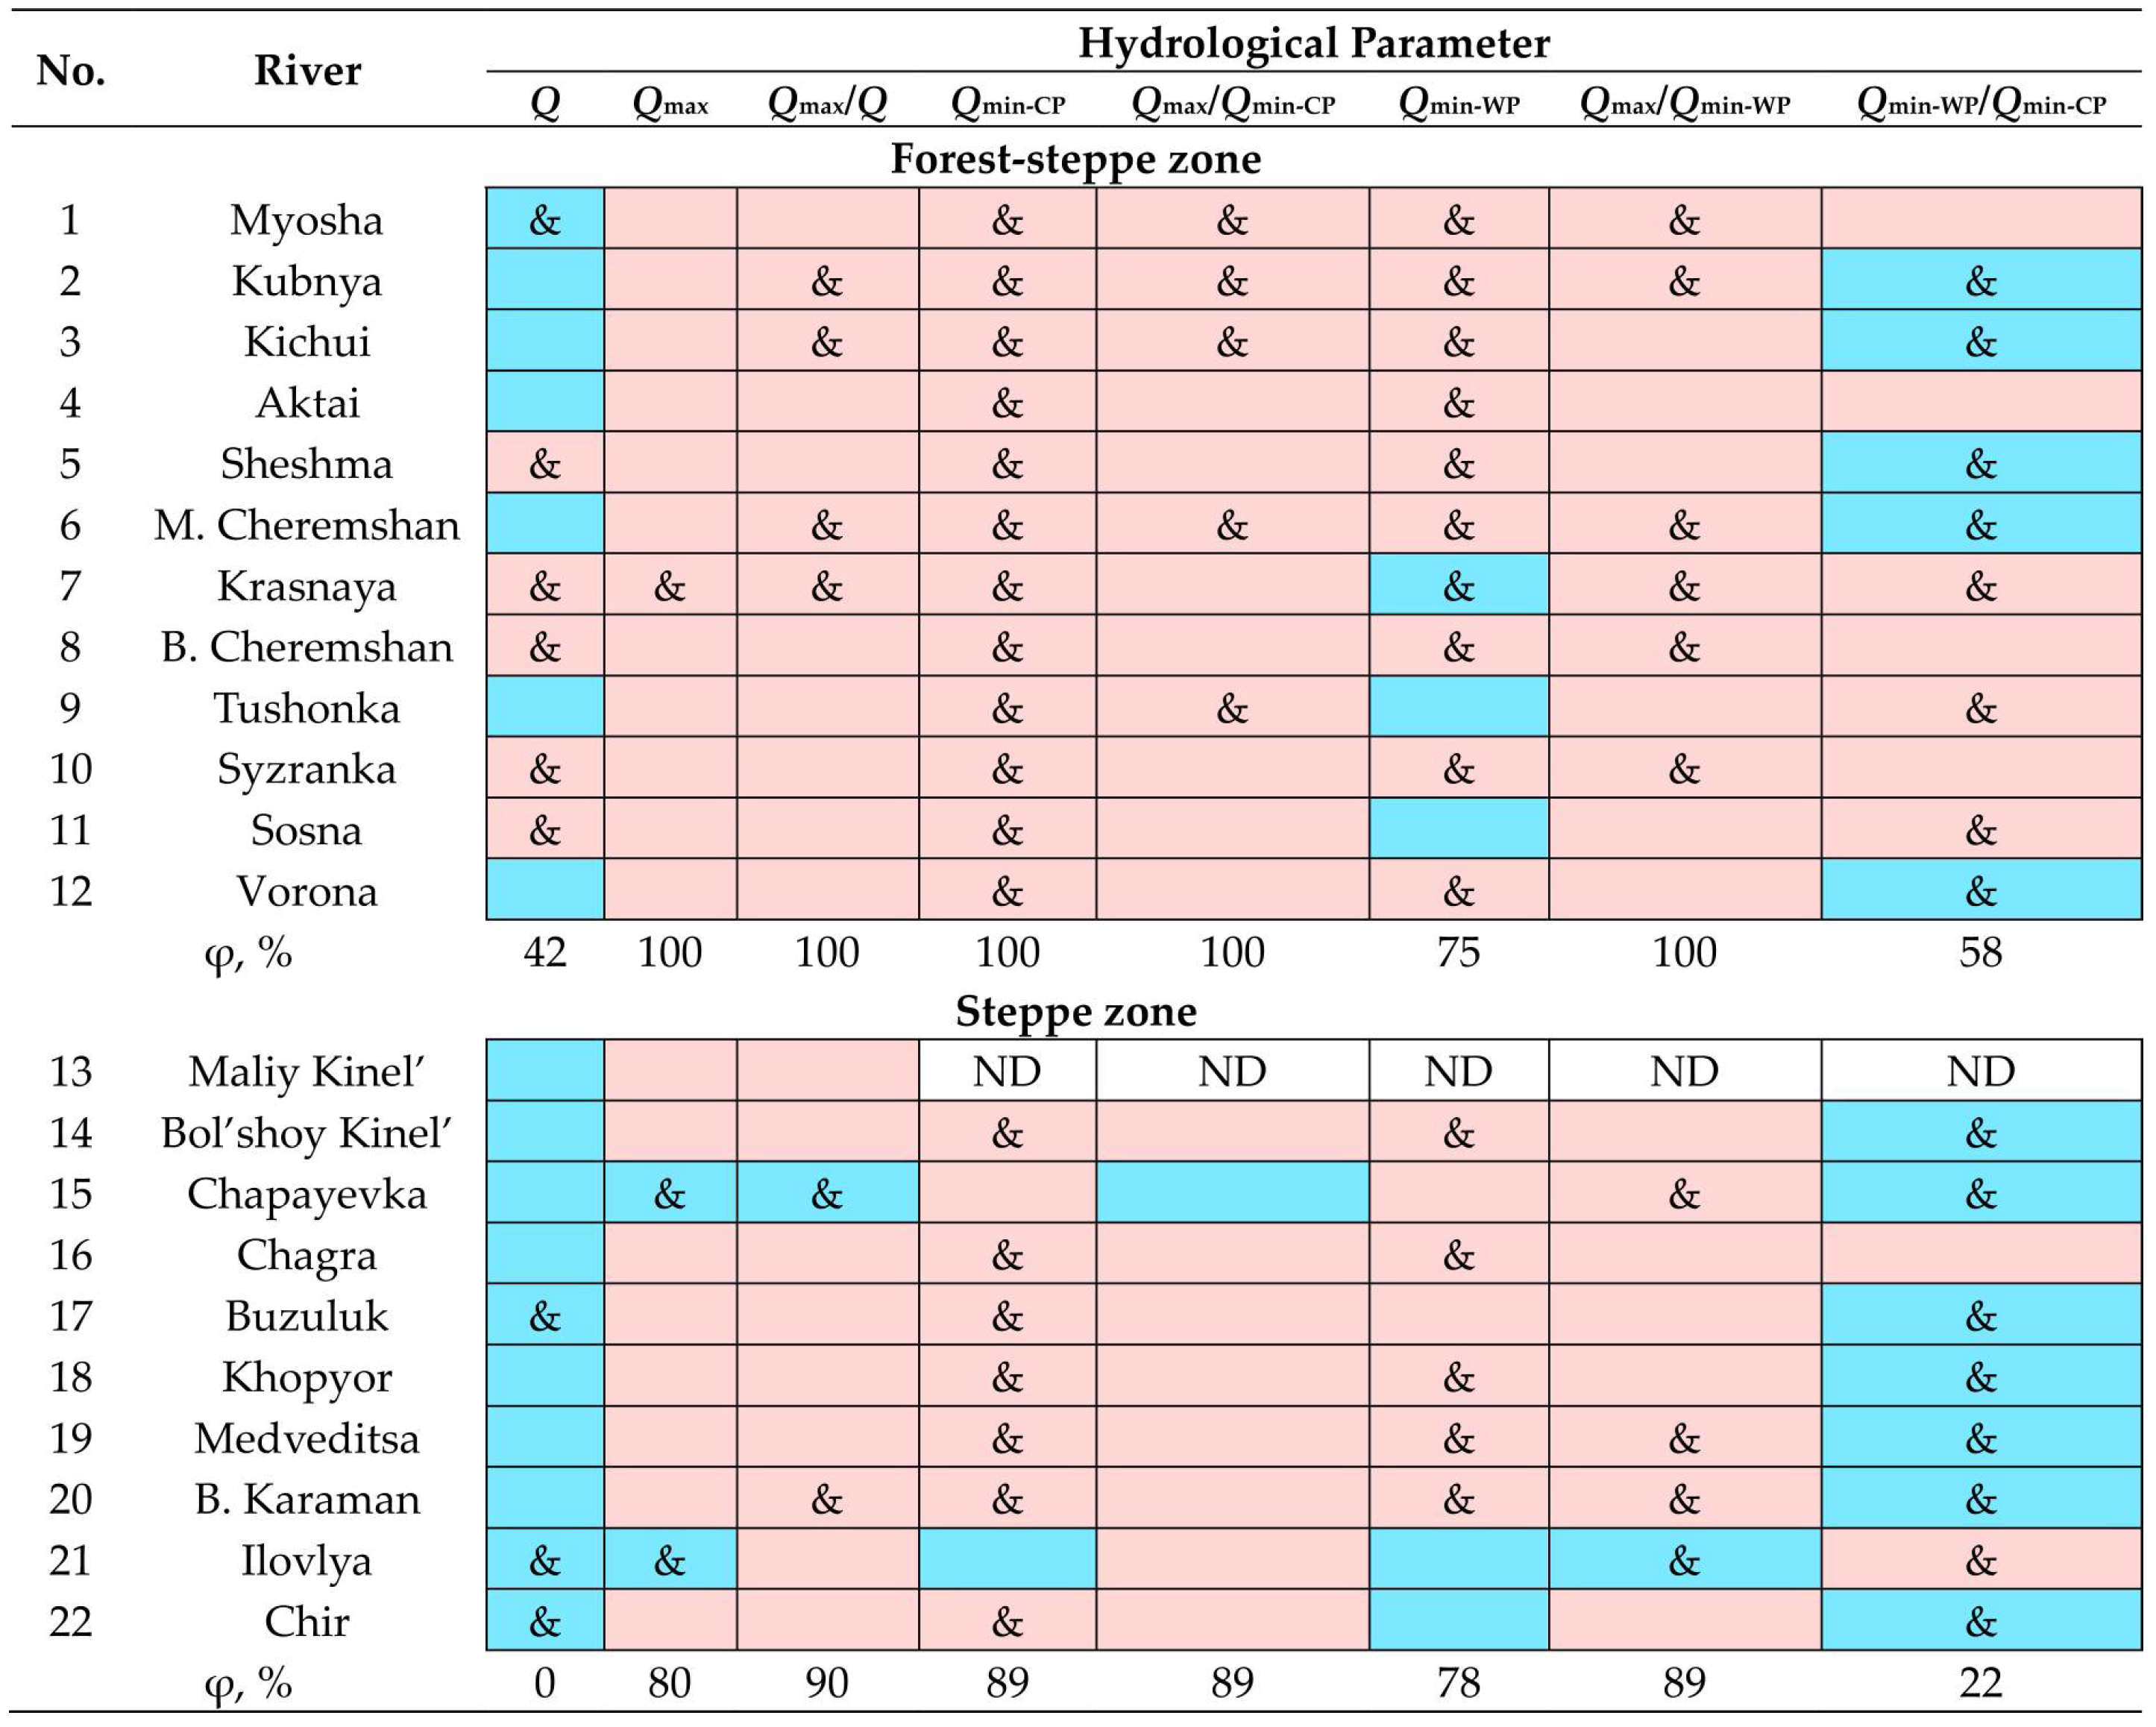
The tested series of observations are also heterogeneous in the overwhelming majority of cases, especially for rivers in the forest-steppe zone: 85% of cases in the forest-steppe zone and 64% of cases in the steppe zone (
Figure 5). The relatively high proportion of homogeneous series of the parameter
Qmin-WP/
Qmin-CP in the two landscape zones under consideration and the 100% homogeneity of the
Q-series of the analyzed rivers in the steppe zone are also noteworthy.
In those observation series that were characterized by heterogeneity, the main changes in intra-annual parameters
Qmax,
Qmin-CP, and
Qmin-WP occurred, on average, around 1990 (
Table 3). Moreover, in the forest-steppe zone, critical changes in the minimum runoff of the warm period (
Qmin-WP) occurred, on average, earlier than changes in the minimum runoff of the cold season (
Qmin-CP) and changes in the maximum runoff (
Qmax). In the forest-steppe zone, critical changes in the annual average water flow (
Q) happened much later (on average, in the late 1990s). Compared with the steppe zone, the rivers of the forest-steppe zone were characterized by a greater spread of years of principal changes (larger
σ values), which could partly be associated with a greater number of cases of their detection than for the steppe zone rivers.
The above-mentioned significant heterogeneity of the examined long-term observation series is also manifested in their significant non-stationarity: 84% of cases in the forest-steppe zone and 67% of cases in the steppe zone (
Figure 6). In the rivers of the steppe zone, the relatively high proportion of stationary series for the parameter
Qmin-WP/
Qmin-CP and the total statistical stationarity of the tested series for the parameter
Q are also noteworthy.
3.2. Trend Changes
3.2.1. Annual Water Flow
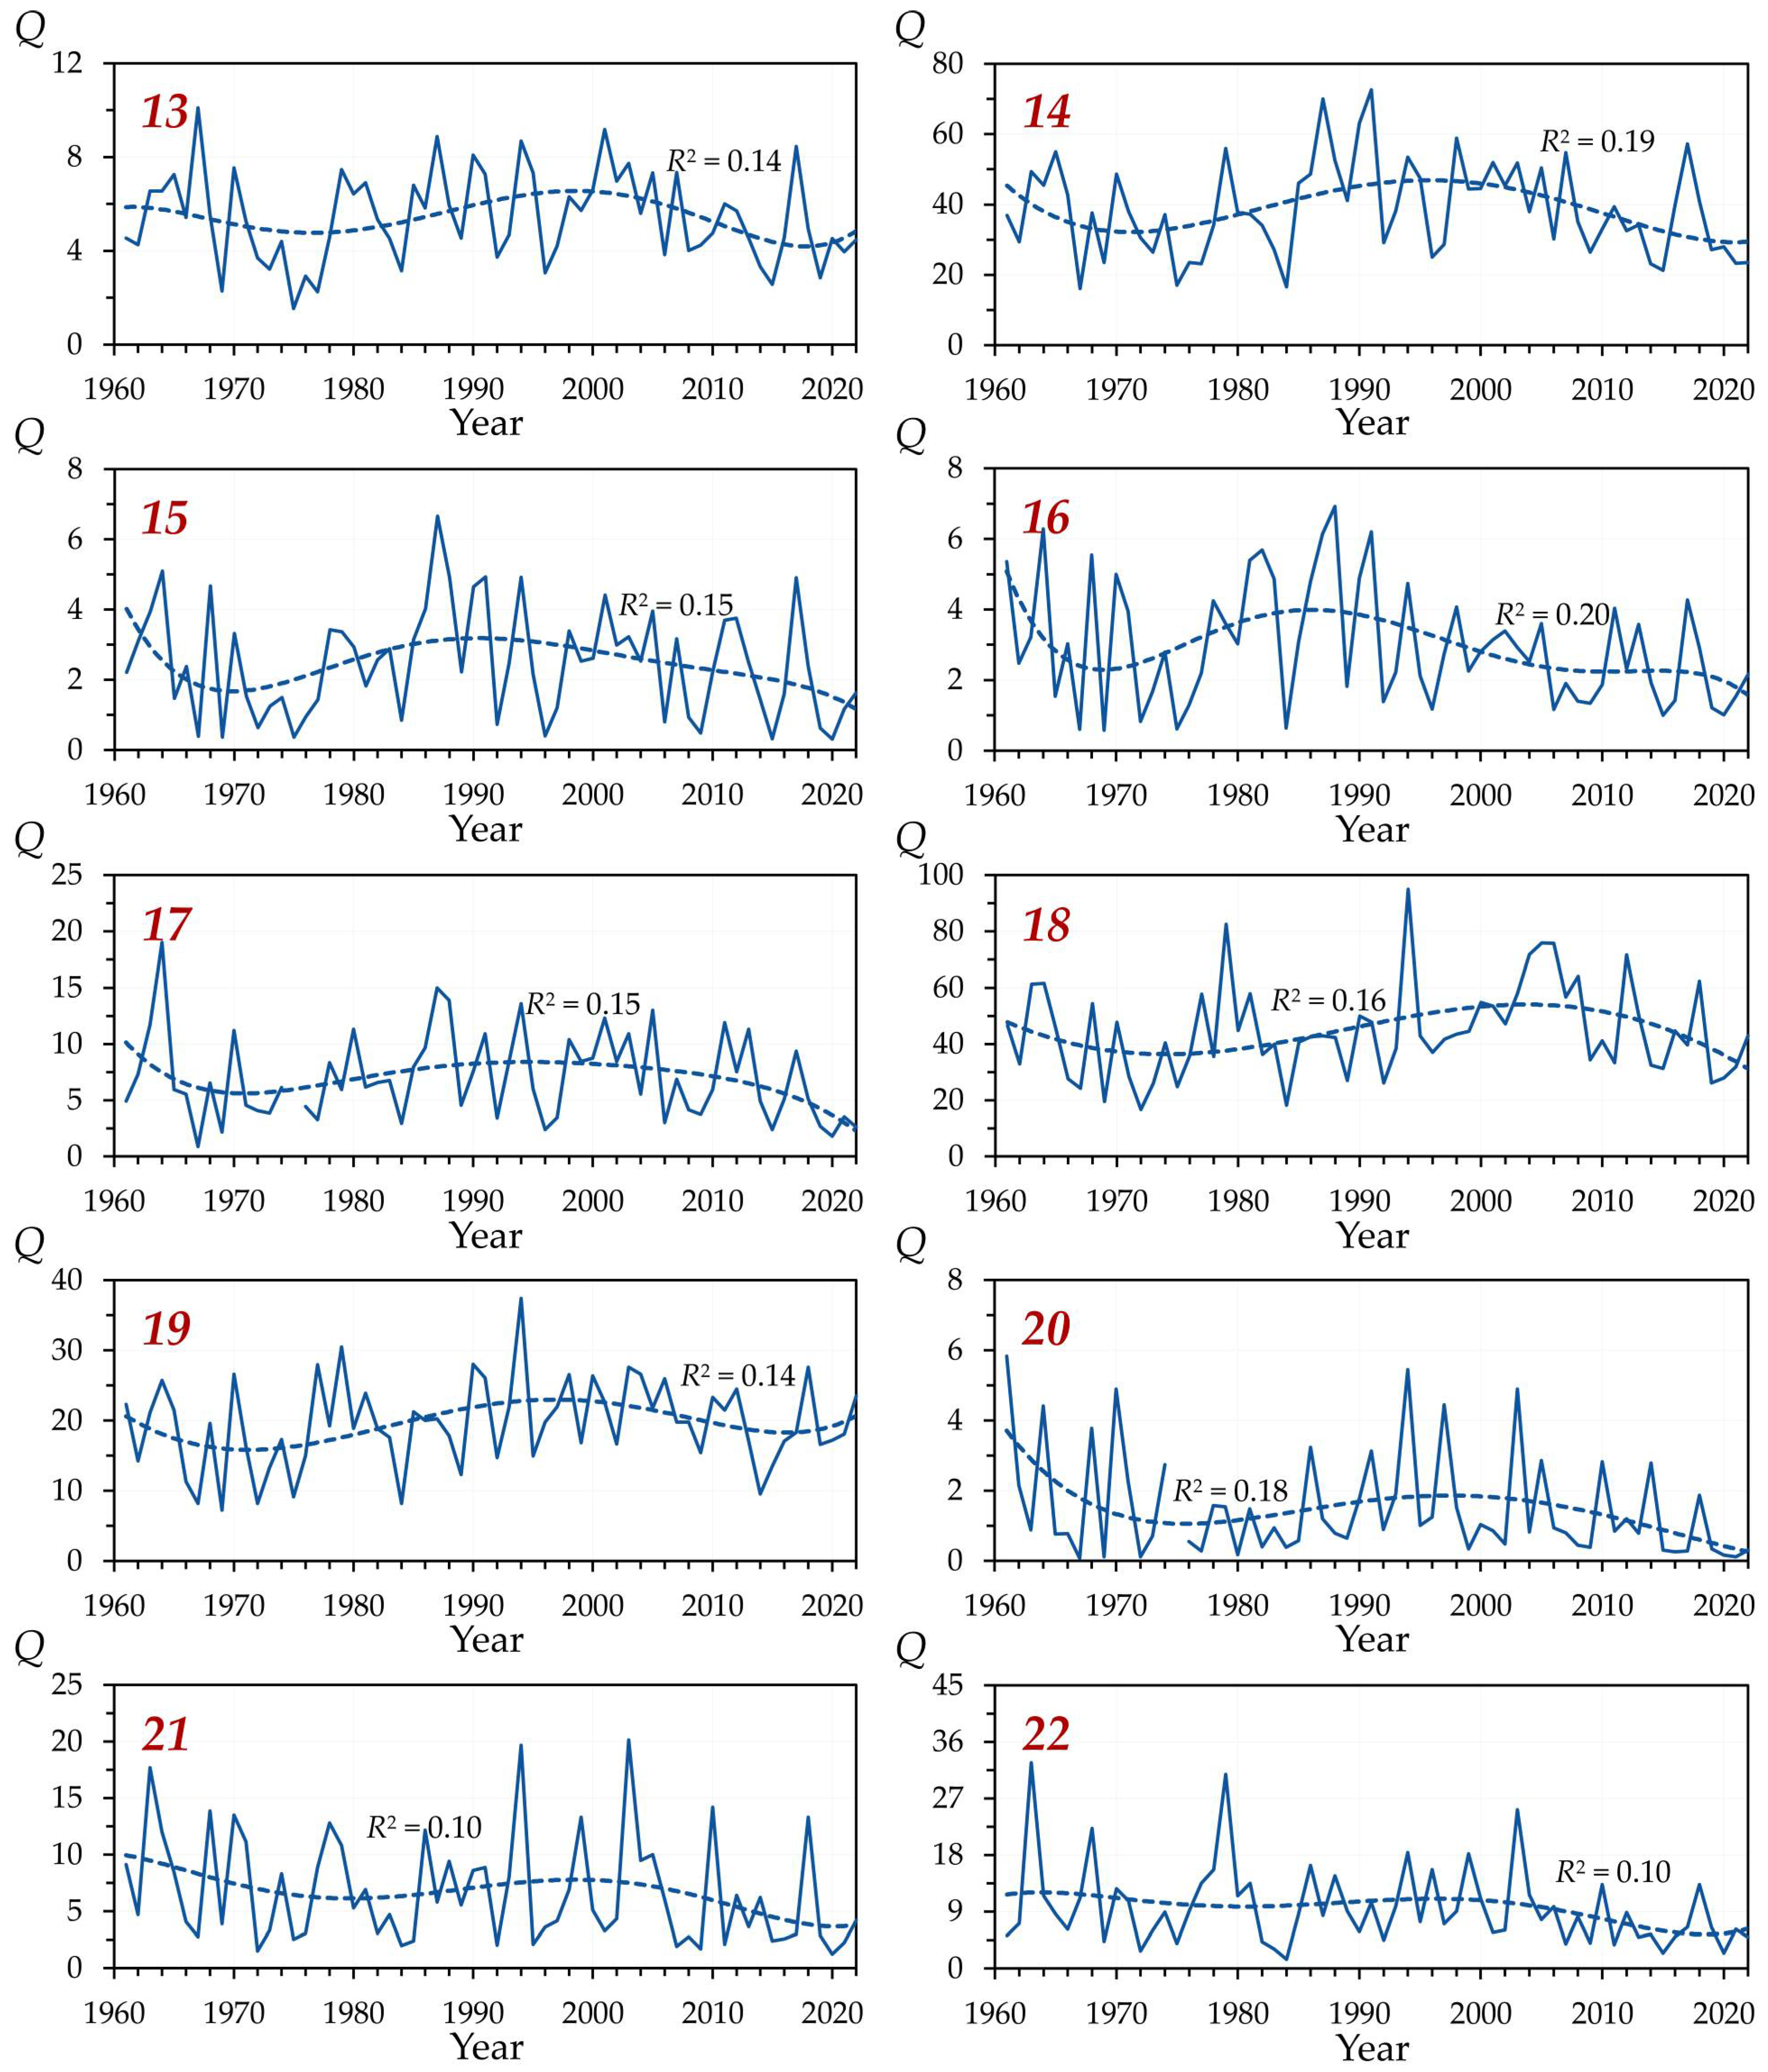
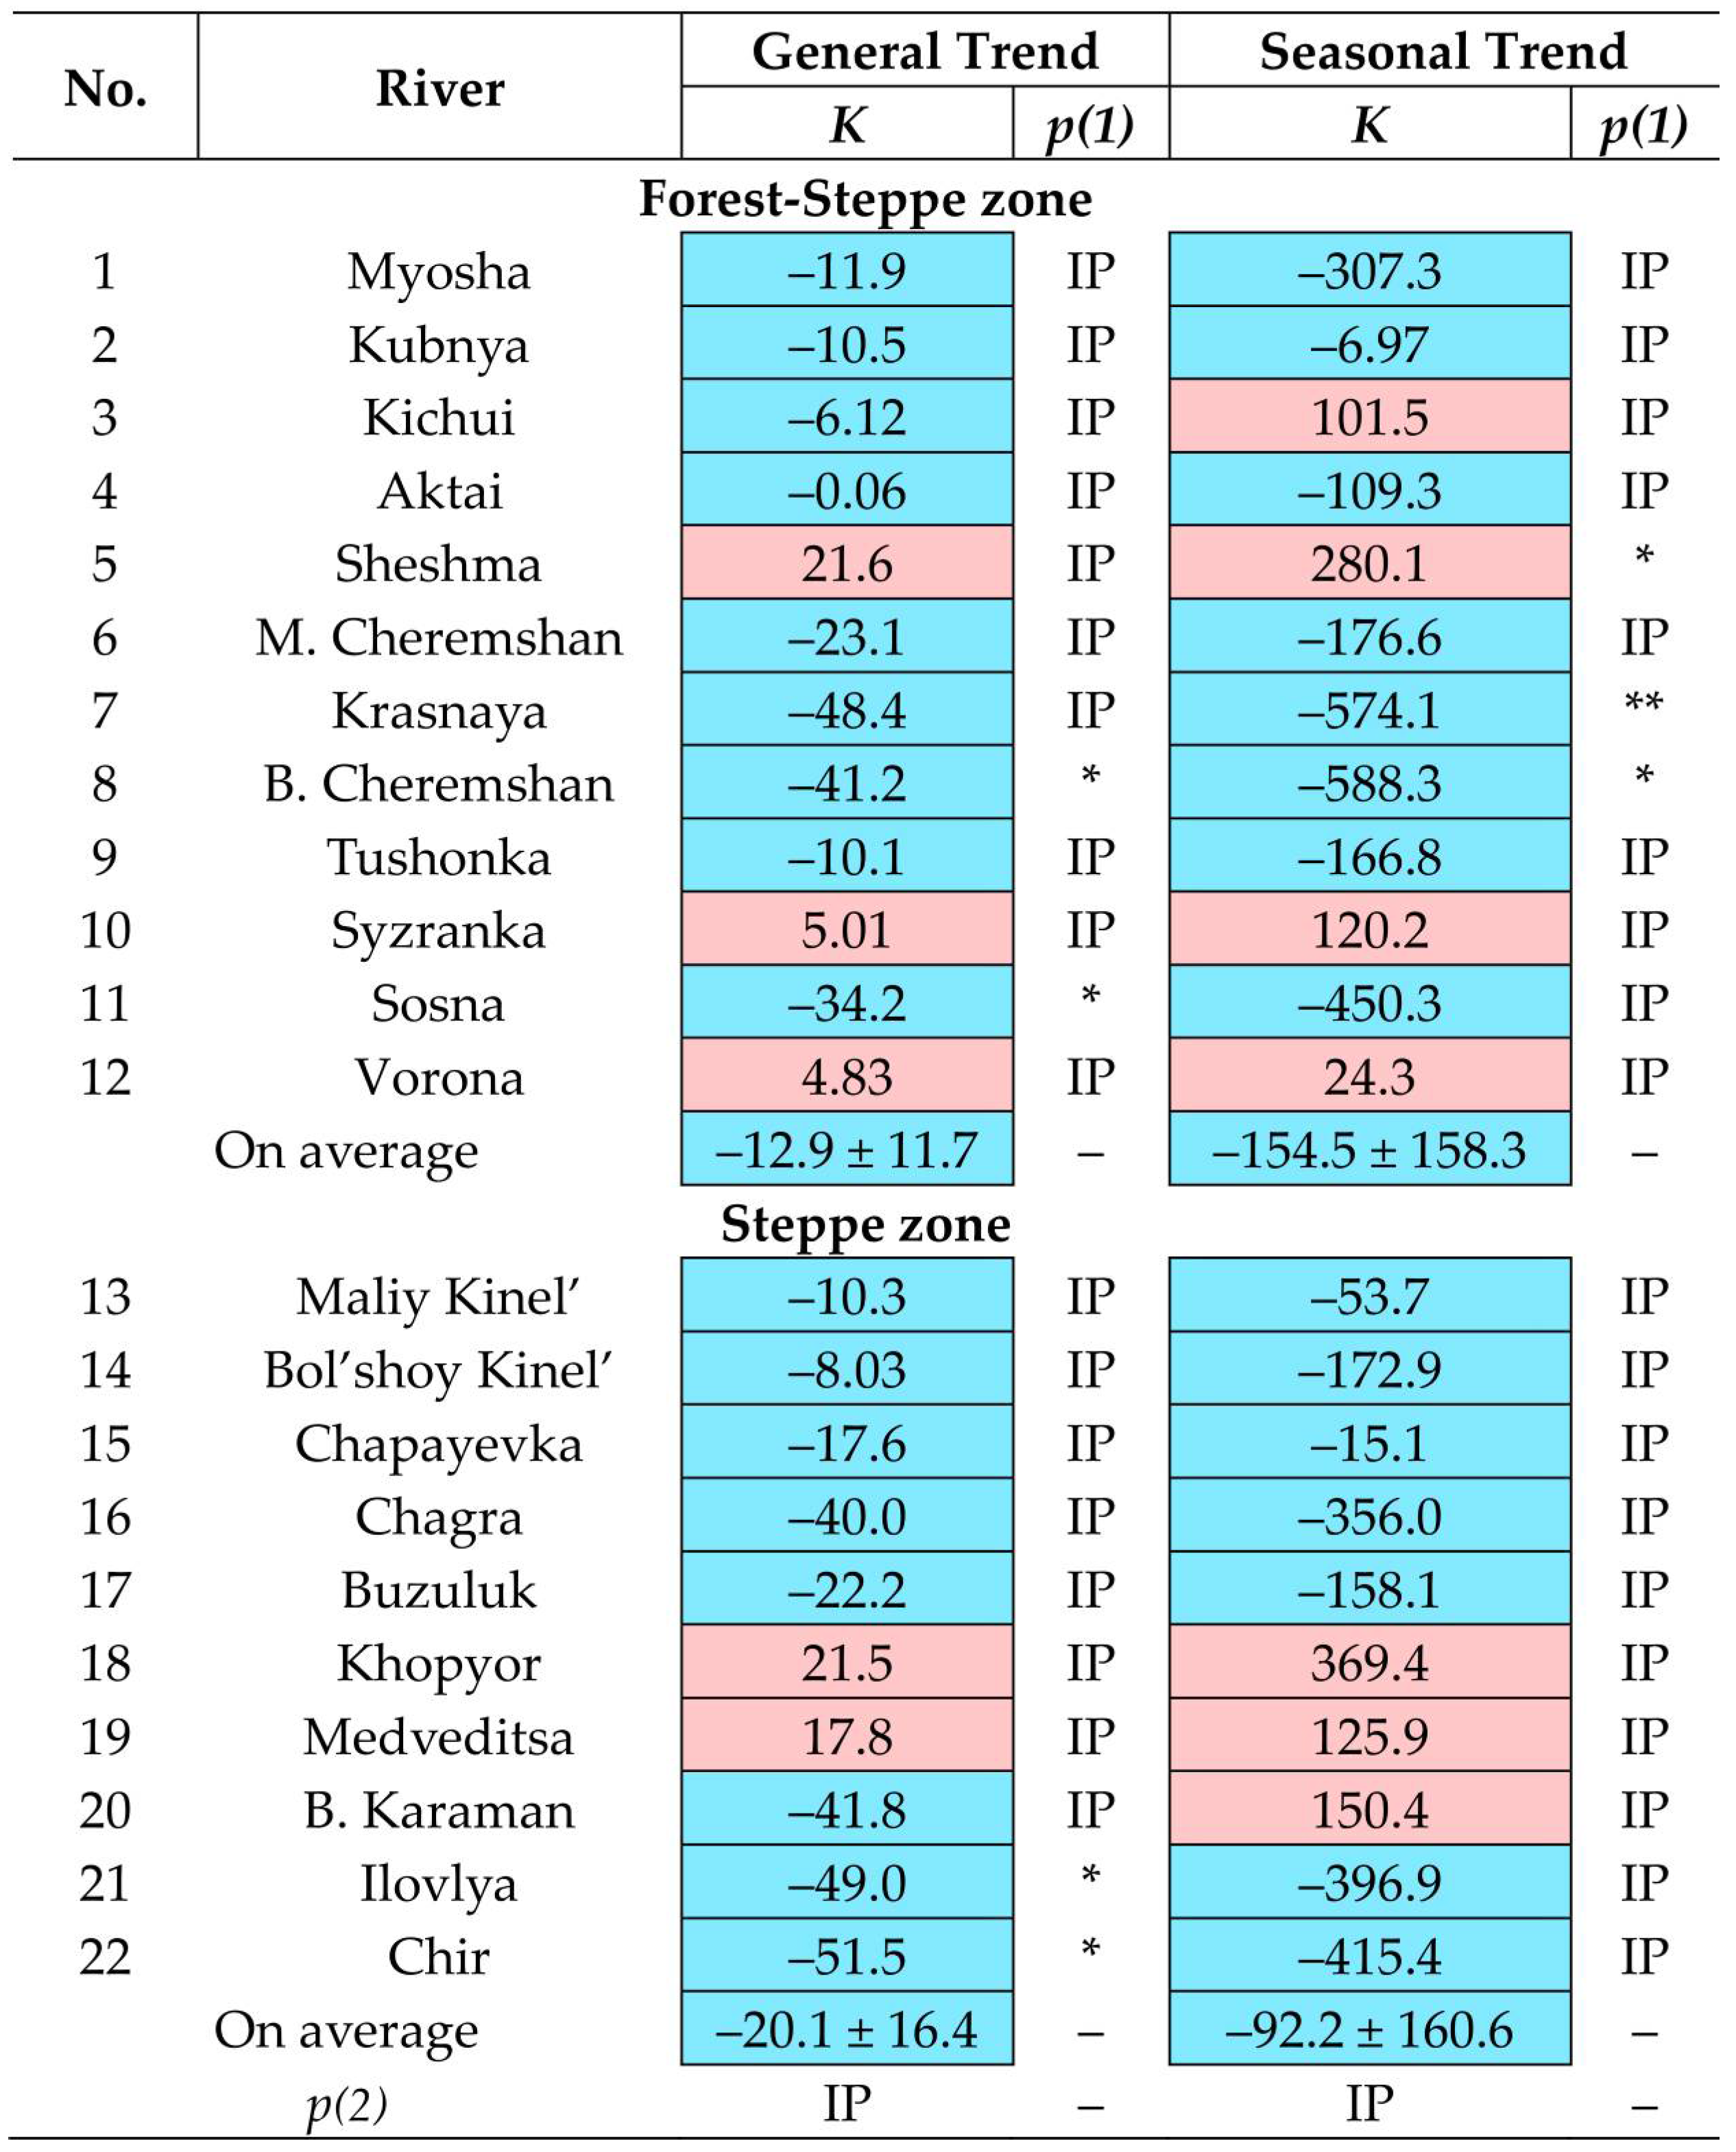
In the period from 1960 to 2022, on the vast majority of the rivers under consideration (in total for the two zones, this amounted to 77%: 75% in the forest-steppe zone and 80% in the steppe zone), a general trend of reducing annual water flow (
Q) was observed. In the steppe zone, it was somewhat more significant than in the forest-steppe zone (
Figure 7). At the same time, the prevalence (68%: 67% in the forest-steppe zone and 70% in the steppe zone) of a descending seasonal trend was also noted. Compared with general trends, in the forest-steppe zone, descending seasonal trends were more noticeable than in the steppe zone. However, no statistically significant differences were found in the degree of expression of either general or seasonal trends between the two landscape zones. It is fundamentally important to note that, despite the presence of prevailing tendencies towards a decline in
Q throughout the region under consideration, in 82–86% of cases, these tendencies turned out to be statistically insignificant.
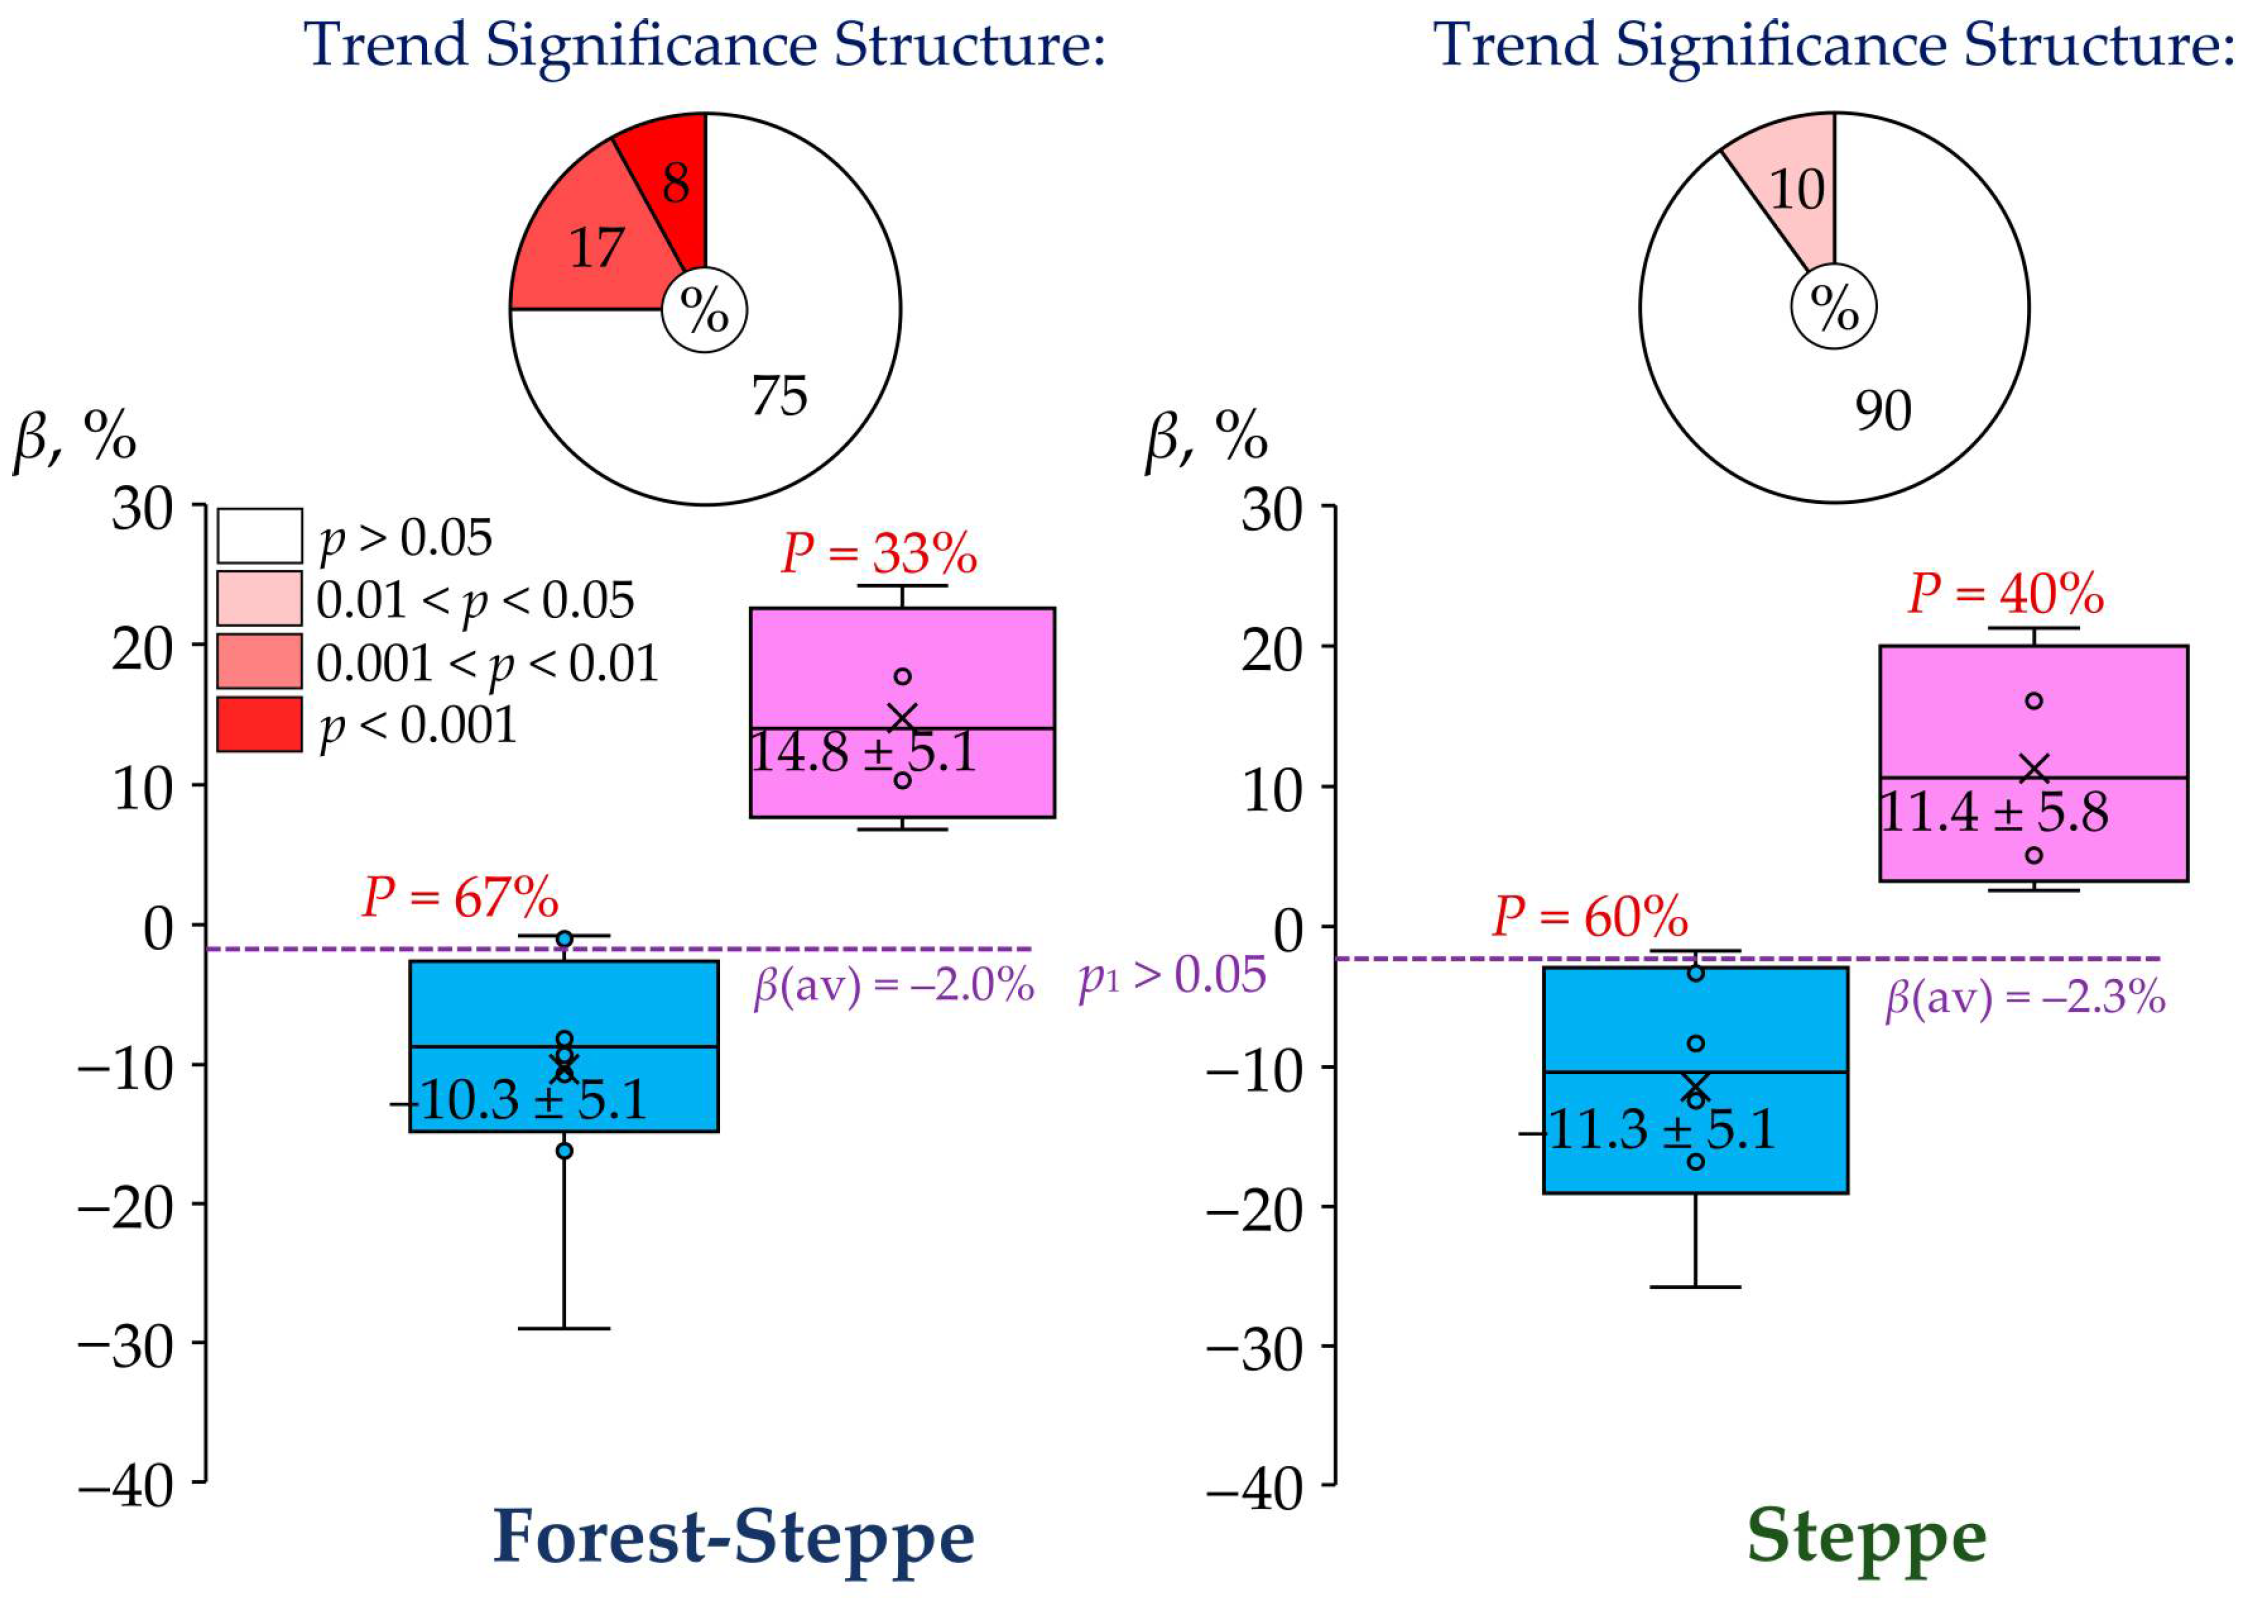
In the context of regional climate change, changes in the flow of water of small and medium-sized rivers in the east of the East European Plain are of interest when comparing the baseline periods 1961–1990 and 1991–2020. This possibility is provided by using the coefficient
β (see Formula (2)). According to the coefficient
β, there were no statistically significant changes in the annual average water flow (
Q) across the study region. The flow reduced by only 2.0–2.3% between the baseline periods 1961–1990 and 1991–2020 (
Figure 8).
Moreover, in 33–40% of cases, even an increment in
Q was noted. Despite this, the dominant part (≥75%) of these trends did not have statistical significance, especially in the steppe zone (see
Figure 8). Also, no statistically significant difference in the average values of
Q was found between the analyzed landscape zones.
3.2.2. Annual Maximum Water Flow
In contrast to the annual average water flow (
Q), the annual maximum water flow (
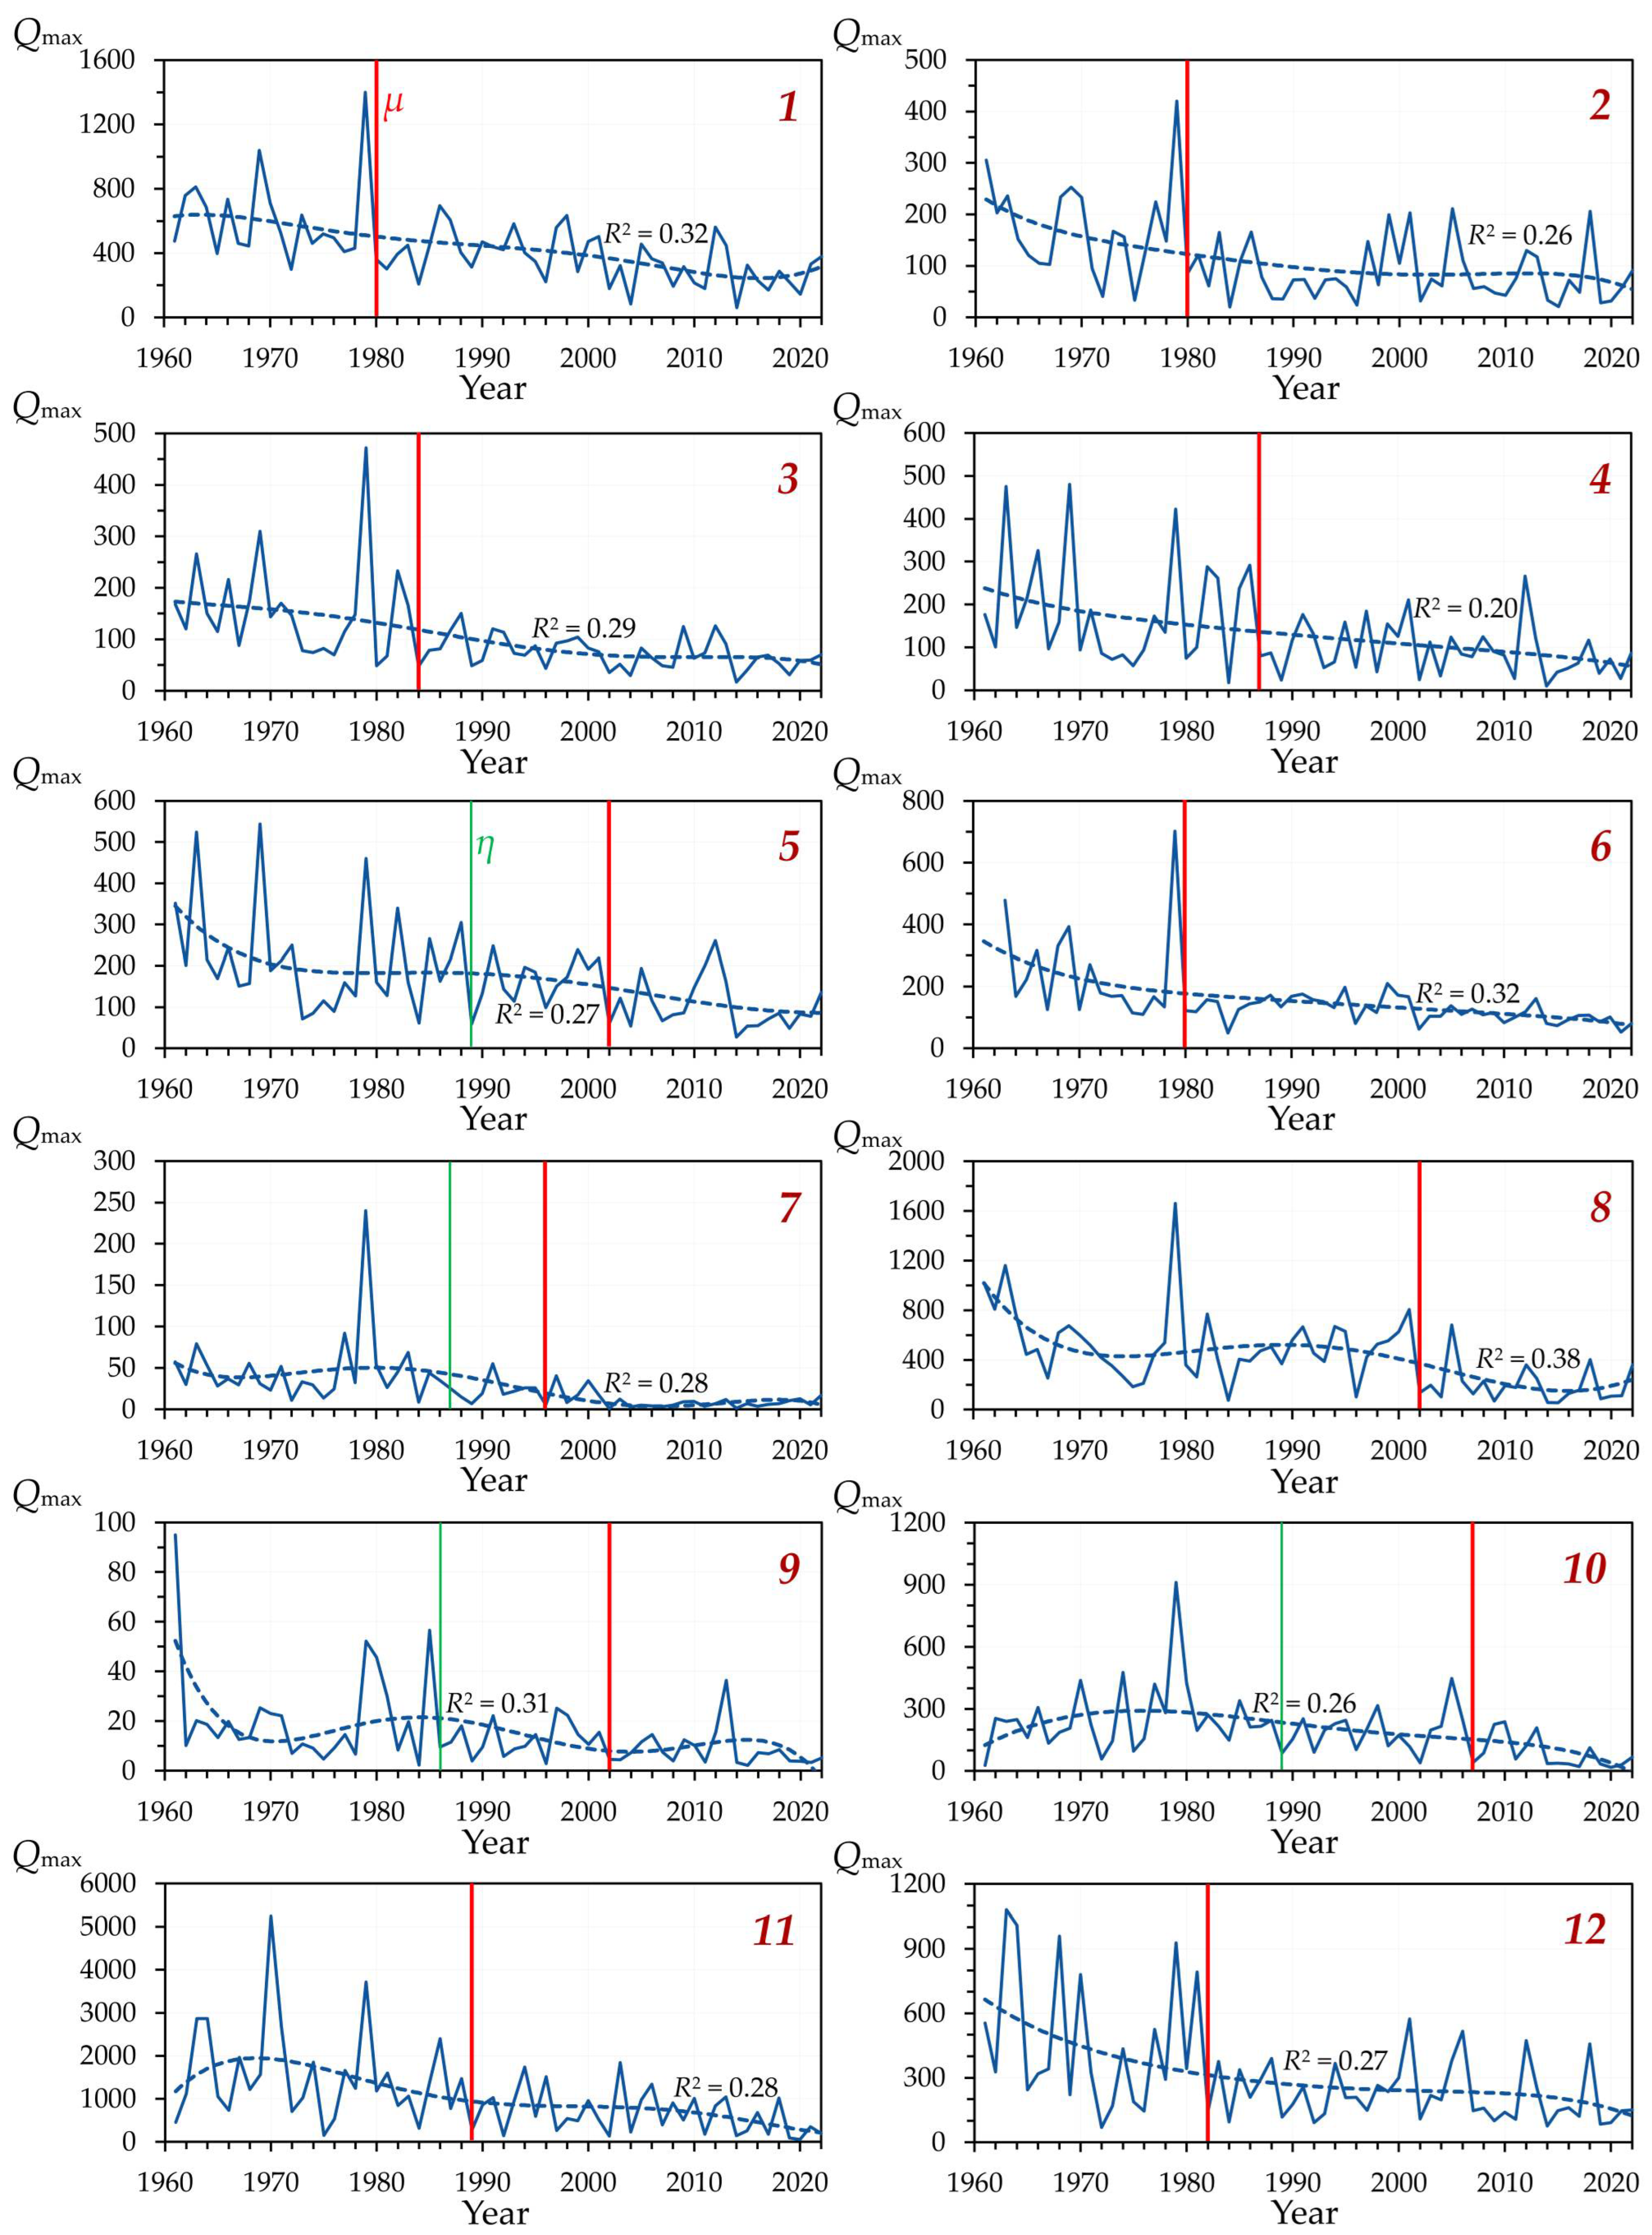
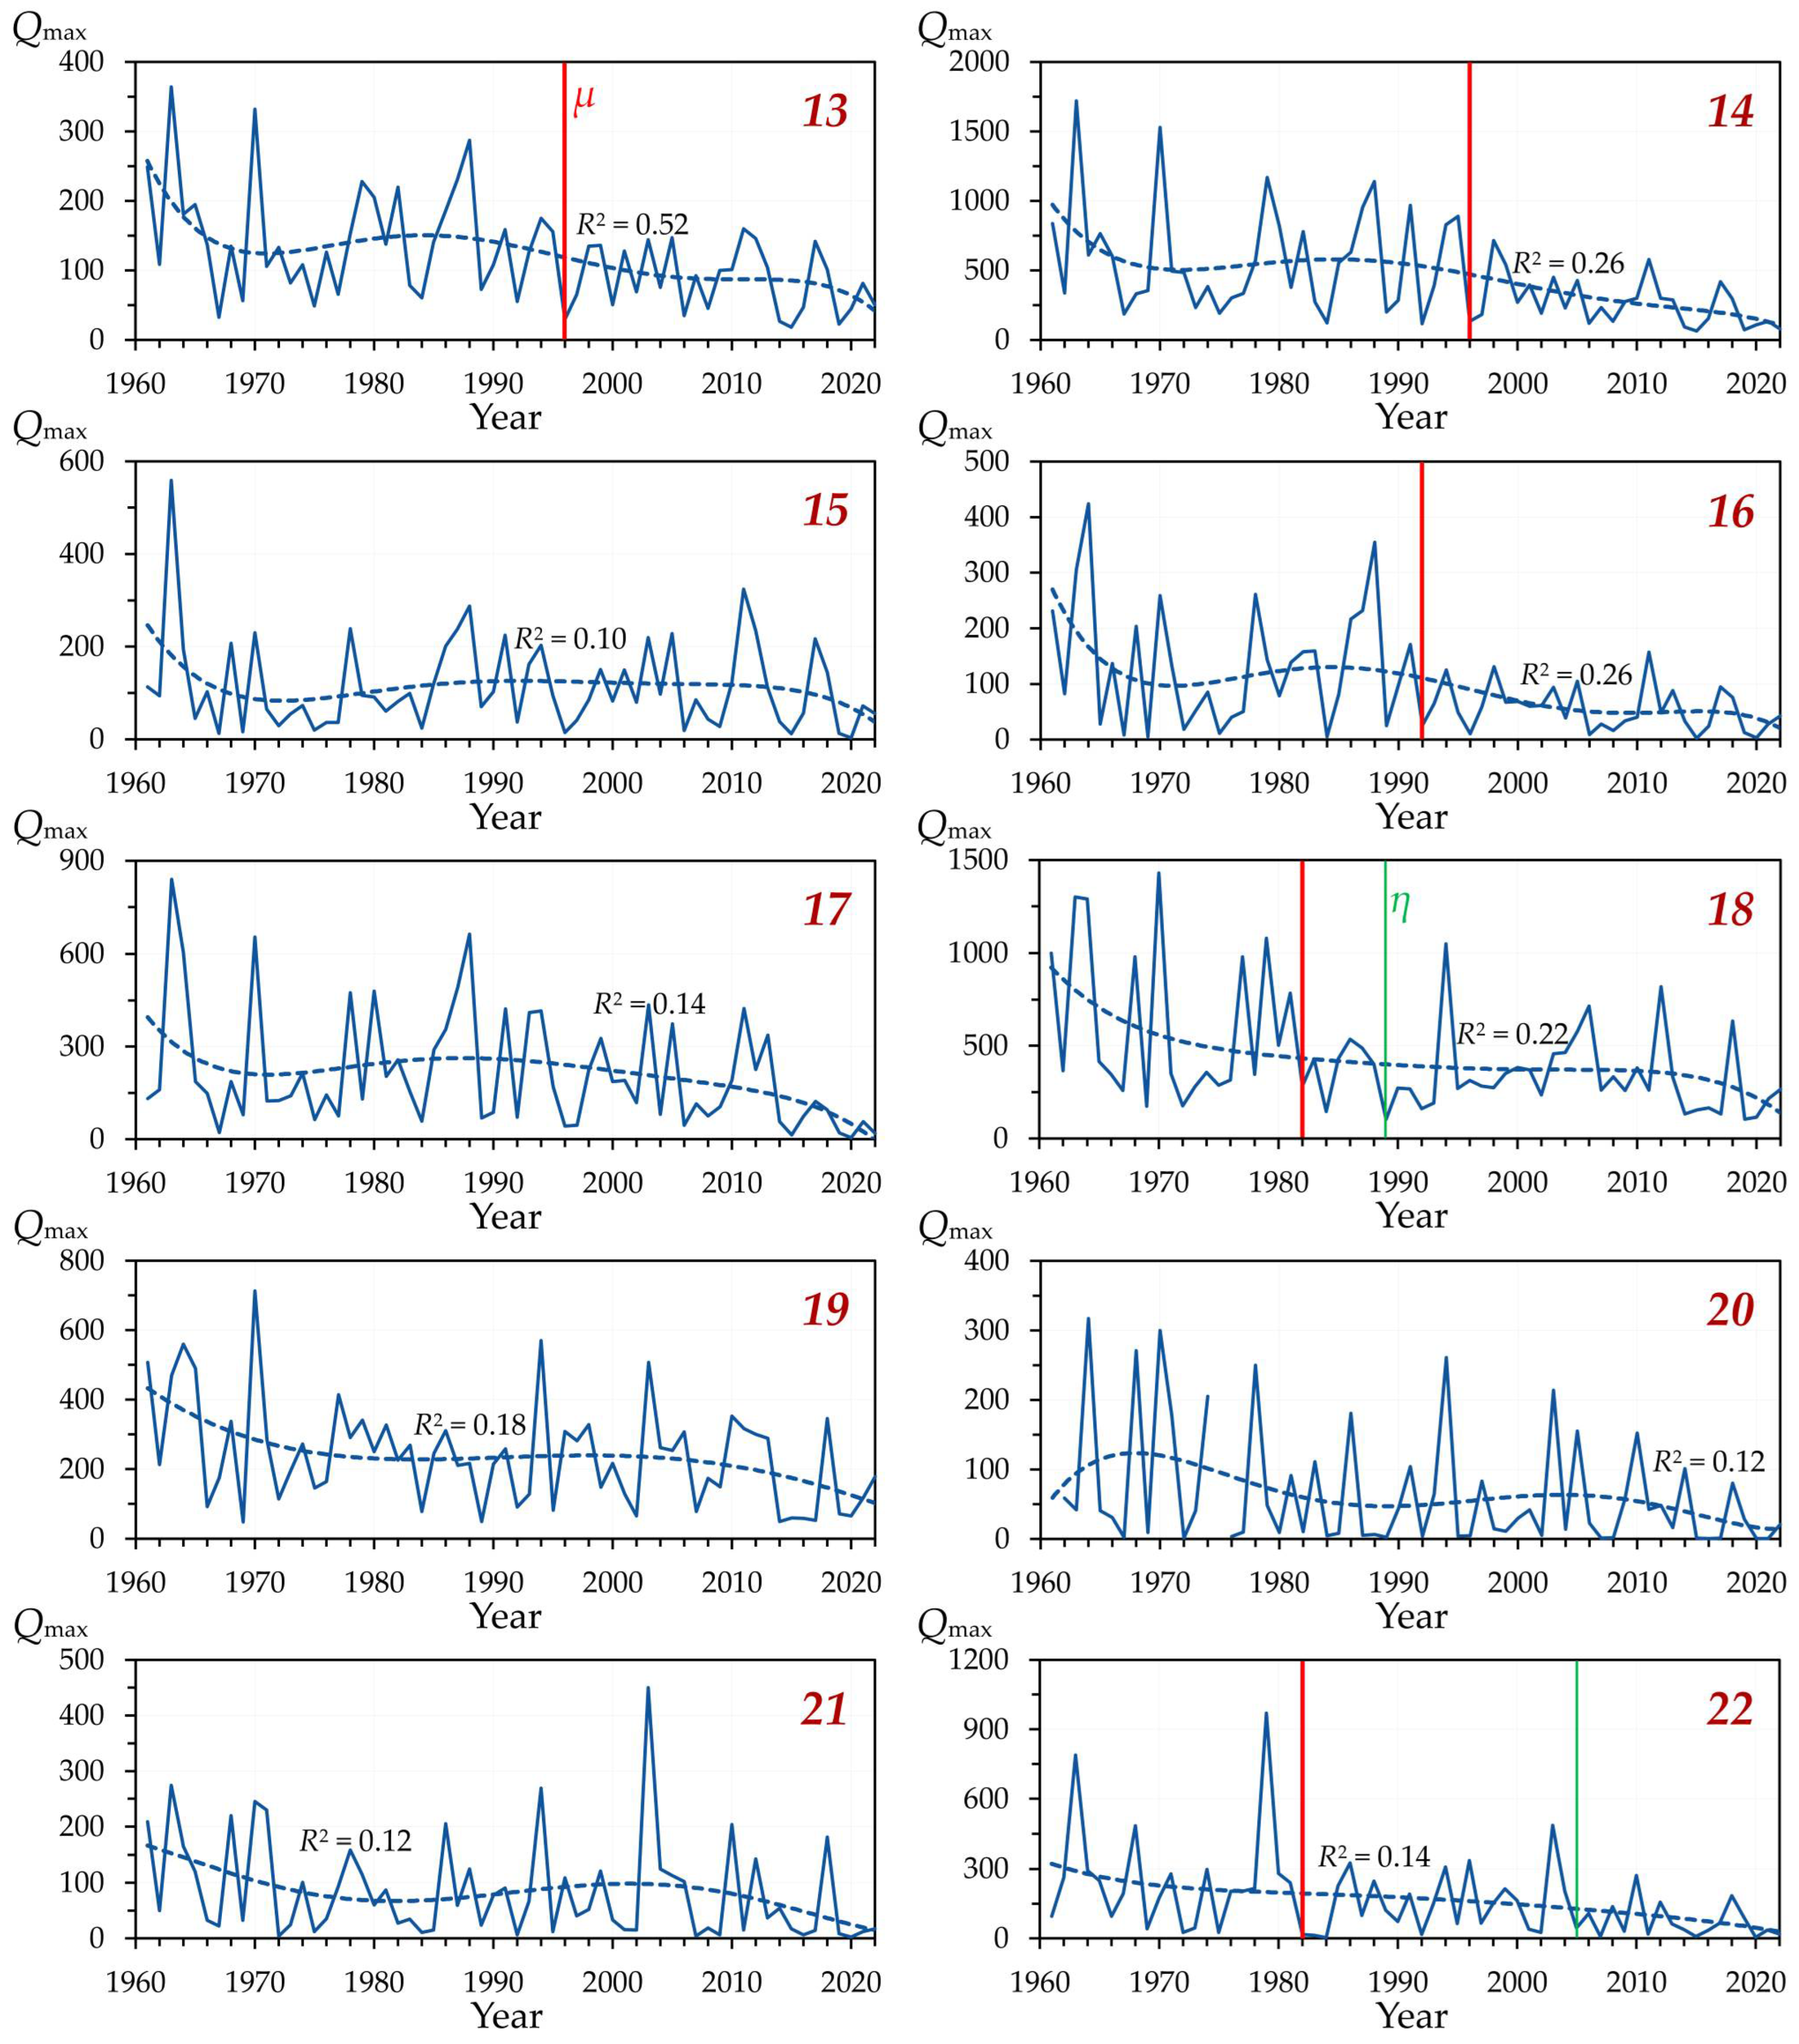
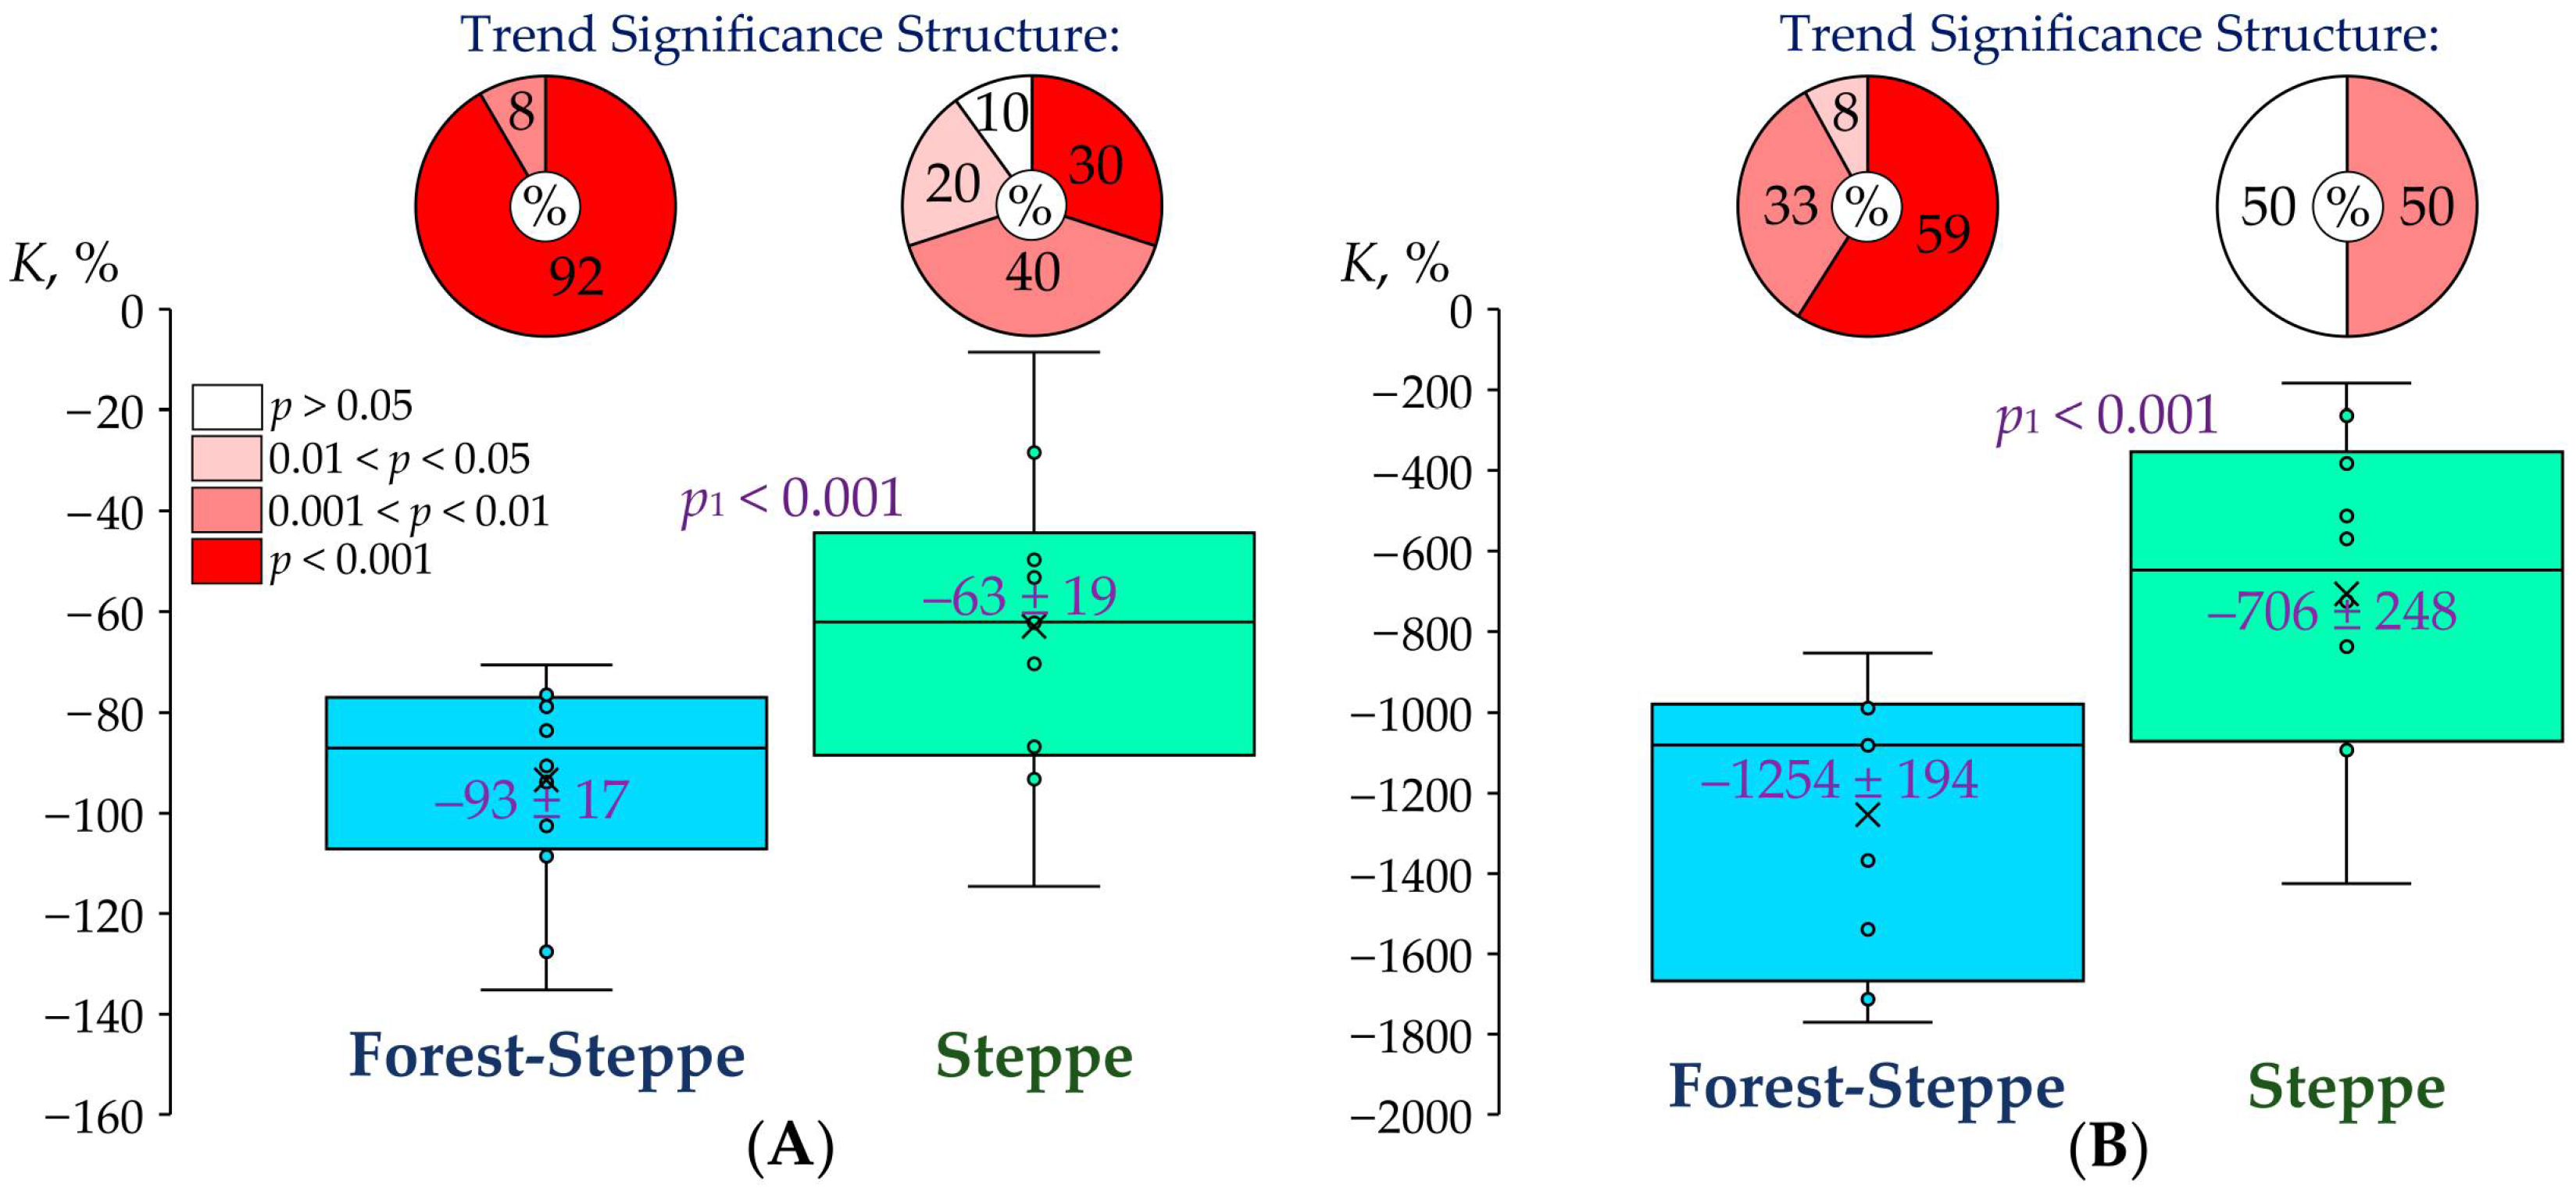
Qmax) showed decreasing general and seasonal trends everywhere in both the forest-steppe and steppe zones. This decrease was more noticeable and mostly statistically significant (
Figure 9). In the steppe zone, a statistically significant general trend of reducing
Qmax was not noted only for the Chapayevka River. It should be noted that the general and seasonal decline in
Qmax in the rivers of the forest-steppe zone was, on average, “deeper” (and the differences were statistically significant) compared to the rivers of the steppe zone (see
Figure 9).
According to the revealed widespread descending trend (see
Figure 9), the annual maximum water flow of the rivers (
Qmax) in the study region reduced between the baseline periods 1961–1990 and 1991–2020 by almost 40%, and this reduction was more significant in the forest-steppe than in the steppe zone (with a statistically significant difference) (
Figure 10). Moreover, if in the forest-steppe zone all decreases in
Qmax were statistically significant to one degree or another, then in the steppe zone, only 60% of all cases of decrease in
Qmax were considered as such.
3.2.3. Annual Minimum Water Flow in the Cold Season
Analysis of changes in the annual minimum water flow in the cold (mainly winter) season of the year (
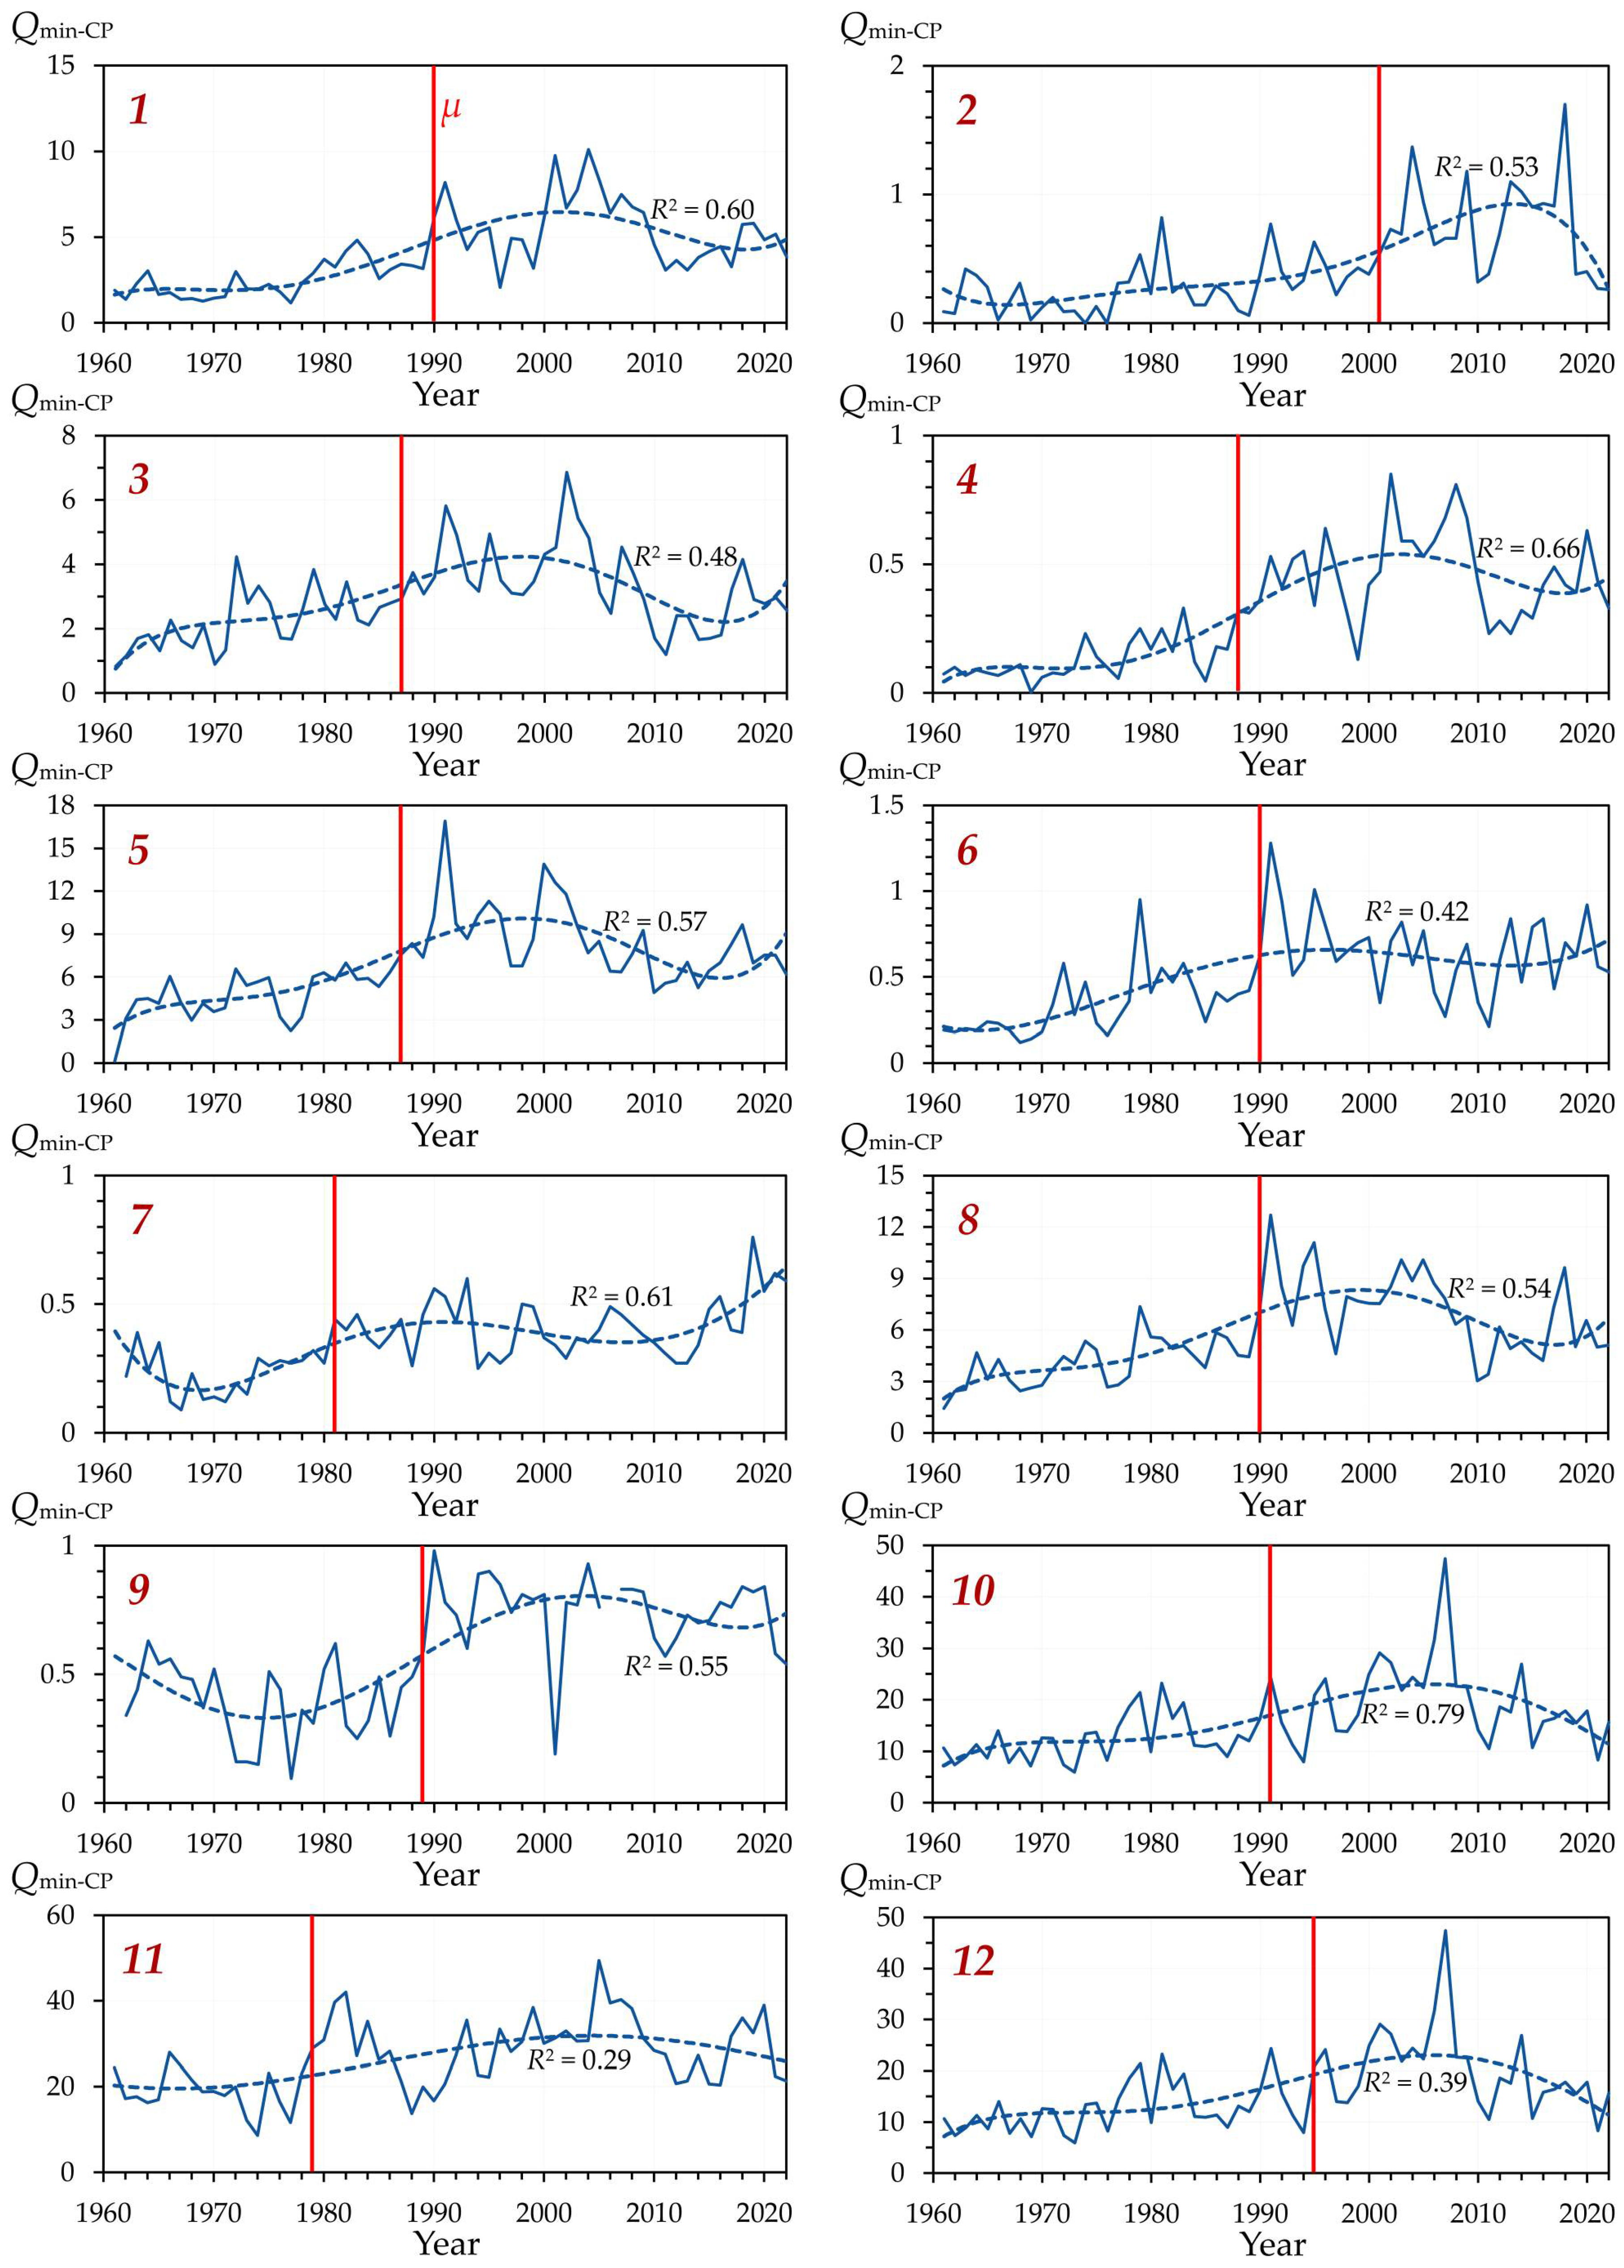
Qmin-CP) revealed its general increment in 1961–2022 (
Figure 11). The vast majority of these trends were statistically significant, especially in the forest-steppe zone. In the steppe zone, only in the southernmost rivers of the study region (the Ilovlya and Chir rivers), no statistical significance was found for either the general or seasonal
Qmin-CP growth trend. No statistically significant differences in the degree of expression of ascending trends in
Qmin-CP between the forest-steppe and steppe zones were found.
As for the minimum water flow during the cold season (
Qmin-CP), in the study region, it increased significantly (on average, by 96–100%) between 1961–1990 and 1991–2020, while no statistically significant differences between the average values for the forest-steppe and steppe zones were found (
Figure 12). All identified increments in
Qmin-CP between the periods were statistically significant.
3.2.4. Annual Minimum Water Flow in the Warm Season
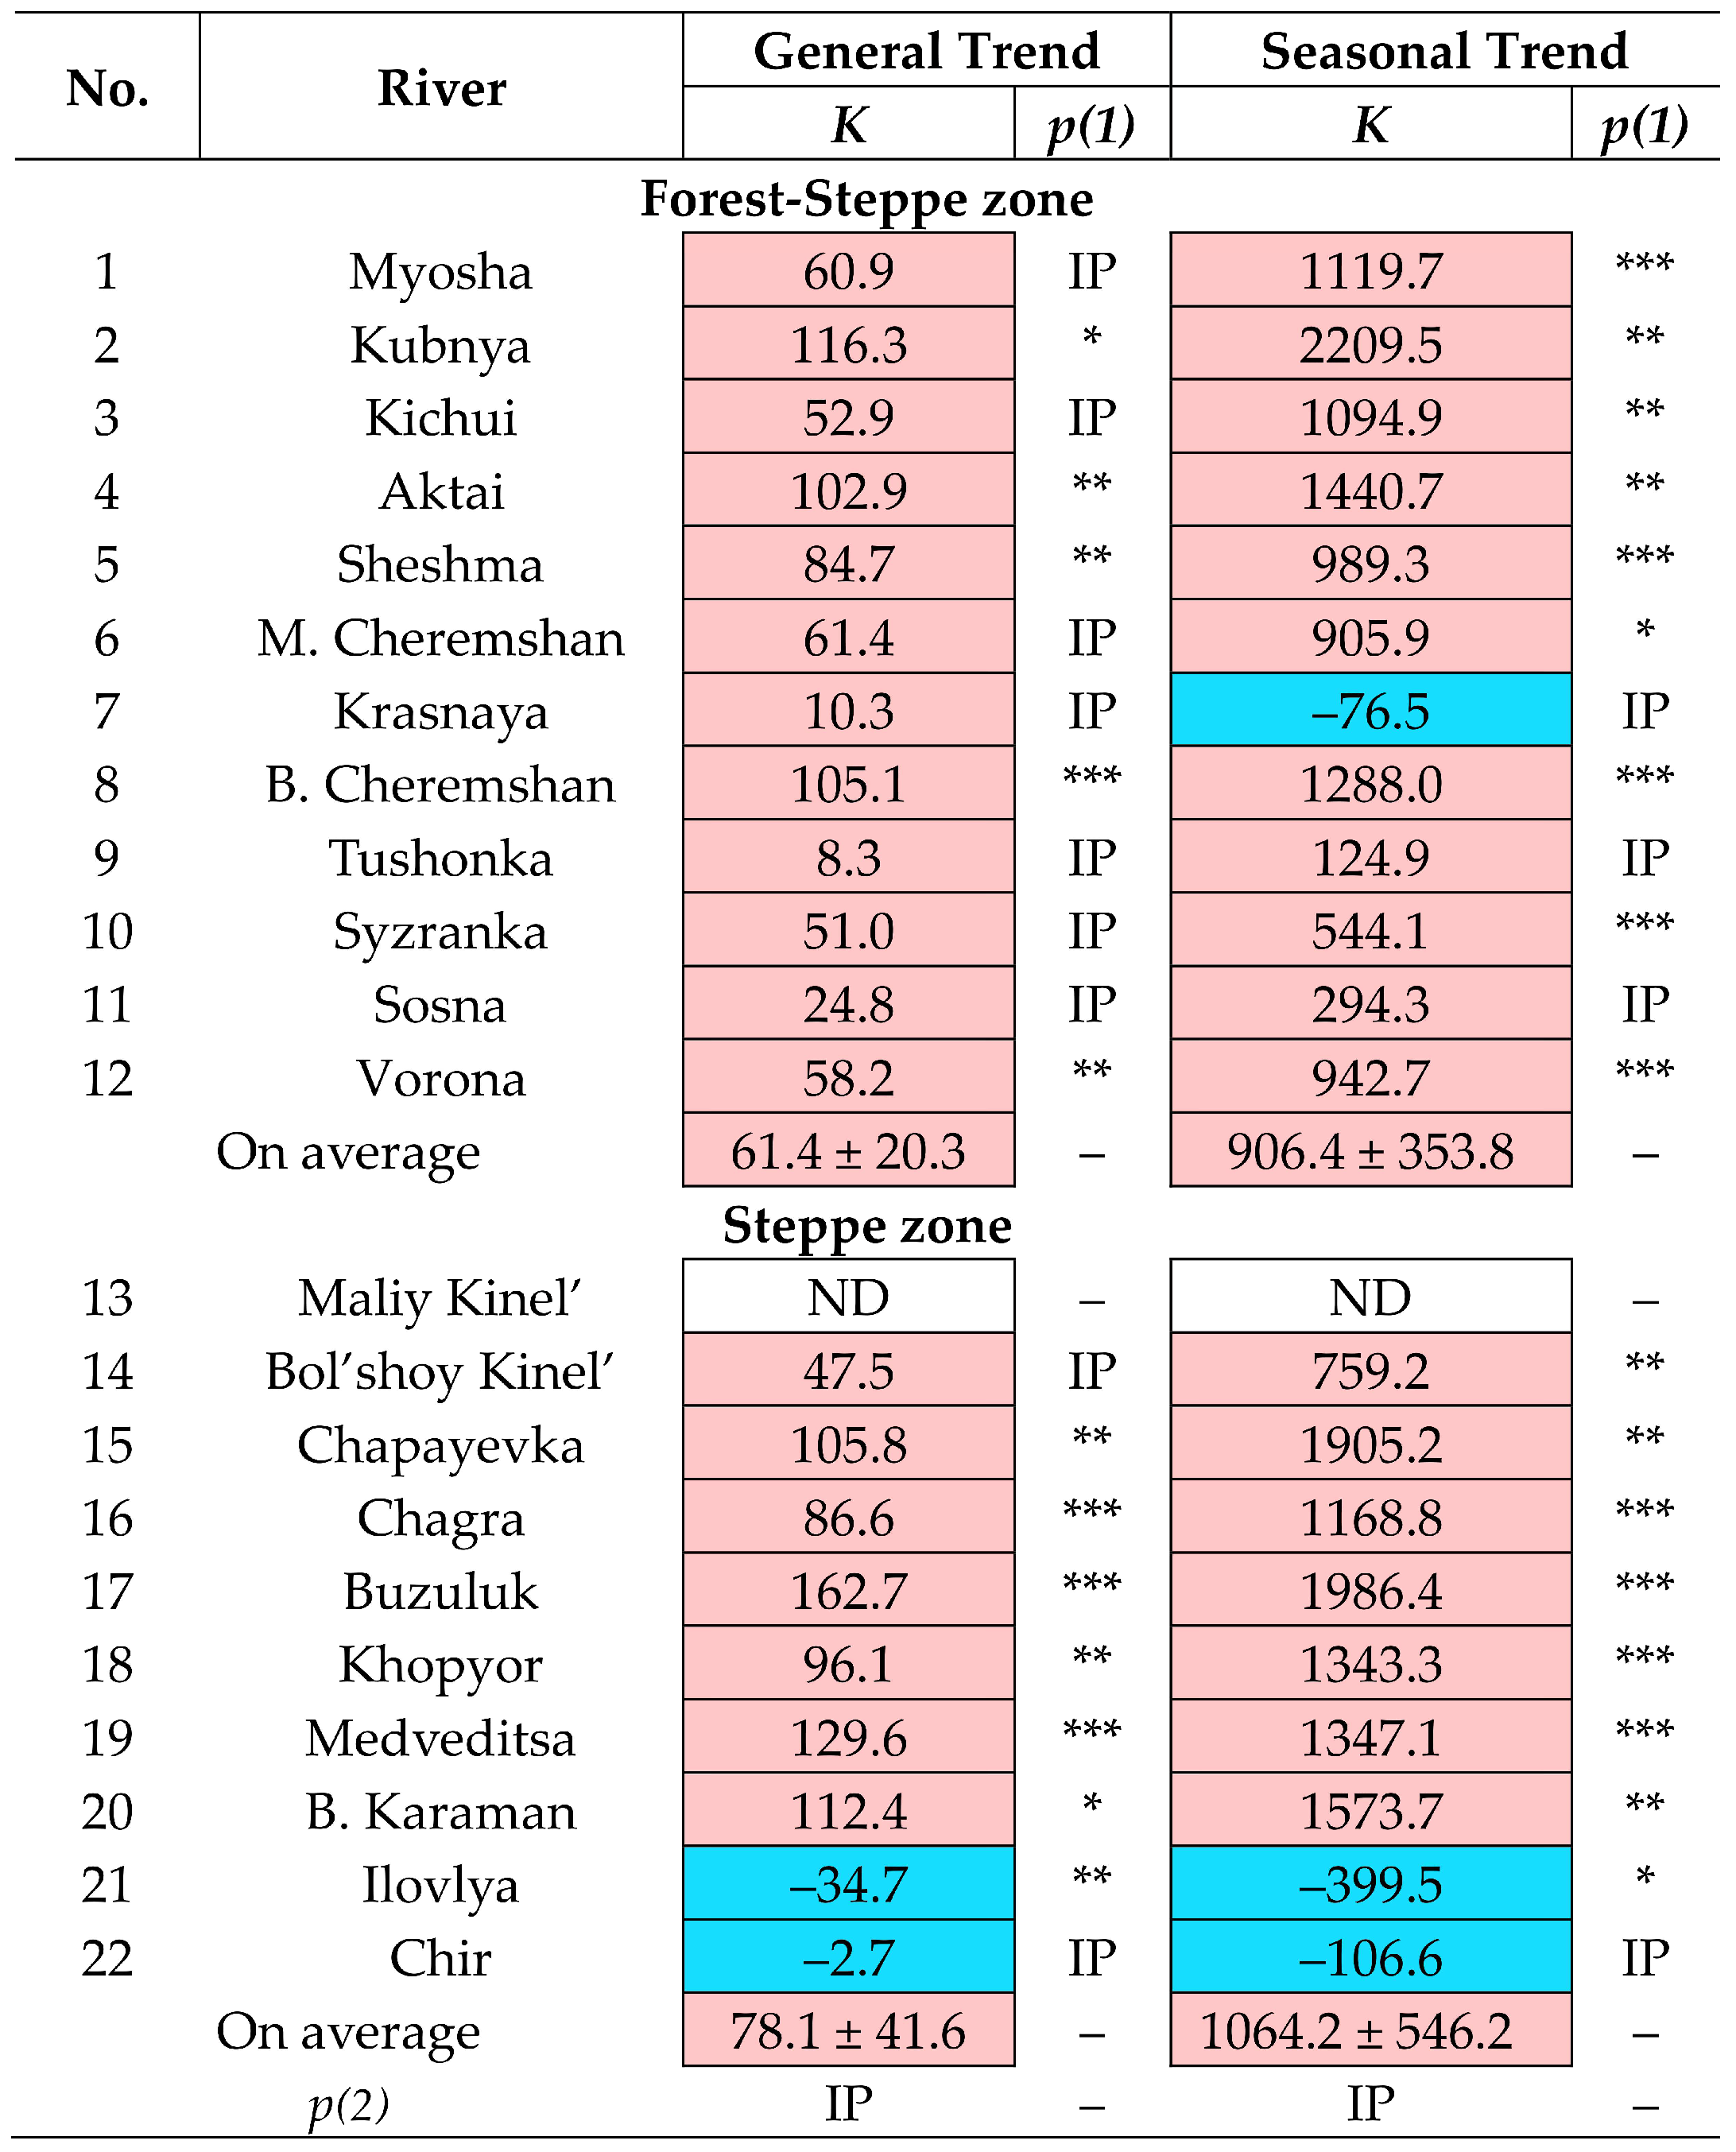
As with
Qmin-CP, the annual minimum flow of the warm season (
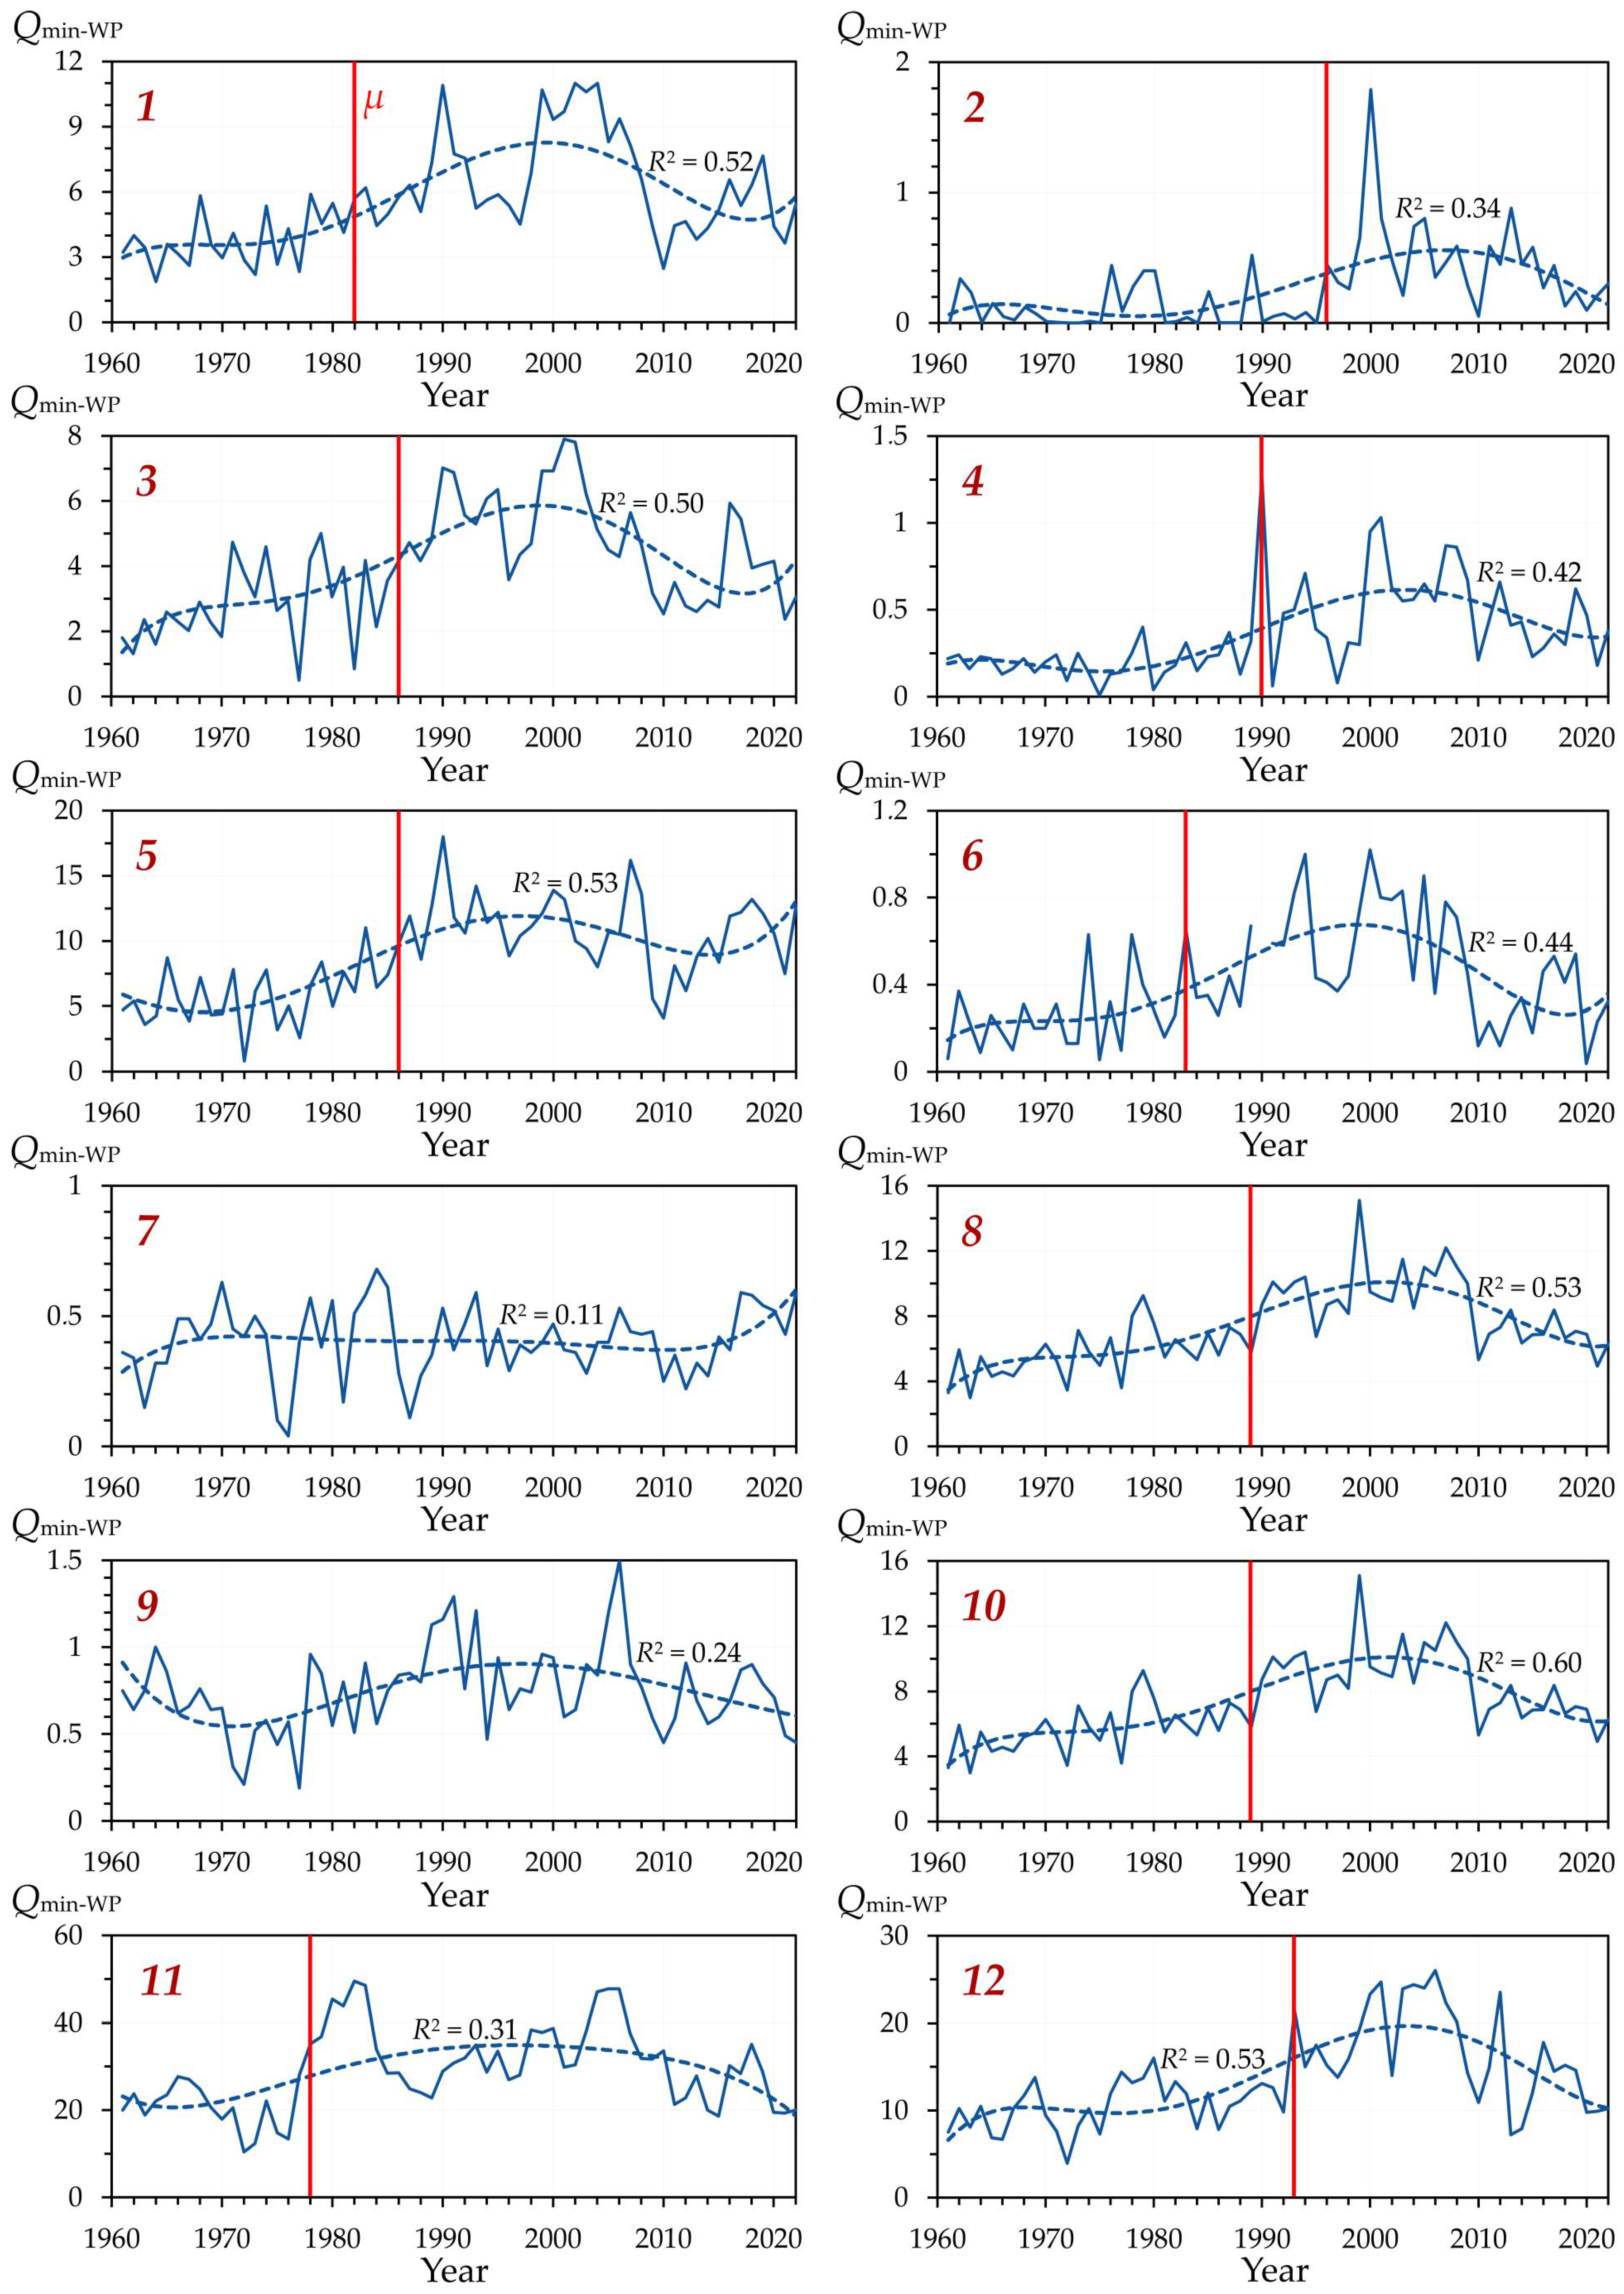
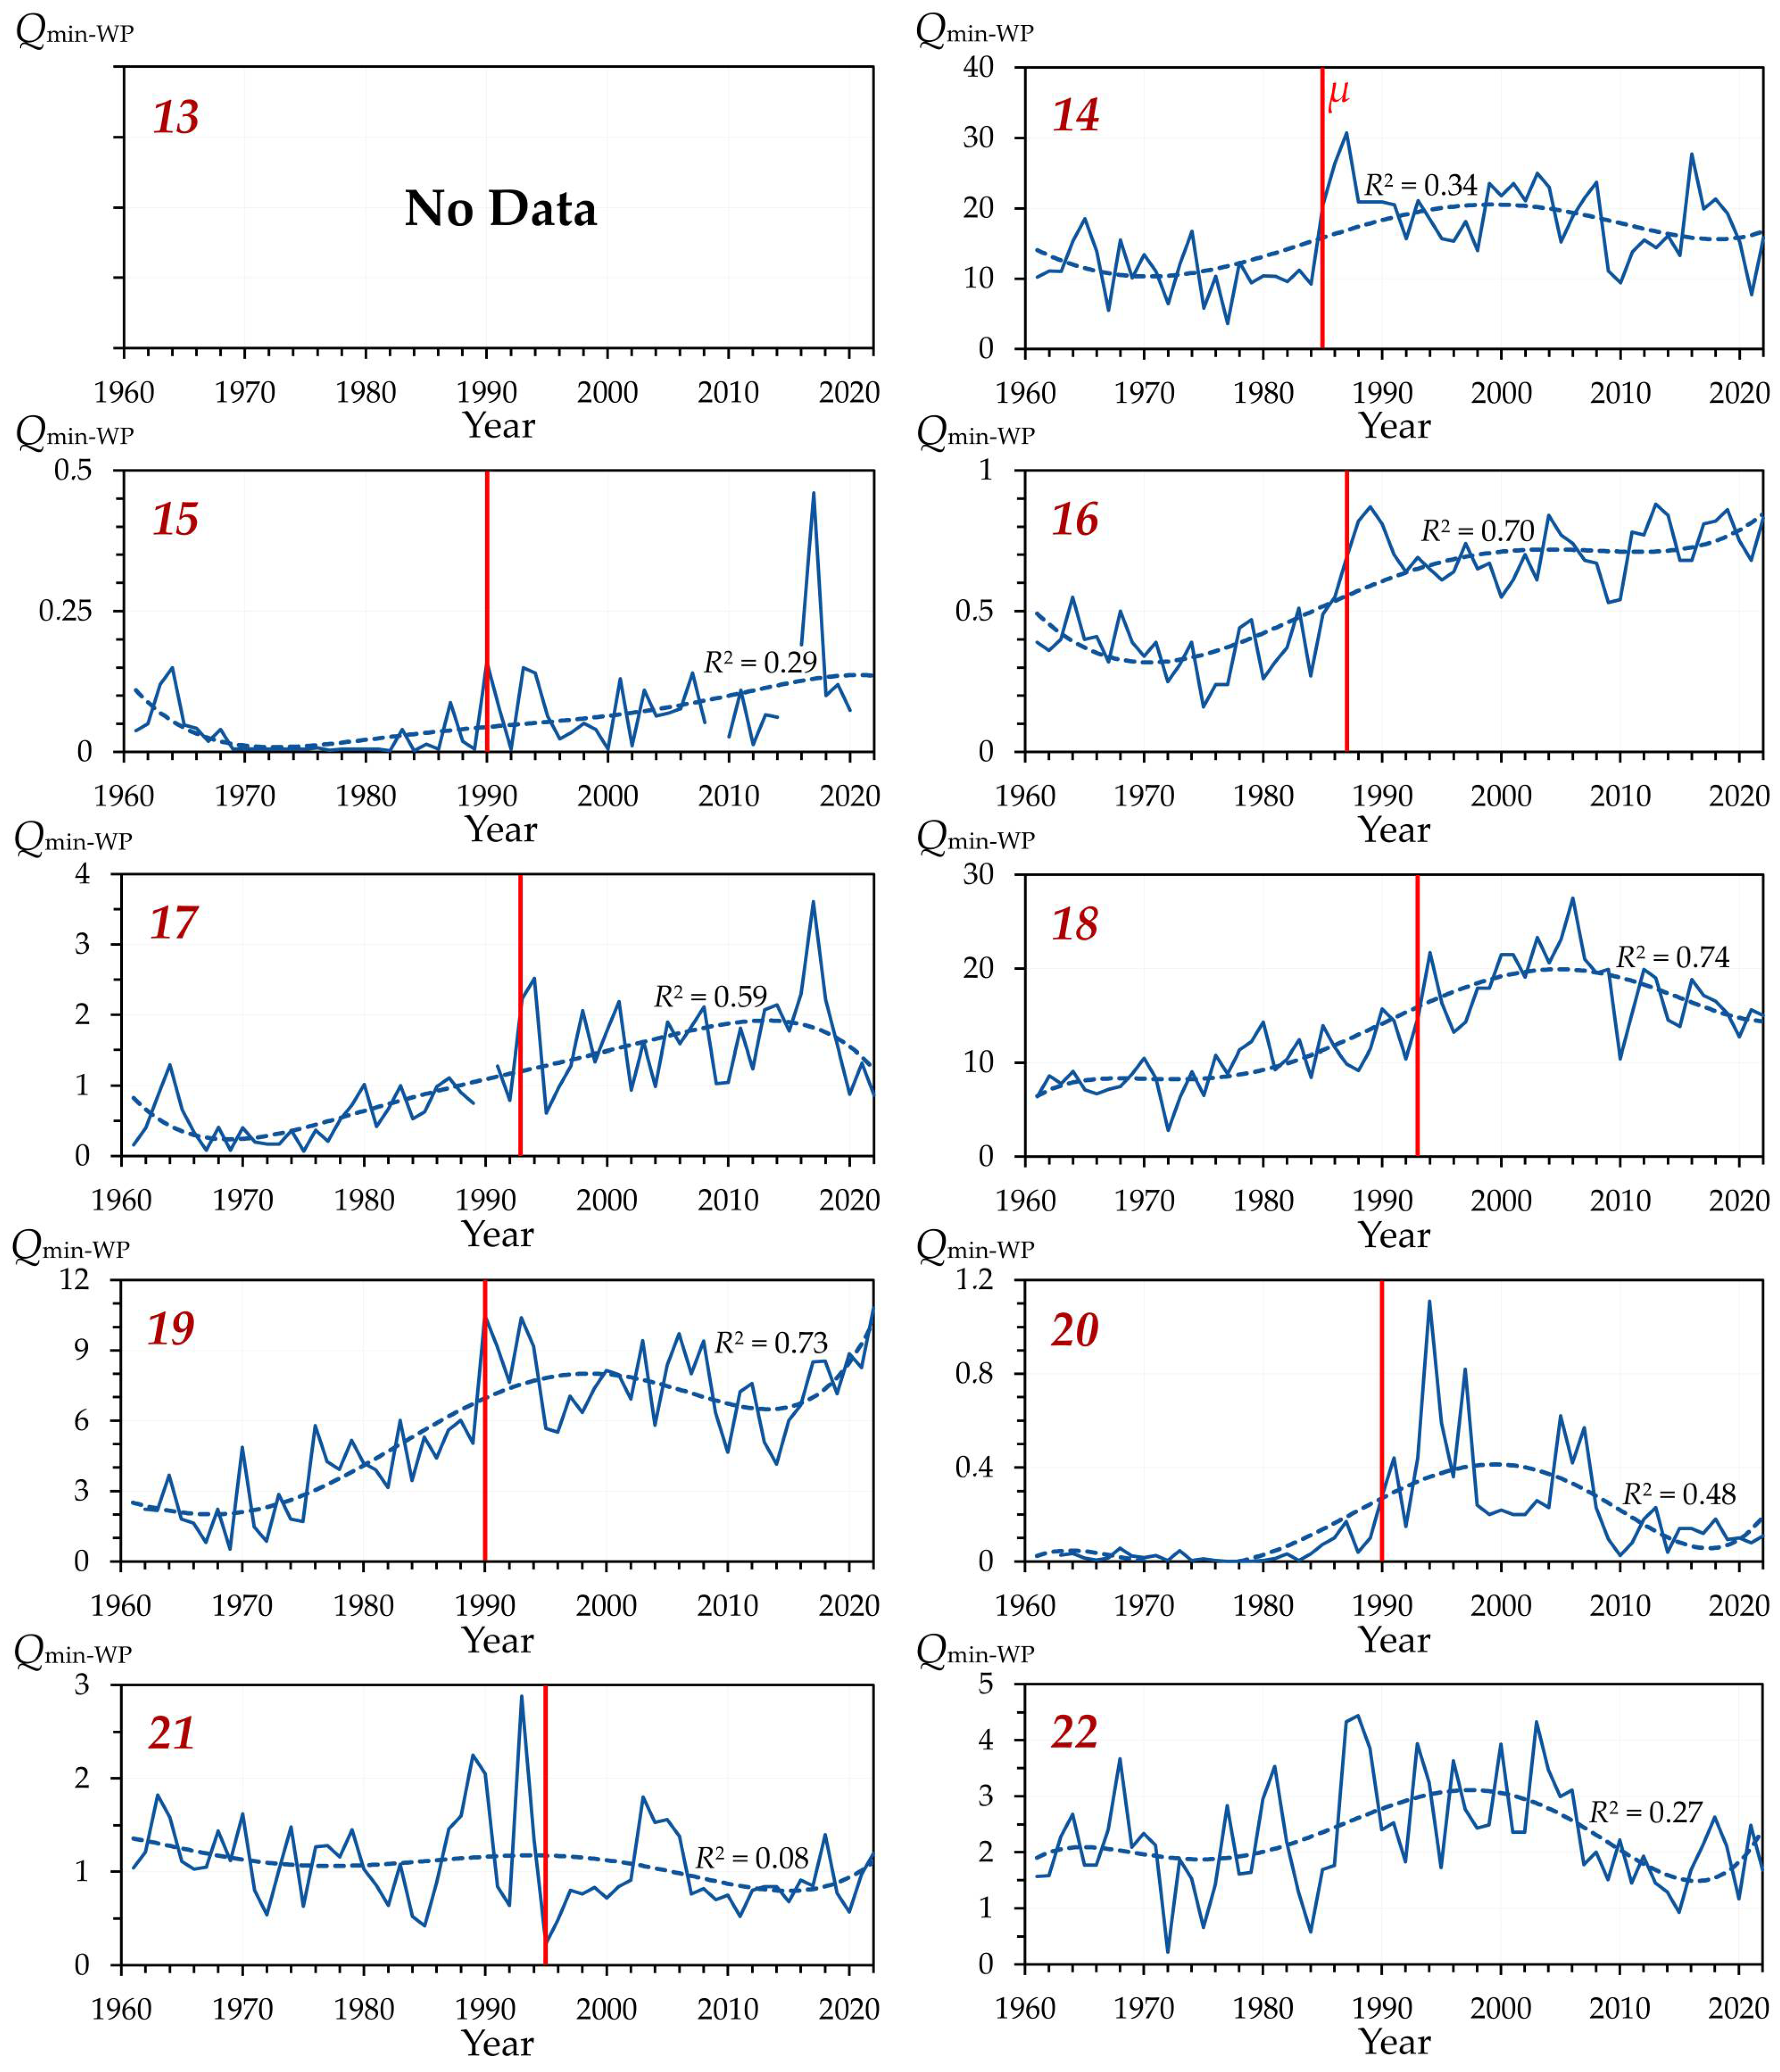
Qmin-WP) had a predominant increasing general and seasonal trends (in 86–90% of the analyzed rivers) during the period under consideration: in 92–100% of cases in the forest-steppe zone and 78% of cases in the steppe zone (in the latter, in the Ilovlya River, the decreasing general and seasonal trends in
Qmin-WP even had statistical significance) (
Figure 13). However, in contrast to
Qmin-CP, the general trend of
Qmin-WP growth in 1961–2022 had a predominant statistical significance only in the rivers of the steppe zone (in 78% of cases), while in the rivers of the forest-steppe zone it was detected in less than half of the cases (42%). In the seasonal trend in these landscape zones, the statistical significance was higher—89% and 75%, respectively.
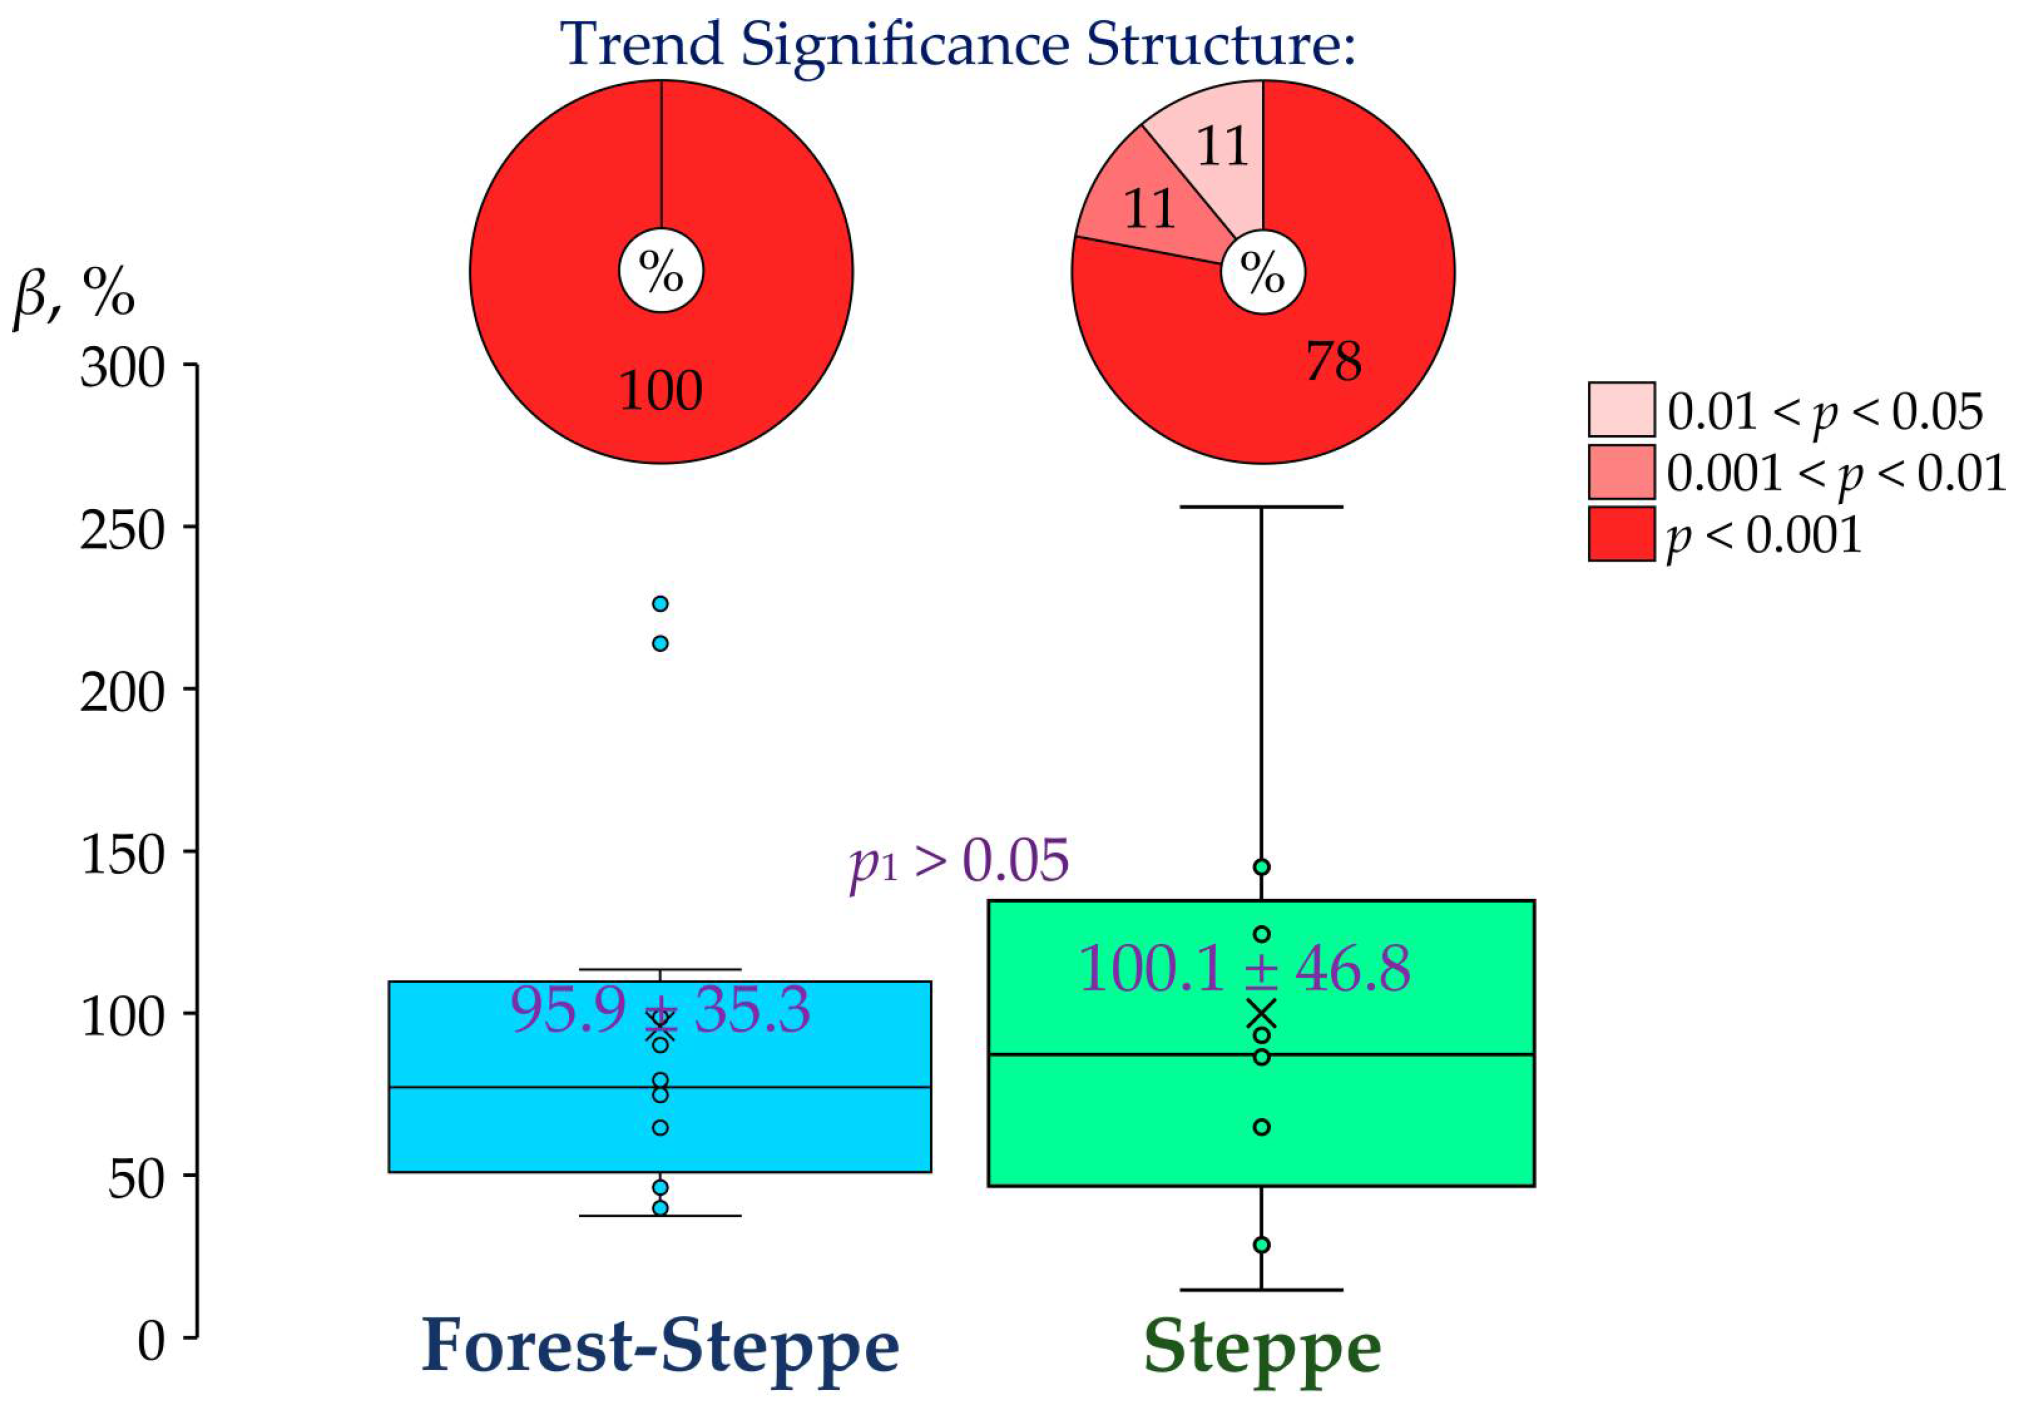
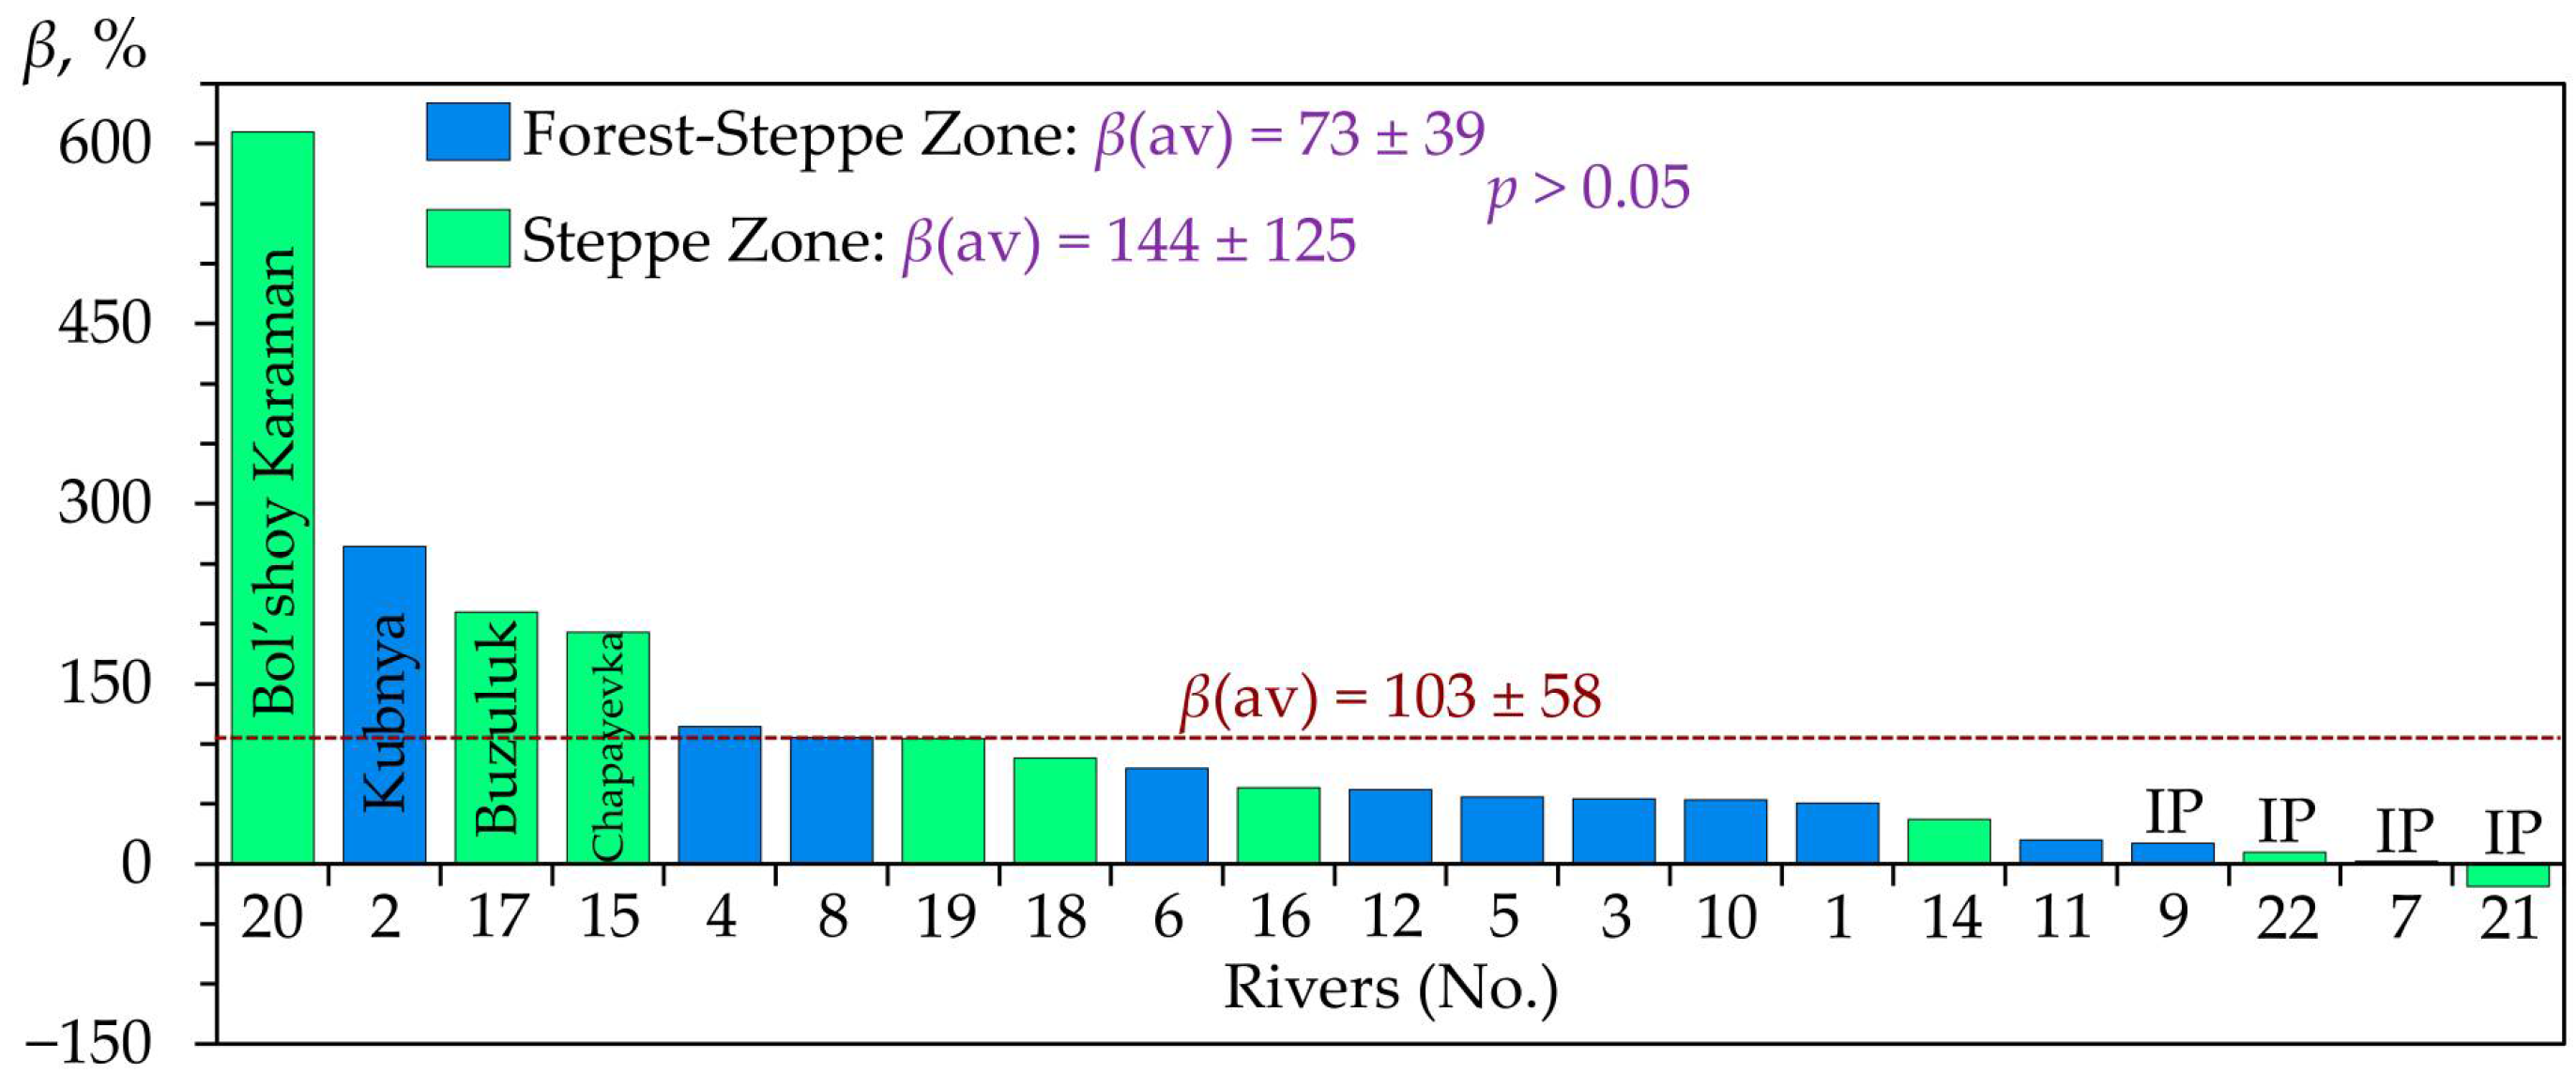
An increase in the minimum water flow during the warm period of the year (
Qmin-WP) was also significant (on average, by 103%) between 1961–1990 and 1991–2020 (
Figure 14).
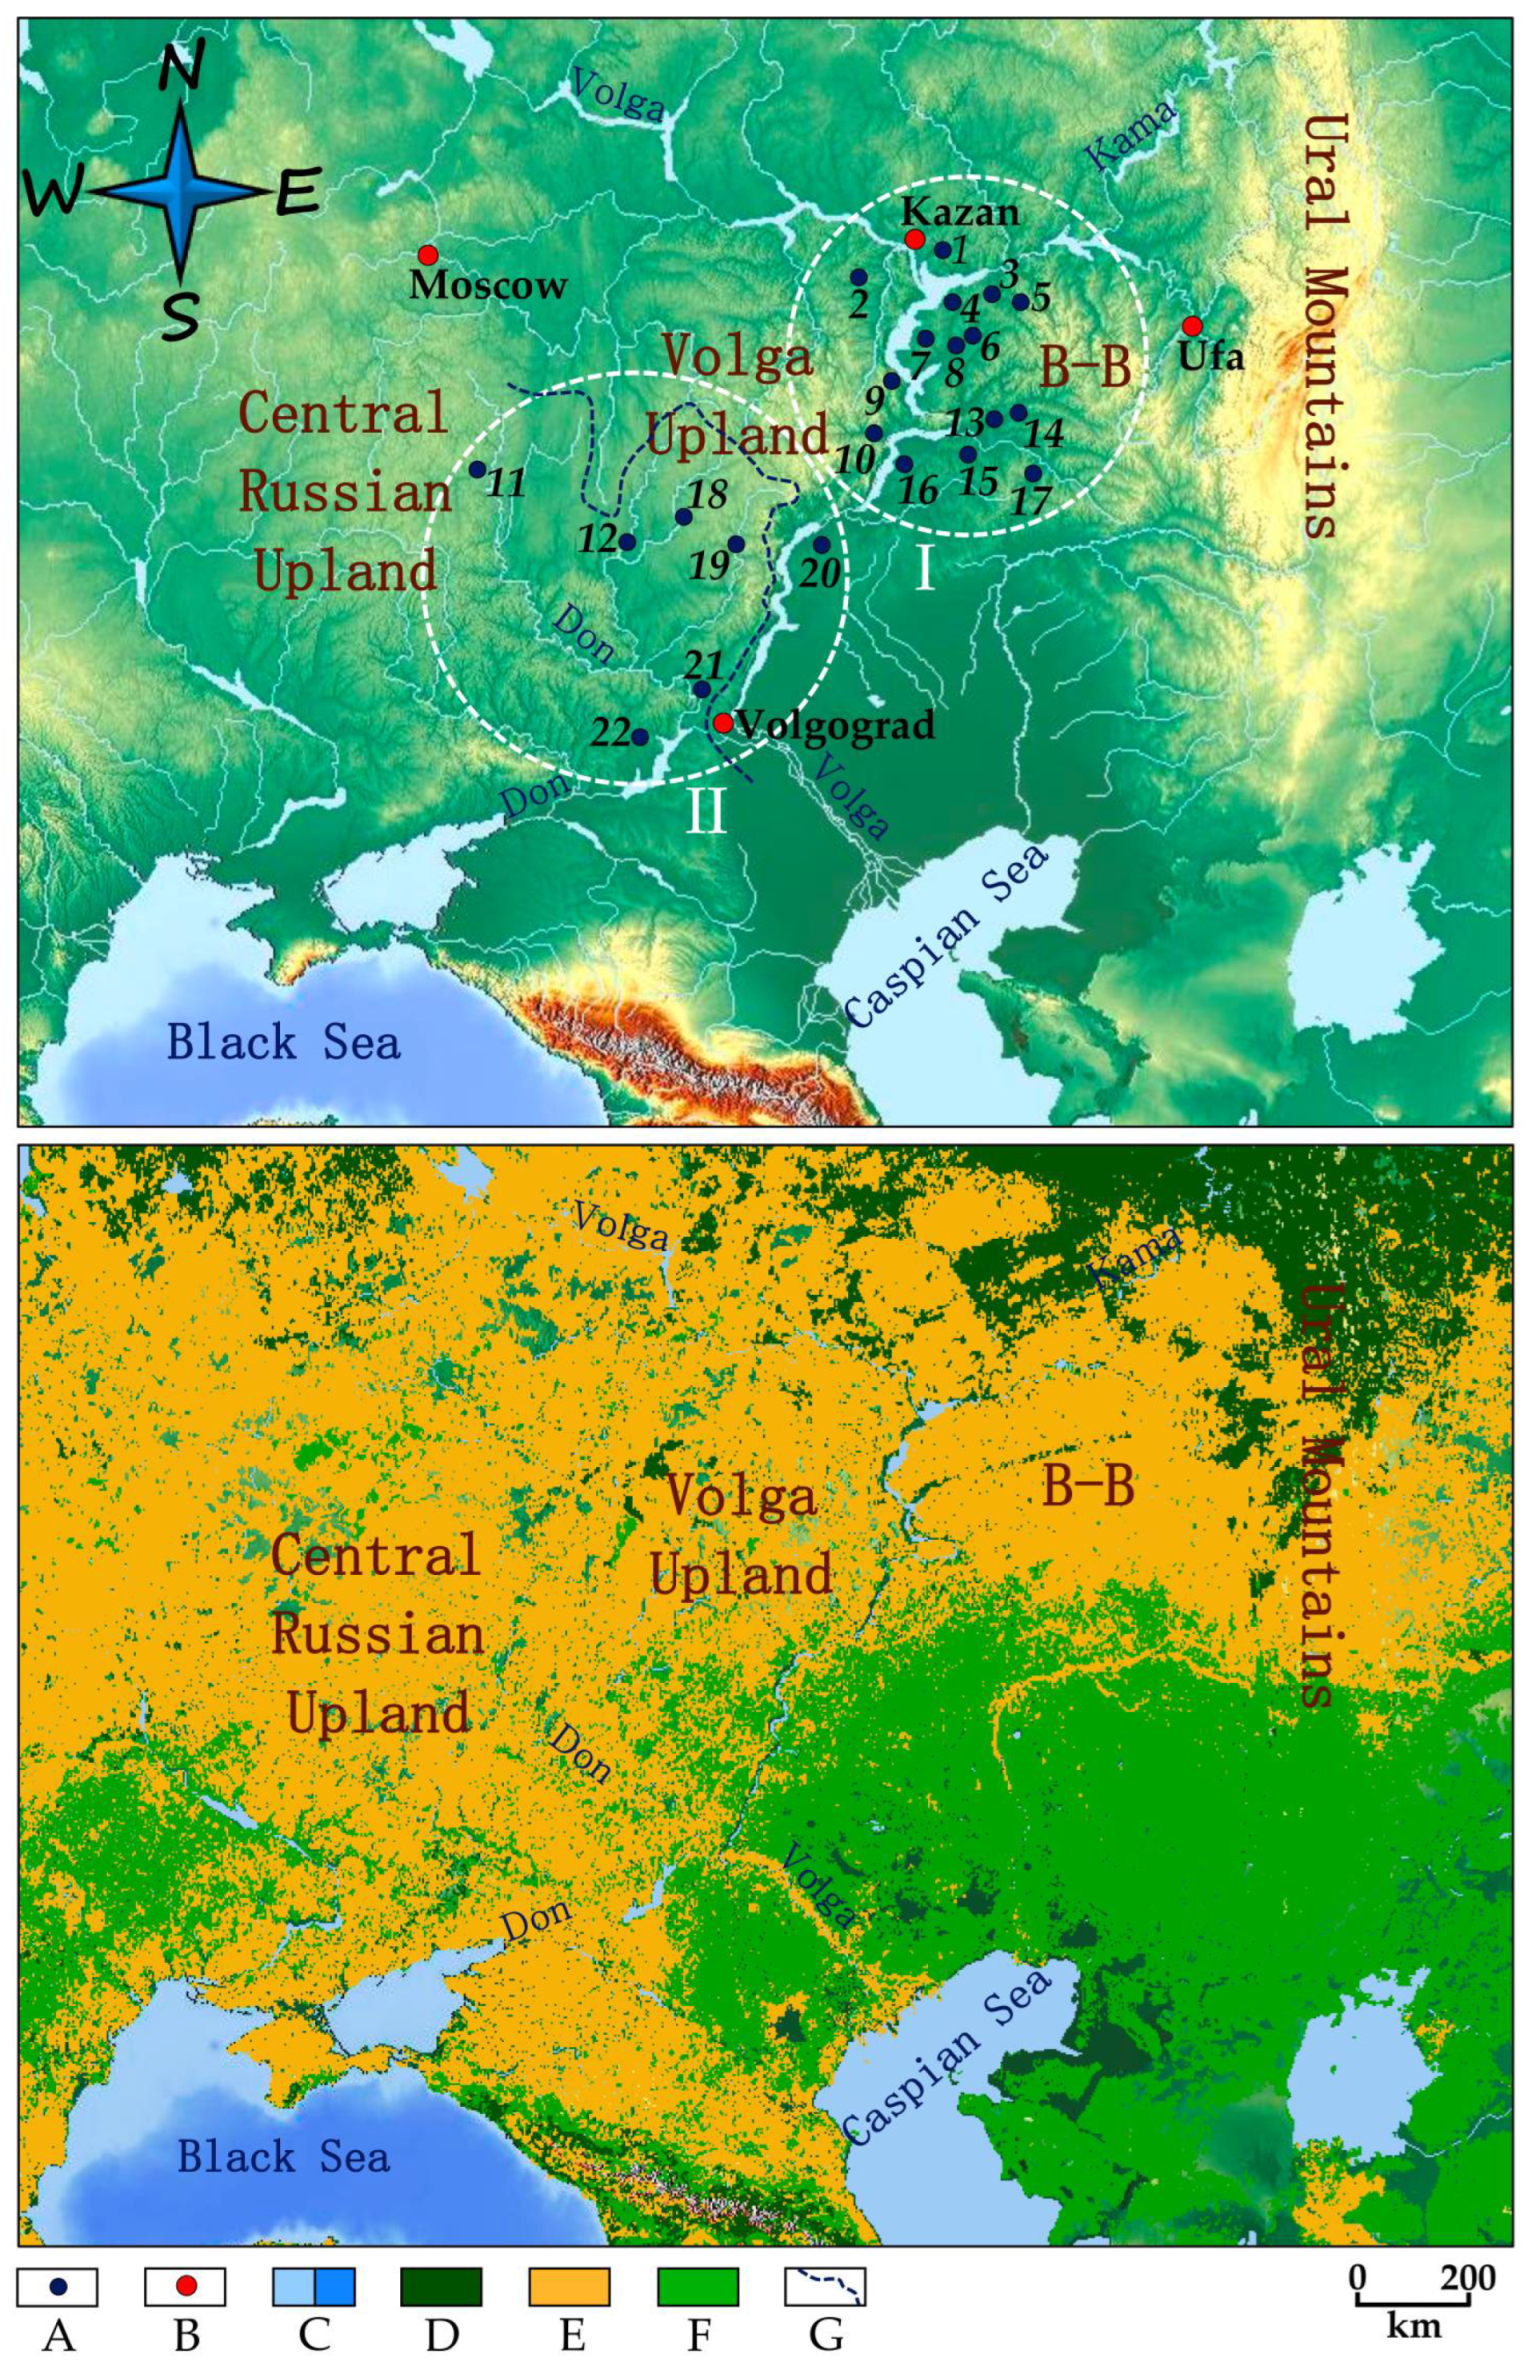
Except for two rivers in the Middle Volga region (see Sector I in
Figure 1) and two rivers in the extreme south of the region covered by the study (within the Don River basin, see Sector II in
Figure 1), the identified increases in the coefficient
β were statistically significant. As in the case of
Qmin-CP, no statistical significance was also found in the difference of the average values of
β for
Qmin-WP between the forest-steppe and steppe zones.
As for the ratio of values K and β for each river in the study region, their overall good comparability was revealed, which is expressed in high coefficients of their linear correlation (r). For the parameter Q, r is equal to 0.88 in magnitude and 0.77 in sign; for Qmax, 0.81 and 1.0, respectively; for Qmin-CP, 0.85 and 0.95, respectively. For Qmin-WP, the coefficient r turned out to be comparatively low—0.60 and 0.81, respectively. The reasons for these discrepancies require separate study.
3.3. Changes in Intra-Annual Variability
It is quite expected that the above-described changes in the main hydrological parameters also entailed changes in their ratios, which are one of the indicators of intra-annual variability of river water flow. The value of the coefficient
β for the parameter
Qmax/
Q shows that, on average, across the entire region under study, this ratio declined by 40% (or 1.7 times) between the baseline periods 1961–1990 and 1991–2020 (see
Table A1 in
Appendix B). These reductions were statistically significant in 100% of cases in the forest-steppe zone and in 80% of cases in the steppe zone. Moreover, the analyzed rivers of the forest-steppe zone were characterized by a more noticeable variability reduction (statistically significant difference) in the flow, according to
β, than the rivers of the steppe zone.
The reduction in
Qmax/
Qmin-CP and
Qmax/
Qmin-WP between the periods indicated turned out to be even more significant: on average, by 70–73% in the analyzed rivers of the forest-steppe zone (100% statistical significance) and by 65–68% in the steppe zone (89% statistical significance) (see
Table A2 in
Appendix B). No statistically significant difference was detected between the average coefficients
β computed for rivers in the forest-steppe and steppe zones for the two ratios under consideration.
As for the coefficient
β, computed based on the ratio of two minimum water flows
Qmin-WP/
Qmin-CP, it revealed significant variability in both the forest-steppe and steppe zones. If we take into account the average values, we can state a slight decrement (by 16%) in this ratio only in the forest-steppe zone; however, even in this case, in almost 60% of the rivers, these changes were not statistically significant (see
Table A2 in
Appendix B). These changes were also statistically insignificant in 89% of the rivers in the steppe zone.
3.4. Changes in Interannual Variability
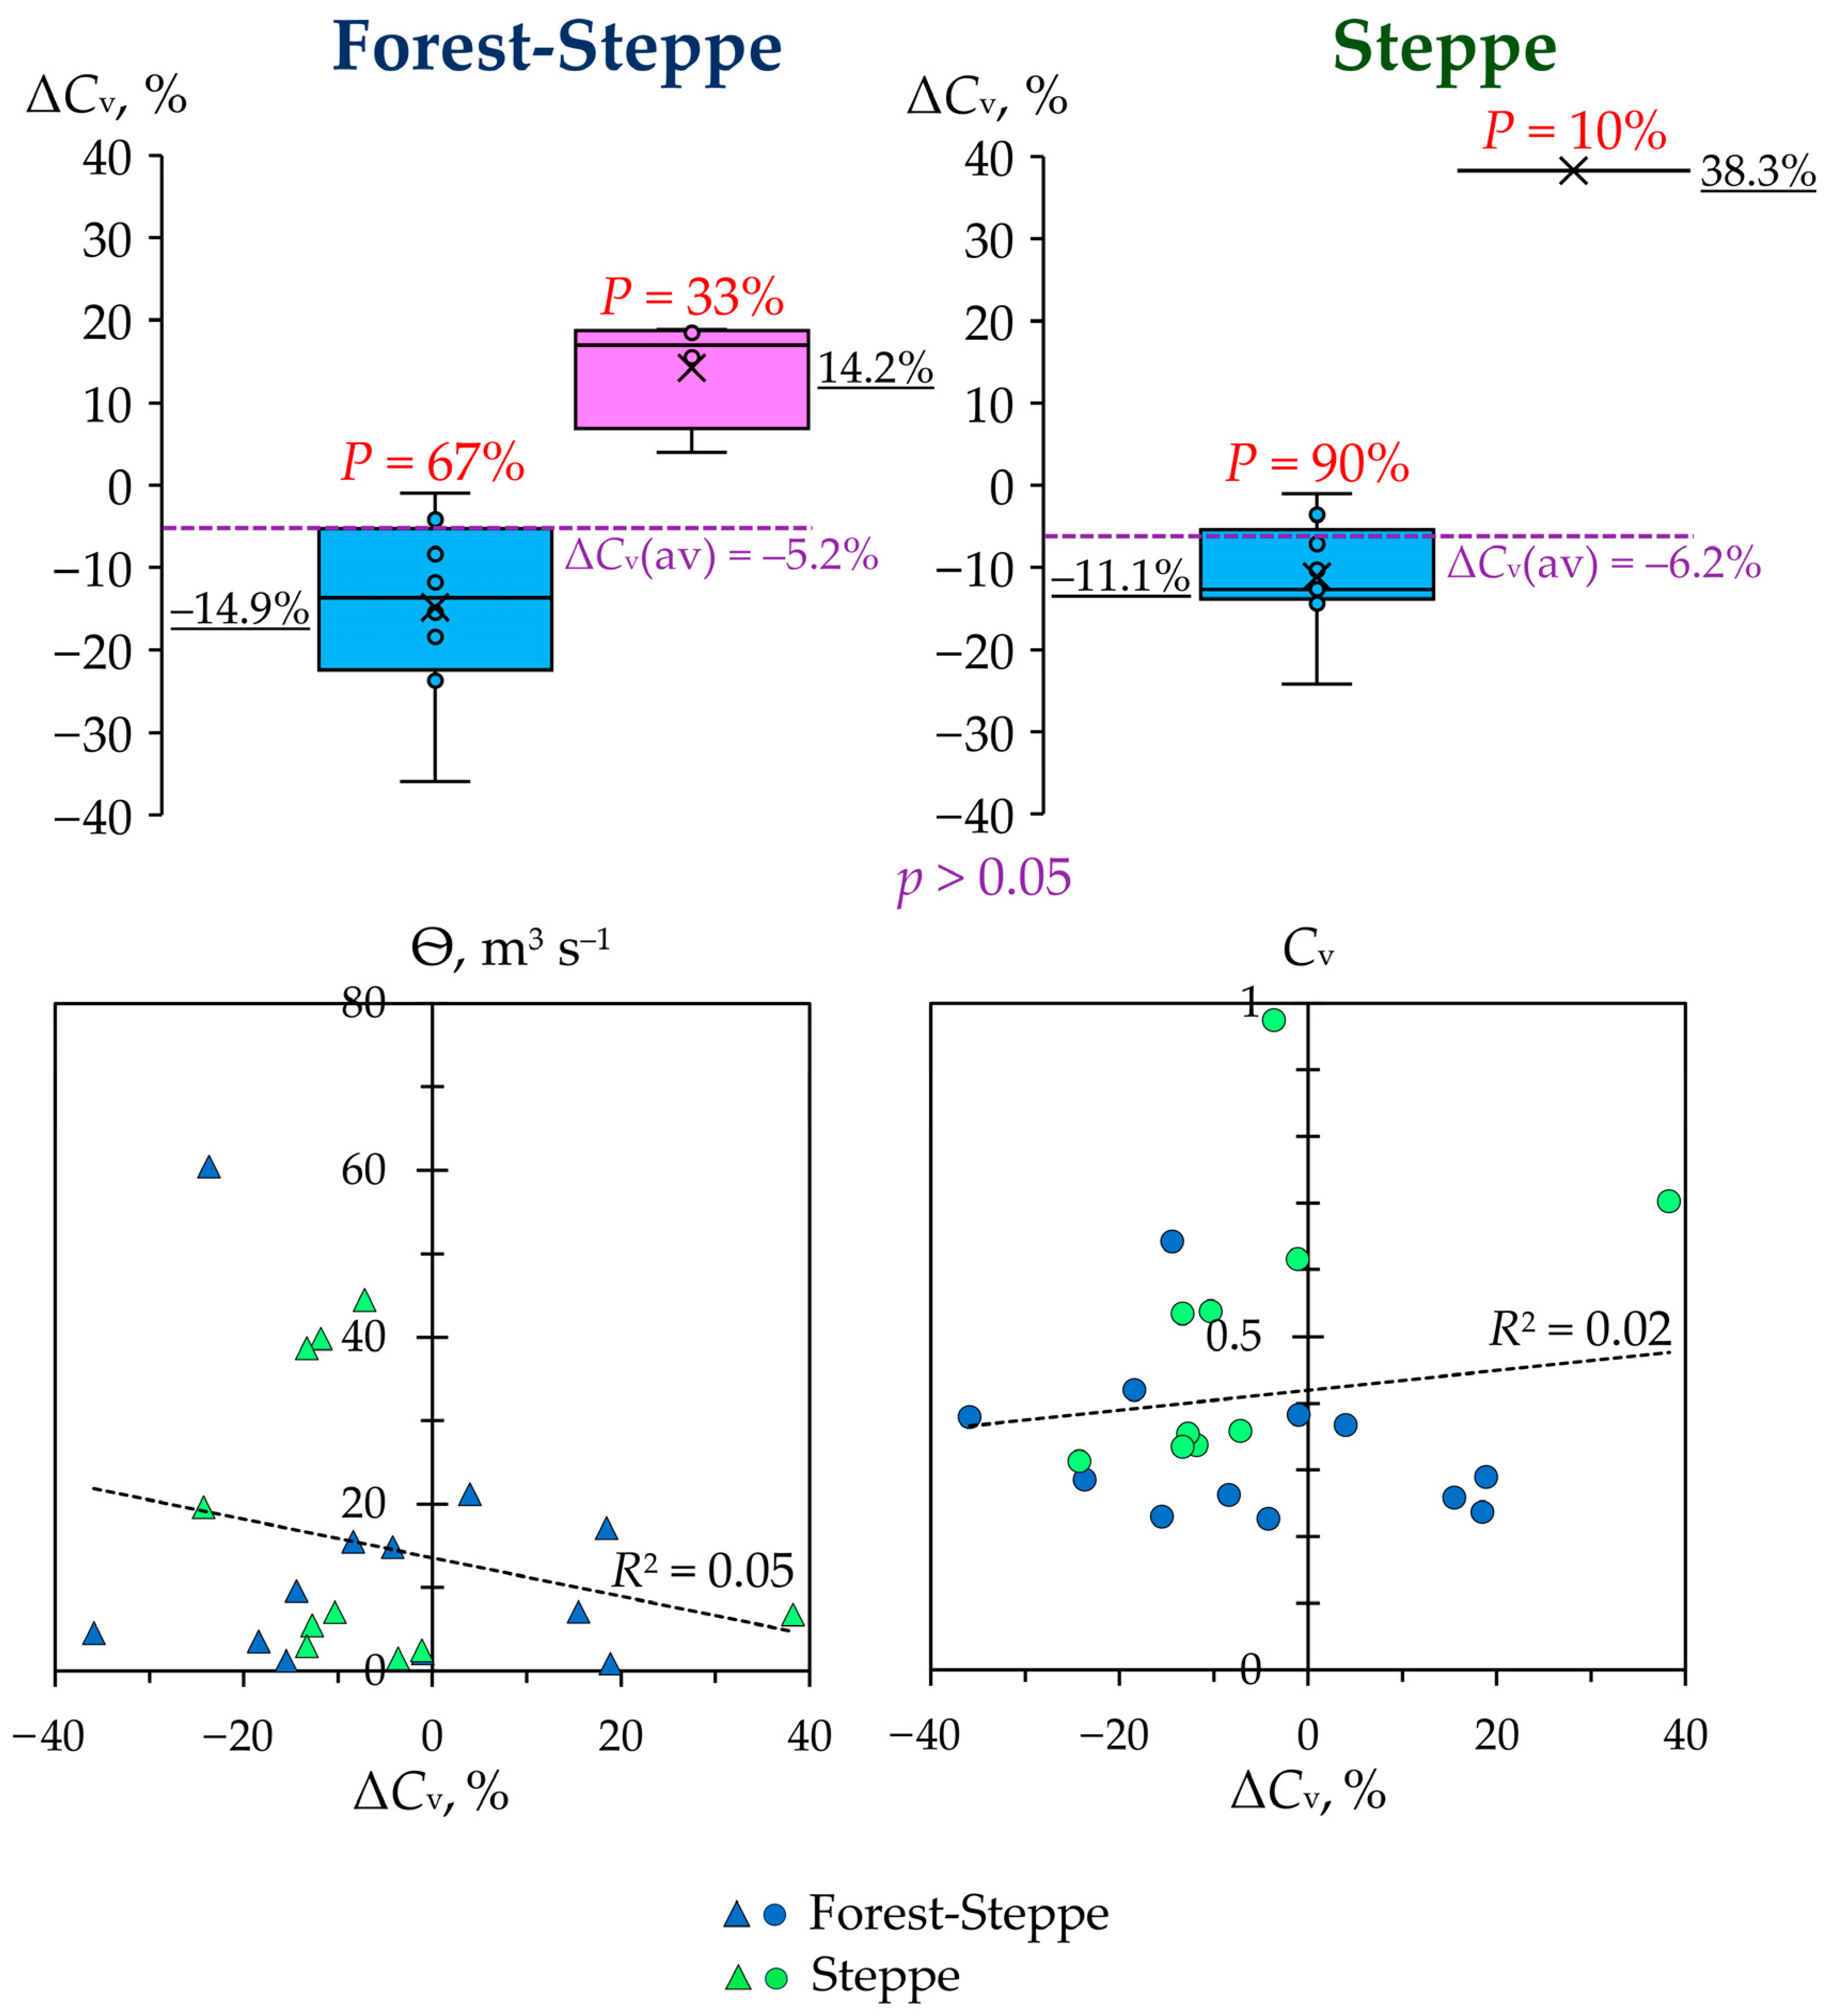
In the study region, a slight decrease (by 5–6%) in the interannual variability of the annual average water flow (
Q) was noted between the baseline periods 1961–1990 and 1991–2020. This decrease was reflected in a decline in the Δ
Cv coefficient (
Figure 15). It is noteworthy that in 33% of the rivers of the forest-steppe zone and 10% (the Ilovlya River) of the steppe zone, an increase in the interannual variability of
Q was detected. No statistically significant dependence of the coefficient Δ
Cv on the long-term average
Q and the long-term average variability of the flow was revealed.
There were also changes in the interannual variability of the annual maximum water flow (Qmax), which differed in the landscape zones considered. In the forest-steppe zone of the east of the East European Plain, the tendency towards decreasing variability of Qmax generally prevailed (67% of the studied rivers, in contrast to 60% in the steppe zone), and the average zonal value of ΔCv was −12.2%, in contrast to +1.7% in the steppe zone (with statistical significance of the difference in the average values between these zones). No statistically significant dependence of the coefficient ΔCv on the long-term average values of Qmax and the long-term average variability of Qmax was traced.
The overall decrease in the interannual variability of the cold season minimum water flow (Qmin-CP) between the baseline periods 1961–1990 and 1991–2020 by an average of 26% in the forest-steppe and 21% in the steppe was due to the prevailing tendency to decrease the variability of this flow in 83% and 78% of the rivers in these zones, respectively. No statistically significant difference in the average values of ΔCv was found between the rivers of the forest-steppe and the steppe. Also, no statistically significant dependence of the ΔCv coefficient on the long-term average values of Qmin-CP and the long-term average variability of Qmin-CP was revealed.
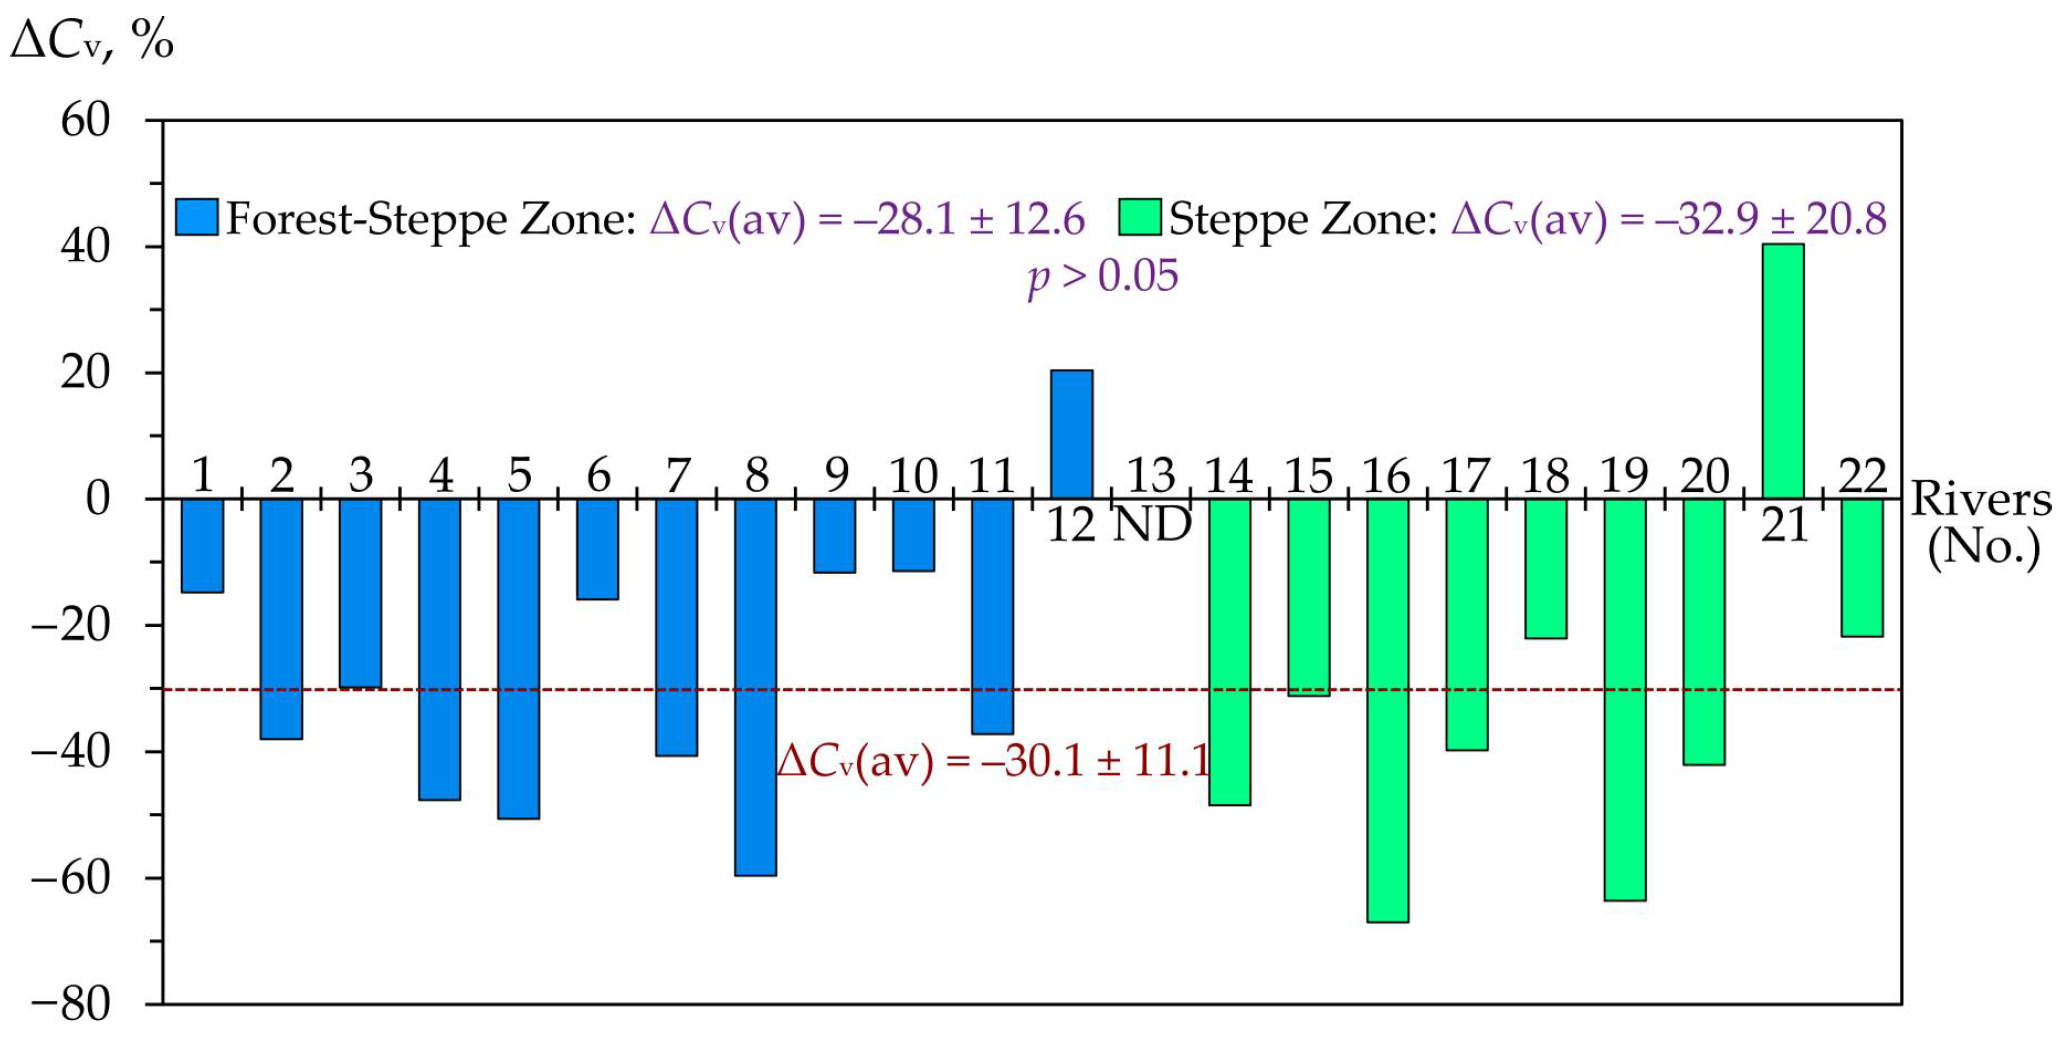
The greatest changes occurred in the interannual variability of the minimum water flow during the warm period of the year (
Qmin-WP). For all the analyzed rivers, the reduction in the coefficient of interannual
Qmin-WP variation (
Cv) averaged about 30% between 1961–1990 and 1991–2020 (
Figure 16). No statistically significant difference in the average values of Δ
Cv for
Qmin-WP was found between the rivers of the forest-steppe and the steppe.
3.5. Water Flow Changes and Some Factors
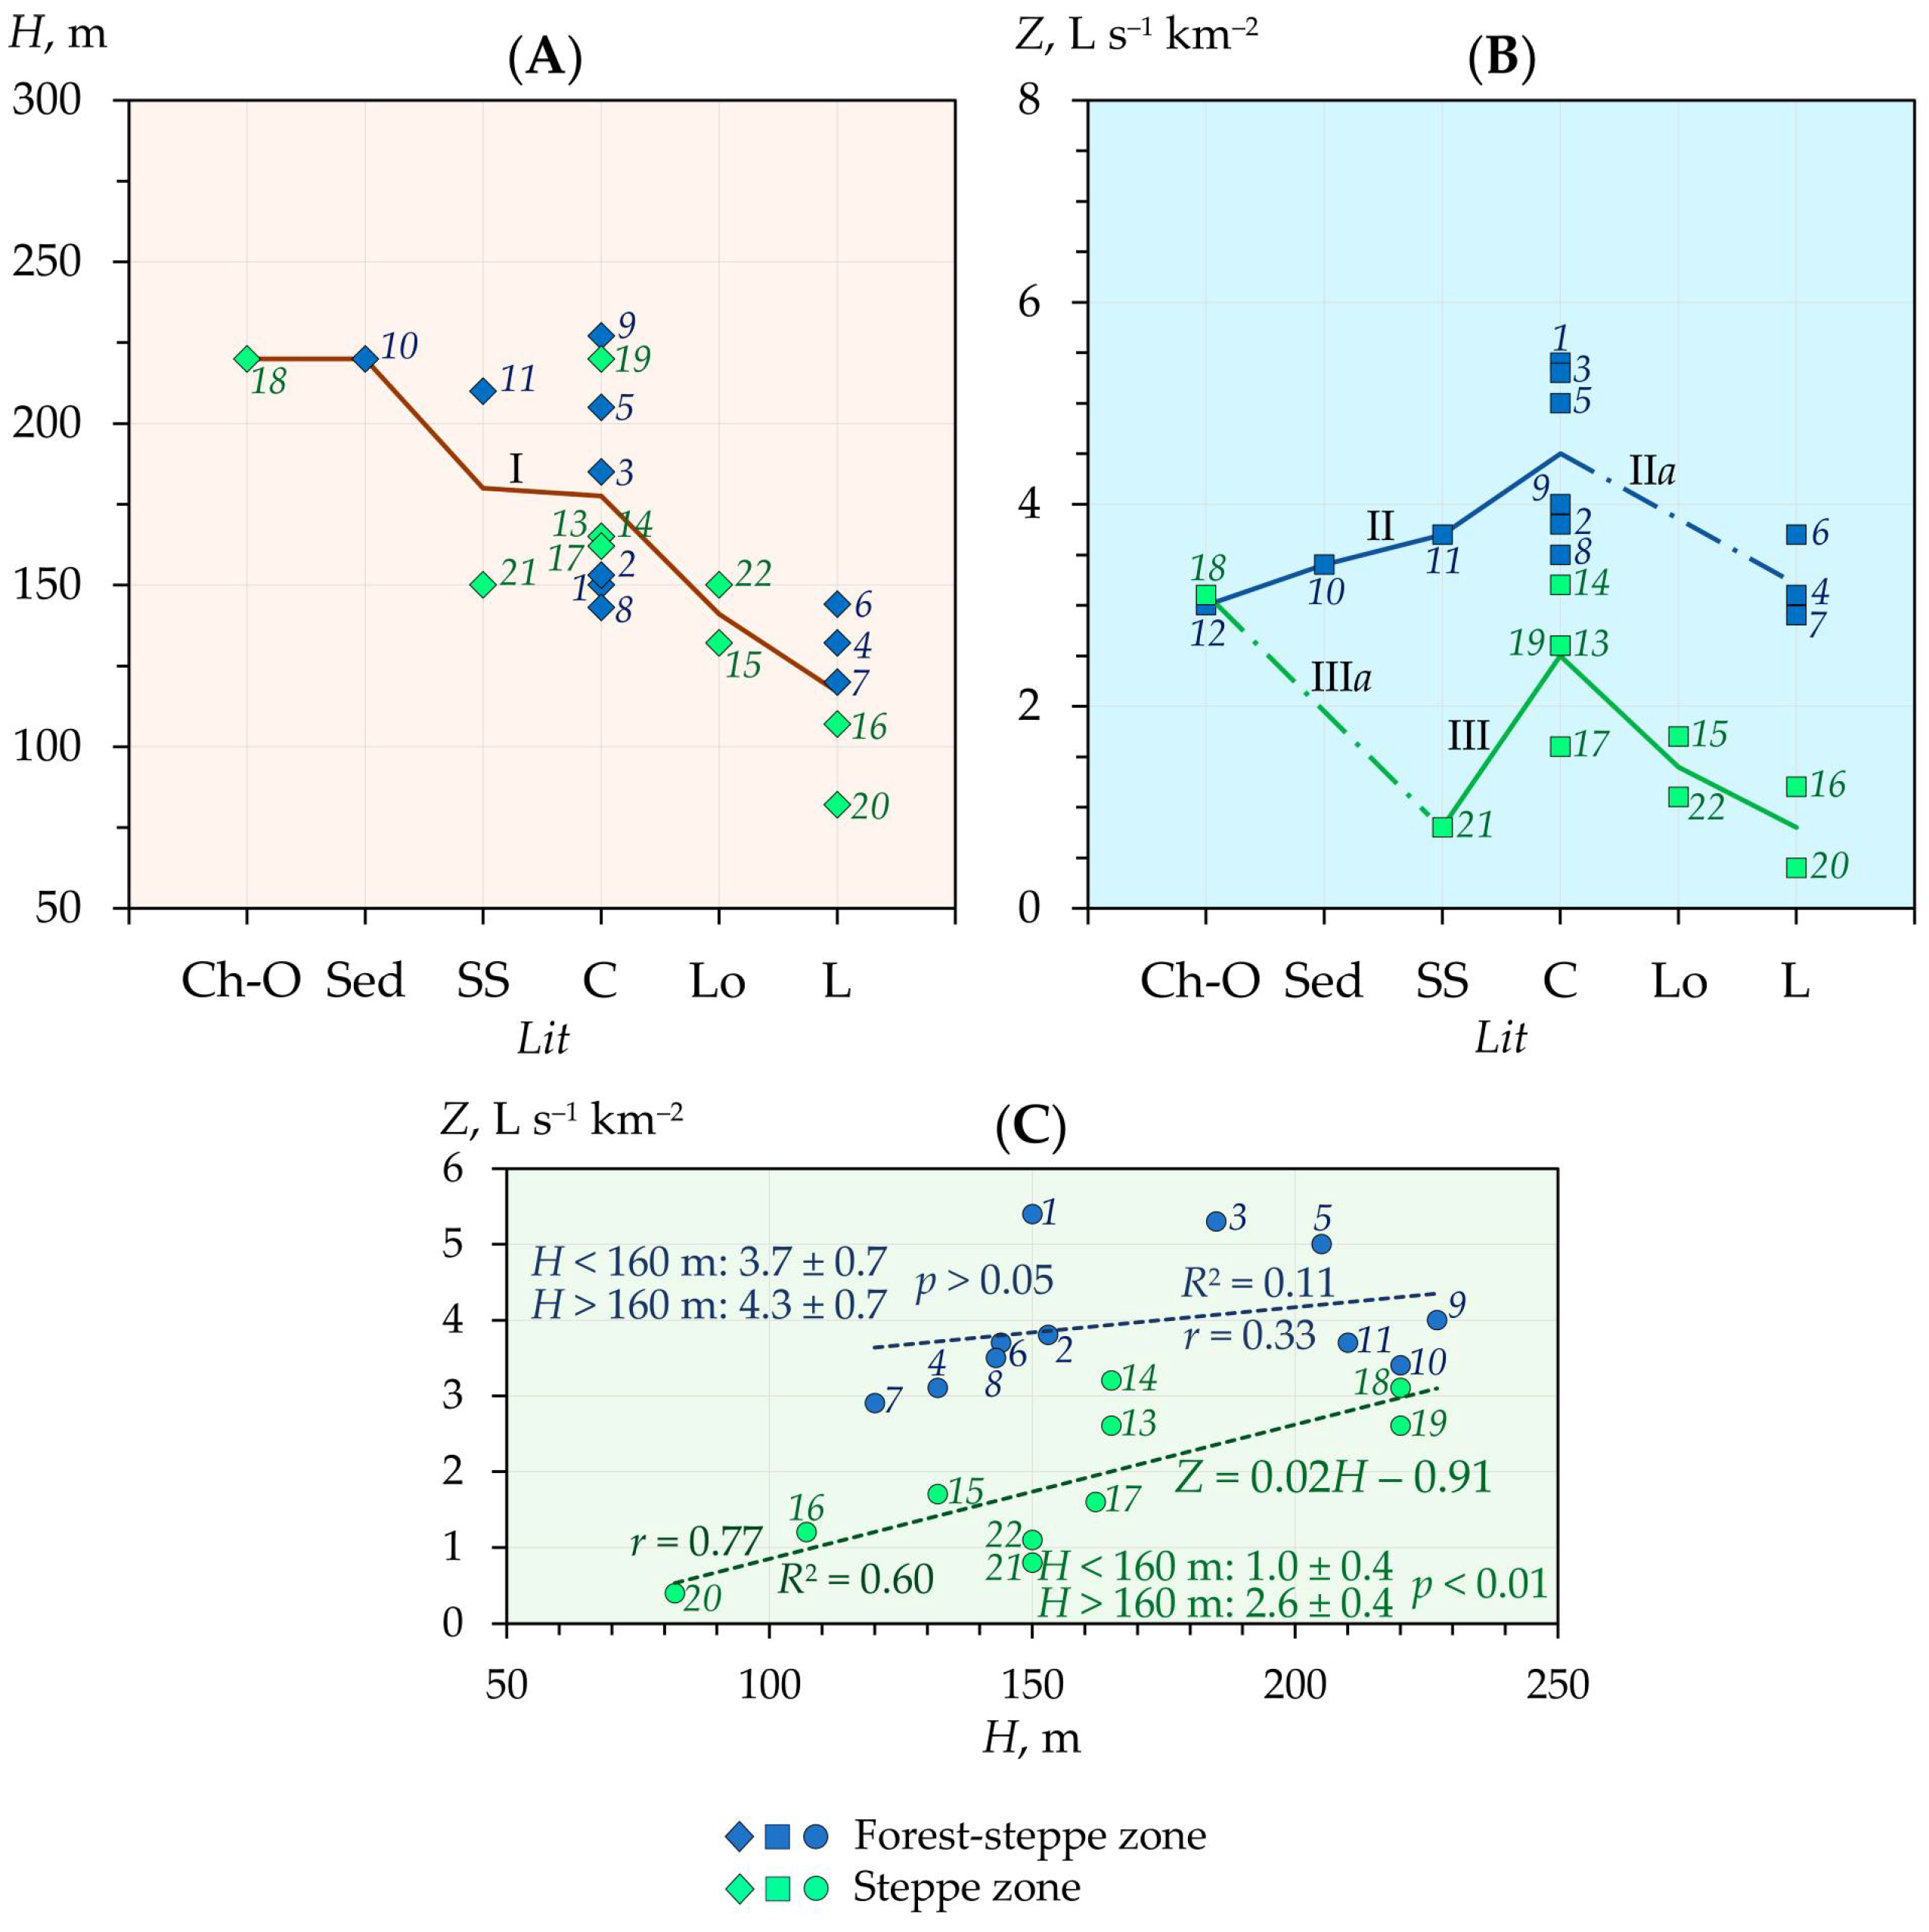
An analysis of the regional distribution of trends in the change of the annual average water flow (
Q) of the analyzed rivers between baseline periods (the coefficient
β) revealed some dependence on the absolute elevation of their basins (
Figure 17A).
This was especially clear and statistically reliable in the rivers of the steppe zone, as opposed to the forest-steppe zone. Thus, the elevation level of 160 m a.s.l. can be preliminarily called the regional topographic boundary of multidirectional trends in the change of Q (primarily for the steppe rivers) in the period from 1961 to 2020.
As for the annual maximum water flow (
Qmax) in the study region, no clear and statistically significant relationships were identified between its changes and changes in the absolute elevations of the analyzed river basins (
Figure 17B). However, as in the case of annual water flow, this relationship is manifested somewhat better in steppe river basins than in forest-steppe ones.
It is obvious that the specified dependence (
β =
f(
h, or
H)) reflects primarily changes in the flow of water in rivers with different long-term annual average flow volumes (Ѳ). The latter directly depends on the elevation of the river basins in given climatic conditions. In the more full-flowing rivers (with increasing Ѳ), an increase in
Q (
β) was observed between the baseline periods 1961–1990 and 1991–2020, and vice versa (see
Figure A9 in
Appendix A). This trend again turned out to be most noticeable and statistically significant in the rivers of the steppe zone.
The relationship
β =
f(Ѳ) is manifested even better if we take into account the factor of the river basin area, that is, through the use of the value of the specific water runoff (
Z, L s
−1 km
−2). As can be seen from
Figure 18, with an increase in
Z, an increase in the coefficient
β is traced. This dependence is again most clear and statistically significant for the analyzed rivers of the steppe zone, in contrast to the rivers of the forest-steppe zone.
In this regard, in the steppe zone, the value of Z equal to 2 L s–1 km–2 can be preliminarily considered a conditional boundary of changes in the sign of the value of β and, consequently, the direction of the trend in the change in the annual average water flow (Q) of rivers in the study region. When Z > 2 L s–1 km–2, the annual water runoff increased, and when Z < 2 L s–1 km–2, it decreased between the baseline periods 1961–1990 and 1991–2020.
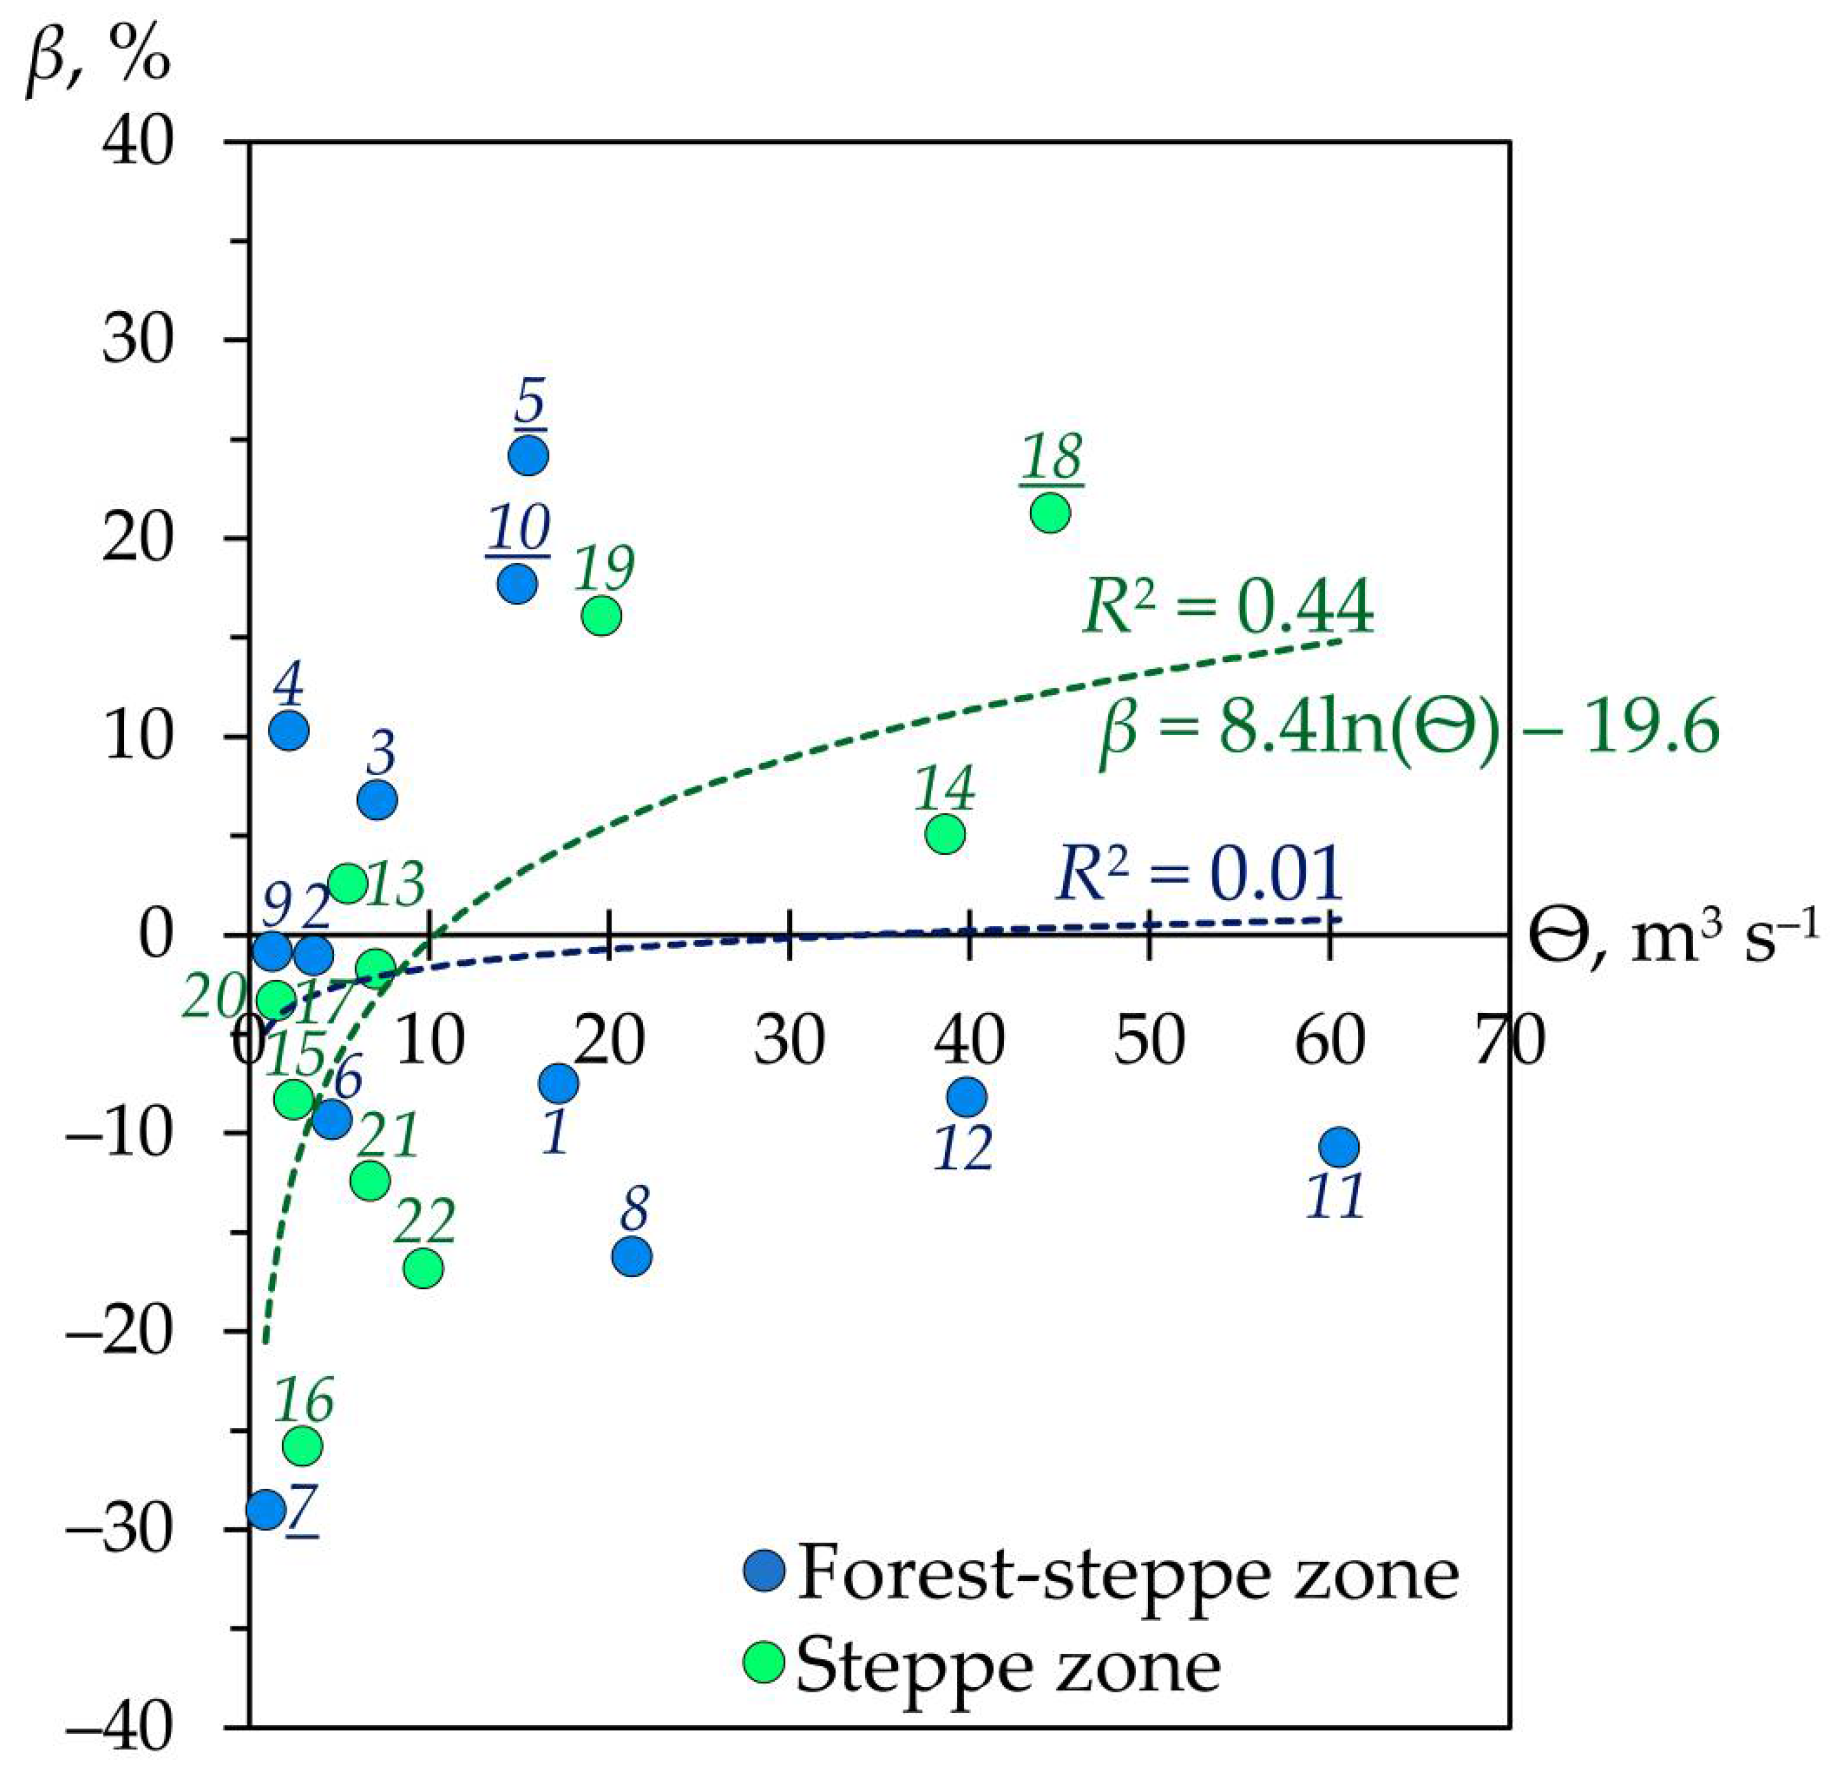
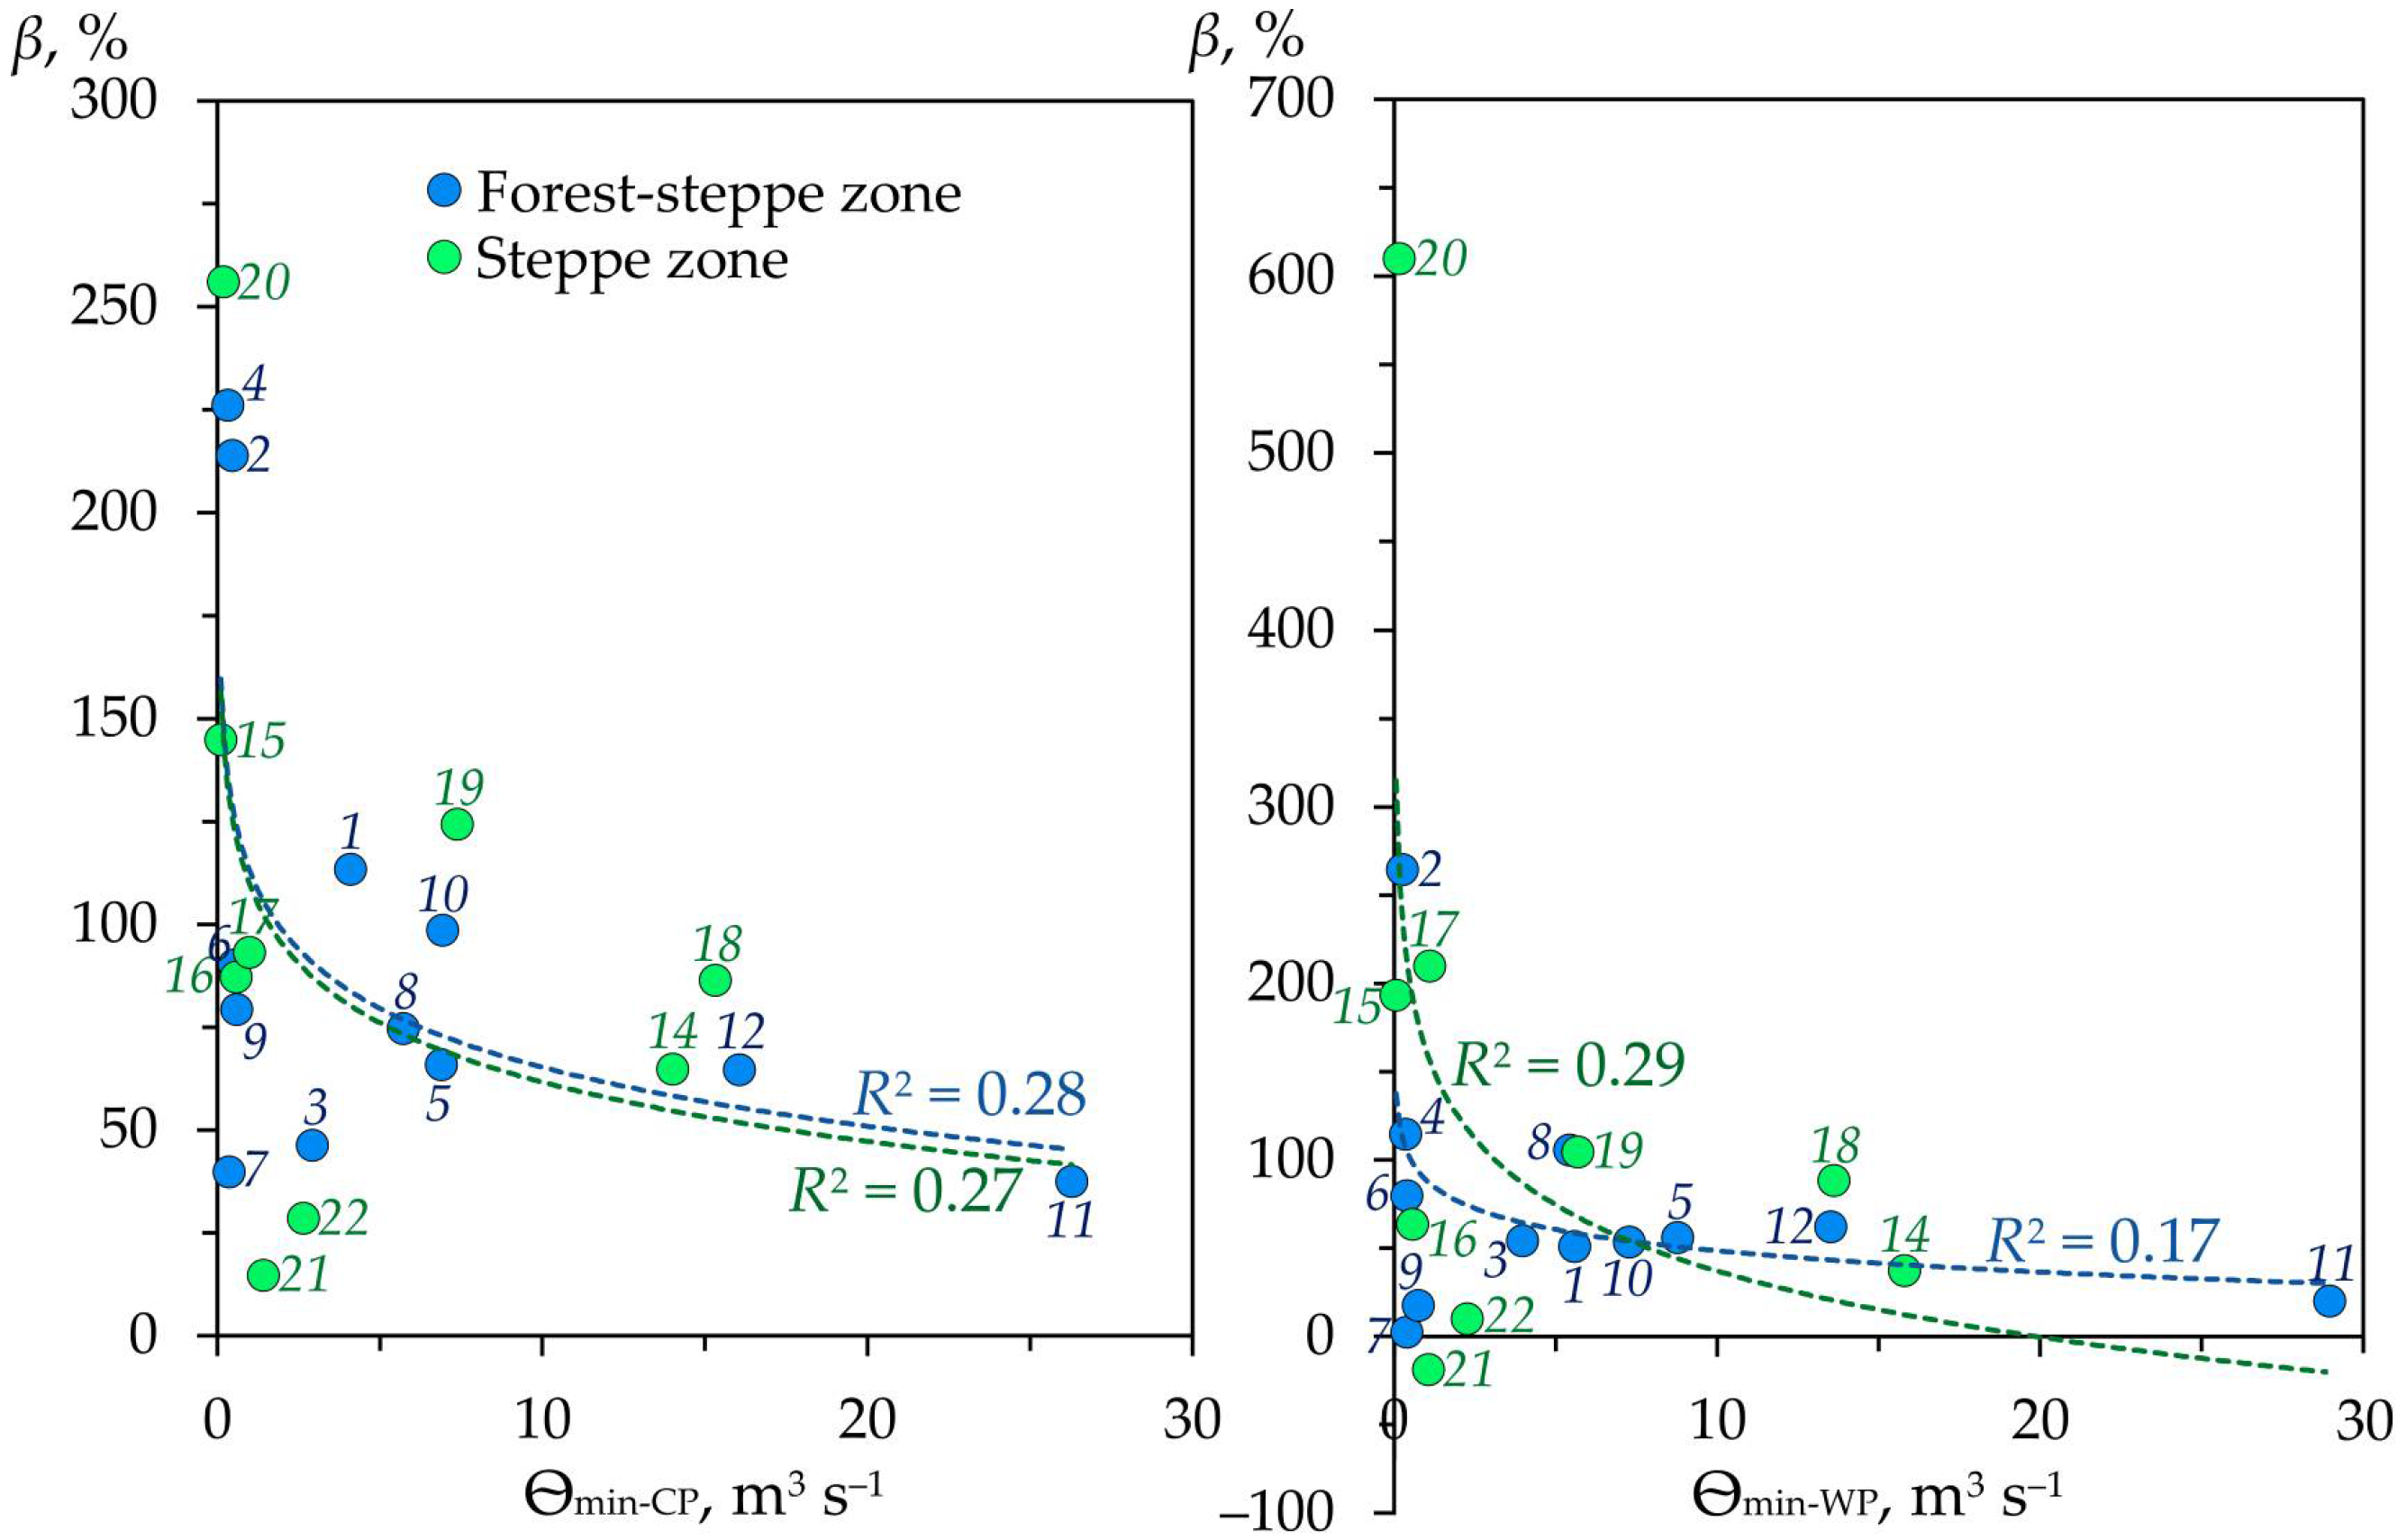
For minimum water discharges during the cold and warm periods of the year, a relationship between their changes across the baseline climatological periods (
β) and their long-term average values (Ѳ
min-CP and Ѳ
min-WP) was revealed (see
Figure A10 in
Appendix A). This dependence had an inverse logarithmic character. When the values of Ѳ
min-CP and Ѳ
min-WP are less than 8 m
3 s
–1, the values of
β increase as a whole, but their spread also increases, up to negative values of
β (for Ѳ
min-WP). Despite this, neither in the rivers of the forest-steppe nor in the rivers of the steppe zone did the identified logarithmic dependencies have statistical significance.
3.6. Intraregional Changes
The location of the analyzed rivers in the east of the East European Plain allows them to be grouped into two relatively isolated sectors (subregions): Sector I—the Middle Volga region, and Sector II—the Lower Volga region and part of the Don River basin (see
Figure 1). Analysis of changes in the main examined hydrological parameters between the baseline periods 1961–1990 and 1991–2020 (the coefficient
β) did not reveal statistically significant differences between these sectors (
Table 4).
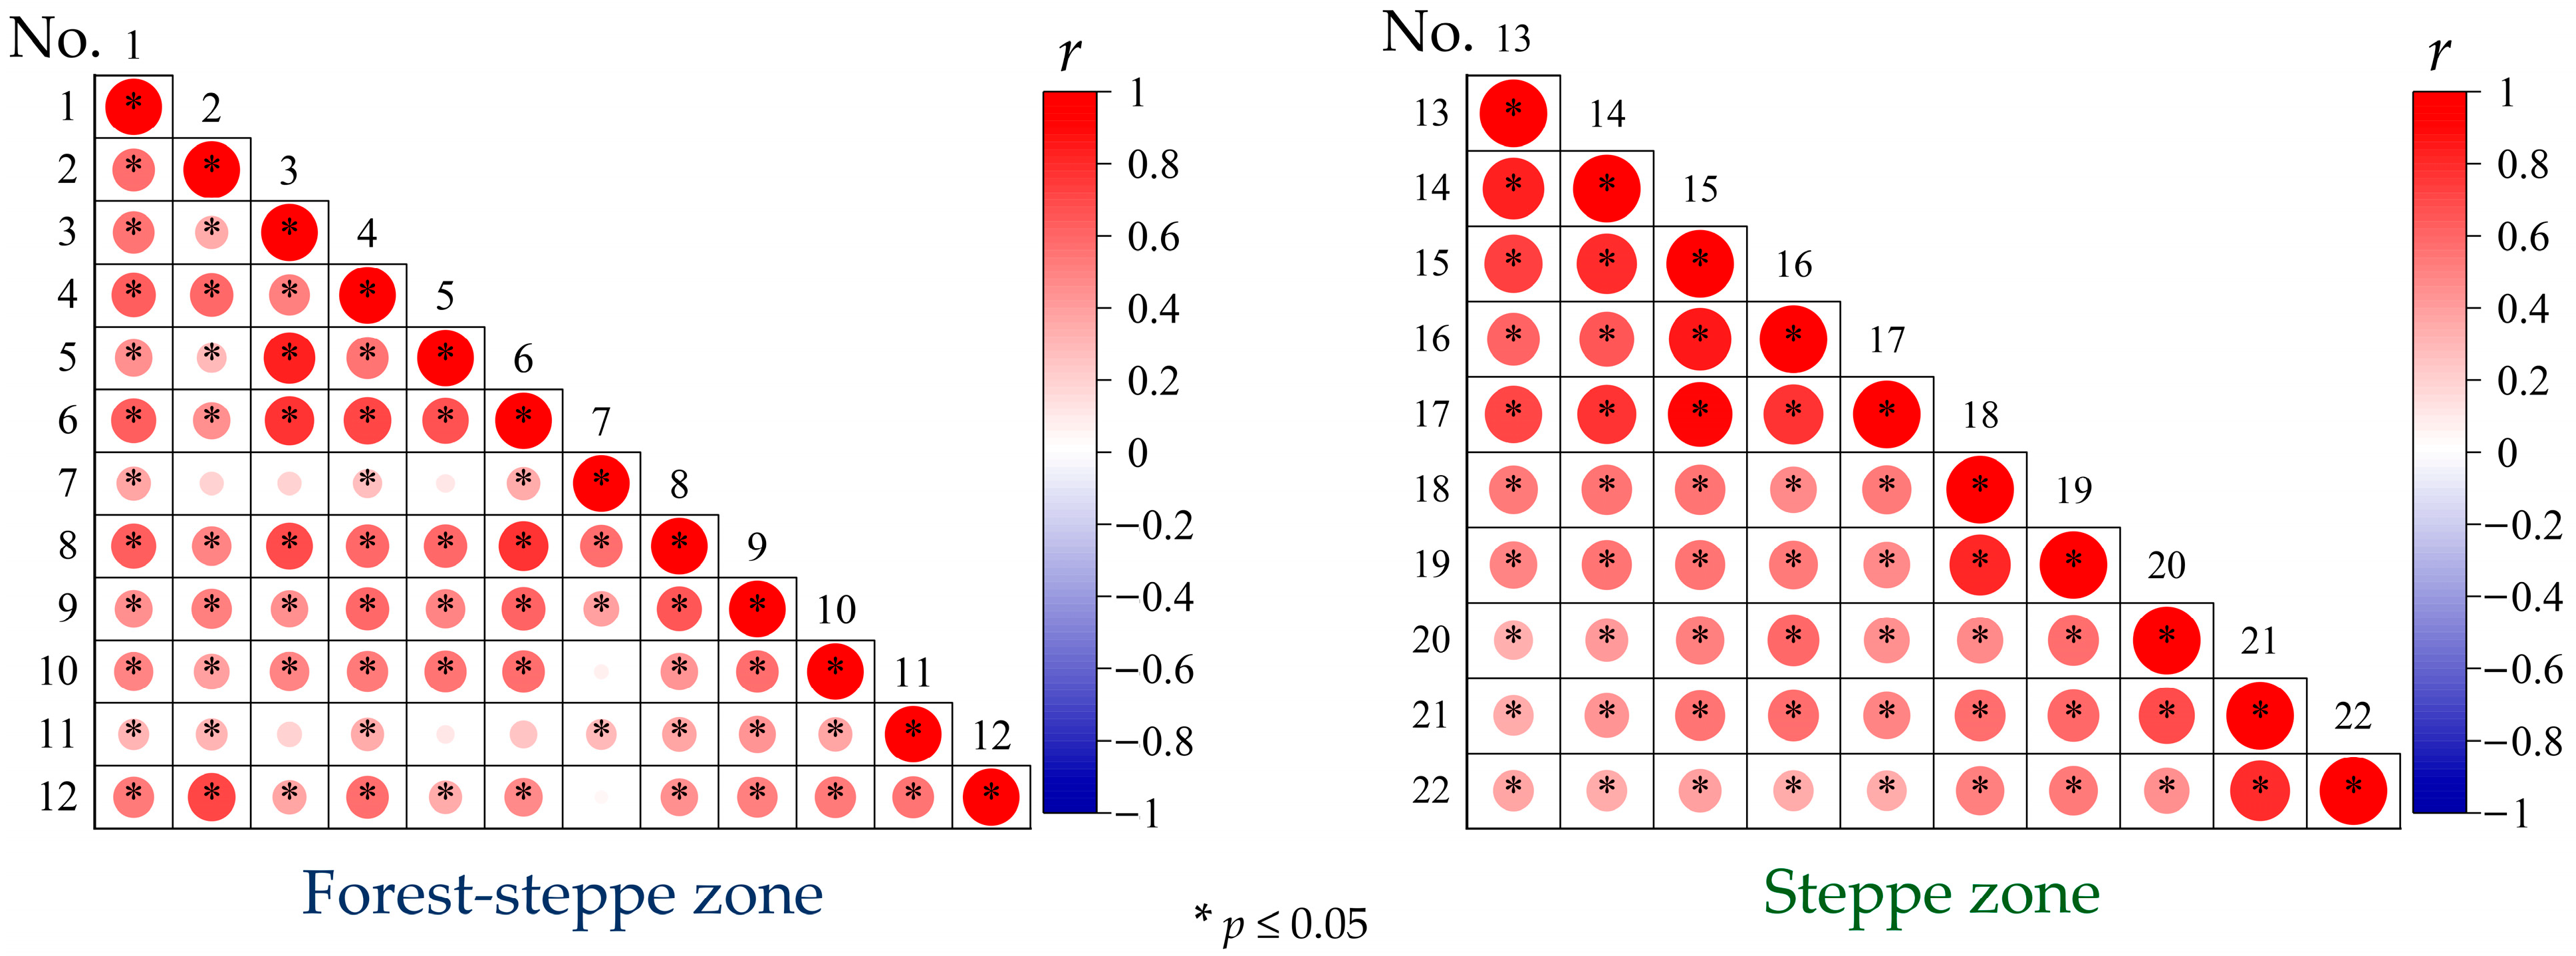
For each sector, a mutual correlation of long-term series of each of the main hydrological parameters was carried out, after which the analyzed rivers were ranked by the value of their average correlation coefficient (
r) with the other rivers. The results of this work were grouped into correlation matrices. These matrices make it possible to identify in each sector both the most representative rivers (more precisely, their long-term hydrological series) (
Table 5), and “anomalous” rivers, the flow of water in which, due to a combination of factors, is least correlated with the water flow of the other rivers in the sectors. In the groups of the most representative rivers (the first three rivers in the ranked series for each parameter), one can single out those rivers that cover all the main examined hydrological parameters. An example of an “anomalous” river is the Krasnaya River (No. 7, Sector I), long-term changes in the hydrological parameters
Q and
Qmin-WP, of which were characterized by an abnormally low (
r is equal to 0.28 and 0.05, respectively) similarity with the changes in these parameters of other rivers in this sector. The Ilovlya River (No. 21, Sector II) also turned out to be anomalous in terms of changes in the parameters
Qmin-CP and
Qmin-WP (
r is equal to 0.27 and 0.07, respectively).
No statistically significant differences in the average correlation coefficients (rav) between the two sectors for each hydrological parameter were found, except for the parameter Qmin-CP. In the latter case, rav in the Sector I significantly exceeds its value in Sector II.
3.7. Water Flow Change Before 1961
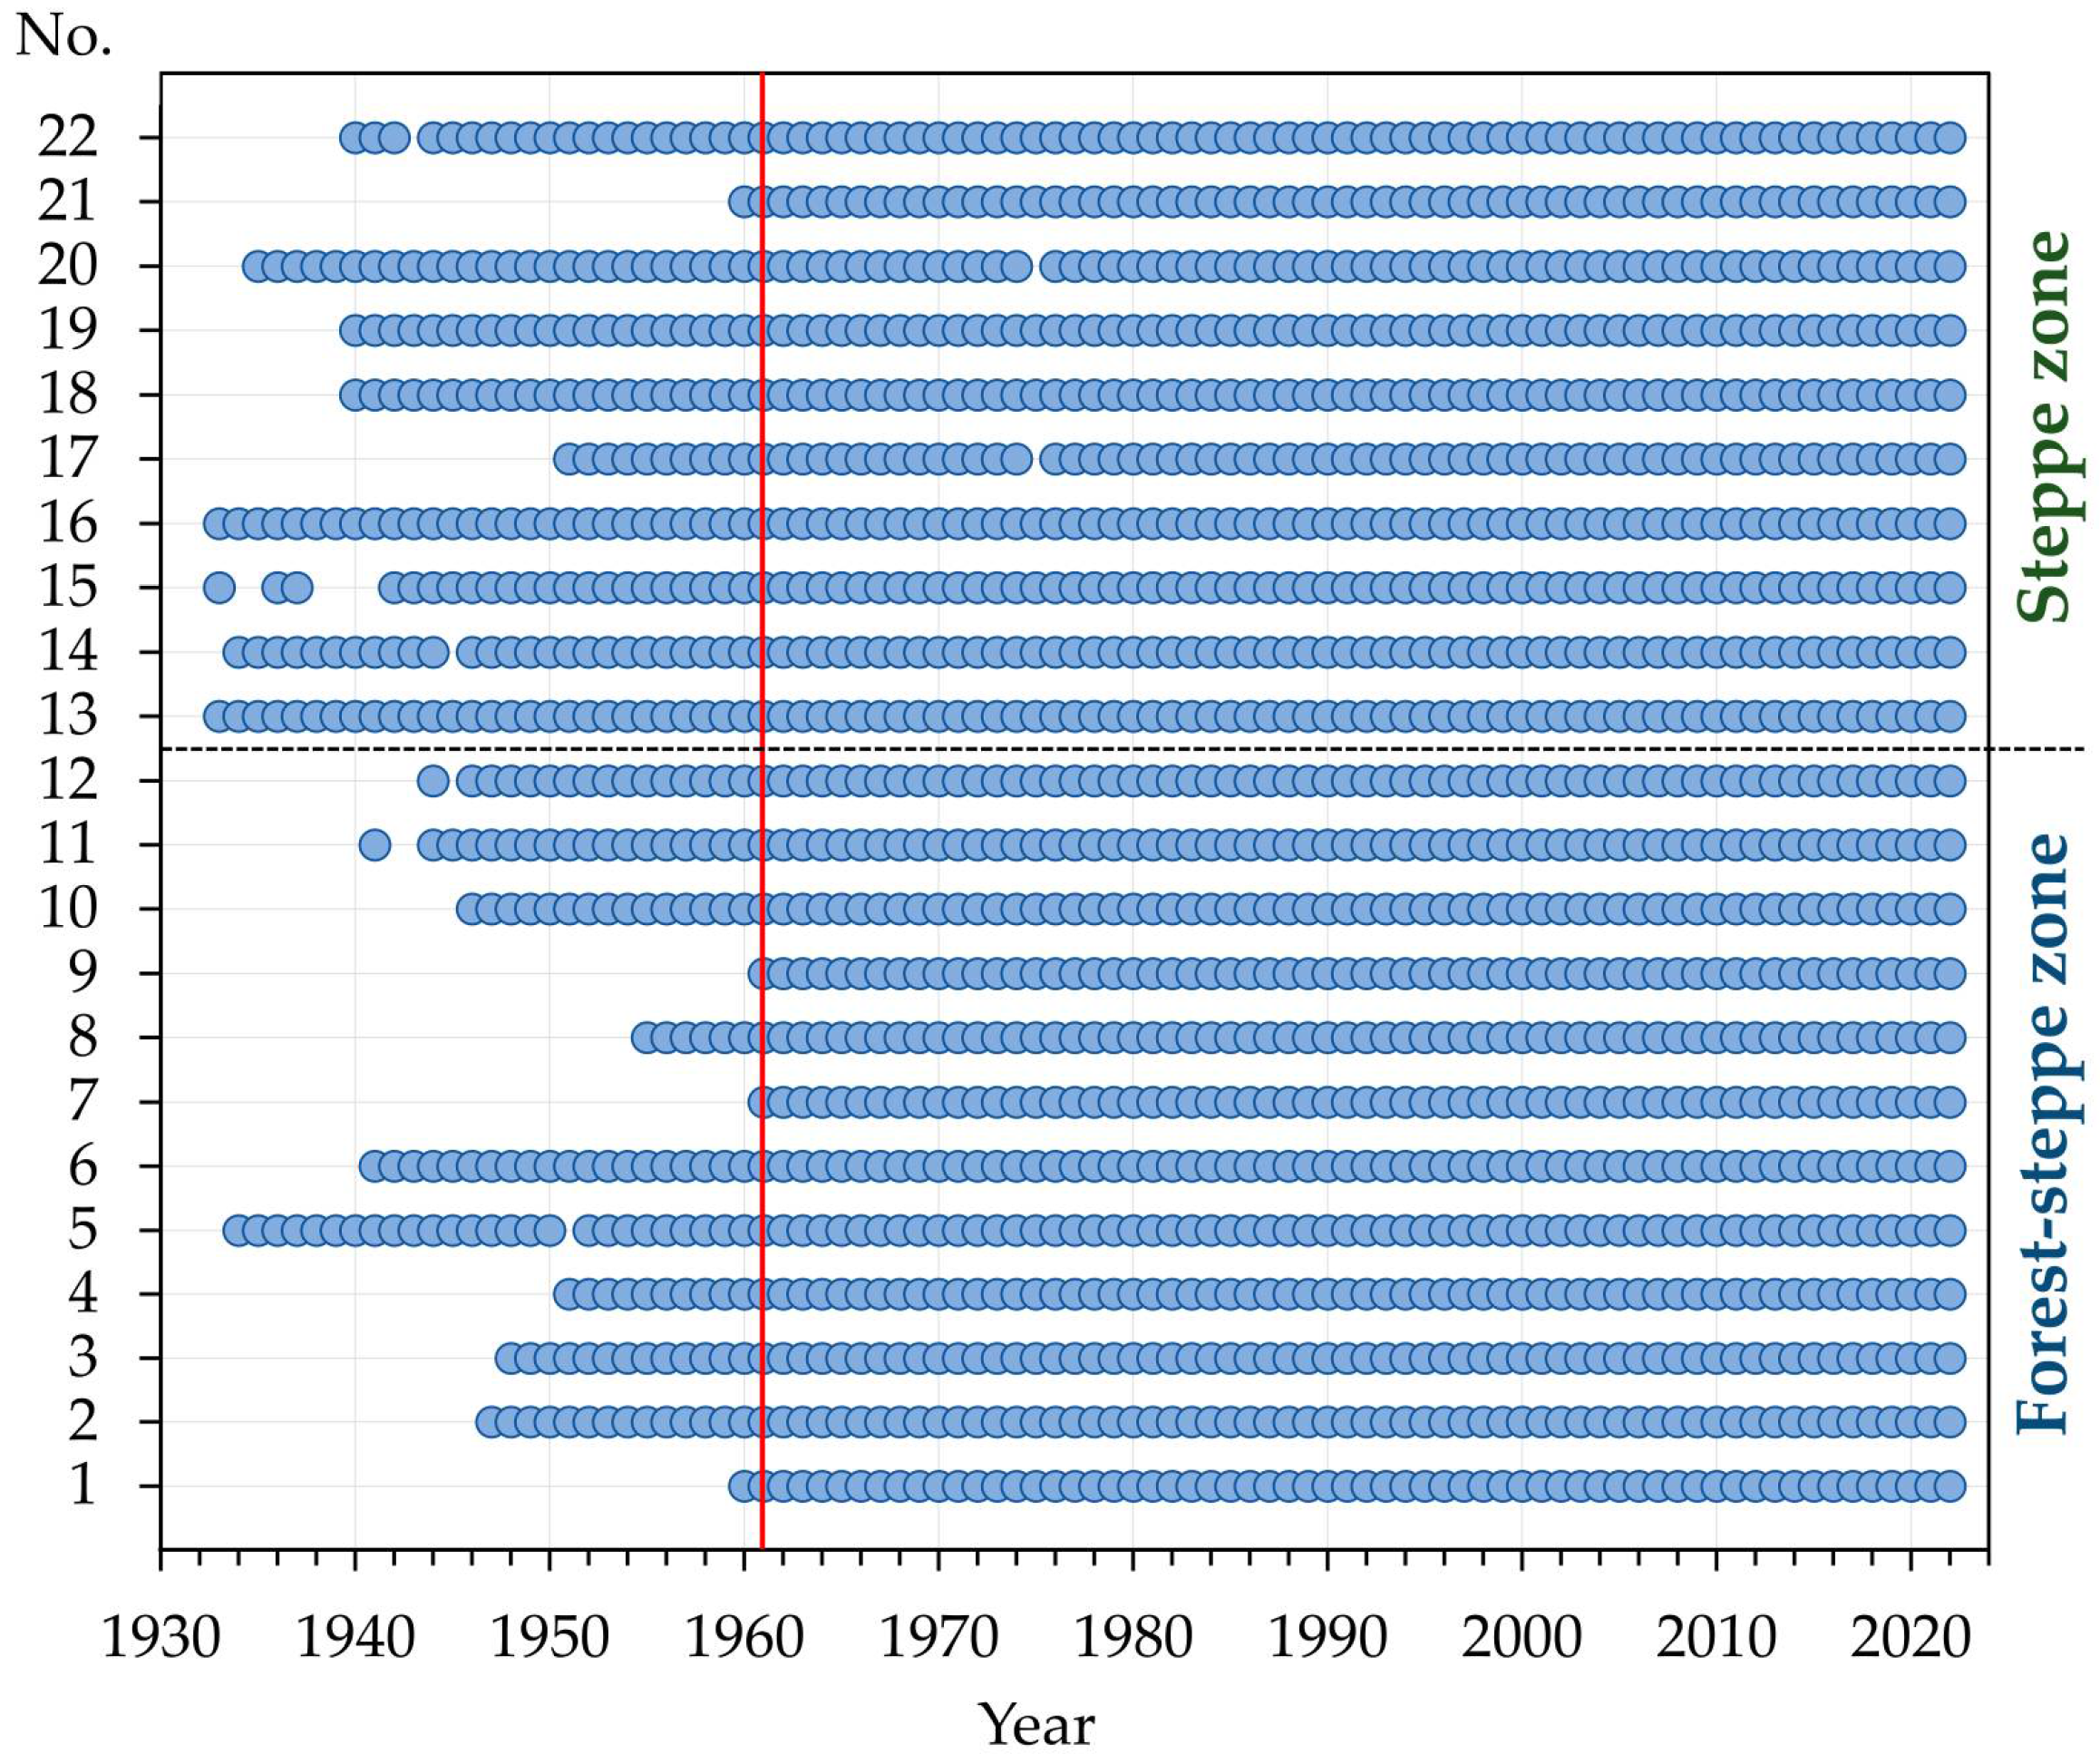
In the representative groups for each main hydrological parameter, one river with the longest series of observations was identified (see
Figure 3). This made it possible to trace changes in water flow in the period up to 1961 and their relationship with changes in water flow between the baseline periods of 1961–1990 and 1991–2020. The results of this comparison are presented in
Table 6.
As can be seen from
Table 6, a statistically significant trend towards growing water flow has been observed since the 1930s for the parameters
Qmin-CP and
Qmin-WP in Sector I and since the 1940s for the parameter
Qmin-CP in Sector II. Sector II also shows a statistically significant inter-period decrement in the annual maximum river water flow since the 1940s. For other parameters, retrospective continuity of trends in water flow changes prior to 1961 was either not maintained or was statistically insignificant.
