Article

Simulating the Porosity Reduction in a Permeable Reactive Barrier–Aquifer System Using THMC Software

1
Graduate Institute of Applied Geology, National Central University, Taoyuan City 32001, Taiwan
2
Korea Institute of Geoscience and Mineral Resources, Daejeon 34132, Republic of Korea
3
Department of Nursing, Fooyin University, Kaohsiung City 83101, Taiwan
4
Center for Advanced Model Research Development and Applications, National Central University, Taoyuan City 83101, Taiwan
*
Author to whom correspondence should be addressed.
Hydrology 2025, 12(9), 232; https://doi.org/10.3390/hydrology12090232
Submission received: 25 July 2025 / Revised: 1 September 2025 / Accepted: 3 September 2025 / Published: 4 September 2025
(This article belongs to the Section Surface Waters and Groundwaters)

Abstract

A permeable reactive barrier (PRB) containing zero-valent iron (ZVI) is an in situ groundwater remediation technology that passively intercepts and treats contaminated groundwater plumes. Over time, secondary mineral precipitation within the PRB diminishes porosity and hydraulic conductivity, altering flow paths, residence times, and sometimes causing bypass of the reactive zone. This study utilizes the THMC software to simulate porosity reduction in a PRB, capturing the coupled effects of fluid flow and geochemical interactions. The simulation results indicate that porosity loss is most significant at the PRB entrance and stabilizes beyond 0.2 m. Porosity reduction is primarily caused by aragonite, siderite, and ferrous hydroxide precipitating in pore spaces. The model further elucidates the influence of groundwater chemistry, demonstrating that variations in bicarbonate concentrations significantly impact mineral precipitation processes, thereby leading to porosity reduction. Furthermore, the study highlights reaction kinetics, with anaerobic iron corrosion rates being critical in controlling porosity reduction via mineral precipitation. THMC software effectively simulates porosity reduction in PRBs, identifies key factors driving clogging, and informs design optimization for long-term remediation.

1. Introduction

Groundwater contamination poses serious risks to human health and ecosystems, highlighting the need for efficient and sustainable remediation methods. Among available technologies, permeable reactive barriers (PRBs) have emerged as a promising in situ solution for treating a wide range of contaminants, including chlorinated compounds, heavy metals, volatile organic compounds (VOCs), and radionuclides [1]. PRBs rely on reactive media, with zero-valent iron (ZVI) being the most widely used due to its ability to remove pollutants through redox reactions, precipitation, and sorption [2,3]. However, the long-term performance of ZVI-PRBs is often impaired by mineral fouling, where secondary mineral precipitation reduces porosity and hydraulic conductivity [4,5,6]. Geochemical and hydrogeological conditions significantly impact this process, making its assessment complex [7,8,9]. Modeling approaches that integrate flow and reactive transport processes provide an alternative for evaluating PRB performance and predicting porosity reduction [10,11,12,13,14].
Using geochemistry and flow conditions within the PRB, Li et al. (2006) [15] estimated that the annual porosity loss for nine minerals in a PRB with reactive material was ZVI, ranging between 0.0007 and 0.03, with the significant loss near the front face and decreasing as it moved inward. Wilkin and Puls (2003) [16] indicate that after eight years of performance, the porosity of the iron media in the PRB at the US Coast Guard Support Center dropped by 0.032 mm within 20 mm of the entrance face and was less than 0.0002 when deep inside the PRB.
Several models have been developed to evaluate the effectiveness of PRB in groundwater remediation and assess porosity reduction over time. Li et al. (2006) [15] employed MODFLOW and RT3D to simulate geochemical processes in PRB and investigate key factors influencing porosity reduction in PRB containing ZVI granules. Their findings indicated that the highest porosity reduction occurred approximately 0.04 m from the entrance face, primarily due to aragonite, siderite, and ferrous hydroxide precipitation between the entrance and mid-planes. Subsequently, Li and Benson (2008) [17] explored multiple strategies to enhance the long-term efficiency of PRB, identifying the most significant porosity reduction at approximately 0.1 m from the entrance face. Further refinement by Li and Benson (2010) [18] demonstrated that the most substantial porosity reduction was observed at the entrance face after calibration with field data, with porosity loss diminishing progressively within the PRB. However, the precise location of maximum porosity reduction remains uncertain. The prediction approach in Li et al. (2006) [15] relied on a combination of MODFLOW for simulating flow in PRB and aquifers and RT3D for modeling advection, dispersion, and reactive transport. Porosity reduction estimates were derived from existing empirical formulas, integrated with response data obtained from RT3D, and adjusted using expert-determined coefficients. Nevertheless, the RT3D model, when applied to a PRB at the US Coast Guard Support Center, failed to accurately predict sulfate and nitrate concentrations due to its inability to account for specific biogeochemical processes.
The review of previous research highlights the necessity for more advanced modeling tools to integrate flow and reactive transport processes comprehensively. To address these challenges, the present study adopts THMC modeling to investigate porosity reduction in ZVI-based PRBs, with the aim of better representing coupled processes and reducing reliance on empirical adjustment factors. The validity of the THMC software has been proven by more than 40 years of development, progressing from FEMWATER (1981) [19,20] to HYDROGEOCHEM (1991) [21,22], and ultimately to THMC (2013) with full integration of thermal, hydrological, mechanical, and chemical processes.
The objective of this study is to identify the key factors controlling porosity reduction in ZVI-based PRBs using a THMC modeling framework. A coupled flow and reactive transport model was developed to simulate groundwater–ZVI interactions and to evaluate the influence of geochemical parameters on mineral-induced clogging. The analysis focused on three aspects: (i) mineral type, to determine which secondary minerals contribute most to porosity reduction; (ii) influent concentration, to examine how variations in groundwater chemistry affect mineral precipitation and porosity loss; and (iii) reaction rate coefficients, to assess which kinetic parameters exert the most significant control on porosity reduction. The findings provide mechanistic insights into fouling processes and offer guidance for improving PRB design, operation, and long-term performance in groundwater remediation.

2. Materials and Methods

2.1. Conceptual Model

A hypothetical study area, illustrated in Figure 1, was adopted to develop the PRB numerical model and evaluate porosity reduction caused by mineral fouling. This study area was previously introduced by Li et al. (2006) [15] in their investigations of the impact of mineral fouling on the hydraulic behavior of permeable reactive barriers.
The flow model extends 71.2 m in length and 60.0 m in width, with a PRB located at the center of the aquifer, measuring 1.0 m in thickness and 25.0 m in width (Figure 1). The PRB is tilted in a direction that is perpendicular to the direction in which groundwater typically flows. The assumption of isotropic hydraulic conductivity was maintained within a two-dimensional region throughout the simulations. Table 1 summarizes the aquifer parameters. The aquifer porosity was set at 0.30, representative of sand and gravel formations, with a hydraulic conductivity of 3.9 m/day. Within the PRB, a constant hydraulic conductivity of 216 m/day was assumed at installation. The initial porosity of the ZVI medium was specified as 0.60, consistent with the typical range of 0.55–0.65 reported for ZVI materials [23]. Constant head boundaries were applied at the inflow and outflow edges of the domain, establishing a hydraulic gradient of 0.01 along the flow path.
When groundwater flows through the PRB, reactions are triggered by water, nitrate, dissolved oxygen (DO), and sulfate, which corrode the iron, increase pH, and lead to the precipitation of secondary minerals. In this study, the aquifer was assumed to be in chemical equilibrium before groundwater entered the PRB, implying that no upstream reactions occurred and no solid phases were transported into the barrier. The inflowing groundwater was considered to contain Fe2+, DO, Mg2+, Ca2+, Mn2+, SO42−, CO32−, H+, OH, NO3, and HCO3, consistent with field-observed species commonly reported in PRB studies [15,16,17,18]. In the PRB, the upgradient concentration boundary was defined using background groundwater concentrations, assumed to be spatially uniform and temporally constant. The bottom boundary was specified as a no-flux condition. At the start of the simulation, solute concentrations within the PRB were set to zero. The modeled geochemical reactions (Table 2) were assumed to occur only within the PRB. The soluble substances in the groundwater will react with ZVI to form nine minerals: CaCO3, FeCO3, MgCO3, CaMg(CO3)2, Fe(OH)2, FeS, Mn(OH)2, MnCO3, and Mg(OH)2. These minerals represent the most commonly observed precipitates in both column and field PRB studies, as reported by Li et al. (2005) [11].

2.2. Groundwater Flow Model

The governing equation for transient flow simulations was performed in the homogeneous aquifer and PRB [22,23,24,25,26]:
K h + p p o z = p p o F h t
where K is the hydraulic conductivity tensor (L/T), h is the pressure head (L), po is the referenced fluid density at zero chemical concentration (M/L3), p is fluid density with dissolved chemical concentrations (M/L3), z is the potential head (L), F is the storage coefficient (1/L), and t is time (T).

2.3. Reactive Transport Model

THMC solved the advective, diffusive, and reactive transport in PRB systems using coupled partial differential equations. The first term represents the mass accumulation rate, the second describes advection transport, the third accounts for dispersion and diffusion processes, the fourth encompasses mass production, reduction rates, and decay processes, and the final term corresponds to source or sink effects associated with artificial injection or withdrawal.
Mass equilibrium and biochemical reaction theories can be used to obtain formulas for reactive processes [27]:
θ C i t + θ C i V f + J i = θ r i + M i
where θ is the effective moisture content (L3/L3), Ci is the concentration of the ith species (M/L3), Vf is transporting velocity relative to the solid and fluid of the ith chemical species (L/T) present, Ji is the surface flux of the ith species due to dispersion and diffusion for relative fluid velocity [(M/T)/L2], ri is the production rate of the ith species per unit medium volume due to all chemical reactions [(M/L3)/T], Mi is source/sink rate [(M/L3)/T].

2.4. Calculate the Porosity Reduction

The influence of the precipitation of secondary minerals on effective moisture content as measured by the THMC program:
θ = S e θ s o 1 + S e φ p
where θso is the effective saturated moisture content when solid or surface chemical species are not present (L3/L3), Se is the effective degree of saturation of water, φp = Pi × Vi, where Pi is the precipitated concentration of the ith mineral (mole/dm3 of water), Vi is the mole volume of the ith mineral (dm3 of solid/mole).
Porosity reduction in PRB will be calculated according to the following formula:
n = θ ; n 0 = θ s o Δ n = n 0 n = θ s o θ
where n is the porosity when considering the precipitation effect (-), n0 is the initial porosity, Δn is the porosity reduction due to mineral precipitation (-).

2.5. Sensitivity Analyses

Three sets of sensitivity analyses were performed to identify key parameters influencing porosity reduction:
  • Mineral type: simulations were run for individual minerals and selected combinations to determine their relative influence. Groundwater ion concentrations and reaction rate coefficients applied in the simulations were based on baseline scenarios.
  • Influent concentrations: the baseline groundwater composition (Table 3) was systematically varied within literature-reported ranges.
  • Reaction rate coefficients: rate constants for iron corrosion (aerobic, anaerobic, nitrate-driven), microbial sulfate reduction, and mineral precipitation were varied according to reported ranges (Table 4).
Baseline values for all input concentrations and rate parameters were selected within reported natural ranges to provide realistic simulation conditions. In addition, influent groundwater chemistry was evaluated using MINTEQA2 [28] to confirm undersaturation relative to the modeled mineral phases, ensuring that no precipitation occurred before entry into the PRB.
Table 3. Groundwater ion concentrations used in the baseline scenario and sensitivity analyses.
Ion in GroundwaterBaseline Scenario 1
(Molar)
Sensitivity Analyses
(Molar)
Literature Review 2
(Molar)
Fe2+1.0 × 10−101.0 × 10⁻¹², 1.0 × 10⁻⁴<9.0 × 10⁻⁴
Ca2+1.0 × 10−32.5 × 10−6, 2.5 × 10−22.5 × 10−6–2.5 × 10⁻²
Mg2+1.0 × 10−34.1 × 10−6, 4.1 × 10−34.1 × 10−6–4.1 × 10⁻³
Mn2+1.0 × 10−71.0 × 10−9, 1.0 × 10⁻⁵<1.8 × 10⁻⁵
OH1.0 × 10−71.0 × 10⁻⁸, 3.2 × 10−61.0 × 10−8–3.2 × 10⁻⁶
Alkalinity (HCO3)1.0 × 10−31.0 × 10−5, 1.0 × 10−21.0 × 10−5–1.0 × 10⁻²
O21.0 × 10−101.0 × 10⁻¹², 1.0 × 10⁻⁴<2.5 × 10⁻⁴
NO31.0 × 10−51.0 × 10⁻⁷, 1.0 × 10⁻³<1.6 × 10⁻³
SO42−1.0 × 10−31.0 × 10−4, 5.0 × 10⁻³<1.0 × 10⁻²
1 Li et al. (2006) [15]. 2 Representative groundwater ions from Freeze and Cherry (1979) [29], Hem (1985) [30], and Langmuir (1997) [31].
Table 4. Rate coefficients employed in the numerical simulations.
Reaction TermsUnitsBaseline Scenario 1Sensitivity AnalysesLiterature Review 2
Aerobic iron corrosionm3/m2-day2.8 × 10−21.0 × 10⁻³, 1.0 × 10⁴<2.8 × 10⁴
Anaerobic iron corrosionmole/m2-day2.0 × 10−73.0 × 10⁻⁸, 5.4 × 10−33.0 × 10−8–5.4 × 10⁻³
Nitrate iron corrosionm3/m2-day1.0 × 10−61.8 × 10⁻⁸, 2.8 × 10−51.8 × 10−8–2.8 × 10⁻⁵
Microbial sulfate reductionM/day1.0 × 10−55.0 × 10⁻⁶, 5.0 × 10−35.0 × 10−6–5.0 × 10⁻³
CaCO3M/day1.0 × 10−42.7 × 10⁻⁹, 1.4 × 10−42.7 × 10−9–1.4 × 10⁻⁴
CaMg(CO3)2M/day1.0 × 10−99.0 × 10⁻¹⁰, 6.9 × 10−69.0 × 10−10–6.9 × 10⁻⁶
MgCO3M/day1.0 × 10−41.1 × 10⁻⁸, 1.4 × 10−41.1 × 10−8–1.4 × 10⁻⁴
Mg(OH)2M/day1.0 × 10−43.4 × 10⁻⁶, 2.3 × 10−33.4 × 10−6–2.3 × 10⁻³
MnCO3M/day1.0 × 10−61.1 × 10⁻⁸, 1.4 × 10−51.1 × 10−8–1.4 × 10⁻⁵
Mn(OH)2M/day1.0 × 10−41.0 × 10⁻⁵, 1.0 × 10⁻³No data
FeCO3M/day1.0 × 10−41.1 × 10⁻⁵, 2.7 × 10−41.1 × 10−5–2.7 × 10⁻⁴
Fe(OH)2M/day1.0 × 10−41.0 × 10⁻³, 2.0 × 10⁻⁴<2.2 × 10⁻⁴
FeSM/day1.0 × 10−61.1 × 10⁻⁸, 2.2 × 10−51.1 × 10−8–2.2 × 10⁻⁵
1 Li et al. (2006) [15]. 2 Representative rate coefficients from Mayer et al. (2001) [12]; Yabusaki et al. (2001) [13]; Reardon (1995) [32]; Gu et al. (2002) [33]; Gu et al. (1999) [34]; Gandhi et al. (2002) [35]; Alowitz and Scherer (2002) [36]; Westerhoff (2003) [37]; Chen et al. (2001) [38]; Kober et al. (2002) [39]; Hunter et al. (1998) [40].

3. Results and Discussion

3.1. The Effect of Mineral Type on Porosity Reduction

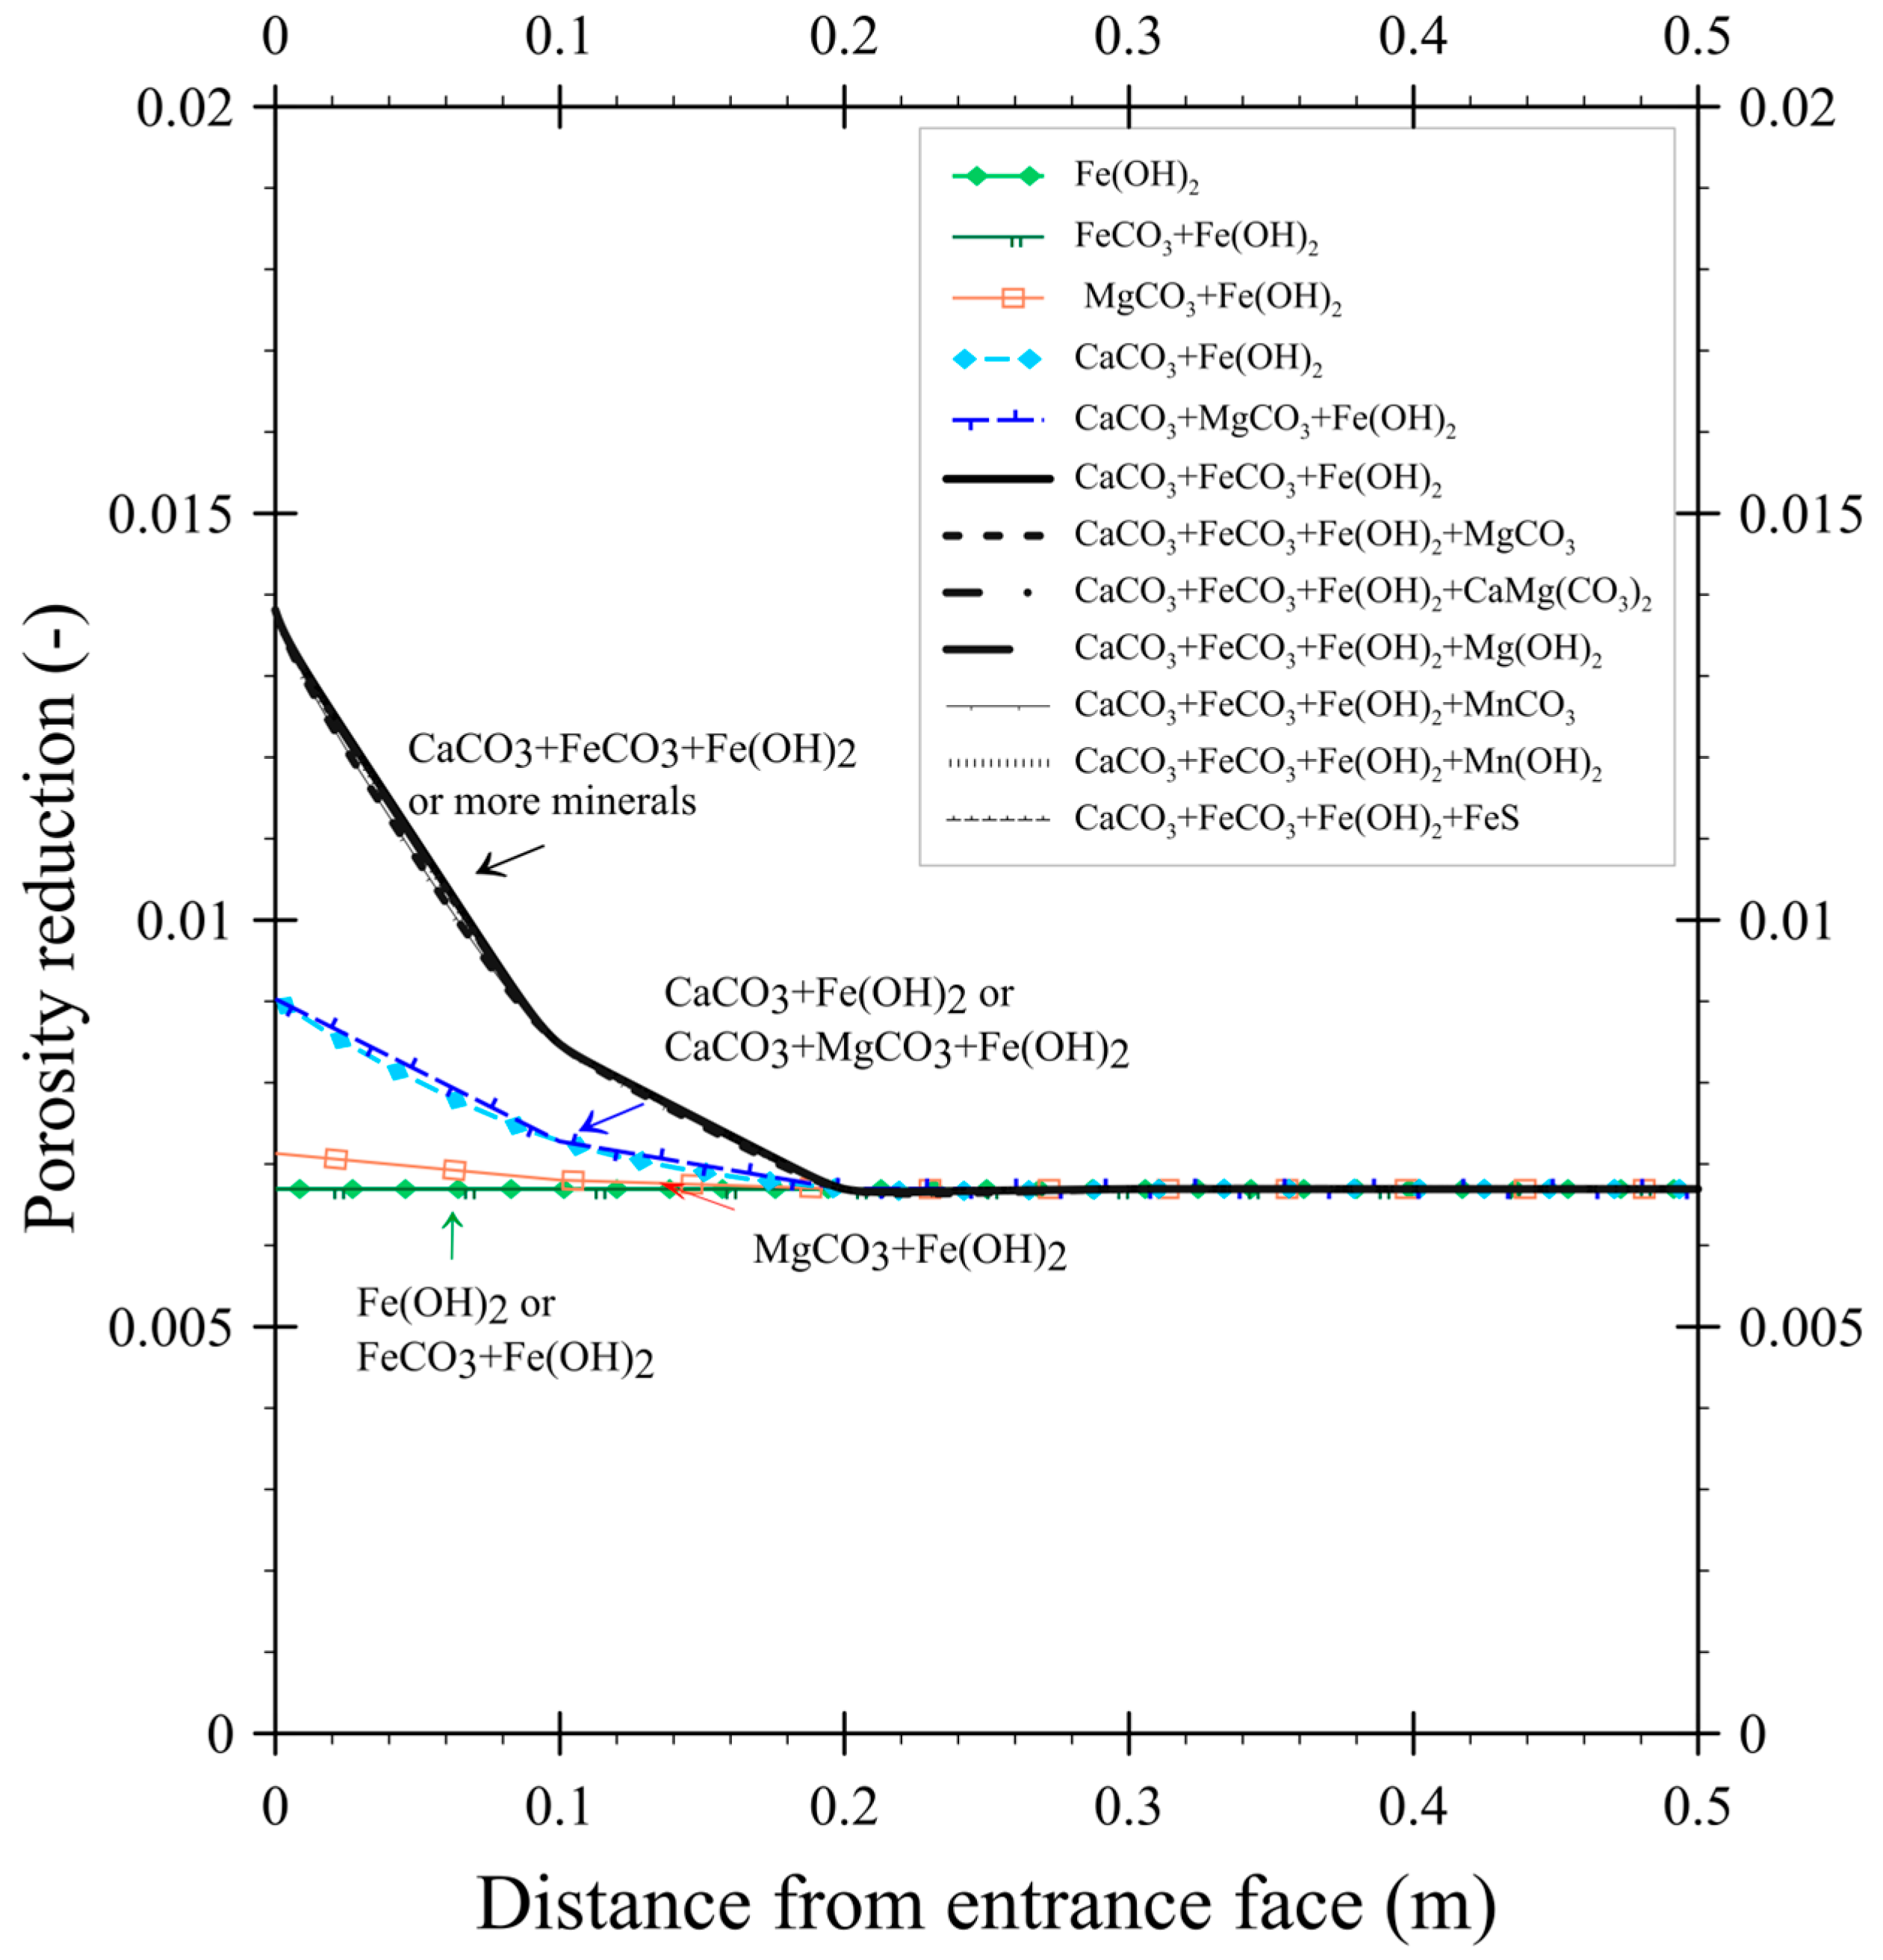
Laboratory and field studies have consistently shown that secondary mineral precipitation, particularly carbonates and iron hydroxides, is the primary cause of porosity reduction in PRBs. To evaluate this, simulations were performed for different mineral phases and combinations (Figure 2). The initial procedure was performed with Fe(OH)2, which typically develops throughout the entire surface area of a PRB. In subsequent simulations, Fe(OH)2 was mixed with one of the minerals containing carbonates (FeCO3, MgCO3, CaCO3). Finally, simulations were run for Fe(OH)2 and carbonate mineral combinations, as well as the remaining minerals (Mn(OH)2, Mg(OH)2, MnCO3, CaMg(CO3)2, and FeS).
After one year of PRB operation, Figure 2 demonstrates the results of evaluating porosity reductions caused by minerals from the entrance face. In the simulation considering Fe(OH)2, the iron corrosion reaction produces Fe2+, OH, and a pH increase. When the reaction is equilibrated by forming a Fe(OH)2 precipitate, the porosity within the PRB decreases. Due to the incorporation of FeCO3 into the model, the porosity reduction pattern remains unchanged since Fe2+ obtained from iron corrosion controls these mineral formations. With the addition of CaCO3, the model’s porosity reduction at the entrance face increased. This is caused by groundwater ions (HCO3, Ca2+) contributing to CaCO3 precipitation. After 0.2 m from the PRB’s entry face, the porosity decreases to the level measured with Fe(OH)2. Applying MgCO3 instead of CaCO3, the porosity reduction is slightly more significant than Fe(OH)2 alone since CaCO3 is less soluble than MgCO3. Likewise, combined CaCO3 and MgCO3 with Fe(OH)2 produced the same reduction in porosity as only using Fe(OH)2 and CaCO3. Including Fe(OH)2, FeCO3, and CaCO3 contributed significantly to porosity and reached maximum values at the entrance face. FeCO3 and CaCO3 account for roughly 50% of the reduction in porosity at the entrance face. Higher pH causes additional CaCO3, which leads to a more significant peak porosity reduction. When FeCO3 is provided, the pH rises because less Fe2+ participates in forming Fe(OH)2, leaving more OH in the solution. The results of these simulations indicate that more than 99% of the porosity reduction in PRB is due to the combination of three minerals, CaCO3, FeCO3, and Fe(OH)2, while the addition of the remaining minerals has a negligible effect.
These results are consistent with field observations, where carbonate phases (calcite and siderite) and iron hydroxides dominate fouling in long-term PRB operation [16]. This confirms that carbonate scaling at the influent face is the primary mechanism driving permeability loss in ZVI-based PRBs.

3.2. The Effect of Concentration on Porosity Reduction

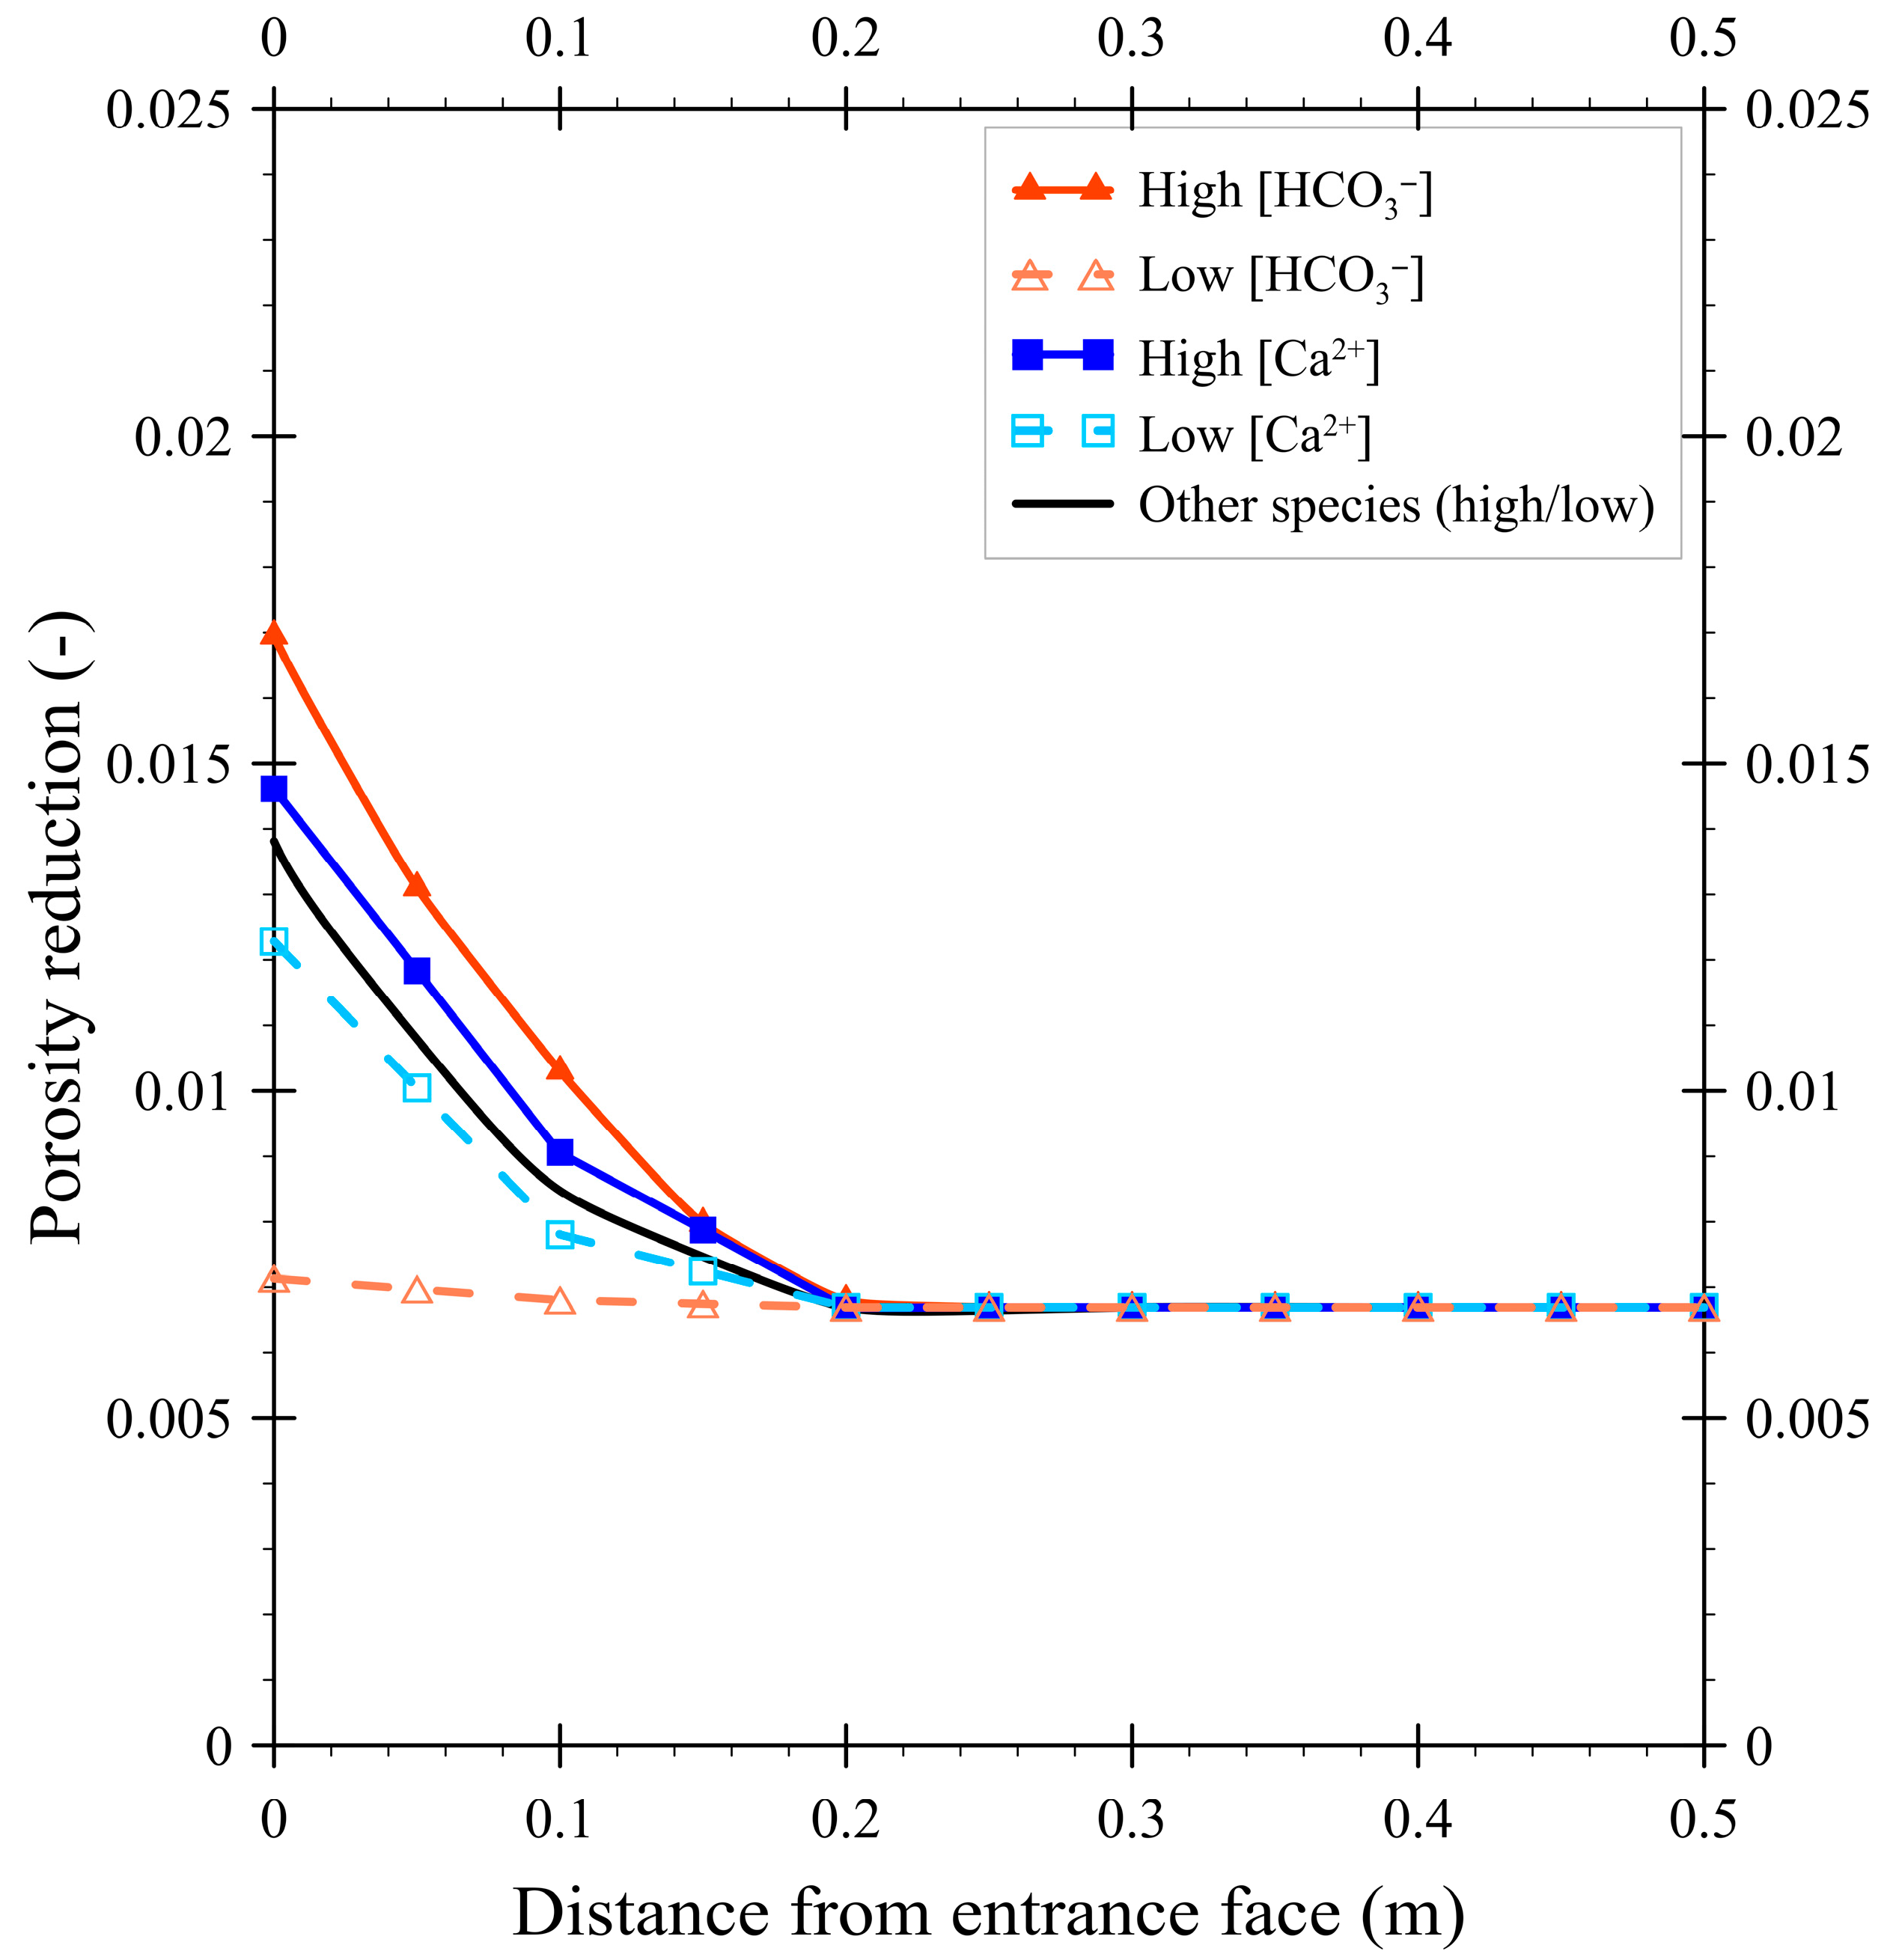
This study conducted a sensitivity analysis to evaluate the influence of influent concentrations on porosity reduction. Baseline values were systematically varied within ranges reported in the literature to represent realistic groundwater conditions. Each ion concentration was adjusted individually while all other parameters were held constant, and system performance was simulated over one year. The results indicate that HCO3 and Ca2+ exert the most significant impact on porosity reduction, whereas the effects of other ions were negligible.
The simulation results (Figure 3) demonstrate that porosity reduction is highly sensitive to HCO3 concentration. At elevated levels, HCO3 significantly enhanced carbonate precipitation, leading to pronounced porosity loss near the entrance face of the PRB. In contrast, at low concentrations, the reduction in porosity was minimal. Similarly, higher Ca2+ concentrations increased carbonate scaling, though the effect was less pronounced than for HCO3. Variations in sulfate (SO42−), nitrate (NO3), and other ions produced negligible changes in porosity reduction (Table 2), with differences below 1%.
These findings indicate that carbonate chemistry, particularly the interaction of Ca2+ and HCO3, is the dominant driver of mineral fouling in PRBs. The steep decline in porosity within the first 0.2 m of the barrier reflects localized carbonate precipitation induced by elevated pH conditions from ZVI corrosion. This is consistent with previous field and modeling studies [15,16], which identified carbonate scaling as the significant cause of permeability loss in ZVI systems.
From an engineering perspective, these results underscore that groundwater alkalinity is a critical control on PRB longevity. Systems operating in aquifers with high bicarbonate concentrations are more vulnerable to rapid clogging, and maintenance strategies should account for this through influent pretreatment, periodic rehabilitation, or alternative barrier designs.

3.3. The Effect of Rate Coefficients on Porosity Reduction

A sensitivity analysis was conducted to identify the rate coefficients significantly impacting a PRB’s porosity reduction. Simulations were performed over one year, systematically varying one rate coefficient at a time while keeping all other input parameters constant. The objective was to assess the influence of relative rate coefficients on porosity decrease by analyzing the resulting porosity reduction curves.
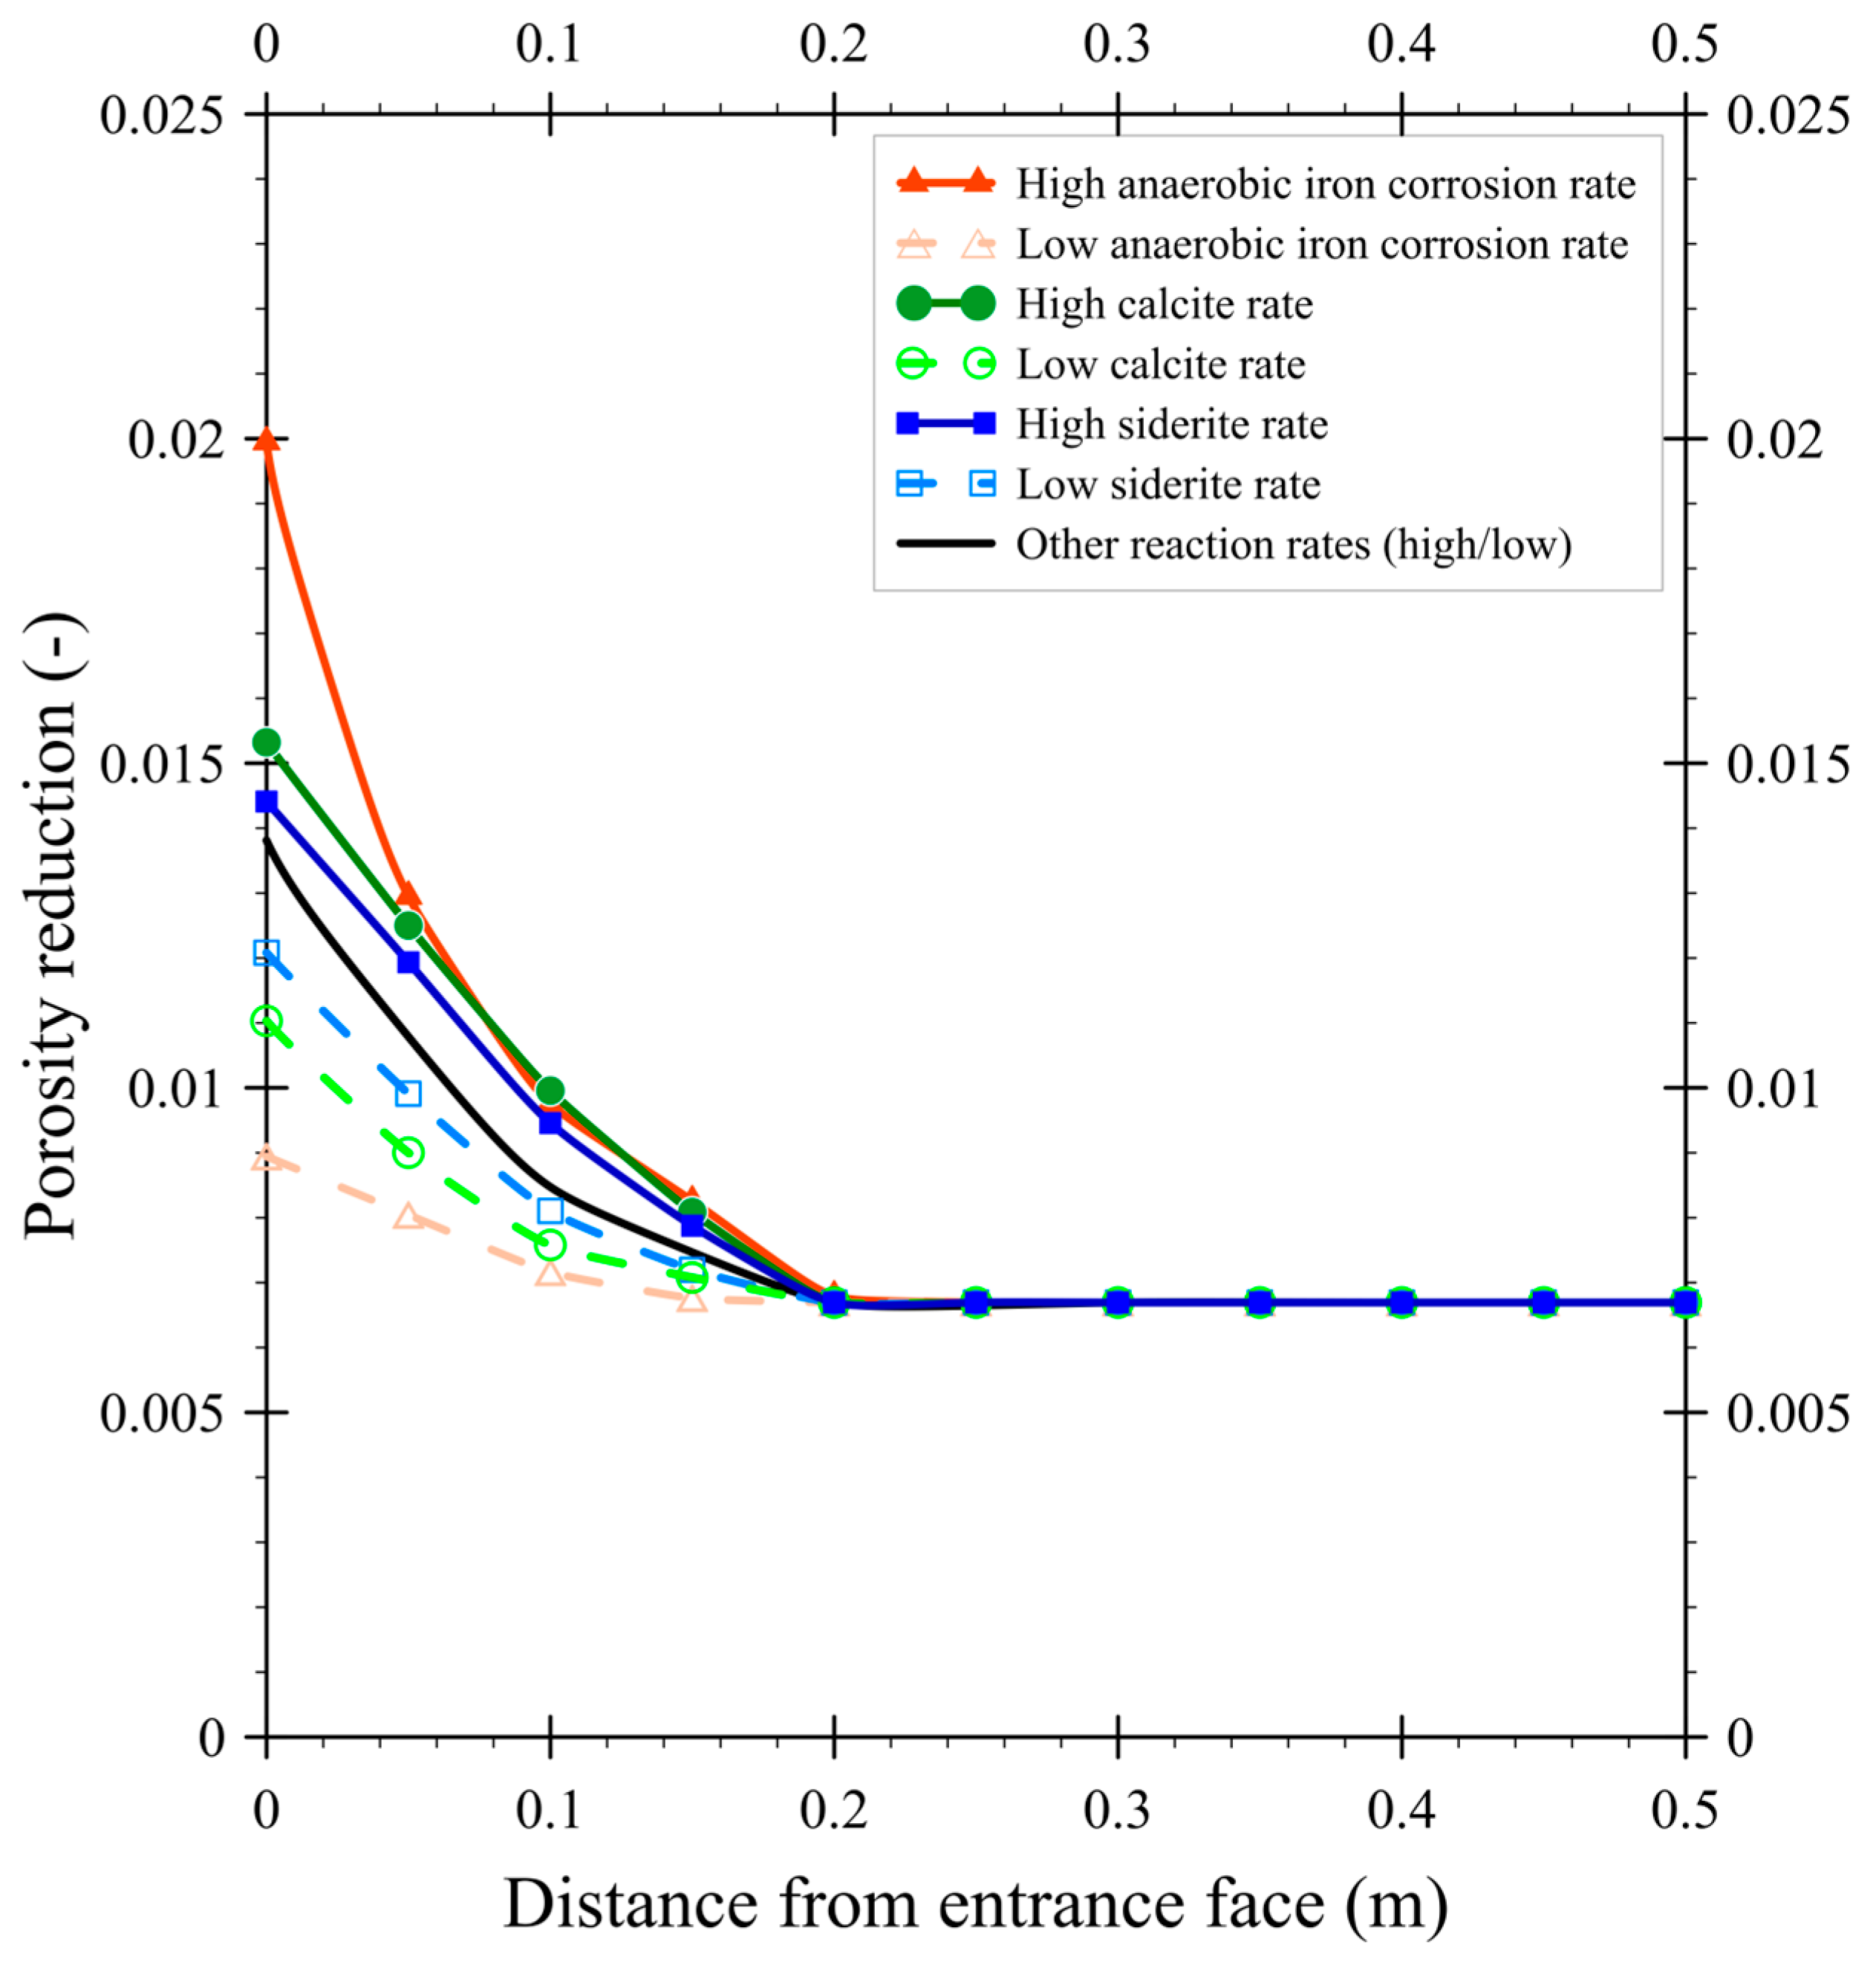
The simulation results (Figure 4) indicate that anaerobic iron corrosion exerts the strongest control on porosity reduction. At higher rate coefficients, porosity loss near the entrance face reached the highest values (≈0.020), with the effect diminishing with depth into the barrier. In contrast, the low anaerobic corrosion rate produced substantially lower porosity reduction curves, emphasizing the sensitivity of system performance to this process.
Carbonate mineral precipitation, particularly from calcite (CaCO3) and siderite (FeCO3), also contributed significantly to porosity loss. Elevated rate coefficients for these minerals led to sharper porosity declines at the upgradient face, while lower rates resulted in more gradual reductions. Calcite precipitation was slightly more impactful than siderite, consistent with its lower solubility and dominant role in carbonate scaling under elevated pH.
In contrast, variations in the rate coefficients of the remaining reactions had negligible effects, as the porosity reduction curves for high and low values were nearly identical. This indicates that processes other than anaerobic iron corrosion and carbonate precipitation contribute minimally to porosity loss.
The results indicate that anaerobic iron corrosion and carbonate mineral precipitation are the primary mechanisms driving porosity reduction in ZVI-based PRBs, particularly at the entrance face where groundwater–iron interactions are most intense. The stabilization of porosity reduction beyond 0.2 m highlights the localized character of clogging, consistent with both field observations and modeling studies that report the most severe fouling at the influent interface [15,16]. These findings highlight the importance of accurately parameterizing anaerobic iron corrosion rates and carbonate mineral kinetics to improve long-term performance predictions, while other processes appear to play only a secondary role.

4. Conclusions

This study employs the THMC software to investigate porosity reduction in PRB containing ZVI caused by secondary mineral precipitation. The simulations identify CaCO3, FeCO3, and Fe(OH)2 as the principal mineral phases driving pore space reduction. Sensitivity analysis revealed that bicarbonate concentrations in groundwater and the anaerobic iron corrosion rate coefficient parameters are the most influential controlling mineral precipitation dynamics. These results are consistent with laboratory and field evidence, supporting the applicability of the THMC software for predicting long-term PRB behavior. Overall, the THMC software provides mechanistic perspectives on the long-term evolution of PRB performance. The findings highlight critical geochemical controls on porosity loss, offering a quantitative framework for improving PRB design, operation, and maintenance strategies. Subsequent research should enhance kinetic models of iron corrosion and sulfate reduction, integrate microbial activities, and consider aquifer integration to more accurately reflect field conditions. Furthermore, long-term monitoring data are essential to confirm numerical simulations and enhance prediction accuracy. In order to further assess the robustness of the THMC software, it is advised to conduct comparative assessments with other modeling frameworks.

Author Contributions

Conceptualization, methodology, T.-T.-H.N. and J.-S.C.; software, J.-S.C.; writing—original draft preparation, T.-T.-H.N.; writing—reviewing and editing, J.-S.C., H.S. and C.-P.L.; supervision, J.-S.C. All authors have read and agreed to the published version of the manuscript.

Funding

This research received no external funding.

Data Availability Statement

No new data were created or analyzed in this study. Data sharing does not apply to this article.

Conflicts of Interest

The authors declare no conflicts of interest.

References

  1. Naidu, R.; Bekele, D.N.; Birke, V. Permeable reactive barriers: Cost-effective and sustainable remediation of groundwater. Sustain. Groundw. Remediat. 2014, 1, 1–2. [Google Scholar]
  2. Gillham, R. In Situ Remediation of VOC-Contaminated Groundwater Using Zero-Valent Iron: Long-Term Performance; Center for Groundwater Studies: Fremantle, Australia, 1999. [Google Scholar]
  3. O’Hannesin, S.F.; Gillham, R.W. Long-term performance of an in situ “iron wall” for remediation of VOCs. Groundwater 1998, 36, 164–170. [Google Scholar] [CrossRef]
  4. Phillips, D.H.; Watson, D.B.; Roh, Y.; Gu, B. Mineralogical characteristics and transformations during long-term operation of a zerovalent iron reactive barrier. J. Environ. Qual. 2003, 32, 2033–2045. [Google Scholar] [CrossRef] [PubMed]
  5. Richardson, J.P.; Nicklow, J.W. In situ permeable reactive barriers for groundwater contamination. Soil Sediment Contam. 2002, 11, 241–268. [Google Scholar] [CrossRef]
  6. Wilkin, R.T.; Puls, R.W.; Sewell, G.W. Long-Term Performance of Permeable Reactive Barriers Using Zero-Valent Iron: An Evaluation at Two Sites; Report EPA/600/S-02/001; U.S. Environmental Protection Agency: Cincinnati, OH, USA, 2002. [Google Scholar]
  7. Phillips, D.H.; Gu, B.; Watson, D.B.; Roh, Y.; Liang, L.; Lee, S. Performance evaluation of a zerovalent iron reactive barrier: Mineralogical characteristics. Environ. Sci. Technol. 2000, 34, 4169–4176. [Google Scholar] [CrossRef]
  8. Vikesland, P.J.; Klausen, J.; Zimmermann, H.; Roberts, A.L.; Ball, W.P. Longevity of granular iron in groundwater treatment processes: Changes in solute transport properties over time. J. Contam. Hydrol. 2003, 64, 3–33. [Google Scholar] [CrossRef]
  9. Warner, S.D.; Sorel, D. Ten Years of Permeable Reactive Barriers: Lessons Learned and Future Expectations. In Chlorinated Solvent and DNAPL Remediation: Innovative Strategies for Subsurface Cleanup; ACS Symposium Series 837; Warner, S.D., Ed.; American Chemical Society: Washington, DC, USA, 2003. [Google Scholar]
  10. Gavaskar, A.R.; Gupta, N.; Sass, B.; Janosy, R.; O’Sullivan, D. Permeable Barriers for Groundwater Remediation; Battelle Press: Columbus, OH, USA, 1998. [Google Scholar]
  11. Li, L.; Benson, C.H.; Lawson, E.M. Impact of mineral fouling on hydraulic behavior of permeable reactive barriers. Groundwater 2005, 43, 582–596. [Google Scholar] [CrossRef]
  12. Mayer, K.U.; Blowes, D.W.; Frind, E.O. Reactive transport modeling of an in situ reactive barrier for the treatment of hexavalent chromium and trichloroethylene in groundwater. Water Resour. Res. 2001, 37, 3091–3103. [Google Scholar] [CrossRef]
  13. Yabusaki, S.; Cantrell, K.; Sass, B.; Steefel, C. Multicomponent reactive transport in an in situ zero-valent iron cell. Environ. Sci. Technol. 2001, 35, 1493–1503. [Google Scholar] [CrossRef]
  14. Yang, H.; Hu, R.; Ruppert, H.; Noubactep, C. Modeling porosity loss in Fe0-based permeable reactive barriers with Faraday’s law. Sci. Rep. 2021, 11, 16998. [Google Scholar] [CrossRef]
  15. Li, L.; Benson, C.H.; Lawson, E.M. Modeling porosity reductions caused by mineral fouling in continuous-wall permeable reactive barriers. J. Contam. Hydrol. 2006, 83, 89–121. [Google Scholar] [CrossRef]
  16. Wilkin, R.T.; Puls, R.W. Capstone Report on the Application, Monitoring, and Performance of Permeable Reactive Barriers for Groundwater Remediation: Volume 1: Performance Evaluations at Two Sites; EPA/600-R-03-045a; U.S. Environmental Protection Agency: Cincinnati, OH, USA, 2003. [Google Scholar]
  17. Li, L.; Benson, C.H. Evaluation of Two Strategies to Enhance the Long-Term Hydraulic Performance of Permeable Reactive Barriers. In Proceedings of the GeoCongress: Geotechnics of Waste Management and Remediation, New Orleans, LA, USA, 9–12 March 2008. [Google Scholar]
  18. Li, L.; Benson, C.H. Evaluation of five strategies to limit the impact of fouling in permeable reactive barriers. J. Hazard. Mater. 2010, 181, 170–180. [Google Scholar] [CrossRef]
  19. Yeh, G.T. FEMWATER: A Finite-Element Model of Water Flow Through Saturated–Unsaturated Porous Media; Report No. 1370; Environmental Sciences Division, Oak Ridge National Laboratory: Oak Ridge, TN, USA, 1980. [Google Scholar]
  20. Yeh, G.T. 3DFEMWATER: A Three-Dimensional Finite Element Model of Water Flow Through Saturated–Unsaturated Media; Report No. ORNL-6386; Oak Ridge National Laboratory: Oak Ridge, TN, USA, 1987. [Google Scholar]
  21. Yeh, G.T.; Tripathi, V.S. HYDROGEOCHEM: A Coupled Model of Hydrologic Transport and Geochemical Equilibria in Reactive Multicomponent Systems; Report No. ORNL-6371; Oak Ridge National Laboratory: Oak Ridge, TN, USA, 1990. [Google Scholar]
  22. Yeh, G.T.; Tripathi, V.S. A model for simulating transport of reactive multispecies components: Model development and demonstration. Water Resour. Res. 1991, 27, 3075–3094. [Google Scholar] [CrossRef]
  23. Sarr, D. Zero-Valent-Iron Permeable Reactive Barriers—How Long Will They Last? Remediation 2001, 11, 1–18. [Google Scholar]
  24. Lin, H.C.J.; Richards, D.R.; Talbot, C.A.; Yeh, G.T.; Cheng, J.R.; Cheng, H.P.; Jones, N.L. FEMWATER: A Three-Dimensional Finite Element Computer Model for Simulating Density-Dependent Flow and Transport in Variably Saturated Media; US Army Corps of Engineers, Waterways Experiment Station: Vicksburg, MS, USA, 1997. [Google Scholar]
  25. Yeh, G.T.; Cheng, J.R.; Lin, H.C. 3DFEMFAT: User’s Manual of a 3-Dimensional Finite Element Model of Density Dependent Flow and Transport Through Saturated-Unsaturated Media; U.S. Army Corps of Engineers, Waterway Experiment Station: Vicksburg, MS, USA, 1994. [Google Scholar]
  26. Yeh, G.T.; Chang, J.R.; Gwo, J.P.; Lin, H.C.; Richards, D.R. 3DSALT: A Three-Dimensional Finite Element Model of Density-Dependent Flow and Transport Through Saturated-Unsaturated Media; U.S. Army Corps of Engineers, Waterway Experiment Station: Vicksburg, MS, USA, 1994. [Google Scholar]
  27. Owczarek, J.A. Fundamentals of Gas Dynamics; International Textbook Company: New York, NY, USA, 1964. [Google Scholar]
  28. Allison, J.D.; Brown, D.S.; Novo-Gradac, K.J. MINTEQA2/PRODEFA2, A Geochemical Assessment Model for Environmental Systems: Version 3.0 User’s Manual; EPA-600/3-91-021; U.S. Environmental Protection Agency: Athens, GA, USA, 1991. [Google Scholar]
  29. Freeze, R.A.; Cherry, J.A. Groundwater; Prentice Hall: Englewood Cliffs, NJ, USA, 1979. [Google Scholar]
  30. Hem, J.D. Study and Interpretation of the Chemical Characteristics of Natural Water, 3rd ed.; Water-Supply Paper 2254; U.S. Geological Survey: Alexandria, VA, USA, 1985. [Google Scholar]
  31. Langmuir, D. Aqueous Environmental Geochemistry; Prentice Hall: Upper Saddle River, NJ, USA, 1997. [Google Scholar]
  32. Reardon, E.J. Anaerobic corrosion of granular iron: Measurement and interpretation of hydrogen evolution rates. Environ. Sci. Technol. 1995, 29, 2936–2945. [Google Scholar] [CrossRef] [PubMed]
  33. Gu, B.; Watson, D.B.; Wu, L.Y.; Phillips, D.H.; White, D.C.; Zhou, J.Z. Microbiological characteristics in a zerovalent iron reactive barrier. Environ. Monit. Assess. 2002, 77, 293–309. [Google Scholar] [CrossRef]
  34. Gu, B.; Phelps, T.J.; Liang, L.; Dickey, M.J.; Roh, Y.; Kinsall, B.L.; Palumbo, A.V.; Jacobs, G.K. Biogeochemical dynamics in zero-valent iron columns: Implications for permeable reactive barriers. Environ. Sci. Technol. 1999, 33, 2170–2177. [Google Scholar] [CrossRef]
  35. Gandhi, S.; Oh, B.T.; Schnoor, J.L.; Alvarez, P.J. Degradation of TCE, Cr(VI), sulfate, and nitrate mixtures by granular iron in flow-through columns under different microbial conditions. Water Res. 2002, 36, 1973–1982. [Google Scholar] [CrossRef]
  36. Alowitz, M.J.; Scherer, M.M. Kinetics of nitrate, nitrite, and Cr(VI) reduction by iron metal. Environ. Sci. Technol. 2002, 36, 299–306. [Google Scholar] [CrossRef]
  37. Westerhoff, P. Reduction of nitrate, bromate, and chlorate by zero valent iron (Fe0). J. Environ. Eng. 2003, 129, 10–16. [Google Scholar] [CrossRef]
  38. Chen, J.L.; Al-Abed, S.R.; Ryan, J.A.; Li, Z. Effects of pH on dechlorination of trichloroethylene by zero-valent iron. J. Hazard. Mater. 2001, 83, 243–254. [Google Scholar] [CrossRef]
  39. Kober, R.; Schlicker, O.; Ebert, M.; Dahmke, A. Degradation of chlorinated ethylenes by Fe0: Inhibition processes and mineral precipitation. Environ. Geol. 2002, 41, 644–652. [Google Scholar]
  40. Hunter, K.; Wang, Y.; Van Cappellen, P. Kinetic modeling of microbially driven redox chemistry of subsurface environments: Coupling transport, microbial metabolism, and geochemistry. J. Hydrol. 1998, 209, 53–80. [Google Scholar] [CrossRef]
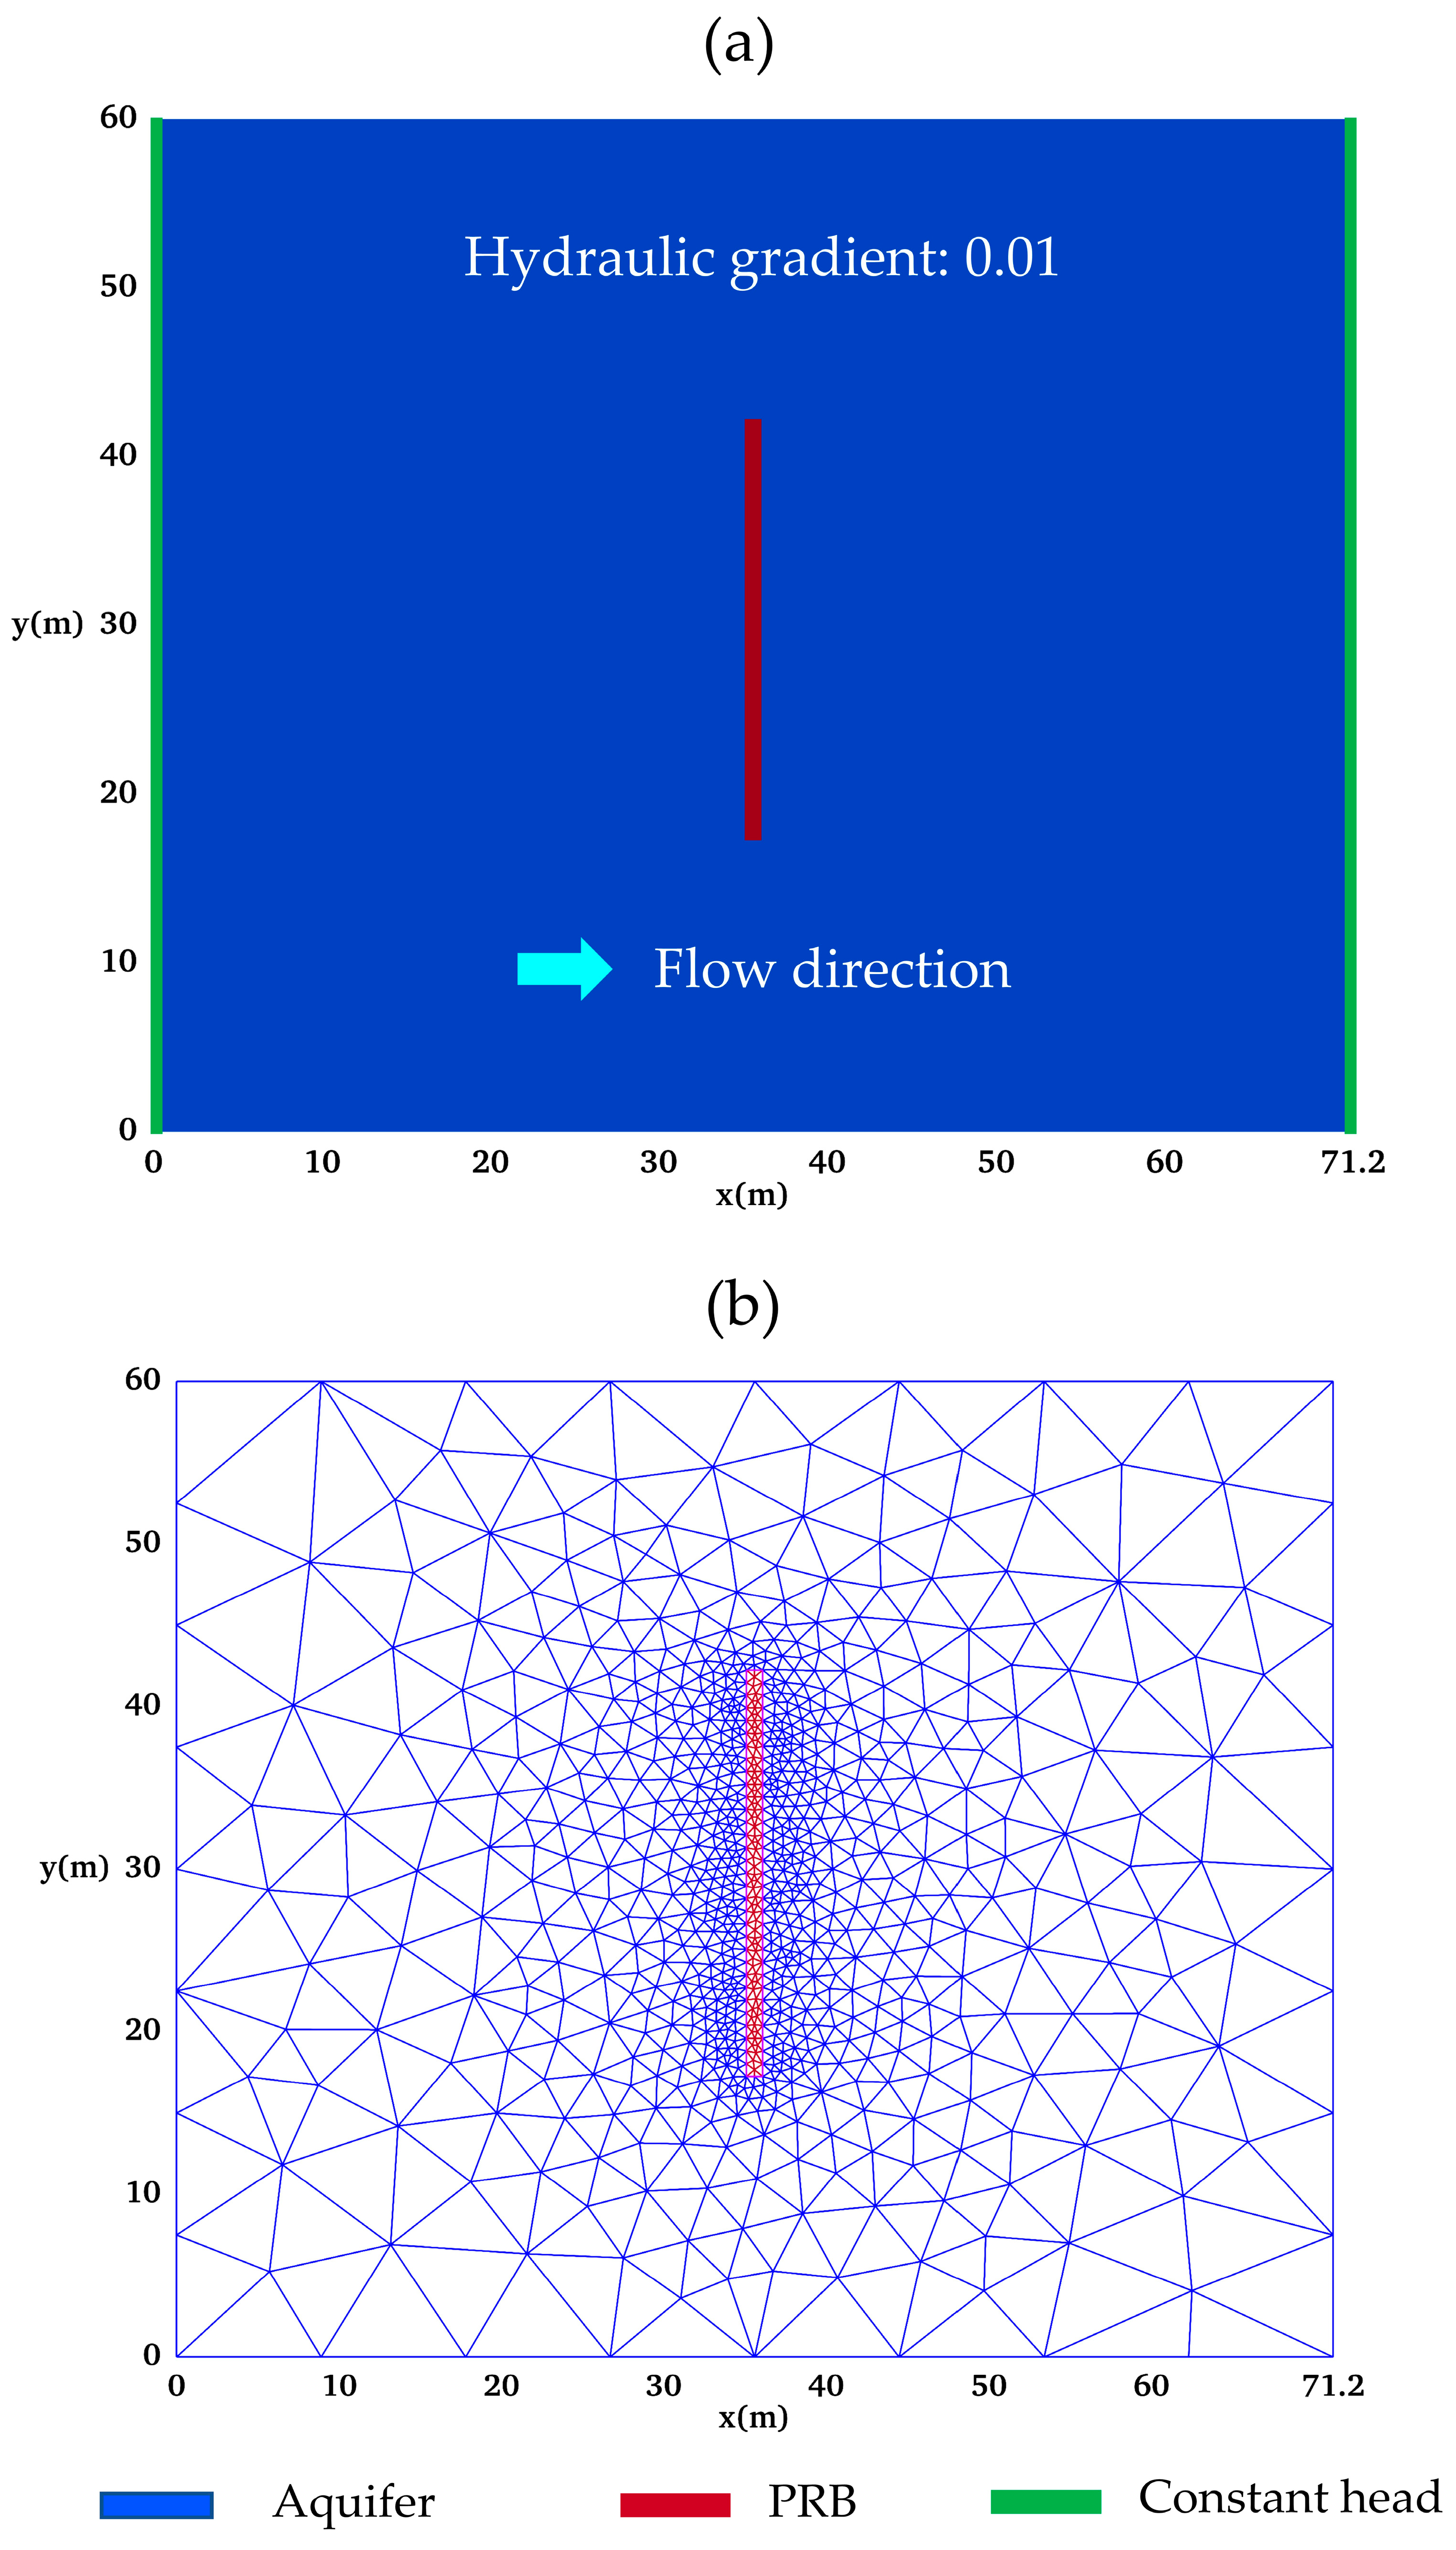
Figure 1. Conceptual and numerical model of the PRB–aquifer system. (a) Conceptual layout showing aquifer boundaries, flow direction, and PRB placement. (b) Triangle mesh discretization of the aquifer and PRB domain.
Hydrology 12 00232 g001
Figure 2. Effect of mineral combinations on porosity reduction in a ZVI-PRB after one year of operation. The curves illustrate porosity reduction along the distance from the entrance face for different mineral combinations.
Hydrology 12 00232 g002
Figure 3. Sensitivity of porosity reduction in a ZVI-PRB to ion concentrations. HCO3 and Ca2+ enhance the entrance face loss of porosity, whereas other species have negligible effects (black curve).
Hydrology 12 00232 g003
Figure 4. Sensitivity of porosity reduction in a ZVI-PRB to reaction rate coefficients. Anaerobic iron corrosion and carbonate mineral precipitation (calcite and siderite) cause the most significant porosity loss near the entrance face, whereas other reactions exhibit negligible effects (black curve).
Hydrology 12 00232 g004
Table 1. Hydrological parameters and boundary conditions of the aquifer and PRB.
Aquifer
(Homogeneous)
PRB
(Homogeneous)
Domain (length × width)71.2 m × 60.0 m1.0 m × 25.0 m
Hydraulic conductivity (K)3.9 (m/day)216 (m/day)
Porosity initial (n0)0.30.6
Boundary conditionsNo flow: top, bottom
Constant-head: upstream
and downstream)
Upgradient: background groundwater concentrations
Table 2. Chemical reactions and solubility constants.
Reaction 1Mineral FormedSolubility Constant
log(Keq) 1
Fe0 + H2O + 0.5O2 → Fe2+ + 2OH--
Fe0 + 2H2O → Fe2+ + H2 + 2OH--
4Fe0 + 7H2O + NO3 → Fe2+ + 10OH + NH4+--
SO42− + 4H2 → HS + OH + 3H2O--
HCO3 ↔ H+ + CO32−-−10.07
H2O ↔ H+ + OH-−14.0
CaCO3 ↔ Ca2+ + CO32−Calcite/aragonite−8.1
CaMg(CO3)2 ↔ Ca2+ + Mg2+ + 2CO32−Ca–Mg–carbonate−17.7
MgCO3 ↔ Mg2+ + CO32−Magnesite−7.2
Mg(OH)2 ↔ Mg2+ + 2OHBrucite−11.2
MnCO3 ↔ Mn2+ + CO32−Rhodochrosite−9.3
Mn(OH)2 ↔ Mn2+ + 2OHPyrochroite−12.9
FeCO3 ↔ Fe2+ + CO32−Siderite−10.5
Fe(OH)2 ↔ Fe2+ + 2OHFerrous hydroxide−15.2
FeS + H2O ↔ Fe2+ + HS + OHFerrous sulfide−18.4
1 Li et al. (2006) [15].
Disclaimer/Publisher’s Note: The statements, opinions and data contained in all publications are solely those of the individual author(s) and contributor(s) and not of MDPI and/or the editor(s). MDPI and/or the editor(s) disclaim responsibility for any injury to people or property resulting from any ideas, methods, instructions or products referred to in the content.