Abstract
In the arid and semi-arid climate of Southern Kazakhstan, groundwater is the primary and most resilient source of water for pasture irrigation. This study provides an integrated assessment of the predicted, natural, and operational groundwater resources across five administrative regions—Almaty, Zhetysu, Zhambyl, Kyzylorda, and Turkestan—considering water quality (total dissolved solids, TDS), potential well yield, and aquifer depth. Hydrogeological maps at 1:200,000 and 1:1,000,000 scales, a regional well inventory, and GIS-based spatial analysis were combined to classify resource availability and identify surplus and deficit zones. Results show that 92.5% of predicted exploitable resources (totaling 1155.2 m3/s) have TDS ≤ 3 g/L, making them suitable for domestic and livestock use. Regional disparities are pronounced: Zhetysu, Almaty, and Zhambyl exhibit resource surpluses, Kyzylorda approaches balance, while Turkestan faces a marked deficit. The developed groundwater availability map integrates mineralization, well productivity, and recommended drilling depth, enabling the design of water intake systems without costly field exploration. This decision-support tool has practical value for optimizing water allocation, reducing operational costs, and improving the sustainability of pasture management under the constraints of limited surface water resources.
1. Introduction
In the context of global climate change and intensifying anthropogenic pressure on water resources, groundwater has become a critical and comparatively resilient source of fresh water, particularly in arid and semi-arid regions. Satellite observations indicate that more than half of the world’s largest aquifers are undergoing critical depletion due to unsustainable abstraction and shifts in precipitation regimes [1,2,3]. In arid zones of Asia and North America, pumping often exceeds natural recharge, driving declines in hydraulic heads, water-quality deterioration, and salinization [4,5,6]. In surface-water-deficit countries such as Jordan, Morocco, and Palestine, groundwater supplies up to 60–80% of domestic and drinking water and is central to drought adaptation [7,8,9]. Similar pressures are documented in Australia, where parts of the Great Artesian Basin face local stress despite its overall storage [10,11,12].
In Central Asia, rapid population growth and the expansion of irrigated agriculture exacerbate sustainability risks. In Afghanistan and Pakistan, decades of intensive pumping have lowered groundwater levels by tens of meters [13,14,15], while growing aridity reduces natural replenishment and accelerates the depletion of “fossil” reserves [16,17,18]. Southern Kazakhstan, characterized by arid to semi-arid climate, scarce and unevenly distributed surface water, and substantial agricultural demand, faces analogous challenges [19,20]. Groundwater underpins water supply for settlements and agriculture, including >10 million ha of pasture lands [19,20]. Recent assessments indicate that the region’s predicted exploitable groundwater resources are approximately 100 million m3/day (≈1155 m3/s), yet their spatial distribution is highly uneven owing to geological heterogeneity and variations in aquifer depth [21,22].
Against this backdrop, we develop a spatial zoning of Southern Kazakhstan by groundwater availability for pasture-land watering. We integrate 1:200,000/1:1,000,000 hydrogeological maps with a region-wide well inventory and GIS-based processing to classify territories by (i) total dissolved solids (TDS), (ii) potential well yield, and (iii) recommended drilling depth and to quantify a provision coefficient K = Q_stock/Q_need at administrative scales [23,24,25]. The resulting maps and metrics provide a decision-oriented basis for environmental planning, optimization of water-supply schemes, and the sustainable development of the regional livestock sector [26].
To situate our contribution within the regional literature, we address three persistent gaps: (i) the absence of a harmonized, decision-oriented framework that links hydrogeological potential to quantified pastoral water demand at administrative scales; (ii) limited comparability across studies due to non-standardized classes of TDS, well yield, and drilling depth; and (iii) insufficient translation of maps into operational guidance for pasture management. We overcome these limitations by integrating multi-scale hydrogeological cartography with a curated well inventory and by applying uniform classification thresholds together with a single provision coefficient K = Q_stock/Q_need. The resulting zoning explicitly identifies areas where local groundwater can reliably sustain pasture watering versus zones that are likely to require deeper drilling, quality pretreatment, or alternative supply schemes. By reporting compact, reproducible metrics at the rayon level and aligning cartographic conventions across the main text and SI, the study provides a transferable baseline for planning, scenario evaluation, and targeted field verification.
2. Materials and Methods
2.1. Study Area
Southern Kazakhstan (Almaty, Zhetysu, Zhambyl, Kyzylorda, and Turkestan regions) spans high- and mid-mountain belts of the Tien Shan and Zhetysu Alatau in the south and southeast, grading north- and northwestward into foothill plains, gently inclined pediments, and extensive sandy deserts (Aralkum, Saryesik-Atyrau, Taukum, Dzhuankum, Moyynkum, Kyzylkum) with ridge–hummock relief. The principal rivers are Syr Darya, Shu, Ile, Karatal, Aksu, and Lepsy; major lakes include the Aral Sea, Balkhash, Sasyk-Kul, and Alakol. Structurally, the western sector belongs to the Turan Platform with a displaced crystalline basement and a weakly deformed Mesozoic–Cenozoic cover, whereas the southern, central, and eastern sectors comprise folded mountain systems of the Northern Tien Shan and Zhetysu Alatau (with spurs Karatau and Kendyktas) and uplifted blocks of the Shu–Ili Mountains and Betpak-Dala. Hydrogeologically, fissured (locally fissure–karst) aquifers dominate in mountain-folded domains, while intermontane basins and river valleys host unconfined and confined porous systems; on the Turan Platform, unconfined/confined porous and formation waters prevail within foothill/intermontane artesian basins, large desert syneclises, and modern to ancient river valleys.
2.2. Data Sources
We integrated (i) hydrogeological maps at 1:200,000 and 1:1,000,000 scales and the Atlas of Hydrogeological Maps of the Republic of Kazakhstan (2022) to delineate hydrogeological domains and support regionalization and figure production and (ii) a consolidated inventory of production and observation wells for the study area, including specific capacity from pumping tests, static/dynamic water levels, and total dissolved solids (TDS). The breakdown of predicted groundwater resources by TDS class (fresh ≤ 1 g L−1 dominating at 65.9%) is provided in Supplementary Figure S1.
Quality control comprised coordinate verification (WGS84), duplicate removal, and exclusion of logs lacking screened-interval or TDS information. A descriptive summary of well metadata is provided in Supplementary Table S1. All maps were produced by the authors in ArcGIS Pro 2.8.
2.3. Indicators and Thresholds
We mapped three decision-oriented indicators—(1) groundwater quality (TDS), (2) potential well yield, and (3) recommended drilling depth—and summarized availability using a single provision coefficient K:
- TDS (g L−1). Classified per SanPiN RK (“The Order of the Minister of Health of the Republic of Kazakhstan”, dated 20 February 2023, No. 26) [27,28]) into ≤1 (fresh), 1–3 (slightly brackish), and 3–10 (moderately mineralized).
- Potential well yield (L s−1). Binned into ≤5, 5–10, 10–30, and ≥30.
- Recommended drilling depth (m). Stratified into 0–50, 50–100, 100–150, and >150.
The provision coefficient is defined as K = Q_stock/Q_need, where Q_stock denotes the exploitable groundwater stock derived from the mapped indicators within hydrogeological domains (either predicted resources or operational reserves, as specified for a given analysis), and Q_need is the daily water demand of pasture lands estimated from livestock inventories, per-head watering norms, and an allowance for distribution losses. For rayon-level summaries, K is reported in four classes: <0.5 insufficient, 0.5–1.0 partial, 1.0–1.5 sufficient, and >1.5 reliable. All thresholds and class edges are used consistently across figures, tables, and text.
The formula used for calculation was
where K is the coefficient of provision with groundwater of domestic and drinking quality; Qstocks(Qresource) are, respectively, the values of operational reserves or predicted resources of groundwater, thousand m3/day; and Qneed is the region’s need for water for domestic and drinking purposes, thousand m3/day.
2.4. GIS Processing and Mapping
All spatial layers were harmonized to a common coordinate reference system, clipped to the study boundary, and processed in ArcGIS Pro 2.8. Predicted resources (≤10 g L−1), natural resources, and operational reserves were rasterized and aggregated to administrative units for computation of K. Cartographic elements follow a consistent scheme (scale bars in km; north arrows). TDS classes and units are harmonized across the main text, figure legends, and Supplementary Information.
3. Results and Discussion
3.1. Regional Hydrogeographic Context
Mineralization of groundwater, expressed as total dissolved solids (TDS), is directly controlled by the lithological composition of the aquifer and its depth [29,30,31]. In the mountainous folded areas of the Almaty and Zhetysu regions, aquifers are represented by fractured and karst reservoirs in limestone-dolomite deposits at depths of 50–300 m, where, due to the rapid feeder current, TDS usually does not exceed 1 g/L [32]. In the foothill and plain zones of the Kyzylorda and Turkestan regions, aquifers occur at 5–50 m in alluvial-deluvial deposits, which causes increased mineralization values of 1–3 g/L with long-term contact with clayey and salt-containing rocks [33,34]. In the intermountain depressions of the Zhambyl region, where the depth reaches 500 m, TDS increases to 3–10 g/L due to the mixed influence of carbonate and clay layers [35].
3.1.1. Almaty Region
The Almaty region extends from the snow-capped peaks of the Zailiyskiy Alatau in the south to Lake Balkhash in the north, and is bounded by the ridges of the Shu-Ilei Mountains in the west and the watershed of the Ili and Karatal Rivers in the east. The south is dominated by the mountain ranges of the Zailiyskiy Alatau, Ketmen, Terskey, and Kungey-Alatau with numerous intermountain and intramountain depressions (including Kopa-Ileiskaya), and the north is dominated by the sandy massifs of the South Balkhash Depression. The hydrographic network is represented by the Ili River and its tributaries. The average long-term runoff of the basin is 17.7 km3/year (6.0 km3/year available for use), and during low-water periods, it is 12.3 km3/year (5.41 km3/year) (Figure 1a). Groundwater is developed in Quaternary alluvial-proluvial boulder-pebble and eolian-alluvial deposits, as well as in pressure complexes of Neogene-Cretaceous rocks. The predicted exploitation resources with a mineralization of up to 10 g/L are estimated at 244.8 m3/s, of which 81.1% is fresh water (≤1 g/L) and 14.5% is slightly brackish water (1–3 g/L) (Figure 1f). Comparison of the volumes of predicted (244.8 m3/s), natural (186.3 m3/s), and operational (78.2 m3/s) resources together with their resource modules (1.89, 1.76, and 0.74 L/s km2, respectively) is presented in the combined diagram (Figure 1k).
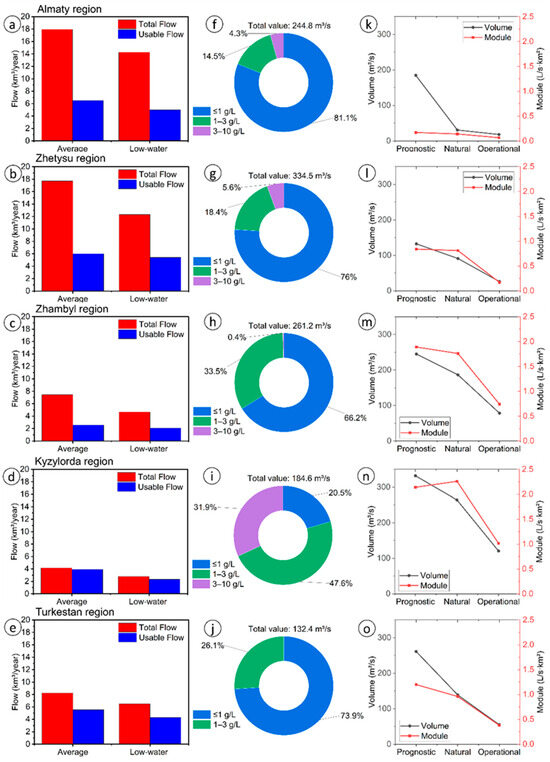
Figure 1.
(a–e) Surface-water flow in average and low-water years for five regions; (f–j) distribution of prognostic groundwater resources by mineralization; (k–o) volumes and resource modules of prognostic, natural, and operational groundwater reserves.
3.1.2. Zhetysu Region
The Zhetysu region is located in the southeast of Kazakhstan between the Central Kazakhstan Uplands in the north, the Alakol and Sasyk-Kul lakes in the east, the Ile River in the south, and the Saryesik-Atyrau sands in the west. The main hydrographic framework is formed by the rivers of the Balkhash and Alakol basins (Karatal, Aksu, Lepsi, Tentek, Ayagoz, etc.). The average annual runoff of all rivers is 7.43 km3/year, of which 2.57 km3/year is available for use, and during the low-water period, the total runoff decreases to 4.66 km3/year (2.07 km3/year is available) (Figure 1b). Groundwater in the region is developed in four key horizons—from Quaternary alluvial-proluvial deposits to confined Neogene-Cretaceous complexes. The total predicted resources exceed 332.0 m3/s, with fresh water (mineralization ≤ 1 g/L) making up 254.5 m3/s (76.6%) and slightly brackish water (1–3 g/L) making up 61.7 m3/s (18.6%) (Figure 1g). Comparison of the volumes of predicted (332.0 m3/s), natural (264.1 m3/s), and operational (120.5 m3/s) reserves and their modules (2.14, 2.26, and 1.015 L/s km2) is presented in the combined diagram (Figure 1l).
3.1.3. Zhambyl Region
The Zhambyl region is located in the south of Kazakhstan, bounded by the spurs of the Kyrgyz Range in the south, the Maly Karatau in the northwest, and the sands of Moyynkum and Betpak-Dala in the north. The largest intermountain basins (Shu-Sarysu, Kopinskaya, etc.) and the Kendyktas Plateau determine the local hydrogeological structure. Surface resources of the Shu, Talas, Assa, and other river basins are characterized by an average annual runoff of 4.15 km3/year, of which 3.92 km3/year is used, and during low-water periods, the total runoff decreases to 2.77 km3/year (2.32 km3/year is available) (Figure 1c). The predicted exploitable resources of groundwater with mineralization up to 10 g/L are 261.2 m3/s, including 172.8 m3/s of fresh water (≤1 g/L) and 87.4 m3/s of slightly brackish water (1–3 g/L) (Figure 1h). The comparison of the volumes of predicted (261.2 m3/s), natural (138.9 m3/s), and operational (54.85 m3/s) reserves with their modules (1.20, 0.96, and 0.38 L/s km2, respectively) is presented in the combined diagram (Figure 1m).
3.1.4. Kyzylorda Region
The Kyzylorda region occupies the lowland plain of the lower reaches of the Syr Darya River, a significant part of which is occupied by aeolian massifs (the Aral Kara-Kum, Northern Kyzylkum, and Moyynkum). The eastern border is defined by the spurs of Kara-Tau, while the western is defined by the coast of the Aral Sea. The main surface resources of the region are formed by the Syr Darya: the average long-term runoff is 8.23 km3/year (5.54 km3/year is available), while in the low-water period, it is 6.50 km3/year (4.30 km3/year is available) (Figure 1d).
Groundwater is widespread in all lithological and genetic complexes from Quaternary eolian-alluvial deposits to Upper Cretaceous and Cretaceous horizons. The predicted exploitation resources with mineralization up to 10 g/L are estimated at a total of 184.6 m3/s, of which 20.5% are fresh waters (≤1 g/L), 47.6% are slightly brackish (1–3 g/L), and 31.9% are more mineralized (3–10 g/L) (Figure 1l). A comparative analysis of the underground resource indicators (predicted 184.6 m3/s, natural 30.7 m3/s, and operational 18.1 m3/s) and their density moduli (0.17, 0.14, and 0.065 L/s km2, respectively) is presented in a combined diagram (Figure 1n).
3.1.5. Turkestan Region
The Turkestan region is located in the central part of South Kazakhstan on the Turan Plain and the western spurs of the Tien Shan, from Karatau in the northwest to the Ugam-Talas ranges in the southeast, with the main part of the region occupied by the terraced valleys of the Syr Darya and its tributaries (Figure 1e). The average annual flow of the river network (Syr Darya, Arys, Keles, Kurukkeles, etc.) is 17.95 km3/year, of which 6.50 km3/year is available for use, and during low-water periods, the total flow decreases to 14.27 km3/year (5.00 km3/year is used) (Figure 1j). Groundwater is developed in the Quaternary, Pliocene, Paleogene, and Cretaceous deposits, as well as in the fissure-karst zones of the Western Tien Shan. The predicted exploitable resources with a mineralization of up to 10 g/L are estimated at 132.4 m3/s, of which 73.9% are fresh waters (≤1 g/L) and 26.1% are slightly brackish waters (1–3 g/L) (Figure 1b). The volumes of predicted (132.4 m3/s), natural (91.15 m3/s), and exploitable (26.0 m3/s) groundwater reserves and the corresponding modules (0.84, 0.81, and 0.17 L/s km2) are presented in the combined column-linear diagram (Figure 1o).
3.2. Spatial Distribution of Predicted and Natural Groundwater Resources
Figure 2 shows a generalized hydrogeological map of South Kazakhstan, which shows the main tectonic structures (the Turan Plate, the Syr Darya, Shu-Sarysu, Ili and Alakol-Balkhash basins), as well as the distribution of key aquifers: fissure aquifers in the Tien Shan and Zhetysu-Alatau mountain ranges, porous-stratal aquifers in intermountain and foothill basins, and porous aquifers in Quaternary deposits of the plains. A detailed version of this map is provided in the Supplementary File (Figure S2). Relief elements (highlands, foothills, sandy deserts) serve as reference points for understanding the zones of groundwater recharge and discharge, and the main hydrographic networks (the Syr Darya, Shu, Ili, and other rivers) help to link cartographic data with the dynamics of surface runoff.
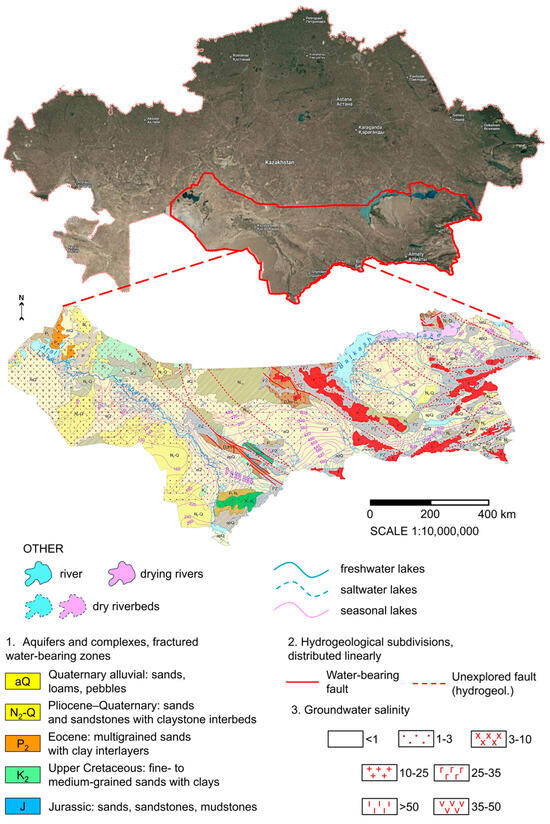
Figure 2.
Hydrogeological map of Southern Kazakhstan (by ArcGIS Pro 2.8).
The figure emphasizes the complex combination of the geological structure and hydrogeological conditions of the region. Figure 3 shows the hydrogeological zoning of Southern Kazakhstan at the first-order level, highlighting the main groundwater basins and their second order. In this study, first-order basins are defined as the principal tectono-sedimentary units delineated by major structural boundaries (e.g., large faults and folds) encompassing entire catchment areas of major river systems. Second-order basins represent sub-catchments within these larger units, bounded by local hydrographic divides and geomorphic features corresponding to distinct drainage areas. This classification follows the criteria of the Hydrogeological Atlas of the Republic of Kazakhstan (hydrogeological map series at 1:200,000 and 1:1,000,000) [36].
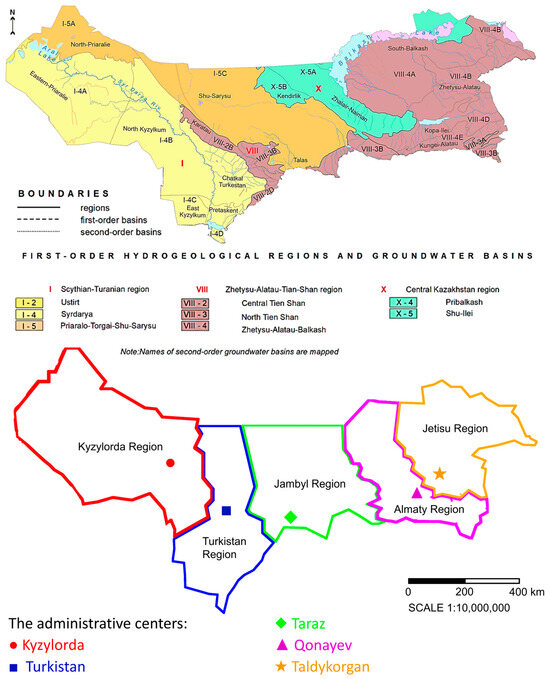
Figure 3.
Map of hydrogeological regionalization (by ArcGIS Pro 2.8).
Three large hydrogeological regions are marked in different colors: Scythian-Turanian (I-2, I-4, I-5), Zhetysu-Alatau-Tien Shan (VIII-2, VIII-3, VIII-4), and Central Kazakhstan (X-4, X-5), within which the first- and second-order basins are marked with dotted and thin lines, respectively [37]. The lower part of the map shows the administrative division of five regions (Almaty, Zhetysu, Zhambyl, Kyzylorda, and Turkestan) with their centers indicated: Taldykorgan (orange star), Kokshetau (red circle), Taraz (green diamond), Kyzylorda (blue square), and Turkestan (purple triangle). The scale is 1:10,000,000, with north pointing up. Figure 2 and Figure 3 were produced by the authors using ArcGIS Pro 2.8 [38].
The analysis of five regions of Southern Kazakhstan allows us to highlight several key findings. First, the significant difference between the total and used flow indicates serious instability of water use in certain regions: in the Almaty and Zhambyl regions, only a third to a quarter of the total flow is available for exploitation, while in the Kyzylorda and Turkestan regions, this figure is higher, but the water quality often does not meet drinking water standards due to high mineralization. Second, the distribution of predicted resources by mineralization classes demonstrates that only in the Almaty and Zhetysu regions does the share of fresh water exceed 75%, while in the Kyzylorda region, more than a third of the reserves are at a mineralization of 3–10 g/L, which requires expensive preparation. A comparison of the volumes of predicted, natural, and exploitable reserves together with their resource modules indicates a significant reduction in water available for withdrawal during the transition from forecast to actual exploitation. A sharp drop in the module in operational reserves is especially characteristic, which indicates the risk of rapid depletion of horizons with intensive water withdrawal.
Maps of three indicators—total dissolved solids (TDS), potential well yield, and recommended drilling depth—are presented together with region- and district-level summaries (class shares, medians, and ranges) and the district-scale distribution of the Coefficient of Resource Fulfilment (CRF), highlighting zones of surplus and deficit. The section reports observed magnitudes and spatial patterns without causal interpretation.
Figure 4a shows a map of predicted exploitable groundwater resources in South Kazakhstan, calculated in m3/s.
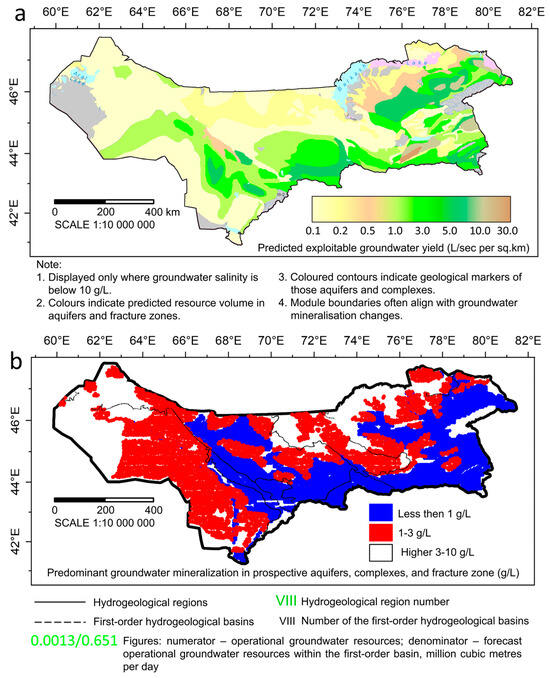
Figure 4.
Map of forecast exploitable resources of Southern Kazakhstan: (a) exploitable resources (thousand m3 day−1); (b) specific resource module (L s−1 km−2).
The color scale displays the volumes of resources within five basins: from light blue areas with minimum values (<50 m3/s) to deep blue zones with maximum volumes (>200 m3/s). The most significant reserves are concentrated in the Kopa-Ilei and South Balkhash basins, which is due to good connections with atmospheric and river feeding, as well as a thick layer of aquifers.
Regionally, the concentration of higher availability classes (K > 1.5K > 1.5K > 1.5) in alluvial–deltaic tracts along the Ile, Karatal–Aksu–Lepsy, and Syr Darya corridors mirrors the recharge–storage controls highlighted for Central Asian forelands and interior basins in the studies cited in the Introduction. Conversely, the prevalence of K ≤ 1.0K\le 1.0K ≤ 1.0 in interfluvial deserts (Moyynkum, Taukum, Kyzylkum) and in structurally closed depressions is consistent with documented head declines and salinization under increasing aridity. The TDS structure—fresh to slightly brackish waters on piedmont fans with basinward increases in mineralization—reproduces canonical arid-basin trends. Finally, the recommended drilling depths (≤100–150 m in major valley fills versus >150 m on distal desert plains) accord with reported well-completion patterns, reinforcing the operational utility of our zoning for pasture-water planning.
Figure 4b shows a map of natural groundwater resources (m3/s), determined by natural flow without taking into account withdrawal. A green palette is used here: from pale green shades (<30 m3/s) in the sand massif zones to deep emerald areas (>150 m3/s) in the foothill and intermountain basins. Comparison of Figure 4a and Figure 4b demonstrates that in most areas the exploitable reserves are significantly lower than the natural potential, which indicates a reserve of opportunities for a sustainable increase in water intake while maintaining the limits of natural replenishment.
Figure 5 shows the natural groundwater resources of Southern Kazakhstan as the average annual flow module (L/s km2). The highest values (>10 L/s km2) are observed in the zones of the intermountain basins of Zailiysky and Zhetysu-Alatau, which is due to intensive mountain recharge flow and developed fracturing of rocks. Moderate modules (2–5 L/s km2) are typical for foothill plains, while reduced ones (<0.1 L/s km2) are noted in the aeolian deserts of the Aral Sea region and Moyynkum Desert due to the low permeability of sediments. It should be noted that this map was obtained on the basis of average annual estimates and may not reflect seasonal fluctuations in flow rate.
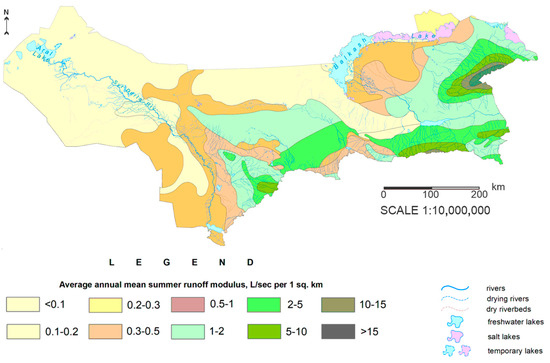
Figure 5.
Map of natural groundwater resources of Southern Kazakhstan.
3.3. Groundwater Quality and Water Availability Assessment
Figure 6a shows the distribution of the predicted exploitable groundwater resources of Southern Kazakhstan by three mineralization classes. The total volume of predicted resources is estimated at 1155.2 m3/s, of which 761.4 m3/s (65.9%) are fresh waters with mineralization ≤ 1 g/L, 307.1 m3/s (26.6%) are slightly brackish waters (1–3 g/L), and only 86.7 m3/s (7.5%) are waters with mineralization of 3–10 g/L. This picture confirms the dominance of waters qualitatively suitable for CRF in the resource potential of the region (Figure 6a).
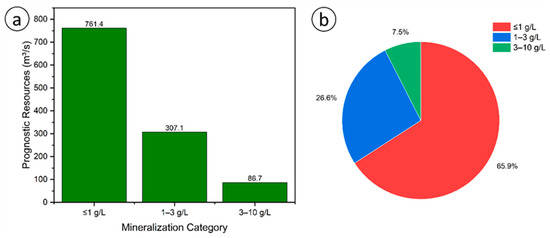
Figure 6.
Distribution of predicted exploitable groundwater resources of Southern Kazakhstan by mineralization categories: (a) absolute volumes of resources (m3/s) in categories ≤1, 1–3, and 3–10 g/L; (b) relative shares (%) of these resources from the total volume.
Figure 6b demonstrates the proportional ratio of these three mineralization classes: more than two-thirds of all predicted waters (<1 g/L) can be used without additional desalination treatment, another quarter of the reserves are represented by slightly brackish waters (1–3 g/L), requiring only simple adjustment of the chemical composition, and only an insignificant part (7.5%) occupies moderately mineralized horizons (3–10 g/L). Considering that the norms of SanPiN RK allow the use of groundwater with a mineralization of up to 3 g/L for domestic and drinking purposes, it can be concluded that over 92% of the predicted resources of the region meet these requirements and can satisfy the needs of both populated areas and pasture complexes (Figure 6b).
Spatial patterns in CRF reflect the combined influence of aquifer type and depth, salinity, recharge regime, and water demand. Higher CRF clusters in the Zhetysu, Almaty, and Zhambyl regions, where porous alluvial intermontane systems and mountain-front recharge yield shallower, fresher (low-TDS) groundwater and higher prospective yields. In contrast, lower CRF is more frequent in parts of Turkestan and Kyzylorda, coinciding with deeper confined systems of the Turan Platform and desert syneclises, where longer residence times and greater evaporative concentration produce elevated TDS and reduced yields; these areas also show thicker unsaturated zones and a higher proportion of brackish waters. Superimposed on the hydrogeologic control, districts with higher livestock densities exhibit larger Q_need, which accentuates deficits even where physical availability is moderate. These contrasts are consistent with the regional hydrogeological framework (e.g., Syr Darya, Shu–Sarysu, Ili, and Alakol–Balkhash depressions) documented in the Hydrogeological Atlas (2022) and related syntheses, and they motivate practical choices: prioritize siting along proximal alluvial fans and valley fills in surplus districts, whereas deficit districts may require deeper drilling, salinity treatment, or demand management, to ensure reliable supply.
The developed map of conditions of groundwater supply for pasture areas reflects the spatial distribution of groundwater by mineralization categories (≤1; 1–3; >3; >10 g/L), possible productivity of production wells (≤5; 5–10; 10–30; ≥30 L/s), and prevailing occurrence depth (shading). When considering this map together with the map of predicted production resources and the map of natural groundwater resources, it is possible to assess the resource potential of any area of Southern Kazakhstan and determine the design productivity of water intakes for pasture irrigation. The assessment of provision shows that pasture areas are fully provided with fresh and slightly brackish groundwater resources even for the long term. The groundwater demand of the pasture areas of Southern Kazakhstan as a whole is 166,365 thousand m3/day and varies from 12,264 thousand m3/day (Kyzylorda region) to 72,612 thousand m3/day (Zhambyl region); for other regions, the combined demand is 81,489 thousand m3/day (Table 1, Figure S1). At the same time, the predicted operational resources (99,792.5 thousand m3/day) and natural resources (61,794.13 thousand m3/day) significantly exceed the demand of the pasture landscape of the region.

Table 1.
Provision of pasture areas with predicted operational and natural groundwater resources by administrative regions of South Kazakhstan.
The obtained results emphasize the high reliability of groundwater supply to pastures in Southern Kazakhstan and demonstrate that the developed map is an effective tool for planning and optimizing irrigation systems in the arid climate of the region. Table 1 presents summary data on the water demand of pasture areas of Southern Kazakhstan and their resource potential. The total daily demand is 166,365 m3, while the predicted exploitable resources are estimated at 99,792.5 m3 and natural resources at 61,794.13 m3. The total volume of available resources (≈161,586.6 m3/day) almost completely covers the region’s needs. The distribution of water demand and resources by region reveals significant differences. In the Almaty region, the demand (24,767 m3/day) is covered by resources of 37,244.6 m3 (forecast 21,148.2; natural 16,096.4), in Zhetysu, the demand is 28,968 m3/day with resources of 51,507.4 m3, and in Zhambyl, it is 27,754 m3/day with resources of 34,571.1 m3. The Kyzylorda region is close to balance: demand of 12,264 m3/day and resources of 18,604.2 m3. The only deficit is observed in the Turkestan region, where the demand is 72,612 m3/day, and the resources amount to only 19,659.3 m3.
The data demonstrate the composition of the predicted exploitable resources by mineralization classes: the volume of water with mineralization up to 1 g/L reaches 65,781.3 m3/day, with mineralization of 1–3 g/L reaching 26,520.4 m3/day and mineralization of 3–10 g/L reaching 7490.8 m3/day. The module of natural resources (dm3/s km2) varies from 0.14 in the Kyzylorda region to 2.26 in Zhetysu, which reflects the density of water intake per unit area.
As a result of the comprehensive analysis of the predicted, natural, and exploitable resources of groundwater in the pasture areas of Southern Kazakhstan, the following patterns were identified. The total volume of predicted resources with mineralization up to 10 g/L is 1155.2 m3/s, of which fresh water (≤1 g/L) provides 761.4 m3/s (65.9%), slightly brackish water (1–3 g/L) 307.1 m3/s (26.6%), and more mineralized (>3 g/L) 86.7 m3/s (7.5%). The natural resources of the region are taken to be equal to 715.2 m3/s with an average modulus of 0.99 L/s km2, and the operational reserves suitable for long-term industrial and agricultural water use are 297.7 m3/s, of which fresh water makes up 287.4 m3/s (modulus 0.40 L/s km2).
The groundwater availability map (Figure 7) demonstrates the spatial distribution of four classes of water availability by well flow rate.
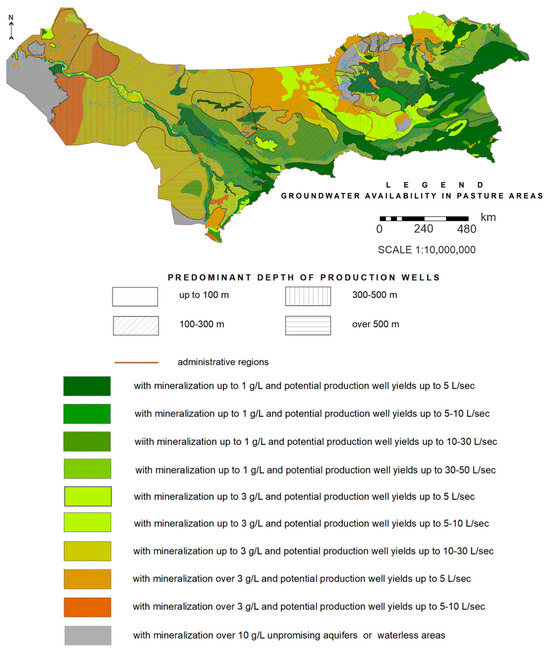
Figure 7.
Map of classes of groundwater supply for pasture areas in South Kazakhstan.
The most productive aquifers, confined to floodplain and alluvial deposits of large rivers (Ili, Chu, Sarysu), provide a well flow rate of at least 2 L/s. Zones with a flow rate of 0.5 to 2 L/s are localized mainly on the lower terraces and estuarine plains of small tributaries, where stable water intake is maintained. Interfluves and arid plains, represented by soils with complex fracturing and low thickness of aquifers, are capable of providing only 0.1–0.5 L/s, and in areas with a flow rate of less than 0.1 L/s, water is concentrated in fragmented, thin horizons, which significantly limits their practical use. Gray areas of the map indicate unproductive or highly mineralized strata that require preliminary measures to reduce salinity.
The regional analysis revealed that the Zhetysu, Almaty, and Zhambyl regions have excess forecast and operational groundwater resources, which creates favorable conditions for expanding irrigation and organizing water intake on pastures. In the Kyzylorda region, there is a relative balance between resources and needs, but local areas with shortages require regulation of water intake volumes to prevent an imbalance between resources and consumption. The Turkestan region is characterized by a deficit of both forecast and operational reserves, so either a link to deep aquifers or a reduction in the intensity of water consumption is necessary here.
The obtained results confirm that the cartographic approach to groundwater accounting and classification allows for efficient planning of well drilling and operation depending on the geological and geomorphological conditions of the region. The developed map can serve as a practical tool for selecting optimal water intake sites, reducing drilling and operation costs, as well as for the justified development of melioration measures and sustainable water use on pasture lands in Southern Kazakhstan. Thus, the Zhetysu, Almaty, and Zhambyl regions have significant groundwater reserves and can not only satisfy their own needs but also provide resource support to neighboring territories. The Kyzylorda region requires careful production management to avoid exceeding the “resources-demand” balance. The Turkestan region is experiencing an acute deficit: to provide pastures, it is necessary to either attract additional deep layers and alternative aquifers or reduce water consumption.
4. Conclusions
The conducted study allowed for comprehensively assessing the predicted, natural, and operational resources of groundwater in the pasture areas of Southern Kazakhstan, taking into account their mineralization, productivity, and depth. Spatial analysis revealed that a significant part of the region has stable reserves of fresh and slightly brackish water, meeting the needs of livestock even in the long term. The Zhetysu, Almaty, and Zhambyl regions are characterized by a surplus of resources, which creates opportunities for expanding irrigation and interregional resource support. The Kyzylorda region is close to balance but requires regulated water withdrawal, while in the Turkestan region, a deficit is recorded, which can be compensated for by attracting deep horizons and desalination or optimization of water consumption. The developed map of groundwater supply conditions integrates key hydrogeological indicators and serves as an applied tool for selecting optimal drilling sites, designing water intakes, and planning melioration measures without conducting expensive surveys. Its application will improve the efficiency of resource use, reduce operating costs, and strengthen the sustainability of pasture water supply in the arid climate of Southern Kazakhstan.
Supplementary Materials
The following supporting information can be downloaded at: https://www.mdpi.com/article/10.3390/hydrology12090227/s1, Figure S1, Distribution of predicted groundwater resources of Southern Kazakhstan by mineralization categories, m3/s; Figure S2, A detailed version; Table S1, Wells—5 Regions (Almaty, Zhetysu, Zhambyl, Kyzylorda, Turkestan).
Author Contributions
Conceptualization, V.S. and A.K.; methodology, T.R.; software, R.A.; validation, G.N., V.S. and D.A.; formal analysis, V.S.; investigation, D.A.; resources, D.A.; data curation, V.S.; writing—original draft preparation, A.K.; writing—review and editing, G.N.; visualization, G.N.; supervision, R.A.; project administration, R.A.; funding acquisition, R.A. All authors have read and agreed to the published version of the manuscript.
Funding
This study is funded by the Science Committee of the Ministry of Science and Higher Education of the Republic of Kazakhstan (No. BR 24992885).
Data Availability Statement
The original contributions presented in this study are included in the article and supplementary material. Further inquiries can be directed to the corresponding authors.
Conflicts of Interest
Author Rakhmatulla Ayazbayev is employed by the company Limited Liability Partnership “AlmatyHydroGeology”, Almaty, Kazakhstan. The remaining authors declare that the research was conducted in the absence of any commercial or financial relationships that could be construed as a potential conflict of interest.
Correction Statement
This article has been republished with a minor correction to the Data Availability Statement. This change does not affect the scientific content of the article.
References
- Taylor, R.G.; Scanlon, B.; Döll, P. Groundwater and climate change. Nat. Clim. Change 2013, 3, 322–329. [Google Scholar] [CrossRef]
- Wada, Y.; van Beek, L.P.H.; Bierkens, M.F.P. Global depletion of groundwater resources. Geophys. Res. Lett. 2012, 39, L11402. [Google Scholar] [CrossRef]
- Famiglietti, J.S. The global groundwater crisis. Nat. Clim. Change 2017, 7, 449–450. [Google Scholar] [CrossRef]
- Scanlon, B.R.; Reedy, R.C.; Faunt, C.C. Groundwater depletion and sustainability of irrigation in the US High Plains and Central Valley. Proc. Natl. Acad. Sci. USA 2012, 109, 9320–9325. [Google Scholar] [CrossRef] [PubMed]
- Richey, A.S.; Thomas, B.F.; Lo, M.-H. Quantifying renewable groundwater stress with GRACE. Water Resour. Res. 2015, 51, 5217–5238. [Google Scholar] [CrossRef]
- Alley, W.M.; Reilly, T.E.; Franke, O.L. Sustainability of Ground-Water Resources; U.S. Geological Survey Circular: Reston, VA, USA, 2002; Volume 1186.
- Foster, S.; Garduño, H. Groundwater and drought in Jordan. Hydrogeol. J. 2015, 23, 1425–1437. [Google Scholar]
- Tharme, R.E.; Soulis, E.D.; Cui, Y. Managing groundwater in Morocco’s agricultural basins. Agric. Water Manag. 2012, 104, 190–200. [Google Scholar]
- Gutjahr-Gobell, R.; Gvirtzman, H.; Berkowitz, B. Groundwater use and drought adaptation in Palestine. J. Hydrol. 2018, 557, 189–203. [Google Scholar]
- Ashraf, M.; Chaturvedi, A.; Roberts, J. Groundwater management challenges in the Great Artesian Basin, Australia. J. Environ. Manag. 2019, 234, 543–551. [Google Scholar]
- Li, X.; Zhao, J.; Huang, Q. Impacts of irrigation on groundwater depletion in northern China. Water Resour. Res. 2020, 56, e2019WR026895. [Google Scholar]
- Razmkhah, A.; Rahman, M.M.; Salehin, M. Groundwater drought assessment in arid regions of Iran. J. Hydrol. 2021, 594, 125982. [Google Scholar]
- Qureshi, A.S.; Scott, C.A.; Raschid-Sally, L.; Jayakody, P. Challenges and prospects for sustainable groundwater management in the Indus Basin, Pakistan. Hydrogeol. J. 2015, 23, 1503–1518. [Google Scholar] [CrossRef]
- Custodio, E. Aquifer overexploitation: What does it mean? Hydrogeol. J. 2002, 10, 254–277. [Google Scholar] [CrossRef]
- Zhou, Y.; Shrestha, S.; Babel, M.S. Groundwater sustainability under climate change in Central Asia. Renew. Sustain. Energy Rev. 2021, 136, 110418. [Google Scholar]
- Groen, A.; Simmers, I.; Vanderborght, J. Fossil groundwater dynamics and climate change. Earth-Sci. Rev. 2014, 136, 130–142. [Google Scholar]
- Hassan, A.; Sultan, M.; Valdes, G. Impact of climate variability on groundwater recharge in arid regions. J. Arid. Environ. 2019, 162, 1–10. [Google Scholar]
- Muthuwatta, L.P.; Singh, R.; Savenije, H.H.G. Climate Change and Groundwater Resources in Semi-Arid Regions; Springer Water: Cham, Switzerland, 2018; pp. 45–57. [Google Scholar]
- Wu, H.; Wu, J.; Song, F.; Abuduwaili, J.; Saparov, A.S.; Chen, X.; Shen, B. Spatial distribution and controlling factors of surface water stable isotope values (δ18O and δ2H) across Kazakhstan, Central Asia. Sci. Total Environ. 2019, 678, 53–61. [Google Scholar] [CrossRef] [PubMed]
- Khan, F.I.; Anderson, G.; Jambor, E. Sustainable groundwater management in Kazakhstan. Water Int. 2016, 41, 858–875. [Google Scholar]
- Auezov, B.A.; Saparov, A.M.; Iskakova, Z.M. Groundwater resources and use in South Kazakhstan. J. Arid. Environ. 2019, 166, 23–30. [Google Scholar]
- Iskakova, Z.; Saparov, A.; Turdaliev, M. Spatial distribution and potential of groundwater in South Kazakhstan. Hydrogeol. J. 2021, 29, 1021–1034. [Google Scholar]
- Saparov, A.M.; Auezov, B.A.; Kharisov, M.V. Hydrogeological zoning of Southern Kazakhstan. Environ. Earth Sci. 2020, 79, 331. [Google Scholar]
- Johnson, A.I.; Sposito, G. Modeling Mineralization Patterns in Arid Aquifers; Springer Hydrogeology: Cham, Switzerland, 2014; pp. 89–110. [Google Scholar]
- Mahmood, K.; Babel, M.S. GIS-based groundwater suitability assessment. Water 2016, 8, 100. [Google Scholar]
- Zhang, L.; Li, P.; Wu, J. Geostatistical analysis of groundwater quality and yield in arid environments. Elsevier J. Hydrol. 2022, 603, 127046. [Google Scholar]
- Adenova, D.; Sarsekova, D.; Absametov, M.; Murtazin, Y.; Sagin, J.; Trushel, L.; Miroshnichenko, O. The study of groundwater in the zhambyl region, southern Kazakhstan, to improve sustainability. Sustainability 2024, 16, 4597. [Google Scholar] [CrossRef]
- Order of the Minister of Health of the Republic of Kazakhstan Dated February 20, 2023 No. 26. On Approval of the Sanitary Rules “Sanitary and Epidemiological Requirements for Water Sources, Water Intake Places for Domestic and Drinking Purposes, Domestic and Drinking Water Supply and Places of Cultural and Domestic Water Use and Safety of Water Bodies”. Registered with the Ministry of Justice of the Republic of Kazakhstan on February 20, 2023 No. 31934. Available online: https://adilet.zan.kz/rus/docs/V2300031934 (accessed on 12 October 2024).
- Shamshedenova, S.; Beisenova, R.; Rakhymzhan, Z.; Zhaznaeva, Z.; Syzdykova, N.; Tazitdinova, R.; Khanturin, M. Ecological Characteristics of Groundwater in Rural Areas of the Karaganda Region. J. Ecol. Eng. 2019, 20, 67–75. [Google Scholar] [CrossRef] [PubMed]
- Tleuova, Z.; Snow, D.D.; Mukhamedzhanov, M.; Ermenbay, A. Relation of hydrogeology and contaminant sources to drinking water quality in southern Kazakhstan. Water 2023, 15, 4240. [Google Scholar] [CrossRef]
- Tazhiyev, S.; Murtazin, Y.; Sotnikov, Y.; Rakhimova, V.; Adenova, D.; Abdizhalel, M.; Yerezhep, D. Geoinformation and Analytical Support for the Development of Promising Aquifers for Pasture Water Supply in Southern Kazakhstan. Water 2025, 17, 1297. [Google Scholar] [CrossRef]
- Ayana, D.; Yermekkul, Z.; Issakov, Y.; Mirobit, M.; Ainura, A.; Yerbolat, K.; Ainur, K.; Kairat, Z.; Zhu, K.; Dávid, L.D. The possibility of using groundwater and collector-drainage water to increase water availability in the Maktaaral district of the Turkestan region of Kazakhstan. Agric. Water Manag. 2024, 301, 108934. [Google Scholar] [CrossRef]
- Murtazin, Y.; Miroshnichenko, O.; Trushel, L. Description of the informational system of groundwater resources and reserves of Kazakhstan. Int. Multidiscip. Sci. GeoConference SGEM 2019, 19, 137–144. [Google Scholar]
- Environmental Systems Research Institute. ArcGIS Pro, Version 2.8; Environmental Systems Research Institute: Redlands, CA, USA, 2021. Available online: https://www.esri.com/en-us/arcgis/products/arcgis-pro (accessed on 1 July 2024).
- Akhmetova, S.; Polyakova, S.; Duskayev, K.; Chigrinets, A. Water resources and regional climate change: Almaty metropolis case. Cent. Asian J. Sustain. Clim. Res. 2023, 2, 69–84. [Google Scholar] [CrossRef]
- Mukhamedzhanov, M.; Arystanbaev, Y.; Iskakov, N.; Kazanbaeva, L.; Bekzhigitova, D. Prospects of use of underground waters to rangesicle field of water supply for the growing needs of Kyzylorda. Int. Multidiscip. Sci. GeoConference SGEM 2017, 17, 659–667. [Google Scholar]
- Sala, R.; Deom, J.M.; Clarke, D. The “karez” of the Sauran Region (Turkestan oasis). Water Sci. Technol. Water Supply 2010, 10, 656–663. [Google Scholar] [CrossRef]
- Adenova, D.; Tazhiyev, S.; Sagin, J.; Absametov, M.; Murtazin, Y.; Trushel, L.; Zaryab, A. Groundwater quality and potential health risk in Zhambyl region, Kazakhstan. Water 2023, 15, 482. [Google Scholar] [CrossRef]
Disclaimer/Publisher’s Note: The statements, opinions and data contained in all publications are solely those of the individual author(s) and contributor(s) and not of MDPI and/or the editor(s). MDPI and/or the editor(s) disclaim responsibility for any injury to people or property resulting from any ideas, methods, instructions or products referred to in the content. |
© 2025 by the authors. Licensee MDPI, Basel, Switzerland. This article is an open access article distributed under the terms and conditions of the Creative Commons Attribution (CC BY) license (https://creativecommons.org/licenses/by/4.0/).