Article

Intelligent Decoupling of Hydrological Effects in Han River Cascade Dam System: Spatial Heterogeneity Mechanisms via an LSTM-Attention-SHAP Interpretable Framework

1
Department of Water Resources, Bureau of Hydrology, Changjiang Water Resources Commission, Wuhan 430010, China
2
Key Laboratory of Resources Conversion and Pollution Control of the State Ethnic Affairs Commission, College of Resources and Environmental Science, South-Central Minzu University, Wuhan 430074, China
*
Author to whom correspondence should be addressed.
Hydrology 2025, 12(8), 217; https://doi.org/10.3390/hydrology12080217 (registering DOI)
Submission received: 3 July 2025 / Revised: 30 July 2025 / Accepted: 13 August 2025 / Published: 16 August 2025

Abstract

The construction of cascade dam systems profoundly reshapes river hydrological processes, yet the analysis of their spatial heterogeneity effects has long been constrained by the mechanistic deficiencies and interpretability limitations of traditional mechanistic models. Focusing on the middle-lower Han River (a 652 km reach regulated by seven dams) as a representative case, this study develops an LSTM-Attention-SHAP interpretable framework to achieve, for the first time, intelligent decoupling of dam-induced hydrological effects and mechanistic analysis of spatial differentiation. Key findings include the following: (1) The LSTM model demonstrates exceptional predictive performance of water level and flow rate in intensively regulated reaches (average Nash–Sutcliffe Efficiency, NSE = 0.935 at Xiangyang, Huangzhuang, and Xiantao stations; R2 = 0.988 for discharge at Xiantao Station), while the attention mechanism effectively captures sensitive factors such as the abrupt threshold (>560 m3/s) in the Tangbai River tributary; (2) Shapley Additive exPlanations (SHAP) values reveal spatial heterogeneous dam contributions: the Cuijiaying Dam increases discharge at Xiangyang station (mean SHAP +0.22) but suppresses water level at Xiantao station (mean SHAP −0.15), whereas the Wangfuzhou Dam shows a stable negative correlation with Xiangyang water levels (mean SHAP −0.18); (3) dam operations induce cascade effects through altered channel storage capacity. These findings provide spatially adaptive strategies for flood risk zoning and ecological operations in globally intensively regulated rivers such as the Yangtze and Mekong.

1. Introduction

The global river system is undergoing a human-dominated hydrological reorganization, where the synergistic effects of cascade dam construction and climate change are disrupting natural runoff processes, triggering dramatic alterations in sediment-water fluxes and reconfiguring flood risks in estuarine zones [1,2,3]. From the Nile Delta erosion induced by the Aswan High Dam to the sediment flux reduction (>70%) triggered by reservoir clusters in the Mekong Basin, high-intensity human development has fundamentally reshaped riverine material transport pathways [4,5]. Such disturbances are particularly severe in low-gradient meandering channels (e.g., the Hanjiang River’s downstream reach with a 0.09‰ slope), where the “wide-narrow” channel morphology (upstream valley width 800–1200 m vs. downstream levee-constrained width 300–500 m) exacerbates backwater-induced flood hazards [1,6,7]. Traditional hydrologic models struggle to quantify the cascade effects of dam clusters and nonlinear interactions with tributary inflows, hindering flood resilience enhancement and transboundary water resource management [8].
Current research faces dual methodological bottlenecks: Process-based mechanistic models (e.g., HEC-RAS) struggle to couple high-dimensional drivers, while statistical models lack the capacity to capture long-term complex dependencies [9]. Deep learning offers a transformative pathway—Long Short-Term Memory (LSTM) networks, with their gated architecture (forget/input/output gates), have achieved NSE > 0.92 in Jingle watershed flood forecasting [10]. However, existing studies predominantly focus on predictive optimization, lacking sufficient physical interpretation of dam contributions, especially the dynamic decoupling of “natural-social” system feedback mechanisms through explainable AI (XAI) techniques, which impedes the translation of model outcomes into sustainable governance strategies [11].
This study selects the middle-lower Hanjiang River as a representative case, with its global significance manifested through three distinctive characteristics: (1) a 652 km reach regulated by seven cascade dams (from Danjiangkou to Xinglong), exemplifying high-intensity human water resource development [12]; (2) a 50-year hydrologic record (1974–2023) documenting the synergistic effects of the South–North Water Diversion Project and dam construction (e.g., a 72.5% sediment reduction at Huangzhuang Station); (3) tributary confluences like the Tangbai River creating complex boundary conditions, where discharge surges (>560 m3/s) trigger nonlinear hydrologic responses [13]. While traditional LSTM networks can capture long-term dependencies, they treat all time step information equally. In contrast, the attention mechanism dynamically assigns weights to highlight critical timesteps (e.g., flood peaks or reservoir operation nodes), thereby establishing a synergistic framework of “LSTM for temporal feature extraction + attention for key node selection” [14]. By developing an LSTM-Attention-SHAP coupled framework, this work pioneers spatial heterogeneity analysis of dam regulation contributions.
The study aims to address three critical scientific challenges: (1) quantifying threshold effects of cascade dams on water level redistribution in mainstem–tributary systems; (2) decoupling dam operations in sensitive reaches (180–265 km); (3) establishing a nonlinear transfer model linking development intensity and hydrologic response. The outcomes will provide universal tools for flood risk zoning and ecological operations in intensively regulated rivers like the Yangtze, Mekong, and Rhine.

2. Materials and Methodology

2.1. Study Area

The middle-lower reaches of the Han River stretch approximately 652 km from the Danjiangkou Reservoir to its confluence with the Yangtze River at Hankou in Wuhan, the study area as illustrated in Figure 1. The river flows from the mountainous northwestern Hubei region to the alluvial plains of Jianghan. This section features a meandering channel, with the downstream riverbed having an average gradient of only 0.09‰, characteristic of a lowland sinuous river [6]. The basin’s topography is predominantly plains and hills, with a wider valley and numerous sandbars and gravel shoals in the middle reaches. Upon entering the Jianghan Plain downstream, the channel narrows, constrained by embankments on both sides, forming a “wide upstream, narrow downstream” river pattern. This configuration often leads to levee breaches during flood seasons due to inadequate flood discharge capacity. Hydrologically, the region exhibits typical subtropical monsoon climate influences, with an average annual precipitation of 873 mm. However, precipitation is unevenly distributed, with 75% of the annual runoff occurring between May and October. Interannual variability is significant—for instance, the Huangzhuang Station records a maximum annual runoff of 113.5 billion m3 and a minimum of only 25 billion m3 [15,16].
The construction of cascade hydropower projects has profoundly reshaped the hydrological regime of the middle-lower Han River. Hubei Province has planned a seven-tier navigation dam system, comprising (from upstream to downstream) Danjiangkou, Wangfuzhou, Xinji, Cuijiaying, Yakou, Nianpanshan, and Xinglong, forming a systematic development framework. As the core regulatory project, the Danjiangkou Reservoir significantly mitigates flood risks in the middle and lower reaches through water storage and peak flow reduction. By the 1970s, it had reduced sediment load at Huangzhuang Station by 72.5% compared to pre-dam conditions [17]. Coordinated cascade operation has improved navigation standards, with the section downstream of Nianpanshan to the river mouth now meeting Class III waterway standards (accommodating 1000 t vessels). Plans aim to achieve continuous 1000 t navigation from Xiangyang to the estuary. However, reservoir operations have also intensified seasonal flow fluctuations downstream, with notable phenomena such as reduced water levels during dry seasons and regulated storage during flood periods. This necessitates integrated management of flood control, navigation, and ecological demands [18].

2.2. Multi-Period Data Collection

This study utilizes a 50-year (1974–2023) long-term series of measured hydrological data from key hydrological stations along the mainstem of the middle-lower reaches of the Han River (Huangjiagang, Xiangyang, Huangzhuang, and Xiantao). All data were authoritatively provided by the Hydrology Bureau of the Changjiang Water Resources Commission of China. The dataset includes daily discharge and water level observations, inflow from the Tangbai River, as well as critical information such as the construction locations and operational timelines of water control projects within the region. The multi-period, long-term hydrological records provide a robust foundation for analyzing the evolution of hydrological regimes in the middle and lower Han River, particularly in quantifying the impacts of water project operations and the implementation of the South-to-North Water Diversion Project’s central route on natural runoff processes. Additionally, the synchronous collection of tributary inflow data enhances the completeness of basin-scale water cycle simulations and water resource allocation.
The spatiotemporal details of hydrological stations and water control projects are presented in Table 1. Among them, Huangjiagang, Xiangyang, Huangzhuang, and Xiantao serve as control stations along the mainstem, covering the key river section from downstream of the Danjiangkou Reservoir to the estuary. Their water level-flow sequences comprehensively document the basin’s water resource development and utilization over the past five decades. The inclusion of project operational timelines facilitates the precise division of hydrological sequences into different construction phases, thereby enabling analysis of the staged interference characteristics of cascade hydropower development on the hydrological rhythm of the mainstem.

2.3. LSTM

LSTM is a specially designed Recurrent Neural Network (RNN) architecture for extracting trends from large-scale time-series data. Its core innovation lies in the gating mechanism that enables dynamic control of information flow. At each time step, it calculates a forget gate ( f t ) to determine the proportion of old memory cell information to discard. Subsequently, it computes an input gate ( i t ) and a candidate memory cell ( C ~ t ) to determine the proportion of new information used to update the memory cell. The memory cell is then updated by combining the outcomes of the forget gate and input gate, forming a new memory state ( c t ). Finally, an output gate ( o t ) controls the generation of the hidden state, and a new hidden state ( h t ) is computed based on the memory cell and output gate, which is then passed to the next time step [19]. The mathematical formulas are as follows:
f t = σ W f h t 1 ,   x t + b f
i t = σ ( W i [ h t 1 ,   x t ] + b i )
C ~ t = t a n h ( W c h t 1 , x t + b c )
c t = f t c t 1 + i t C ~ t
o t = σ ( W o [ h t 1 ,   x t ] + b o )
h t = o t t a n h ( c t )
Here, σ represents the sigmoid function, h t 1 is the hidden state from the previous time step, and x t is the input data at the current time step. W f denotes the weight matrix for the forget gate, and b f is the bias term for the forget gate. W i and W c are the weight matrices for the input gate, respectively, controlling the input information and the generation of the candidate state, while b i and b c are the bias terms for the input gate. W o represents the weight matrix for the output gate, and b o is the bias term for the output gate.

2.4. Attention Mechanism

The Attention Mechanism is a technique in deep learning that simulates human visual or cognitive attention by dynamically allocating varying weights to focus on critical parts of input data, thereby enhancing the model’s ability to process essential information. This mechanism can directly capture dependencies between any positions in sequences and exhibits remarkable performance when handling complex sequences. Its core concepts include Query (Q), Key (K), and Value (V), where Q represents the current processing target, K serves as an identifier for input elements, and V contains the actual information of these elements [20]. The calculation formula is as follows:
A t t e n t i o n Q , K , V = s o f t m a x Q K T d k V
Here, d k is the dimension of the key K, and s o f t m a x denotes the Softmax normalization process. The Softmax normalization formula is given as follows:
σ ( Z ) i = e Z i j = 1 n e Z j
Among them, Z is the input vector Z = [z_1,z_2,z_3,···,z_n], σ ( Z ) i denotes the output (probability value) of the Softmax function for the i-th element, and j = 1 n e Z j represents the normalization factor.

2.5. Data Processing

Due to the discrepancies in both dimensions and orders of magnitude between discharge and water level, these differences can significantly impact the accuracy of model fitting [21]. To mitigate these effects, min–max normalization is employed to generate dimensionless data as numerical features. The min–max normalization formula is as follows:
X n o r m = X X m i n X m a x X m i n
In the context, X represents the raw data, X m i n denotes the minimum value of the data, X m a x is the maximum value of the data, and X n o r m is the normalized result; the presence or absence of the Hydro Project within a time series is encoded using 0 and 1, with the presence encoded as 1 and the absence encoded as 0, serving as a binary categorical feature.
To enable the LSTM model to capture temporal dependencies effectively, it is necessary to combine the aforementioned numerical features and binary categorical features into a structure suitable for supervised learning. Defining n as the number of timesteps shifted backward and m as the number of timesteps shifted forward in the time series data, the combined features are shifted backward by n steps to create lag features and shifted forward by m steps to generate forecast features, thus using past n timesteps to predict future m − 1 steps. In this study, we employ m = 40, meaning that the past 40 timesteps are used to predict the current timestep. Given the substantial volume of data, the dataset is partitioned chronologically as follows: training set (1974–2020), validation set (2021–2022), and test set (2022–2023). The model is trained on the training set, optimized for hyperparameters using the validation set, and evaluated for accuracy as well as SHAP value computation on the test set.

2.6. Model Architecture and Model Hyperparameter Settings

The model in our study adopts a custom “LSTM-Multihead Attention-Regression Head” architecture and was trained for 100 epochs. Before model training, model hyperparameters need to be tuned to determine the model’s structure and functionality [22]. We employed a grid search method to select the hyperparameters, including the number of memory units in the LSTM layer, learning rate, batch size, and dropout, based on accuracy [23,24]. During training, dropout regularization is applied to prevent overfitting, while iterative parameter adjustments minimize the loss function on the training set. Hyperparameter tuning ranges are given in Table 2; the hyperparameter combination achieving the highest accuracy was ultimately used for model training.

2.7. Interpretable Methods for Deep Learning Models

SHAP (Shapley Additive exPlanations) is a model interpretation method developed based on the theoretical framework of Shapley values from cooperative game theory. This approach quantifies the contribution of each covariate to the model’s predictions [25]. The calculation formula for Shapley values is as follows:
Φ i = S N { i } S ! n S 1 ! n ! [ f S i f ( S ) ]
Here, Φ i represents the SHAP value for feature i, N is the set of all features, n is the total number of features, S is a feature subset excluding i, f ( S ) denotes the model prediction value using only subset S , f S i is the prediction value after adding feature i to subset S , and S ! n S 1 ! n ! serves as the weighting term for the weighted average across all possible combinations of subset S . In this research, the SHAP values of features such as discharge, water level, and hub at upstream and downstream stations are calculated for analysis.

3. Results

3.1. Prediction Performance of the LSTM Model

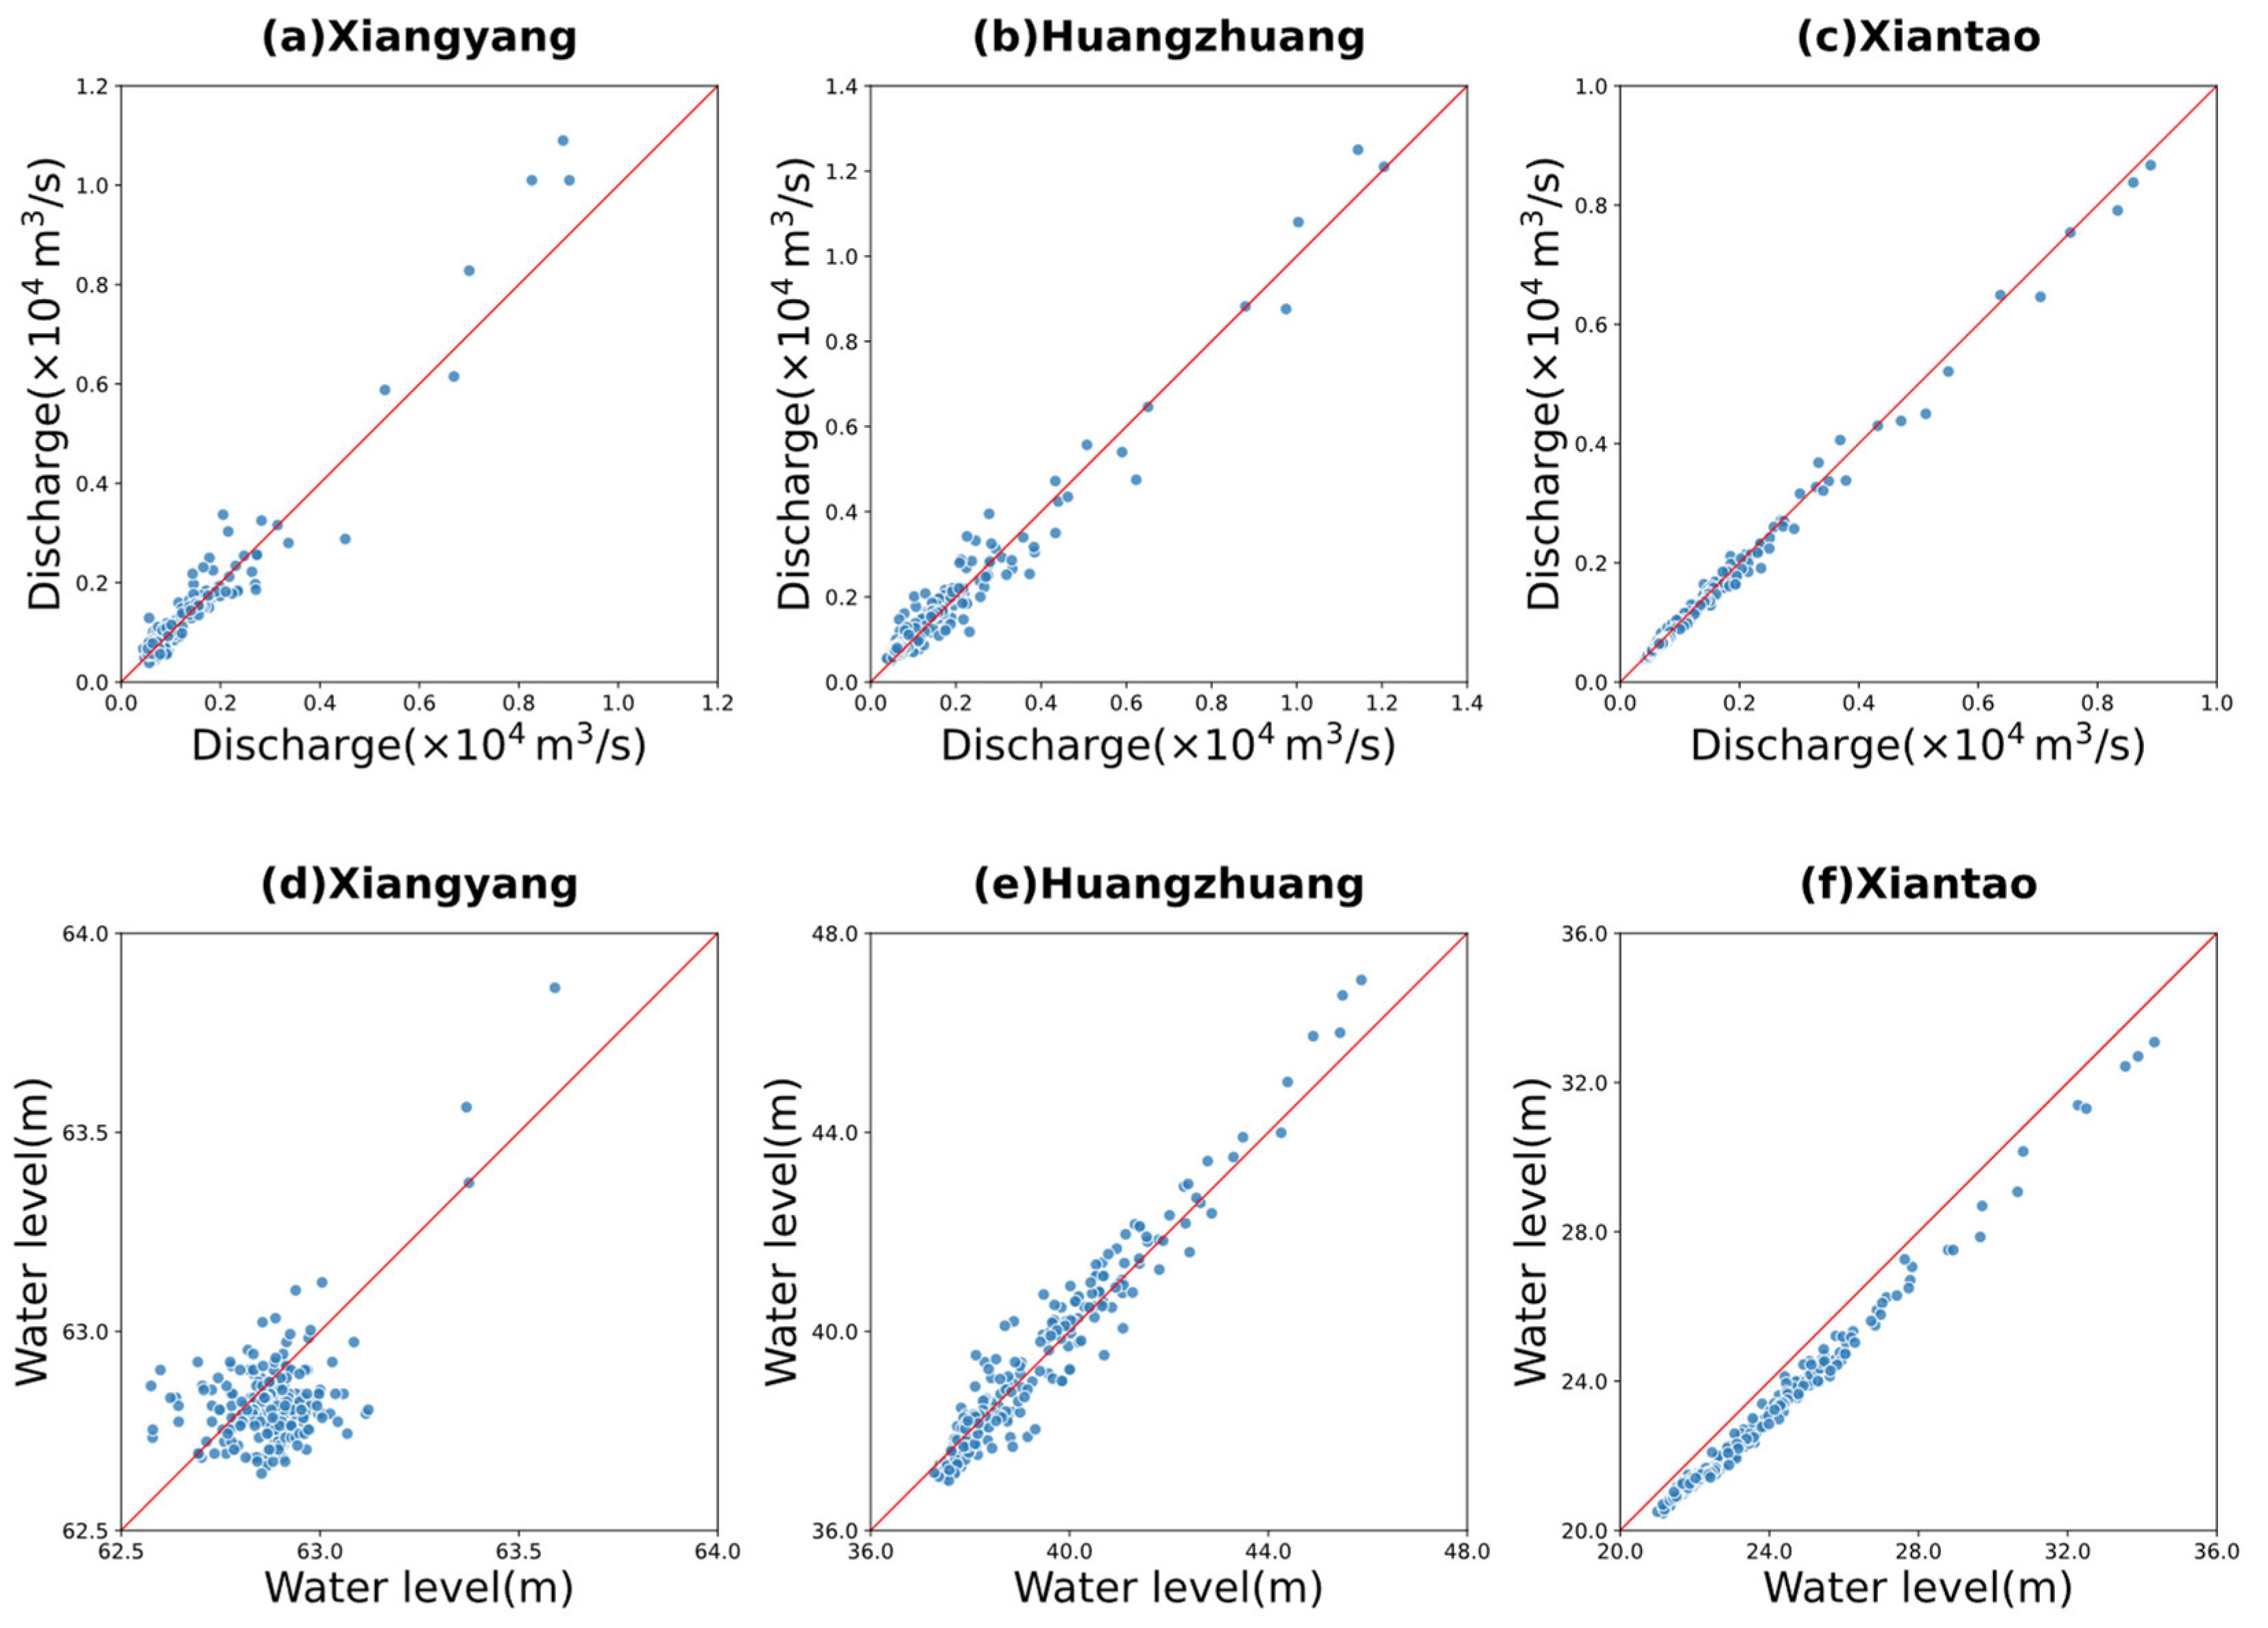
The comparison plots of observed versus LSTM-predicted flow and water level are shown in Figure 2, where the horizontal axis represents observed values and the vertical axis denotes predicted values. The discharge and water level predictions from all three stations are distributed near the 45° line, indicating minor errors between observed and predicted values with no systematic bias in the model. The model demonstrates favorable prediction accuracy. At low-flow conditions, scatter points do not diverge significantly across the three stations, reflecting the model’s strong sensitivity to small-scale fluctuations. Furthermore, all three stations’ predictions adhere to the 45° distribution pattern, validating the model’s robust capability in handling spatial heterogeneity.
The evaluation metrics presented in Table 3 show that both Root Mean Square Error (RMSE) and Mean Absolute Error (MAE) values for the three stations remain within 1% of the magnitude range, while R2 and NSE indicators approach 1.0, with residual errors primarily attributable to uncontrollable environmental noise. These results confirm that the model exhibits no significant fitting bias.
In conclusion, through validation via 45° line distribution patterns and multi-metric evaluation, the LSTM model demonstrates overall satisfactory performance, which is attributed to its gating mechanisms and time-series modeling proficiency. However, Figure 2f reveals a systematic underestimation in water level predictions, which may be attributed to either insufficient representation of extreme flood events in the training dataset or the absence of key topographic parameters in the input features.

3.2. Contribution of Discharge Capacity

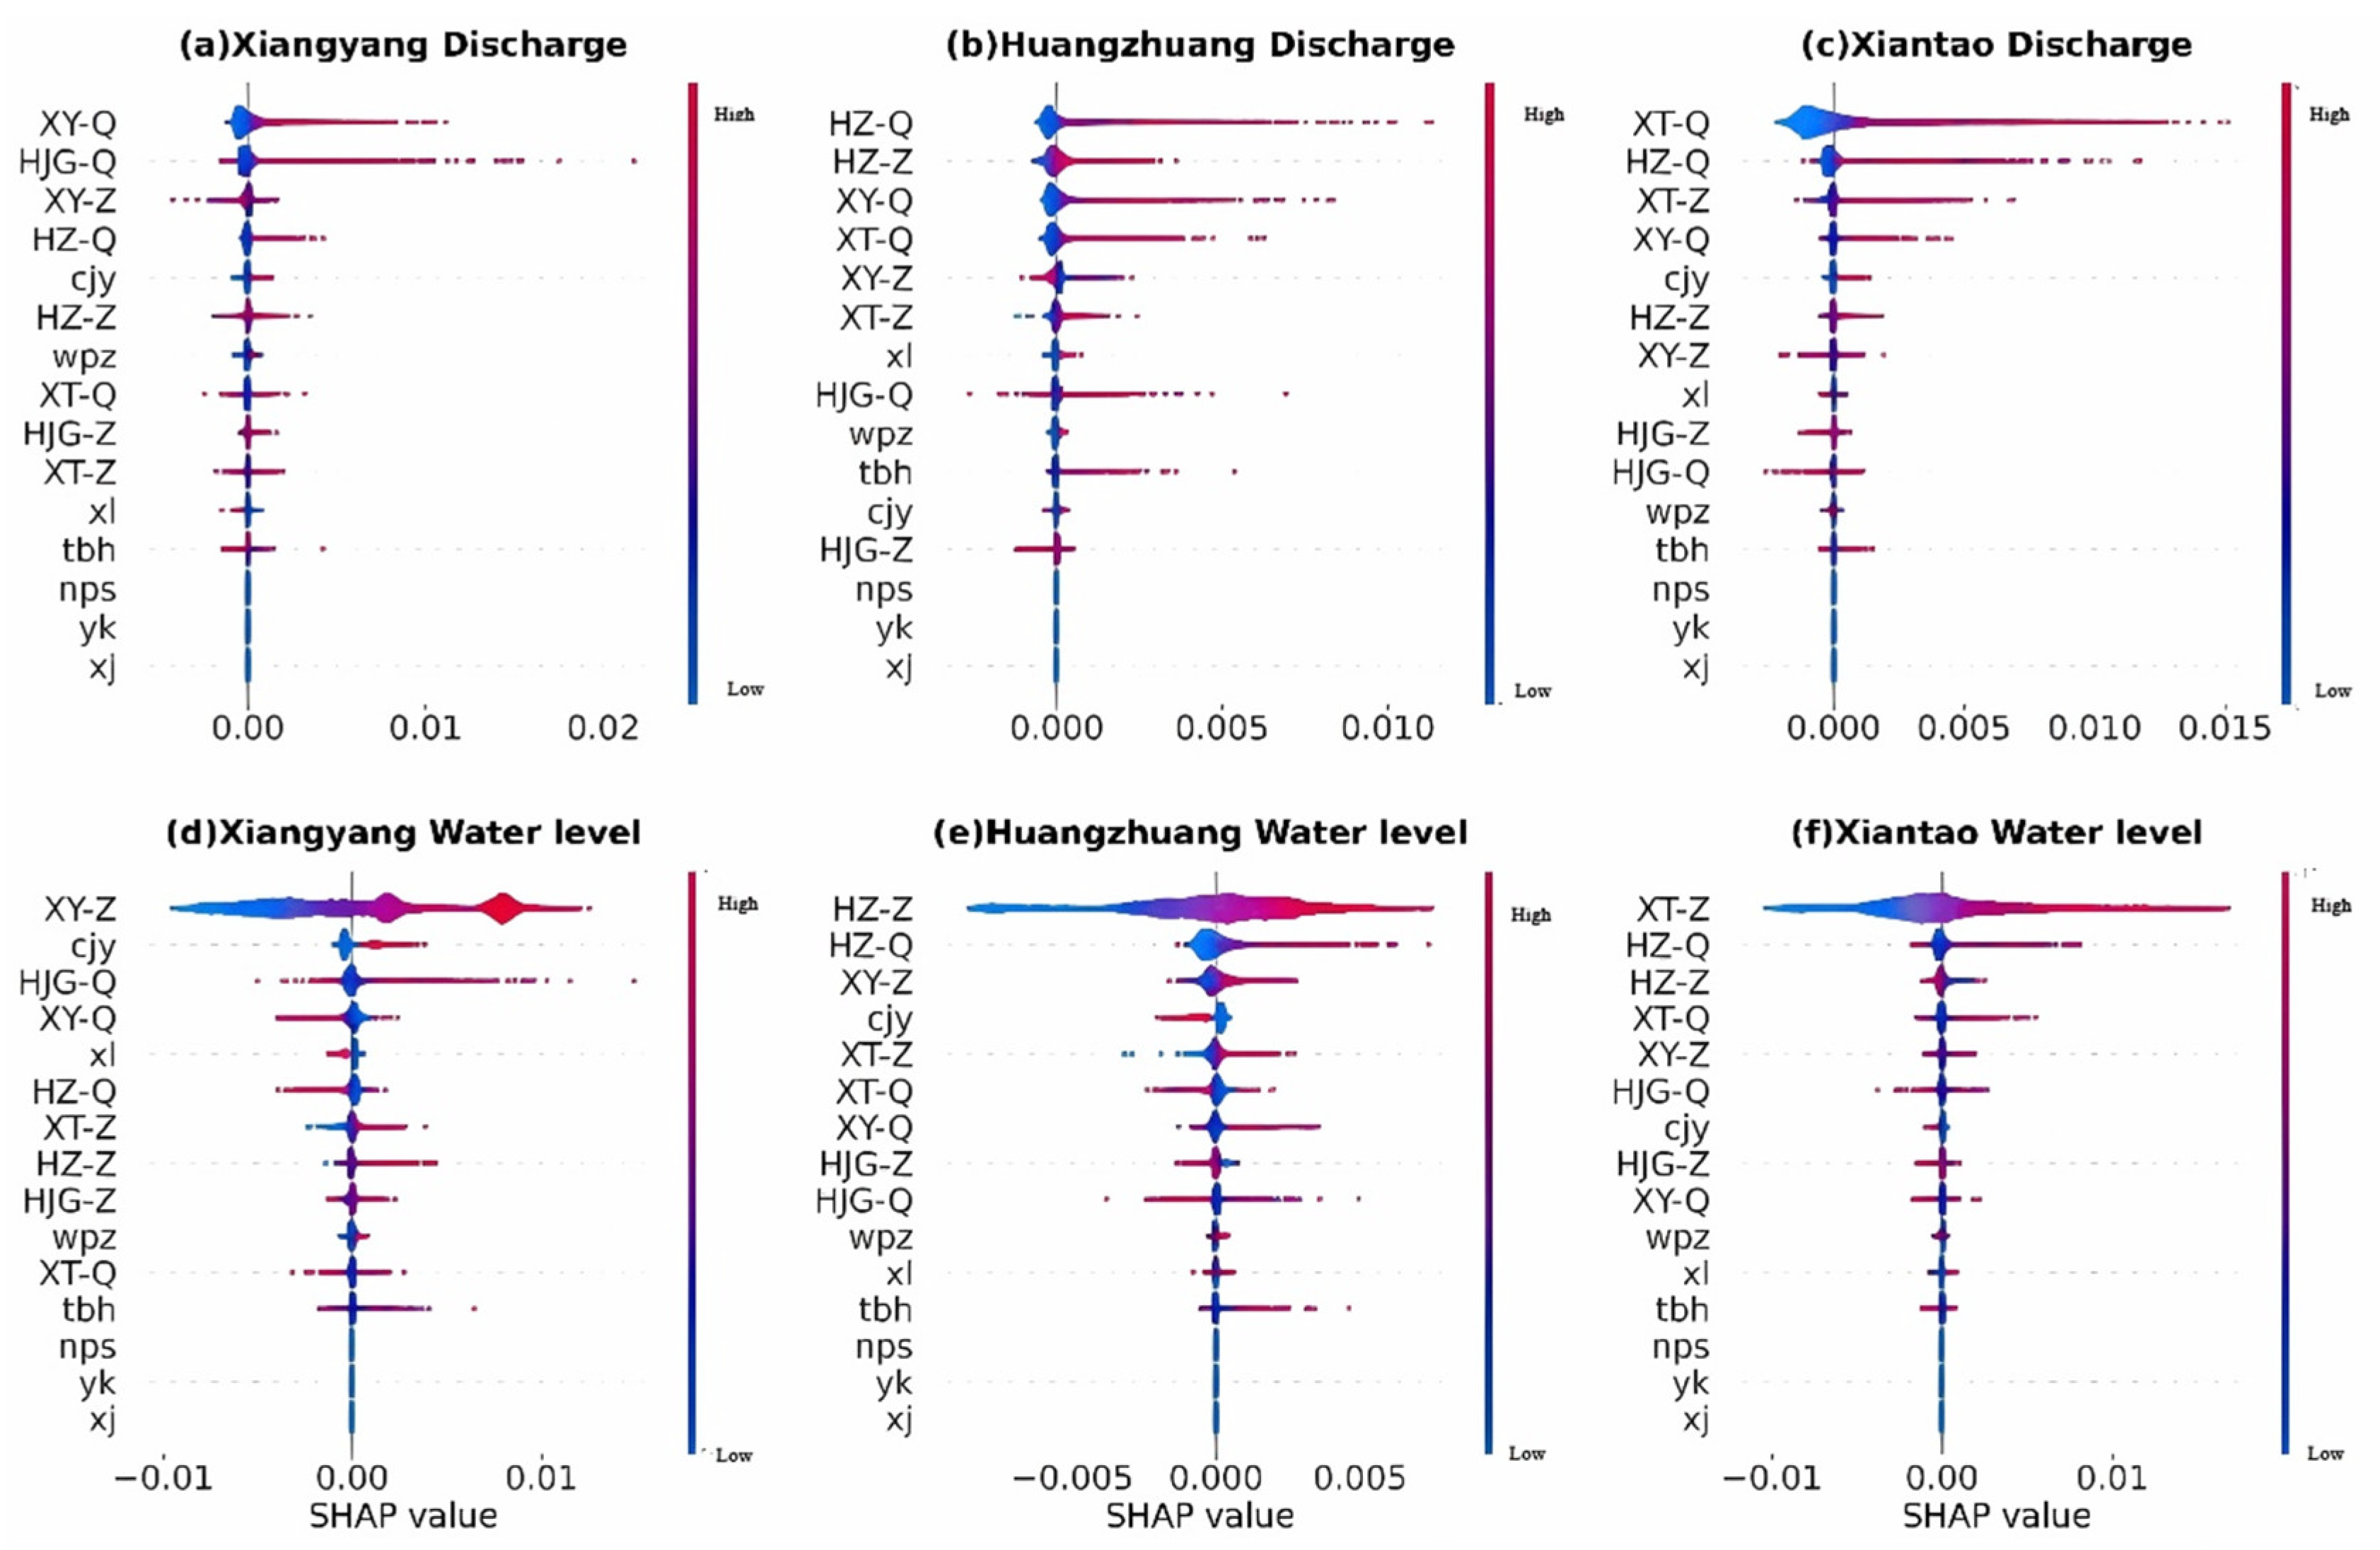
To further investigate the impact of features on prediction outcomes, this study employs the SHAP value (Shapley Additive exPlanation) for interpretation. For a more intuitive understanding of overall patterns, the SHAP values for each feature of every sample were computed, and SHAP summary plots were created. In the SHAP summary plot, the vertical axis ranks features by their importance, with the top features exerting greater influence on model predictions. The horizontal axis indicates the positive or negative direction of the SHAP values, where positive values push predictions toward the positive class and negative values push predictions toward the negative class. Red dots represent high feature values, while blue dots represent low feature values. Since the training data used in this study ends on 31 December 2022, and the construction periods of the Danjiangkou Hydro Project, Yakou Hydro Project, and Xinji Hydro Project at that time were all less than one year, these three hydro projects exhibit minor influence in the feature importance analysis.
Figure 3a shows the SHAP summary plot for flow prediction at the Xiangyang Station. Among the features influencing the flow at Xiangyang Station, the upstream Huangjiagang Station discharge and the historical discharge at Xiangyang Station itself have a greater impact on the model. Both features are predominantly distributed on the right side of the horizontal axis, with dense clusters of red dots indicating that high values of these features increase the predicted discharge. Overall, these features show a positive correlation with the discharge prediction at Xiangyang Station. In contrast, the historical water level at Xiangyang Station is mainly distributed on the left side of the horizontal axis, with dense clusters of red dots suggesting that elevated historical water levels lead to lower discharge predictions. This indicates a negative correlation between historical water levels and discharge predictions at Xiangyang Station, which may be attributed to regulation effects from the upstream Wangfuzhou Hydro Project. The outflow from the Tangbai River exhibits a negative correlation with the discharge prediction at Xiangyang Station. The influence of the Cuijiaying Hydro Project shows a positive correlation with the discharge prediction at Xiangyang Station, meaning the absence of this hydro project decreases predicted discharge at Xiangyang Station, while its presence increases it. The impact trend of the Wangfuzhou Hydro Project appears less distinct, which may be related to its interaction with the historical water level feature of Xiangyang Station mentioned above. The Xinglong Hydro Project demonstrates a negative correlation with the discharge prediction at Xiangyang Station.
Figure 3b displays the SHAP summary plot for flow prediction at Huangzhuang Station. Among the features influencing Huangzhuang Station’s discharge, the discharge from upstream Xiangyang Station and the station’s own historical discharge and water level exert a greater impact on the model. Their data points are primarily clustered on the right side of the horizontal axis, with high-density red dots indicating that high values of these features increase the predicted discharge. Overall, these features—the discharge from upstream Xiangyang Station and the station’s historical discharge and water level—demonstrate a positive correlation with the predicted discharge at Huangzhuang Station. In contrast, data points for the water level feature from Xiangyang Station are mainly clustered on the left side of the horizontal axis, with high-density red dots indicating that high values of this feature decrease the predicted discharge. This suggests a negative correlation between Xiangyang Station’s water level feature and Huangzhuang Station’s discharge prediction. The outflow feature from the Tangbai River exhibits a positive correlation with Huangzhuang Station’s discharge prediction. The influence of the Xinglong Hydro Project also shows a positive correlation: Its absence lowers the predicted discharge at Huangzhuang Station, while its presence raises the predicted discharge. The influence of the Wangfuzhou Hydro Project manifests as a weak positive correlation. No significant trend was observed for the influence of the Cuijiaying Hydro Project.
Figure 3c presents the SHAP summary plot for discharge prediction at Xiantao Station. Among the features influencing Xiantao Station’s discharge, the discharge from upstream Huangzhuang Station and the station’s own historical discharge and water level have a greater impact on the model. Their data points are predominantly located on the right side of the horizontal axis, with high-density red dots signifying that high values of these features increase the predicted discharge. Collectively, these features—the discharge from upstream Huangzhuang Station and the station’s historical discharge and water level—show a positive correlation with the predicted discharge at Xiantao Station. The outflow feature from the Tangbai River also demonstrates a positive correlation with Xiantao Station’s discharge prediction. The influence of the Cuijiaying Hydro Project exhibits a positive correlation with Xiantao Station’s discharge prediction: Its absence lowers the predicted discharge at Xiantao Station, whereas its presence raises it. The Xinglong Hydro Project shows a weak negative correlation in its influence. No clear trend was observed for the influence of the Wangfuzhou Hydro Project.
Figure 3d illustrates the SHAP summary plot for water level prediction at Xiangyang Station. Among the features influencing Xiangyang Station’s water level, the flow from upstream Huangjiagang Station and the station’s historical water level have a more significant impact on the model. Their data points are concentrated on the right side of the horizontal axis, with high-density red dots indicating that high values of these features increase the predicted water level. Overall, these features—the flow from upstream Huangjiagang Station and the station’s historical water level—display a positive correlation with the predicted water level at Xiangyang Station. Conversely, data points for the station’s historical flow feature are primarily located on the left side of the horizontal axis, with high-density red dots suggesting that high values of this feature decrease the predicted water level. This indicates a negative correlation between the station’s historical discharge feature and Xiangyang Station’s water level prediction, potentially due to regulation by the upstream Wangfuzhou Hydro Project. The outflow feature from the Tangbai River shows a positive correlation with Xiangyang Station’s water level prediction. The influence of the Cuijiaying Hydro Project also exhibits a positive correlation: Its absence lowers the predicted water level at Xiangyang Station, while its presence raises it. The Xinglong Hydro Project displays a negative correlation in its influence. The Wangfuzhou Hydro Project shows a weak positive correlation in its influence.
Figure 3e is the SHAP summary plot for the water level prediction at Huangzhuang Station. Among the features influencing Huangzhuang Station’s water level, the historical discharge and water levels from upstream Xiangyang Station and the station itself exert greater influence on the model, predominantly distributed to the right of the horizontal axis. The dense clustering of red dots indicates that higher values of these features elevate the predicted outcome. Overall, historical water levels from upstream Xiangyang Station and the station itself demonstrate a positive correlation with the predicted discharge at Huangzhuang Station. The Tangbai River outflow characteristics exhibit a positive correlation with Huangzhuang Station’s predicted water level. The impact of the Cuijiaying Hydro Project manifests as a negative correlation with Huangzhuang Station’s predicted water level, meaning its absence elevates the water level while its presence lowers it. Wangfuzhou Hydro Project shows a weak positive correlation, while the influence trend of Xinglong Hydro Project is unclear.
Figure 3f is the SHAP summary plot for the water level prediction at Xiantao Station. Among the features influencing Xiantao Station’s water level, the historical discharge and water levels from upstream Huangzhuang Station and the station itself exert greater influence on the model, predominantly distributed to the right of the horizontal axis. The dense clustering of red dots indicates that higher values of these features elevate the predicted outcome. Overall, historical water levels from upstream Huangzhuang Station and the station itself demonstrate a positive correlation with the predicted discharge at Xiantao Station. The Tangbai River outflow characteristics exhibit a negative correlation with Xiantao Station’s predicted water level. The impact of the Cuijiaying Hydro Project manifests as a negative correlation with Xiantao Station’s predicted water level, meaning its absence elevates the water level while its presence lowers it. Wangfuzhou Hydro Project shows an unclear influence trend, while Xinglong Hydro Project exhibits a weak positive correlation.

3.3. Spatial Heterogeneity Analysis

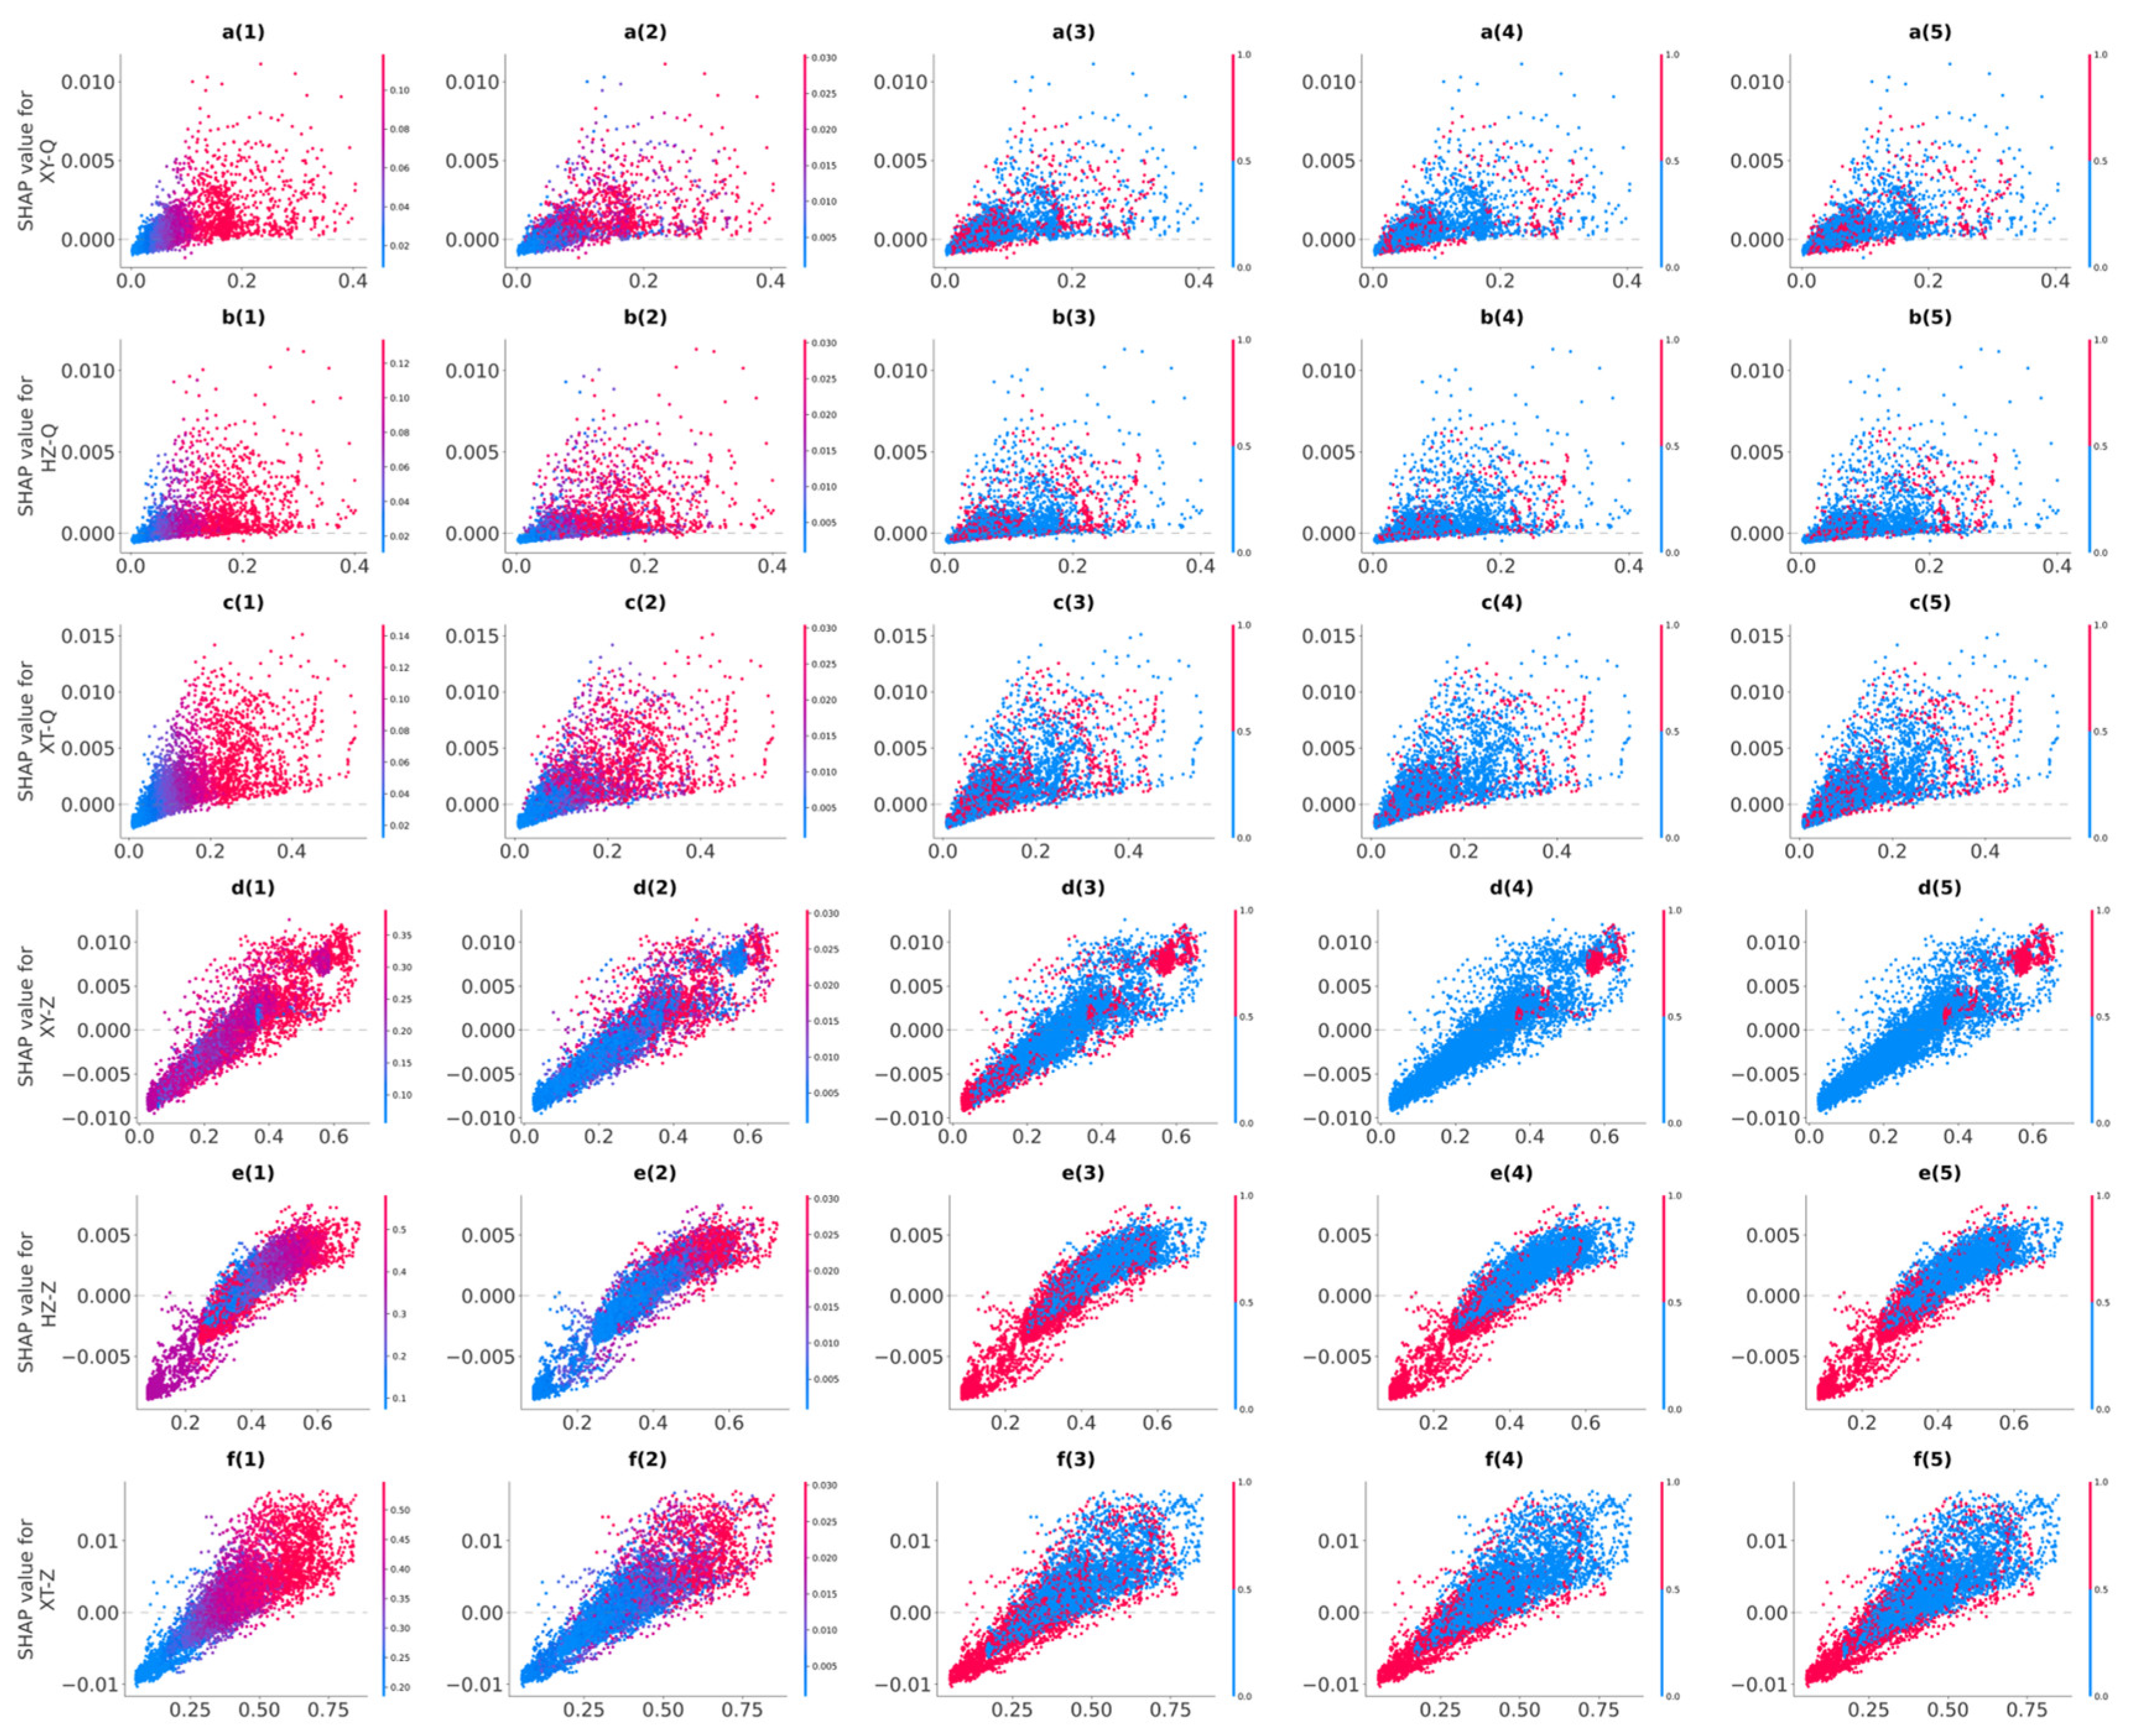
The SHAP dependence plot illustrates the marginal effect of features on model predictions, demonstrating how feature values alter the model’s output [26]. It globally reveals the impact of individual features across the entire dataset while also facilitating the analysis of interactions between different features. In this study, SHAP partial dependence plots were generated for each station’s most influential feature and its corresponding feature from upstream stations, along with the Tangbai River outflow and the three Hydro Projects (Cuijiaying, Wangfuzhou, and Xinglong), to analyze their interactions. The color of points in the plots represents the value of the interacting feature. The horizontal axis represents the feature values corresponding to the plotted characteristic.
Figure 4(a1) shows the SHAP partial dependence plot for the interaction between discharge at Xiangyang Station and Huangjiagang Station. When both stations exhibit low discharge, the SHAP interaction value is negative, indicating a negative contribution. When Xiangyang Station’s flow increases while Huangjiagang’s discharge remains low, the SHAP interaction remains negative. However, when Huangjiagang’s discharge rises, the SHAP interaction value becomes positive, suggesting an overall positive linear interaction. Figure 4(a2) displays the SHAP plot for the interaction between Xiangyang Station’s discharge and Tangbai River outflow. The scattered point distribution shows no discernible color pattern, indicating a weak interaction. Figure 4(a3)–(a5) present the SHAP plots for interactions between Xiangyang Station’s discharge and the Wangfuzhou Hydro Project, Cuijiaying Hydro Project, and Xinglong Hydro Project, respectively. The disorganized point distributions and absence of clear color patterns in all three plots similarly suggest weak interactions.
Figure 4(b1) shows the interaction SHAP partial dependence plot for the discharge at Huangzhuang Station and the discharge at Xiangyang Station. When the discharge at Huangzhuang Station is low and the discharge at Xiangyang Station is also low, the SHAP interaction value is negative, indicating a negative contribution. When the discharge at Huangzhuang Station is larger and the discharge at Xiangyang Station is smaller, the SHAP interaction value is negative. When the discharge at Xiangyang Station is larger, the SHAP interaction value becomes positive. Overall, there exists a certain positively correlated linear interaction. Figure 4(b2) shows the interaction SHAP partial dependence plot for the discharge at Huangzhuang Station and the outflow of the Tangbai River. The overall distribution of points is scattered without a clear color pattern, indicating the presence of a weak interaction. Figure 4(b3)–(b5) show the interaction SHAP partial dependence plots for the discharge at Huangzhuang Station and the Wangfuzhou Hydro Project, Cuijiaying Hydro Project, and Xinglong Hydro Project, respectively. The overall distribution of points is scattered without a clear color pattern, indicating the presence of a weak interaction.
Figure 4(c1) shows the interaction SHAP partial dependence plot for the discharge at Xiantao Station and the flow at Xiangyang Station. When the discharge at Xiantao Station is low and the discharge at Huangzhuang Station is also low, the SHAP interaction value is negative, indicating a negative contribution. When the discharge at Xiantao Station is larger and the discharge at Huangzhuang Station is smaller, the SHAP interaction value is negative. When the discharge at Huangzhuang Station is larger, the SHAP interaction value becomes positive. Overall, there exists a certain positively correlated linear interaction. Figure 4(c2) shows the interaction SHAP partial dependence plot for the flow at Xiantao Station and the outflow of the Tangbai River. When the discharge at Xiantao Station is low and the outflow of the Tangbai River is also low, the SHAP interaction value is negative, indicating a negative contribution. When the discharge at Xiantao Station is larger and the outflow of the Tangbai River is smaller, the SHAP interaction value exhibits a small positive contribution. When the outflow of the Tangbai River is larger, the SHAP interaction value becomes a larger positive value. Overall, there exists a certain positively correlated linear interaction. Figure 4(c3)–(c5) show the interaction SHAP partial dependence plots for the discharge at Xiantao Station and the Wangfuzhou Hydro Project, Cuijiaying Hydro Project, and Xinglong Hydro Project, respectively. The overall distribution of points is scattered without a clear color pattern, indicating the presence of a weak interaction.
Figure 4(d1) shows the SHAP interaction partial dependence plot between water levels at Xiangyang Station and Huangjiagang Station. When both stations exhibit low water levels, the SHAP interaction value is negative, indicating a negative contribution. When the water level at Xiangyang Station increases while Huangjiagang Station remains low, the SHAP interaction value is negative. When Huangjiagang Station’s water level rises significantly, the SHAP interaction value becomes positive, demonstrating an overall linearly positive interactive relationship. Figure 4(d2) presents the SHAP interaction partial dependence plot between the Xiangyang Station water level and outflow from the Tangbai River. A sudden color shift occurs when Xiangyang Station’s water level reaches 0.4–0.5, suggesting a nonlinear interaction. Figure 4(d3)–(d5) displays the SHAP interaction partial dependence plot between the Xiangyang Station water level and the Wangfuzhou Hydro Project. At low water levels in Xiangyang Station, the presence of the Wangfuzhou Hydro Project yields a negative SHAP interaction value, indicating a negative contribution. An abrupt color change occurs when Xiangyang Station’s water level rises while the Wangfuzhou Hydro Project is absent. A second color mutation appears when Xiangyang Station’s water level further increases with the Wangfuzhou Hydro Project present, revealing a segmented interaction pattern. Figure 4(d3)–(d5) illustrate SHAP partial dependence plots for interactions between Xiangyang Station water level and Cuijiaying Hydro Project. All plots show abrupt color changes at higher water levels of Xiangyang Station, confirming nonlinear interactions.
Figure 4(e1) shows the SHAP interaction partial dependence plot between water levels at Huangzhuang Station and Xiangyang Station. When Huangzhuang Station is low and Xiangyang Station is high, the SHAP interaction value is negative, signifying a negative contribution. Abrupt color changes occur as Xiangyang Station’s water level increases and further rises, indicating segmented interactions. Figure 4(e2) presents the SHAP interaction partial dependence plot between the Huangzhuang Station water level and outflow from the Tangbai River. When both Huangzhuang Station and Tangbai River outflow are low, the SHAP interaction value is negative, suggesting a negative contribution. When Huangzhuang Station’s water level rises while Xiangyang Station remains high, the SHAP interaction value turns positive, reflecting an overall linearly positive interactive relationship. Figure 4(e3)–(e5) display SHAP partial dependence plots for interactions between Huangzhuang Station water level and Wangfuzhou Hydro Project, Cuijiaying Hydro Project, and Xinglong Hydro Project, respectively. All three plots show negative SHAP interaction values when Huangzhuang Station is low and dams are present, indicating negative contributions. When Huangzhuang Station’s water level rises without hydro projects, the SHAP interaction value becomes positive, suggesting a positive contribution, while the overall relationship demonstrates linearly negative interactive patterns.
Figure 4(f1) shows the interaction SHAP partial dependence plot for the water levels at Xiantao Station and Huangzhuang Station. When the water level at Xiantao Station is relatively low and the water level at Huangzhuang Station is also relatively low, the SHAP interaction value is negative, indicating negative contributions. When the water level at Xiantao Station increases and the water level at Huangzhuang Station is relatively high, the SHAP interaction value is positive, indicating positive contributions. Overall, there exists a certain positive linear interaction effect. Figure 4(f2) shows the interaction SHAP partial dependence plot for the water level at Xiantao Station and the outflow from the Tangbai River. When the water level at Xiantao Station is relatively low and the outflow from the Tangbai River is also relatively low, the SHAP interaction value is negative, indicating negative contributions. When the water level at Xiantao Station increases and the outflow from the Tangbai River is relatively high, the interaction value is positive, indicating positive contributions, suggesting the existence of a certain positive interaction effect. Figure 4(f3)–(f5) show the interaction SHAP partial dependence plots for the water level at Xiantao Station and the Wangfuzhou Hydro Project, Cuijiaying Hydro Project, and Xinglong Hydro Project, respectively. All three exhibit the same pattern: When the water level at Xiantao Station is relatively low and the Hydro Project is in operation, the SHAP interaction value is negative, indicating negative contributions. When the water level at Xiantao Station increases and the Hydro Project is not in operation, the SHAP interaction value is positive, indicating positive contributions and suggesting the existence of a certain negative interaction effect.
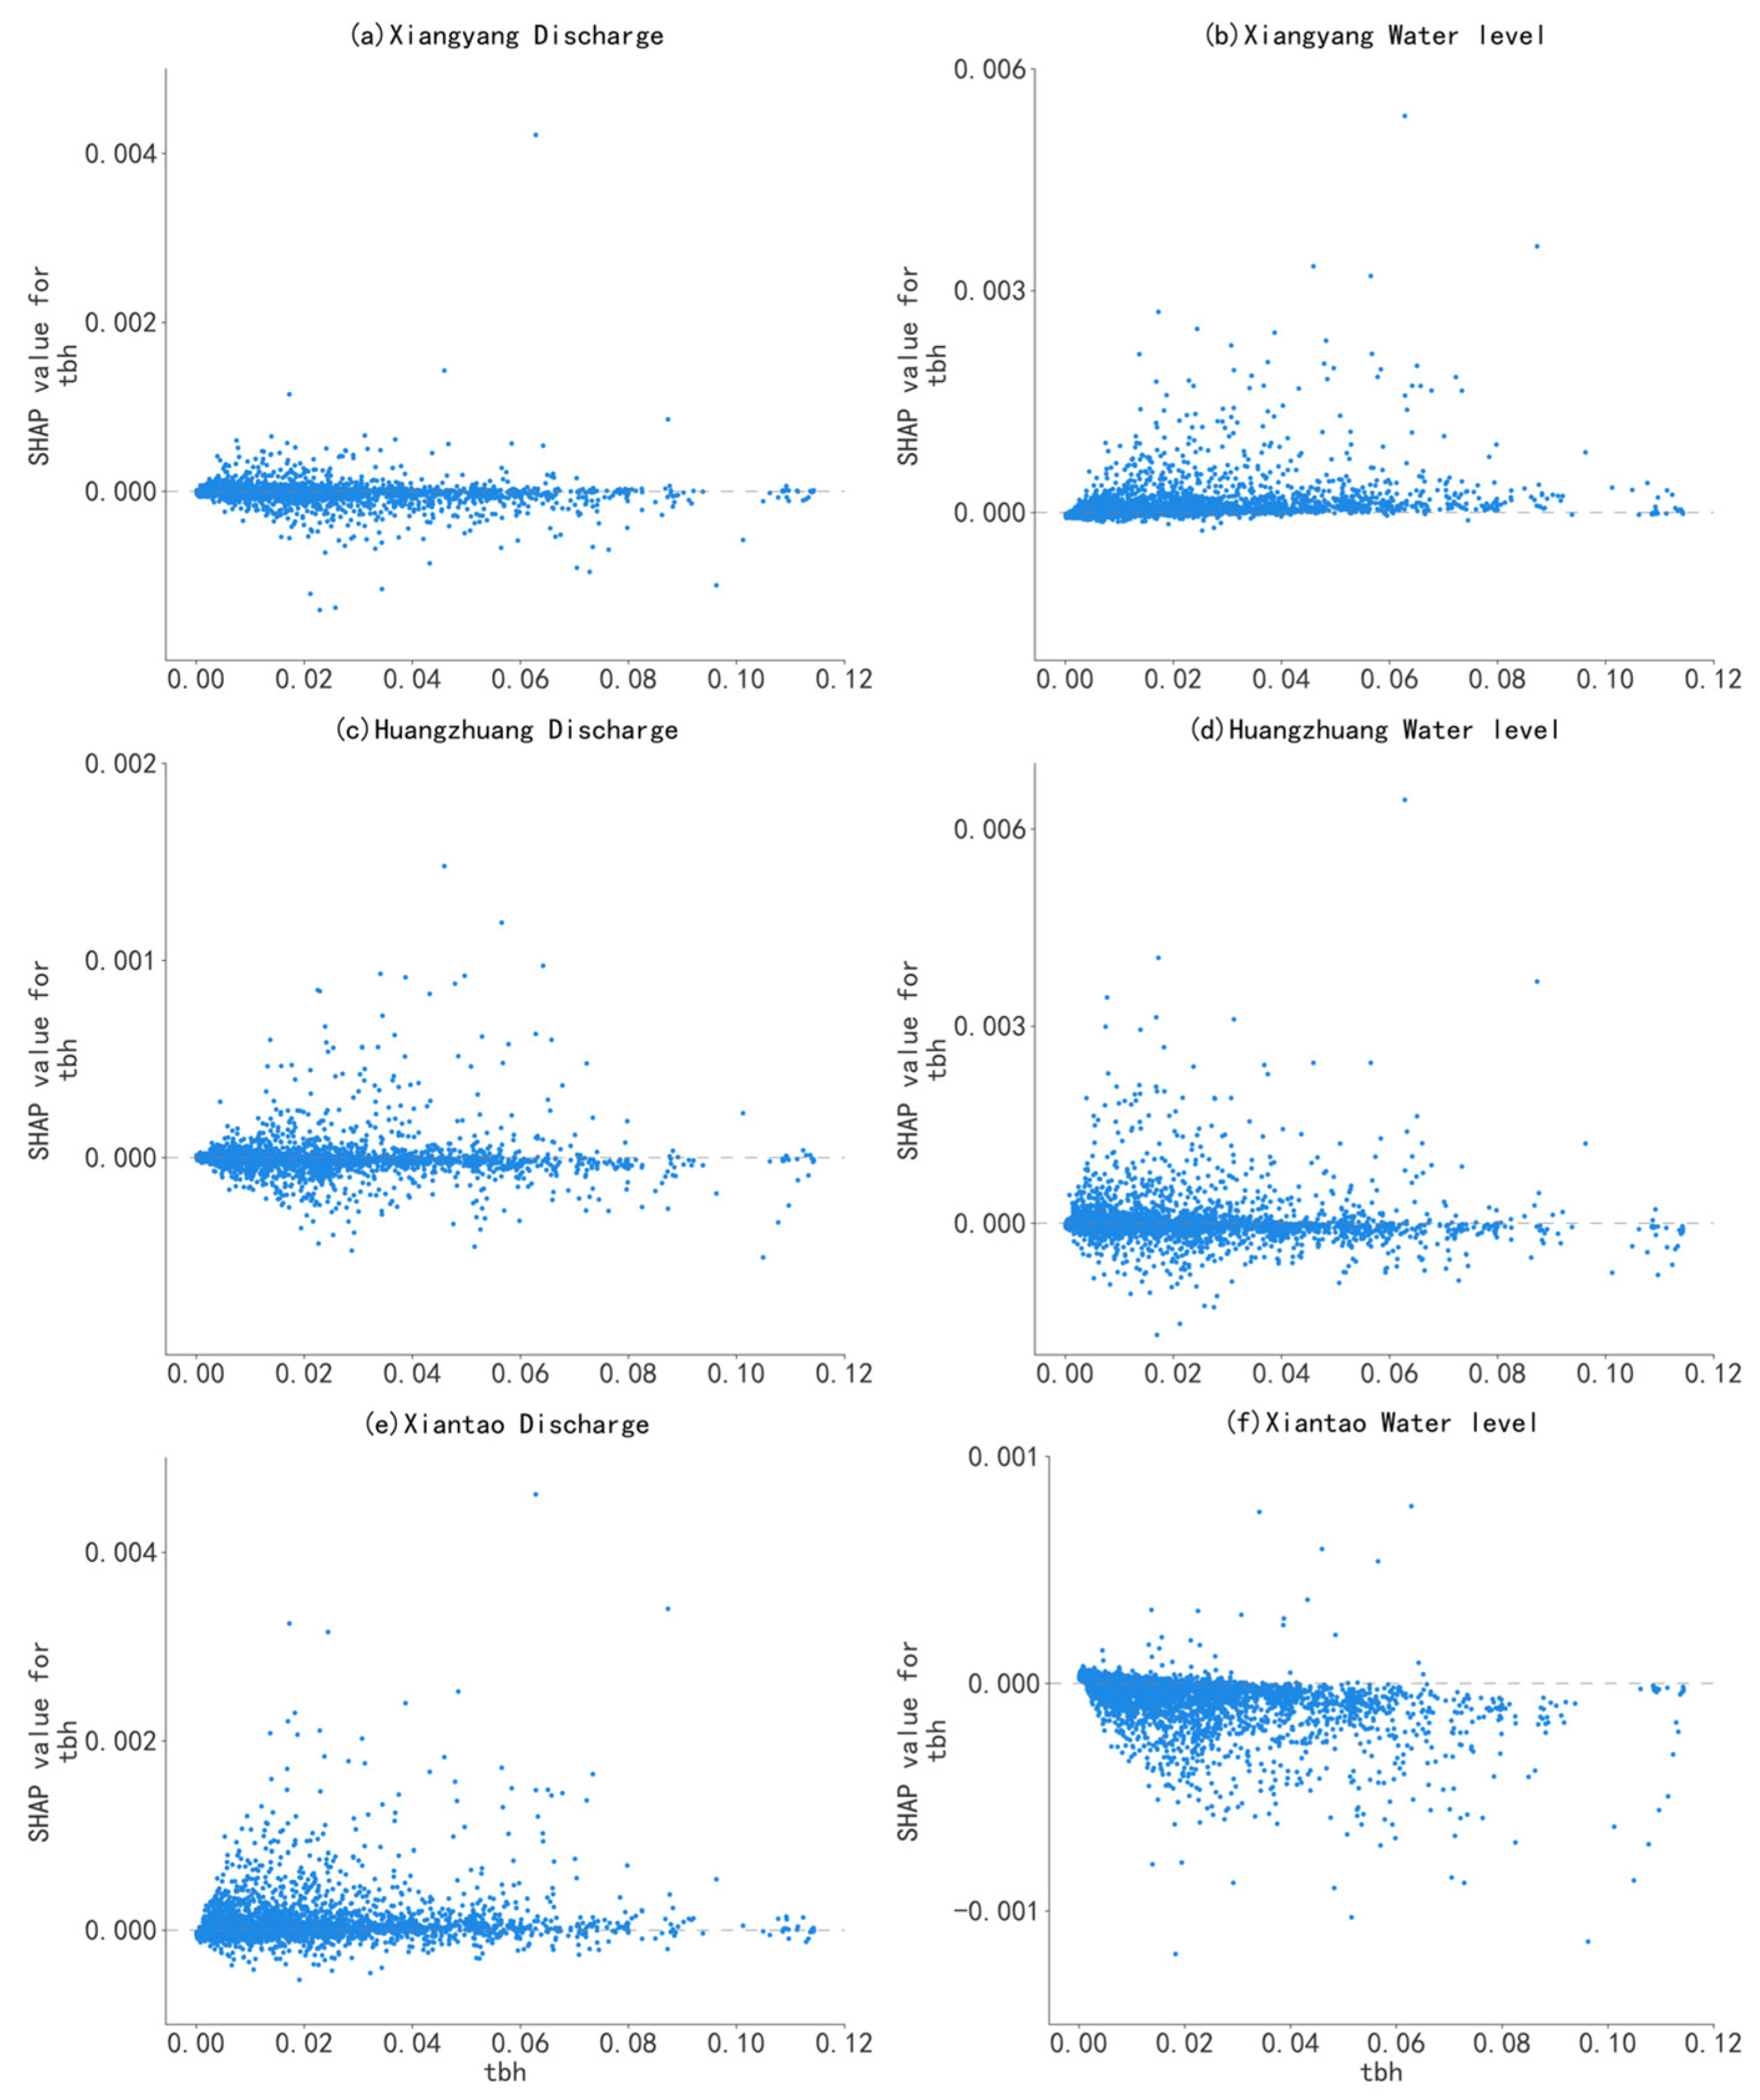
Figure 5 shows the SHAP dependence plots depicting the relationship between the Tangbai River outflow and the flow/water levels at three monitoring stations, all demonstrating nonlinear response patterns. The flow rates at all three stations exhibit a critical threshold when Tangbai River outflow ranges from 0.02 to 0.04 (denormalized to 280–560 m3/s), with SHAP values clustering near zero when outflow is below 280 m3/s but showing a sharp positive surge when exceeding 560 m3/s, consistently accompanied by an inflow ratio (R) greater than 0.25, suggesting this critical response corresponds to the inflow ratio threshold (R > 0.25) at the Han-Tangbai River confluence. Water level responses vary significantly across stations: Xiangyang Station shows a consistent positive correlation, Huangzhuang Station displays a segmented pattern with strong positive SHAP values below 560 m3/s, weakening influence between 560 and 1120 m3/s, and neutral values above 1120 m3/s, while Xiantao Station maintains a negative correlation throughout. These findings collectively indicate that when the Tangbai River tributary outflow exceeds 560 m3/s with an inflow ratio surpassing 0.25, both flow and water level parameters exhibit threshold-type responses, establishing 560 m3/s as the critical discharge threshold where the exceeded inflow ratio (R > 0.25) triggers nonlinear hydrological behavior in the river system.

4. Discussion

The LSTM-SHAP coupled framework developed in this study enables spatial heterogeneity resolution of hydro project hydrological effects in the middle–lower reaches of the Han River, demonstrating prediction accuracy (Xiantao Station discharge R2 = 0.988) that significantly surpasses conventional hydrodynamic models in the Danube River Basin [27]. This advantage stems from three key innovative mechanisms: (1) Gated structures effectively capture nonlinear coupling interactions between dam operations and natural processes; (2) attention mechanisms dynamically enhance focus on sensitive factors (e.g., abrupt Tangbai River discharge changes > 560 m3/s); (3) SHAP values quantitatively disentangle spatial differentiation of hub contributions—while the Cuijiaying Hydro Project enhances discharge at Xianyang Station (mean SHAP +0.022), it suppresses water levels at Xiantao Station (mean SHAP −0.015). This mechanism demonstrates cross-basin convergence across diverse hydroclimatic systems, aligning with the Mekong River’s Jinghong Reservoir dry-season drawdown [28] and Rhine River channelization-induced flood-level amplification [29].
Our findings overturn the traditional paradigm of “linear transmission of dam impacts”. Unlike the Mississippi River study [30] that primarily focus on prediction accuracy, SHAP partial dependence plots reveal two types of nonlinear responses in the Han River: (1) threshold effects; (2) spatial adaptation patterns—dam operations primarily drive peak discharge attenuation in wandering reaches (Huangzhuang Station, SHAP +0.018), while enhanced backwater effects dominate in confined meandering reaches (Xiantao Station, SHAP −0.015) under levee constraints. This complements the amplification theory observed in Amazonian tributaries [31], jointly proving that the tributary inflow ratio (R > 0.25) is a sensitive indicator of cascading disturbances.
Current results critically corrected two prevalent management misconceptions: firstly, refuting the “homogeneous transmission of hub effects” hypothesis (e.g., Cuijiaying Hydro Project’s opposing impacts on upstream/downstream stations remain undetected by conventional models); secondly, highlighting cascading risks of new dams (Nianpanshan, Yakou)—analogous to the Sekong–Sesan–Srepok Basin in the Mekong River, cumulative effects may trigger an average annual downstream channel storage loss three years post-operation [32]. This exposes limitations of conventional physically based models: their inadequate resolution of physical mechanisms during extreme scenarios (e.g., centennial floods).
Future research necessitates breakthroughs in three directions: (1) integrating hydrodynamic modules (e.g., HEC-RAS) to develop physics-constrained LSTM models, strengthening predictive assessment capabilities for unbuilt dams; (2) embedding SHAP-identified thresholds (e.g., Tangbai River 560 m3/s) into cascade joint operation rule bases to balance navigation (1000-t waterway assurance) and ecological demands; (3) establishing a five-year recalibration mechanism to track cumulative dam impacts. This paradigm can be extended to other intensively regulated rivers like the Yangtze and Mekong, providing intelligent decision-making tools for water-use efficiency and disaster resilience enhancement objectives.

5. Conclusions

This study successfully elucidated the spatial heterogeneity mechanisms of the hydrological effects within the cascade hydraulic dams in the Hanjiang River by employing an integrated LSTM-Attention-SHAP framework. Empirical evidence demonstrates that the LSTM model exhibits superior predictive capability in river reaches under strong anthropogenic interference (average NSE = 0.935 at Xiangyang, Huangzhuang, and Xiantao stations), wherein the discharge prediction R2 at Xiantao Station reached 0.988, outperforming traditional models in the Danube River basin. SHAP values quantitatively reveal the spatial differentiation pattern in dam contributions—the Cuijiaying Hydro Project enhances discharge at Xiangyang Station (mean SHAP +0.022) but suppresses water levels at Xiantao Station (mean SHAP −0.015), while the Wangfuzhou Hydro Project maintains a stable negative correlation with Xiangyang water levels (mean SHAP −0.018) through its peak shaving and valley filling operations. The Tangbai River tributary exhibits a nonlinear amplification effect on mainstream discharge (SHAP values surge when discharge > 560 m3/s), coupled with abrupt water surface gradient changes in the 180–265 km reach (reaching 2.3 times the upstream value), collectively marking the confluence zone as a hydrologically sensitive area.
The findings establish a multi-scale mutual feedback mechanism between natural and anthropogenic factors: Dam operations induce cascading effects by altering channel storage (e.g., Cuijiaying caused “channel storage loss” downstream). These insights subvert the traditional cognition of “linear transmission of dam impacts”, providing spatially adapted strategies for flood risk zoning and control in large basins like the Yangtze and Mekong (prioritizing peak-shaving capacity regulation in braided reaches) and trans-basin water transfer optimization (e.g., safeguarding the 1000 t-class navigation channel in the South-to-North Water Diversion Project’s Middle Route).
Current limitations include insufficient characterization of the cascade effects from newly constructed dams (e.g., Nianpanshan, Yakou) and the analysis of physical mechanisms under extreme scenarios. Future efforts require coupling hydrodynamic modules to develop physically constrained LSTMs, embedding SHAP-identified thresholds (Tangbai River’s 560 m3/s) into joint operation rule bases, and establishing a five-year recalibration mechanism to track the cumulative impacts of dams. This intelligent paradigm can be extended to heavily modified rivers globally, supporting the achievement of sustainable water resource management goals.

Author Contributions

Conceptualization, S.O. and C.X.; methodology, M.Z. and J.Z.; software, W.X.; validation, M.Z., G.Z. and Z.P.; investigation, C.X.; data curation, G.Z.; writing—original draft preparation, M.Z. and Z.P.; writing—review and editing, S.O. and J.Z.; supervision, C.X.; funding acquisition, S.O. and C.X. All authors have read and agreed to the published version of the manuscript.

Funding

The work was financially supported by Hubei Provincial Key Research and Development Program (2023BCB115), the Hubei Provincial Natural Science Foundation of China (Grant Number: 2024AFB849), the National Natural Science Foundation of China (U21A2039), the Fundamental Research Funds for the Central Universities of South-Central Minzu University (Grant Numbers: CZZ24020, CZH25018), the Fund for Academic Innovation Teams of South-Central Minzu University (Grant Number: XTZ24019).

Data Availability Statement

The data presented in this study are available on request from the corresponding author.

Conflicts of Interest

The authors declare no conflicts of interest.

Abbreviations

The abbreviations in the figures of this section are defined as follows:
HJG-QDischarge at Huangjiagang Station
HJG-ZWater level at Huangjiagang Station
XY-QDischarge at Xiangyang Station
XY-ZWater level at Xiangyang Station
HZ-QDischarge at Huangzhuang Station
HZ-ZWater level at Huangzhuang Station
XT-QDischarge at Xiantao Station
XT-ZWater level at Xiantao Station
cjyCuijiaying Hydro Project
wpzWangfuzhou Hydro Project
xlXinglong Hydro Project
npsNianpanshan Hydro Project

References

  1. Yang, X.; Hu, Y.; Sun, Z.; Li, Y.; Xiong, H.; Li, D. Human interventions alter morphodynamics of meandering channels: Insights from decadal to pre-industrial observations in the Yangtze River. J. Hydrol. 2024, 634, 131067. [Google Scholar] [CrossRef]
  2. Chang, C.-H.; Lee, H.; Do, S.; Du, T.; Markert, K.; Hossain, F.; Ahmad, S.; Piman, T.; Meechaiya, C.; Bui, D.; et al. Operational forecasting inundation extents using REOF analysis (FIER) over lower Mekong and its potential economic impact on agriculture. Environ. Model. Softw. 2023, 162, 105643. [Google Scholar] [CrossRef]
  3. Li, J.; Wu, G.; Zhang, Y.; Shi, W. Optimizing flood predictions by integrating LSTM and physical-based models with mixed historical and simulated data. Heliyon 2024, 10, e33669. [Google Scholar] [CrossRef]
  4. Stanley, D.J. Nile delta: Extreme case of sediment entrapment on a delta plain and consequent coastal land loss. Mar. Geol. 1996, 129, 189–195. [Google Scholar] [CrossRef]
  5. Ali, E.M.; El-Magd, I.A. Impact of human interventions and coastal processes along the Nile Delta coast, Egypt during the past twenty-five years. Egypt. J. Aquat. Res. 2016, 42, 1–10. [Google Scholar] [CrossRef]
  6. Kemper, J.T.; Rathburn, S.L.; Mueller, E.R.; Wohl, E.; Scamardo, J. Geomorphic response of low-gradient, meandering and braided alluvial river channels to increased sediment supply. Earth-Sci. Rev. 2023, 241, 104429. [Google Scholar] [CrossRef]
  7. Roccati, A.; Faccini, F.; Luino, F.; De Graff, J.V.; Turconi, L. Morphological changes and human impact in the Entella River floodplain (Northern Italy) from the 17th century. Catena 2019, 182, 104122. [Google Scholar] [CrossRef]
  8. Mahapatra, S.; Kumar Jha, M. Environmental flow estimation for regulated rivers under data-scarce condition. J. Hydrol. 2022, 614, 128569. [Google Scholar] [CrossRef]
  9. Zeiger, S.J.; Hubbart, J.A. Measuring and modeling event-based environmental flows: An assessment of HEC-RAS 2D rain-on-grid simulations. J. Environ. Manag. 2021, 285, 112125. [Google Scholar] [CrossRef] [PubMed]
  10. Li, W.; Liu, C.; Xu, Y.; Niu, C.; Li, R.; Li, M.; Hu, C.; Tian, L. An interpretable hybrid deep learning model for flood forecasting based on Transformer and LSTM. J. Hydrol. Reg. Stud. 2024, 54, 101873. [Google Scholar] [CrossRef]
  11. Zhang, Y.; Gu, Z.; Thé, J.V.G.; Yang, S.X.; Gharabaghi, B. The Discharge Forecasting of Multiple Monitoring Station for Humber River by Hybrid LSTM Models. Water 2022, 14, 1794. [Google Scholar] [CrossRef]
  12. Zhang, X.; Yang, H.; Zhang, W.; Fenicia, F.; Peng, H.; Xu, G. Hydrologic impacts of cascading reservoirs in the middle and lower Hanjiang River basin under climate variability and land use change. J. Hydrol. Reg. Stud. 2022, 44, 101253. [Google Scholar] [CrossRef]
  13. Deng, P.; Xu, C.; Bing, J.; Wang, L.; Li, L. Refined analysis of flood-regional composition under changing environment in the middle reach of Hanjiang River. J. Hydro-Environ. Res. 2024, 53, 15–27. [Google Scholar] [CrossRef]
  14. Liu, H.; Lei, D.; Yuan, J.; Yuan, G.; Cui, C.; Wang, Y.; Xue, W. Ionospheric TEC Prediction in China Based on the Multiple-Attention LSTM Model. Atmosphere 2022, 13, 1939. [Google Scholar] [CrossRef]
  15. Chen, H.; Guo, S.; Xu, C.-y.; Singh, V.P. Historical temporal trends of hydro-climatic variables and runoff response to climate variability and their relevance in water resource management in the Hanjiang basin. J. Hydrol. 2007, 344, 171–184. [Google Scholar] [CrossRef]
  16. Hao, W.; Hao, Z.; Yuan, F.; Ju, Q.; Hao, J. Regional Frequency Analysis of Precipitation Extremes and Its Spatio-Temporal Patterns in the Hanjiang River Basin, China. Atmosphere 2019, 10, 130. [Google Scholar] [CrossRef]
  17. Wang, Y.; Wang, D.; Wu, J. Assessing the impact of Danjiangkou reservoir on ecohydrological conditions in Hanjiang river, China. Ecol. Eng. 2015, 81, 41–52. [Google Scholar] [CrossRef]
  18. Sun, J.; Chen, W.; Hu, B.; Xu, Y.J.; Zhang, G.; Wu, Y.; Hu, B.; Song, Z. Roles of reservoirs in regulating basin flood and droughts risks under climate change: Historical assessment and future projection. J. Hydrol. Reg. Stud. 2023, 48, 101453. [Google Scholar] [CrossRef]
  19. Waqas, M.; Humphries, U.W. A critical review of RNN and LSTM variants in hydrological time series predictions. MethodsX 2024, 13, 102946. [Google Scholar] [CrossRef] [PubMed]
  20. Hong, S.; Choi, Y.; Jeon, J.-J. Interpretable water level forecaster with spatiotemporal causal attention mechanisms. Int. J. Forecast. 2025, 41, 1037–1054. [Google Scholar] [CrossRef]
  21. Kim, Y.-S.; Kim, M.K.; Fu, N.; Liu, J.; Wang, J.; Srebric, J. Investigating the impact of data normalization methods on predicting electricity consumption in a building using different artificial neural network models. Sustain. Cities Soc. 2025, 118, 105570. [Google Scholar] [CrossRef]
  22. Tian, Y.; Xu, Y.-P.; Yang, Z.; Wang, G.; Zhu, Q. Integration of a Parsimonious Hydrological Model with Recurrent Neural Networks for Improved Streamflow Forecasting. Water 2018, 10, 1655. [Google Scholar] [CrossRef]
  23. Kanji, S.; Das, S. Exploring the morpho-tectonic nature, hydrological and physical characteristics of a watershed and prioritizing sub-watersheds surface runoff potentialities by integrating MCDM and ensemble machine learning models. J. Environ. Manag. 2025, 386, 125772. [Google Scholar] [CrossRef]
  24. Haces-Garcia, F.; Ross, N.; Glennie, C.L.; Rifai, H.S.; Hoskere, V.; Ekhtari, N. Rapid 2D hydrodynamic flood modeling using deep learning surrogates. J. Hydrol. 2025, 651, 132561. [Google Scholar] [CrossRef]
  25. Kruk, M. SHAP-NET, a network based on Shapley values as a new tool to improve the explainability of the XGBoost-SHAP model for the problem of water quality. Environ. Model. Softw. 2025, 188, 106403. [Google Scholar] [CrossRef]
  26. Wang, S.; Peng, H. Multiple spatio-temporal scale runoff forecasting and driving mechanism exploration by K-means optimized XGBoost and SHAP. J. Hydrol. 2024, 630, 130650. [Google Scholar] [CrossRef]
  27. Shen, Y.; Xu, Z.; Zhou, Q.; Zhu, Z.; Jiang, C. A direct two-way coupling of the hydrologic and 1D-2D hydrodynamic models for watershed flood simulation. J. Hydrol. 2024, 639, 131606. [Google Scholar] [CrossRef]
  28. Kondolf, G.M.; Rubin, Z.K.; Minear, J.T. Dams on the Mekong: Cumulative sediment starvation. Water Resour. Res. 2014, 50, 5158–5169. [Google Scholar] [CrossRef]
  29. Arnaud, F.; Schmitt, L.; Johnstone, K.; Rollet, A.-J.; Piégay, H. Engineering impacts on the Upper Rhine channel and floodplain over two centuries. Geomorphology 2019, 330, 13–27. [Google Scholar] [CrossRef]
  30. Wang, Z.; Si, Y.; Chu, H. Daily Streamflow Prediction and Uncertainty Using a Long Short-Term Memory (LSTM) Network Coupled with Bootstrap. Water Resour. Manag. 2022, 36, 4575–4590. [Google Scholar] [CrossRef]
  31. Latrubesse, E.; Arima, E.; Dunne, T.; Park, E.; Baker, V.; d’Horta, F.; Wight, C.; Wittmann, F.; Zuanon, J.; Baker, P.; et al. Damming the rivers of the Amazon basin. Nature 2017, 546, 363–369. [Google Scholar] [CrossRef] [PubMed]
  32. Hecht, J.S.; Lacombe, G.; Arias, M.E.; Dang, T.D.; Piman, T. Hydropower dams of the Mekong River basin: A review of their hydrological impacts. J. Hydrol. 2019, 568, 285–300. [Google Scholar] [CrossRef]
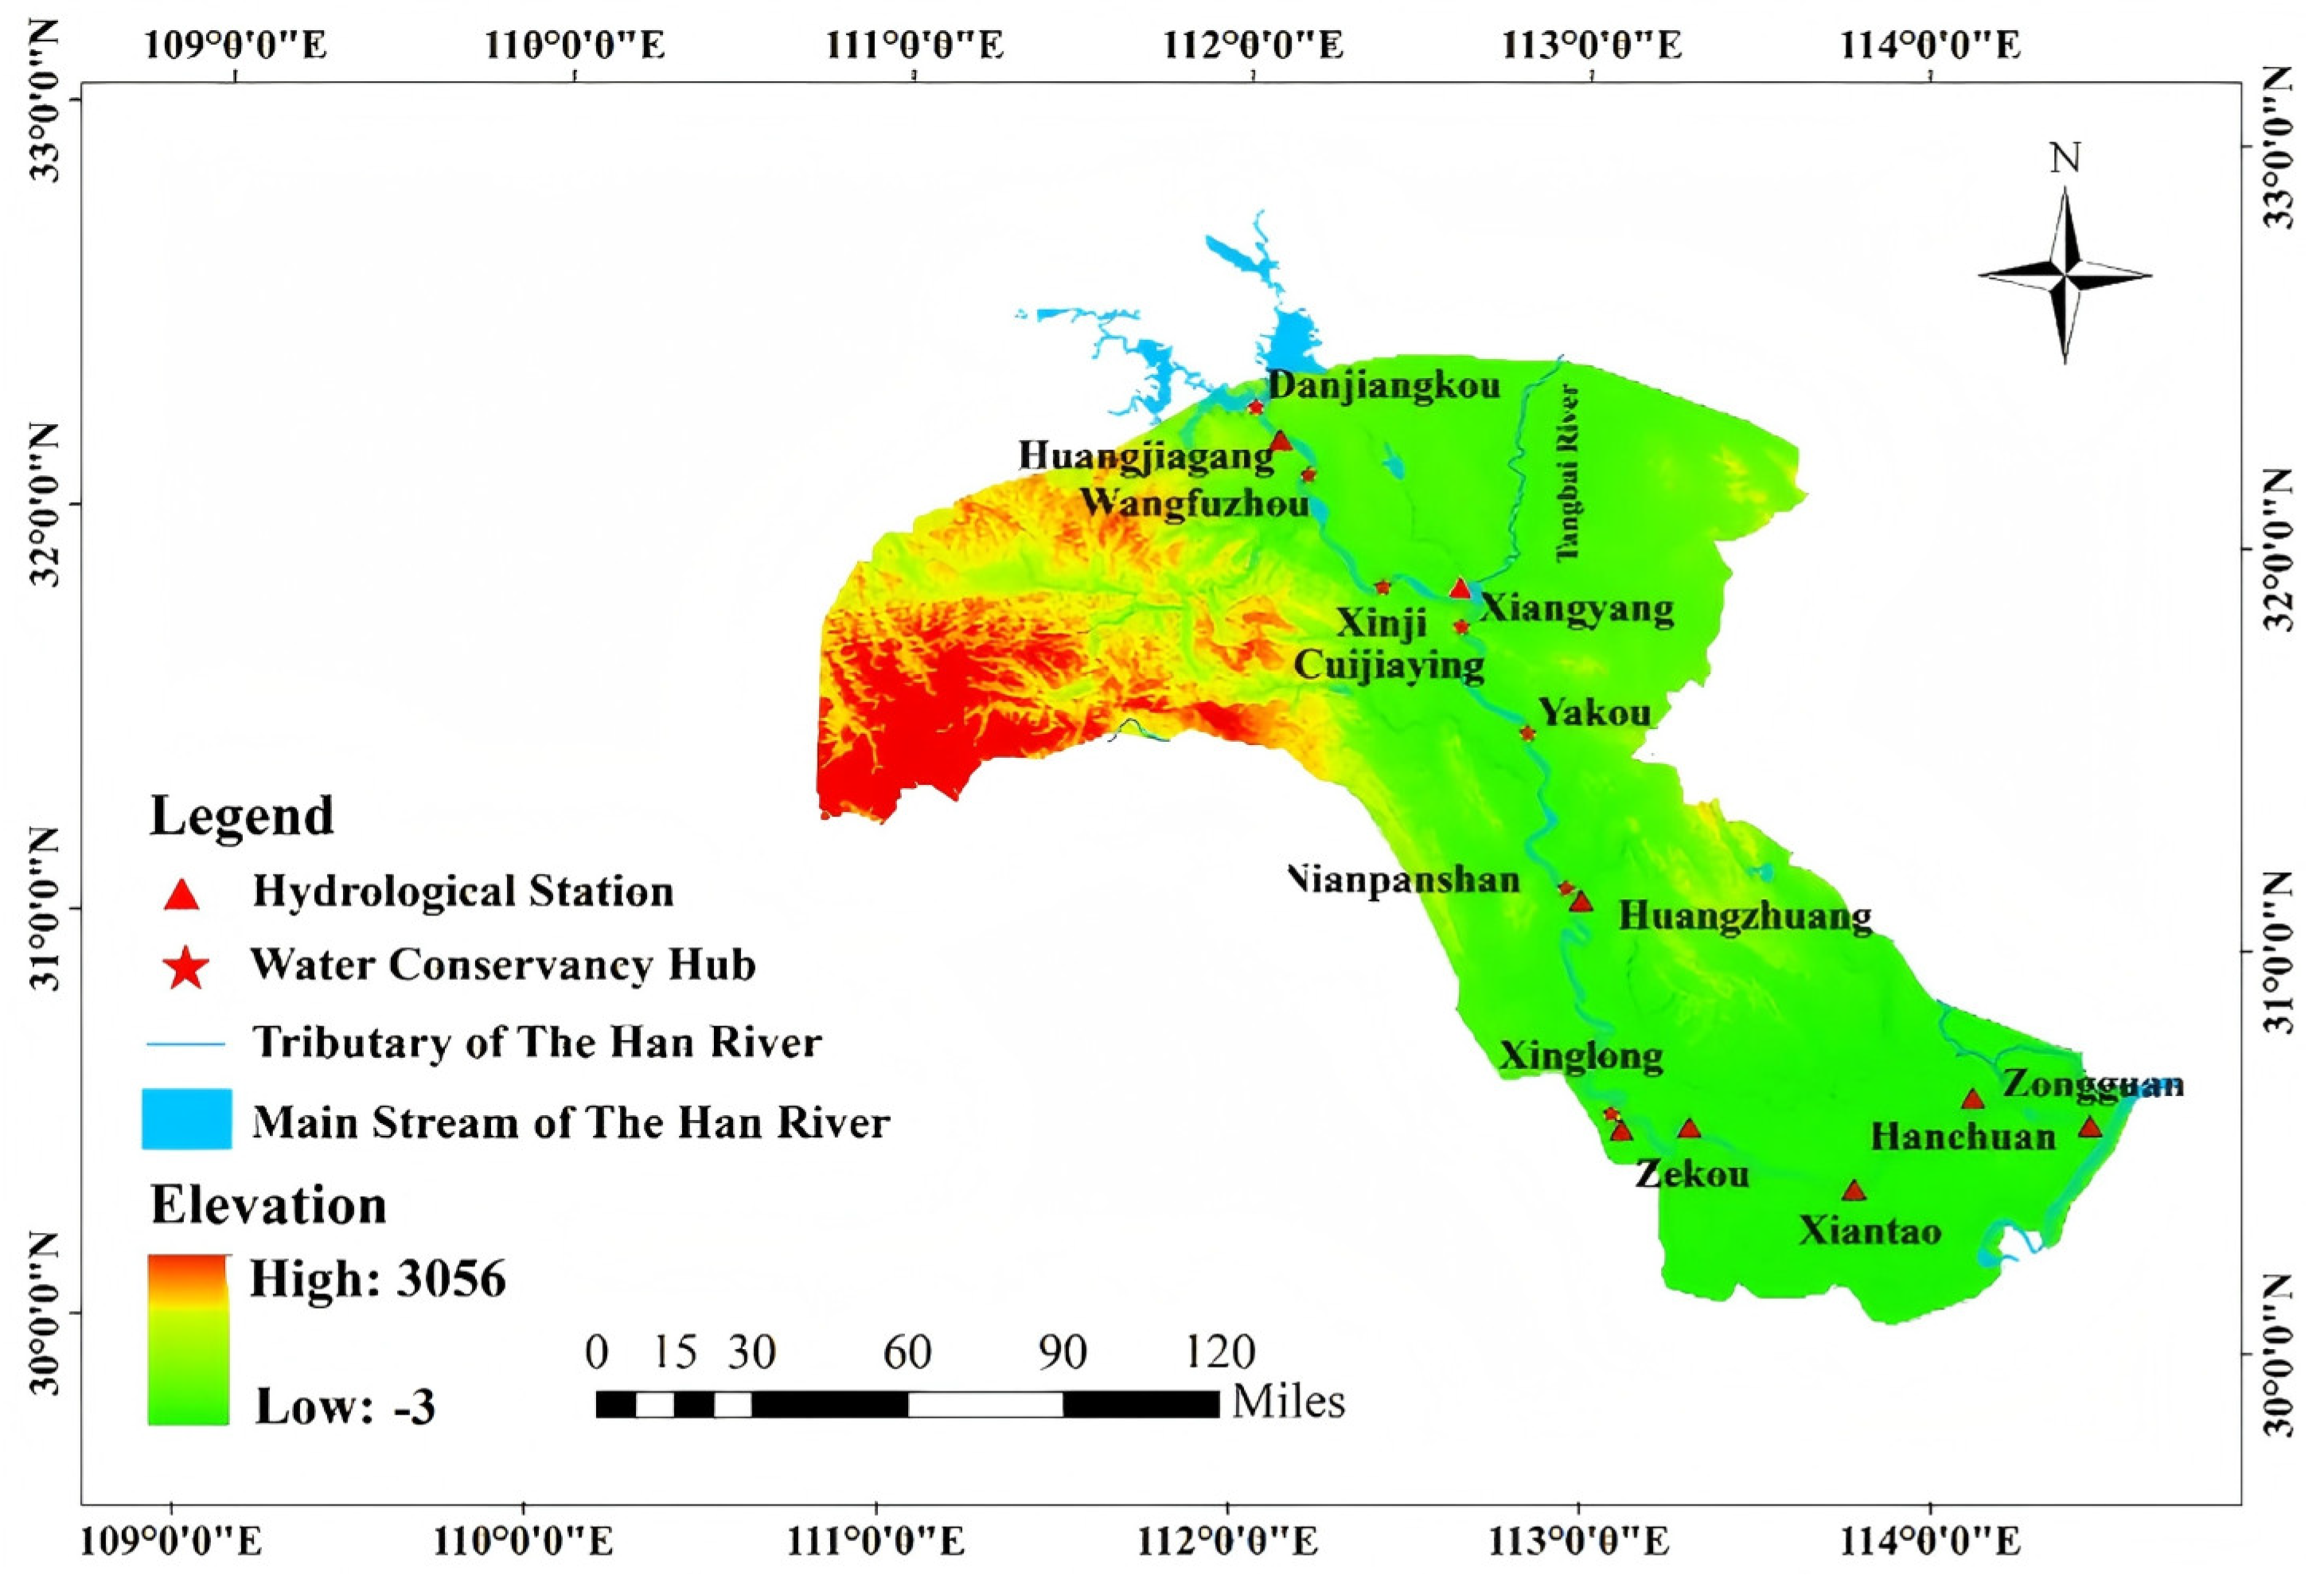
Figure 1. Sketch map of the middle and lower Han River basin.
Hydrology 12 00217 g001
Figure 2. Verification of model calculation results: (a) comparative diagram of measured versus simulated flow values at Xiangyang Station, (b) comparative diagram of measured versus simulated water level values at Xiangyang Station, (c) comparative diagram of measured versus simulated flow values at Huangzhuang Station, (d) comparative diagram of measured versus simulated water level values at Huangzhuang Station, (e) comparative diagram of measured versus simulated flow values at Xiantao Station, and (f) comparative diagram of measured versus simulated water level values at Xiantao Station.
Hydrology 12 00217 g002
Figure 3. SHAP summary plots: (a) discharge at Xiangyang Station, (b) water level at Xiangyang Station, (c) discharge at Huangzhuang Station, (d) water level at Huangzhuang Station, (e) discharge at Xiantao Station, and (f) water level at Xiantao Station.
Hydrology 12 00217 g003
Figure 4. SHAP dependence plots. a(15): Xiangyang flow vs. Huangjiagang flow, Tangbai flow, and 3 hubs (Wang/Cui/Xing) SHAP; b(15): Huangzhuang flow vs. Xiangyang flow, Tangbai flow, same 3 hubs SHAP; c(15): Xiantao flow vs. Huangzhuang flow, Tangbai flow, same 3 hubs SHAP; df(15): Xiangyang/Huangzhuang/Xiantao water level vs. counterparts, Tangbai flow, same 3 hubs SHAP.
Hydrology 12 00217 g004
Figure 5. Tangbai River SHAP dependence plots.
Hydrology 12 00217 g005
Table 1. Key stations and hydraulic hubs along the middle–lower Han River.
StationsLongitudeLatitudeLinking HubsOperation TimeObserved Items
Huangjiagang111°31′ E32°31′ NDanjiangkou1973Water level, Discharge
Xiangyang112°10′ E32°02′ NWangfuzhou, Xinji1995, 2024
Huangzhuang112°30′ E31°13′ NYakou, Nianpanshan2022, 2023
Xiantao113°27′ E30°22′ NXinglong2013
Table 2. Model Hyperparameter Settings.
HyperparametersSearch Space
lstm_units[32, 64, 128]
num_heads[4, 8]
learning_rate[0.01, 0.001]
batch_size[32, 64, 128]
dropout_rate[0.2, 0.3, 0.5]
Table 3. Computational model accuracy evaluation.
Gauging StationsRMSEMAER2NSE
Xiangyang247.48810.1340.9380.938
Huangzhuang230.2929.7330.8790.879
Xiantao107.8476.7720.9880.988
Disclaimer/Publisher’s Note: The statements, opinions and data contained in all publications are solely those of the individual author(s) and contributor(s) and not of MDPI and/or the editor(s). MDPI and/or the editor(s) disclaim responsibility for any injury to people or property resulting from any ideas, methods, instructions or products referred to in the content.