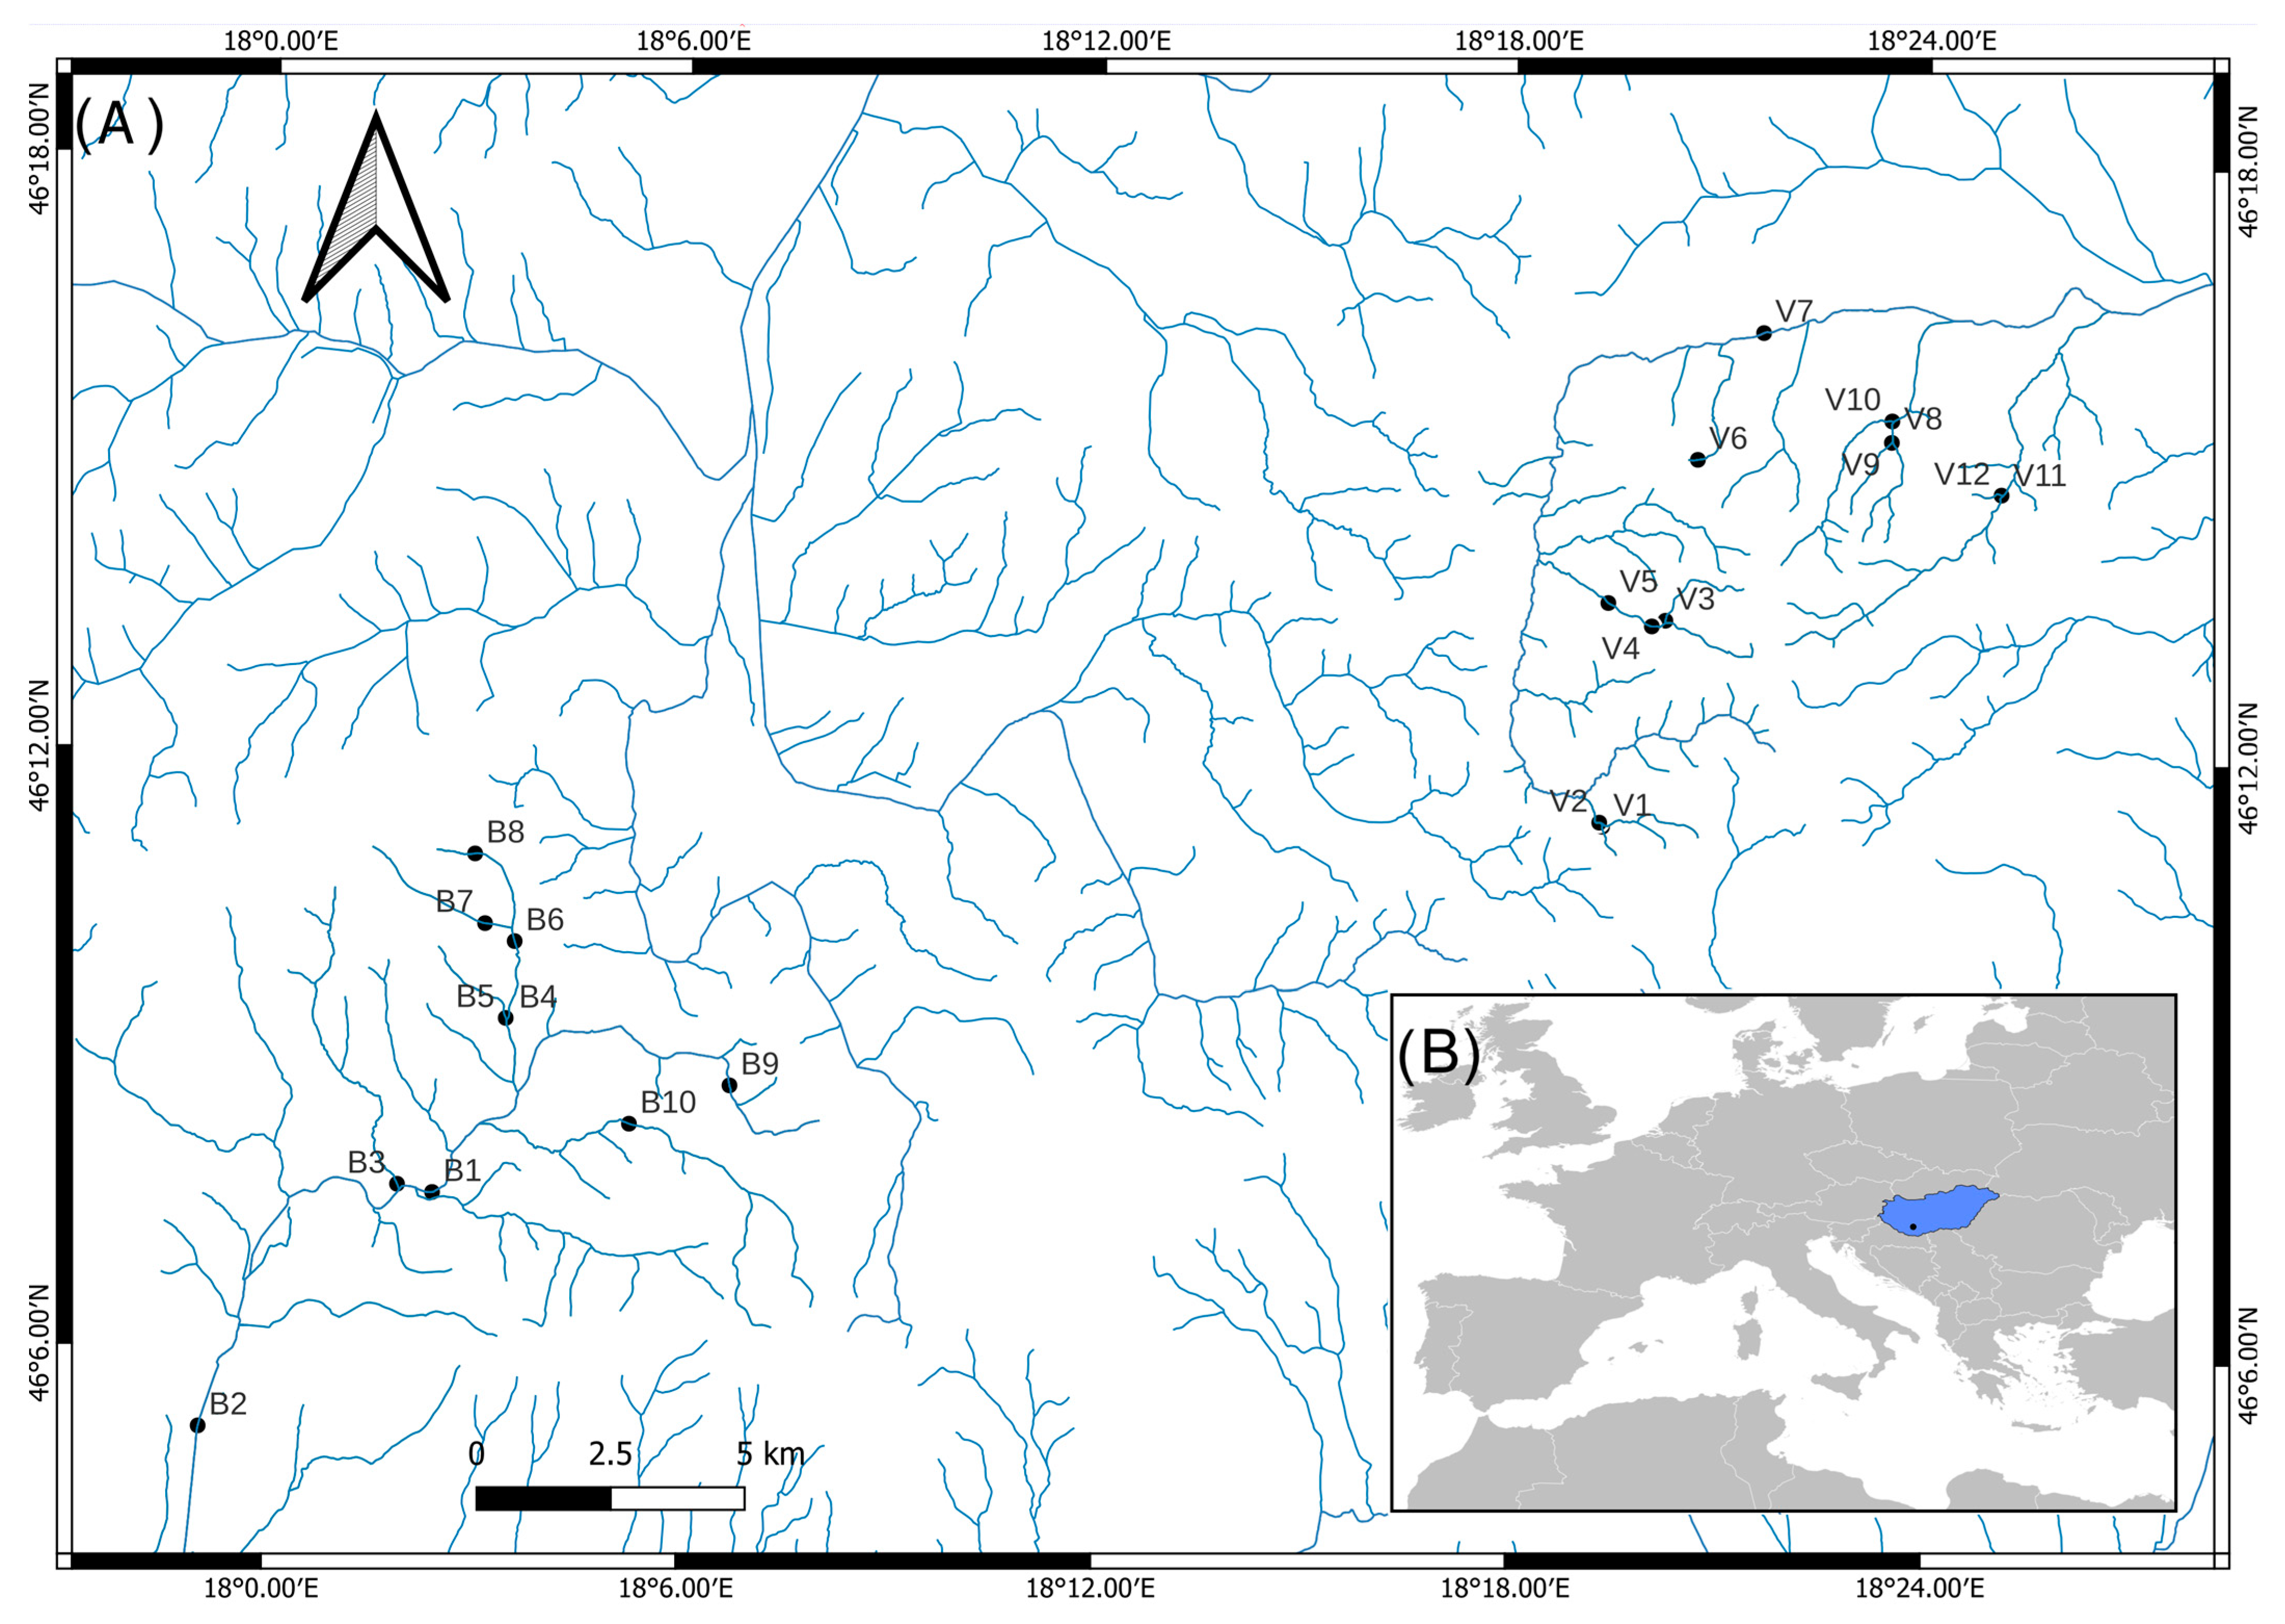
Figure 1.
A map of the study area in the Mecsek Mountains (southwestern Hungary). (A) Two river systems—Bükkösdi (B) and Völgységi (V) with sampling sites are shown. (B) The location of the study area (black dot) in Hungary, which is marked in blue.
Figure 1.
A map of the study area in the Mecsek Mountains (southwestern Hungary). (A) Two river systems—Bükkösdi (B) and Völgységi (V) with sampling sites are shown. (B) The location of the study area (black dot) in Hungary, which is marked in blue.
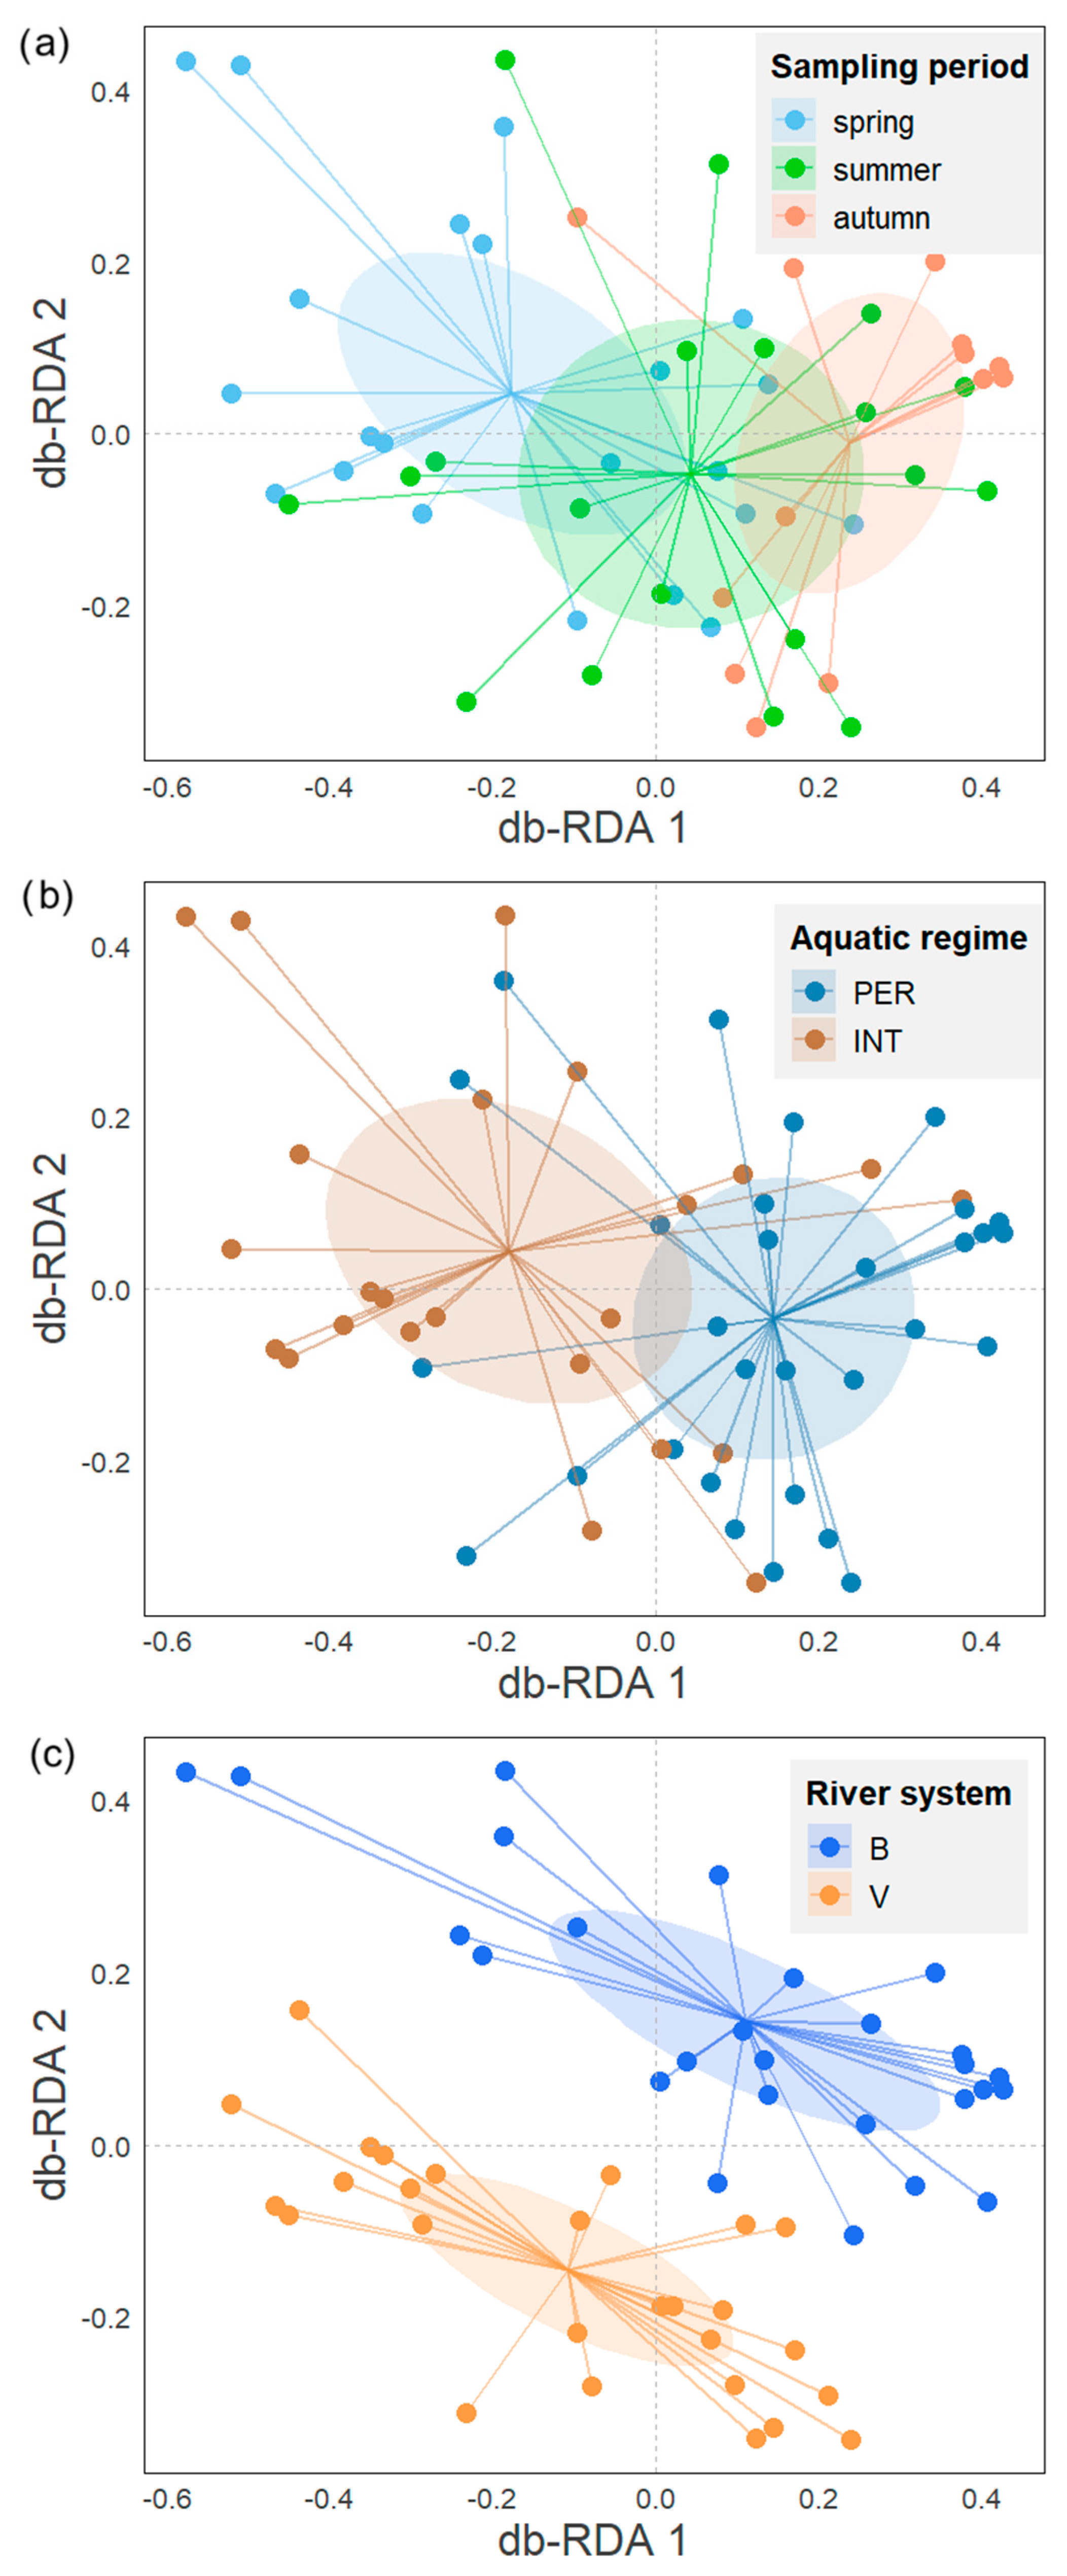
Figure 2.
db-RDA biplots of diatom species composition representing sampling sites and centroids of factors: sampling period (a), aquatic regime (b), and river system (c).
Figure 2.
db-RDA biplots of diatom species composition representing sampling sites and centroids of factors: sampling period (a), aquatic regime (b), and river system (c).
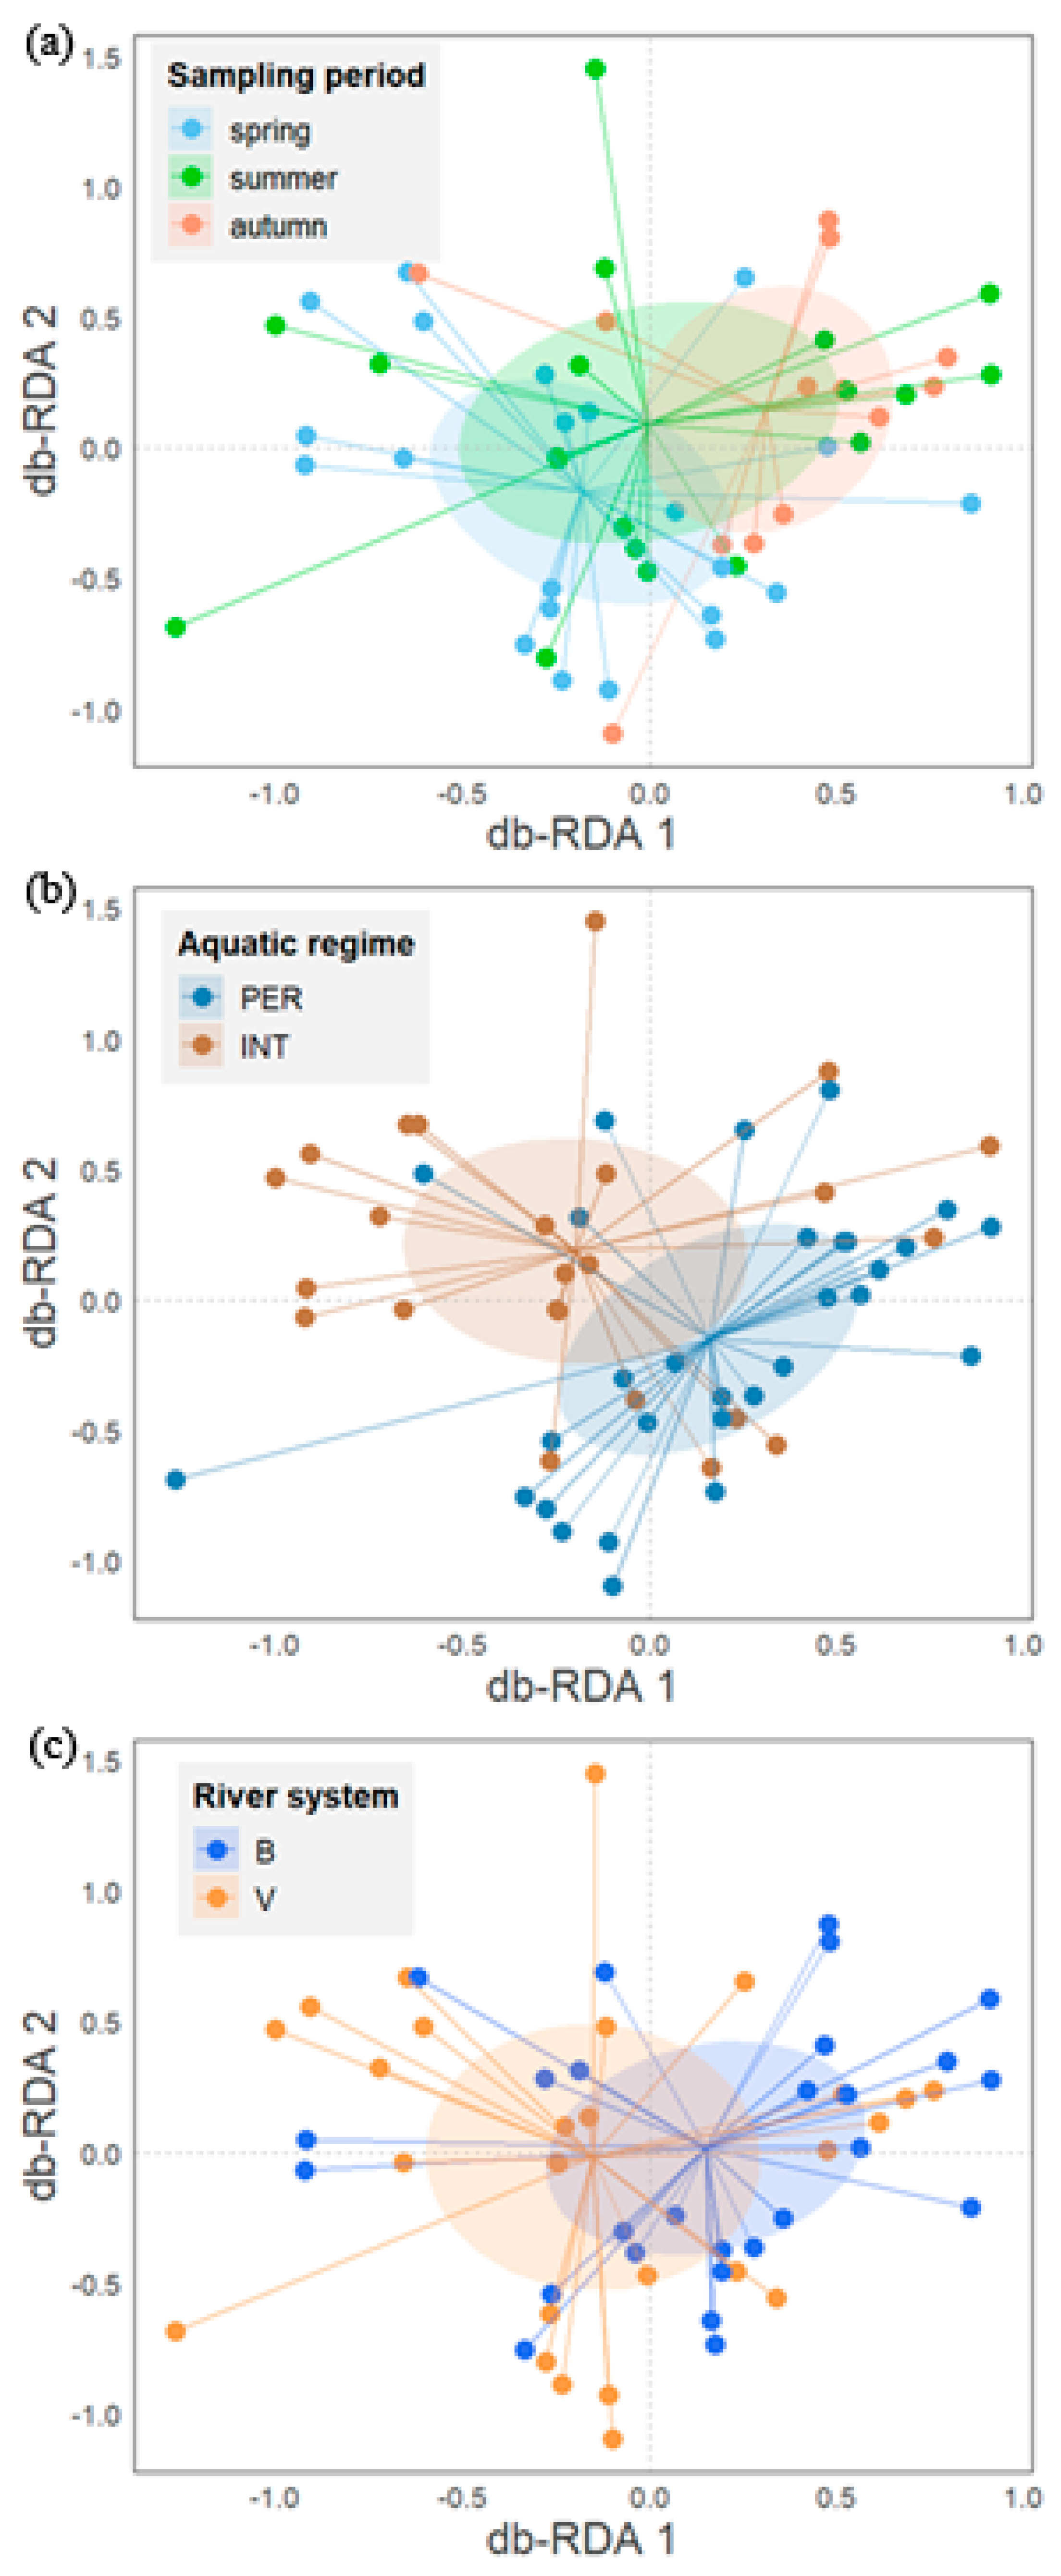
Figure 3.
db-RDA biplots of diatom trait composition representing sampling sites and centroids of factors: sampling period (a), aquatic regime (b), and river system (c).
Figure 3.
db-RDA biplots of diatom trait composition representing sampling sites and centroids of factors: sampling period (a), aquatic regime (b), and river system (c).
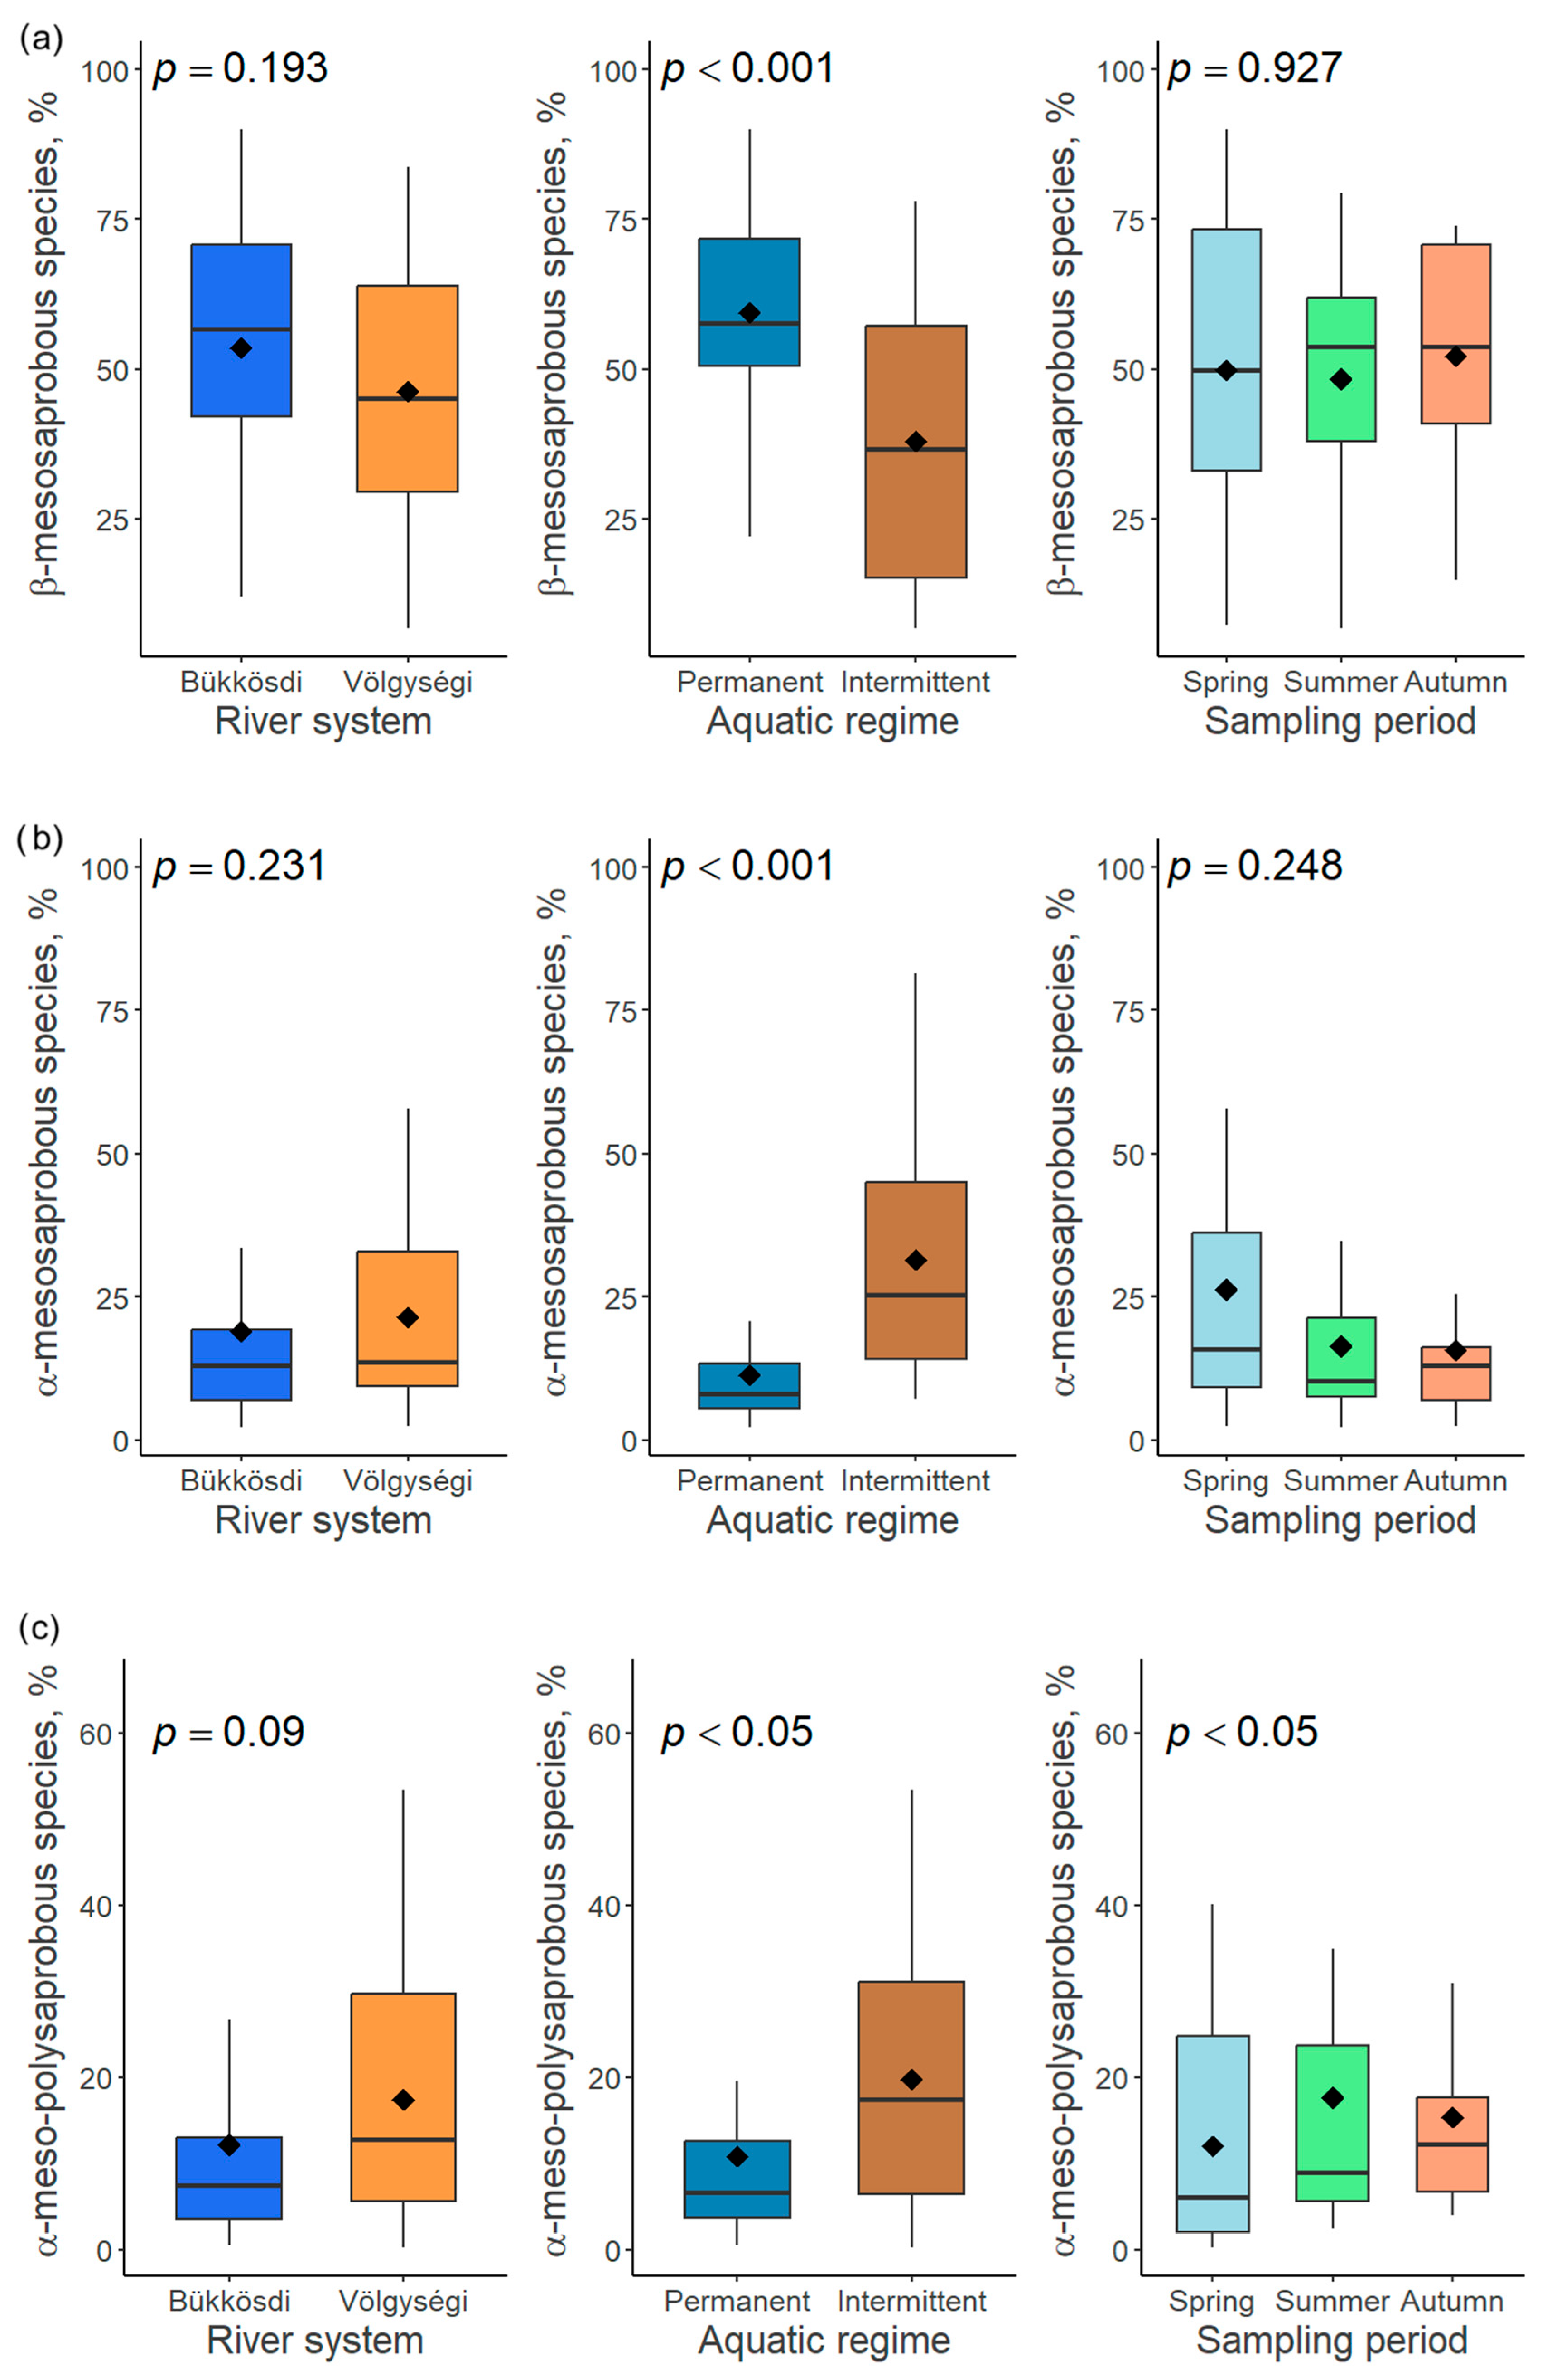
Figure 4.
Responses of relative abundance of β-mesosaprobous (a), α-mesosaprobous (b) and α-meso-polysaprobous (c) diatom species to three factors (river system, aquatic regime, and sampling period).
Figure 4.
Responses of relative abundance of β-mesosaprobous (a), α-mesosaprobous (b) and α-meso-polysaprobous (c) diatom species to three factors (river system, aquatic regime, and sampling period).
Figure 5.
Responses of relative abundance of low-profile (a), high-profile (b), and motile (c) diatom guilds to three factors (river system, aquatic regime, and sampling period).
Figure 5.
Responses of relative abundance of low-profile (a), high-profile (b), and motile (c) diatom guilds to three factors (river system, aquatic regime, and sampling period).
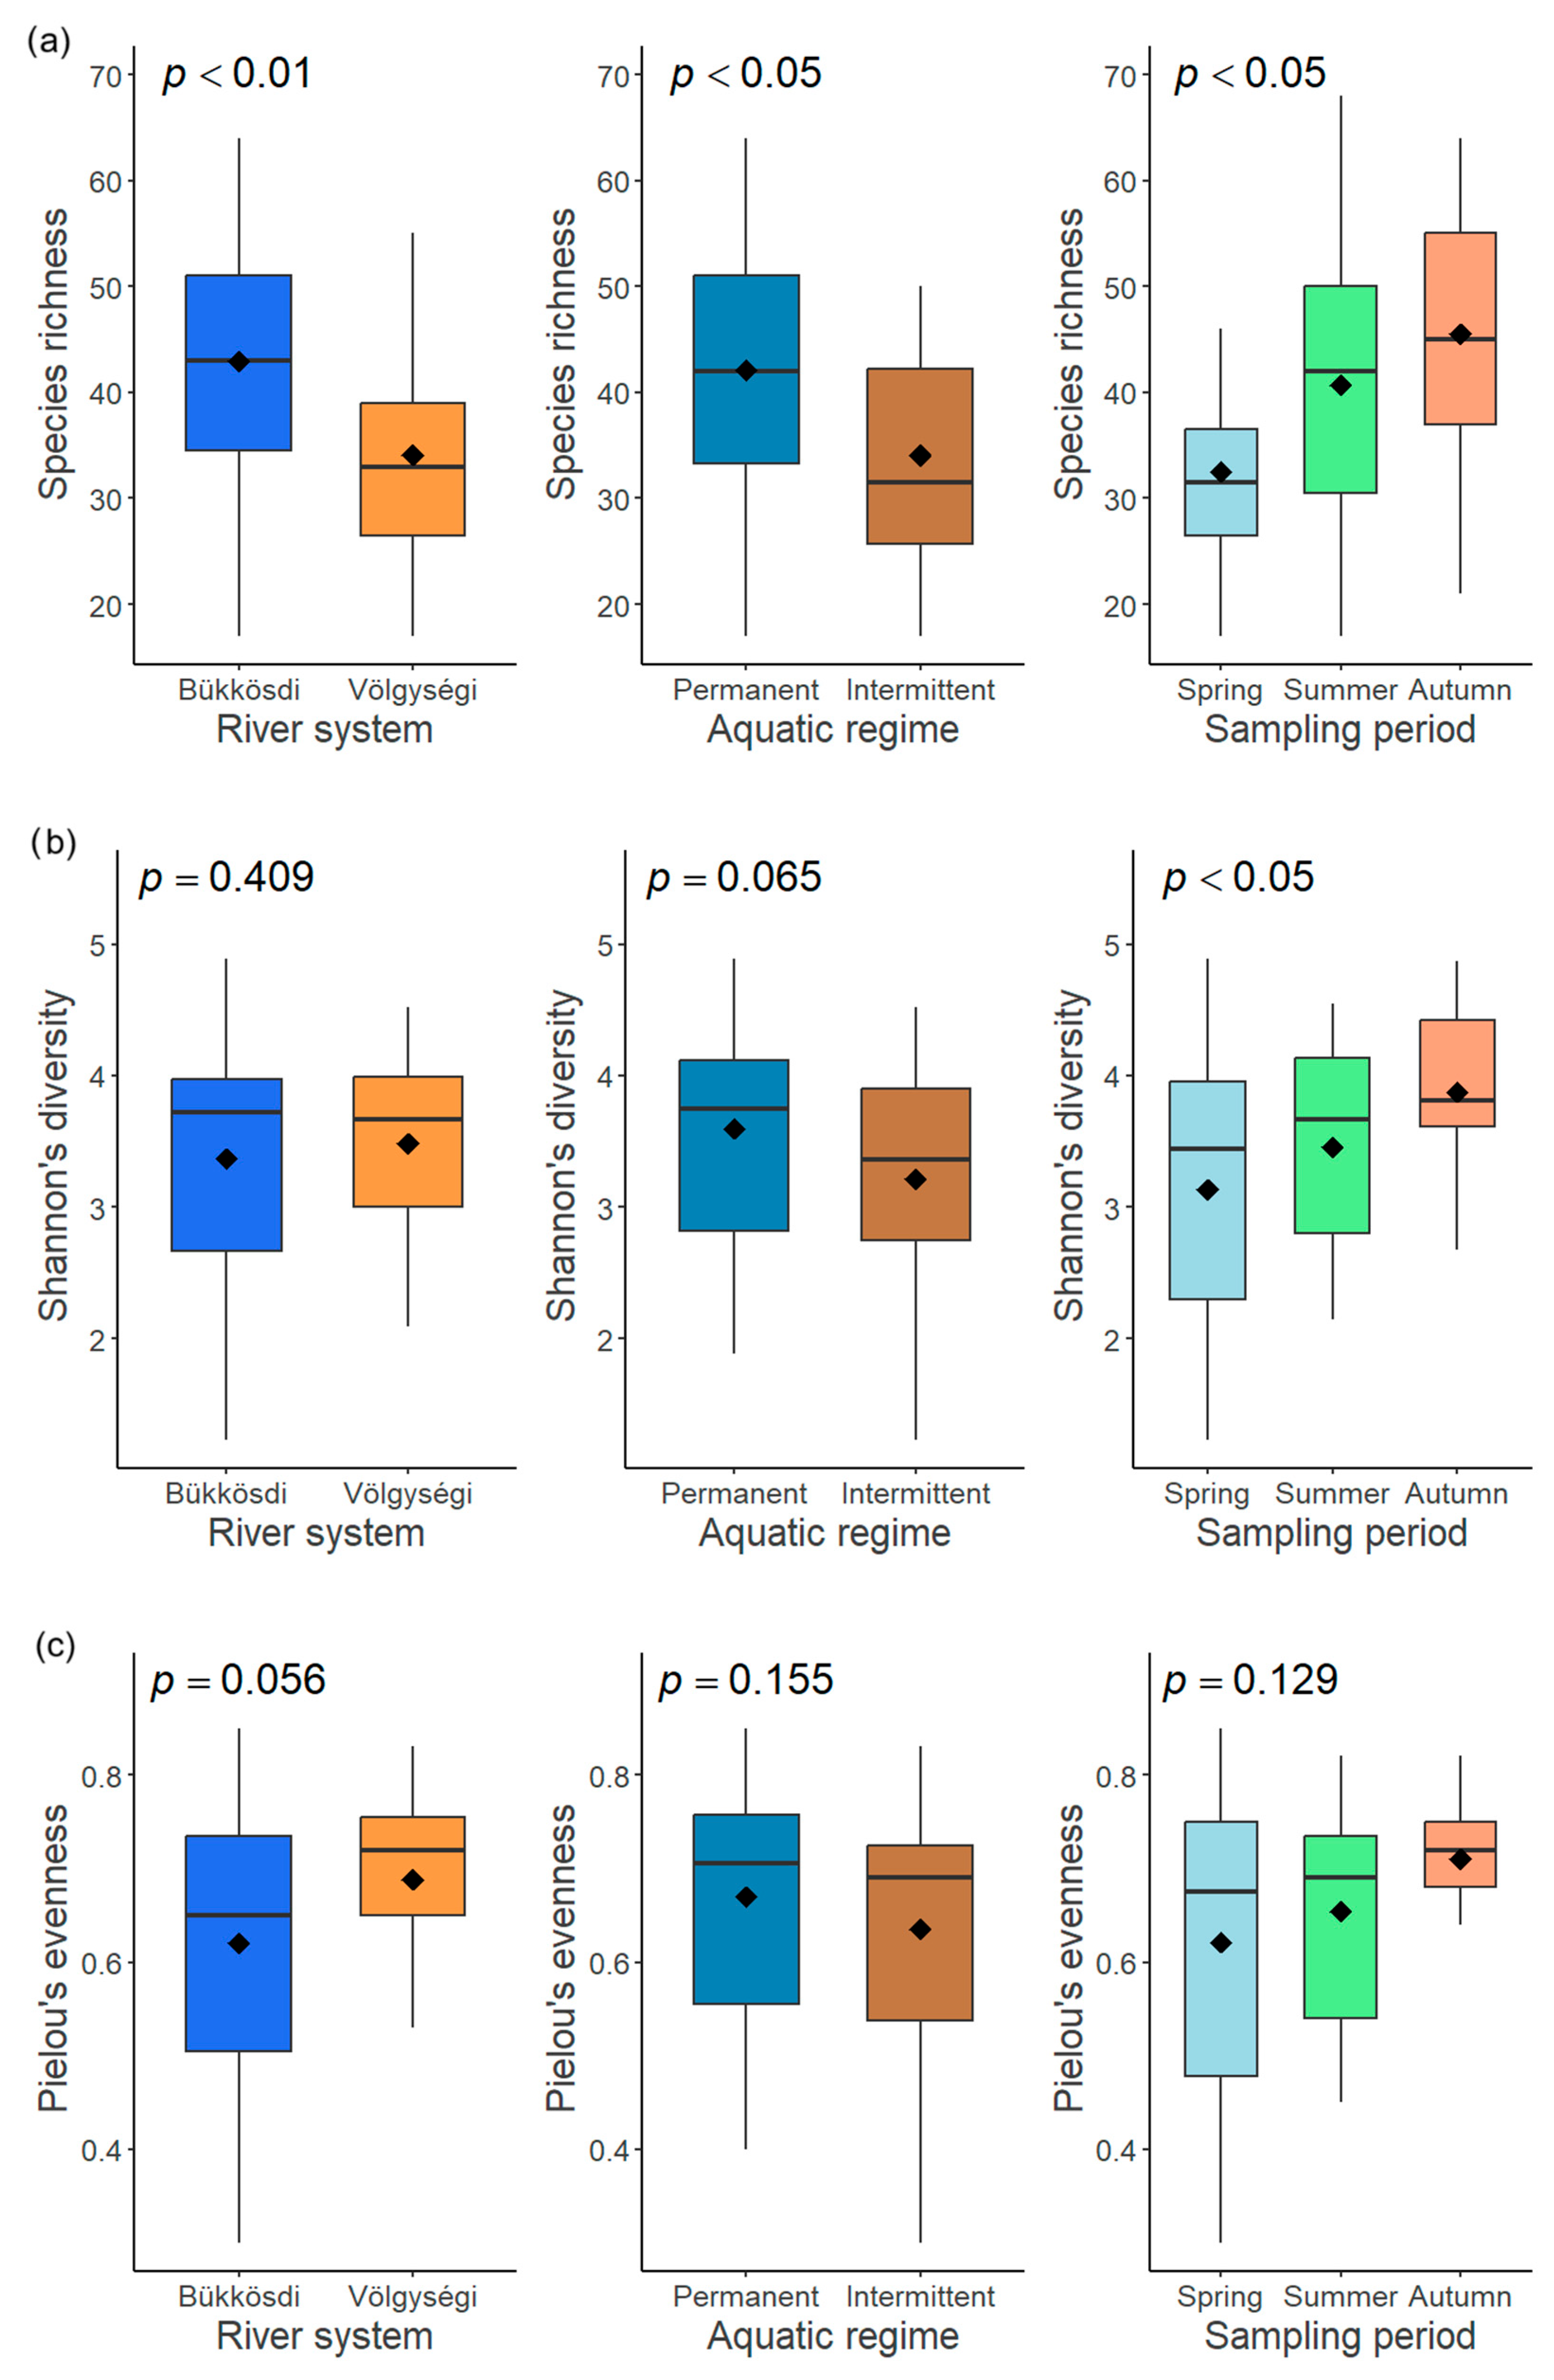
Figure 6.
The influence of three factors (river system, aquatic regime, and sampling period) on diversity measures (species richness (a), Shannon’s diversity (b), and Pielou’s evenness (c)) of diatom communities.
Figure 6.
The influence of three factors (river system, aquatic regime, and sampling period) on diversity measures (species richness (a), Shannon’s diversity (b), and Pielou’s evenness (c)) of diatom communities.
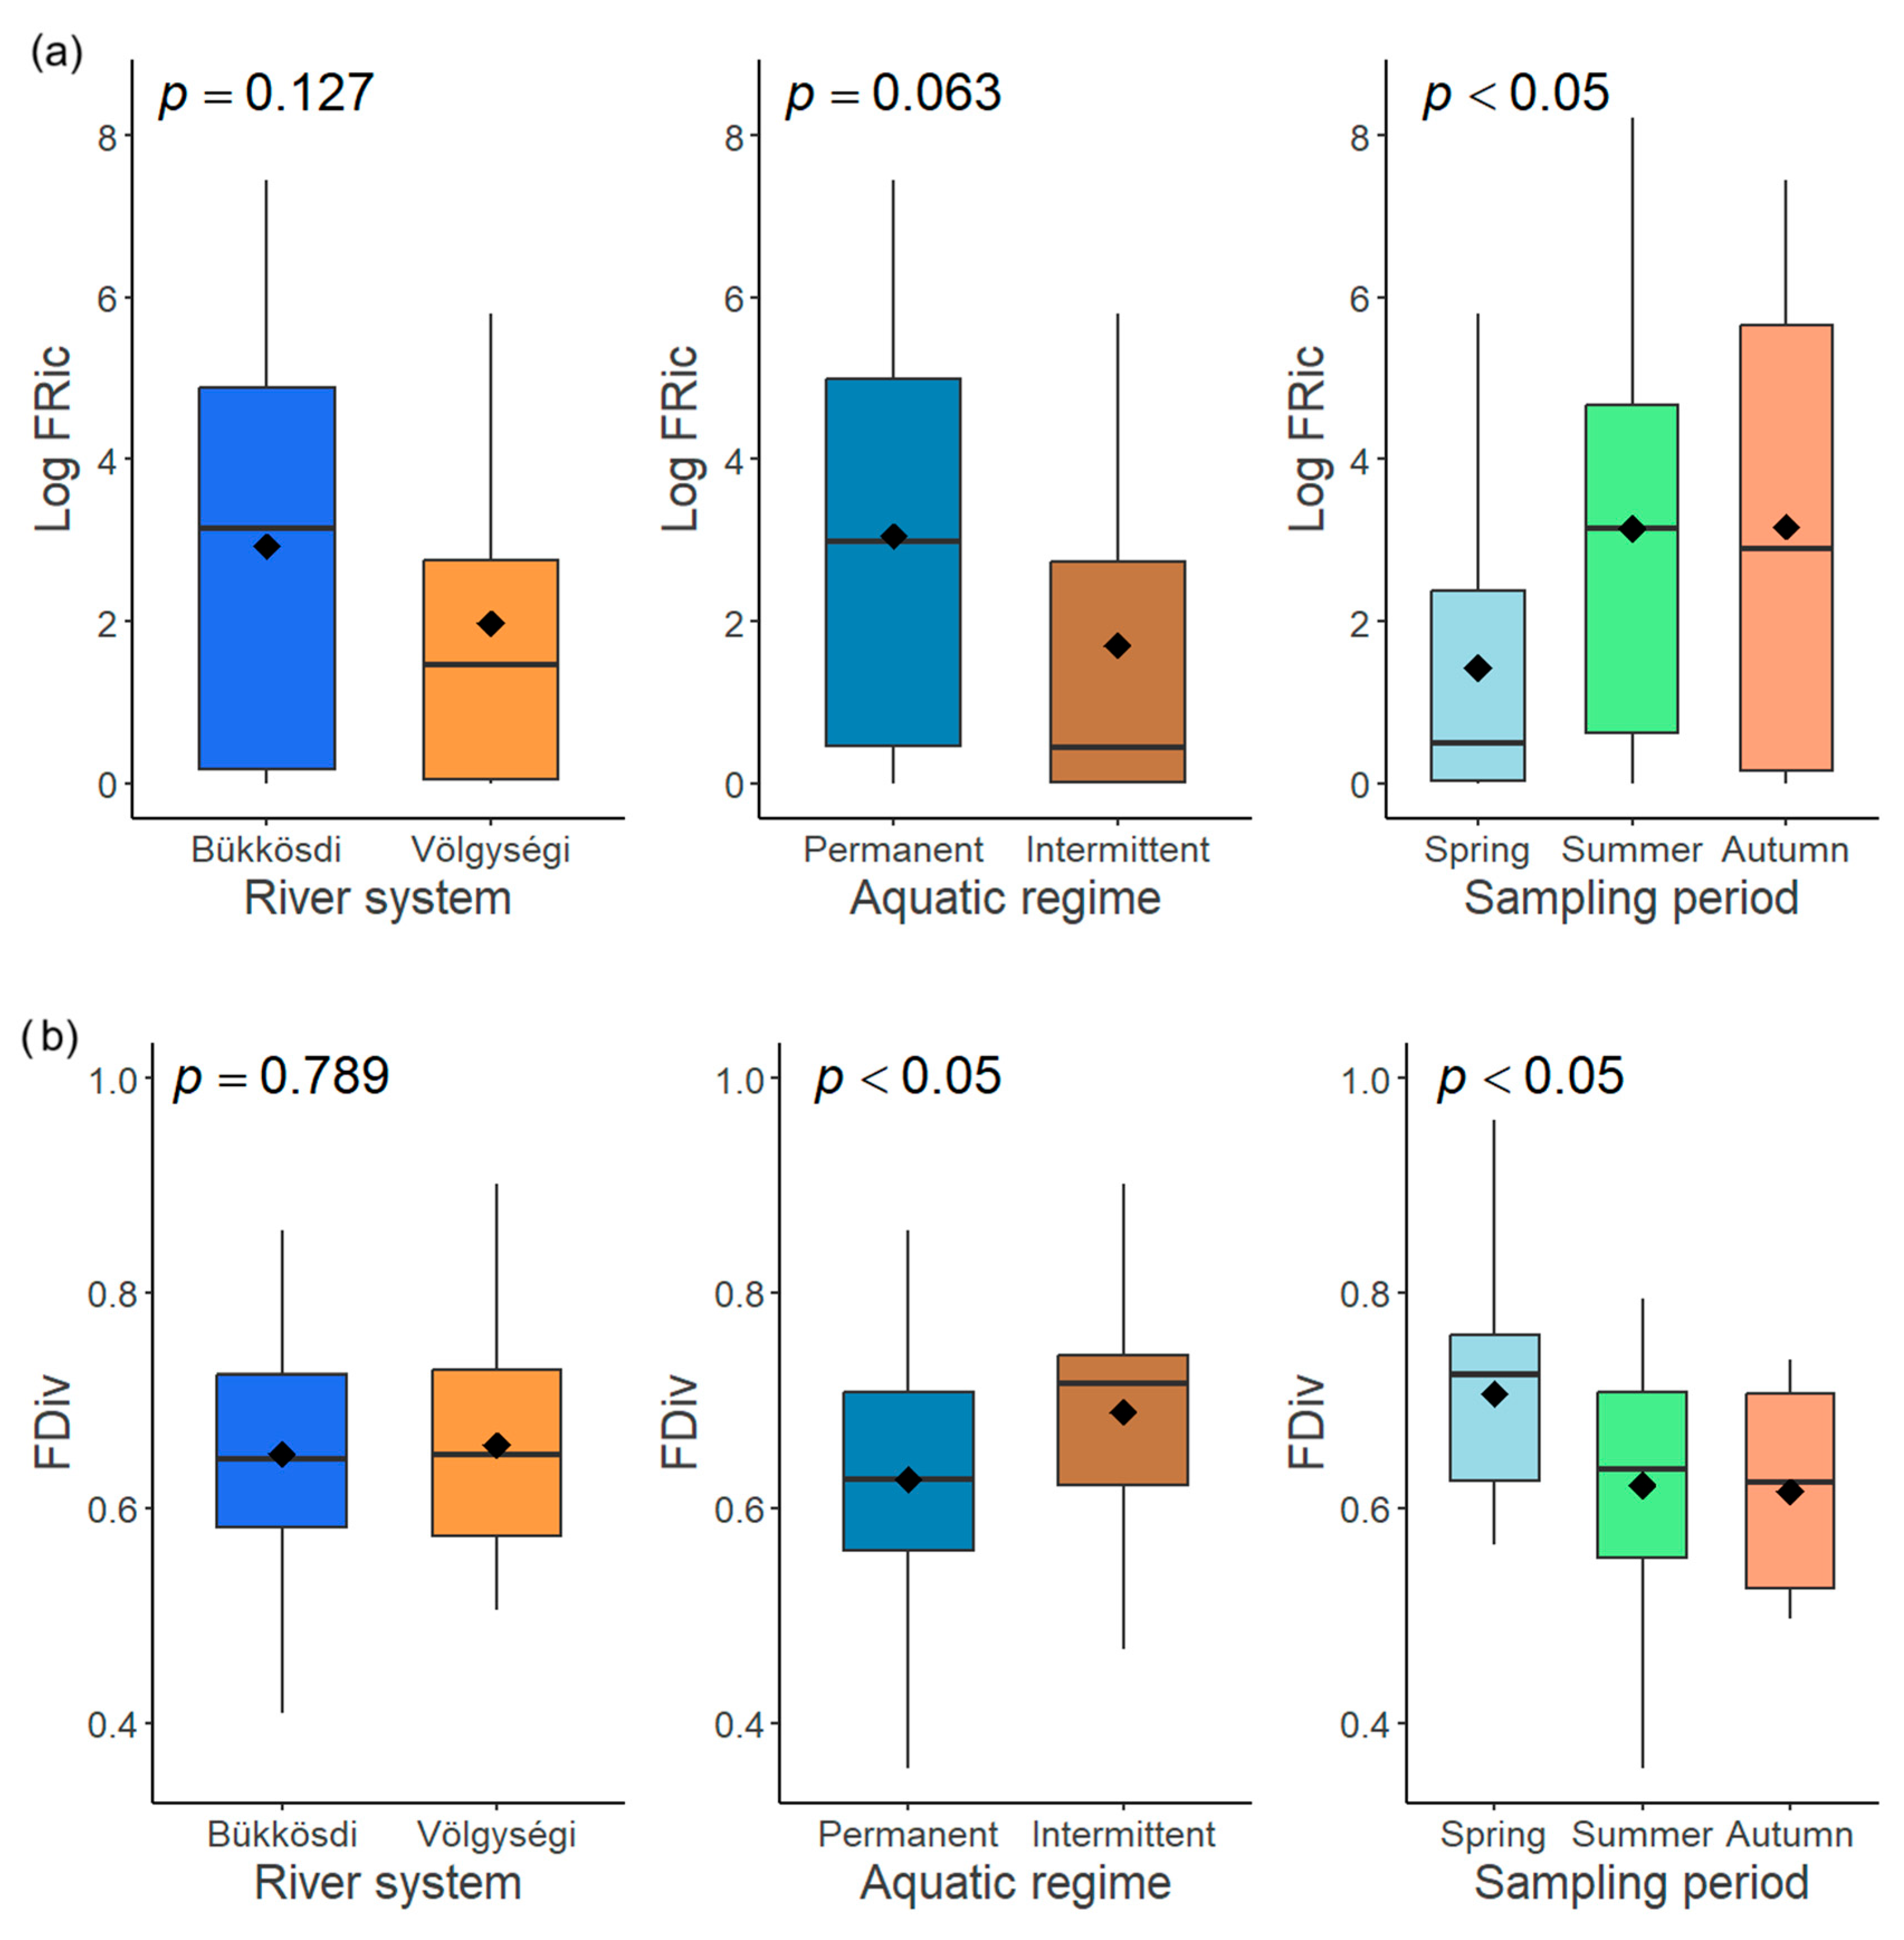
Figure 7.
The influence of three factors (river system, aquatic regime, and sampling period) on functional richness (FRic) (a) and functional divergence (FDiv) (b) of diatom communities.
Figure 7.
The influence of three factors (river system, aquatic regime, and sampling period) on functional richness (FRic) (a) and functional divergence (FDiv) (b) of diatom communities.
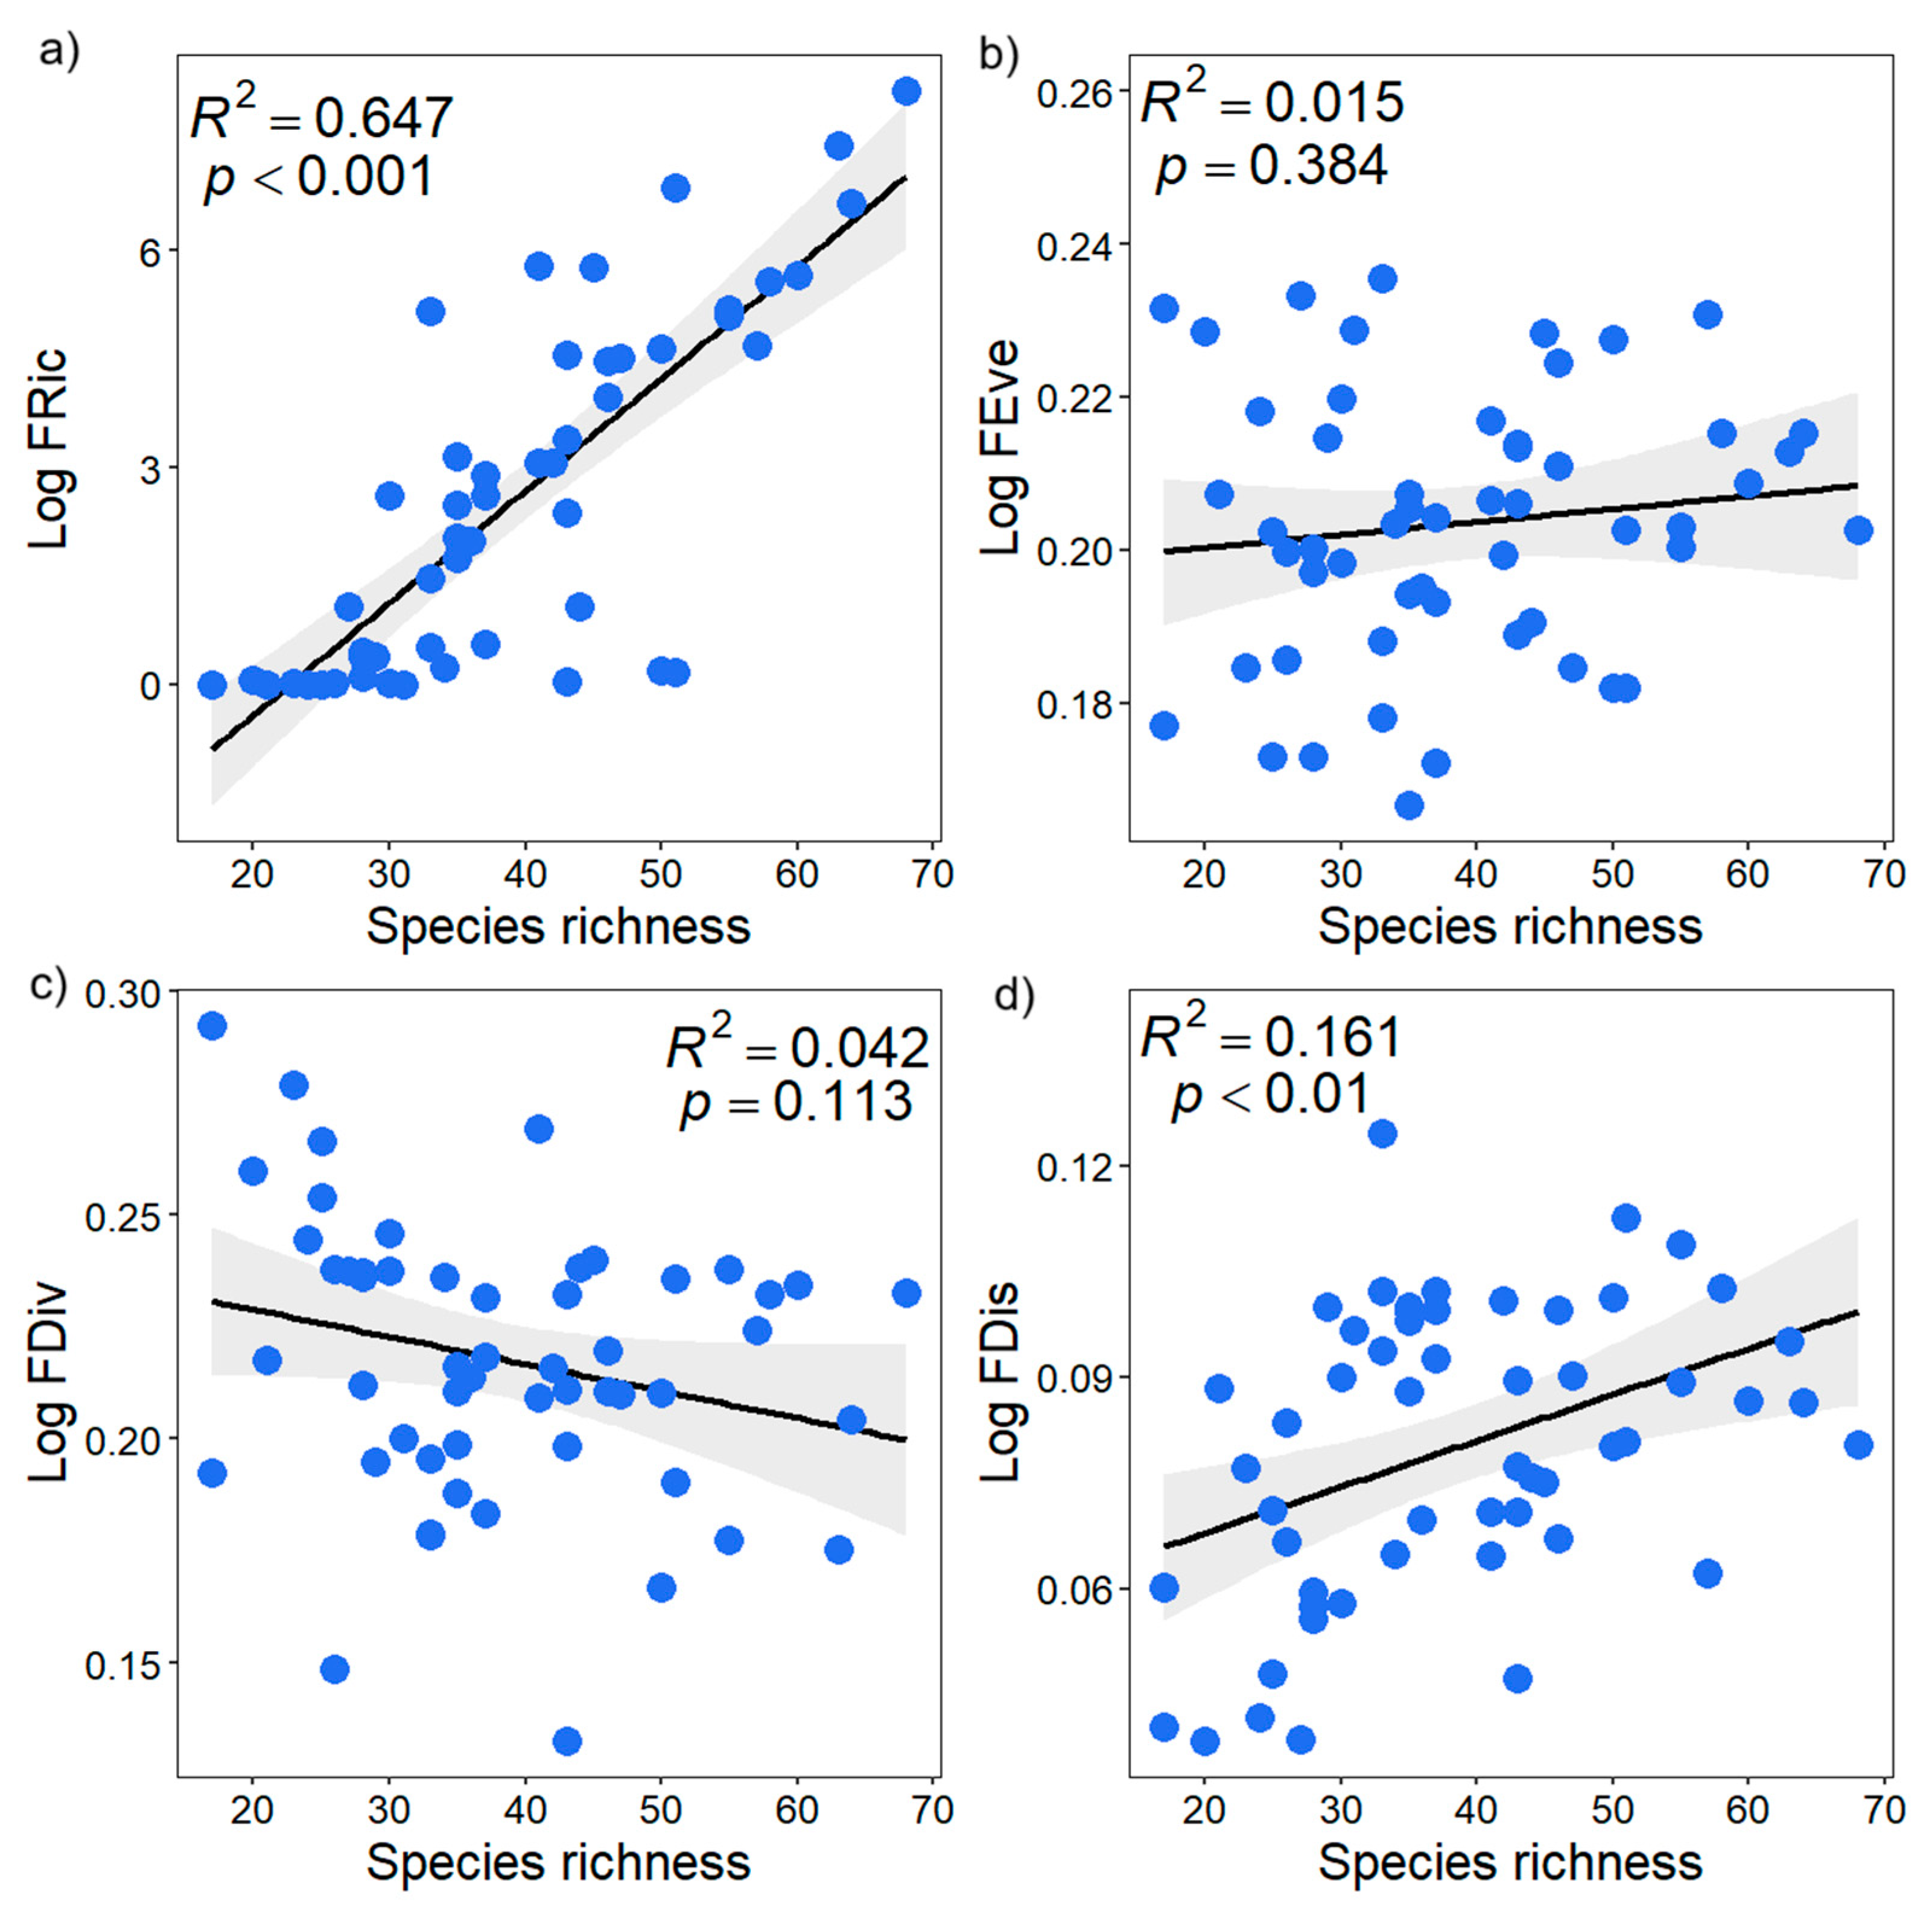
Figure 8.
Relationships between functional diversity indices (functional richness (a), functional evenness (b), functional divergence (c), and functional dispersion (d)) and species richness. Black line represents regression line, gray shadow means 95% confidence interval.
Figure 8.
Relationships between functional diversity indices (functional richness (a), functional evenness (b), functional divergence (c), and functional dispersion (d)) and species richness. Black line represents regression line, gray shadow means 95% confidence interval.
Figure 9.
The response of diatom indices (Specific pollution sensitivity index (a), Rott’s trophic index (b), and Rott’s saprobic index (c) to three factors (river system, aquatic regime, and sampling period).
Figure 9.
The response of diatom indices (Specific pollution sensitivity index (a), Rott’s trophic index (b), and Rott’s saprobic index (c) to three factors (river system, aquatic regime, and sampling period).
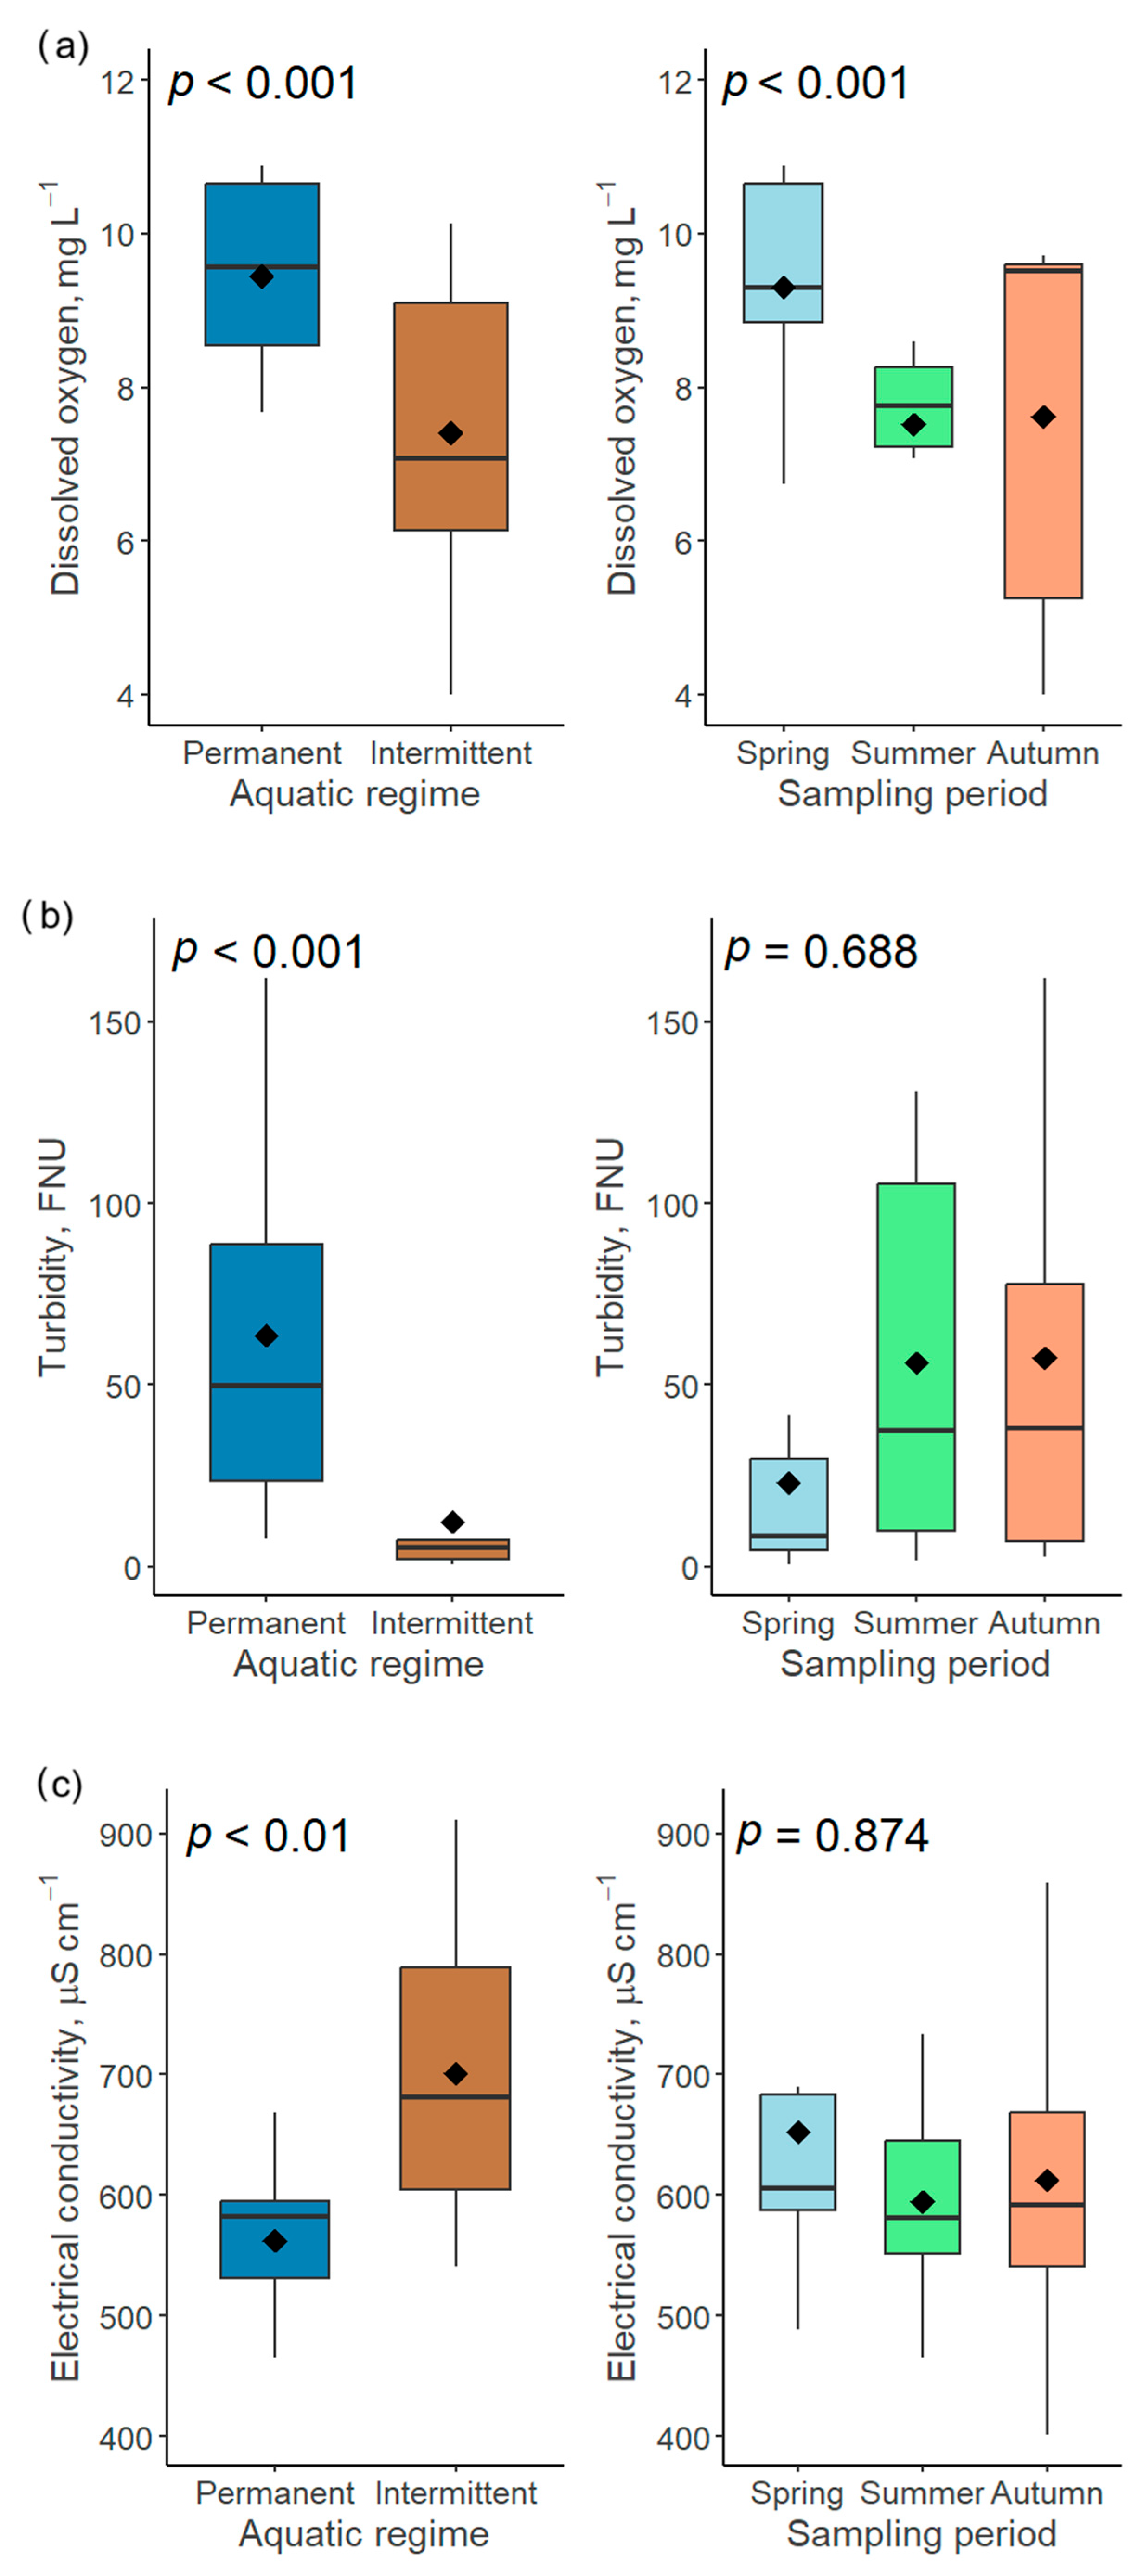
Figure 10.
Influence of two factors (aquatic regime and sampling period) on dissolved oxygen (a), turbidity (b) and electrical conductivity (c) in the Völgységi river system.
Figure 10.
Influence of two factors (aquatic regime and sampling period) on dissolved oxygen (a), turbidity (b) and electrical conductivity (c) in the Völgységi river system.
Figure 11.
Influence of two factors (aquatic regime and sampling period) on nitrate (a) and total phosphorus (b) concentrations in Völgységi river system.
Figure 11.
Influence of two factors (aquatic regime and sampling period) on nitrate (a) and total phosphorus (b) concentrations in Völgységi river system.
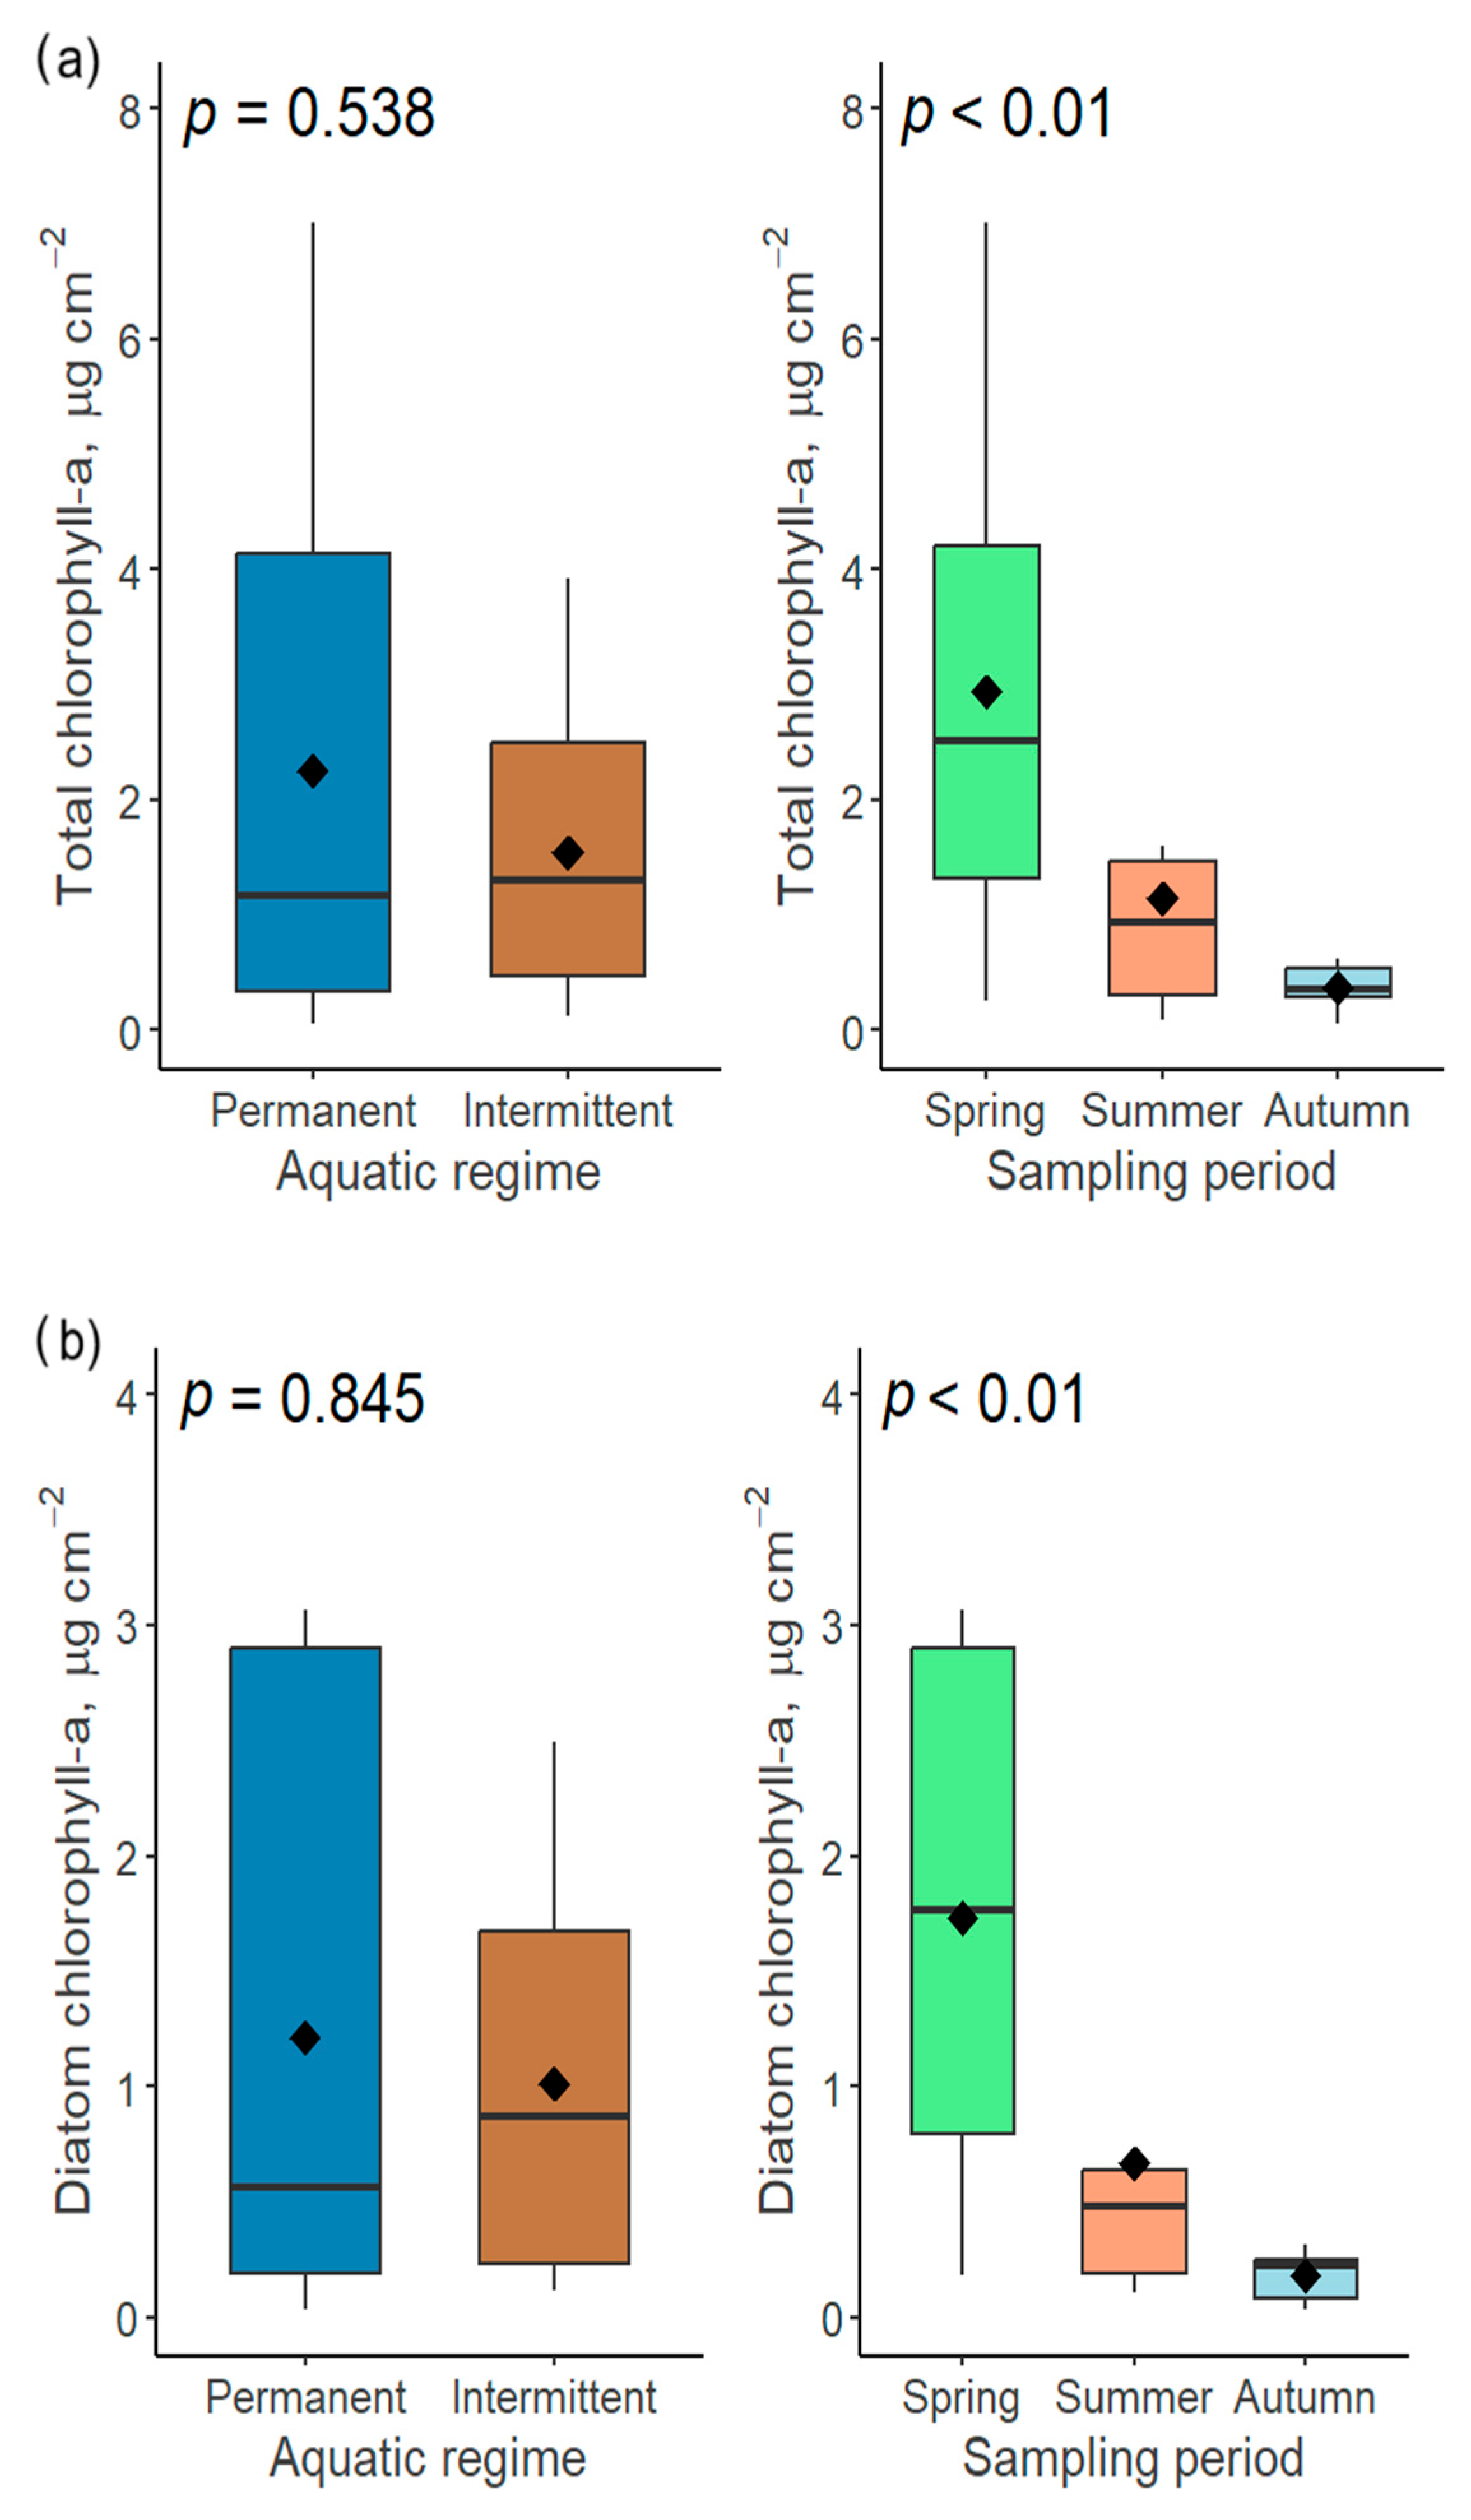
Figure 12.
The influence of two factors (aquatic regime and sampling period) on the total (a) and diatom (b) chlorophyll-a concentrations in the Völgységi river system.
Figure 12.
The influence of two factors (aquatic regime and sampling period) on the total (a) and diatom (b) chlorophyll-a concentrations in the Völgységi river system.
Table 1.
Precipitation level and air temperature in Bükkösdi (2019) and Völgységi (2021) river systems. Data were obtained from meteorological stations located in Pécs (Bükkösdi) and Váralja (Völgységi).
Table 1.
Precipitation level and air temperature in Bükkösdi (2019) and Völgységi (2021) river systems. Data were obtained from meteorological stations located in Pécs (Bükkösdi) and Váralja (Völgységi).
| Völgységi | Bükkösdi | Precipitation |
|---|
| 672 ± 77 | 663 ± 56 | Mean (±SD) total annual for 2016–2021 (mm/year) |
| 561 | 703 | Total annual (mm) |
| 352 | 466 | Total for April–September (mm) |
| 19–86 | 15–129 | Range (min–max) for April–September (mm/month) |
| 50 ± 28 | 67 ± 36 | Mean (±SD) for April–September (mm/month) |
| 37 | 61 | Median (mm/month) |
| Völgységi | Bükkösdi | Air Temperature |
| 10.1 ± 4.2 | 12.3 ± 2.3 | Mean (±SD) spring (April) values (°C) |
| 20.4 ± 5.0 | 19.9 ± 5.1 | Mean (±SD) summer (July) values (°C) |
| 21.5 ± 3.0 | 21.1 ± 2.9 | Mean (±SD) autumn (September) values (°C) |
Table 2.
Functional traits, their categories, and the mean relative abundance of trait categories in the diatom communities of the Bükkösdi and Völgységi stream systems.
Table 2.
Functional traits, their categories, and the mean relative abundance of trait categories in the diatom communities of the Bükkösdi and Völgységi stream systems.
| Mean Relative Abundance (%) | Trait Categories | Traits |
|---|
| 32.6 | 5–99 µm3 | nano | Cell size |
| 19.2 | 100–299 µm3 | micro | |
| 32.4 | 300–599 µm3 | meso | |
| 10.2 | 600–1499 µm3 | macro | |
| 5.6 | ≥1500 µm3 | very large | |
| 49.2 | | low-profile | Guilds |
| 18.9 | | high-profile | |
| 31.3 | | motile | |
| 0.5 | | planktic | |
| 22.7 | | pioneer | Spreading |
| 4.6 | | strictly aquatic | Moisture preference |
| 13.1 | | occasional aerophilic | |
| 53.6 | | aquatic-subaerial | |
| 3.7 | | aerophilic | |
| >0.1 | | terrestrial | |
| 13.6 | 100% saturation | polyoxybiontic | Oxygen demand |
| 37.1 | 75% saturation | oxybiontic | |
| 25.8 | 50% saturation | moderate | |
| 7.4 | 30% saturation | low | |
| 0.4 | 10% saturation | very low | |
| 2.1 | | oligosaprobous | Saprobity |
| 49.9 | | β-mesosaprobous | |
| 20.3 | | α-mesosaprobous | |
| 14.8 | | α-meso-polysaprobous | |
| 1.1 | | polysaprobous | |
| 0.4 | | oligotraphentic | Trophic state |
| 0.5 | | oligo-mesotraphentic | |
| 0.3 | | mesotraphentic | |
| 3.8 | | meso-eutraphentic | |
| 58.2 | | eutraphentic | |
| 2.6 | | hypereutraphentic | |
| 23.4 | | indifferent | |
Table 3.
Significant predictors in the db-RDA models of diatom species and functional composition.
Table 3.
Significant predictors in the db-RDA models of diatom species and functional composition.
| p | Fmodel | Factors |
|---|
| Species composition |
| <0.001 | 2.478 | Sampling period |
| <0.001 | 4.103 | Aquatic regime |
| <0.001 | 4.114 | River system |
| Functional composition |
| 0.143 | 1.504 | Sampling period |
| <0.05 | 3.089 | Aquatic regime |
| 0.225 | 1.389 | River system |
Table 4.
The results of the comparison of the means (±SE) of diatom functional traits through a three-way ANOVA of the effects of river system, aquatic regime and sampling period. Factor levels: river system—Bükkösdi (B) and Völgységi (V); aquatic regime—permanent (PER) and intermittent (INT); sampling period—spring (SPR), summer (SUM), and autumn (AUT). Significant (p ≤ 0.05) differences are marked in bold; marginally significant (0.05 < p ≤ 0.10) differences are marked by an asterisk (*).
| Sampling Period | Aquatic Regime | River System | Functional Traits |
|---|
| p | AUT | SUM | SPR | p | INT | PER | p | V | B |
|---|
| Cell size (µm3) |
| <0.05 | 44.2 ± 6.0 | 35.9 ± 5.9 | 22.8 ± 4.2 | 0.293 | 29.2 ± 4.8 | 35.3 ± 4.4 | 0.177 | 26.7 ± 4.1 | 38.4 ± 4.9 | Nano (%) |
| 0.489 | 21.6 ± 4.2 | 20.8 ± 4.1 | 16.3 ± 3.2 | 0.150 | 22.3 ± 3.5 | 16.6 ± 2.5 | <0.05 | 23.3 ± 2.9 | 14.9 ± 3.0 | Micro (%) |
| <0.05 | 18.8 ± 2.8 | 27.9 ± 3.7 | 44.2 ± 5.1 | 0.233 | 36.3 ± 4.7 | 29.2 ± 3.6 | 0.525 | 32.6 ± 3.7 | 32.2 ± 4.6 | Meso (%) |
| 0.331 | 10.3 ± 3.2 | 7.3 ± 1.4 | 12.7 ± 2.7 | 0.533 | 9.0 ± 1.8 | 11.2 ± 2.2 | 0.697 | 10.3 ± 2.1 | 10.1 ± 2.1 | Macro (%) |
| 0.117 | 5.1 ± 1.6 | 8.0 ± 2.7 | 3.9 ± 0.8 | <0.05 | 3.1 ± 0.7 | 7.7 ± 1.8 | 0.633 | 6.9 ± 2.0 | 4.3 ± 0.8 | Very large (%) |
| Guilds |
| 0.711 | 45.9 ± 4.2 | 52.5 ± 5.5 | 48.4 ± 5.7 | <0.05 | 56.1 ± 4.2 | 43.7 ± 4.3 | 0.841 | 49.8 ± 4.4 | 48.7 ± 4.6 | Low-profile (%) |
| 0.155 | 14.5 ± 4.1 | 15.8 ± 3.7 | 24.1 ± 4.9 | 0.192 | 16.2 ± 3.4 | 21.0 ± 3.8 | 0.235 | 21.8 ± 3.9 | 16.0 ± 3.5 | High-profile (%) |
| 0.150 | 39.0 ± 5.4 | 31.2 ± 5.6 | 26.9 ± 5.0 | 0.269 | 26.0 ± 4.2 | 35.6 ± 4.5 | 0.717 | 27.9 ± 3.9 | 34.7 ± 4.9 | Motile (%) |
| Spreading |
| 0.176 | 28.9 ± 5.0 | 25.3 ± 5.1 | 16.9 ± 3.6 | 0.349 | 20.0 ± 3.9 | 24.9 ± 3.6 | 0.084 * | 18.1 ± 3.2 | 27.4 ± 4.2 | Pioneer (%) |
| Moisture preference |
| 0.125 | 3.4 ± 0.8 | 3.3 ± 1.0 | 6.5 ± 1.4 | 0.116 | 6.3 ± 1.5 | 3.2 ± 1.6 | 0.165 | 4.0 ± 0.9 | 5.3 ± 1.0 | Strictly aquatic (%) |
| 0.445 | 9.9 ± 2.2 | 15.0 ± 3.8 | 13.4 ± 4.3 | <0.001 | 4.8 ± 1.5 | 19.8 ± 3.5 | 0.404 | 15.2 ± 3.6 | 11.0 ± 2.7 | Occasional aerophilic (%) |
| 0.573 | 55.3 ± 4.8 | 49.8 ± 5.1 | 56.0 ± 4.4 | 0.059 * | 60.1 ± 3.9 | 47.1 ± 3.7 | 0.136 | 48.5 ± 4.4 | 59.7 ± 4.1 | Aquatic-subaerial (%) |
| 0.119 | 2.9 ± 1.1 | 5.7 ± 3.4 | 2.4 ± 1.6 | 0.822 | 3.6 ± 1.5 | 3.8 ± 2.2 | 0.557 | 2.9 ± 1.3 | 4.5 ± 2.5 | Aerophilic (%) |
| Oxygen demand |
| 0.394 | 17.8 ± 4.7 | 9.8 ± 2.7 | 14.4 ± 3.3 | 0.804 | 13.5 ± 2.6 | 13.6 ± 3.0 | 0.897 | 12.5 ± 2.0 | 14.6 ± 3.5 | Polyoxybiontic (%) |
| 0.966 | 32.9 ± 4.4 | 39.2 ± 5.3 | 37.7 ± 4.9 | <0.01 | 27.6 ± 3.9 | 44.7 ± 3.4 | 0.116 | 32.7 ± 4.1 | 41.4 ± 3.9 | Oxybiontic (%) |
| 0.474 | 17.9 ± 3.7 | 24.9 ± 6.1 | 31.1 ± 6.2 | <0.01 | 37.7 ± 5.7 | 16.2 ± 3.3 | 0.062 * | 31.5 ± 5.2 | 19.9 ± 4.5 | Moderate (%) |
| ≤0.01 | 11.5 ± 2.3 | 8.2 ± 2.2 | 4.3 ± 0.9 | 0.499 | 8.3 ± 1.7 | 6.7 ± 1.3 | 0.846 | 6.3 ± 1.3 | 8.5 ± 1.7 | Low (%) |
| Saprobity |
| 0.364 | 3.2 ± 1.0 | 1.7 ± 0.4 | 1.8 ± 0.7 | 0.442 | 1.8 ± 0.5 | 2.4 ± 0.6 | 0.574 | 1.9 ± 0.5 | 2.4 ± 0.6 | Oligosaprobous (%) |
| 0.927 | 48.9 ± 5.3 | 49.0 ± 5.0 | 51.1 ± 5.5 | <0.001 | 38.8 ± 4.7 | 58.7 ± 3.1 | 0.193 | 46.2 ± 4.5 | 53.5 ± 4.1 | β-mesosaprobous (%) |
| 0.248 | 18.3 ± 3.2 | 15.9 ± 3.4 | 25.2 ± 5.0 | <0.001 | 31.2 ± 4.4 | 11.5 ± 1.6 | 0.231 | 21.5 ± 3.2 | 19.1 ± 4.0 | α-mesosaprobous (%) |
| <0.05 | 16.9 ± 3.5 | 17.3 ± 4.1 | 11.4 ± 2.8 | <0.05 | 19.1 ± 3.2 | 11.3 ± 2.4 | 0.090 * | 17.4 ± 2.8 | 12.1 ± 2.9 | α-meso-polysaprobous (%) |
| 0.815 | 0.6 ± 0.3 | 1.5 ± 0.9 | 1.1 ± 0.4 | 0.109 | 0.6 ± 0.2 | 1.6 ± 0.6 | 0.583 | 0.8 ± 0.3 | 1.4 ± 0.6 | Polysaprobous (%) |
| Trophic state |
| 0.421 | 4.5 ± 1.5 | 2.2 ± 0.4 | 4.6 ± 1.4 | 0.180 | 3.4 ± 1.2 | 4.1 ± 0.9 | 0.626 | 4.3 ± 1.2 | 3.2 ± 0.8 | Meso-eutraphentic (%) |
| 0.557 | 62.5 ± 4.7 | 57.5 ± 4.2 | 56.3 ± 4.5 | 0.603 | 59.9 ± 4.0 | 56.8 ± 3.4 | 0.983 | 56.7 ± 3.1 | 59.7 ± 4.2 | Eutraphentic (%) |
| 0. 4 | 0.5 ± 0.4 | 5.1 ± 3.4 | 1.6 ± 0.4 | 0.156 | 1.2 ± 0.2 | 3.7 ± 2.0 | 0.164 | 1.1 ± 0.3 | 4.1 ± 2.4 | Hypereutraphentic (%) |
| 0.189 | 19.8 ± 4.4 | 20.9 ± 3.4 | 27.6 ± 3.7 | 0.296 | 25.9 ± 3.1 | 21.3 ± 3.0 | 0.174 | 25.4 ± 2.4 | 21.4 ± 3.7 | Indifferent (%) |
Table 5.
The results of a comparison of the means (±SE) of various measures of taxonomic and functional diversity through a three-way ANOVA of the effects of river system, aquatic regime and sampling period. Factor levels: river system—Bükkösdi (B) and Völgységi (V); aquatic regime—permanent (PER) and intermittent (INT); sampling period—spring (SPR), summer (SUM), and autumn (AUT). Significant (p ≤ 0.05) differences are marked in bold; marginally significant (0.05 < p ≤ 0.10) differences are marked by an asterisk (*).
| Sampling Period | Aquatic Regime | River System | Measures |
|---|
| p | AUT | SUM | SPR | p | INT | PER | p | V | B |
|---|
| Taxonomic diversity |
| <0.05 | 43.8 ± 3.6 | 41.1 ± 3.0 | 33.2 ± 1.9 | <0.05 | 34.1 ± 2.4 | 42.1 ± 2.2 | <0.01 | 34.1 ± 2.1 | 43.0 ± 2.5 | Species richness |
| <0.05 | 3.8 ± 0.2 | 3.5 ± 0.2 | 3.1 ± 0.2 | 0.065 * | 3.2 ± 0.2 | 3.6 ± 0.1 | 0.409 | 3.5 ± 0.1 | 3.3 ± 0.2 | Shannon’s diversity |
| 0.129 | 0.71 ± 0.02 | 0.65 ± 0.03 | 0.62 ± 0.03 | 0.155 | 0.63 ± 0.03 | 0.68 ± 0.02 | 0.056 * | 0.69 ± 0.02 | 0.62 ± 0.03 | Pielou’s evenness |
| Functional diversity |
| <0.05 | 3.2 ± 0.8 | 3.1 ± 0.6 | 1.4 ± 0.4 | 0.063 * | 1.7 ± 0.5 | 3.0 ± 0.4 | 0.127 | 2.0 ± 0.4 | 2.9 ± 0.5 | Log FRic |
| 0.800 | 0.61 ± 0.02 | 0.60 ± 0.02 | 0.59 ± 0.01 | 0.476 | 0.60 ± 0.01 | 0.59 ± 0.01 | 0.102 | 0.58 ± 0.01 | 0.61 ± 0.01 | FEve |
| <0.05 | 0.61 ± 0.02 | 0.62 ± 0.02 | 0.71 ± 0.03 | <0.05 | 0.69 ± 0.02 | 0.63 ± 0.02 | 0.789 | 0.67 ± 0.03 | 0.65 ± 0.02 | FDiv |
| 0.130 | 0.23 ± 0.01 | 0.21 ± 0.01 | 0.18 ± 0.02 | 0.120 | 0.19 ± 0.01 | 0.21 ± 0.01 | 0.967 | 0.20 ± 0.01 | 0.20 ± 0.01 | FDis |
Table 6.
The results of a comparison of the means (±SE) of species richness in trait categories whose relative abundance showed a significant response to the effects of river system and aquatic regime. Factor levels: river system—Bükkösdi (B) and Völgységi (V); aquatic regime—permanent (PER) and intermittent (INT). Significant (p ≤ 0.05) differences are marked in bold; marginally significant (0.05 < p ≤ 0.10) differences are marked by an asterisk (*).
| Aquatic Regime | River System | Trait Categories |
|---|
| p | INT | PER | p | V | B |
|---|
| 0.223 | 7.8 ± 0.9 | 9.5 ± 0.6 | 0.087 * | 7.8 ± 0.6 | 9.7 ± 0.8 | Micro-sized taxa |
| <0.05 | 3.5 ± 0.5 | 5.5 ± 0.4 | 0.075 * | 4.0 ± 0.5 | 5.2 ± 0.4 | Large taxa |
| <0.01 | 7.7 ± 0.5 | 10.2 ± 0.6 | 0.347 | 8.7 ± 0.4 | 9.4 ± 0.8 | Low-profile guild |
| <0.01 | 3.0 ± 0.3 | 5.4 ± 0.5 | <0.001 | 3.2 ± 0.4 | 5.4 ± 0.5 | Occasional aerophilic |
| 0.610 | 13.2 ± 0.9 | 14.3 ± 0.8 | <0.05 | 12.6 ± 0.7 | 15.0 ± 0.9 | Aquatic-subaerial |
| 0.090 * | 8.5 ± 0.6 | 10.4 ± 0.5 | <0.001 | 8.1 ± 0.6 | 10.9 ± 0.4 | Oxybiontic |
| 0.429 | 5.8 ± 0.4 | 6.6 ± 0.4 | <0.01 | 5.4 ± 0.3 | 7.0 ± 0.4 | Moderate O2 demand |
| <0.05 | 11.3 ± 0.8 | 14.5 ± 0.7 | <0.05 | 11.9 ± 0.7 | 14.3 ± 0.8 | β-mesosaprobous |
| 0.375 | 6.1 ± 0.6 | 7.3 ± 0.6 | <0.05 | 5.7 ± 0.5 | 7.9 ± 0.6 | α-mesosaprobous |
| 0.132 | 5.0 ± 0.4 | 4.6 ± 0.4 | <0.05 | 4.1 ± 0.3 | 5.4 ± 0.4 | α-meso-polysaprobous |
Table 7.
The results of a comparison of the means (±SE) of water quality diatom indices through a three-way ANOVA of the effects of river system, aquatic regime, and sampling period. Factor levels: river system—Bükkösdi (B) and Völgységi (V); aquatic regime—permanent (PER) and intermittent (INT); sampling period—spring (SPR), summer (SUM) and autumn (AUT). Significant (p ≤ 0.05) differences are marked in bold.
| Sampling Period | Aquatic Regime | River System | Index |
|---|
| p | AUT | SUM | SPR | p | INT | PER | p | V | B |
|---|
| <0.05 | 13.2 ± 0.5 | 13.6 ± 0.6 | 14.9 ± 0.3 | 0.634 | 14.2 ± 0.4 | 13.8 ± 0.4 | 0.501 | 14.2 ± 0.3 | 13.9 ± 0.5 | IPS |
| 0.766 | 6.9 ± 0.3 | 6.5 ± 0.2 | 6.6 ± 0.4 | 0.155 | 6.2 ± 0.4 | 6.9 ± 0.3 | 0.887 | 6.7 ± 0.2 | 6.6 ± 0.3 | TI |
| 0.148 | 12.6 ± 0.2 | 12.3 ± 0.4 | 13.0 ± 0.2 | 0.814 | 12.7 ± 0.2 | 12.6 ± 0.3 | 0.222 | 12.9 ± 0.2 | 12.5 ± 0.3 | SI |
| 0.139 | 10.9 ± 0.3 | 10.8 ± 0.3 | 11.5 ± 0.2 | 0.707 | 11.1 ± 0.2 | 11.2 ± 0.2 | 0.391 | 11.3 ± 0.1 | 11.0 ± 0.3 | ISPITI |
