Abstract
Due to global warming, extreme temperature events have become increasingly prevalent, posing significant threats to both socioeconomic development and human safety. While previous studies have extensively examined the influence of individual climatic circulation systems on extreme temperature, the combined effects of multiple concurrent circulation patterns remain poorly understood. Using daily temperature data from 29 meteorological stations in Chongqing (1960–2019), this study employs linear trend analysis, correlation analysis, and random forest (RF) models to analyze spatiotemporal variations in the intensity and frequency of extreme temperature. We selected 21 climate indicators from three categories—atmospheric circulation, sea surface temperature (SST), and sea-level pressure (SLP)—to identify the primary drivers of extreme temperatures and quantify their respective contributions. The key findings are as follows: (1) All extreme intensity indices exhibited an increasing trend, with the TXx (annual maximum daily maximum temperature) showing the higher trend (0.03 °C/year). The northeastern region experienced the most pronounced increases. (2) Frequency indices also displayed an upward trend. This was particularly evident for the TD35 (number of days with maximum temperature ≥35 °C), which increased at an average rate of 0.16 days/year, most notably in the northeast. (3) The Western Pacific Subtropical High Ridge Position Index (GX) and Asia Polar Vortex Area Index (APV) were the dominant climate factors driving intensity indices, with cumulative contributions of 26.0% to 33.4%, while the Western Pacific Warm Pool Strength Index (WPWPS), Asia Polar Vortex Area Index (APV), North Atlantic Subtropical High Intensity Index (NASH), and Indian Ocean Warm Pool Strength Index (IOWP) were the dominant climate factors influencing frequency indices, with cumulative contributions of 46.4 to 49.5%. The explanatory power of these indices varies spatially across stations, and the RF model effectively identifies key circulation factors at each station. In the future, more attention should be paid to urban planning adaptations, particularly green infrastructure and land use optimization, along with targeted heat mitigation strategies, such as early warning systems and public health interventions, to strengthen urban resilience against escalating extreme temperatures.
1. Introduction
According to the sixth assessment report of the intergovernmental panel on climate change (IPCC, 2021), the global average surface temperature in 2011–2020 was 1.1 °C higher than that recorded during 1850–1900 [1]. In China, the temperature has increased by 0.26 °C per decade since 1951—nearly double the global average increase of 0.15 °C per decade over the same period. The China Climate Change Blue Book emphasizes that China is both a highly sensitive and significantly impacted region in the context of global climate change [2,3]. Projections by the WMO indicate that extreme high-temperature events will intensify, characterized by greater intensity, a prolonged duration, and increased frequency. These changes pose severe risks to natural ecosystems, socioeconomic stability, and public health [4,5], with heatwaves already ranking as the deadliest weather-related disaster [6]. Between 2000 and 2019, extreme heat caused an estimated 489,000 annual deaths globally, and by 2100, half of the world’s population could face life-threatening heatwaves [7]. In light of these threats, understanding the spatiotemporal patterns and driving mechanisms of extreme temperatures is critical for mitigation and adaptation strategies [8].
Numerous countries and regions worldwide—particularly Western Europe, North America, and East Asia—are experiencing increasingly severe extreme high-temperature events [9,10]. Previous studies indicate that Western Europe has warmed at a rate of 0.74 °C per global warming degree (GWD) over the past 70 years—a faster increase than that observed in other regions [11]. In the US, the frequency of extreme high-temperature events rose by approximately 20% between 1983 and 2023, while heatwave duration extended from 30 to 70 days [12]. East Asia has experienced approximately 2 °C of warming relative to pre-industrial levels [13]. Meanwhile, China has faced growing threats from extreme heat, particularly in the middle and lower Yangtze River Basin, Huai River Basin, and Sichuan Basin, which have emerged as high-frequency zones for such events [14,15]. Projections suggest that these regions will experience further intensification of extreme temperatures in the coming decades. Existing studies have primarily characterized extreme high-temperature events through metrics such as maximum values, frequency, and duration [16,17].
The factors driving extreme high temperatures have emerged as a key focus of current climate research. Scholars typically examine the impact of atmospheric circulation patterns on regional heat events, with studies demonstrating that the Western Pacific Subtropical High and El Niño–Southern Oscillation significantly influence temperature extremes in China [18,19,20]. Conventional approaches using linear regression and composite analysis have established important relationships between circulation patterns and extreme heat. However, existing research is limited by its predominant reliance on single-variable correlation analysis, with few studies examining the coupled effects of multiple circulation elements [21]. In reality, extreme heat events result from complex interactions between atmospheric circulation, sea surface temperatures, sea-level pressure, and local topography, which introduce substantial variability and uncertainty. Single-variable linear correlation methods have proven inadequate for uncovering the underlying formation mechanisms. Future research should prioritize multivariate analysis to better understand the synergistic effects of these factors. Such approaches would enable a more accurate identification of dominant drivers and provide a stronger scientific foundation for a predictive modeling of extreme heat events.
As one of China’s most heat-vulnerable regions, Chongqing has experienced increasingly severe extreme high-temperature events under global climate change. In recent years, researchers have witnessed a notable intensification in both the duration and severity of heatwaves, exemplified by two extreme events in July 2022 and August 2024 that resulted in temperatures exceeding 35 °C for up to 70 days. The 2024 heatwave alone resulted in RMB 3.33 billion in direct economic losses, severely impacting urban infrastructure and public health [22,23]. Existing research on Chongqing’s thermal extremes remains limited in temporal scope and analytical depth. Although Zhang et al. examined temperature frequency and intensity from 1961 to 2006 [24] and Cheng et al. identified the Yangtze and Wujiang River basins as high-temperature hotspots, most of the existing studies were conducted prior to 2015 and focus primarily on occurrence trend analysis rather than causal mechanisms [25]. This knowledge gap hinders both the understanding of heatwave formation and the development of effective mitigation strategies. To address these limitations, this study employs daily temperature data from 29 meteorological stations and applies a random forest model to systematically investigate the nonlinear relationships between circulation patterns and extreme temperatures. Our approach aims to (1) elucidate the complex drivers of heat extremes in Chongqing and (2) enhance predictive capabilities to support climate adaptation planning and heat-risk management in mountainous urban areas.
2. Study Area and Dataset
2.1. Study Area
Chongqing covers an area of 82,400 km2 and has predominantly mountainous and hilly terrain (75.8% of the total area) [26]. The topography exhibits distinct regional variations: higher elevations dominate the southeast and northeast, while lower elevations characterize the central and western regions, gradually descending along the Yangtze River valley from north to south [27]. The northeast is framed by the Daba and Wushan Mountains, whereas the south is traversed diagonally by the Dalou and Wuling Mountains, with parallel ridges and valleys predominating in the central region (Figure 1a). It has a subtropical humid monsoon climate, with rain and heat occurring during the same period (summer: June–July–August), and any extreme temperature event occurred during summer [28]. In recent decades, there has been an increase in both the frequency and intensity of extreme high-temperature events, with profound impacts on urban infrastructure, public health, and agricultural productivity. The July–August 2022 heatwave set multiple records that were originally established in 1961, including the highest average temperature, maximum number of hot days, and peak intensity [29]. Seventeen districts reported unprecedented temperatures, which affected 2.72 million residents and caused CNY 3.56 billion in direct economic losses [30]. As shown in Figure 1b, the annual average temperature distribution displays marked spatial heterogeneity, which can be divided into four climatic zones, namely northeast, southeast, central, and western. High-temperature centers cluster in central and western plains/hills, while low-temperature areas concentrate in southeastern and northeastern high-altitude mountains. Representative extreme-temperature stations include Fengjie (northeast), Zhongxian (central), Shapingba (western), and Youyang (southeast).
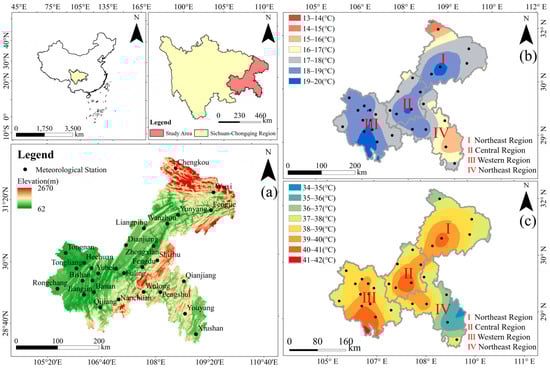
Figure 1.
Overview of Chongqing. (a) Distribution of the region’s topography and meteorological stations; (b) annual average temperature; and (c) annual maximum temperature.
2.2. Data Sources
This study utilizes maximum temperature data from the China Meteorological Data Service Center (http://data.cma.cn (accessed on 30 September 2024)); the station metadata are presented in Table 1. To maintain data integrity, we applied linear regression interpolation for stations with minor data gaps (0.005–0.42% missing rates in Wanzhou, Changshou, Fuling, and Wulong) using contemporaneous data from neighboring stations for imputation. Stations with more than 1.5% of their data missing (Tiancheng, Wansheng, Wushan, and Kaixian) were excluded from the analysis. Previous studies indicated that atmospheric circulation was a principal driver of extreme heat events [31,32]. For example, the Yangtze River Basin heatwave in 2022 was associated with an anomalously intense and westward-extending Western Pacific Subtropical High [33]. In this study, we select 21 climatic indices, including 13 atmospheric circulation, 6 SST, and 2 SLP indices (Table 2, sourced from the National Climate Center: http://cmdp.ncc-cma.net/cn/download.htm (accessed on 30 September 2024)). These were selected to identify the key factors influencing extreme temperature indices in Chongqing.

Table 1.
Basic information of selected meteorological stations in Chongqing.
Table 2.
The large-scale climate driving indices and their abbreviations used in this study.
3. Methodology
This study comprises the two following key components: (1) an analysis of the spatiotemporal characteristics of extreme temperatures, and (2) an investigation of their climatic drivers. In pursuit of the former, we employed linear regression, Mann–Kendall (M-K) trend tests, and Pettitt tests to examine the spatiotemporal evolution of four extreme temperature indices. The second component involved conducting both single-factor (Pearson correlation) and multi-factor (RF model) analyses to identify relationships between extreme temperature indices and climatic drivers.
3.1. Extreme Temperature Indices
The RClimDex model, developed by Zhang et al. at the Canadian Meteorological Research Center using the R software version 4.3.3, provides an efficient platform for computing extreme climate indices [34]. This tool simplifies the calculation process and can generate 16 extreme temperature indices. For our analysis, we employed RClimDex to calculate the TXx (annual maximum daily maximum temperature) and TNn (annual minimum daily minimum temperature). Following established meteorological standards, we adopted the China Meteorological Administration’s definition of extreme high temperatures as daily maximum temperatures exceeding 35 °C—a threshold associated with significant health risks and adverse impacts [35]. We also incorporated the international criterion of daily minimum temperatures above 20 °C, which is particularly relevant for agricultural and industrial systems [36,37]. Based on these standards, our study focuses on four key extreme temperature indices (shown in Table 3), which are TXx, TXn, TD35, and TR20.
Table 3.
Description of extreme temperature indexes used in this study.
3.2. Mann–Kendall Test
We employed the non-parametric M-K trend test to analyze extreme temperature indices. This test was selected for its robustness to non-normal distributions and outliers. The analysis was performed at both 0.05 and 0.01 confidence levels. The standardized test statistic (Z) was calculated from the M-K statistic and its variance (with adjustment for tied values), where a statistically significant positive Z value indicates an increasing trend, while a significant negative Z value denotes a decreasing trend [38].
3.3. Attribution Analysis of Extreme Temperature Changes
3.3.1. Selection of Climate Driving Factors
To address potential multicollinearity among the climate factors listed in Table 2, we implemented a two-step variable selection procedure [39]. First, we calculated Pearson correlation coefficients between all climate factors to identify highly correlated variable groups. We then applied principal component analysis (PCA) to these groups and noted the presence of multicollinearity when the vector angle between factors was less than 30° (Figure 2). Through this screening process, we excluded seven redundant climate factors, namely the Niño 4, MEI, IOWPA, IOSHA, WPSHA, AHA, and WPWPA. As a result, 14 climate factors were retained for subsequent analysis. Recognizing the potential lagged effects of climate factors on extreme temperatures, we identified optimal lag times by computing Pearson correlation coefficients across 0–12-month lags. For each factor, we selected the lag period that showed the maximum correlation with extreme temperatures. We then used these optimally lagged climate factors in our attribution analysis of extreme high-temperature events.
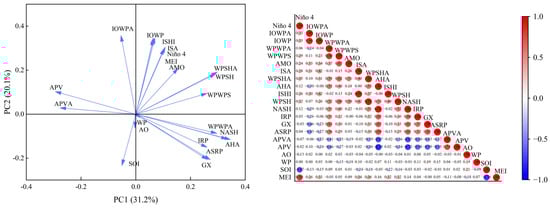
Figure 2.
Multicollinearity analysis between pairwise atmospheric circulation indices.
3.3.2. Random Forest
The RF model is an ensemble machine learning method that utilizes bootstrap aggregation (bagging) to enhance predictive performance, as this model excels at handling nonlinear relationships between multiple factors [40]. For every bootstrap subset, the method builds a decision tree, where each tree is trained on a randomly selected portion of the data to improve the model’s generalization performance. This algorithm operates by (1) generating multiple bootstrap samples from the original dataset, (2) constructing a decision tree for each sample using randomly selected subsets of predictors at each node, and (3) aggregating predictions across all trees. This approach significantly improves model generalization and demonstrates robust performance in both classification and regression tasks.
In the RF model, the incremental mean squared error (IMSE) is typically employed as a key indicator for evaluating the importance of individual factors. In this study, we applied normalization to scale the cumulative factor importance to 100%, enabling us to accurately derive the relative contribution of each factor. The formula is as follows:
where represents the extent to which the factor contributes to extreme high temperature; indicates the importance of the factors; and the total of across all factors is equal to 1.
4. Results
4.1. Long-Term Changes in Selected Extreme Temperature Indices
Figure 3 illustrates the temporal evolution of four extreme temperature indices at Shapingba station, which has been selected as Chongqing’s national representative station. All indices exhibit significant increasing trends, with maximum values predominantly occurring post-2000, indicating heightened exposure to extreme temperature risks. This pattern was consistently observed across other stations. We identified abrupt change points in four indices using Pettitt’s test [41]. Three indices (TXx, TD35, and TR20) showed change points around 2000, while TXn exhibited an earlier shift in 1985. These transitions likely reflect responses to global climate change, with the earlier TXn shift potentially indicating initial changes in minimum temperature extremes preceding other indices.
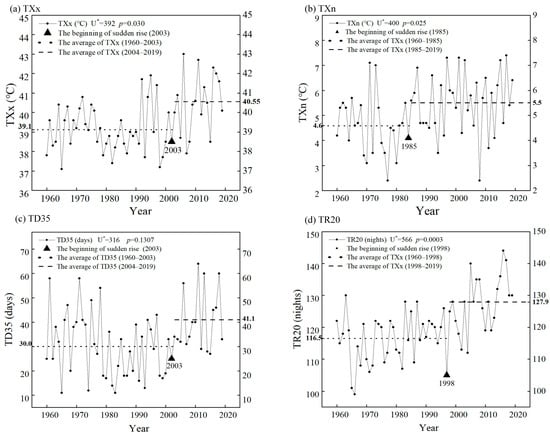
Figure 3.
Change evolution and potential abrupt changes in four selected extreme temperature indices in a typical station (Shapingba in region III) from 1960 to 2019. U* and p represent the statistical and significance level of the Pettitt test, respectively.
4.2. Changes in Intensity of Extreme Temperature
Figure 4 presents the spatial distribution of extreme temperature intensity, as measured by TXx and TXn indices. Our analysis reveals a predominant increasing trend in TXx across most stations, with considerable spatial variability in warming rates (−0.0065 to 0.166 °C/year). The most pronounced warming occurred at Qianjiang station (0.166 °C/year) in the southeastern region, while Banan station in the western region showed a marginal cooling trend (−0.0065 °C/year). Notably, only three stations (Tongnan, Banan, and Youyang) exhibited slight decreases. Regional analysis demonstrates distinct spatial patterns: the western region displayed the most significant warming (0.028–0.035 °C/year), while the central region showed minimal change with near-zero growth rates. The TXn analysis reveals a similar (predominantly increasing) trend, though with reduced magnitude compared to TXx (0.01–0.09 °C/year). The strongest warming effect occurs at Fengjie station in the northeast (0.09 °C/year), while Banan station in the west again shows minimal cooling (−0.01 °C/year). Spatially, the northeast exhibits the most pronounced increases (0.05–0.10 °C/year) in contrast with the southeast, where trends approach zero. These findings highlight substantial spatial heterogeneity in extreme temperature trends across Chongqing.
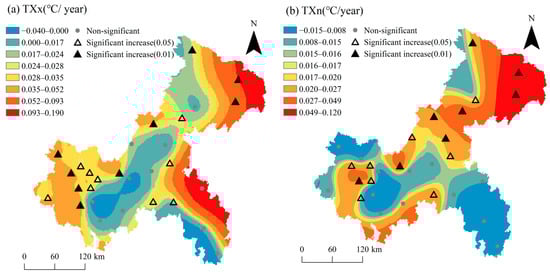
Figure 4.
Spatial trends of extreme temperature intensity from 1960 to 2019 in Chongqing.
The M-K test results reveal statistically significant trends for both TXx and TXn indices at most stations. For TXx, 62% of stations showed a significance level of 0.05, with 31% reaching a significance level of 0.01. The corresponding figures for TXn were 55% and 27%, respectively. Spatially, stations with higher significance levels clustered predominantly in the western region, where 75% (TXx) and 50% (TXn) of stations achieved a significance level of 0.05. In contrast, most southeastern stations failed to achieve statistical significance at either level. Notably, Wuxi (TXx) and Fengjie (TXn) demonstrated the strongest significance, indicating particularly pronounced trends in these locations. These results collectively demonstrate more robust temperature trends in western compared to southeastern Chongqing.
Figure 5 presents the decadal evolution of extreme temperature intensity indices across Chongqing. Spatially, high-value areas consistently concentrate along the Yangtze River valley, while low-value centers persist in southeastern and northeastern mountainous regions. Regarding TXx, since the 1960s, most districts and counties in Chongqing have recorded TXx values exceeding 38 °C, with only a few stations in the central and southwestern regions surpassing 40 °C. From the 1970s onward, high-value areas began to expand, followed by a further notable increase in the 2000s. The most significant expansion occurred in the 2010s, when areas with TXx ≥ 40 °C accounted for approximately half of the entire city, indicating a substantial intensification of extreme maximum temperature intensity. The evolution of TXn shows a similar trend: in the 1960s, most areas, except for some parts of the central and western regions, recorded TXn values below 2.5 °C. Although there was a brief decline in the 1970s and 1980s, TXn has steadily risen since the 1990s. By the 2010s, areas with TXn ≥ 5 °C had expanded significantly, covering about 50% of the region. Overall, both intensity indices have exhibited a consistent upward trend over the past 60 years, with only a slight decline in the 1970s and 1980s. The most pronounced increase occurred between the 2000s and 2010s, during which the area with TXx values reaching 40–43 °C expanded by nearly one-third, and the area with TXn values reaching 5–7.5 °C increased by approximately one-fifth. This indicates a rapid expansion of extreme high temperatures from the central axis of the Yangtze River to the surrounding regions.
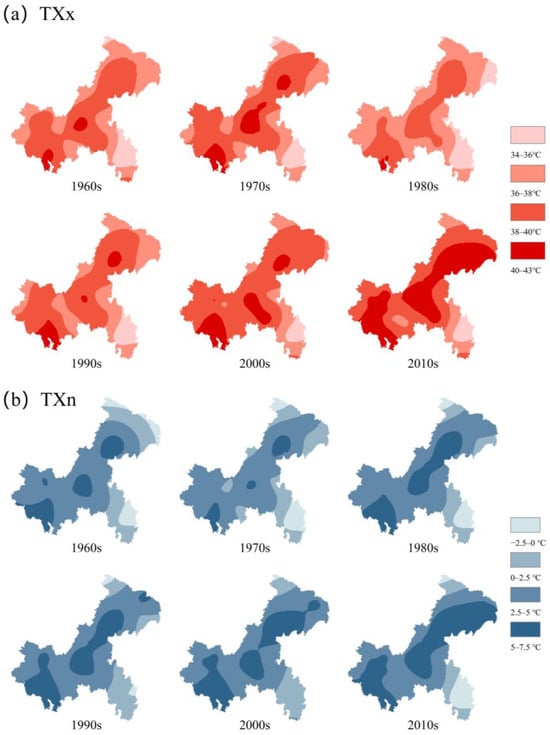
Figure 5.
Spatial changes in extreme temperature intensity in each decade from 1960 to 2019.
4.3. Changes in Frequency of Extreme Temperatures
Figure 6 displays the spatial distribution of extreme temperature frequency trends as measured by TD35 and TR20. The TD35 index shows a predominantly increasing trend across most stations, though considerable spatial variability is observed (−0.16 to 0.77 days/year). The most pronounced increase occurs at Wuxi station in the northeastern mountains (0.77 days/year), while Banan station in the southern urban core shows a marginal decrease (−0.16 days/year). The northeastern region exhibits the strongest warming trend, with multiple stations exceeding 0.10 days/year. Southwestern and central regions demonstrate more moderate changes, ranging from slow increases to near-stable conditions. Only Banan station shows declining trends. These patterns highlight significant spatial heterogeneity in the intensification of extreme heat frequency across Chongqing’s diverse topography.
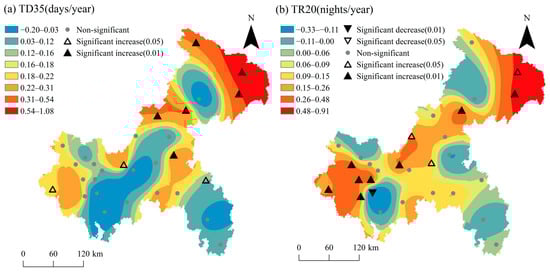
Figure 6.
Spatial trends of extreme temperature frequency from 1960 to 2019.
Similarly, the TR20 index demonstrates an increasing trend, reflecting more frequent nighttime high-temperature events across the region. Annual change rates range from −0.28 to 0.55 days/year, with Fengjie station showing the most significant increase (0.55 days/year) and Banan station in the southeastern hills exhibiting the largest decrease (−0.28 days/year). Western regions show the strongest warming trend at multiple stations (>0.1 days/year), while southeastern areas display minimal change overall, with some localized decreases. These patterns indicate substantial regional variability in nighttime temperature extremes, with western Chongqing experiencing the most pronounced increases in tropical night frequency.
The M-K trend test results reveal statistically significant trends for both frequency indices across multiple monitoring stations. For TD35 (days ≥ 35 °C), 31% of stations showed significant trends at 0.05, with 20% reaching a significance level of 0.01. Wuxi station exhibited the strongest statistical confidence for this index. The TR20 index demonstrated even greater significance, with 38% of stations achieving a significance level of 0.05 and 27% achieving a significance level of 0.01, with Shapingba station showing the most robust trend.
Figure 7 presents the decadal evolution of extreme temperature frequency indices (TD35 and TR20) across Chongqing. Spatially, high-frequency zones consistently concentrate along the Yangtze River valley, while low-frequency areas persist in the southeastern and northeastern highlands. For TD35, central/western regions experienced more than 20 hot days/year, while southeastern/northeastern areas remained below this threshold in the 1960s. From the 1970s onward, high-frequency hot day zones (TD35) progressively expanded outward, undergoing accelerated growth during the 2000s. This spatial propagation peaked in the 2010s, when areas experiencing more than 40 hot days annually encompassed approximately 67% of Chongqing’s metropolitan area, demonstrating a substantial intensification of extreme heat frequency. The trend of TR20 aligns closely with that of TD35. During the 1960s, TR20 exceeded 90 hot nights/year only in localized areas of central and western Chongqing, with most regions recording fewer than 60 hot nights. This pattern shifted markedly by the 2010s, when conditions involving more than 90 tropical nights/year expanded to encompass approximately 67% of the study area, representing a substantial increase in both the frequency and spatial extent of tropical nights.
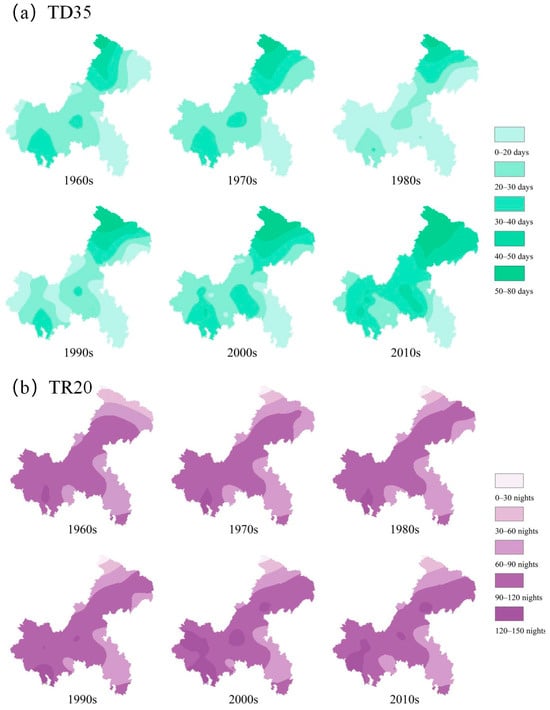
Figure 7.
Spatial changes in extreme temperature frequency in each decade from 1960 to 2019.
Overall, both TD35 and TR20 indices demonstrated sustained increasing trends, interrupted only by a temporary decline in TD35 during the 1970s–1980s when 20–30 hot day zones contracted by nearly 50%. The most substantial expansion occurred during the 2000–2010 period, with the number of regions experiencing 30–40 annual hot days (TD35) increasing by 33%, and areas with more than 5 °C TR20 growing by 20%. These trends reveal a synchronous expansion in both the frequency and spatial coverage of extreme heat events, radiating outward from Chongqing’s Yangtze River corridor and urban centers under persistent warming conditions.
4.4. Attribution Analysis of CLIMATE Indices on Extreme Temperature
Figure 8 depicts the correlation matrix between 14 climatic drivers and four extreme temperature indices. Significant correlations (p < 0.05) between multiple climatic factors and all temperature indices can be observed, with optimal lag times predominantly occurring during June–August. The strongest associations are observed for seven circulation indices, namely IOWP, IRP, APVI, APVA, GX, ASRP, and NASH. TXx shows negative correlations with IOWP, IRP, WP, GX, ASRP, and NASH, while TXn exhibits positive correlations with these same indices. TXx exhibits positive correlations with APVI, APVA, WPWPS, and WPSH, whereas TXn shows negative correlations. As for TD35 and TR20, they were both positively correlated with IOWP, IRP, GX, ASRP, NASH, and WPSH and negatively correlated with APVI and APVA, respectively. These results highlight the dominant influence of regional circulation patterns on Chongqing’s extreme temperature variability, with particularly strong seasonal coupling during the summer months.
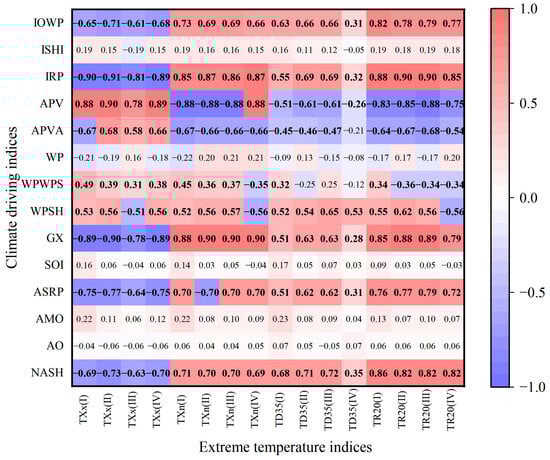
Figure 8.
Pearson’s correlation coefficient between extreme temperature indices and large-scale circulation. Bold font indicates a significance level of greater than 0.05.
We employed an RF model to quantify climatic drivers’ contributions to extreme temperature indices in Chongqing. To avoid overfitting the RF model, the dataset was split into 70% for calibration and 30% for validation. We conducted model calibration and validation for four typical stations. Their determination coefficients (R2) were greater than 0.85. As shown in Figure 9, the model calibration results for Shapingba station demonstrate strong predictive performance across all four indices, with determination coefficients (R2) exceeding 0.86 and root mean square errors (RMSEs) of less than 3.01. These robust validation metrics confirm the RF model’s suitability for forecasting extreme temperature patterns.
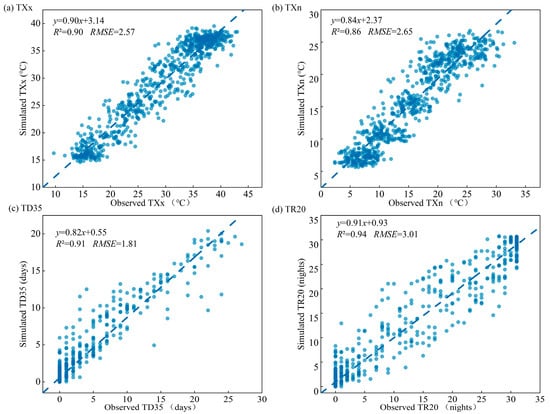
Figure 9.
Comparison between four extreme temperature indices (simulated and observed) of a typical station (Shapingba in region III) based on the RF model.
The contributions of individual atmospheric circulation indices are listed in Figure 10. As for intensity indices, we noted no significant regional difference in the contribution rates of various climate driving indices. Both GX and APV were the dominant climate driving factors influencing TXx and TXn. The cumulative contributions of GX and APV accounted for 29.7% (TXx) and 33.0% (TXn) at Shapingba (region III) compared to 26.0% and 33.4% at Fengjie (region I), respectively. According to Figure 8, both strong GX and weak APV could contribute to the occurrence of extremely high temperatures. Enhanced GX intensity promotes westward expansion, positioning Chongqing under a subsiding northwesterly airflow that suppresses convection and reduces cloud cover, thereby increasing surface solar radiation. APV reductions indicate polar vortex contraction, weakening cold air advection from mid-latitude regions. As for frequency indices, the dominant climate driving factor varied with different regions due to the randomness of TD35 and TR20. For example, NASH made the most significant contribution (16.3%) to TD35 in Fengjie (region I), and APV made the most significant contribution (15.1%) to TD35 in Shapingba (region III). Overall, WPWPS, APV, NASH, and IOWP were the dominant climate driving factors that affected TD35 and TR20, which indicates that the occurrence of extreme heat events is determined by multiple factors [42].
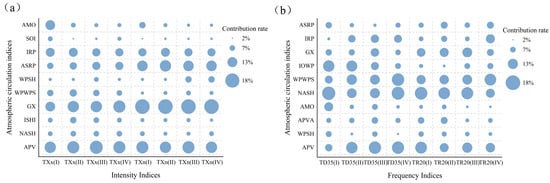
Figure 10.
Contribution of large-scale atmospheric circulations on extreme temperature indices in Chongqing. (a) Contribution rates (%) of large-scale circulation factors to intensity indices (TXx, TXn). (b) Contribution rates (%) of large-scale circulation factors to frequency indices (TD35, TR20).
5. Discussion
5.1. Variation Characteristics of Extreme Temperatures
Chongqing experienced significant warming from 1960 to 2019. Regarding the four extreme temperature indices discussed in this study, regardless of intensity or frequency indices, the overall average trend showed a sensitive response to global warming, with the change amplitude exceeding the global average [43]. Table 4 reveals the differences in the trends of extreme temperature indices in China’s other regions and the global land. While the study periods examined across different research papers vary slightly (within a 10-year range), this temporal discrepancy does not preclude meaningful qualitative comparisons. The TXx trend (0.30 °C/decade) in Chongqing was the highest among these studies, whose trends were reported to be almost twice those of the Yangtze River Basin (0.16 °C/decade). We also noted signs of sudden changes in Chongqing’s warming, with an abrupt increase in three extreme temperature indices (TXx, TD35, and TR20) around the year 2000. These observations are indicative of an increased likelihood of more frequent and severe extreme heat events in the coming decades [44,45,46].
The extreme temperature intensity in Chongqing is greater than that of other regions [47]. We used TD35 rather than TD25 (the number of days with a maximum temperature of ≥25 °C) to investigate extreme temperature frequency. Although the increasing trend of TD35 was lower than that of TD25 in other regions of China (Table 4), the TD35 trend showed greater significance compared to other indices, which may be attributed to the nonlinear response of the climate system due to complex topography [48].
Table 4.
Comparison of the change trends of extreme temperature indices in different regions.
Table 4.
Comparison of the change trends of extreme temperature indices in different regions.
| Regions | Period | TXx (°C/Decade) | TXn (°C/Decade) | TD35 (TD25) (Days/Decade) | TR20 (Nights/Decade) |
|---|---|---|---|---|---|
| Chongqing | 1960–2019 | 0.31 | 0.19 | 1.60 (TD35) | 1.30 |
| The Loess Plateau [49] | 1960–2013 | 0.20 | 0.30 | 4.17 (TD25) | 1.40 |
| The Yangtze River Basin [50] | 1962–2011 | 0.16 | 0.33 | 2.93 (TD25) | 1.80 |
| China land [51] | 1960–2010 | 0.17 | 0.32 | 1.90 (TD25) | 1.20 |
| Global land [43] | 1951–2015 | 0.11 | 0.28 | 0.47 (TD25) | 0.91 |
5.2. Climate Driving Factors of Extreme Temperatures
Extreme temperature events result from complex interactions among multiple factors, with atmospheric circulation patterns and sea–atmosphere interactions emerging as the two dominant drivers [52]. These systems regulate temperature extremes through dynamic and thermodynamic processes, often triggering cascading impacts across regional and global climates [53]. While previous studies have typically examined individual or limited climate indices, our analysis incorporates 21 indicators across three categories (atmospheric circulation, SST, and SLP) to comprehensively assess their combined influence on extreme temperatures. We employ an RF model to quantify these relationships, which captures the nonlinear responses of extreme temperatures to climatic drivers—a critical expansion of traditional linear methods (e.g., stepwise regression) that fails to account for such complexities [54].
Our analysis identifies GX and APV as the dominant climatic drivers of extreme temperature intensity (TXx and TXn) in Chongqing and suggests that WPWPS, APV, NASH, and IOWP primarily influence frequency indices (TD35 and TR20). Notably, Western Pacific Subtropical High indicators (i.e., GX and WPWPS) exhibit the strongest impacts on extreme temperatures, with GX modulating temperatures through atmospheric circulation anomalies and WPWPS acting via sea–atmosphere interactions [55,56]. These results are consistent with broader patterns observed across China, where the Western Pacific Subtropical High serves as the principal driver of extreme temperatures. Its anomalous westward extension enhances subsidence warming while suppressing cloud formation and precipitation [57]. Additional factors, including NASH, IOWP, and APV, also contribute to temperature extremes through distinct mechanisms: NASH influences the Yangtze River Basin via mid-latitude Rossby waves, while IOWP modulates the regional climate through Indian Ocean sea surface temperature anomalies. This multi-factor interplay underscores the complexity of extreme temperature formation [58]. The identified mechanisms align with findings by Qin et al. [59], who demonstrated that coupling between the South Asian High and WPSH exacerbated drought and extreme heat events in southern China during summer months.
Urbanization further exacerbates regional temperature increases through modifications to surface properties, anthropogenic heat emissions, and local circulation patterns, which have a particularly noticeable impact on the intensification of summer extreme heat events [60,61]. While numerous studies have documented this urban heat island effect in major Chinese cities such as Shanghai and Beijing [62,63], our analysis did not detect a pronounced urban heat island effect signal across the broader Chongqing area. However, the marked acceleration in extreme temperature trends observed circa 2000 coincides temporally with Chongqing’s rapid urbanization phase. Recent climate conditions have demonstrated an increasing prevalence of extreme temperatures under combined urbanization and climatic forcing [64]. This is evidenced by two record-breaking heat events (in July 2022 and August 2024) occurring within the past five years. These findings highlight the critical need to implement evidence-based urban planning adaptations—particularly green infrastructure development and land use optimization—along with targeted heat mitigation strategies, such as early warning systems and public health interventions, to strengthen urban resilience against escalating temperature extremes [65,66].
6. Conclusions
This study examined the spatiotemporal evolution of extreme temperature in Chongqing using daily temperature records from 29 meteorological stations (1960–2019). By applying a RF model, we quantify the nonlinear relationships between climatic drivers and extreme temperature indices, identifying dominant circulation factors. Key findings include
- (1)
- From the perspective of temporal changes, all extreme temperature indices exhibited obvious increasing trends, with TXx of 0.03 °C/year, TXn of 0.02 °C/year, TD35 of 0.16 days/year, and TR20 of 0.14 nights/year. Abrupt change points of all indices were identified at around 2000, except for TXn.
- (2)
- From the perspective of spatial changes, extreme temperature in most stations showed an increasing trend, with 58.6%, 55.2%, 31.0%, and 41.4% of stations beyond 0.05 significance level for TXx, TXn, TD35, and TR20, respectively.
- (3)
- RF models were established between extreme temperature indices and climate driving factors, with an R2 value for all stations more than 0.85. GX and APV were the dominant climate driving factors in TXx and TXn, with cumulative contributions of 26.0% to 33.4%, while WPWPS, APV, NASH, and IOWP were the main dominant climate driving factors in TD35 and TR20, with cumulative contributions of 46.4 to 49.5%.
Author Contributions
C.W.: writing—original draft, validation, investigation. Y.W.: conceptualization, supervision, and funding acquisition. C.L.: supervision and investigation. S.W., X.H., Z.Z. and S.Z.: data curation. All authors have read and agreed to the published version of the manuscript.
Funding
This research was funded by the National Natural Science Foundation of China (No. 42201045) and sponsored by the Natural Science Foundation of Chongqing, China (No. cstc2021jcyj-msxmX0692; CSTB2023NSCQ-MSX0632) and the Science and Technology Research Program of Chongqing Municipal Education Commission (No. KJZD-K202400501). The APC was funded by Yuefeng Wang.
Data Availability Statement
Data are available upon request to the corresponding author Yuefeng Wang.
Conflicts of Interest
The authors have no relevant financial or non-financial interests to disclose.
Abbreviations
The following abbreviations are used in this manuscript:
| TXx | The highest temperature of each month from the daily maximum temperature data |
| TXn | The lowest value of the highest temperature for each month from the daily maximum temperature data |
| TD35 | The number of days with a maximum temperature above 35 °C in each month from the daily maximum temperature data |
| TR20 | The number of days with a minimum temperature above 20 °C in each month from the daily minimum temperature data |
| SST | Sea surface temperature |
| SLP | Sea-level pressure |
| ISA | Indian Subtropical High Area Index |
| WPSHA | Western Pacific Subtropical High Area Index |
| AHA | Atlantic Subtropical High Area Index |
| NASH | North Atlantic Subtropical High Intensity Index |
| AO | Arctic Oscillation |
| ASRP | Atlantic Sub Tropical High Ridge Position Index |
| GX | Western Pacific Subtropical High Ridge Position Index |
| WPSH | Western Pacific Subtropical High Intensity Index |
| WP | West Pacific Pattern |
| APVA | Asia Polar Vortex Area Index |
| APV | Asia Polar Vortex Intensity Index |
| IRP | Indian Subtropical High Ridge Position Index |
| ISHI | Indian Subtropical High Intensity Index |
| Niño 4 | Niño 4 Index |
| IOWPA | Indian Ocean Warm Pool Area Index |
| WPWPA | Western Pacific Warm Pool Area Index |
| AMO | Atlantic Multi-decadal Oscillation Index |
| WPWPS | Western Pacific Warm Pool Strength index |
| IOWP | Indian Ocean Warm Pool Strength Index |
| SOI | Southern Oscillation Index |
| MEI | Multiviarate ENSO Index |
| RF | Random forest model |
| RMSEs | Root mean square errors |
| M-K | Mann–Kendall |
| IMSE | Incremental mean squared error |
References
- IPCC. Climate Change 2021: The Physical Science Basis; Cambridge University Press: Cambridge, UK, 2021; pp. 4–31. [Google Scholar]
- China Meteorological Administration. Release of China Climate Change Blue Book (2024). Energy. Conserv. Environ. Prot. 2024, 7, 1. [Google Scholar]
- Zhou, X.; Li, Y.; Xiao, C.; Chen, W.; Mei, M.; Wang, G. High-Impact Extreme Weather and Climate Events in China: Summer 2024 Overview. Adv. Atmos. Sci. 2025, 42, 1064–1076. [Google Scholar] [CrossRef]
- Pan-Mao, Z.; Bai-Quan, Z.; Yang, C.; Rong, Y. Several New Understandings in the Climate Change Science. Adv. Clim. Change Res. 2021, 17, 629. [Google Scholar]
- Zhang, Y.; Hao, Z.; Feng, S.; Zhang, X.; Hao, F. Changes and Driving Factors of Compound Agricultural Droughts and Hot Events in Eastern China. Agric. Manag. Water Qual. 2022, 263, 107485. [Google Scholar] [CrossRef]
- A Quick Look at the WMO Global Climate Status Report 2023. China Meteorological News, 26 March 2024; Special Report. p. 4.
- Jones, B.; O’Neill, B.C.; McDaniel, L.; McGinnis, S.; Mearns, L.O.; Tebaldi, C. Future Population Exposure to US Heat Extremes. Nat. Clim. Change 2015, 5, 652–655. [Google Scholar] [CrossRef]
- Mora, C.; Dousset, B.; Caldwell, I.R.; Powell, F.E.; Geronimo, R.C.; Bielecki, C.R.; Trauernicht, C. Global Risk of Deadly Heat. Nat. Clim. Change 2017, 7, 501–506. [Google Scholar] [CrossRef]
- Zhang, L.; Yu, X.; Zhou, T.; Zhang, W.; Hu, S.; Clark, R. Understanding and Attribution of Extreme Heat and Drought Events in 2022: Current Situation and Future Challenges. Adv. Atmos. Sci. 2023, 40, 1941–1951. [Google Scholar] [CrossRef]
- Jones, B.; O’Neill, B.C.; McDaniel, L.; McGinnis, S.; Mearns, L.O.; Tebaldi, C. The 2021 Western North America Heat Wave Among the Most Extreme Events Ever Recorded Globally. Advance 2022, 8, 6860. [Google Scholar]
- Vautard, R.; Cattiaux, J.; Happé, T.; Singh, J.; Bonnet, R.; Cassou, C.; Yiou, P. Heat Extremes in Western Europe Increasing Faster Than Simulated Due to Atmospheric Circulation Trends. Nat. Commun. 2023, 14, 6803. [Google Scholar] [CrossRef] [PubMed]
- Pan, X.; Shen, S.; Thomas, N.; Bosilovich, M.; Wei, J.; Iredell, L. Have Heat Waves Become More Intense and Frequent in North America in the Past 40 Years? In Proceedings of the 23rd Meeting of the American Geophysical Union (AGU), San Francisco, CA, USA, 11–15 December 2023. Abstract A21C-2260. [Google Scholar]
- Li, D.; Zhou, T.; Zou, L.; Zhang, W.; Zhang, L. Extreme High-Temperature Events over East Asia in 1.5 °C and 2 °C Warmer Futures: Analysis of NCAR CESM Low-Warming Experiments. Geophys. Res. Lett. 2018, 45, 1541–1550. [Google Scholar] [CrossRef]
- Dian-Xiu, Y.; Ji-Fu, Y.; Zheng-Hong, C.; You-Fei, Z.; Rong-Jun, W. Spatial and Temporal Variations of Heat Waves in China from 1961 to 2010. Adv. Clim. Change Res. 2014, 5, 66–73. [Google Scholar] [CrossRef]
- Zou, Y.; Song, X.; Ma, Z. Historical Evolution and Future Projection of Compound Drought-Heat Wave Events in the Yangtze River Basin. Prog. Geogr. 2024, 43, 2242–2257. [Google Scholar]
- Zhao, J.; Liu, X.; Shen, Z.; Wang, R.; Wang, M. Spatiotemporal Variation Characteristics of High-Temperature Days and Heat Waves on the Qinghai-Tibet Plateau from 1971 to 2020. Chin. J. Appl. Environ. Biol. 2024, 30, 1085–1092. [Google Scholar]
- Zhang, Q.; Huang, Y.; Hao, L.; Wang, R.; Wang, M. Spatiotemporal characteristics of high temperature and heat wave in Dongting Lake Basin based on percentile threshold method. J. Meteorol. Environ. 2025, 41, 66–73. [Google Scholar]
- Keellings, D.; Waylen, P. Investigating Teleconnection Drivers of Bivariate Heat Waves in Florida Using Extreme Value Analysis. Clim. Dyn. 2015, 44, 3383–3391. [Google Scholar] [CrossRef]
- Deng, K.; Yang, S.; Ting, M.; Zhao, P.; Wang, Z. Dominant Modes of China Summer Heat Waves Driven by Global Sea Surface Temperature and Atmospheric Internal Variability. J. Clim. 2019, 32, 3761–3775. [Google Scholar] [CrossRef]
- Tang, S.; Qiao, S.; Feng, T.; Wang, Y.; Yang, Y.; Zhang, Z.; Feng, G. Asymmetry of Probabilistic Prediction Skills of the Midsummer Surface Air Temperature over the Middle and Lower Reach of the Yangtze River Valley. Clim. Dyn. 2021, 57, 3285–3302. [Google Scholar] [CrossRef]
- Zhang, T.; Deng, G.; Liu, X.; He, Y.; Shen, Q.; Chen, Q. Heatwave Magnitude Quantization and Impact Factors Analysis over the Tibetan Plateau. npj Clim. Atmos. Sci. 2025, 8, 2. [Google Scholar] [CrossRef]
- Martyn-Nemeth, P.; Hayman, L.L. Climate Change and Cardiovascular Health. J. Cardiovasc. Nurs. 2024, 39, 305–306. [Google Scholar] [CrossRef]
- Witze, A. Racism Is Magnifying the Deadly Impact of Rising City Heat. Nature 2021, 595, 349–351. [Google Scholar] [CrossRef] [PubMed]
- Zhang, T.; Cheng, B.; Liu, X.; Xiang, B.; Wang, Y. Variability of Extreme High Temperature and Response to Regional Warming over Chongqing. Meteorology 2008, 69–76. [Google Scholar] [CrossRef]
- Cheng, B.; Sun, W.; Guo, Q. Analyses of Climatological Features of the Summer High Temperature and Circulation Situation in Chongqing. J. Southwest Univ. (Nat. Sci. Ed.) 2010, 32, 73–80. [Google Scholar]
- Zhang, Q.; Lu, Y.; Yan, T.; Xie, Q.; Zhao, C.; Hu, Y. Temporal and Spatial Evolution Characteristics and Influencing Factors of Mountain Torrents in Chongqing. J. Yangtze River Sci. Res. Inst. 2023, 40, 80–87+117. [Google Scholar]
- Liu, Y.; Zhou, T.; Yu, W. Analysis of Changes in Ecological Environment Quality and Influencing Factors in Chongqing Based on a Remote-Sensing Ecological Index Mode. Land 2024, 13, 227. [Google Scholar] [CrossRef]
- Chen, S.; Wei, X.; Cai, Y.; Li, H.; Li, L.; Pu, J. Spatiotemporal Evolution of Rocky Desertification and Soil Erosion in Karst Area of Chongqing and Its Driving Factors. CATENA 2024, 242, 108108. [Google Scholar] [CrossRef]
- Luo, J.; Deng, C.Z.; Zhu, Y.; Li, H.; Li, L.; Pu, J. Characteristics and Cause Comparison of High Temperature in Different Stages of Midsummer 2022 in Chongqing. Meteorology 2023, 49, 1108–1118. [Google Scholar]
- Zhou, F. Performance and recommendations of the rare high temperature and drought disaster in Chongqing City in 2022. China Flood Drought Manag. 2023, 33, 12–14. [Google Scholar]
- Kenyon, J.; Hegerl, G.C. Influence of Modes of Climate Variability on Global Temperature Extremes. J. Clim. 2008, 21, 3872–3889. [Google Scholar] [CrossRef]
- Wang, H.; Liu, G.; Peng, J.; Ji, L. Preliminary Study on the Effect of Intraseasonal Evolution of the Tropical Atlantic SST Anomalies on Summer Persistent Heatwave Events over the Area South of the Yangtze River. Chin. J. Atmos. Sci. 2021, 45, 300–314. [Google Scholar]
- Peng, J.; Sun, S.; Lin, D. The extreme Hot Event Along the Yangtze Basins in Auguse 2022. J. Appl. Meteorol. Sci. 2023, 34, 527–539. [Google Scholar]
- Gu, Z.; Li, Y.; Qin, M.; Ji, K.; Yi, Q.; Li, P.; Feng, D. Spatiotemporal Variation Characteristics of Extreme Precipitation in Henan Province Based on RClimDex Model. Atmosphere 2024, 15, 1399. [Google Scholar] [CrossRef]
- Yin, Q.; Wang, J. The Association Between Consecutive Days’ Heat Wave and Cardiovascular Disease Mortality in Beijing, China. BMC Public Health 2017, 17, 1–9. [Google Scholar] [CrossRef] [PubMed]
- Donat, M.G.; Alexander, L.V.; Yang, H.; Durre, I.; Vose, R.; Dunn, R.J.; Kitching, S. Updated Analyses of Temperature and Precipitation Extreme Indices Since the Beginning of the Twentieth Century. J. Geophys. Res. Atmos. 2013, 118, 2098–2118. [Google Scholar] [CrossRef]
- Qian, C.; Zhang, X.; Li, Z. Linear Trends in Temperature Extremes in China, with an Emphasis on Non-Gaussian and Serially Dependent Characteristics. Clim. Dyn. 2019, 53, 533–550. [Google Scholar] [CrossRef]
- Singh, S.; Mall, R.K.; Singh, N. Changing Spatio-Temporal Trends of Heat Wave and Severe Heat Wave Events over India: An Emerging Health Hazard. Int. J. Bioclimatol. Biometeorol. 2021, 41, E1831–E1845. [Google Scholar] [CrossRef]
- Yin, S.; Wang, Y.; Lei, C.; Zhang, J. Runoff responses to landscape pattern changes and their quantitative attributions across different time scales in ecologically fragile basins. CATENA 2025, 249, 108716. [Google Scholar] [CrossRef]
- Breiman, L. Random forests. APL Mach. Learn. 2001, 45, 5–32. [Google Scholar] [CrossRef]
- Pettitt, A.N. A non-parametric approach to the change-point problem. J. R. Stat. Soc. Ser. C (Appl. Stat.) 1979, 28, 126–135. [Google Scholar] [CrossRef]
- Boyko, N.; Omeliukh, R.; Duliaba, N. The Random Forest Algorithm as an Element of Statistical Learning for Disease Prediction. Interactions 2022, 4, 13. [Google Scholar]
- Zhang, P.; Ren, G.; Xu, Y.; Wang, X.; Qin, Y.; Sun, X.; Ren, Y. Observed changes in extreme temperature over the global land based on a newly developed station daily dataset. J. Clim. 2019, 32, 8489–8509. [Google Scholar] [CrossRef]
- Xue, Y.; Chen, Q.; Zhang, J.; Huang, P. Trends in Extreme High Temperature at Different Altitudes of Southwest China During 1961–2014. Atmos. Ocean. Sci. Lett. 2020, 13, 417–425. [Google Scholar] [CrossRef]
- Yu, H.; Zhou, C.; Ke, X.; Pang, Y. Characteristics of heatwave and heavy rainfall in Sichuan-Chongqing Region and corresponding adaptive strategy. Yangtze River 2024, 55, 146–154. [Google Scholar]
- Xu, L.; Zhang, T.; Wang, A.; Yu, W.; Yang, S. Variations of Summer Extreme and Total Precipitation over Southeast Asia and Associated Atmospheric and Oceanic Features. J. Clim. 2022, 35, 6395–6409. [Google Scholar] [CrossRef]
- Zhang, X.; Long, Q.; Kun, D.; Yang, D.; Lei, L. Comprehensive Risk Assessment of Typical High-Temperature Cities in Various Provinces in China. Int. J. Environ. Res. Public Health 2022, 19, 4292. [Google Scholar] [CrossRef]
- Gabric, A.J. The Climate Change Crisis: A Review of Its Causes and Possible Responses. Atmosphere 2023, 14, 1081. [Google Scholar] [CrossRef]
- Zhao, A.; Liu, X.; Zhu, X.; Pan, Y.; Zhao, Y.; Wang, D. Trends and spatial differences of extreme temperatures in the Loess Plateaur egion from 1965 to 2013. Geogr. Res. 2016, 35, 639–652. [Google Scholar]
- Wang, Q.; Zhang, M.; Wang, S.; Luo, S.; Wang, B. Analysis of extreme temperature events in the Yangtze River Basin from 1962 to 2011. Acta Geogr. Sin. 2013, 68, 611–625. [Google Scholar]
- Zhou, B.; Xu, Y.; Wu, J.; Dong, S.; Shi, Y. Changes in temperature and precipitation extreme indices over China: Analysis of a high-resolution grid dataset. Int. J. Bioclimatol. Biometeorol. 2016, 36, 1051–1066. [Google Scholar] [CrossRef]
- An, R.; Li, J.; Feng, J. Modulation of the link between the Hadley circulation and the meridional structure of tropical SSTs by the Atlantic multidecadal oscillation. Atmos. Res. 2024, 299, 107201. [Google Scholar] [CrossRef]
- Suarez-Gutierrez, L.; Müller, W.A.; Li, C.; Marotzke, J. Dynamical and thermodynamical drivers of variability in European summer heat extremes. Clim. Dyn. 2020, 54, 4351–4366. [Google Scholar] [CrossRef]
- Chen, J.; Li, Y.; Wang, B.; Yang, X.; Liu, F. Prediction of extreme temperature events in the Yellow River Basin of China using the SMLR and RF methods. J. Nat. Disasters 2024, 33, 74–88. [Google Scholar]
- Guan, W.; Hu, H.; Ren, X.; Yang, X. Subseasonal zonal variability of the western Pacific subtropical high in summer: Climate impacts and underlying mechanisms. Clim. Dyn. 2019, 53, 3325–3344. [Google Scholar] [CrossRef]
- Yook, S.; Thompson, D.; Sun, L.; Patrizio, C. The simulated atmospheric response to western North Pacific sea surface temperature anomalies. J. Clim. 2022, 35, 3335–3352. [Google Scholar] [CrossRef]
- Wu, H.; Xu, X.; Wang, Y. Effects of Orography on the High—Temperature Event on 22 June 2023 in North China. Atmosphere 2024, 15, 324. [Google Scholar] [CrossRef]
- Jiang, J.; Liu, Y.; Mao, J.; Wu, G. Extreme heatwave over Eastern China in summer 2022: The role of three oceans and local soil moisture feedback. Environ. Res. Lett. 2023, 18, 044025. [Google Scholar] [CrossRef]
- Qin, Y.; Qin, Y.; Shen, Y.; Li, Y.; Xiang, B. Numerical Study on the Effects of Intraseasonal Oscillations for a Persistent Drought and Hot Event in South China Summer 2022. Remote Sens. 2023, 15, 892. [Google Scholar] [CrossRef]
- Qian, Y.; Chakraborty, T.; Li, J.; Li, D.; He, C.; Sarangi, C.; Chen, F.; Yang, X.; Leung, L. Urbanization impact on regional climate and extreme weather: Current understanding, uncertainties, and future research directions. Adv. Atmos. Sci. 2022, 39, 819–860. [Google Scholar] [CrossRef]
- Jiang, X.; Luo, Y.; Zhang, D.; Wu, M. Urbanization Enhanced Summertime Extreme Hourly Precipitation over the Yangtze River Delta. J. Clim. 2020, 33, 5809–5826. [Google Scholar] [CrossRef]
- An, N.; Dou, J.; González-Cruz, J.; Bornstein, R.; Miao, S.; Li, L. An observational case study of synergies between an intense heat wave and the urban heat island in Beijing. J. Appl. Meteorol. Climatol. 2020, 59, 605–620. [Google Scholar] [CrossRef]
- Du, H.; Zhou, F.; Li, C.; Cai, W.; Jiang, H.; Cai, Y. Analysis of the Impact of Land Use on Spatiotemporal Patterns of Surface Urban Heat Island in Rapid Urbanization: A Case Study of Shanghai, China. Sustainability 2020, 12, 1171. [Google Scholar] [CrossRef]
- Zhang, J.; Tian, L.; Lu, J. Temporal evolution of urban heat island and quantitative relationship with urbanization development in Chongqing, China. Atmosphere 2022, 13, 1594. [Google Scholar] [CrossRef]
- Leal Filho, W.; Echevarria Icaza, L.; Emanche, V.; Al-Amin, A. An evidence-based review of impacts, strategies and tools to mitigate urban heat islands. Int. J. Environ. Res. Public Health 2017, 14, 1600. [Google Scholar] [CrossRef] [PubMed]
- Massaro, E.; Schifanella, R.; Piccardo, M.; Caporaso, L.; Taubenböck, H.; Cescatti, A.; Duveiller, G. Spatially-optimized urban greening for reduction of population exposure to land surface temperature extremes. Nat. Commun. 2023, 14, 2903. [Google Scholar] [CrossRef]
Disclaimer/Publisher’s Note: The statements, opinions and data contained in all publications are solely those of the individual author(s) and contributor(s) and not of MDPI and/or the editor(s). MDPI and/or the editor(s) disclaim responsibility for any injury to people or property resulting from any ideas, methods, instructions or products referred to in the content. |
© 2025 by the authors. Licensee MDPI, Basel, Switzerland. This article is an open access article distributed under the terms and conditions of the Creative Commons Attribution (CC BY) license (https://creativecommons.org/licenses/by/4.0/).