Article

Effectiveness of River Training Projects in Controlling Shoal Erosion: A Case Study of the Middle Yangtze River

1
Key Laboratory of Resources Conversion and Pollution Control of the State Ethnic Affairs Commission, College of Resources and Environmental Science, South-Central Minzu University, Wuhan 430074, China
2
State Key Laboratory of Pollution Control and Resource Reuse, School of the Environment, Nanjing University, Nanjing 210023, China
3
Tianjin Research Institute for Water Transport Engineering, Tianjin 300456, China
4
Bureau of Hydrology, Changjiang Water Resources Commission, Wuhan 430010, China
5
Changjiang Waterway Institute of Planning, Design & Research, Wuhan 430040, China
*
Author to whom correspondence should be addressed.
Hydrology 2025, 12(6), 148; https://doi.org/10.3390/hydrology12060148
Submission received: 23 April 2025 / Revised: 6 June 2025 / Accepted: 9 June 2025 / Published: 12 June 2025

Abstract

Reservoir regulation and river training works are significant factors influencing downstream channel evolution. However, there is still a lack of systematic studies on the evolution patterns under their synergistic impacts. In particular, the adaptability of shoal training works under hydrological variability conditions needs further investigation. The main purpose of this study is to undertake a thorough analysis of the efficacy of river training works related to shoal erosion control and to identify its underlying causes and potential mitigation strategies. By reviewing completed river training works and collecting and analyzing hydrological data of the middle Yangtze River, we developed and applied a hydro-morphological model to simulate the river evolution processes. A systematic evaluation was undertaken on the impact of training works on shoal erosion. The results indicate that the river training works can influence local hydrological and hydrodynamic conditions, thereby enhancing shoals’ resistance to erosion and decelerating shoal shrinkage. However, under altered hydrologic regimes, the effectiveness of training works wanes, thus failing to fully achieve its intended effects. Specifically, the bank protection project attenuated the intensity of scour at the head of the continent by 30% (average annual scour depth reduced from 2.1 m to 1.5 m) and increased the local stability index by 14.5% (from 0.744 to 0.852), but it is still below the critical threshold (1.024). The findings of this study are expected to provide a scientific basis for the planning and implementation of river training works in the Middle Yangtze River and serve as a reference for addressing similar issues in other regions.

1. Introduction

The scouring of river shoals is directly related to issues such as river flood control and navigation, which have attracted sustained scholarly attention from scholars. Major and medium-sized rivers like the Yangtze and Mississippi commonly exhibit numerous shoals as part of their fluvial geomorphology [1,2]. Watson reevaluated information on the effects of levees and levees on flood levels based on a specific hydrograph analysis of the Middle Mississippi River and found that the rise in flood levels is more likely to be related to levee construction. These bars form due to the long-term interplay between the depositional and erosional process of sediment in rivers, reflecting adaptations to upstream sediment and water flux processes [3].
However, the construction of reservoirs upstream alters the sediment-water conditions in rivers, which in turn affects channel sedimentation. Downstream of dams, severe scouring and the retreat of bars and shoals are common, resulting in degraded navigation. The implementation of mid-channel bar training works is a typically effective measure to mitigate these impacts [4]. However, there are still different views in the current academic community about the specific impact assessment of river training projects, and the core of the debate lies in the scale of engineering intervention and the dynamic equilibrium capacity of the river system. Prasujya and Nayan conducted a comparative analysis of the Brahmaputra River before and after river engineering and found that after the implementation of engineering, the intensity of river bends significantly increased and river shoals migrated and faced significant potential erosion threats, likely leading to severe geomorphological degradation. Kidová et al. evaluated multiple river systems and found that the construction of river training works leads to adverse simplification of river patterns, loss of connectivity between channels and floodplains, and disruption and restriction of hydro-morphological continuity, exacerbating riverbed erosion. The above studies have shown that excessive or inappropriate river engineering may lead to destabilization of channel morphology and degradation of dammed ridges and beaches. Some studies suggest that appropriate engineering measures can protect rivers and maintain the stability of river shoals and beaches. Based on simulation studies, Zhou et al. explored the influence of large-scale river training works on the sedimentation processes of rivers. Their research found that without engineering measures, severe erosion occurred at the tail of river shoals, whereas considering the effects of engineering, there was no significant change in the planform geometry of the shoals. Jaafar et al. using the HEC-RAS model to study the Tigris River, found that well-designed engineering measures can enhance river stability. These findings suggest that appropriate river engineering can effectively protect rivers. However, most of the current studies focus on the impact of river training projects on the hydrological condition of the river under a certain time series of characteristic flow levels, without considering the impact of hydrological condition changes, such as upstream damming and interception after the implementation of the measures.
China is currently the world’s leading dam-building country. The effects of reservoir impoundment are widespread across numerous rivers, among which the construction of the Three Gorges Dam (TGD) has altered the hydrological conditions in the middle and lower reaches of the Yangtze River. Downstream hydrological stations show a significant decrease in annual sediment transport, which has led to problems such as riverbed erosion and the retreat of bar-beach morphology [5,6,7]. During the phased impoundment stages of the TGD, significant impacts have already been observed downstream in relation to aspects such as water levels, flow velocities, and sediment transport. To counteract these effects, relevant authorities concurrently undertook extensive river training structures to address the continual shrinkage of bars and beaches [8]. Today, with the completion of the phased impoundment trials of the TGD and its transition into full operation, new changes in water and sediment conditions have emerged. It is worth conducting further investigation regarding whether the existing river channel engineering is still capable of adapting to these changes in water and sediment conditions and effectively achieving the intended control over bars and beaches.
The coupled IHA-RVA/hydro-morphological approach breaks through the limitations of the traditional approach in terms of cross-scale correlation, dynamic adaptation, and risk warning. It not only provides a tool for waterway management in the middle reaches of the Yangtze River but also provides a methodological paradigm for the sustainable management of global river systems (e.g., the Mississippi River and the Brahmaputra River), especially for non-equilibrium river systems under the superposition of climate change and human activities.
This study will investigate the following aspects: (1) Macroscale analysis of sediment transport and bar morpho-dynamics will be performed to elucidate interactions among sediment particles, hydrodynamics, and channel morphology. The flow characteristics of floods of different frequencies in braided channels and their interrelationships will be investigated. (2) We will conduct a microscopic analysis of changes in sediment textural characteristics before and after impoundment, quantifying the effects of hydrological and sediment dynamics coupling on channel erosion and sedimentation. (3) By comparing changes in water flow and sedimentation in typical shoal protection zones before and after reservoir filling at the TGD, this study will further analyze potential evolution trends of bars and beaches. Based on these findings, targeted solutions will be formulated to provide scientific references and decision-making bases for policymakers involved in similar riverine ecological environments.

2. Materials and Methodology

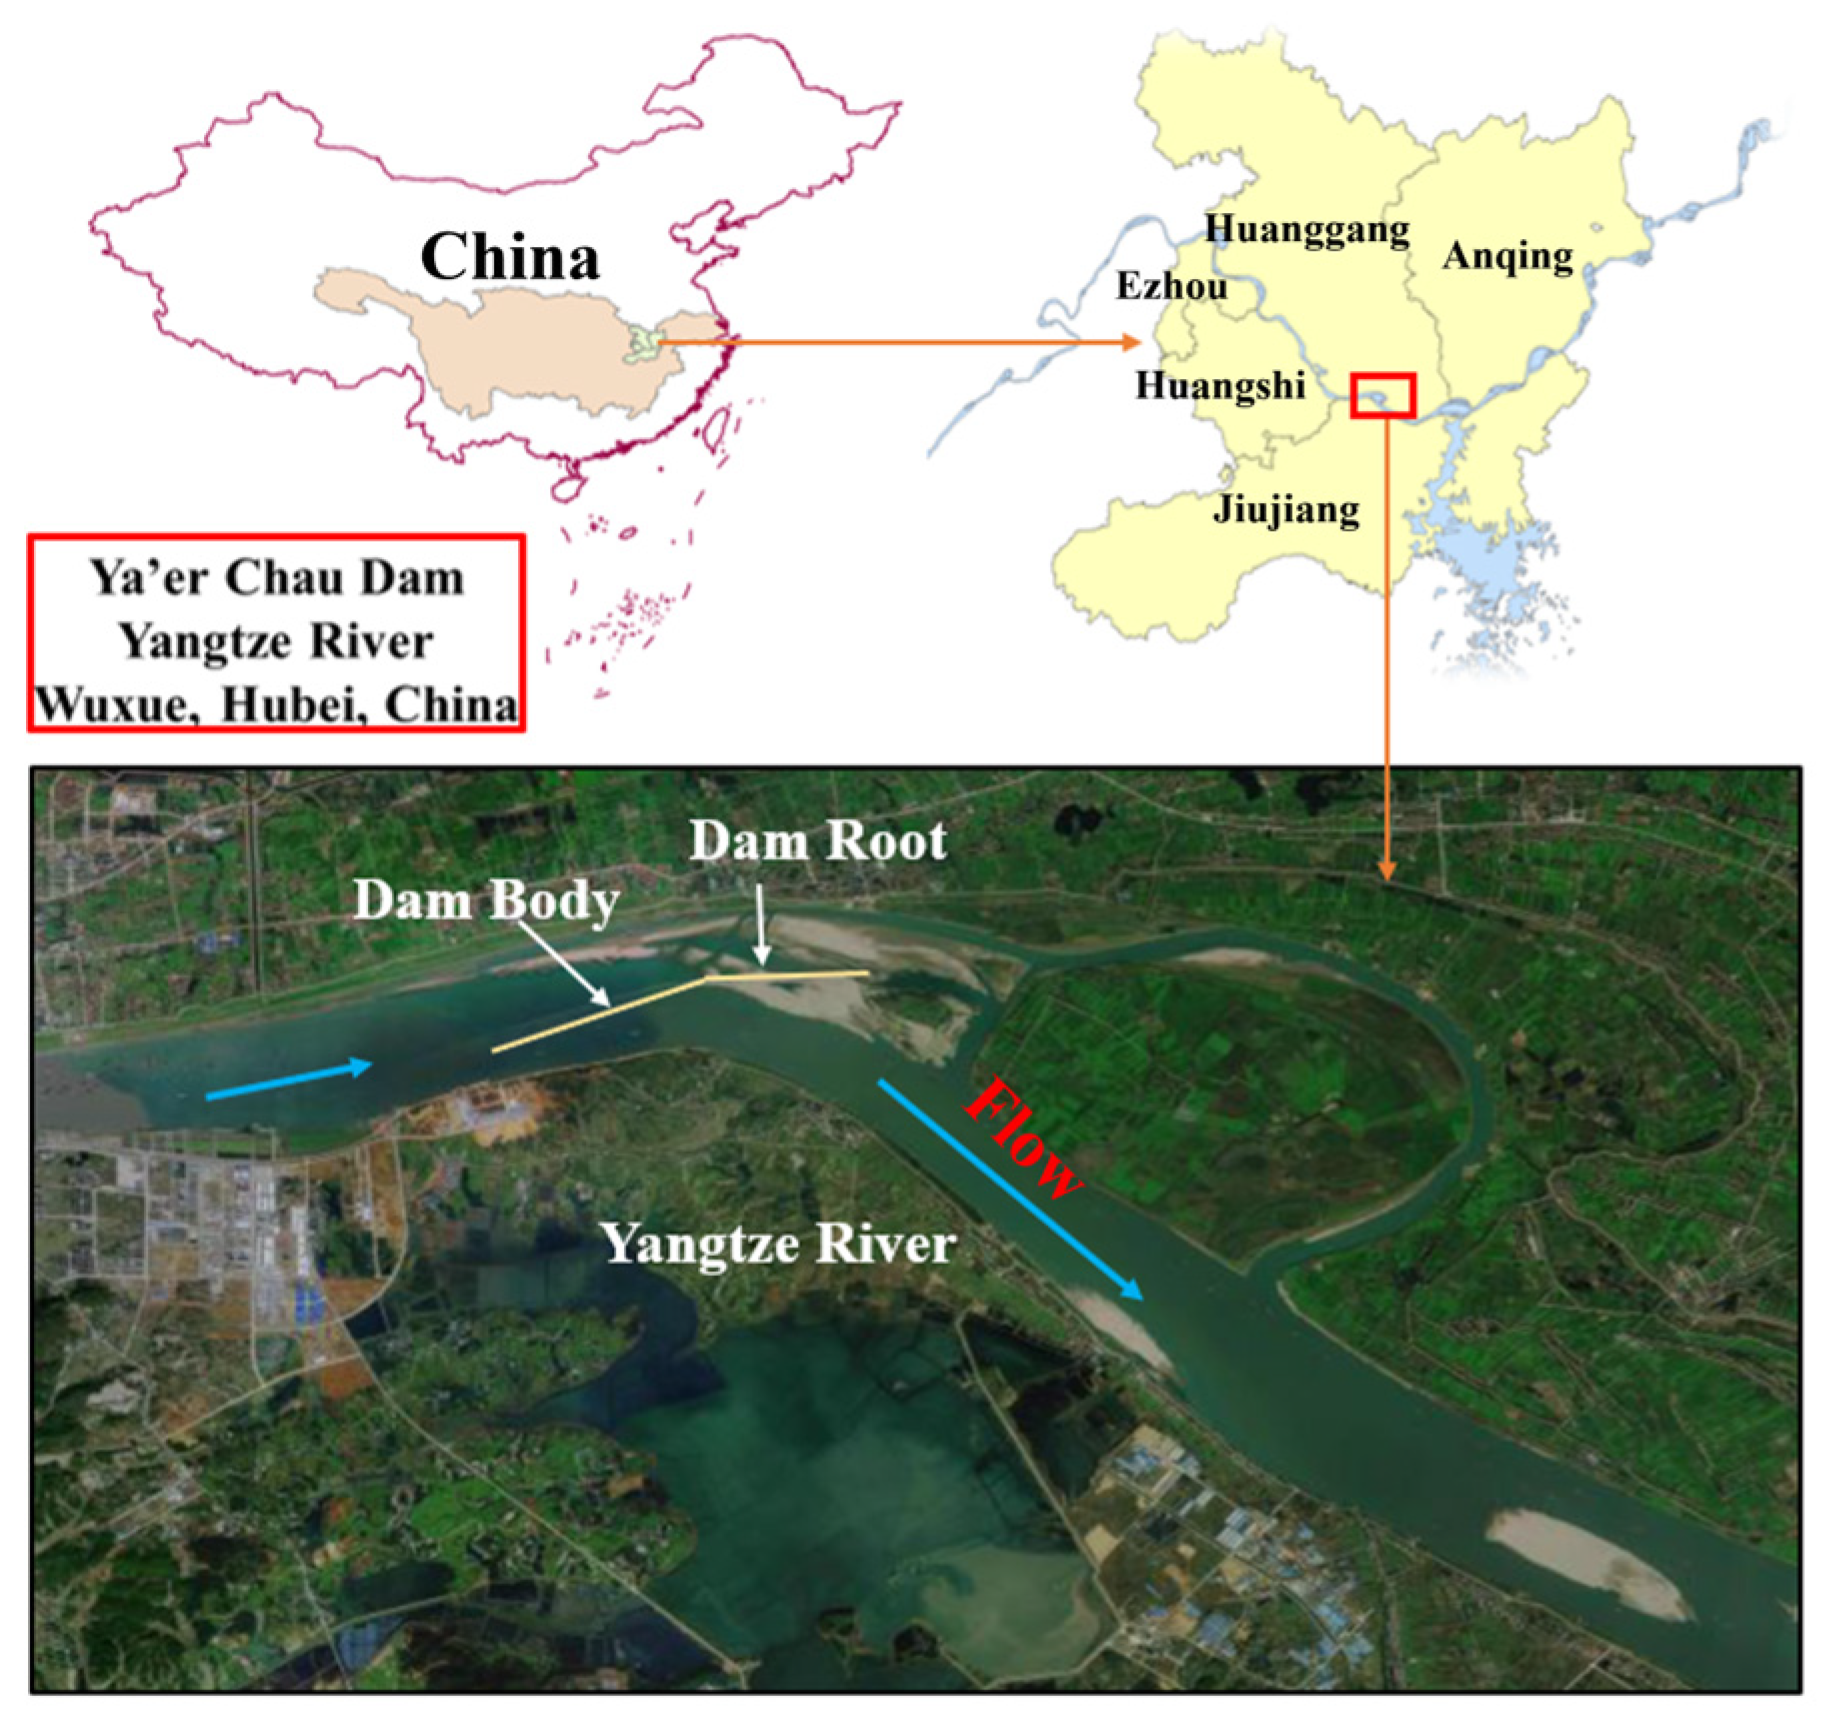
2.1. Study Area and Data Collection
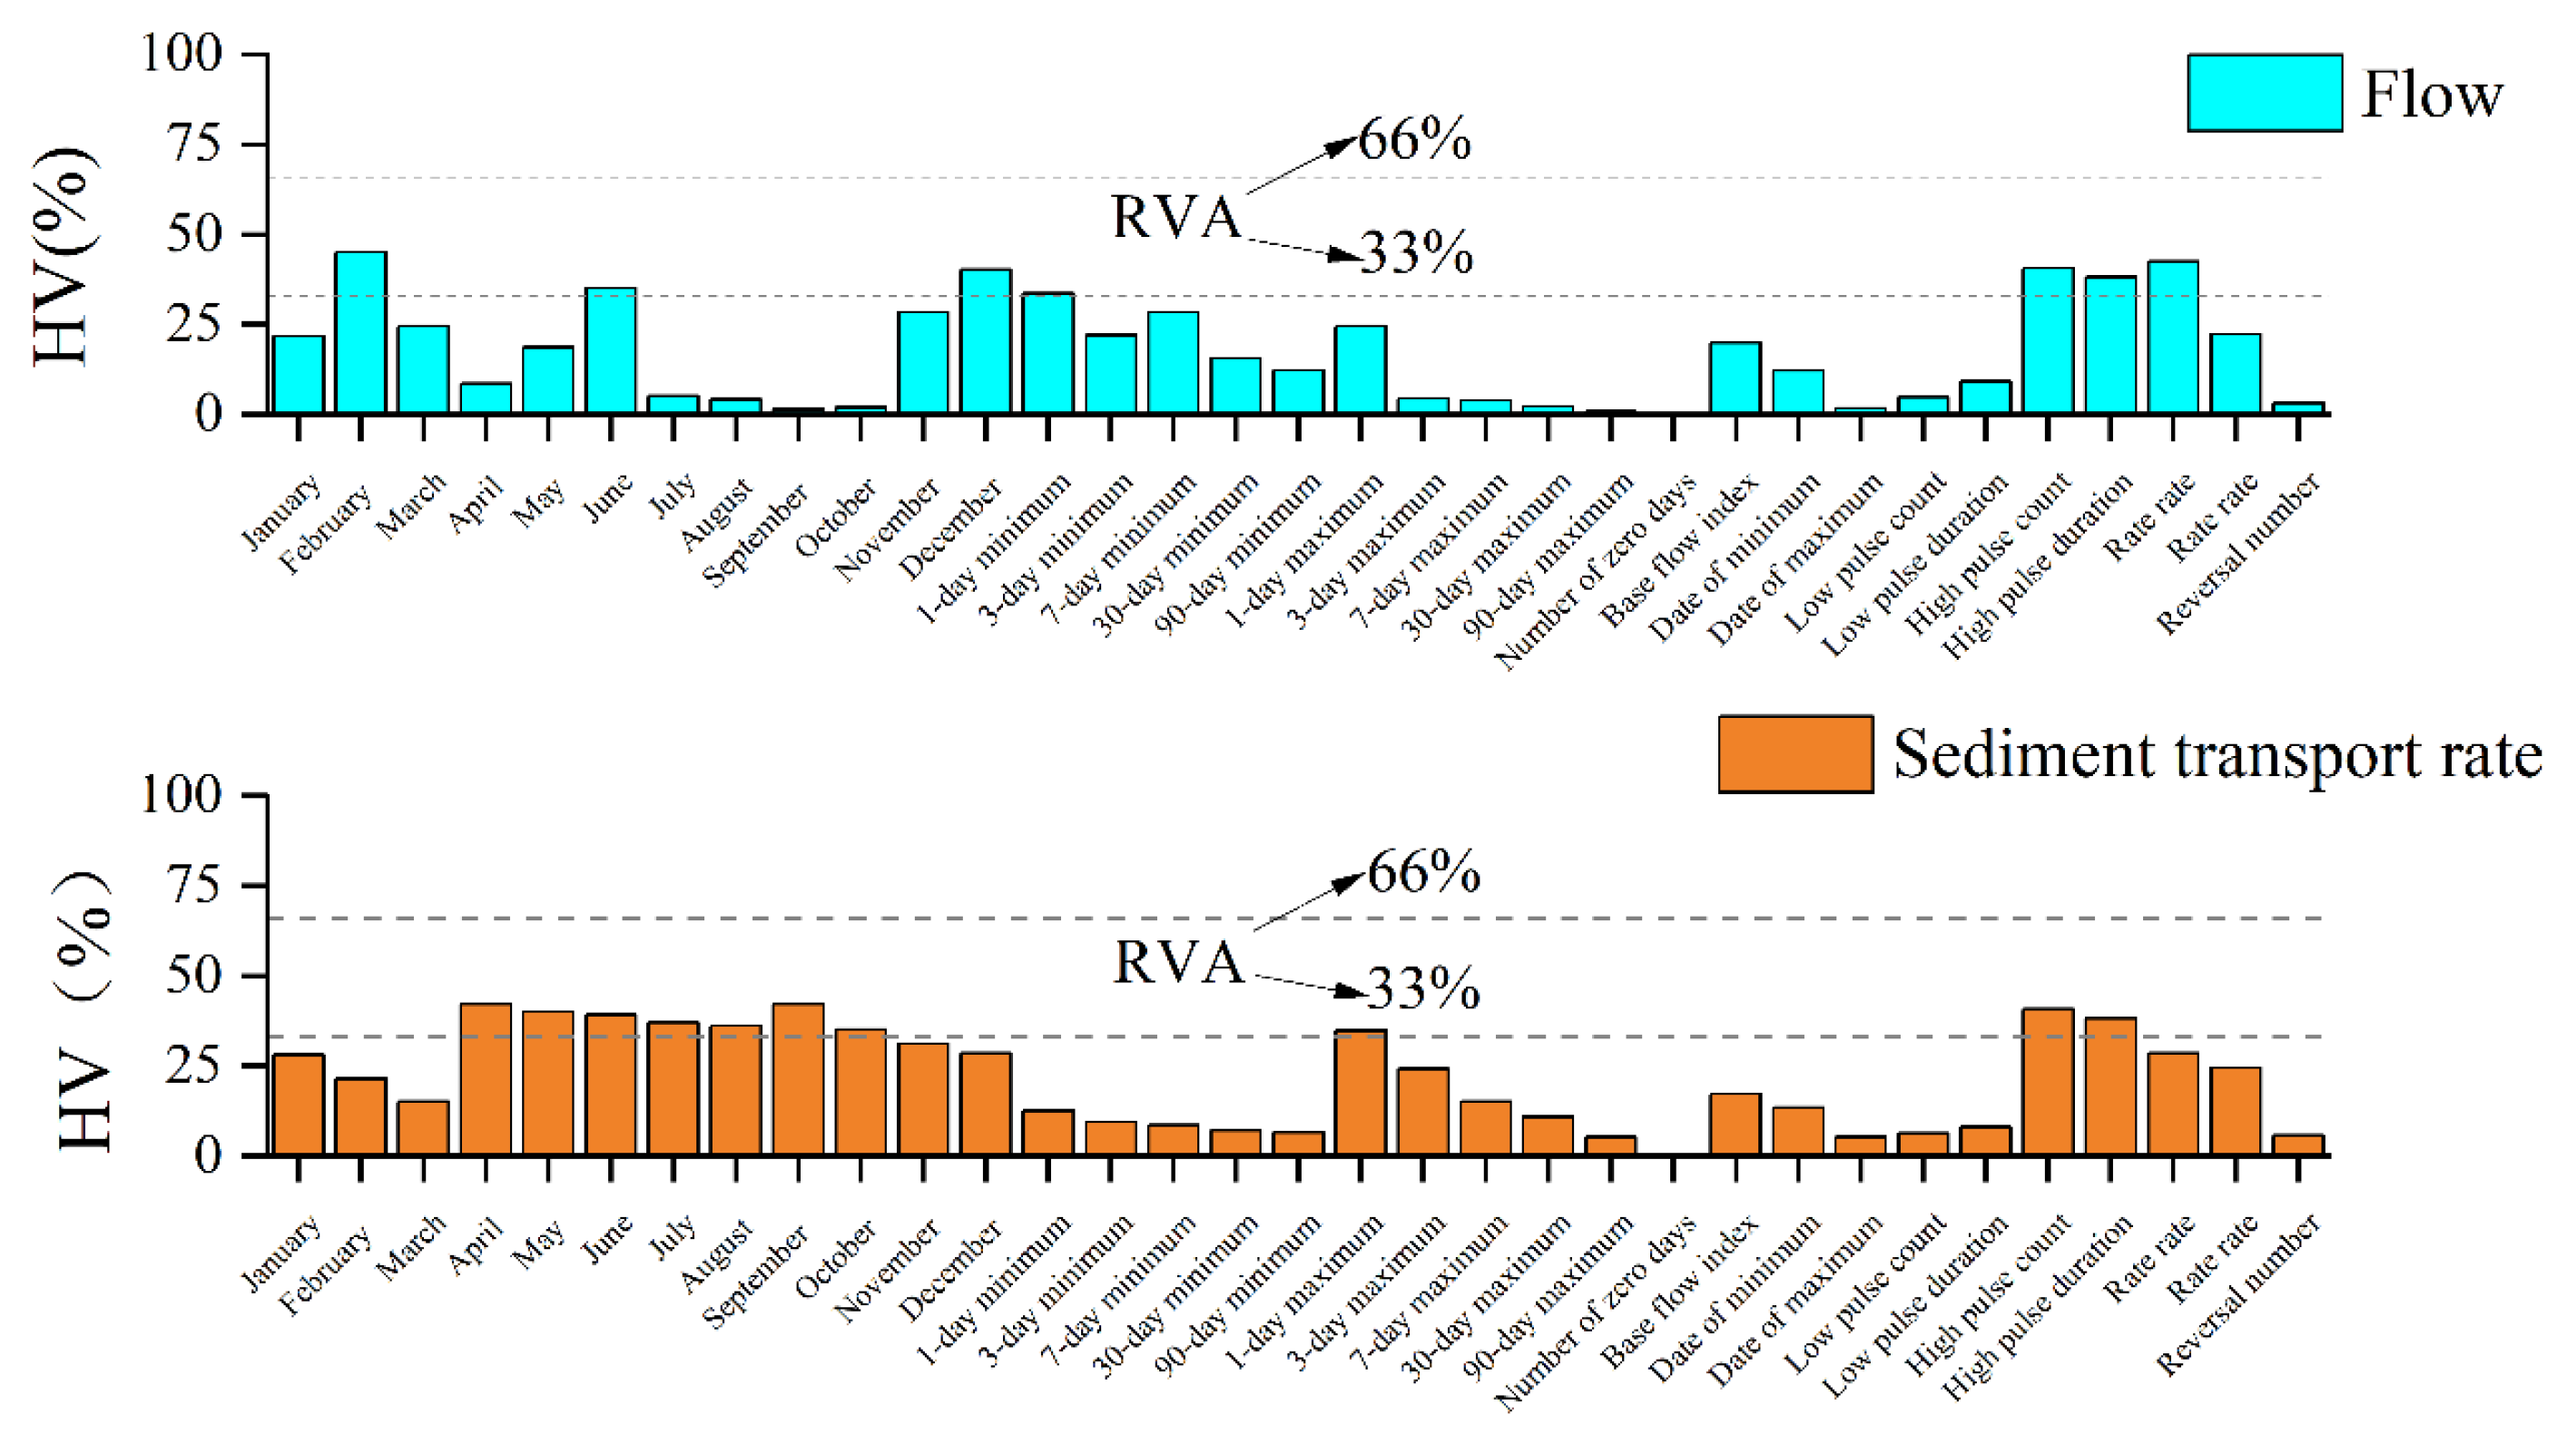
The Yangtze River, which is approximately 6300 km in length, serves as one of China’s most vital fluvial systems, bearing immense responsibilities for economic development and vital natural resource maintenance. To enhance the efficiency of water resource utilization within the basin, numerous hydraulic engineering complexes such as Xiangjiaba, TGD, and Gezhouba dams have been constructed along the Yangtze River, primarily for hydroelectric power generation. However, while reservoir impoundment has intercepted substantial amounts of sediment, it has also led to significant alterations in hydrological processes downstream, inducing erosion and retreat of bars and beaches. To regulate water flow and ensure navigational channels remain clear, over 300 river training works have been strategically deployed along the Yangtze River.
This paper selects the Wuxue section of the middle Yangtze River, which is located approximately 830 km downstream from the TGD, as the research subject. This section of the river features a goose-head-shaped braided channel. The river section is located in the transition area from the low hills in the middle reaches of the Yangtze River to the alluvial plains, connected with the Edong hills (the remaining veins of Dabie Mountains) in the west and the plains in the middle and lower reaches of the Yangtze River in the east, and the topography is gradually smoothing out. Both sides of the river channel are constrained by low hills, forming a relatively narrow valley with steep local banks. It divides into two channels—left and right—and represents a typical distribution of shoals influenced by reservoir regulation in the middle reaches of the Yangtze River. Following the construction of the TGD, changes in hydrological conditions have led to ongoing erosion and retreat of bars and beaches, resulting in deteriorating navigational conditions. To address the problems of dispersed flow and shallow shoals that impede navigation, protective measures were designed and implemented in 2007, including a 5988 m-long longitudinally regulated down-dam and an 850 m-long end-of-dam shoal protection zone (Figure 1). The 5988 m-long dam consists of three parts: the bottom protection, the dam body and the dam head. The bottom protection is made of a soft-body row structure with concrete blocks, and the dam body is mainly made of thrown stone. The width of the top of the dam is 2 to 5 m, the slope ratio of the backwater slope (right side of the dam) is 1:2, and the slope ratio of the waterward slope (left side of the dam) is 1:1.5 to 1:2. The length of the end of the dam is 450 m, the width of the dam is 80 m, and it adopts the structure of the X-type rows and hinged rows, etc. These measures include building rock berms and building a soft-body row structure. These include rock revetments and other interventions designed to stabilize the riverbanks and protect the beach land in the channel section of the Wuxue Braided River. The hydrological conditions in the study area are undergoing further changes as the groundwater level reaches the commissioning level of 175 m. It will be necessary to adapt the existing channel works to the new hydrological conditions.
The data collected for this study include hydrological, sedimentological, and topographical data from key measurement sites within the study area. These data were provided by the Hydrology Bureau of the Yangtze River Water Resources Commission (Table 1). Before released, the data underwent quality assurance protocols for integrity, accuracy, and consistency, ensuring no data were missing. Flow discharge, water level, and sediment concentration data without TGD were computed using a validated 1D hydro-morpho-dynamic modeling for the Yichang–Datong navigation corridor reach of the Yangtze River [9].

2.2. IHA-RVA

The IHA (Indicators of Hydrologic Alteration) framework is a hydrological assessment model comprising 33 indicators. It evaluates changes in the hydrological regime of rivers across aspects such as flow and water level magnitude, timing, frequency, duration, and rate of change. It uses ranges of change to analyze variations in hydrological characteristics before and after anthropogenic intervention, aiming to establish management objectives for rivers [10,11]. According to the different hydrological characteristics, the IHA index system is stratified into five groups (Table 2). Richer et al. quantitatively analyzed the degree of hydrological variability using the concept of departure. IHA primarily calculates the magnitude of departure and deviation magnitude metrics. The magnitude of departure measures the impact of flow-regulating infrastructure on hydrological sequences, while the coefficient of variation reflects the interannual variability of each parameter in the IHA. The specific formulas are as follows:
P = P b e f o r e P a f t e r P b e f o r e × 100 %
C v = σ X = 1 n 1 ( X i X ) 2 X
where P is the corresponding index offset of each IHA; C v is the coefficient of variation; σ is the standard deviation; n is the total number of samples; and X i is the parameter value of the year. X is the average value of the parameters for n years.
In the RVA method, the 25th and 75th quantiles are generally used as the upper and lower limits, and the degree of hydrological variation is calculated using the following formula:
D = N i N e N e × 100 %
where D is the degree of hydrological variation; N i is the observed number, which refers to the number of years that fall within the RVA target after the impact of human activities; N e is the projected number of years in which the IHA is expected to fall within the RVA target after the impact of human activities.
The degree of hydrological variability less than 33% indicates low or no change, between 33% and 67% suggests moderate change, and greater than 67% indicates high change.

2.3. Hydro-Morphological Indicators

(1) Hydraulic erosion intensity
After the operation of the TGD for water storage, the adjustment of the downstream river channel morphology is influenced by changes in flow regime and significant reductions in sediment load. In current studies, some scholars have proposed using parameters of hydraulic erosion intensity to characterize the flow-sediment conditions. The flood season average hydraulic erosion intensity ( F ) is defined as follows [12]:
F = 1 N j = 1 N ( Q j 2 / S j ) / 10 8
where N is the total number of days of flood season in the year, generally from May to October; Q j is the average daily flow during flood season ( m 3 /s); and S j is the suspended sediment content (kg/ m 3 ).
For a specific flow range, the duration, frequency, and magnitude of each flow within the range will influence the adjustment of riverbed morphology. Calculating the sediment transport capacity of water for each flow within this range reflects the cumulative effect of sediment transport capacity over that flow range. The cumulative effect of sediment transport capacity ( F f ) for each flow range can be defined as follows:
F f i = j = 1 N i ( Q j 2 / S j ) / 10 8
where N i is the total number of days in which the average daily flow is within the flow range for a given year, and Q j is the average daily flow during flood season ( m 3 /s). S j is suspended mass sediment content ( k g / m 3 ).
(2) River morphologic stability index
From the perspective of sediment movement, the cause of erosion and collapse of river shoal slopes is that nearshore sediment can be driven and transported by water flow [13,14]. Here, we choose to use the river morphologic stability index K y [15]:
K y = d v b 2 + 0.107 H
where d is the average particle size of nearshore sediment, mm; v b is the near-shore bottom flow velocity, m/s; H is the water depth, m; and v b can be represented by the vertical average flow rate v :
v b = 3 ψ 3 ψ + 1 v
where parameter ψ = 0.2 H d 0.12 , where H and d are calculated in units (m).
For the flow rate index K y , when K y ≈ 1.024, the possibility of erosion in the river channel is small. When K y < 1.024, the likelihood of riverbed erosion is greater. When K y > 1.024, the riverbed is more likely to be silted.
The river morphologic stability index K y accurately quantified the scour resistance of the continental beach in the Wuxue section under the influence of the Three Gorges Project by coupling the near-shore sediment coarsening, the regulation of the flow velocity of the branching channel and the change in water depth, with the threshold value K y = 1.024 validated by historical bank failures and effectiveness of revetment projects to effectively identify erosion risks and guide adaptive management.

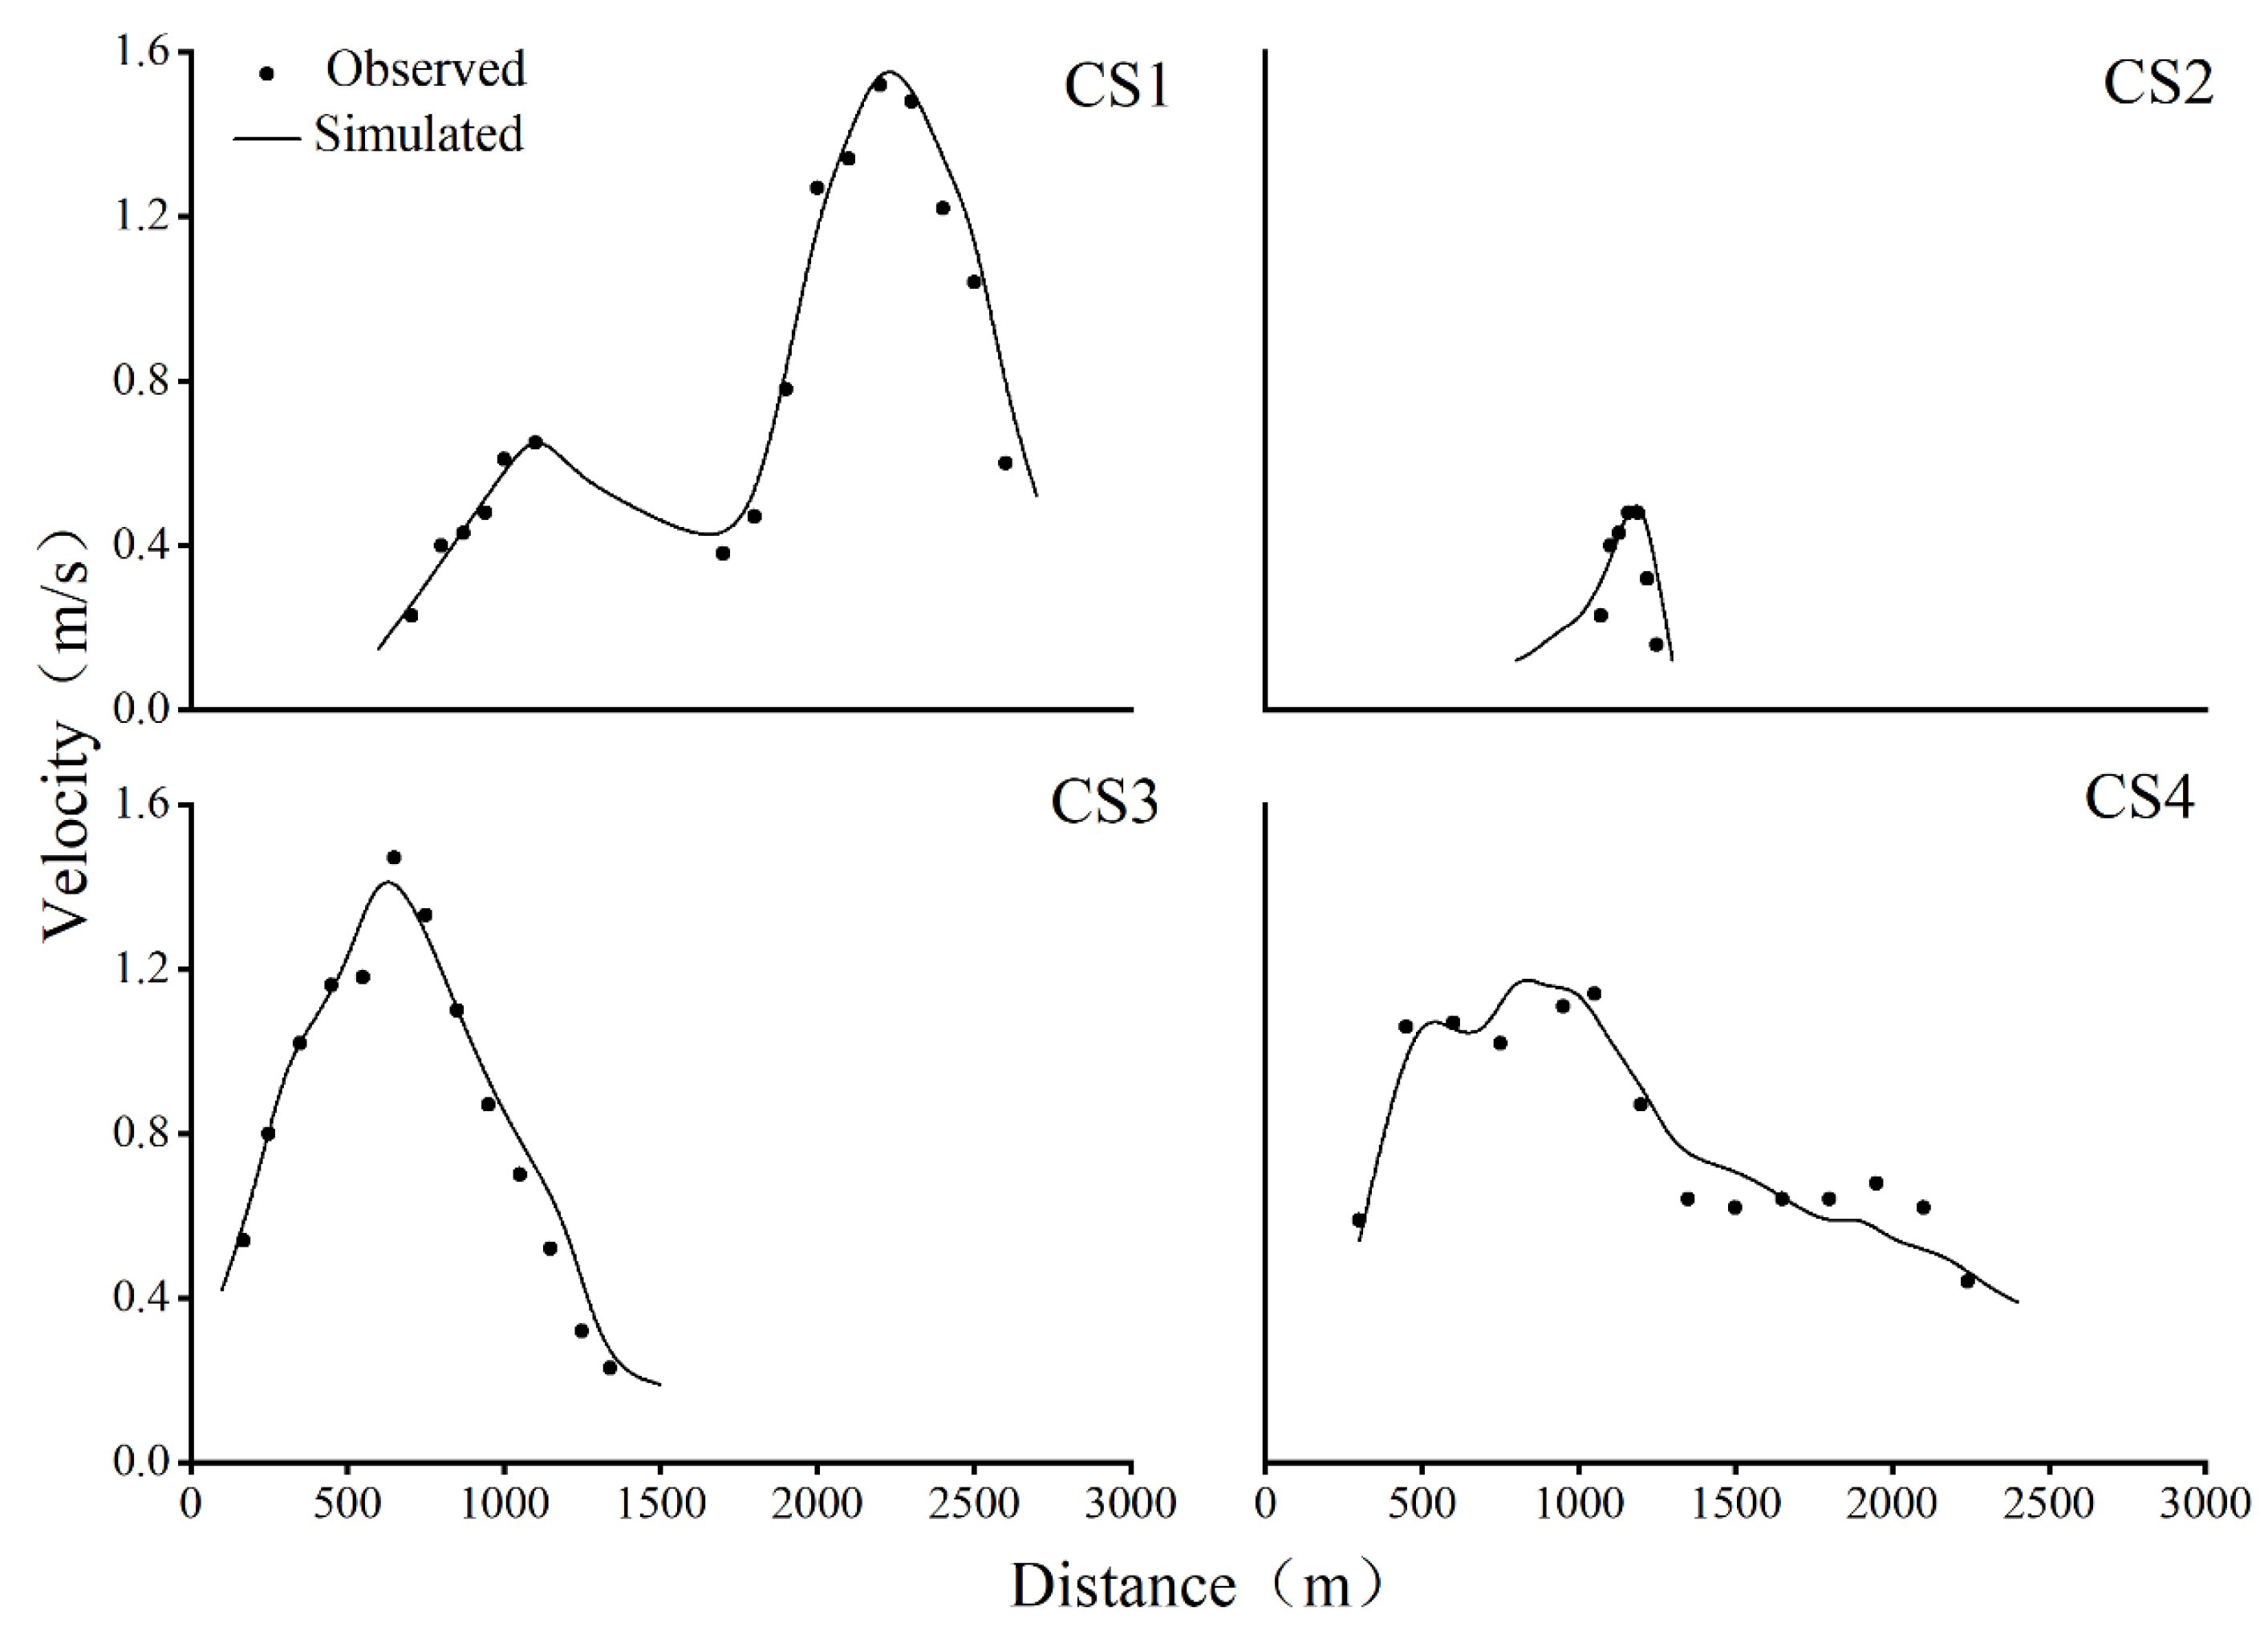
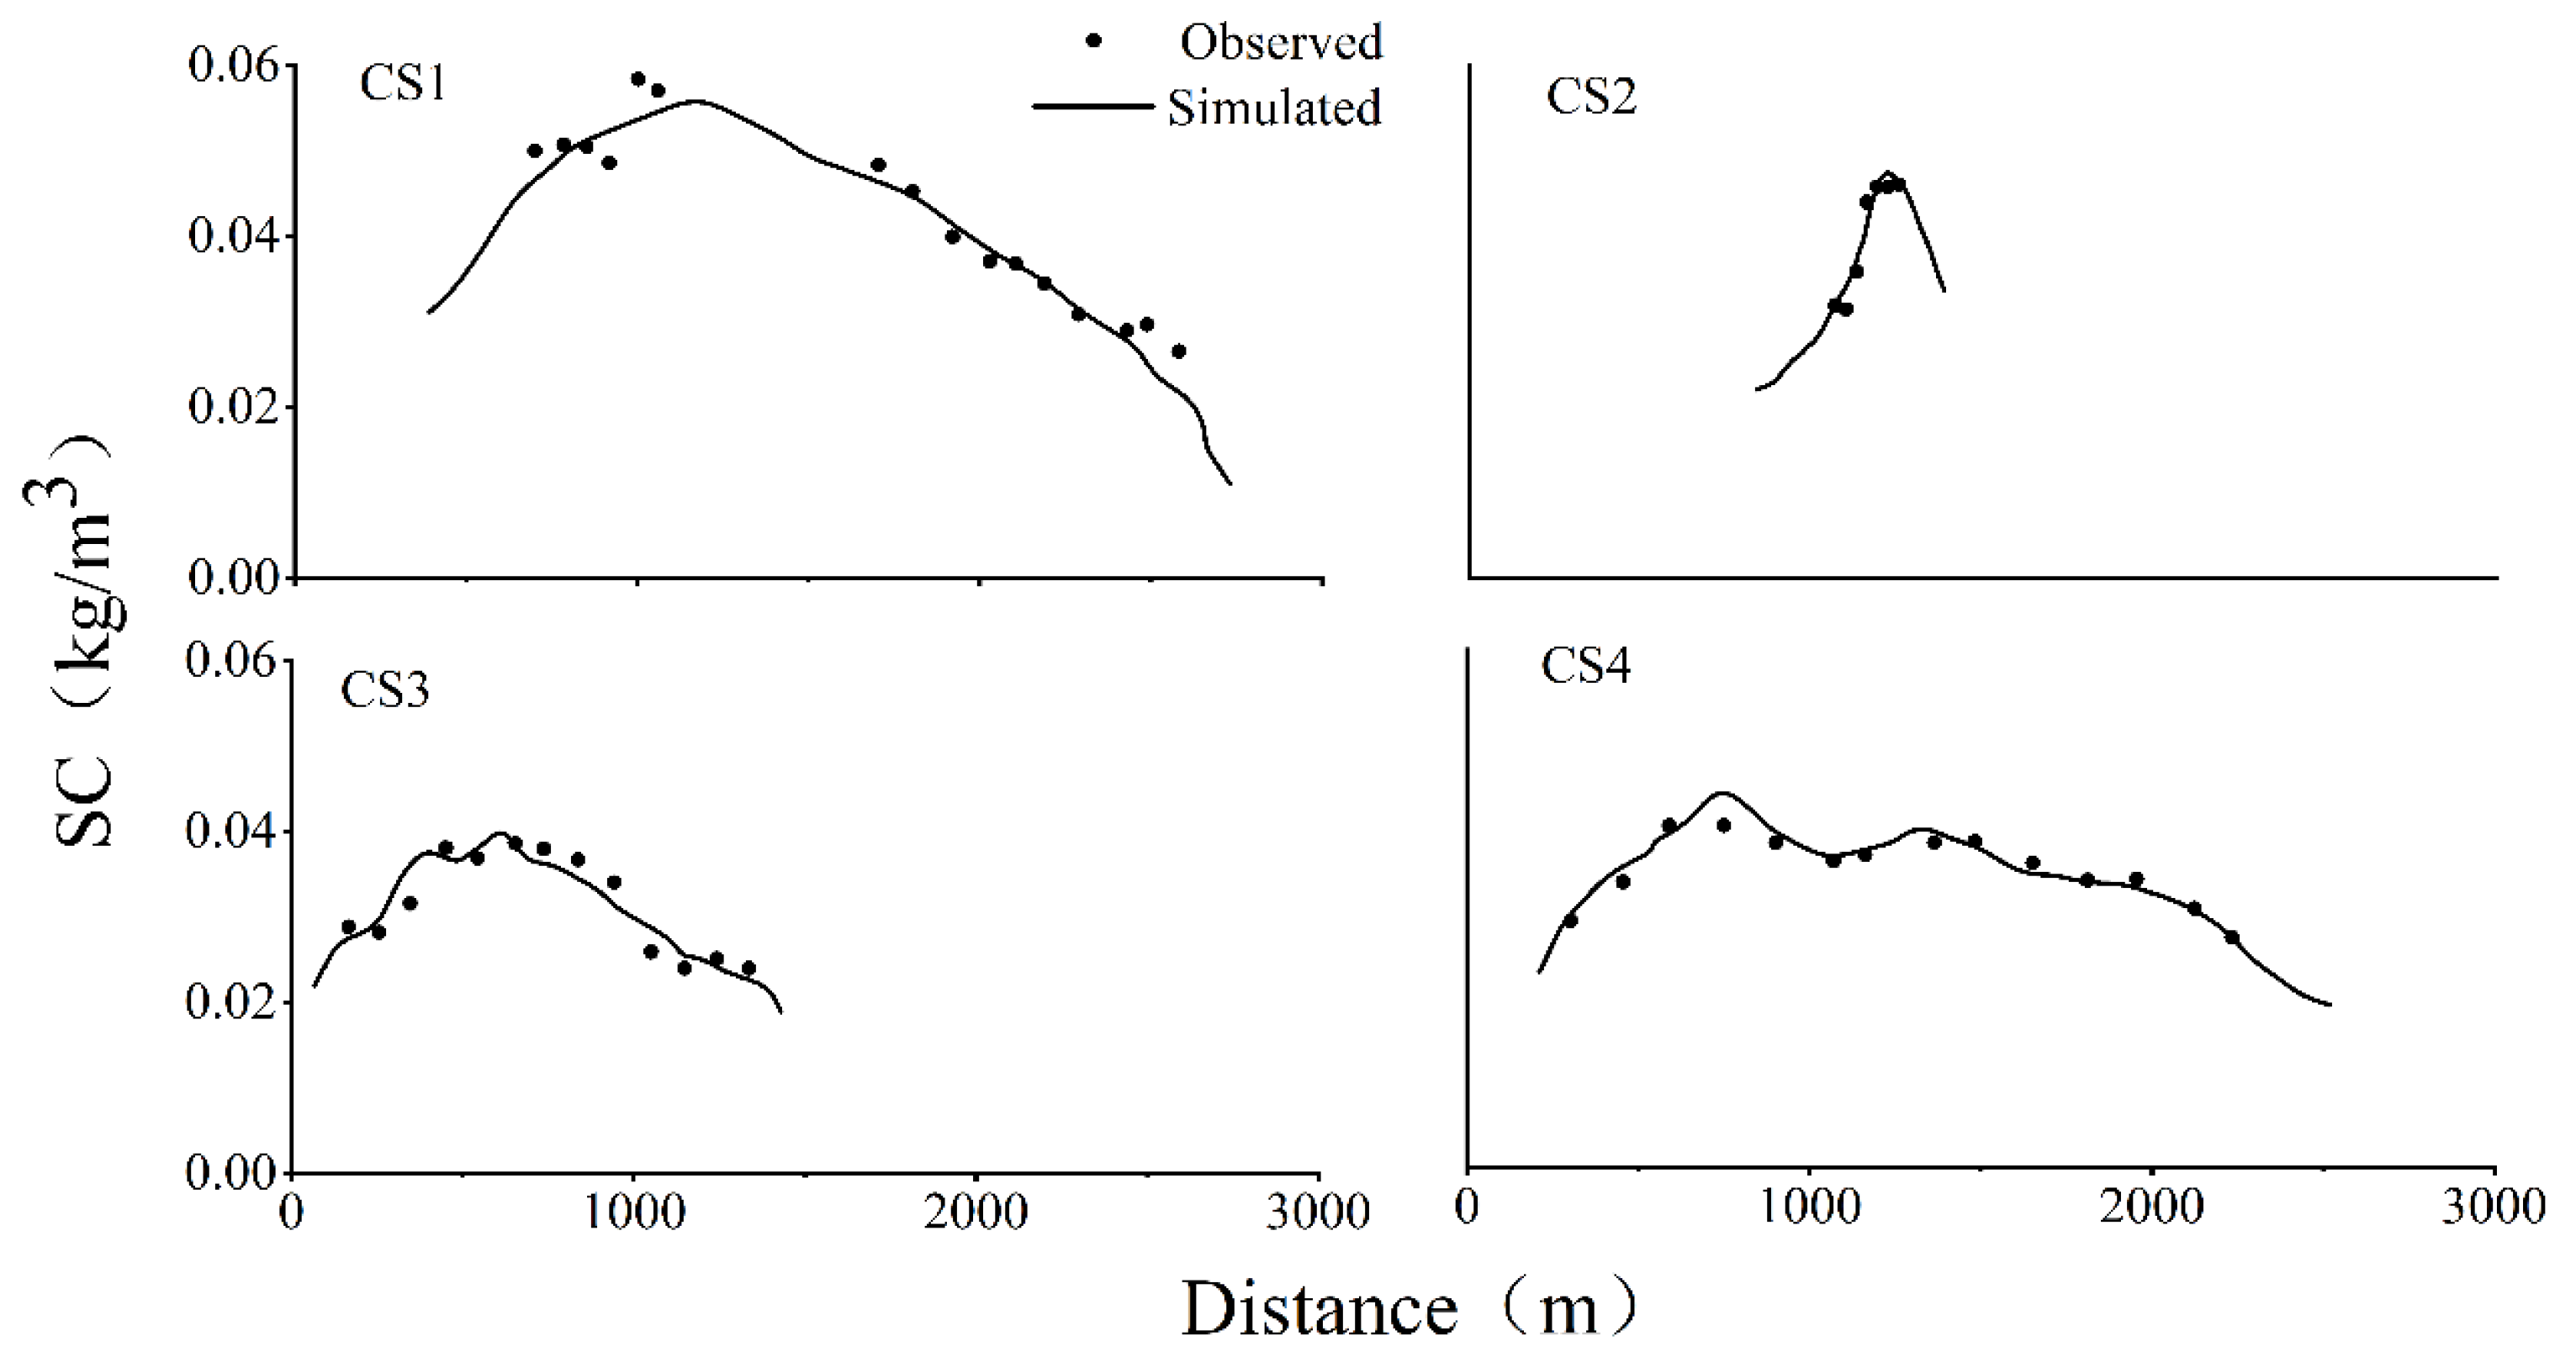
2.4. Numerical Simulation

Delft3D is a comprehensive hydrodynamic modeling system developed by WL Delft Hydraulics at Delft University of Technology in the Netherlands. It employs a well-fitted, boundary-fitted curvilinear grid discretization format capable of simulating unsteady flow and material transport phenomena. The sediment transport module (Delft3D-SED) is used to study the transport of cohesive and non-cohesive sediments, such as the dispersion of dredged materials, and the analysis of bedform evolution and erosion patterns. It is suitable for scenarios where variations in bed topography can be neglected in the assessment of flow conditions. In this study, we utilized Delft3D to simulate the process of riverbed evolution.
The total length of the simulated river section is approximately 18 km. To better adapt to the complex geometry of the gooseneck-type branching channel, a boundary-fit curvilinear grid is used, and a total of 9720 planar grids are divided into the computational area, with minimum grid sizes of 24 m and 31 m along and perpendicular to the flow direction, respectively. The maximum grid size is 223 m and 235 m, respectively. The vertical direction was divided into 8 layers, with the height of each grid layer being 12.5% of the water depth from the riverbed to the water surface. Based on the 2018 1:10,000 topographic map of the riverbed (Table 1), the grid node elevations were interpolated to generate the grid nodes to ensure the accurate reproduction of the shallow and deep channel morphology (For specific Settings, please refer to Figure 2). The model inlet used the 2003–2023 daily mean flow data from the Jiujiang Hydrological Station as the input condition, and the outlet boundary used the interpolated water level from the Jiujiang Hydrological Station (Appendix A). In the deep channel area, the roughness coefficient n = 0.02–0.023, which responds to the smooth scouring of the riverbed after TGD operation, and the roughness coefficient n = 0.025–0.028, which corresponds to the increase in surface roughness due to rock casting bank protection and vegetation cover, were used as input conditions for the model, and the initial roughness range was set based on the historical study [16]. The initial roughness range is set based on the historical study (in the deep channel area, the roughness coefficient n = 0.02–0.023, in response to the TGD operation, the riverbed scour is smooth, the roughness coefficient of the bank and beach n = 0.025–0.028, in response to the increase in surface roughness due to the casting of rock revetment and the vegetation cover), and the regional roughness is adjusted by combining with the measured flow rate and water level data, to minimize the root-mean-square error between the simulated flow rate and the measured value, to ensure the model’s reliability in the complicated branching channels, and to provide the results of the engineering adaptability evaluation with high confidence.

3. Results

3.1. Computational Scenarios

Since the damming of the TGD, the riverbed morphology of the study area has undergone significant changes, which in turn have exerted profound impacts on its hydrodynamic characteristics. This study first conducted a change-point analysis on the spatiotemporal variations in water and sediment inflows from the upstream of the study area was first performed to identify the significant differences in hydrological and sedimentary processes before and after the impoundment of the TGD. Subsequently, a well-calibrated and validated hydro-geomorphological coupled model was employed to quantitatively calculate the variations in hydrodynamic parameters and the trend of river channel evolution. By utilizing hydrological sequence data from 2003 to 2018 to simulate different hydrodynamic scenarios, comparative analyses were conducted on the hydrodynamic characteristics and scour reduction rates of the river channel under flow conditions corresponding to the 95%, 75%, 50%, and 25% exceedance frequencies.
It is worth noting that the hydrological sequence data from 2003 to 2023 accurately reflect the measured hydrological processes following the impoundment of the TGD. Based on the previously established one-dimensional hydraulic model of the Yangtze River section from Yichang to Datong, this study meticulously calculated the discharge, water level, and sediment concentration during this period under the conditions of the reservoir construction project. In addition, this study thoroughly investigated the impacts of engineering protection measures on bars and shoals within the study river section and comprehensively assessed their adaptability to changes in water and sediment, with detailed results presented in Table 3 and Table 4.

3.2. Changes in Hydrological Processes

A comparative statistical assessment was made of the hydrological data with and without flow regulation by the TGD, with the data divided into flood (June–September) and non-flood (October–May) seasons for comparative analysis (Figure 3). In the non-flood season, the average discharge with TGD was higher, reaching 1.62 × 10⁴ m3/s, while without TGD, the discharge range was broader, varying from 0.88 × 10⁴ m3/s to 3.81 × 10⁴ m3/s. In the flood season, the average discharge with TGD significantly increased to 3.40 × 10⁴ m3/s, whereas without TGD, the average discharge range was from 1.27 × 10⁴ m3/s to 6.85 × 10⁴ m3/s. The results indicate that the hydrological regulation project in the TGD area is more stable with flow regulation, effectively controlling discharge fluctuations and reducing the probability of extreme flow events.
In terms of sediment transport rates, the rates were significantly higher without TGD. Specifically, at the 1%, 10%, and 50% exceedance frequencies, the sediment transport rates without TGD were 34.13 kg/s, 14.4 kg/s, and 0.86 kg/s, respectively, while with TGD, the rates were 14.8 kg/s, 4.82 kg/s, and 0.66 kg/s, representing reductions of 56.63%, 66.53%, and 23.26%, respectively. The construction of the TGD has significantly altered the downstream hydrological conditions by regulating flow and trapping upstream sediments, effectively reducing the frequency of downstream floods and inducing substantial modifications on the sediment transport processes in the river channel [17].
In summary, after the TGD water storage, the drastic hydrological changes in the study area (such as a 62% decrease in the average annual sediment content and a 30% increase in the extreme flow frequency) directly drive the shallow beach stability index below the critical threshold (1.024) by enhancing the sediment transport capacity and shear stress (such as the shear stress at the lower end of the sandbar at a 25% frequency flood reaching 12.6 N/m2). Quantitatively, the model shows that the training works; although increasing by 14.5% (from 0.744 to 0.852), it cannot reverse the trend of unbalanced erosion. It is necessary to dynamically optimize the project layout to deal with the continuous variation in water and sediment.
The changing intensity of the hydrological regime was assessed using the 33 IHA indexes proposed by Richter and the RVA method (Figure 4). The analysis shows that (1) monthly flow regimes demonstrate pronounced interquartile variability (IQR = 33–66%) in February and June, which are classified as Category 2 alterations (|RVA| > 33%) according to Richter’s threshold criteria; (2) sediment flux displays a phase-shifted seasonality, with a 7-month duration of Category 2 variability showing 15 ± 3 day lag behind corresponding flow variations, attributable to bedload adjustment hysteresis; (3) annual extreme value data reveal that the minimum annual flow exhibits greater variation compared to the maximum annual flow, whereas sediment transport rates show the opposite pattern; (4) the timing of annual extreme values for discharge and sediment transport rates varies minimally, with the minimum values changing by approximately one month and the maximum values changing within ten days. The frequency and duration of high and low pulses have decreased, especially for low pulses, indicating moderate changes. Overall, sediment transport rates are more significantly affected, with 10 out of 33 indicators showing moderate variability, compared to 6 indicators for flow.

3.3. Hydrodynamic Change

The operation and regulation of the TGD have significantly moderated the intensity of riverbed erosion, as illustrated in Figure 5. During the flood season, the maximum erosion intensity under the TGD was 21.25, which is only 59.47% of the intensity observed without the TGD. In contrast, during the non-flood season, the maximum erosion intensity under the TGD was 42.33, accounting for 85.44% of the erosion intensity observed in the absence of TGD. The average and minimum erosion intensities are roughly equivalent to the average and minimum erosion intensity under the two conditions, which indicates that the river treatment project of the lower reaches of the TGD effectively controls the flow velocity and erosion intensity during the flood peak [18].
The comparative analysis of cumulative sediment transport capacity in the river section, under conditions with and without the TGD, is illustrated in Figure 6. The left panel (with TGD) shows the data distribution influenced by TGD operations, characterized by a mean (μ) of 14.448 and a standard deviation (σ) of 7.502. Conversely, the right panel (without TGD) displays the data distribution in the absence of TGD, with a mean of 13.755 and a standard deviation of 7.044. The figure indicates that the data points associated with TGD (represented in green) exhibit a closer alignment with the reference line on the normal probability plot, indicating a distribution that more closely approximates normality. In contrast, the data points without TGD (depicted in red) demonstrate a significant deviation from the reference line, particularly in the tail regions of the distribution. This implies that the presence of the TGD improves the stability and predictability of the data distribution, rendering it more stable and predictable. In the absence of TGD, the data exhibit greater variability, potentially indicative of outliers or biases.
This disparity in sediment transport characteristics may be primarily attributed to the significant reduction in sediment supply downstream of the dam caused by reservoir regulation. Although the suspended sediment concentration at downstream sections shows a gradual recovery trend, it has not yet reached a state of sediment equilibrium. The research findings indicate that the river system exhibits enhanced cumulative sediment transport capacity under non-equilibrium sediment transport conditions [19]. Comparison of hydraulic erosion intensities reveals the direct effect of TGD regulation on shoal erosion: erosion energy quantification: after TGD operation, the F value during flooding (mean 14.45) was elevated by 5.0% compared to the no-TGD scenario (13.76), indicating an enhanced potential for scouring by the current at the same flow rate. Despite the 62% reduction in sand content due to sand interception by TGD, flow (regulation resulted in a more concentrated spatial and temporal distribution of F (standard deviation 7.50 vs. 7.04), exacerbating intermittent violent scour at the foot of the shallow slope.
Figure 7 illustrates the distribution characteristics of shear stress under four operational conditions with varying flood return periods. When the flood return period is 25%, the shear stress gradient at the edge of the training area near the shoals reaches its maximum value, decreasing with increasing flood return periods. Under identical flood return period conditions, the local shear stress in the thalweg region increases significantly because of reclamation works, irrespective of the upstream reservoir impoundment, while the flow shear stress along the dam-side shoreline markedly decreases. Comparative analysis results demonstrate that the upstream reservoir impoundment effect does not significantly influence the shear stress distribution differences in the local tidal flat reclamation reach.
The relationship between the shear stress of water flow and sediment transport is highly intricate. As the shear stress increases, the likelihood of sediment particles on the riverbed being eroded is significantly enhanced. When the critical shear stress required to initiate sediment movement exceeds the resistance of sediment particles to erosion, these particles are entrained by the water flow and transported downstream Consequently, in natural river channels that have not undergone any training works, fine-grained sediments on the surface of bars and shoals are highly susceptible to erosion, resulting in a more pronounced contraction of these bars. In contrast, bars and shoals in channels that have undergone restoration projects typically feature more robust protective structures, which effectively resist erosion and significantly reduce the rate of bar retreat, thereby achieving better protection of the river bars.
Under S(I)–S(II) conditions, in the training works area, the variation area and numerical difference in shear stress are the largest at 25% flow frequency and the smallest at 95% in the training work area, while in the shoal area, the variation area and numerical difference in shear stress show the opposite change, and the variation rule of S(III)–S(IV) is the same, and the difference is that the latter shoal area has a larger variation area. The two groups of comparisons show a symmetrical distribution of extreme values, but the extreme difference in S(III)–S(IV) is smaller, which indicates that the change in shear stress in these two conditions is gentler, or the design parameters of the conditions are closer to each other.

3.4. Causes Analysis of the Morphological Evolution

Figure 8 presents the outcomes of sediment transport and riverbed stability studies for the river reach in question. Figure 8a delineates the alterations in sediment grain size before and after the construction of the TGD. After the dam was constructed, sediment from the upstream area accumulated within the reservoir, precipitating a substantial diminution in the sediment concentration of the downstream flow. Downstream of the dam, the riverbed has been persistently subjected to scouring and incision. Fine-grained sediments are transported downstream, while coarse-grained sediments form a layer of bed armoring on the riverbed. Meanwhile, the grain size of the continuously supplied suspended sediment has also gradually increased, with the median grain size growing from 0.013 mm to 0.028 mm [20].
The spatial distribution of riverbed stability indices under different computational conditions is shown in Figure 8b. Under the flow regulation of the TGD, the average stability index for the protected grid areas with river training works is 0.852, while that for the protected grid areas without river training works is 0.744. Although the difference between the two values is small, the former is closer to the stability threshold of 1.024. Similarly, under uncontrolled inflow conditions, the average stability index for the protected grid areas with river training works is 0.969, compared to 0.953 for those without training works. This indicates that the presence of river training works significantly enhances the erosion resistance of shoals, thereby effectively stabilizing the protected areas of these islands.
Figure 8c presents the vertical distribution of sediment concentration under four different flow frequency conditions for S(I) and S(III). Although there are numerical differences in sediment concentration, the overall distribution pattern is similar: the sediment concentration is highest in the center of the river channel and decreases gradually towards both sides. Under the same conditions, as the flow frequency increases (or the discharge decreases), the sediment concentration also decreases. Under condition S(I), when the frequency increases from 25% to 95%, the sediment concentration decreases from 0.098 kg/m3 to 0.02 kg/m3. Similarly, under condition S(III), the sediment concentration decreases from 0.118 kg/m3 to 0.044 kg/m3. At the same flow frequency, the sediment concentration under the regulated flow conditions of the TGD is lower than that under the unregulated conditions for all four frequencies. This is due to the TGD’s retention of a large amount of sediment in the reservoir area, which results in a reduction in sediment concentration downstream.
Figure 9 presents the comparative results of riverbed evolution under different research conditions. The computations simulate the erosion and deposition processes of the riverbed under the influence of the TGD’s regulated flow and river training works, using the measured hydrological sequences and restored hydrological sequences from 2003 to 2023 as boundary conditions. Based on the topography of 2018 and using four observation sections, the future sedimentation and erosion trends in the study interval after five years were predicted.
Figure 9 C01 is located at the top of the shoals and is directly connected to the river training works, thus being directly influenced by them. The bed scouring in this area is significantly reduced, and the changes in terrain elevation are minimal. This may be because dredging operations have altered the hydrodynamic conditions of the flow, reducing the flow’s ability to erode the riverbed and thereby protecting it from scouring. Figure 9 C02 is in the branch area of the shoals, and Figure 9 C03 is in the main branch area of the shoals. The bed erosion in these two areas has also been reduced during the implementation of the training works, but to a lesser extent than in Figure 9 C01. This may be due to differences in the scope and intensity of the training works’ influence on different river sections, resulting in varying degrees of erosion reduction. Specifically, the branch area may receive less protection, while the main branch area may be more directly protected.
The observational results indicate that, despite a reduction in scour intensity due to river training works, the riverbed elevation continues to decline in Sections C01, C02, and C03. This suggests that although dredging has a positive effect on curbing the contraction of shoals, it cannot completely prevent it. Figure 9 C04 is located at the downstream outlet of the river, where the reach of training works is difficult to extend. Therefore, compared to the situation without dredging, the degree of riverbed erosion in this area shows little difference. This further indicates that the influence of training works may be limited to the upstream part of the river, while erosion at the downstream outlet remains pronounced. Overall, Figure 9 reveals the impact of river training works on riverbed morphological changes. Areas, where training works have been implemented, show varying degrees of response in the processes of sedimentation and erosion, which helps to mitigate riverbed erosion and the contraction of shoals.
Figure 9 C01 (Chau Tau Engineering Reserve): the annual average scour depth decreased from 2.1 m (without engineering) to 1.5 m (28.6% decrease), and the standard deviation of the scour thickness in the engineering area decreased by 35% (from ±0.8 m to ±0.52 m). Figure 9 C02 (branch transition area): within 500 m from the head of the continent to the branch extension, the annual average scour rate increased from 1.2 m to 2.4 m (gradient increase of 100%), reflecting the spatial attenuation effect of the project protection scope. Figure 9 C03 (deep channel area of the main branch): the average scour depth is 3.8 m, which is 72.7% higher than that of the scenario without TGD (2.2 m), and is mainly due to the concentration of flow energy caused by the reduction in sand content (peak shear stress 16.9 N/m2 vs. 14.3 N/m2). Figure 9 C04 (downstream outlet non-protected area): the scour rate is almost the same as in the no-engineering scenario (2.6 m vs. 2.7 m per year), which verifies the spatial limitation of the engineering impacts. The standard deviation of scour thickness in the project area (C01–C03) was ±0.6 m, significantly lower than in the non-engineering area (C04, ±1.2 m). Through quantitative labeling and statistical panels, Figure 9 directly correlates the engineering effects, water–sediment drivers, and geomorphic responses, providing a data baseline for the refined assessment of branching channel management.

4. Discussion

The implementation of river training works has significantly augmented the stability of riverbanks and shoals and improved their resistance to erosion [21,22,23]. However, with the changes in the hydro-sedimentological conditions compared to those upstream, the existing river training works in this study have proven insufficient in fully adapting to these changes. As a result, the training works can only partially mitigate the contraction of shoals by slowing down the erosion rate, rather than reversing the erosion trend. The final geomorphological change maps further corroborate this conclusion. The main reason for the existing treatment works failing to fully adapt to the hydrological changes is that their design was predicated on historical steady-state conditions (e.g., average annual sand delivery of 430 million tons), whereas the actual downstream sand delivery after the TGD operation plummeted to 160 million tons (a decrease of 62.8%), resulting in a significant deviation from the engineering thresholds of resistance to erosion K y (e.g., in the new water–sand non-equilibrium state). For example, although the bank protection project raised the head of the continent by 14.5% (to 0.852), it could not offset the erosion triggered by the increase in sand transport capacity F.
The sediment-trapping effect of the upstream reservoir results in a significant accumulation of sediment within the reservoir area, thereby causing a marked reduction in the sediment concentration of the downstream flow. This change endows the downstream flow with greater residual energy, leading to continuous scouring of the riverbed and the progressive retreat of shoals. With the implementation of river training works in the study reach, the erosion resistance of shoals has been significantly enhanced. Although this measure has strengthened the overall stability of the bars and partially mitigated their recession, the fundamental trend remains unchanged, with only a reduction in the rate of retreat [24].
River training works alter the shape and cross-sectional profiles of rivers, thereby influencing flow velocity and direction. The construction of these projects changes the width of the river channel, and modifications such as widening, narrowing, or deepening can affect flow velocity and flow regime, thus altering the erosion and deposition processes on the riverbed. During the natural evolution towards morphological equilibrium, the riverbed undergoes continuous adjustments to accommodate varying inputs of water and sediment. This indicates the presence of self-regulation mechanisms within the river system [25]. However, the implementation of river training works changes the river’s morphology and hydraulic conditions, thereby affecting its natural regulatory processes. The self-regulation of a river is essentially a dynamic response to changes in upstream water and sediment inputs [26]. Therefore, when the water and sediment conditions change, the river undergoes a series of automatic adjustments. Although river training works designed and implemented under the original hydrological conditions provide a certain degree of protection for shoals, calculations and measurements indicate that shoals continue to experience ongoing erosion and contraction, albeit with some mitigation of these processes. While the self-regulatory mechanism of the river system achieves dynamic equilibrium through feedback loops of sediment transport and bed morphology, engineering interventions (e.g., diversionary embankments) may inhibit or reconfigure this natural feedback pathway (e.g., accelerating deep channel flushing or altering the siltation pattern) by remodeling the local hydraulic boundary conditions, resulting in the system’s need to seek a new equilibrium under artificial constraints. The synergistic or conflicting relationship between the two directly determines the long-term sustainability of channel evolution.
Many scholars have argued that river training works can significantly enhance the stability of riverbanks and riverbeds and promote the restoration and reinforcement of river channels to some extent [27]. This study also corroborates this view, demonstrating that river training works alter the hydraulic conditions within protected areas, thereby reducing the intensity of erosive forces and stabilizing shoals. However, when hydro-sedimentological conditions change, the protective effects of these projects on shoal areas may not reach the satisfactory levels anticipated under the original design conditions. In such cases, it is necessary to adjust the river training works to ensure the continuous and effective protection and stability of shoals.

5. Conclusions

(1)
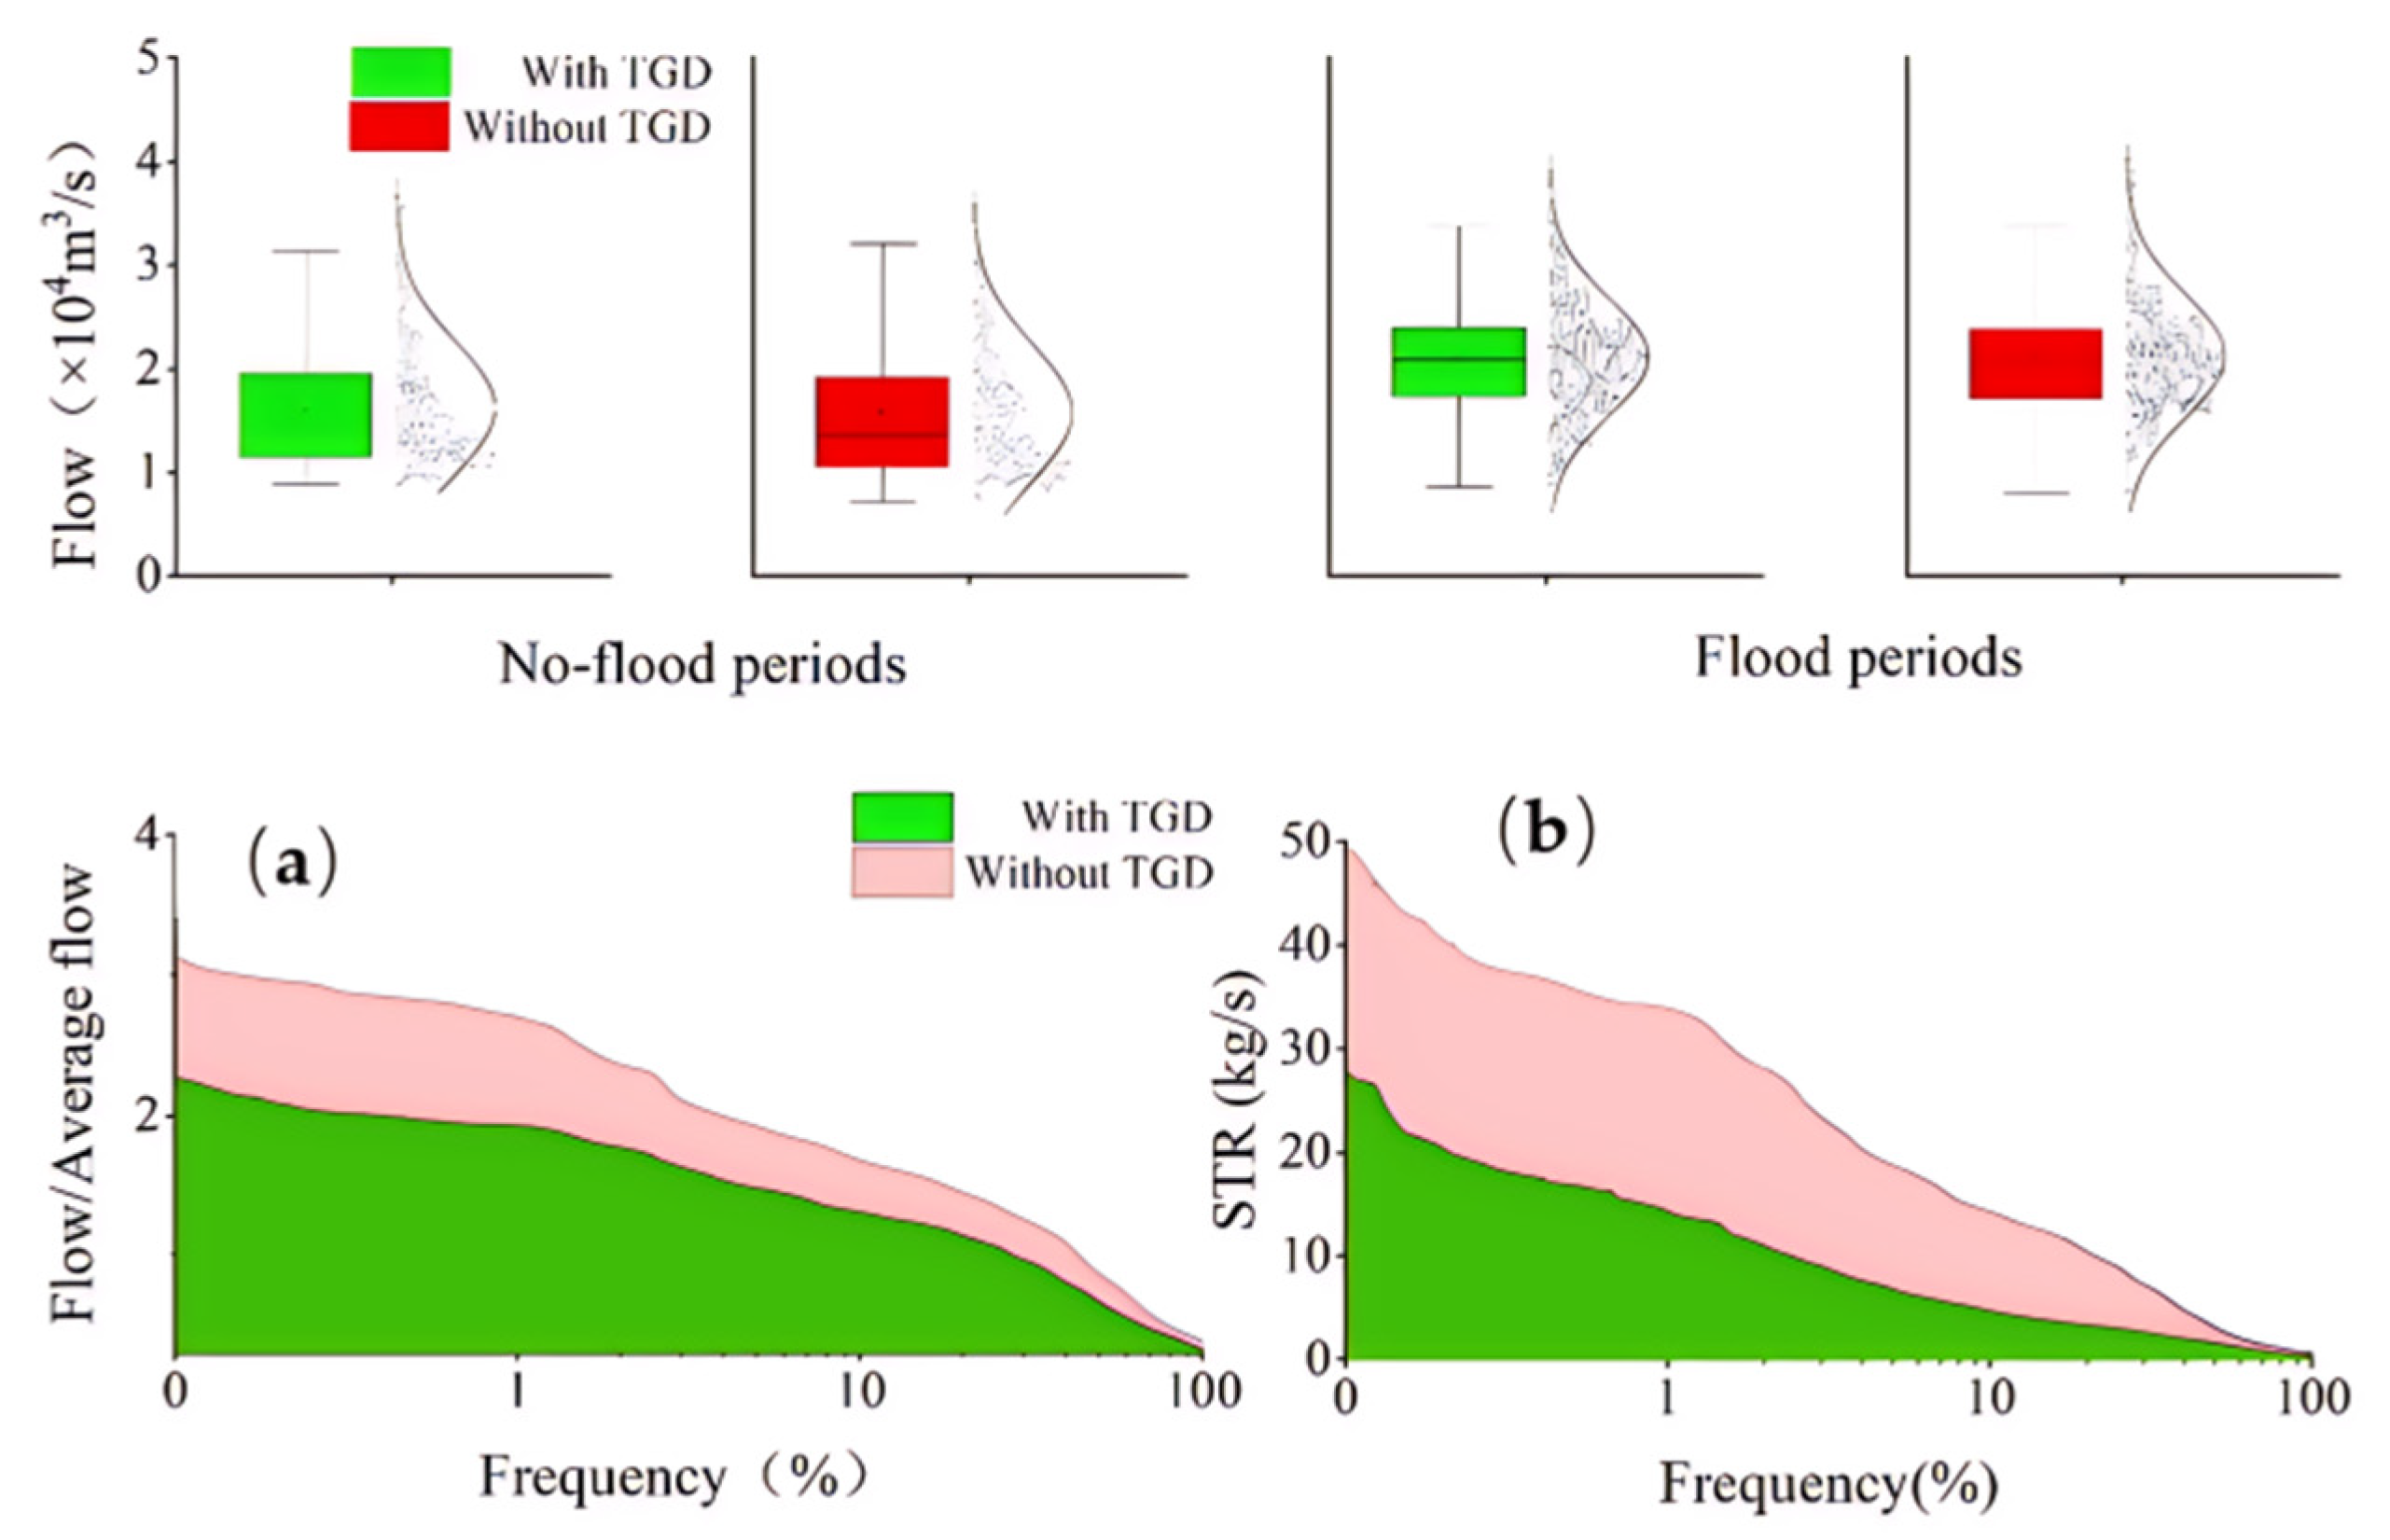
Downstream of the TGD, significant changes have occurred in water and sediment conditions. The reservoir’s storage capacity has led to a sharp decrease in sediment transport downstream, with the maximum sediment transport rate under similar frequency conditions decreasing by 66.53%. These changes in water and sediment directly impact the sediment transport and evolution processes of downstream river sections and shoals. The median particle size in the study area has increased from 0.013 mm to 0.028 mm, indicating that under engineering conditions of training works, riverbed stability indices are closer to the designated threshold of 1.024. This suggests that the presence of training works enhances the stability of shoals. The current river training works have deficiencies in adapting to new water and sand conditions. To improve the adaptability of the work to hydrological changes, the following specific measures are recommended: 1. Based on real-time hydrological monitoring data (e.g., flow rate, sand content, and topography of the riverbed), use machine learning algorithms to construct a water and sand response model, and dynamically optimize parameters of the revetment structure (e.g., rock-throwing granularity, and inclination of the diversion dyke), to match the unsteady water and sand conditions. 2. For different flood return periods (e.g., 10 years, 50 years, 100 years), design multi-stage bank protection structures (e.g., layered rock casting, an adjustable deflector) to enhance the work’s resistance to extreme hydrological events.
(2)
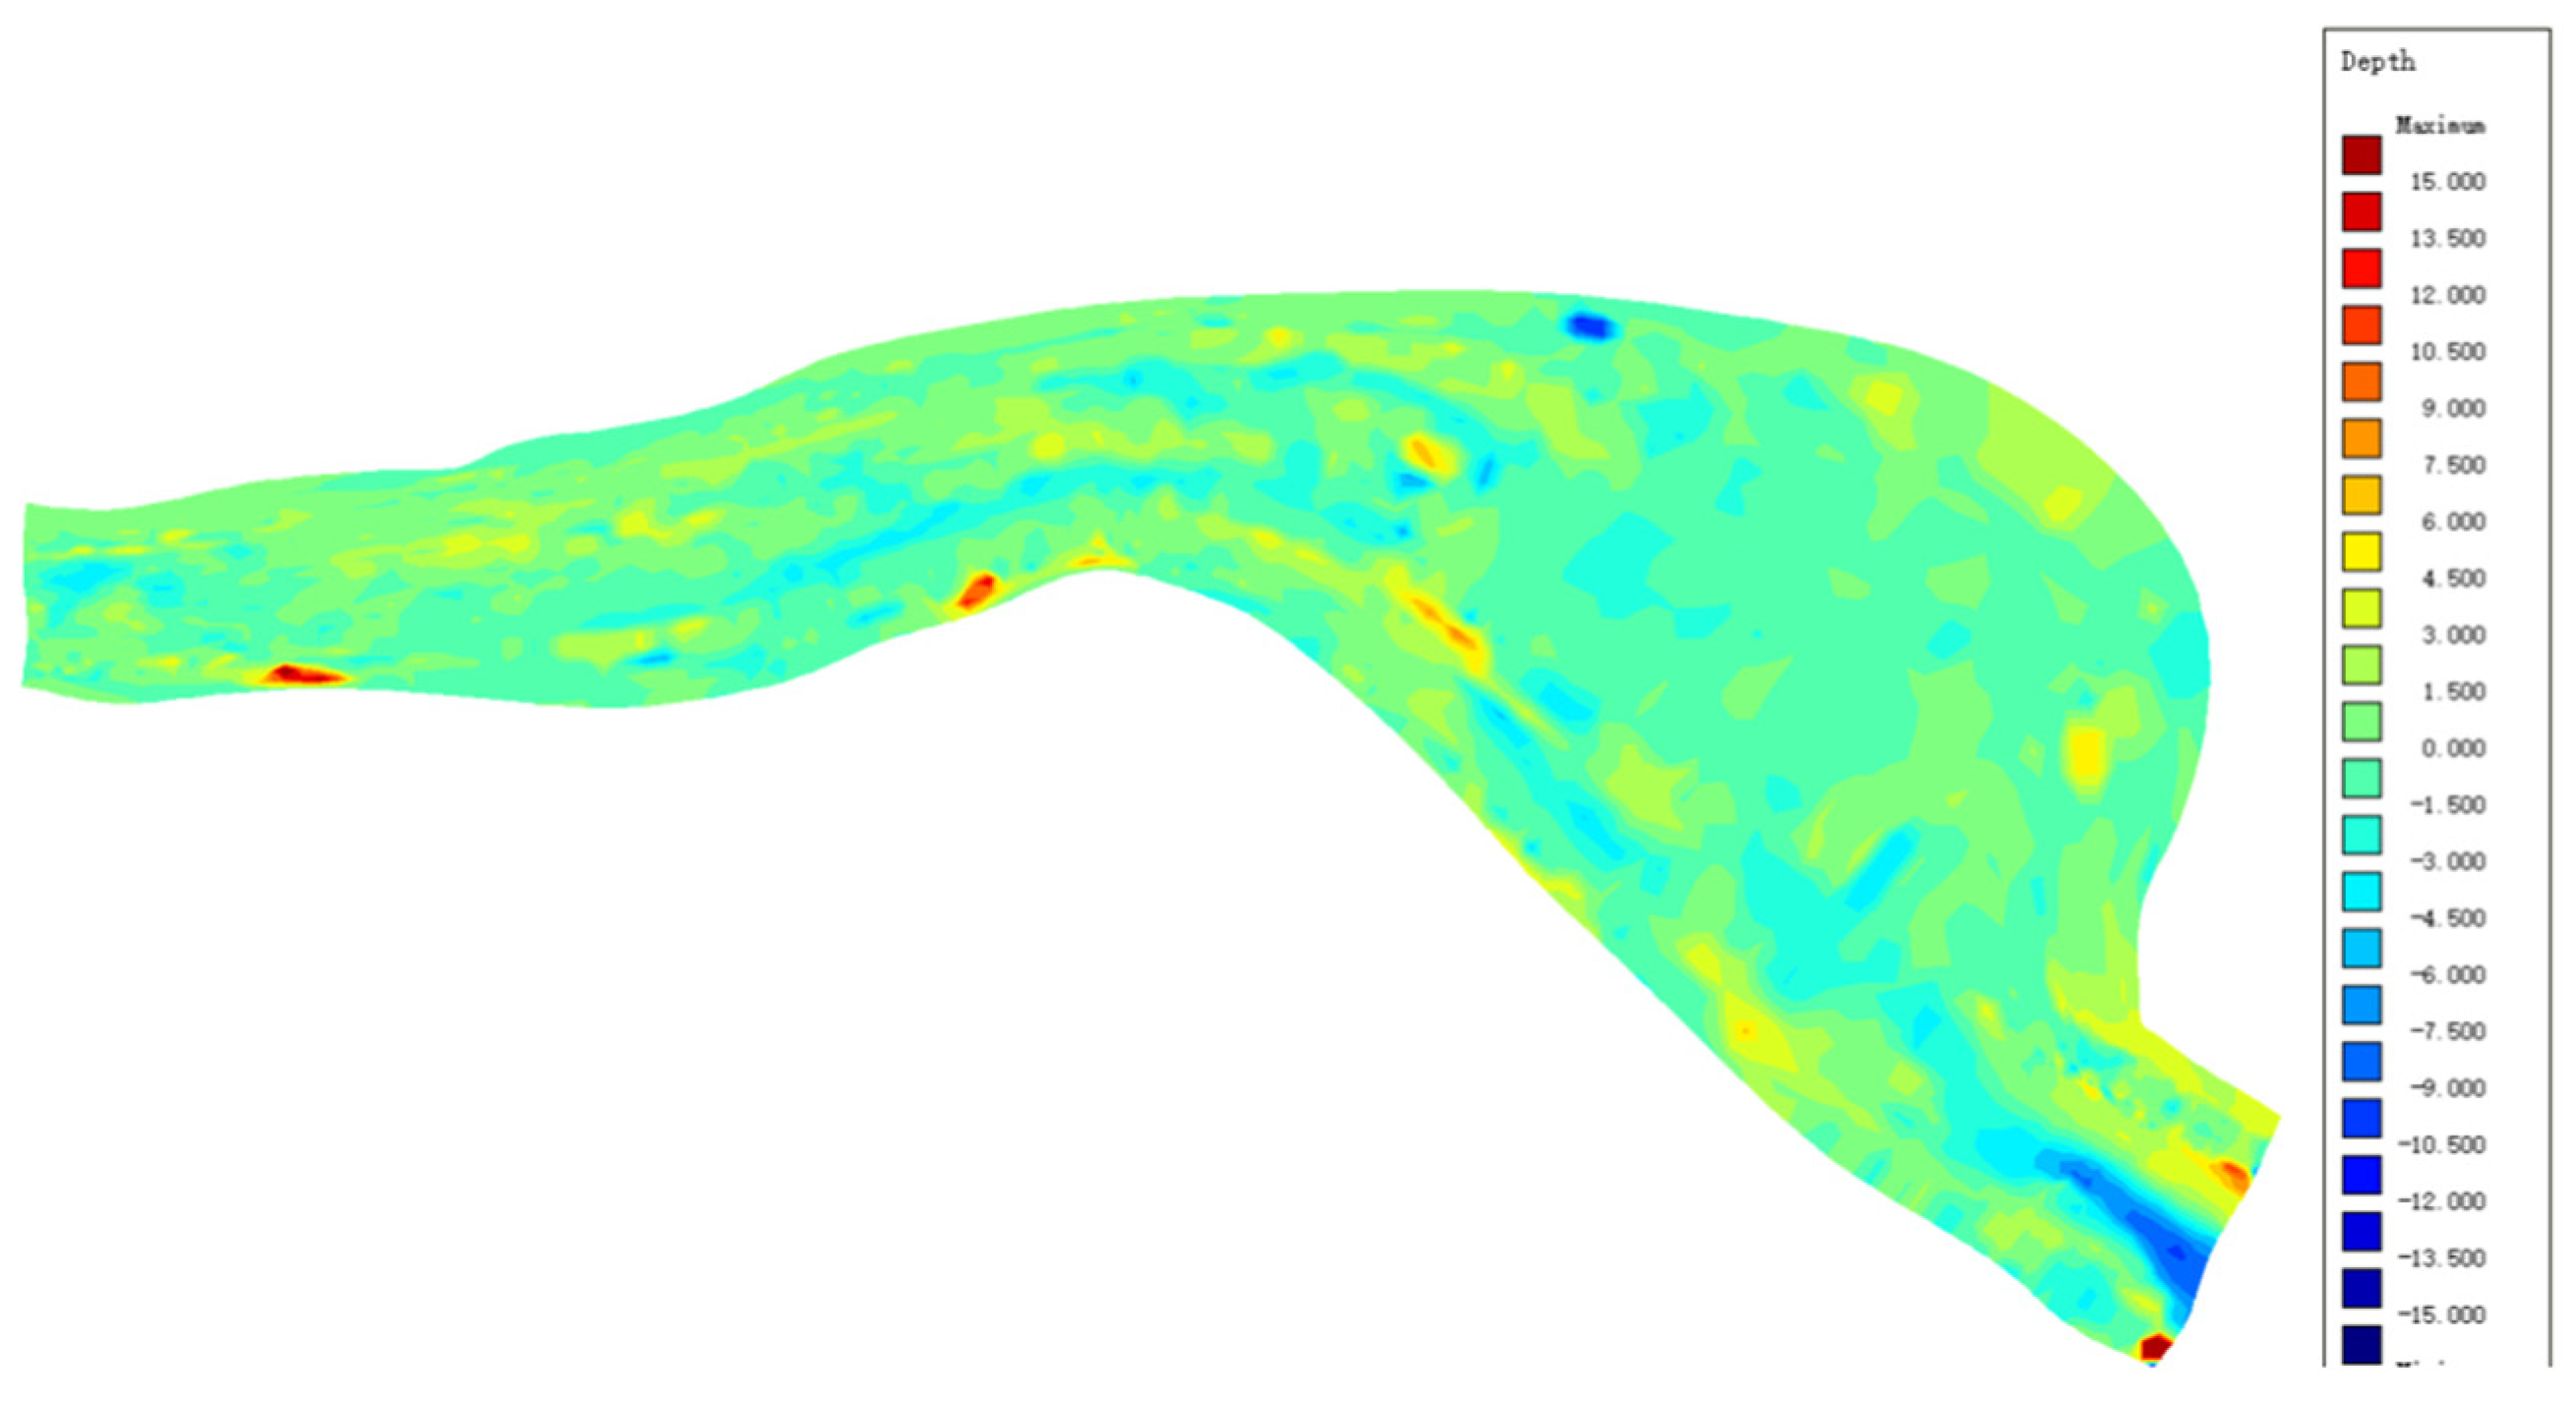
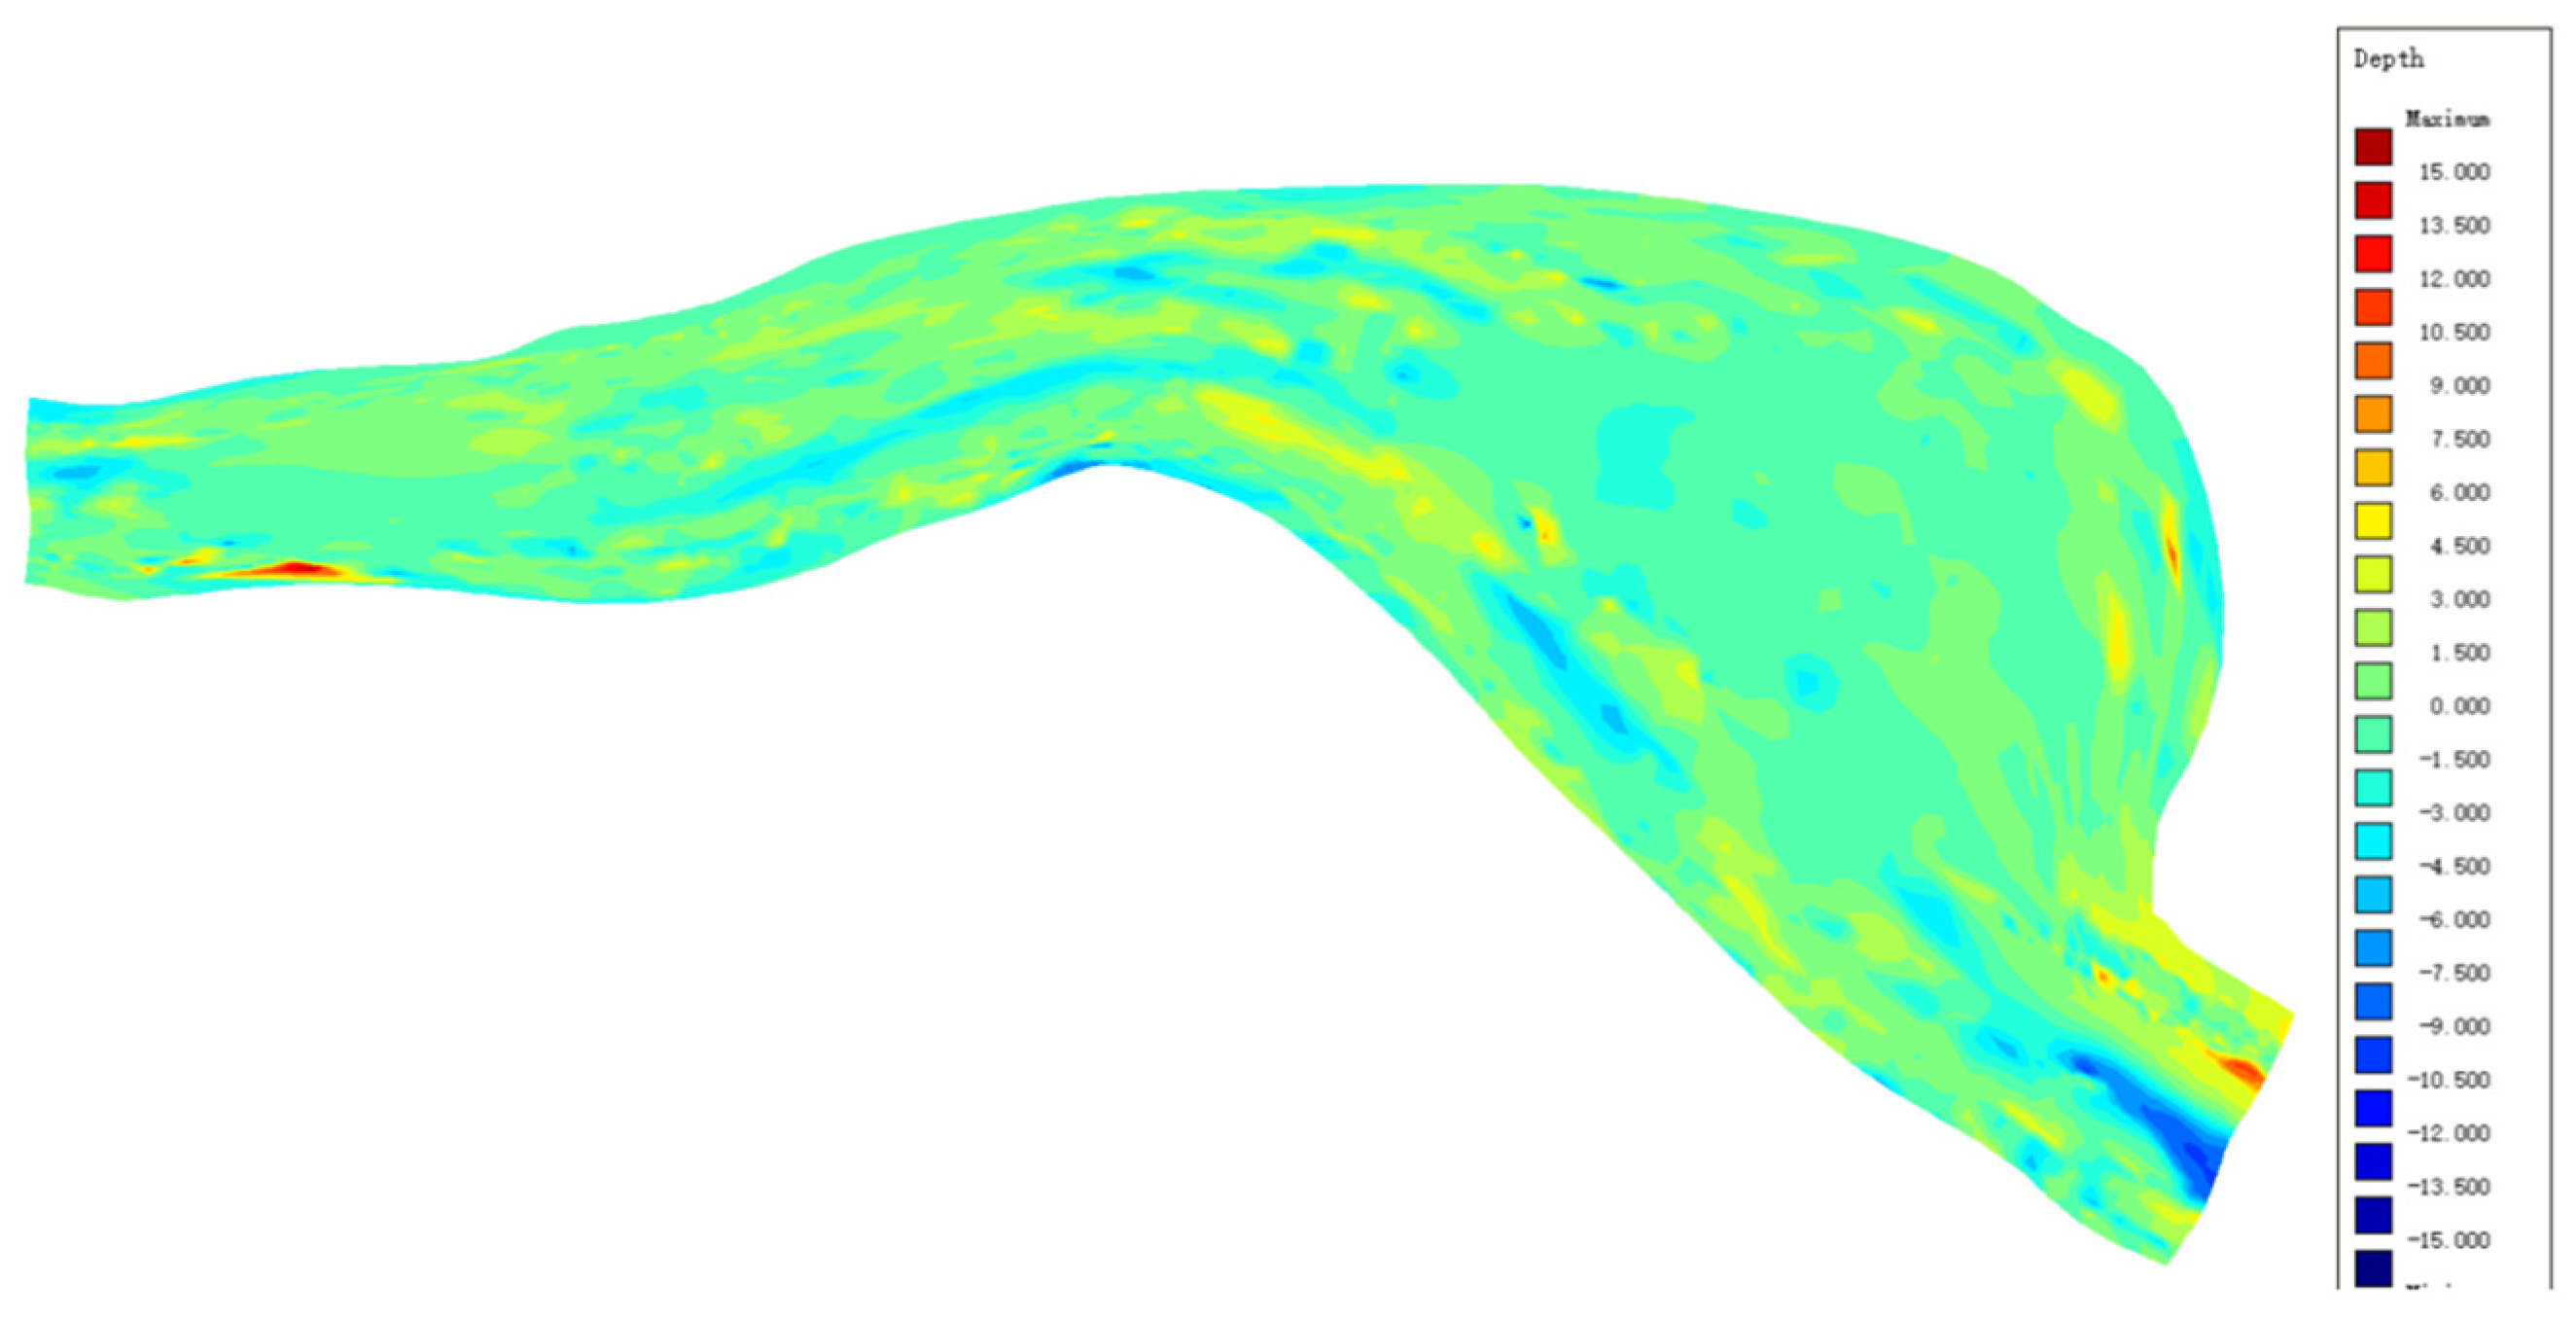
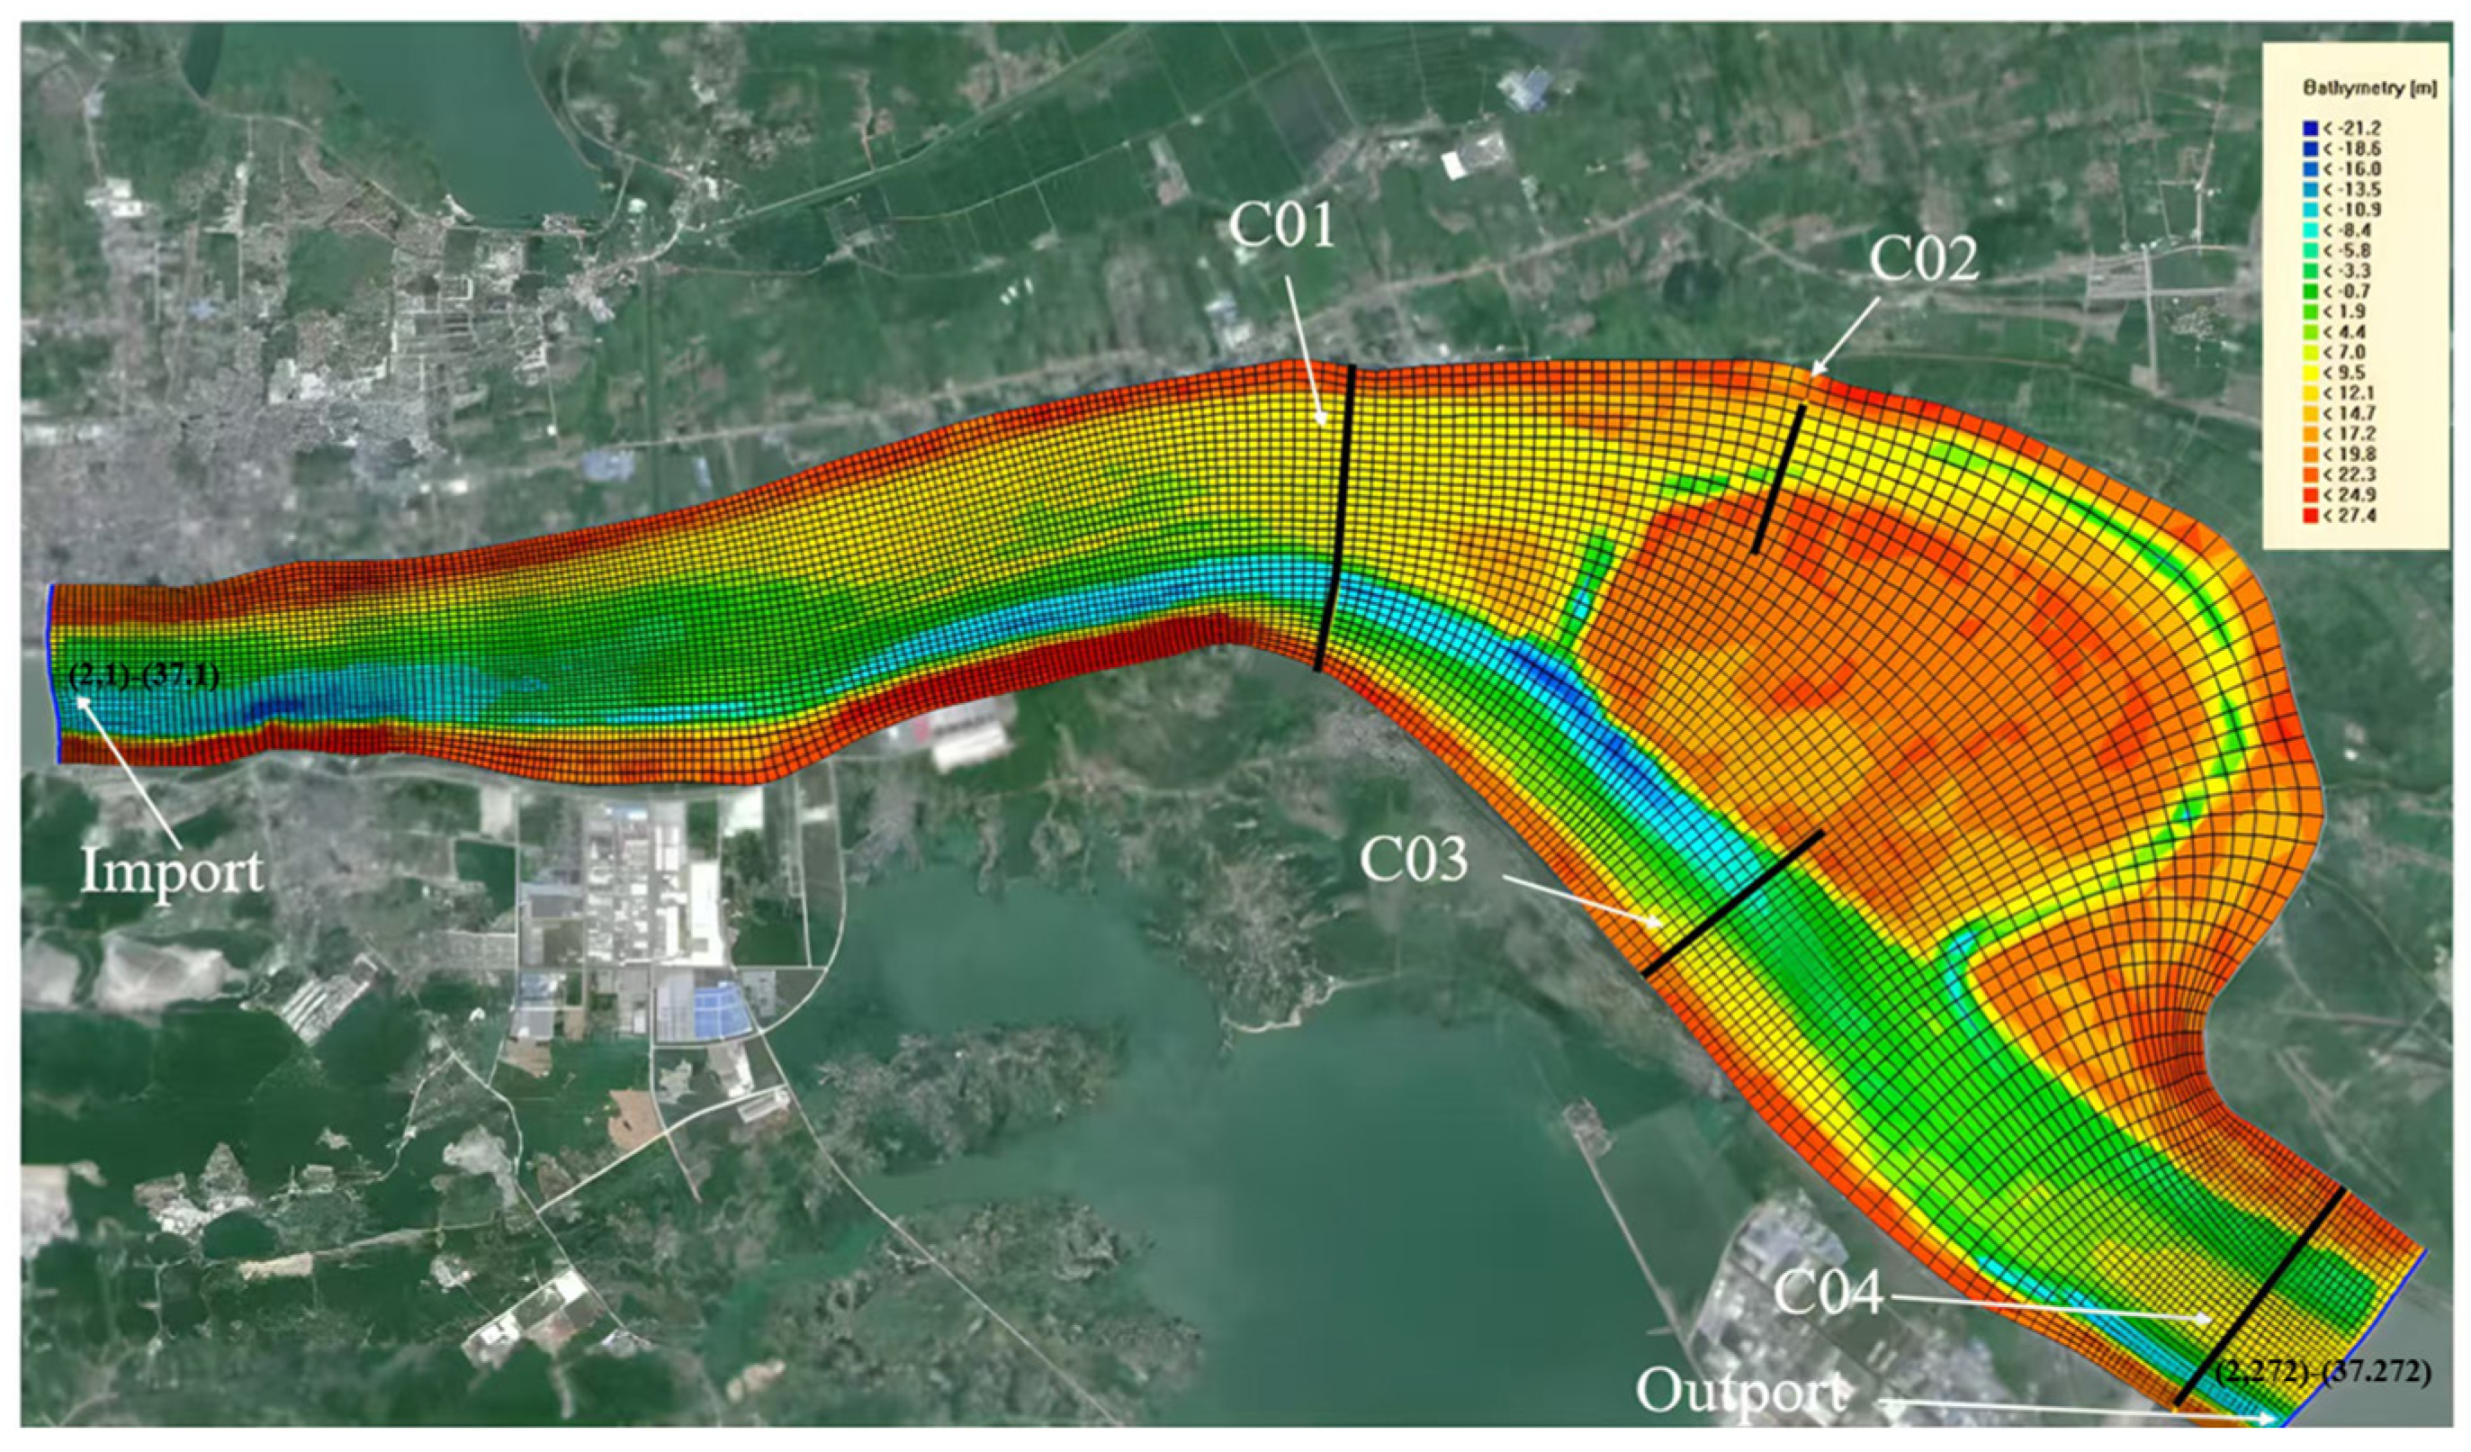
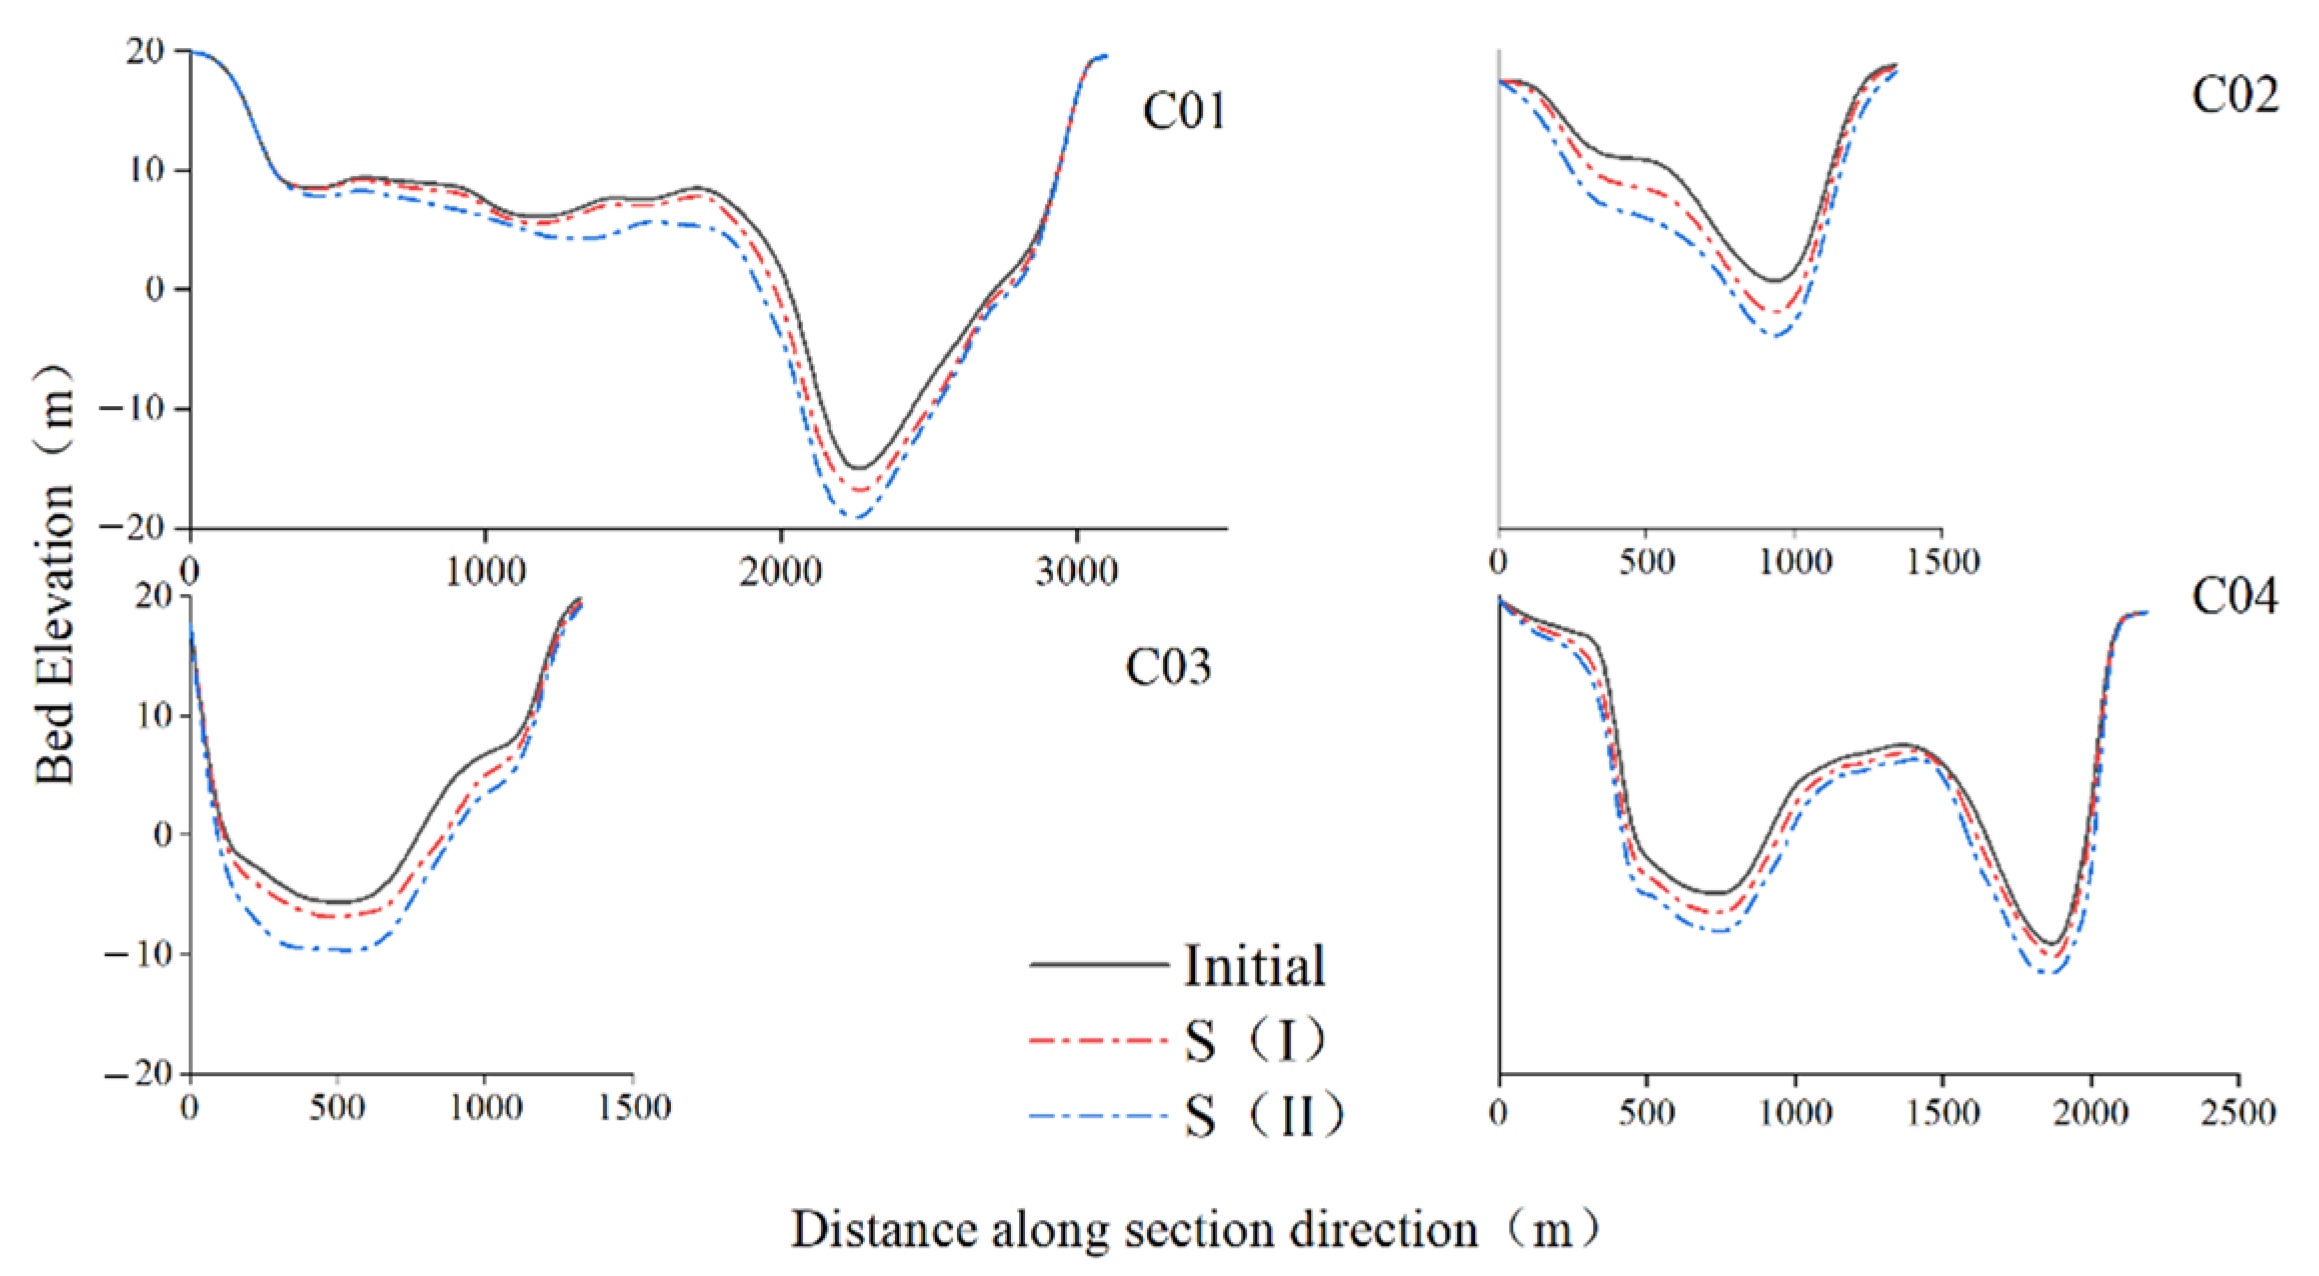
This study analyzed the influence of river training works on riverbed evolution by observing and monitoring the terrain change of cross-sections. The results showed that the river training works significantly weakened the scour of Section C01 (the head of the shoals) and played a positive role in restraining the beach shrinkage, although the riverbed elevation still decreased. The erosion degree of Sections C02 and C03 (the branch and main branch of the shoals) is also reduced, but the effect is not as good as that of Section C01. Section C04 (downstream outlet) exhibits little change in the scour depth of the riverbed due to the limited influence of the training works. In general, river regulation works can alleviate riverbed erosion and shoal shrinkage, but cannot completely inhibit them, and its effect is different in different sections of the river. This finding is of great significance for guiding future river management and ecological protection. In the future, in the context of the continuous operation of the TGD on the Yangtze River, river management needs to focus on the following directions: establishing a long-term water- and sand-monitoring system, combining real-time hydrological data with numerical model predictions, and dynamically adjusting engineering parameters (such as the strength of the bank protection materials and the layout of the diversion dykes) to cope with the non-steady-state changes in water and sand conditions; coordinating flood control, navigation and ecological protection objectives, optimizing the reservoir scheduling program (such as phased sand release and ecological flow release) to alleviate downstream channel erosion pressure.
(3)
Training works have altered river channel morphology and hydraulic conditions through measures such as constructing riprap revetments. However, the effectiveness of these measures is somewhat limited by changes in water and sediment conditions. Variations in water and sediment conditions during the study reveal that current training projects are somewhat inadequate in adapting to these conditions, which is one of the root causes preventing complete prevention of shoal erosion and shrinkage. Therefore, under the new water and sediment conditions, the adaptability of existing river training projects requires further in-depth evaluation to better serve the comprehensive utilization of basin water resources.

Author Contributions

Y.Y. (Yunping Yang): conceptualization, methods, investigation, data collation, methodology and write-up review. W.H.: Methodology, investigation, data collation, formal analysis, methodology, software and write-up review. Y.G.: Methodology, data presentation, software and validation. J.Z.: conceptualization, methodology, formal analysis and write-up review. Y.Y. (Yao Yue): Methodology, write-up review. D.Z.: Data presentation, software. L.L.: methods, resources, data presentation. X.C.: super perspective and write-up review. All authors have read and agreed to the published version of the manuscript.

Funding

The work was financially supported by the Hubei Provincial Natural Science Foundation of China (Grant Number: 2024AFB849), The National Natural Science Foundation of China (U21A2039), the Fundamental Research Funds for the Central Universities of South-Central Minzu University (Grant Number: CZZ24020, CZH25018), the Fund for Academic Innovation Teams of South-Central Minzu University (Grant Number: XTZ24019).

Data Availability Statement

Data will be made available on request.

Acknowledgments

The authors gratefully acknowledge the Hydrology Bureau of the Yangtze River Water Resources Commission, for their invaluable support in providing the essential datasets used in this research. We also thank anonymous reviewers, whose insightful comments have made an immense contribution to the study.

Conflicts of Interest

The authors declare no conflict of interest.

Appendix A

Model verification includes validation of cross-sectional horizontal velocity, vertical velocity, and sediment concentration, evaluated using the Nash efficiency coefficient to assess the accuracy of the model’s calculations. The verification results, as shown in the figure, indicate that the distribution pattern of calculated velocities closely matches the measured values. The Nash efficiency coefficients are all above 0.95, indicating a good agreement between the model calculations and the measured values.
Figure A1. Comparison between observed and simulated transverse velocity in cross-sections on 5 July 2018 (CS is the cross-section).
Hydrology 12 00148 g0a1
Figure A2. Comparison between the observed and simulated vertical velocity in cross-sections on 5 July 2018 (CS is the cross-section).
Hydrology 12 00148 g0a2
Figure A3. Comparison between observed and simulated sediment concentration in cross-sections on 5 July 2018 (CS is the cross-section; SC is the sediment concentration).
Hydrology 12 00148 g0a3
Figure A4. Changes in streambed scour with TGD conditions during the September 2018–April 2021 period.
Hydrology 12 00148 g0a4
Figure A5. Changes in streambed scour without TGD conditions during the September 2018–April 2021 period.
Hydrology 12 00148 g0a5
Table A1. Verification of flow diversion ratio in the research area.
With TGDWithout TGD
Main Stream Flow (m3/s)Tributary Flow (m3/s)Flow Diversion RatioMain Stream Flow (m3/s)Tributary Flow (m3/s)Flow Diversion Ratio
3 March 201612,44553395.89%11,90060095.20%
5 July 201826,634285990.30%25,634245891.25%
4 March 202218,90093595.28%18,60588595.45%

References

  1. Han, J.; Zhang, W.; Yuan, J.; Fan, Y. Channel evolution under changing hydrological regimes in anabranching reaches downstream of the Three Gorges Dam. Front. Earth Sci. 2018, 12, 640–648. [Google Scholar] [CrossRef]
  2. Kelin, H.; Ehab, M.; Andrew, N.J. The Effect of Phragmites australis Dieback on Channel Sedimentation in the Mississippi River Delta: A Conceptual Modeling Study. Water 2021, 13, 1407. [Google Scholar] [CrossRef]
  3. Huang, H.Q.; Wang, D.; Deng, C.; Liu, X.; Huang, L.; Ma, Y. Meandering-anabranching river channel change in response to flow-sediment regulation: Data analysis and model validation. J. Hydrol. 2019, 579, 124209. [Google Scholar]
  4. Li, L.; Ni, J.; Chang, F.; Yue, Y.; Frolova, N.; Magritsky, D.; Borthwick, A.G.L.; Ciais, P.; Wang, Y.; Zheng, C.; et al. Global trends in water and sediment fluxes of the world’s large rivers. Sci. Bull. 2020, 65, 62–69. [Google Scholar] [CrossRef]
  5. Zhu, L.; Yang, Y.; Zheng, J.; Zhang, H.; Wang, J. Influence of the Three Gorges Dam on the transport and sorting of coarse and fine sediments downstream of the dam. J. Hydrol. 2022, 615, 128654. [Google Scholar]
  6. Yang, H.; Jiao, X.; Guo, W.; Yu, L.; Huang, L.; Wang, H.; Wang, B. Synergistic evolution and attribution analysis of water-sediment in the middle and lower reaches of the Yangtze River. J. Hydrol. Reg. Stud. 2024, 51, 101626. [Google Scholar]
  7. Li, X.; Li, J.; Zhang, X.; Zhou, Y.; Zhang, Y. Enhanced lakebed sediment erosion in Dongting Lake induced by the operation of the Three Gorges Reservoir. J. Geogr. Sci. 2015, 25, 917–929. [Google Scholar]
  8. Liu, W.; Zhou, L.; Zhu, L.; Wang, J.; Yang, Y. Impact of upstream reservoirs on geomorphic evolution in the middle and lower reaches of the Yangtze River. Earth Surf. Proc. Land 2022, 48, 582–595. [Google Scholar]
  9. Zhang, D.; Dai, M.; Li, Y.; Wang, H. Characteristics of runoff in the three outlets along Jingjiang River and the influence of water supplement by the reservoirs during 1956–2020. J. Lake Sci. 2022, 34, 945–957. [Google Scholar]
  10. Richter, B.D.; Baumgartner, J.V.; Powell, J.; Braun, D.P. A Method for Assessing Hydrologic Alteration within Ecosystems. Conserv. Biol. 1996, 10, 1163–1174. [Google Scholar] [CrossRef]
  11. Ahmed, P.; Javaid, S.; Bhat, W.A.; Rather, A.F.; Ahmed, R.; Ahmad, S.T. Assessing changing flow regime of upper and middle reaches of Narmada river using the indicators of hydrological alterations (IHA) metrics. ISH J. Hydraul. Eng. 2023, 29 (Suppl. S1), 315–324. [Google Scholar]
  12. Deng, S.; Xia, J.; Zhou, M.; Lin, F. Variations in planform and cross-sectional geometries of the Jianli reach over the past fifty years. Chin. Sci. Bull. 2017, 62, 2698–2708. [Google Scholar]
  13. Wang, S.; Duan, G.; Tian, L.; Wang, M.; Shu, A.; Rubinato, M. An Experimental Study on Mechanisms for Sediment Transformation Due to Riverbank Collapse. Water 2019, 11, 529. [Google Scholar] [CrossRef]
  14. Wei, H.-Y.; Yu, M.-H.; Wu, S.-B. Experimental study on the bank erosion and interaction with near-bank bed evolution due to fluvial hydraulic force. Int. J. Sediment Res. 2015, 30, 81–89. [Google Scholar]
  15. Zhang, F.; Yuncheng, W.; Xiaojun, W. Study on hydrodynamic index threshold of early warning model for bank collapse in lower reaches of Yangtze River. J. Hydraul. Eng. ASCE 2023, 42, 53–64. [Google Scholar]
  16. Attari, M.; Hosseini, S.M. A simple innovative method for calibration of Manning’s roughness coefficient in rivers using a similarity concept. J. Hydrol. 2019, 575, 810–823. [Google Scholar] [CrossRef]
  17. Yan, B.; Chen, Y.; Li, J.; Yao, L.; Xu, B.; Chen, Q.; Zhang, X. Analysis of the influence of reservoir regulation on the multi-scale periodic effect of runoff time series. IOP Conf. Ser. Earth Environ. Sci. 2020, 560, 012042. [Google Scholar]
  18. Mei, X.; Wei, W.; Ge, Z.; Lou, Y.; Wang, J.; Dai, Z. Immediately downstream effects of Three Gorges Dam on channel sandbars morphodynamics between Yichang-Chenglingji Reach of the Changjiang River, China. Chin. Geogr. Sci. 2018, 28, 629–646. [Google Scholar]
  19. Deng, C.; Jiang, L.; Long, R.; Ge, H.; Zhu, L. Decadal Hydro-Morphodynamic Evolution of a Sandy Meander Bend Downstream of the Three Gorges Dam and Impact on Waterway Navigation. Water 2022, 14, 3126. [Google Scholar] [CrossRef]
  20. Mao, Y.; Deng, S.; Xia, J.; Zhou, M.; Xu, Q.; Liu, X. Contributions of different sources to sediment transport in the Middle Yangtze River under intensive channel degradation. Catena 2022, 217, 106511. [Google Scholar]
  21. Xie, B.; Tian, S.; Wang, W.; Zhang, M. Fluvial processes of the downstream reaches of the reservoirs in the Lower Yellow River. J. Geogr. Sci. 2016, 26, 1321–1336. [Google Scholar]
  22. Mosselman, E. Studies on River Training. Water 2020, 12, 3100. [Google Scholar] [CrossRef]
  23. Wang, Y.; Zhong, D.; Zhang, Y.J.; Li, X.; Wang, Y.; Zhang, H. Wide river or narrow river: Future river training strategy for Lower Yellow River under global change. Int. J. Sediment Res. 2018, 33, 271–284. [Google Scholar]
  24. Shahmohammadi, R.; Afzalimehr, H.; Sui, J. Assessment of Critical Shear Stress and Threshold Velocity in Shallow Flow with Sand Particles. Water 2021, 13, 994. [Google Scholar] [CrossRef]
  25. Sun, Z.; Yang, X.; Li, D.; Deng, J.; Li, Y. Relationship between the equilibrium morphology of river islands and flow-sediment dynamics based on the theory of minimum energy dissipation. Int. J. Sediment Res. 2022, 37, 514–521. [Google Scholar]
  26. Liu, H.; Lu, Y.; Wang, Z. Self-adjustment mechanism of bed structures under hydrology and sediment regimes. Hydrol. Res. 2016, 47, 136–148. [Google Scholar] [CrossRef]
  27. Li, Y.; Wang, B.; Liu, Y. Research on Applicability of Lower Yellow River Training Works after Beginning of Xiaolangdi Reservoir Operation. Procedia Eng. 2012, 28, 776–780. [Google Scholar]
Figure 1. Layout and location of the study area: WuXue River section, Ya’er Chau Dam. Latitude 29°49′47″ N, Longitude 115°39′36″ E. (The blue arrows in the picture represent the direction of the river flow).
Hydrology 12 00148 g001
Figure 2. Topographic elevation, grid layout, and cross-section setup for the study are (The black lines in the figure represent the set monitoring sections, and C01, C02, C03, and C04 are the monitoring section numbers).
Hydrology 12 00148 g002
Figure 3. Comparison of flow and sediment transport rate variations under different operating conditions. (a) Flow frequency duration curve; (b): sediment transport rate frequency duration curve; TGD: Three Gorges Dam; STR: sediment transport rate.
Hydrology 12 00148 g003
Figure 4. IHA index changes. HV: hydrological variations.
Hydrology 12 00148 g004
Figure 5. Comparison of hydraulic erosion intensity (SNF: simulated in non-flood season; MNF: measured in non-flood season; SF: simulated in flood season; MF: measured in flood season).
Hydrology 12 00148 g005
Figure 6. Comparison of cumulative sediment transport capacity.
Hydrology 12 00148 g006
Figure 7. Differences in shear stress under different working conditions. S(Ⅰ)–S(Ⅱ) are the differences in shear stress between the conditions with and without the training works in the study area with TGD. S(Ⅲ)–S(Ⅳ) are the differences in shear stress between the conditions with and without the training works in the study area without TGD. Here, 25%, 50%, 75%, and 95% denote the flow rate frequency.
Hydrology 12 00148 g007
Figure 8. Characteristics of river sediment and morphologic stability. (a) Sediment size gradation map; (b) cloud map of river morphologic stability index; (c) vertical sediment concentration in Section 1.
Hydrology 12 00148 g008
Figure 9. The variation in riverbed topography in each monitoring section in the study area.
Hydrology 12 00148 g009
Table 1. Data collection and information at the gauging stations.
Data ItemsTimeData CharacteristicsSource
Riverbed topography (m)2018Hankou–Datong channels (map scale 1:10,000)Hydrographic Bureau of the Yangtze River Water Resources Commission (YRWRC) Wuhan, Hubei Province, China
Sediment discharge (kg/m3)2003–2023Yichang, Shashi, Hankou, Jiujiang, and Datong hydrological stations
Flow rate (m/s)2003–2023Hankou and Jiujiang hydrological stations
Water level (m)2003–2023Hankou and Jiujiang hydrological stations
Table 2. Indicators of hydrologic alteration (IHA).
GroupsIHA Index SystemHydrological Characteristic Index
1Monthly flowAverage flow over 12 months. Minimum annual flow (1 d, 3 d, 7 d, 30 d, 90 d)
2Extreme hydrological conditionsMinimum annual flow (1 d, 3 d, 7 d, 30 d, 90 d)
Base flow index
3The time of occurrence of the annual peak flowThe timing of the annual maximum (minimum) flow
4The frequency and duration of high and low flowsNumber of high (low) pulses per year
The duration of the high (low) pulse
5The rate and frequency of flow changesNumber of process changes per year
Table 3. Hydrological conditions under two different inflow scenarios in the model.
FrequencyWith TGDWithout TGD
Upstream Inflow
(m3/s)
Downstream Water Level
(m)
Sediment Concentration
(kg/m3)
Upstream Inflow
(m3/s)
Downstream Water Level
(m)
Sediment Concentration
(kg/m3)
95%98028.940.07297908.470.035
75%13,20710.530.10213,00010.150.058
50%18,57813.20.16418,00012.490.08
25%32,50017.30.2930,50016.010.112
Table 4. Four operational condition groups of the model and their characteristic values.
GroupsWith Training Projects Without Training ProjectsFlow Characteristics (m3/s)Sediment Concentration (kg/m3)
With TGDS(Ⅰ)S(Ⅱ)Average22,591Average0.100
Maximum65,900Maximum1.050
Minimum7920Minimum0.020
Without TGDS(Ⅲ)S(Ⅳ)Average22,457Average0.410
Maximum69,414Maximum2.320
Minimum7895Minimum0.019
Disclaimer/Publisher’s Note: The statements, opinions and data contained in all publications are solely those of the individual author(s) and contributor(s) and not of MDPI and/or the editor(s). MDPI and/or the editor(s) disclaim responsibility for any injury to people or property resulting from any ideas, methods, instructions or products referred to in the content.

