
Climatological Seasonal Cycle of River Discharge into the Oceans: Contributions from Major Rivers and Implications for Ocean Modeling


Abstract
1. Introduction
2. Materials and Methods
2.1. Global River Discharge Dataset
2.2. Statistical Metrics
3. Results
3.1. Climatological Means
- -
- the earlier study [8] relied heavily on modeling assumptions, including a quasi-steady-state global water budget, which may have resulted in overestimated discharge in arid or net-evaporative regions to preserve balance with evaporation and precipitation;
- -
- extensive interpolation was used to fill large data gaps in [8], whereas our approach is strictly observation-based, excluding stations with fragmented or uncertain records;
- -
- the significant increase in human water usage since the 1970s through agriculture, damming, and urbanization has reduced river discharge globally, particularly in highly developed basins [28], making comparisons to pre-1980 values potentially misleading.
3.2. Climatological Seasonal Cycles of Major Rivers
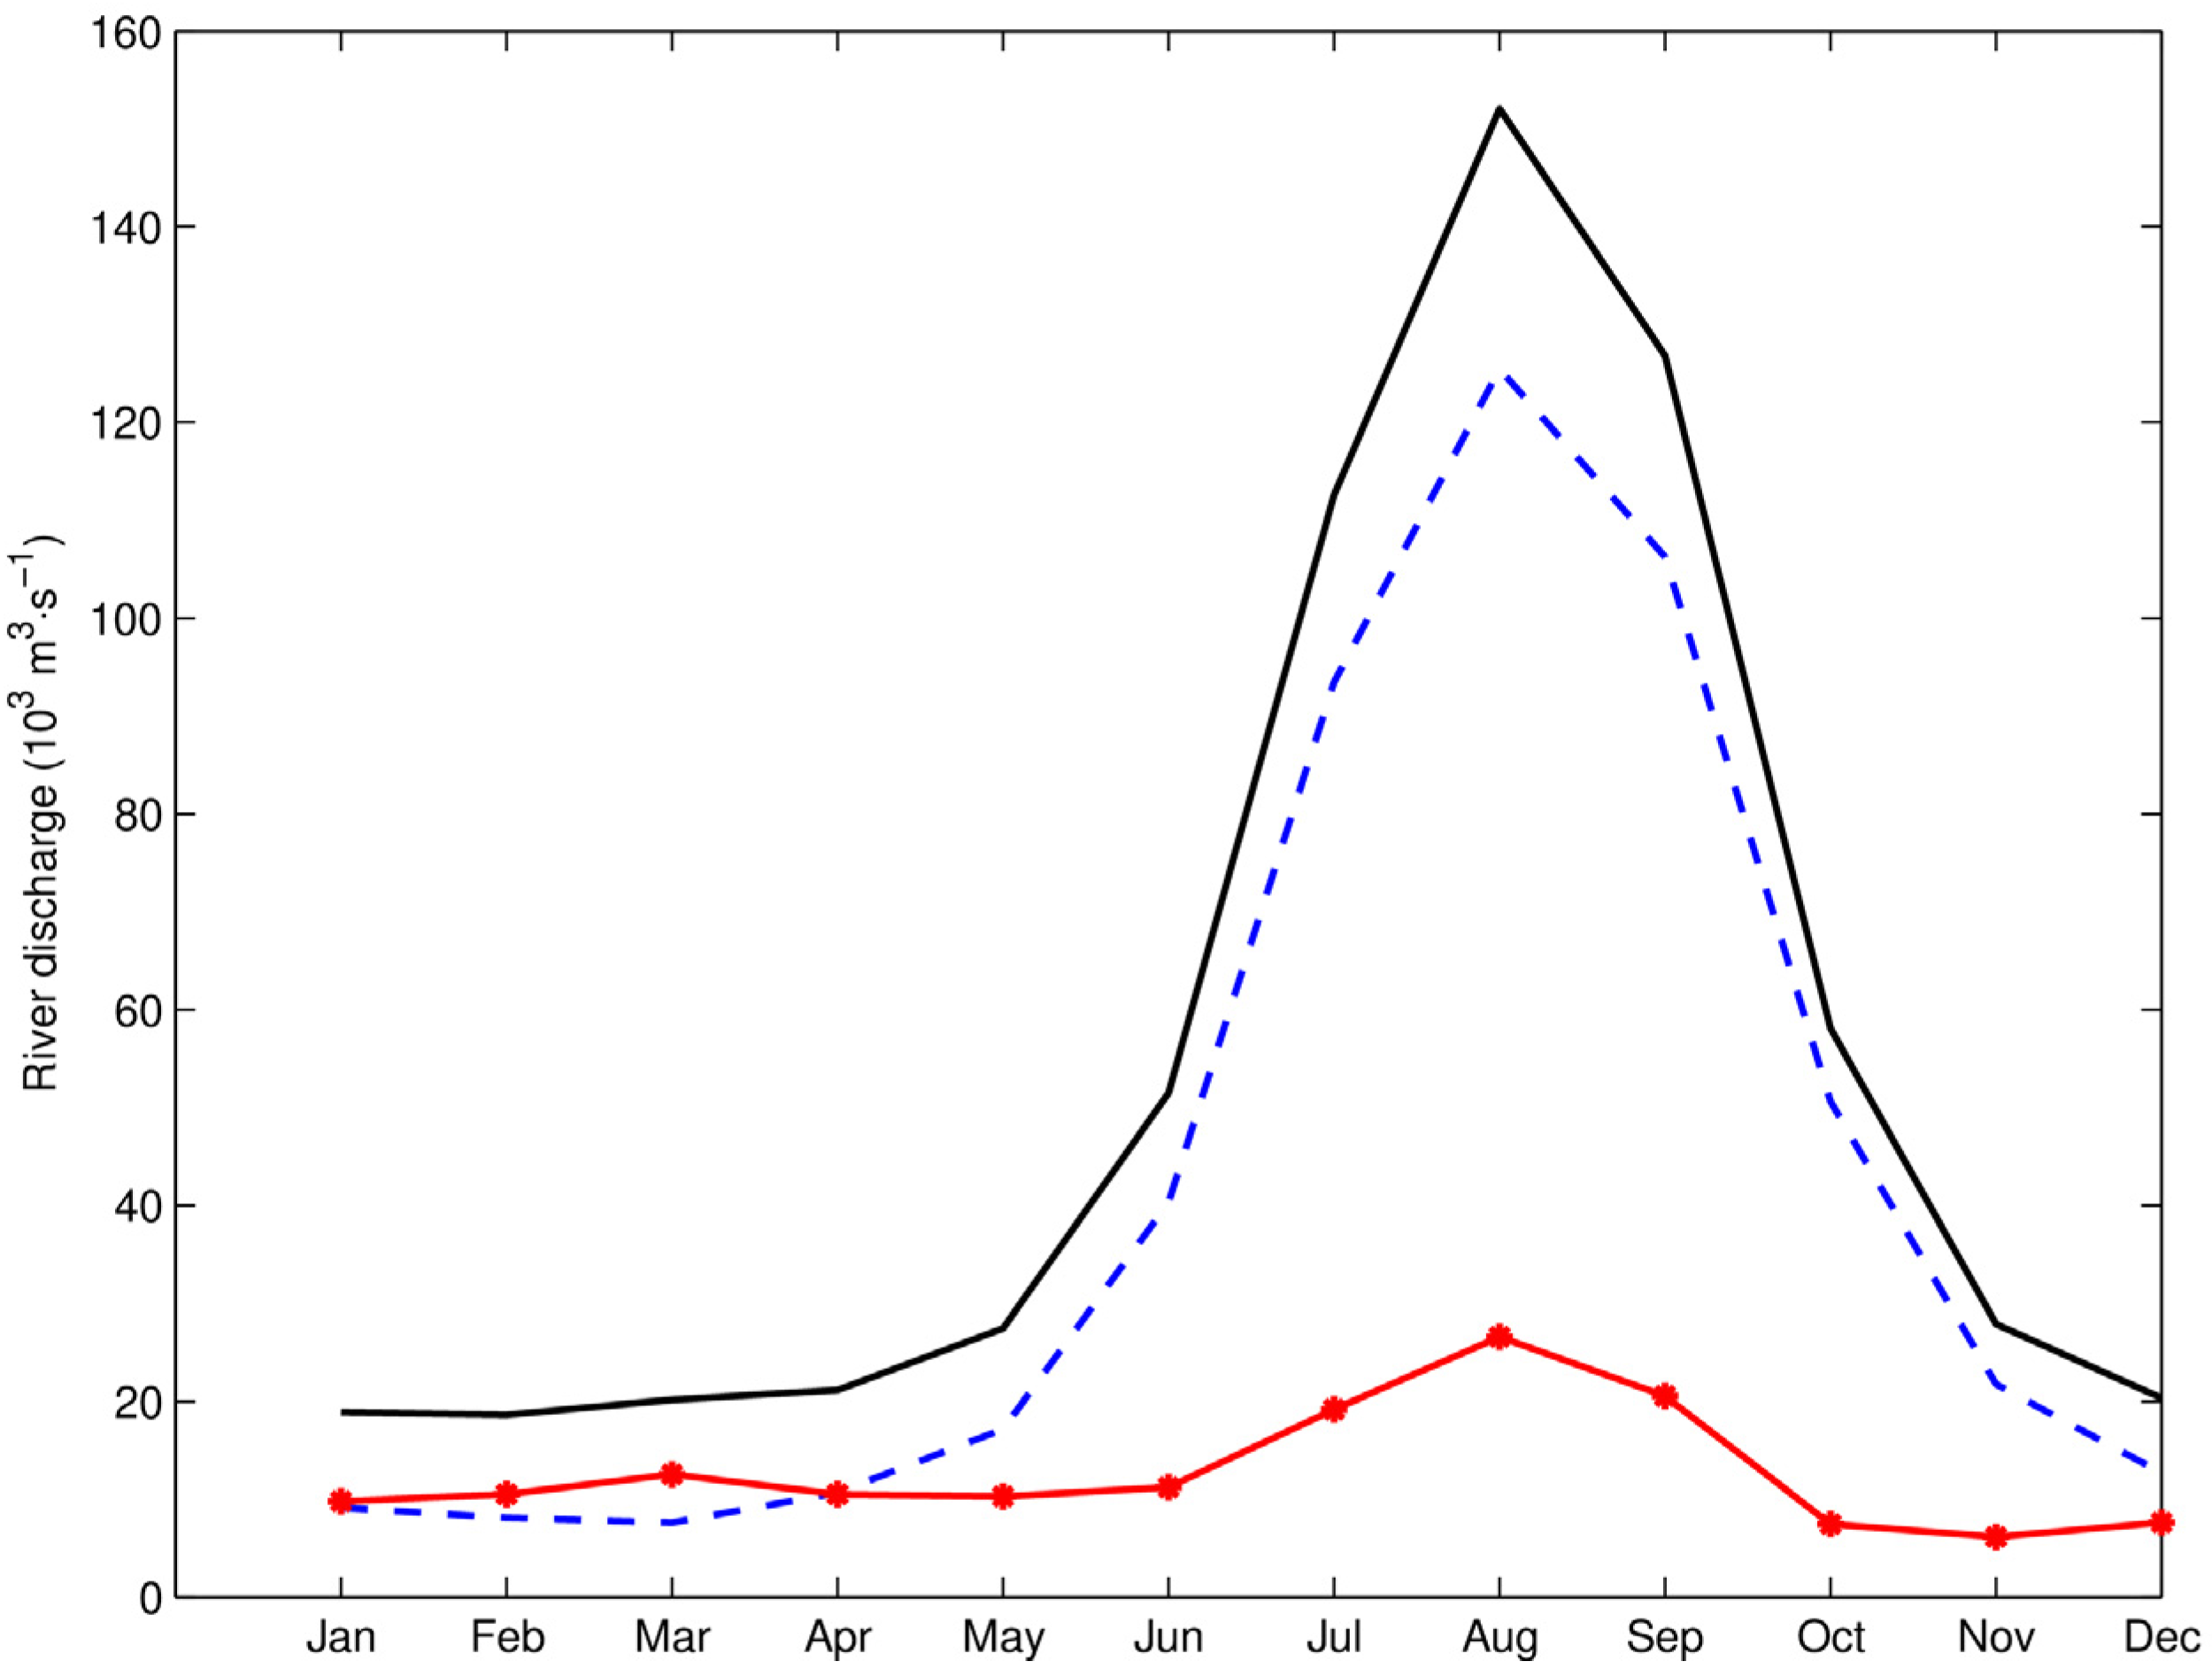
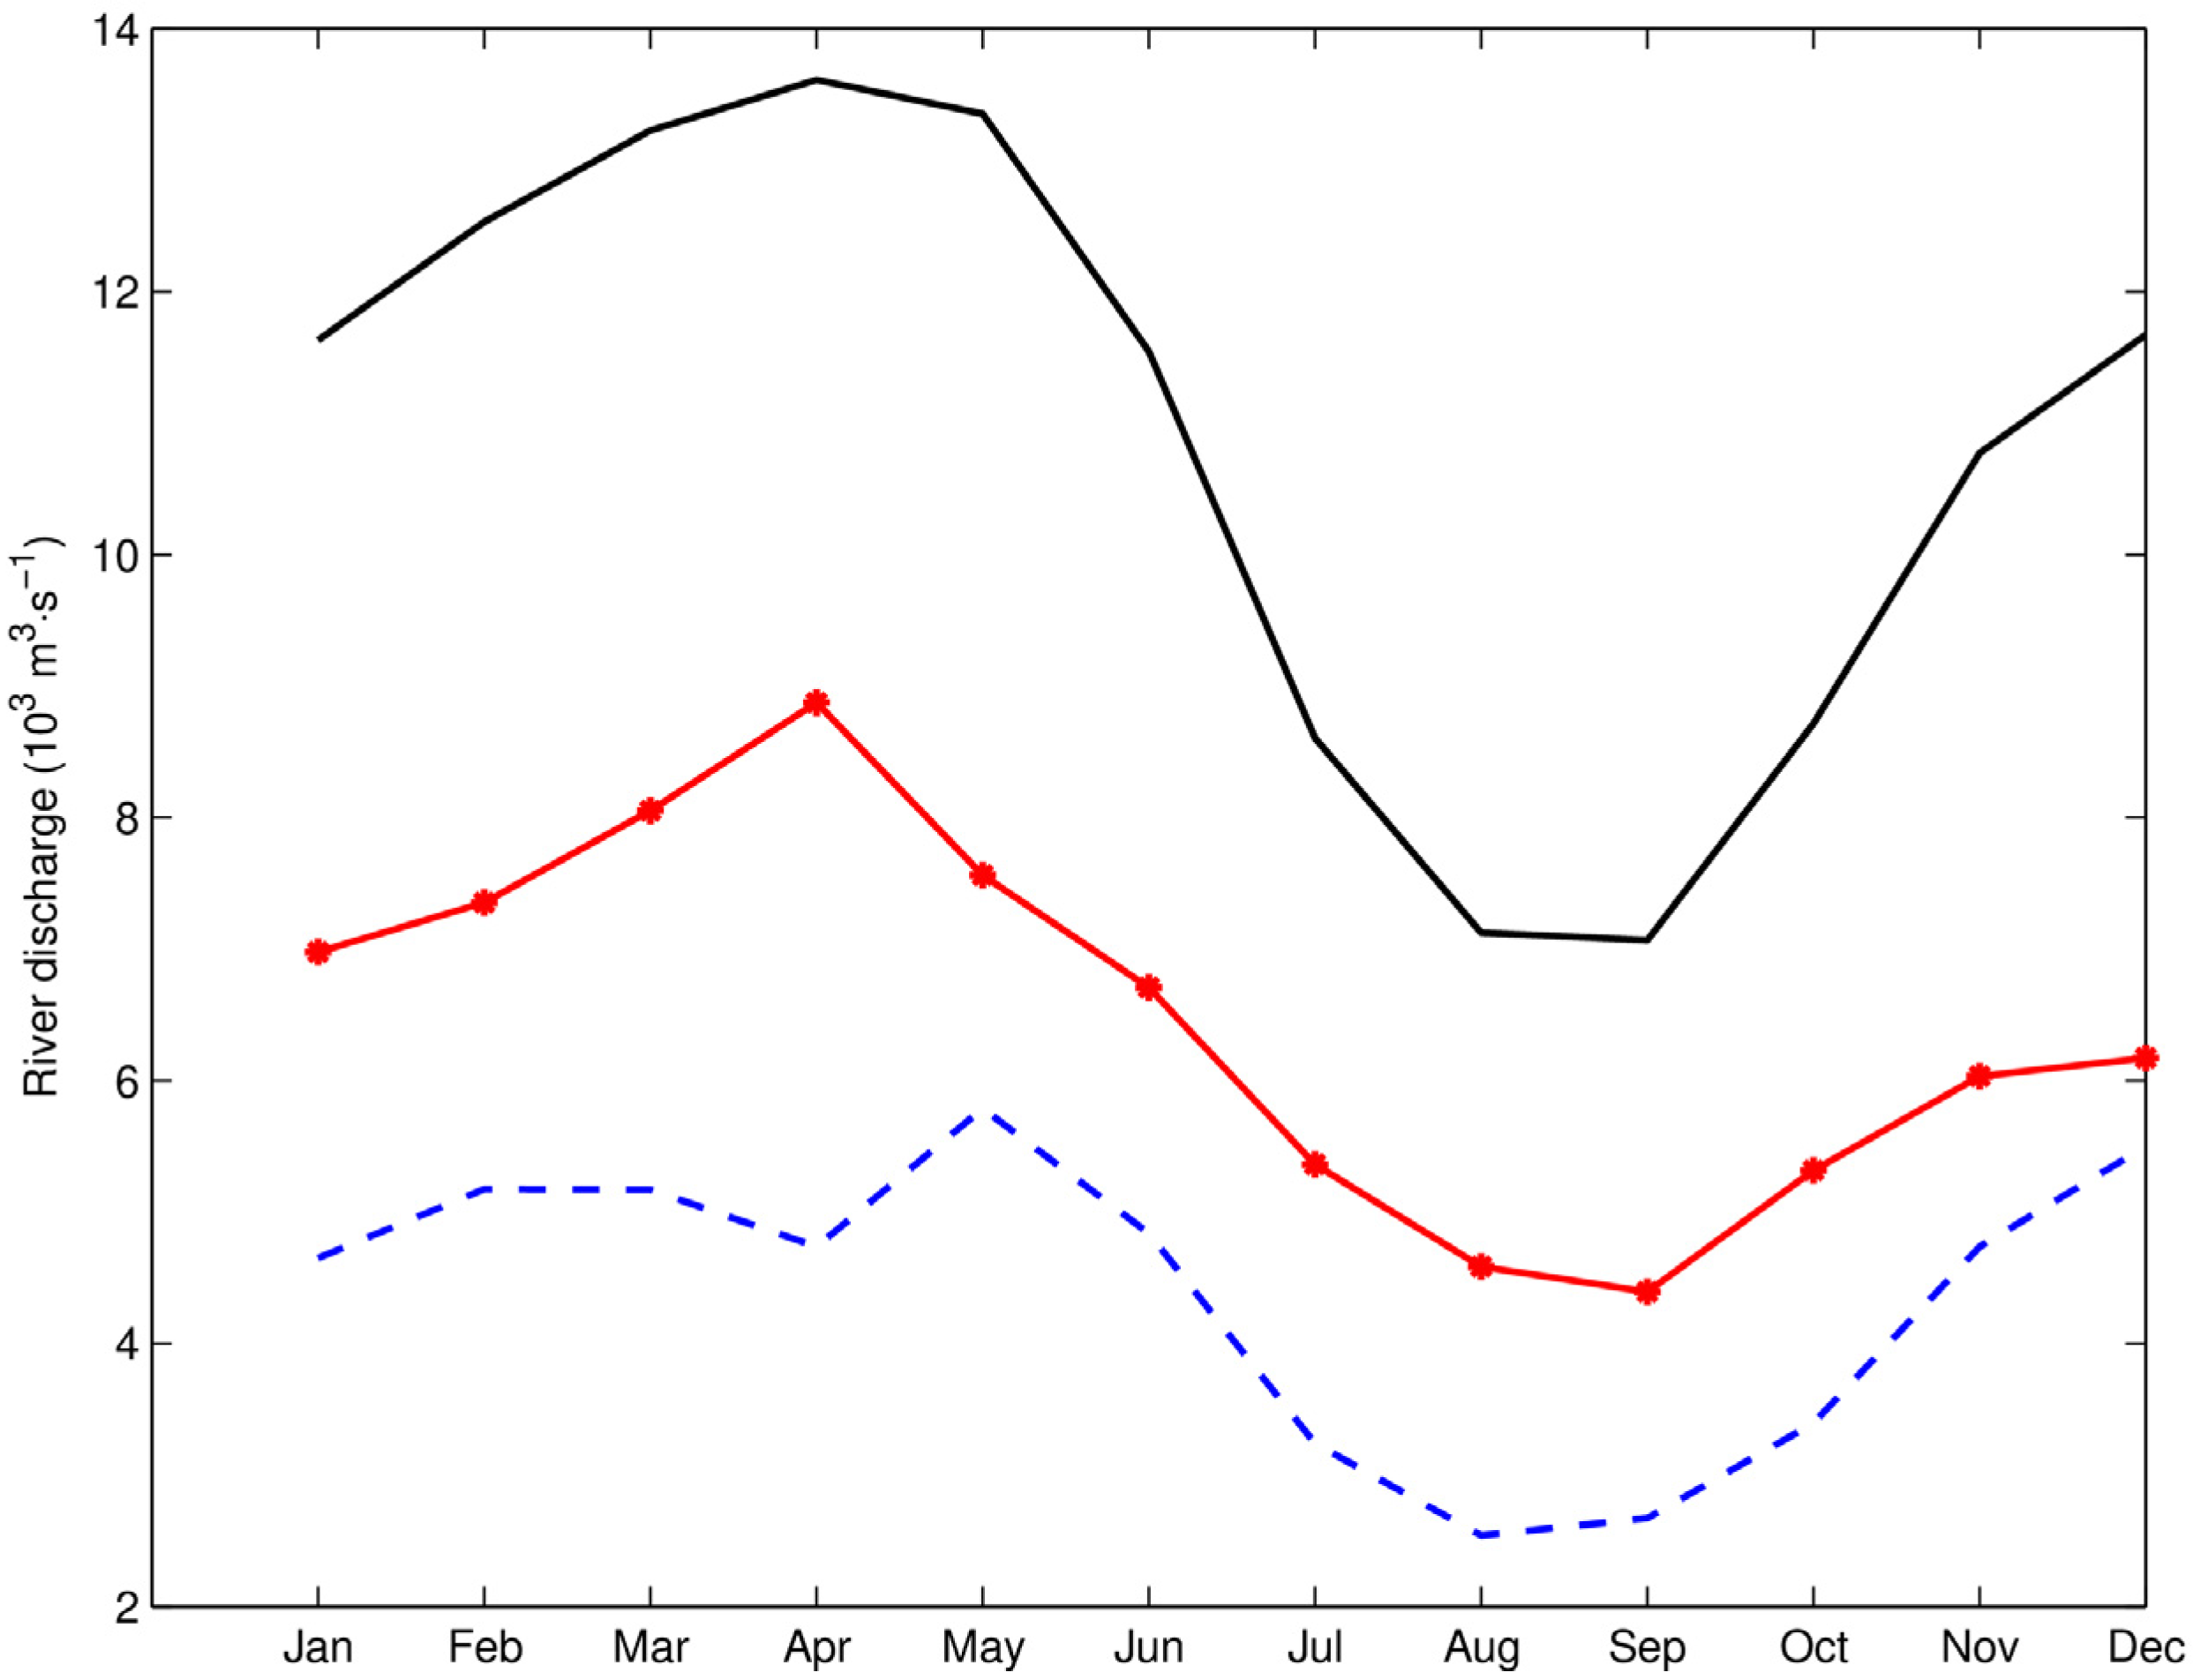
3.3. Climatological Seasonal Cycles of River Discharge into the Oceans
3.3.1. Atlantic Ocean
3.3.2. Pacific Ocean
3.3.3. Indian Ocean
3.3.4. Mediterranean Sea
4. Discussion
5. Conclusions
Author Contributions
Funding
Data Availability Statement
Acknowledgments
Conflicts of Interest
References
- Mann, K.H.; Lazier, J.R.N. Dynamics of Marine Ecosystems: Biological-Physical Interactions in the Oceans, 3rd ed.; Wiley-Blackwell: Hoboken, NJ, USA, 2014. [Google Scholar]
- Yu, L. Global Air–Sea Fluxes of Heat, Fresh Water, and Momentum: Energy Budget Closure and Unanswered Questions. Annu. Rev. 2019, 11, 227–248. [Google Scholar] [CrossRef] [PubMed]
- Diaz, R.J.; Rosenberg, R. Spreading dead zones and consequences for marine ecosystems. Science 2008, 321, 926–929. [Google Scholar] [CrossRef] [PubMed]
- Sauvage, C.; Brossier, C.L.; Ducrocq, V.; Bouin, M.N.; Vincendon, B.; Verdecchia, M.; Taupier-Letage, I.; Orain, J. Impact of the representation of the freshwater river input in the Western Mediterranean Sea. Ocean Model. 2018, 131, 115–131. [Google Scholar] [CrossRef]
- Wang, Y.; Wu, P. Influence of riverine freshwater fluxes on global ocean salinity. Geophys. Res. Lett. 2017, 44, 7793–7801. [Google Scholar] [CrossRef]
- Meade, R.H.; Rayol, J.M.; Conceição, A. Effect of Amazon River on the salinity of the tropical Atlantic Ocean. J. Geophys. Res. Ocean. 1990, 95, 14221–14232. [Google Scholar]
- Masson, S.; Delecluse, P. Influence of the Amazon River on the tropical Atlantic Ocean. Geophys. Res. Lett. 2001, 28, 1981–1984. [Google Scholar] [CrossRef]
- Dai, A.; Trenberth, K.E. Estimates of freshwater discharge from continents: Latitudinal and seasonal variations. J. Hydrometeorol. 2002, 3, 660–687. [Google Scholar] [CrossRef]
- Coles, V.J.; Brooks, M.; Hopkins, J.; Stukel, M.R.; Yager, P.L.; Hood, R. The pathways and properties of the Amazon River Plume in the tropical North Atlantic Ocean. J. Geophys. Res. Ocean. 2013, 118, 6894–6913. [Google Scholar] [CrossRef]
- Gévaudan, M.; Durand, F.; Jouanno, J. Amazon River discharge and the interannual variability of the Western Tropical Atlantic. J. Geophys. Res. Ocean. 2022, 127, e2022JC018495. [Google Scholar] [CrossRef]
- Baumgartner, A.; Reichel, E. The World Water Balance: Mean Annual Global, Continental, and Maritime Precipitation, Runoff and Evaporation; Elsevier: Amsterdam, The Netherlands, 1975. [Google Scholar]
- Falkowski, P.G.; Scholes, R.J.; Boyle, E.; Canadell, J.; Canfield, D.; Elser, J.; Gruber, N.; Hibbard, K.; Hogberg, P.; Linder, S.; et al. The global carbon cycle: A test of our knowledge of Earth as a system. Science 2008, 290, 291–296. [Google Scholar] [CrossRef]
- Carmack, E.C.; Yamamoto-Kawai, M.; Haine, T.W.N.; Bacon, S.; Bluhm, B.A.; Lique, C.; Melling, H.; Polyakov, I.V.; Straneo, F.; Timmermans, M.-L.; et al. Freshwater and its role in the Arctic Marine System: Sources, disposition, storage, export, and physical and biogeochemical consequences in the Arctic and global oceans. JGR Biogeosci. 2015, 121, 675–717. [Google Scholar] [CrossRef]
- Milly, P.C.D.; Dunne, K.A.; Vecchia, A.V. Global pattern of trends in streamflow and water availability in a changing climate. Nature 2005, 438, 347–350. [Google Scholar] [CrossRef] [PubMed]
- van Schaik, E.; Killaars, L.; Smith, N.E.; Koren, G.; van Beek, L.P.H.; Peters, W.; van der Laan-Luijkx, I.T. Changes in surface hydrology, soil moisture and gross primary production in the Amazon during the 2015/2016 El Niño. Philos. Trans. R. Soc. B Biol. Sci. 2018, 373, 20180084. [Google Scholar] [CrossRef] [PubMed]
- Gudmundsson, L.; Boulange, J.; Do, H.X.; Gosling, S.N.; Grillakis, M.G.; Koutroulis, A.G.; Leonard, M.; Liu, J.; Müller Schmied Papadimitriou, L.; Pokhrel, Y.; et al. Globally observed trends in mean and extreme river flow attributed to climate change. Science 2021, 371, 1159–1162. [Google Scholar] [CrossRef]
- Grillakis, M.G. Increase in severe and extreme soil moisture droughts for Europe under climate change. Sci. Total Environ. 2019, 660, 1245–1255. [Google Scholar] [CrossRef]
- Greve, P.; Seneviratne, S.I. Assessment of future changes in water availability and aridity. Geophys. Res. Lett. 2015, 42, 5493–5499. [Google Scholar] [CrossRef]
- Nakhaei, P.; Ozgur, K.; Nakhaei, M.; Fathollahi-Fard, F.; Gheibi, M. Assessment of climate change on river streamflow under different representative concentration pathways. J. Environ. Manag. 2024, 366, 121754. [Google Scholar] [CrossRef]
- Sijp, W.P.; England, M.H. The effect of river runoff on the global ocean circulation. J. Phys. Oceanogr. 2009, 39, 3024–3046. [Google Scholar]
- Haines, K.; Valdivieso, M.; Zuo, H. Ocean salinity and the climate system. Curr. Clim. Change Rep. 2019, 5, 30–42. [Google Scholar]
- Vörösmarty, C.J.; Green, P.; Salisbury, J.; Lammers, R.B. Global water resources: Vulnerability from climate change and population growth. Science 2000, 289, 284–288. [Google Scholar] [CrossRef]
- UNESCO. The United Nations World Water Development Report: Water Resources of the World; United Nations Educational, Scientific and Cultural Organization: Paris, France, 1993; Volume II. [Google Scholar]
- UNESCO. Global River Discharges Database. Volume I: Africa, Volume II: Asia, and Volume III: Europe, Volume IV: North America, Volume V: South America, Volume VI: Oceania; UNESCO: Paris, France, 1996. [Google Scholar]
- Zhuk, V.R.; Kubryakov, A.A. Interannual Variability of the Lena River Plume Propagation in 1993–2020 during the Ice-Free Period on the Base of Satellite Salinity, Temperature, and Altimetry Measurements. Remote Sens. 2021, 13, 4252. [Google Scholar] [CrossRef]
- Hagemann, S.; Dümenil, L. A parameterization of the lateral waterflow for the global scale. Clim. Dyn. 1996, 12, 843–856. [Google Scholar] [CrossRef]
- UNESCO. Studies and Reports in Hydrology, No. 1; UNESCO: Paris, France, 1969. [Google Scholar]
- Milliman, J.D.; Farnsworth, K.L.; Albertin, C.S. Anthropogenic influences on riverine fluxes of sediment, water, and nutrients to the coastal ocean. BioScience 2008, 58, 563–573. [Google Scholar] [CrossRef]
- Czajkowski, J.; Maidment, D.R.; Forrest, D. A framework for aggregating high-resolution tributary inflows into global river discharge estimates. Water Resour. Res. 2015, 51, 7209–7225. [Google Scholar] [CrossRef]
- Oltman, R.E. Summary Report of the International Hydrological Decade (1965–1974); United States Geological Survey: Reston, VA, USA, 1968.
- Meybeck, M.; Ragu, A. River Discharges to the Oceans: An Assessment of Suspended Solids and Particulate C, N, P, and POC; United Nations Environment Program: Nairobi, Kenya, 1996. [Google Scholar]
- Dai, A.; Trenberth, K.E.; Qian, T. A global dataset of Palmer Drought Severity Index for 1870–2003: Relationship with soil moisture and effects of surface warming. J. Hydrometeorol. 2004, 5, 1117–1130. [Google Scholar] [CrossRef]
- Yoo, J.; Carton, J.A. Tropical Atlantic variability and its relation to freshwater discharge from major rivers. J. Geophys. Res. Ocean. 1990, 95, 20519–20528. [Google Scholar]
- Smith, L.C.; Pavelsky, T.M.; Shiklomanov, A.I. Hydrology of the Arctic Ocean. In The Global Coastal Ocean; Robinson, A.R., McCarthy, J.J., Rothschild, B.J., Eds.; Harvard University Press: Cambridge, MA, USA, 2010; pp. 679–732. [Google Scholar]
- Jones, C.; Baker, M.L. Hydrological extremes and their impacts on climate variability. Nat. Clim. Change 2012, 2, 563–571. [Google Scholar] [CrossRef]
- Garcia, N.O.; Mechoso, C.R.; Jones, P.D. Climatology of South Pacific River discharge. Int. J. Climatol. 2015, 35, 2671–2683. [Google Scholar] [CrossRef]
- Brown, J.L.; Allen, M.R.; Smith, L.C. Tropical River discharge and its influence on ocean circulation and climate. Geophys. Res. Lett. 2017, 44, 6321–6330. [Google Scholar] [CrossRef]
- Sharma, R.; Murty, V.S.N.; Suryanarayana, A. River discharge into the northern Indian Ocean and its seasonal variability. J. Mar. Syst. 2006, 62, 70–85. [Google Scholar] [CrossRef]
- Singh, H.; Gaur, A.; Pandey, D.K. Hydrological influence of the Ganges-Brahmaputra rivers on the Indian Ocean during the monsoon season. Geophys. Res. Lett. 2011, 38, L03702. [Google Scholar]
- Rao, S.A.; Behera, S.K.; Masumoto, Y.; Yamagata, T. A comprehensive view of the Indian Ocean during the monsoon season. J. Oceanogr. 2010, 66, 501–514. [Google Scholar]
- Kumar, B.S.; Shankar, R. Seasonal and interannual variability of river discharge into the Indian Ocean: A global assessment. J. Geophys. Res. Ocean. 2014, 119, 2083–2102. [Google Scholar] [CrossRef]
- Sarma, V.V.S.S.; Krishna, M.S.; Prasad, V.R.; Kumar, M.D. Salinity stratification and its influence on primary production in the Bay of Bengal. Cont. Shelf Res. 2013, 66, 63–72. [Google Scholar] [CrossRef]
- Boukthir, M.; Barnier, B. Seasonal and interannual variations in the surface freshwater fluxes in the Mediterranean Sea. J. Mar. Syst. 2000, 24, 343–365. [Google Scholar] [CrossRef]
- Tixeront, J. Estimation of river discharge into the Mediterranean Sea based on rainfall maps. Ann. Géographie 1970, 79, 572–576. [Google Scholar] [CrossRef]
- Margat, J. Water resources in the Mediterranean basin. Hydrol. Sci. J. 1992, 37, 439–453. [Google Scholar] [CrossRef]
- Wadie, W. Decreased Nile river discharge and its effects on the Mediterranean Sea. In Proceedings of the International Conference on the Nile River Basin, Cairo, Egypt, 17–19 October 2016; Volume 2, pp. 163–172. [Google Scholar]
- Martin, J.M.; Milliman, J.D. River discharge to the Mediterranean Sea: Changes in patterns over the last century. Glob. Planet. Change 1997, 14, 75–85. [Google Scholar] [CrossRef]
- García, C.M.; Manzano, M.; Martínez, A. Hydrological impacts of dams and irrigation on river discharge in the Mediterranean basin. Hydrol. Process. 2013, 27, 737–746. [Google Scholar] [CrossRef]
- Dall’Olmo, G.; Lazzari, P. The role of river discharge in shaping the hydrodynamics and nutrient transport in the Mediterranean Sea. Prog. Oceanogr. 2014, 120, 52–62. [Google Scholar] [CrossRef]
- Milliman, J.D.; Farnsworth, K.L.; Albertin, C.S. Flux and fate of fluvial sediments leaving large islands in the East Indies. J. Geol. 2008, 116, 407–428. [Google Scholar] [CrossRef]
- Durack, P.J.; Wijffels, S.E.; Matear, R.J. Ocean salinities reveal strong global water cycle intensification during 1950 to 2000. Science 2012, 336, 455–458. [Google Scholar] [CrossRef] [PubMed]
- Boyer, T.P.; Levitus, S.; Garcia, H.E.; Locarnini, R.A.; Stephens, C.; Antonov, J.I. Objective analyses of annual, seasonal, and monthly temperature and salinity for the world ocean on a 0.25° grid. Int. J. Climatol. 2005, 25, 931–945. [Google Scholar] [CrossRef]
- Schott, F.A.; McCreary, J.P.; Johnson, G.C. Shallow overturning circulations of the tropical-subtropical oceans. In Ocean Circulation and Climate: A 21st Century Perspective; Elsevier: Amsterdam, The Netherlands, 2009; Volume 2, pp. 612–635. [Google Scholar]
- Jensen, T.G. Modelling the seasonal undercurrent in the Somali current system. Deep-Sea Res. Part II Top. Stud. Oceanogr. 2001, 48, 1033–1069. [Google Scholar] [CrossRef]
- Feng, M.; Zhang, N.; Liu, Q.; Wijffels, S. The Indonesian throughflow, its variability and centennial change. Geosci. Lett. 2018, 5, 3. [Google Scholar] [CrossRef]
- Richey, J.E.; Nobre, C.A.; Deser, C. Amazon river discharge and climate variability: 1903 to 1985. Science 1990, 246, 101–103. [Google Scholar] [CrossRef]
- Cooley, S.R.; Coles, V.J.; Subramaniam, A.; Yager, P.L. Seasonal variations in the Amazon plume-related atmospheric carbon sink. Glob. Biogeochem. Cycles 2009, 21. [Google Scholar] [CrossRef]
- Rahmstorf, S. Ocean circulation and climate during the past 120,000 years. Nature 2002, 419, 207–214. [Google Scholar] [CrossRef]
- Ganachaud, A.; Wunsch, C. Improved estimates of global ocean circulation, heat transport and mixing from hydrographic data. Nature 2000, 408, 453–455. [Google Scholar] [CrossRef]
- Gudmundsson, L.; Seneviratne, S.; Zhang, X. Anthropogenic climate change detected in European renewable freshwater resources. Nat. Clim. Change 2017, 7, 813–816. [Google Scholar] [CrossRef]
- Didovets, I.; Krysanova, V.; Nurbatsina, A.; Fallah, B.; Krylova, V.; Saparova, A.; Niyazov, J.; Kalashnikova, O.; Hattermann, F.F. Attribution of current trends in streamflow to climate change for 12 Central Asian catchments. Clim. Change 2024, 177, 16. [Google Scholar] [CrossRef]
- Boiten, W. Hydrometry: Measuring the Water Balance of the Catchment, 2nd ed.; Balkema Publishers, Taylor & Francis Group: Leiden, The Netherlands, 2005; 247p. [Google Scholar]


| River Name | Ocean Basin | Hydrological Regime | Characteristics |
|---|---|---|---|
| Amazon | Atlantic | Equatorial | High, year-round rainfall |
| Orinoco | Atlantic | Monsoonal–Equatorial | Strong summer peak linked to ITCZ migration |
| Ganges-Brahmaputra | Indian | Monsoonal | Strong peak in summer; low flows in winter |
| Mississippi | Atlantic | Mixed (Rain + Snowmelt) | Spring peak from snowmelt; moderate rainfall contribution |
| Changjiang | Pacific | Monsoonal | Dominated by summer monsoon rains |
| Congo | Atlantic | Equatorial | Wet seasons in spring and fall |
| St. Lawrence | Atlantic | Snowmelt-Driven | Peak in late spring; influenced by snowmelt |
| Nile | Mediterranean | Monsoonal-Regulated | Highly regulated |
| Rivers | |||||||
|---|---|---|---|---|---|---|---|
| Data | Amazon | Amur | Columbia | Congo | Elbe | Godavari | Indus |
| UNESCO | 156096 | 9791 | 5452 | 41129 | 743 | 3081 | 2647 |
| H and D | 154892 | 9739 | 5438 | 40250 | 784 | 3038 | 2244 |
| (%) Gap | +0.8 | +0.5 | +0.3 | +2.2 | −5.2 | +1.4 | +18 |
| Data | Mekong | Mississippi | Nile | Orinoco | Parana | Rhine | Yukon |
| UNESCO | 8662 | 17701 | 1283 | 28856 | 17279 | 2287 | 6120 |
| H and D | 9436 | 14795 | 2926 | 31026 | 16595 | 2291 | 6347 |
| (%) Gap | −8.2 | +19.6 | −56.1 | −7.0 | +4.1 | −0.2 | −3.6 |
| Data | St. Francisco | Changjiang | St. Lawrence | Zambezi | Ganges | Nelson | |
| UNESCO | 2635 | 25120 | 7657 | 3342 | 29686 | 2405 | |
| H and D | 2818 | 28936 | 7654 | 3337 | 33298 | 2403 | |
| Gap (%) | −6.5 | −13.2 | 0 | +0.1 | −10.8 | +0.1 | |
| Rivers | ||||||||
|---|---|---|---|---|---|---|---|---|
| Amazon | Amazon+ Tributaries | Congo | Orinoco | Changjiang | Mississippi | St. Lawrence | St. Lawrence + Tributaries | |
| Mean | 155240 | 163851 | 41117 | 28732 | 25111 | 17600 | 7654 | 9672 |
| Amplitude | 55298 | 61421 | 15312 | 30099 | 22556 | 10561 | 426 | 2916 |
| Amp (%) | 35.6 | 37.5 | 37.2 | 104.8 | 89.8 | 60 | 5.6 | 30.1 |
| Std | 44020 | 47654 | 7827.4 | 19831 | 13289.5 | 6408 | 440 | 1314.5 |
| CV (%) | 28.4 | 29.1 | 19.1 | 69 | 52.9 | 36.4 | 5.8 | 13.6 |
| RMSE | 2032 | 12557 | 831.4 | - | 589.1 | 2839.7 | 175.5 | 2291 |
| NRMSE | 1.3 | 7.7 | 2 | 2.4 | 2.4 | 16.1 | 2.3 | 24 |
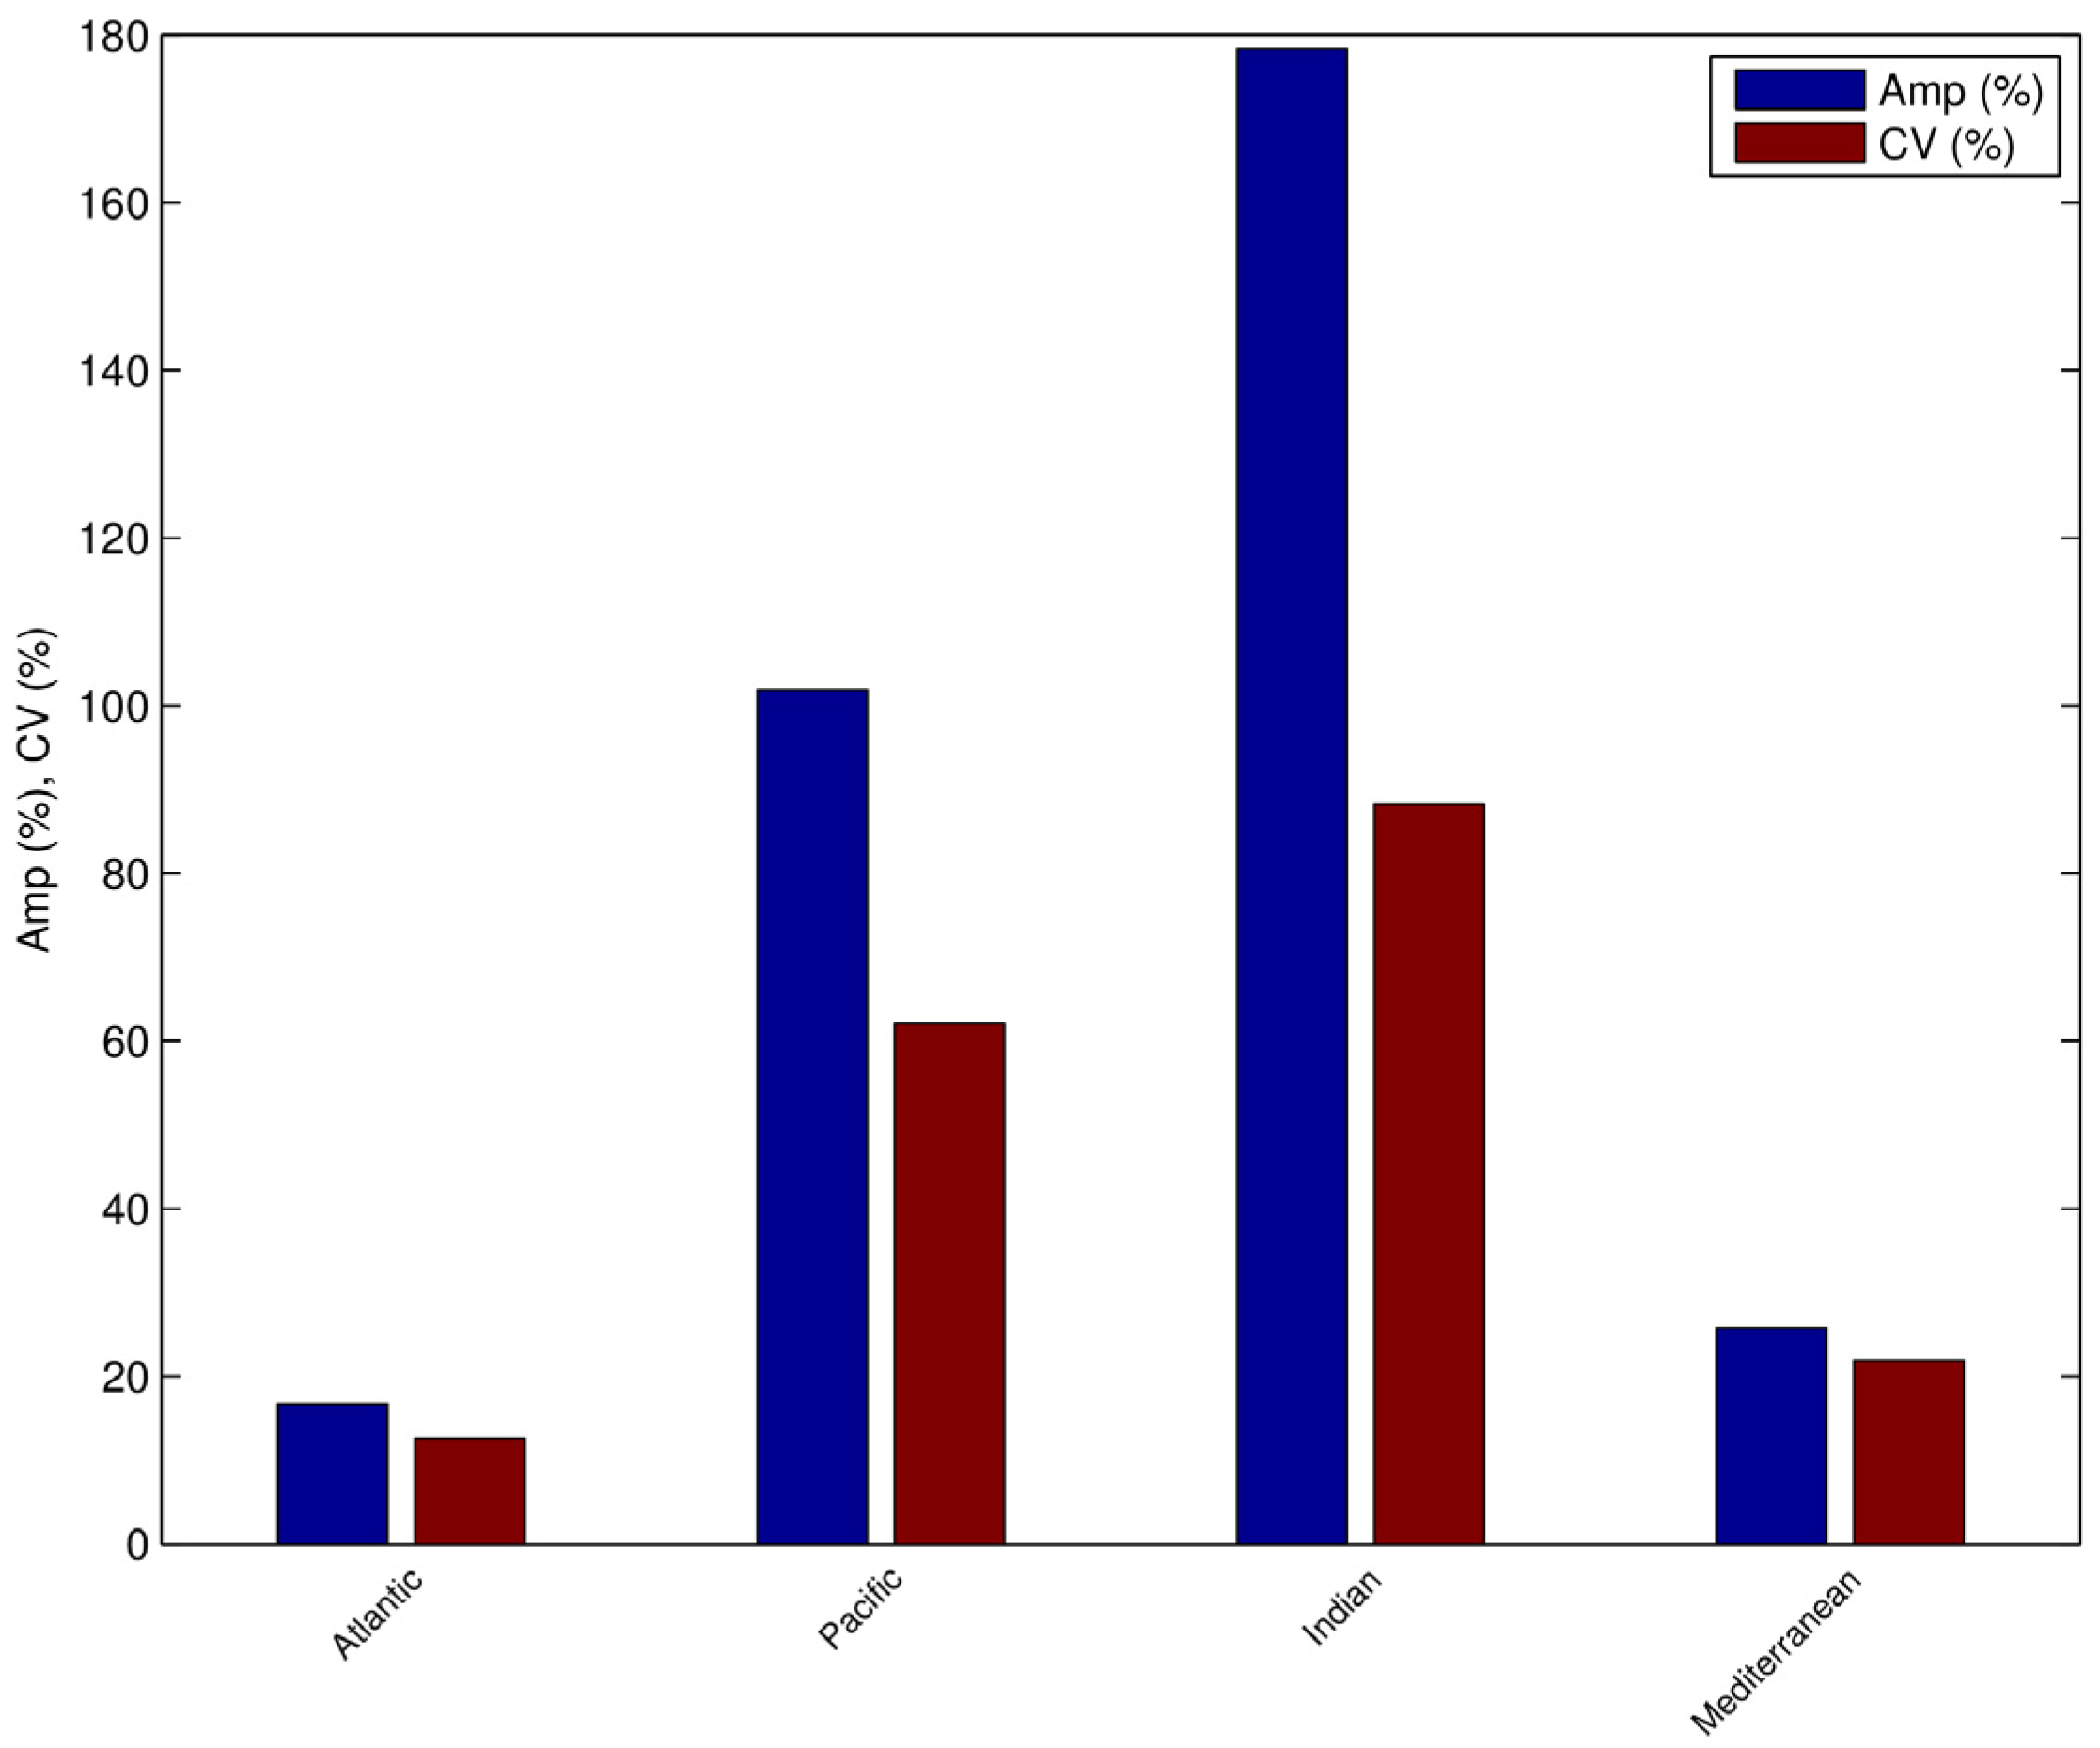
| Basins | |||||||||
|---|---|---|---|---|---|---|---|---|---|
| Atlantic | Tropical Atlantic | Pacific | East Pacific | West Pacific | Indian | East Indian | West Indian | Mediterranean | |
| Mean | 300240 | 278849 | 66993 | 19732 | 47260 | 54625 | 41930 | 12695 | 10820 |
| Amplitude | 50107 | 49780 | 68246 | 30593 | 38343 | 97465 | 83560 | 13905 | 2790 |
| Amp (%) | 16.7 | 17.9 | 101.9 | 155 | 81.1 | 178.4 | 199.3 | 109.5 | 25.8 |
| Std | 37751 | 38507 | 41575 | 14291 | 28202 | 48253 | 42760 | 6170 | 2371 |
| CV (%) | 12.6 | 13.8 | 62.1 | 72.4 | 59.7 | 88.3 | 102 | 48.6 | 21.9 |
Disclaimer/Publisher’s Note: The statements, opinions and data contained in all publications are solely those of the individual author(s) and contributor(s) and not of MDPI and/or the editor(s). MDPI and/or the editor(s) disclaim responsibility for any injury to people or property resulting from any ideas, methods, instructions or products referred to in the content. |
© 2025 by the authors. Licensee MDPI, Basel, Switzerland. This article is an open access article distributed under the terms and conditions of the Creative Commons Attribution (CC BY) license (https://creativecommons.org/licenses/by/4.0/).
Share and Cite
Boukthir, M.; Abdennadher, J. Climatological Seasonal Cycle of River Discharge into the Oceans: Contributions from Major Rivers and Implications for Ocean Modeling. Hydrology 2025, 12, 147. https://doi.org/10.3390/hydrology12060147
Boukthir M, Abdennadher J. Climatological Seasonal Cycle of River Discharge into the Oceans: Contributions from Major Rivers and Implications for Ocean Modeling. Hydrology. 2025; 12(6):147. https://doi.org/10.3390/hydrology12060147
Chicago/Turabian StyleBoukthir, Moncef, and Jihene Abdennadher. 2025. "Climatological Seasonal Cycle of River Discharge into the Oceans: Contributions from Major Rivers and Implications for Ocean Modeling" Hydrology 12, no. 6: 147. https://doi.org/10.3390/hydrology12060147
APA StyleBoukthir, M., & Abdennadher, J. (2025). Climatological Seasonal Cycle of River Discharge into the Oceans: Contributions from Major Rivers and Implications for Ocean Modeling. Hydrology, 12(6), 147. https://doi.org/10.3390/hydrology12060147