Article

Balancing Hydrological Sustainability and Heritage Conservation: A Decadal Analysis of Water-Yield Dynamics in the Honghe Hani Rice Terraces

1
College of Civil Engineering and Architecture, China Three Gorges University, Yichang 443002, China
2
Water Conservancy and Hydropower Engineering Geological Investigation Consultation and Planning Institute in Honghe Hani and Yi Autonomous Prefecture, Mengzi 661199, China
3
Department of Environmental Science and Engineering, Fudan University, Shanghai 200438, China
4
School of Environmental Science and Engineering, Huazhong University of Science and Technology, Wuhan 430074, China
*
Authors to whom correspondence should be addressed.
Hydrology 2025, 12(6), 135; https://doi.org/10.3390/hydrology12060135
Submission received: 4 May 2025 / Revised: 28 May 2025 / Accepted: 29 May 2025 / Published: 31 May 2025

Abstract

The Honghe Hani Rice Terraces, a UNESCO World Heritage agroecosystem, embody a millennia-old synergy of cultural heritage and ecological resilience, yet face declining water yields amid land-use intensification and climate variability. This study employs the InVEST model and geographic detector analysis to quantify water-yield dynamics from 2010 to 2020 and identify their spatial and mechanistic drivers. Annual water yield averaged 558 mm, with cultivated lands contributing 33% of total volume, while built-up areas reached 980 mm per unit in 2018. A 31% decline by 2020, driven by cropland fragmentation and tourism growth, revealed persistent-yield hotspots in forested central-eastern terraces and cold spots in southwestern dryland margins. Land-use pattern accounted for 80–95% of yield variability, exacerbated by temperature interactions. Forests, delivering 68.7 million m3 over the decade, highlight the hydrological significance of traditional landscape mosaics. These findings advocate reforestation in critical recharge zones, terrace restoration to preserve agroecological integrity, and regulated tourism integrating rainwater harvesting to sustain water security and cultural heritage. By blending hydrological modeling with socio-cultural insights, this study provides a scalable framework for safeguarding terraced agroecosystems worldwide, aligning heritage conservation with sustainable development.

1. Introduction

The Honghe Hani Rice Terraces, a UNESCO World Heritage Site, offer an enduring example of a 1300-year-old agroecosystem where forests, villages, terraces, and waterways form a delicately balanced hydrological network [1,2]. This system is unique for its thousand-year stability, self-sustaining water supply from mountain forests, and community-based water management that integrates ecological and cultural practices. It hinges on vertical zonation: mountain forests at higher elevations serve as natural reservoirs, terraced fields provide distributed water storage, and intricate canals facilitate irrigation across microclimatic zones [3]. This synergy underpins rice cultivation while stabilizing water resources, thereby supporting biodiversity and local livelihoods [4,5]. However, climate change and anthropogenic pressures, including unsustainable land use and tourism-driven development, increasingly disrupt this delicate balance, threatening the terraces’ ecological and cultural integrity.
Anthropogenic pressures, including unsustainable land-use practices, exacerbate droughts, landslides, and water conflicts. For instance, warming trends (0.3 °C per decade since 2000) have increased evapotranspiration in grasslands and deteriorated terraces, reducing soil moisture by 15–20% in southwestern zones [6]. Erratic rainfall patterns, characterized by a decline in monsoon precipitation and an increase in extreme rain events, have destabilized the terraces’ “forest–water–terrace” structure, triggering landslides that damaged 8% of paddy fields between 2015 and 2020 [7,8]. Concurrently, anthropogenic pressures exacerbate these challenges. Since 2010, tourism infrastructure, such as hotels and roads, has fragmented croplands, redirected water resources, and escalated conflicts between agricultural and commercial users [9,10,11]. In villages such as Duoyishu, tourism-driven demand has doubled groundwater extraction, depleting aquifer levels and jeopardizing rice cultivation [12]. These pressures are exacerbated by nutrient runoff from abandoned terraces, which has elevated nitrogen concentrations in waterways by 30%, further compromising water quality and availability [7]. Such cascading impacts underscore the critical need to balance hydrological sustainability with heritage conservation.
Despite global recognition of the terraces’ cultural and ecological significance, research on their water-provisioning services, which are critical for resilience, remains limited and fragmented. Previous studies have primarily focused on soil conservation [13,14,15] or cultural heritage [12,16], often neglecting fine-scale hydrological dynamics driven by land-use fragmentation and elevation-driven climate gradients [14]. Coarse-resolution models conceal localized patterns, including the impacts of abandoned terraces or forest loss on water yield [17]. Although the Integrated Valuation of Ecosystem Services and Tradeoffs (InVEST) model has been applied to large watersheds [18,19], its application to small-scale terraced systems, where vertical zonation and human interventions generate nonlinear hydrological responses, remains limited.
More broadly, terraces are recognized for providing multiple ecosystem services, including runoff reduction, water conservation, erosion control, and soil retention [20,21,22]. In the context of the Honghe Hani Rice Terraces, most research has concentrated on soil conservation and the preservation of cultural heritage. For example, studies have investigated soil moisture dynamics in relation to precipitation in this region [1,23]. Additionally, research has explored traditional irrigation systems and water governance practices, with some anthropological analyses highlighting the intricate connections among water management, resource allocation, ethnic culture, and interethnic relations [24]. Despite these important contributions, a critical knowledge gap persists regarding the interplay between land-use fragmentation, climate variability, and water-yield dynamics in these vertically zoned agroecosystems. This study addresses this gap by quantifying the impacts of land-use fragmentation and climate variability on water yield in the Honghe Hani Rice Terraces. By integrating hydrological modeling with socio-economic drivers, our analysis provides actionable insights for balancing UNESCO heritage conservation with sustainable water management—an intersection that remains largely underexplored in the existing literature.
This study addresses these gaps by conducting a fine-resolution (30 m grid) decadal assessment (2010–2020) of water yield in the Hani Terraces, integrating localized datasets (i.e., multi-temporal land-use maps and climate records) with the InVEST model and spatial-statistical tools. To analyze the spatial patterns of water yield, we applied the factor and interaction detector modules of the Geodetector Model (GDM), which quantify the individual and combined effects of key drivers. This novel framework enables (i) mapping spatiotemporal variations in water yield, pinpointing hotspots of high yield and cold spots of scarcity, and (ii) disentangling the relative contributions of climatic, topographic, and anthropogenic drivers, emphasizing land-use–climate interactions. By linking ecosystem service quantification to culturally sensitive adaptive governance, this work offers a replicable model for balancing water provisioning and heritage conservation in the Hani Terraces and similar agroecosystems worldwide.

2. Materials and Methods

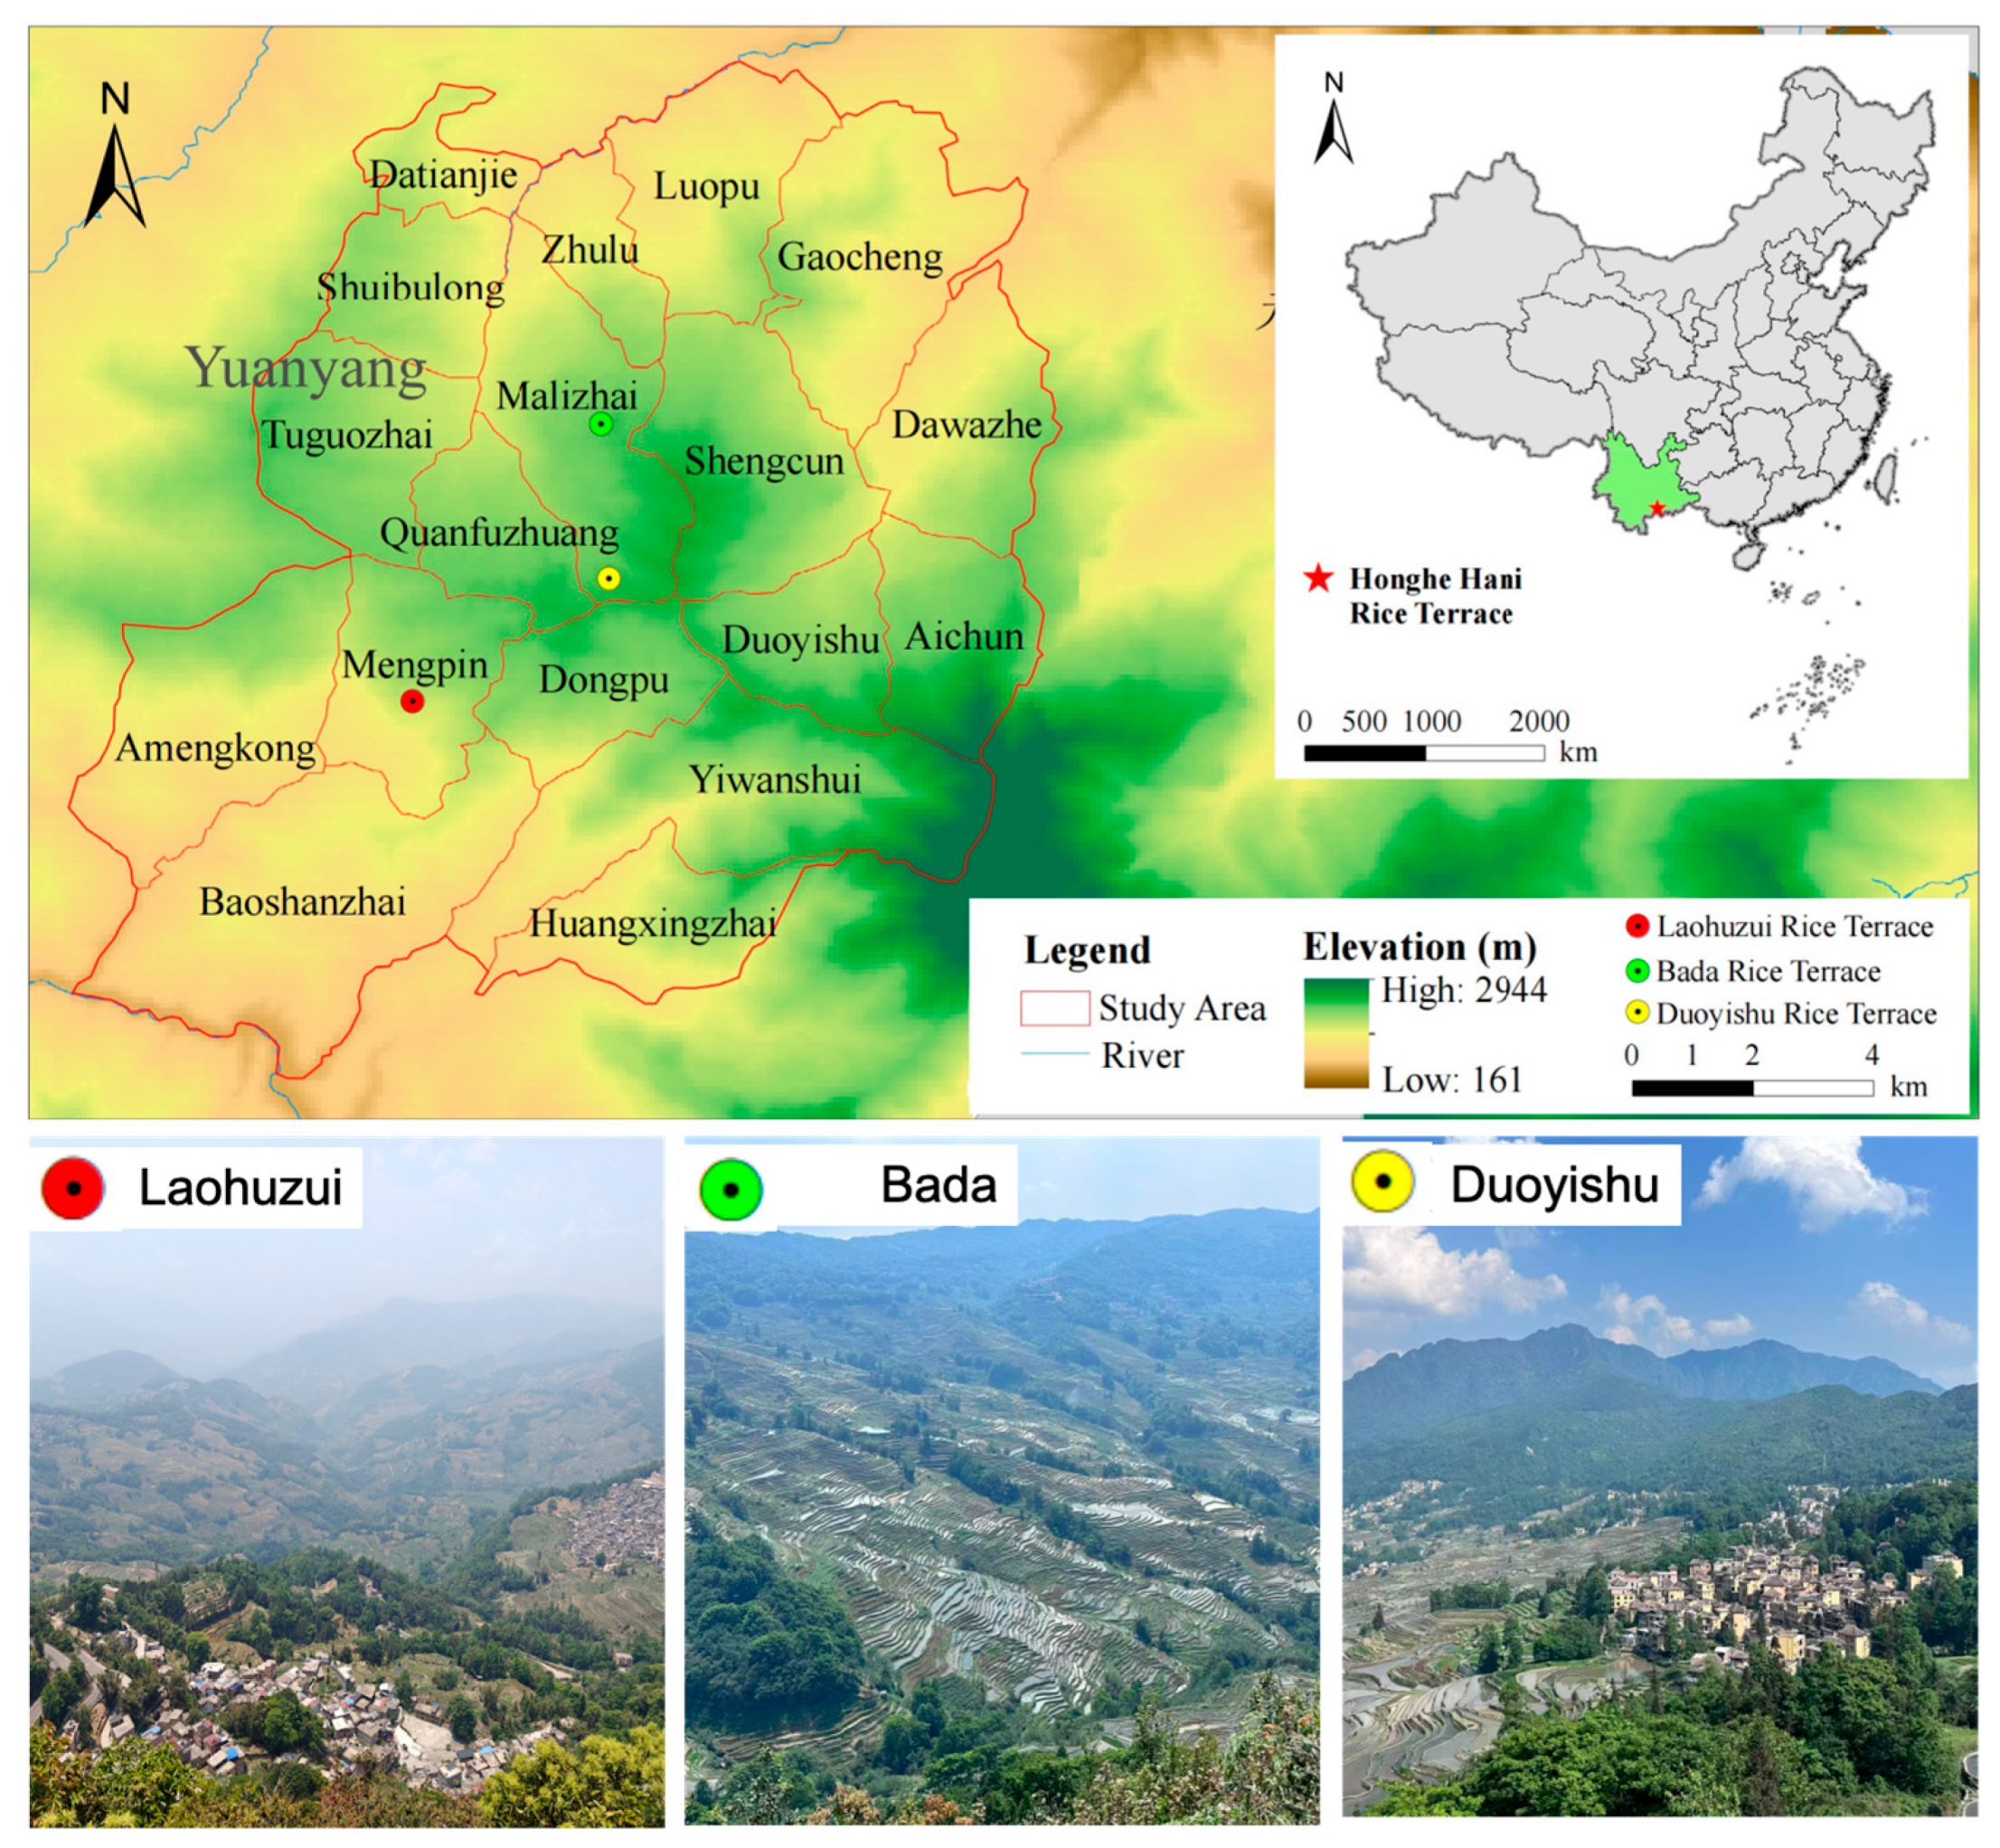
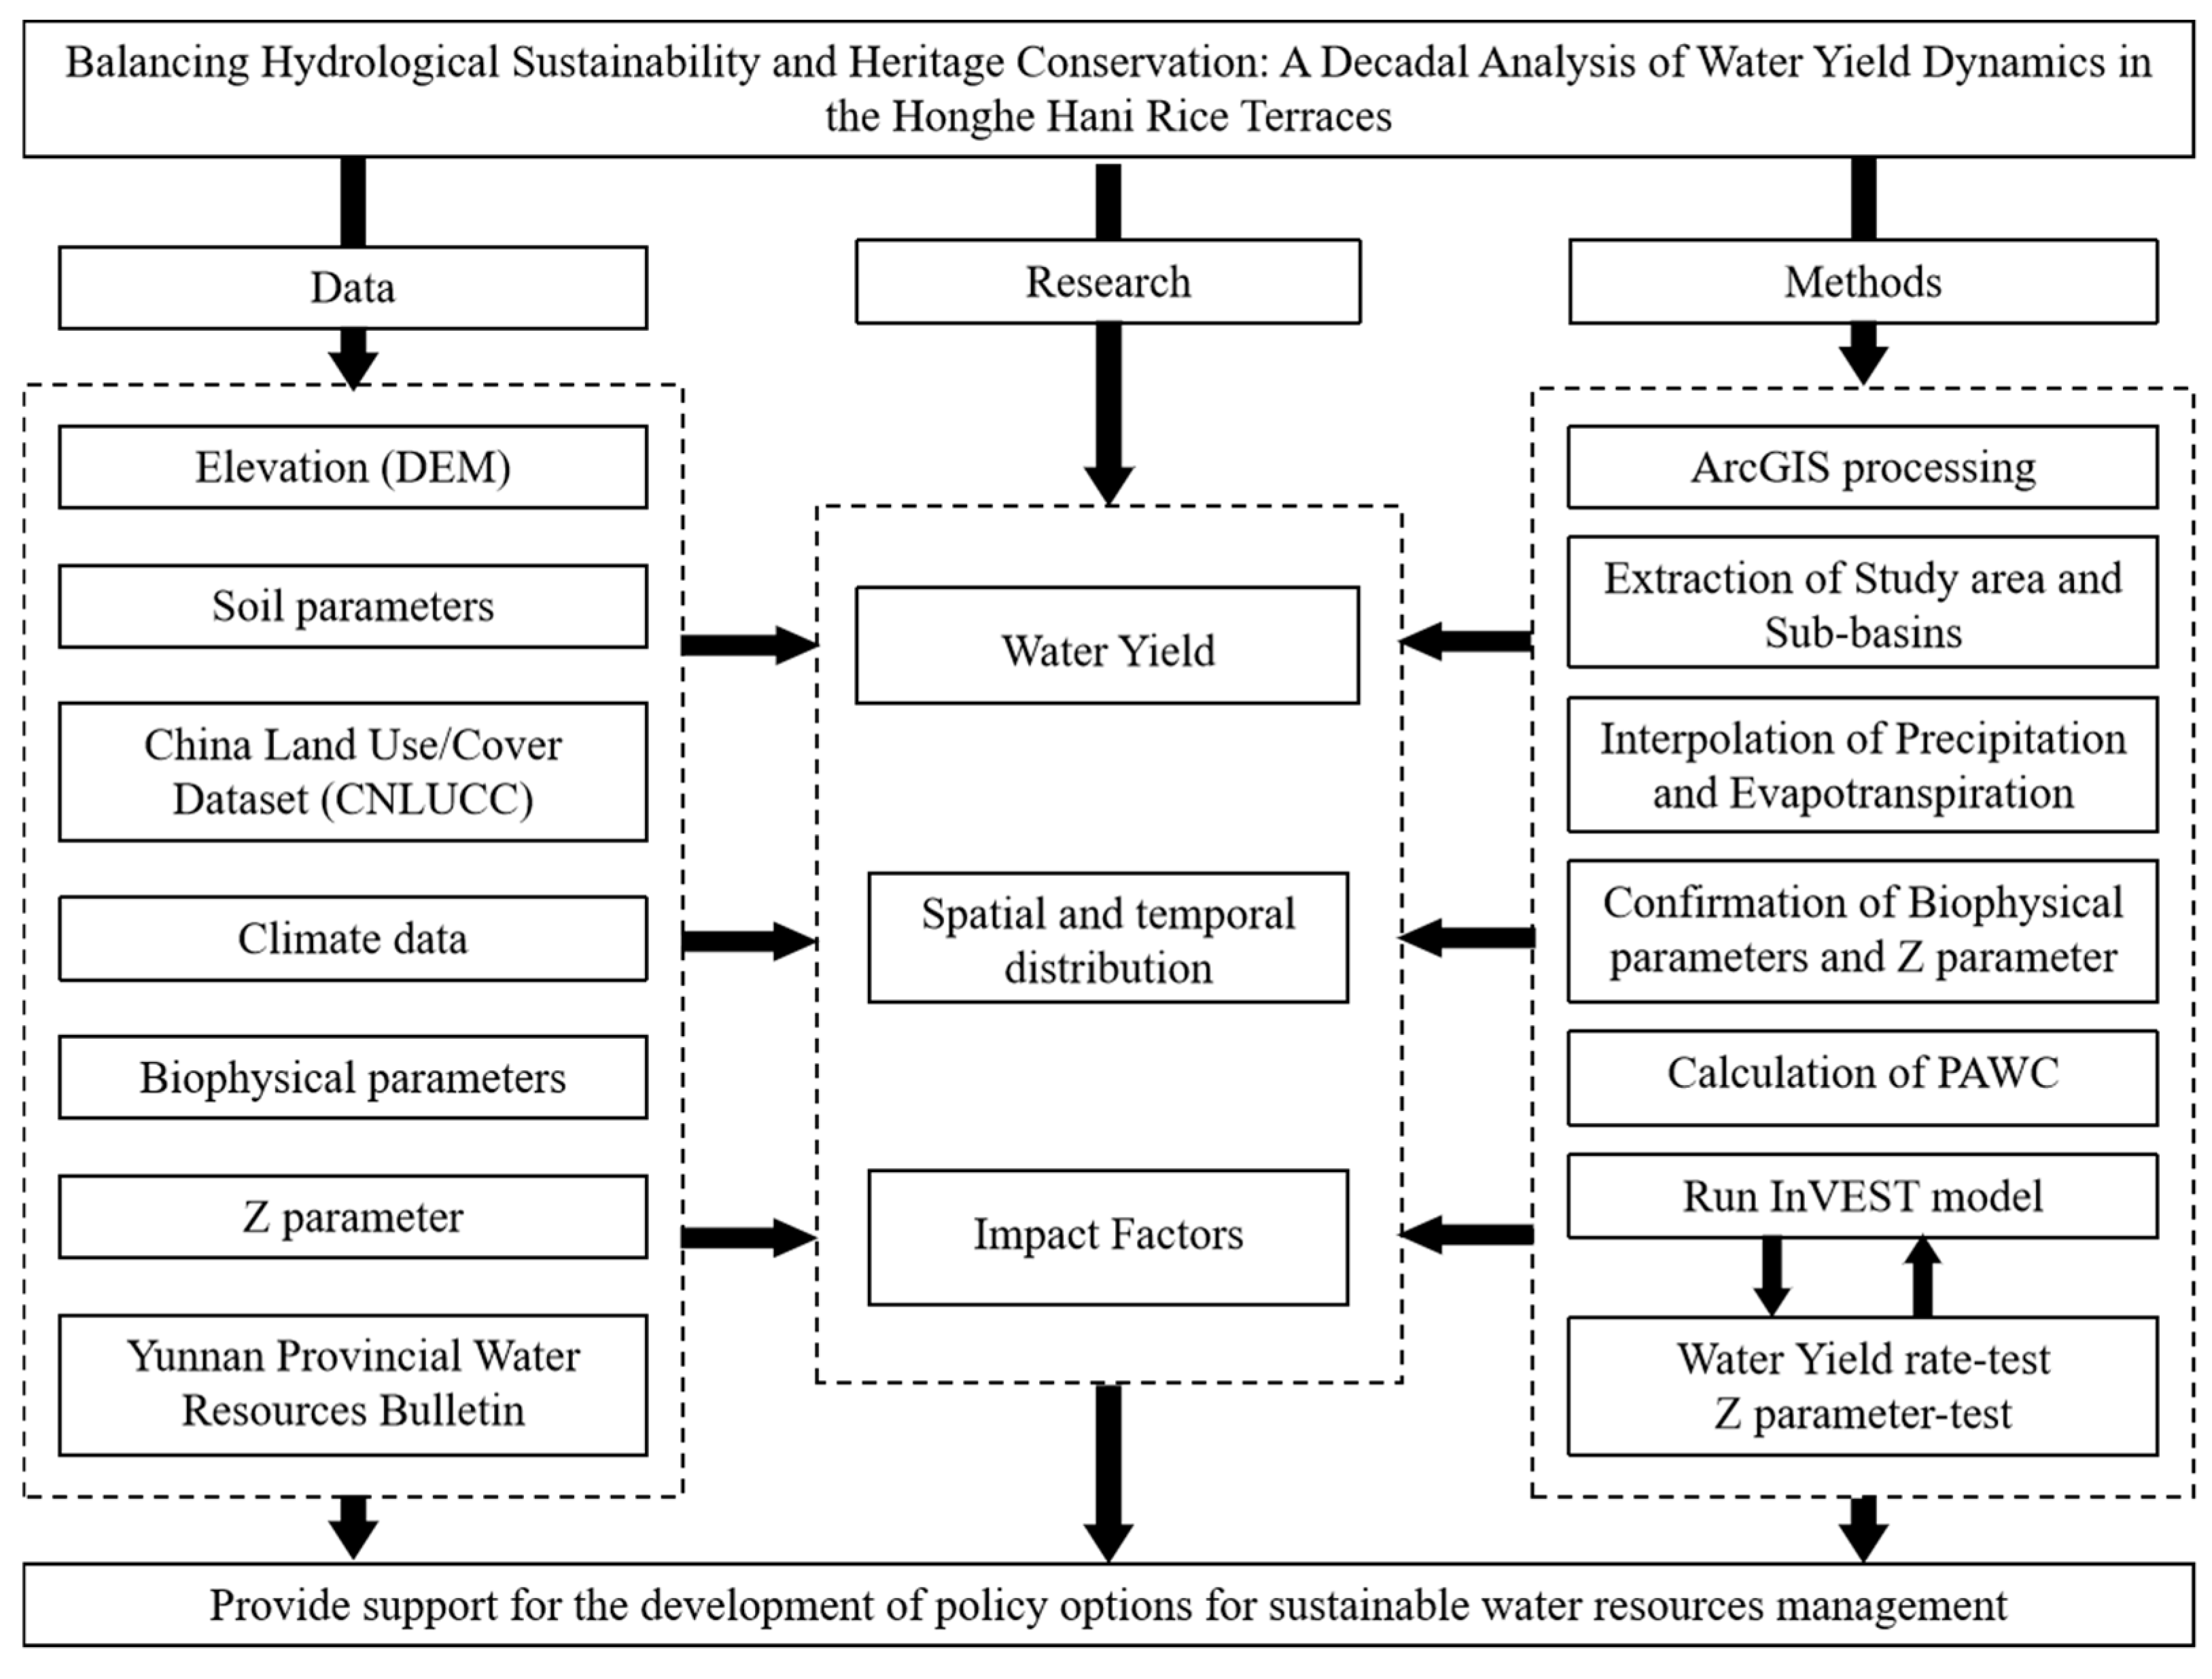
2.1. Study Area and Research Design

The study focused on the Honghe Hani Rice Terraces (23°10′48″–23°01′21″ N, 102°50′44″–102°41′47″ E), a UNESCO World Heritage agroecosystem in Yunnan Province, China. The terraces cover an area of approximately 16,603 hectares along the southern slopes of the Ailao Mountains, ranging in elevation from 144 to 2939 m above sea level. This region is characterized by a subtropical monsoon climate, diverse topography, and a rich cultural heritage associated with the Hani ethnic group.
The landscape is characterized by a distinctive vertical zonation comprising forests, villages, terraces, and waterways, with elevations ranging from 600 to 2837 m. Figure 1 provides geographic context and visually captures the terraces’ structural complexity. This unique landscape supports exceptional hydrological regulation and embodies significant cultural heritage, as highlighted in previous research [16,25]. The region’s complex topography and traditional water management practices make it an ideal case study for assessing land-use and climate impacts on water yield.

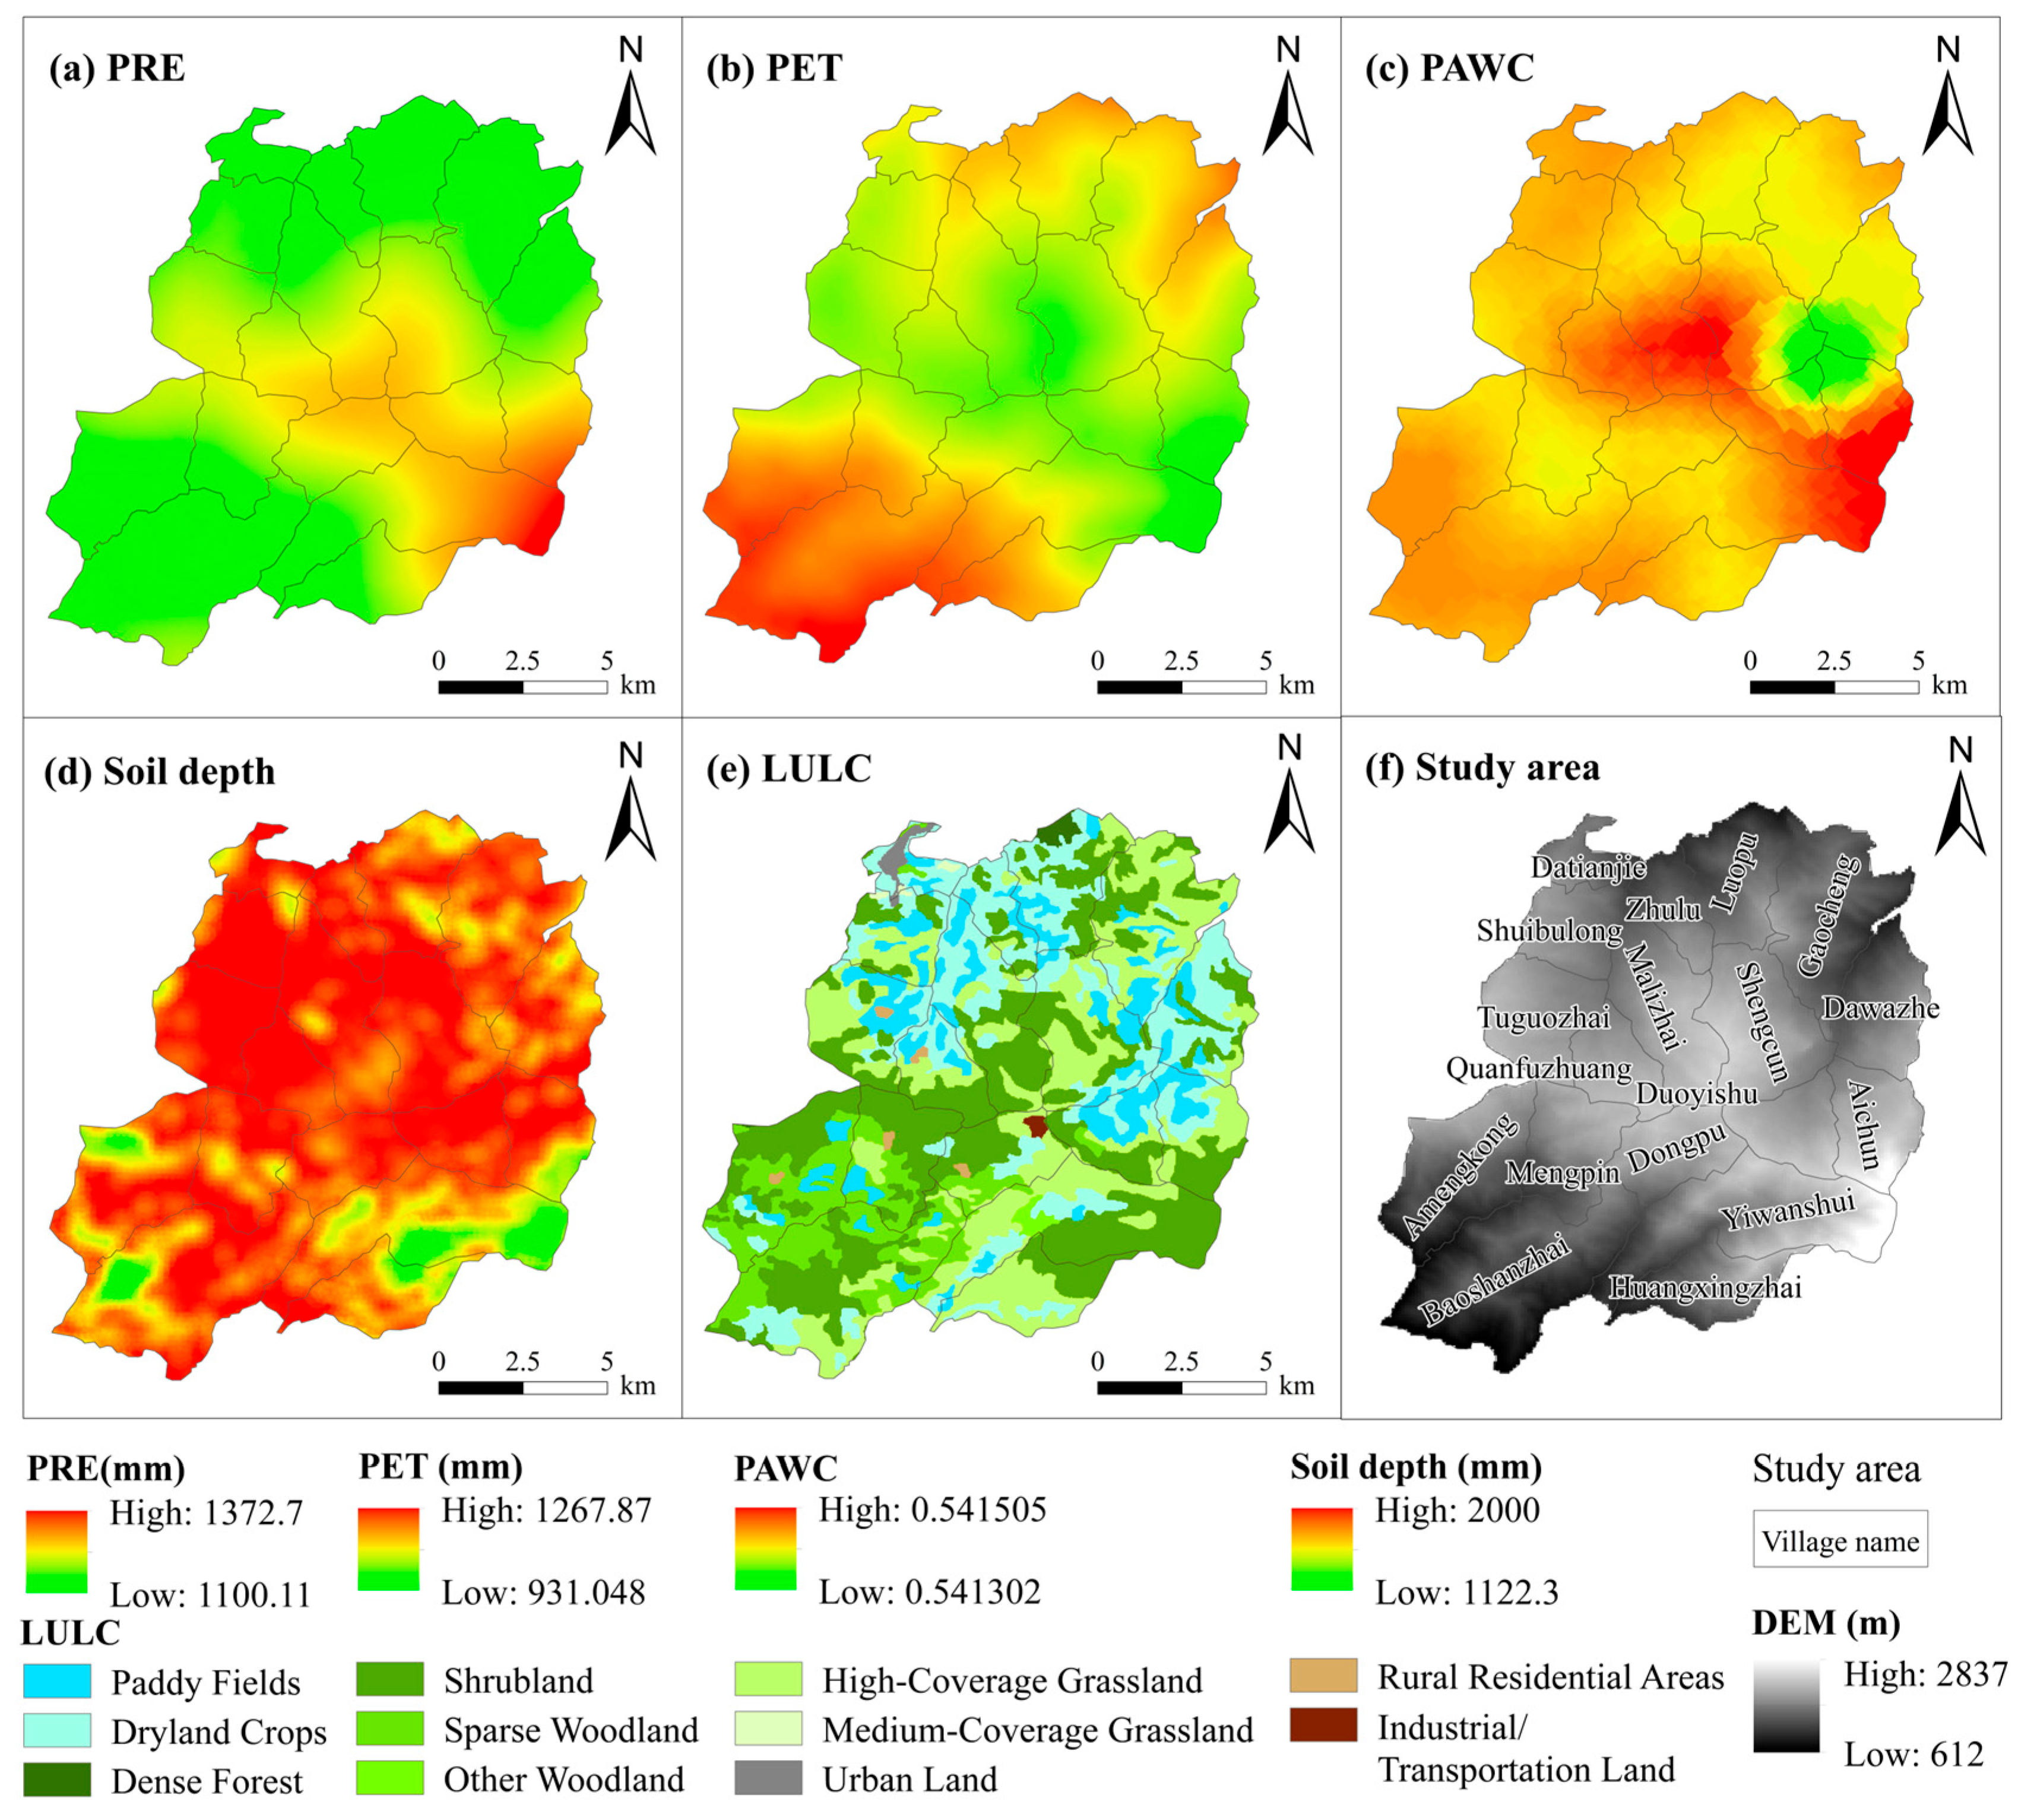
2.2. Data Collection and Preprocessing

The study’s workflow (Figure 2) integrates InVEST modeling, geographic detector analysis, and spatial-statistical validation. This framework links biophysical drivers (e.g., precipitation and soil depth) to socio-economic pressures (e.g., tourism infrastructure), enabling a holistic assessment of water-yield dynamics (data are provided in Supplemental Datasets S1).
We compiled a comprehensive dataset to assess water-yield dynamics in the Honghe Hani Rice Terraces from 2010 to 2020 (Table 1, Figure 3). Land-use/land-cover (LULC) maps for 2010, 2015, 2018, and 2020 were obtained from the China Land Use/Cover Dataset (CNLUCC) at 30 m resolution, categorizing areas into woodlands, croplands (paddy and dryland), grasslands, artificial surfaces, and water bodies [26]. Land-use types and cropland fragmentation (PD) were further processed using ArcGIS ver. 10.5 and Fragstats ver. 4.3.
Climate data, including annual precipitation and potential evapotranspiration (PET), were sourced from the National Earth System Science Data Center (https://www.geodata.cn/, accessed on 1 May 2024) at 1 km resolution. Potential evapotranspiration (PET) was computed using the Hargreaves equation, locally calibrated for mountainous terrain to account for elevation-driven microclimates. Topographic factors, including elevation (DEM) and slope, were retrieved from the Geospatial Data Cloud ([https://www.gscloud.cn/, accessed on 1 May 2024]). Slope was derived from DEM data using ArcGIS spatial analysis tools.
Soil parameters, specifically plant available water content (PAWC), were derived from the Harmonized World Soil Database (HWSD v1.0) using a soil texture-based formula [27], with adjustments for terrace-specific soil properties based on local measurements.
Ecological and socio-economic data were also incorporated. The normalized difference vegetation index (NDVI), gross domestic product (GDP), and land-use data were obtained from the Resource and Environmental Science Data Center, Chinese Academy of Sciences (https://www.resdc.cn, accessed on 1 May 2024). Population density was sourced from the WorldPop dataset (https://www.worldpop.org, accessed on 1 May 2024). The road network was retrieved from the OpenStreetMap data (https://www.geofabrik.de, accessed on 1 May 2024).
Observed water-yield data were extracted from the Yunnan Provincial Water Resources Bulletin, available via the official website of the Department of Water Resources of Yunnan Province (https://wcb.yn.gov.cn/, accessed on 1 May 2024), which provides annual statistics of total surface and groundwater resources at the prefecture scale.
All datasets were resampled to a consistent 30 m resolution and georeferenced to the UTM Zone 48N (WGS84) coordinate system, to ensure spatial alignment for analysis.

2.3. Water-Yield Modeling Using the InVEST Model with Validation

The InVEST Water-Yield Module calculates annual water yield (Y) as the difference between precipitation P and actual evapotranspiration (AET) at the pixel level, integrating surface runoff, groundwater recharge, and baseflow. The model employs the Budyko curve framework to simulate hydrological processes spatially using the following equation:
Y x = 1 A E T x P x · P x
where Y(x) is annual water yield (mm) for pixel x, P(x) is precipitation (mm) for pixel x, and AET(x) is actual evapotranspiration (mm) for pixel x.
For vegetated land-use/land-cover (LULC) types, AET is calculated using the following equation:
A E T ( x ) P ( x ) = 1 + P E T ( x ) P ( x ) 1 + P E T ( x ) P ( x ) ω 1 / ω
where PET(x) is potential evapotranspiration (mm), and ω(x) is an empirical parameter characterizing basin surface properties.
ω is an empirical parameter calculated as follows:
ω x = Z A W C ( x ) P ( x ) + 1.25
where Z is a climate seasonality factor (calibrated iteratively), and AWC(x) is plant available water content (mm). AWC is calculated as AWC = min {soil root depth, root restricting layer depth}·PAWC, where PAWC is plant available water capacity derived from soil texture data.
Model inputs included precipitation, PET, LULC, soil properties, and biophysical parameters (Table 1). To assess the applicability of the InVEST model in the Hani Terraces, simulated water-yield results were compared with observed data from the Yunnan Provincial Water Resources Bulletin (2010, 2015, 2018, and 2020).

2.4. Spatial Analysis of Water-Yield Patterns

Spatial analysis of water-yield patterns in the Honghe Hani Rice Terraces was conducted using ArcGIS (ver. 10.5) to detect clustering, hotspots, and outliers in water-yield outputs from the InVEST model. Water-yield data were then reclassified into 12 categories using the Jenks natural breaks optimization method to enhance visualization of spatial distributions, which minimizes within-class variance and maximizes between-class differences, thereby ensuring optimal representation of spatial variability. To ensure computational efficiency and consistency with regional hydrological patterns, the data were resampled to a 100 m grid resolution. A multi-scale spatial analysis was performed using Global Moran’s I, Getis-Ord Gi* hotspot analysis, and Local Moran’s I outlier analysis. These methods were selected to comprehensively capture both overall spatial autocorrelation and localized clustering or outlier patterns. Specifically, Global Moran’s I quantifies spatial autocorrelation at the landscape scale, Getis-Ord Gi* identifies statistically significant hotspots and cold spots, and Local Moran’s I detects local clusters and spatial outliers. Together, these complementary methods provide a robust and detailed assessment of spatial heterogeneity, providing insights into spatial heterogeneity critical for targeted water resource management and conservation planning.
Global Moran’s I was used to evaluate whether water yield exhibited clustered, dispersed, or random spatial patterns across the study area. The Moran’s I statistic quantifies the average spatial similarity among neighboring pixels. The interpretation is as follows: (i) I > 0: clustered distribution (high or low values cluster together); (ii) I < 0: dispersed distribution; and (iii) I = 0: random distribution. Statistical significance was assessed using z-scores (|z| > 1.96) and p-values (p < 0.05). The Getis-Ord Gi* statistic identified statistically significant hotspots (high-yield clusters) and cold spots (low-yield clusters) at confidence levels of 99%, 95%, and 90%. Local Moran’s I identified spatial anomalies, including High-High (HH) clusters (high-yield areas surrounded by high-yield areas, Low-Low (LL) clusters (low-yield areas surrounded by low-yield areas), High-Low (HL) outliers (high-yield areas surrounded by low-yield areas), and Low-High (LH) outliers (Low-yield areas surrounded by high-yield areas). These analyses collectively informed the spatial dynamics of water yield, supporting prioritized conservation strategies in the Hani Terraces’ agroecosystem.

2.5. Driver and Interaction Analysis Using the Geographic Detector Model

The Geographic Detector Model (GDM) was utilized to assess the impact of potential driving factors (Table 2) on the spatial heterogeneity of water-yield services. The selection of these factors was guided by their recognized impact on water yield and landscape structure, as documented in previous studies (e.g., [28,29]). Roads and their proximity can affect hydrological connectivity and human disturbance, while land-use diversity reflects landscape heterogeneity, which is closely linked to ecosystem functions and water regulation.
This method identifies factors with the greatest explanatory power for both individual and interactive effects. The GDM is based on the principle that, when an independent variable X significantly influences a dependent variable Y, their spatial distributions exhibit notable consistency. In contrast to traditional factor analysis, the GDM distinctively accounts for spatial heterogeneity, providing a more comprehensive perspective on the drivers of ecosystem services.
We employed the factor detector and interaction detector modules of the GDM to (i) evaluate the contributions of individual factors to spatial patterns of water yield and (ii) identify synergistic or antagonistic interactions among paired factors. The factor detector quantifies the explanatory power (q-value) of an individual driver X on the spatial heterogeneity of Y (water yield). The q-value ranges from 0 to 1, where higher values indicate greater explanatory power of X. The interaction detector assesses how the combined effect of two drivers (X1 ∩ X2) enhances or weakens their individual explanatory power. Continuous variables, such as precipitation and temperature, were discretized into stratified classes using the Jenks natural breaks method to minimize within-class variance and maximize between-class differences, ensuring effective spatial stratification for GDM analysis.

3. Results

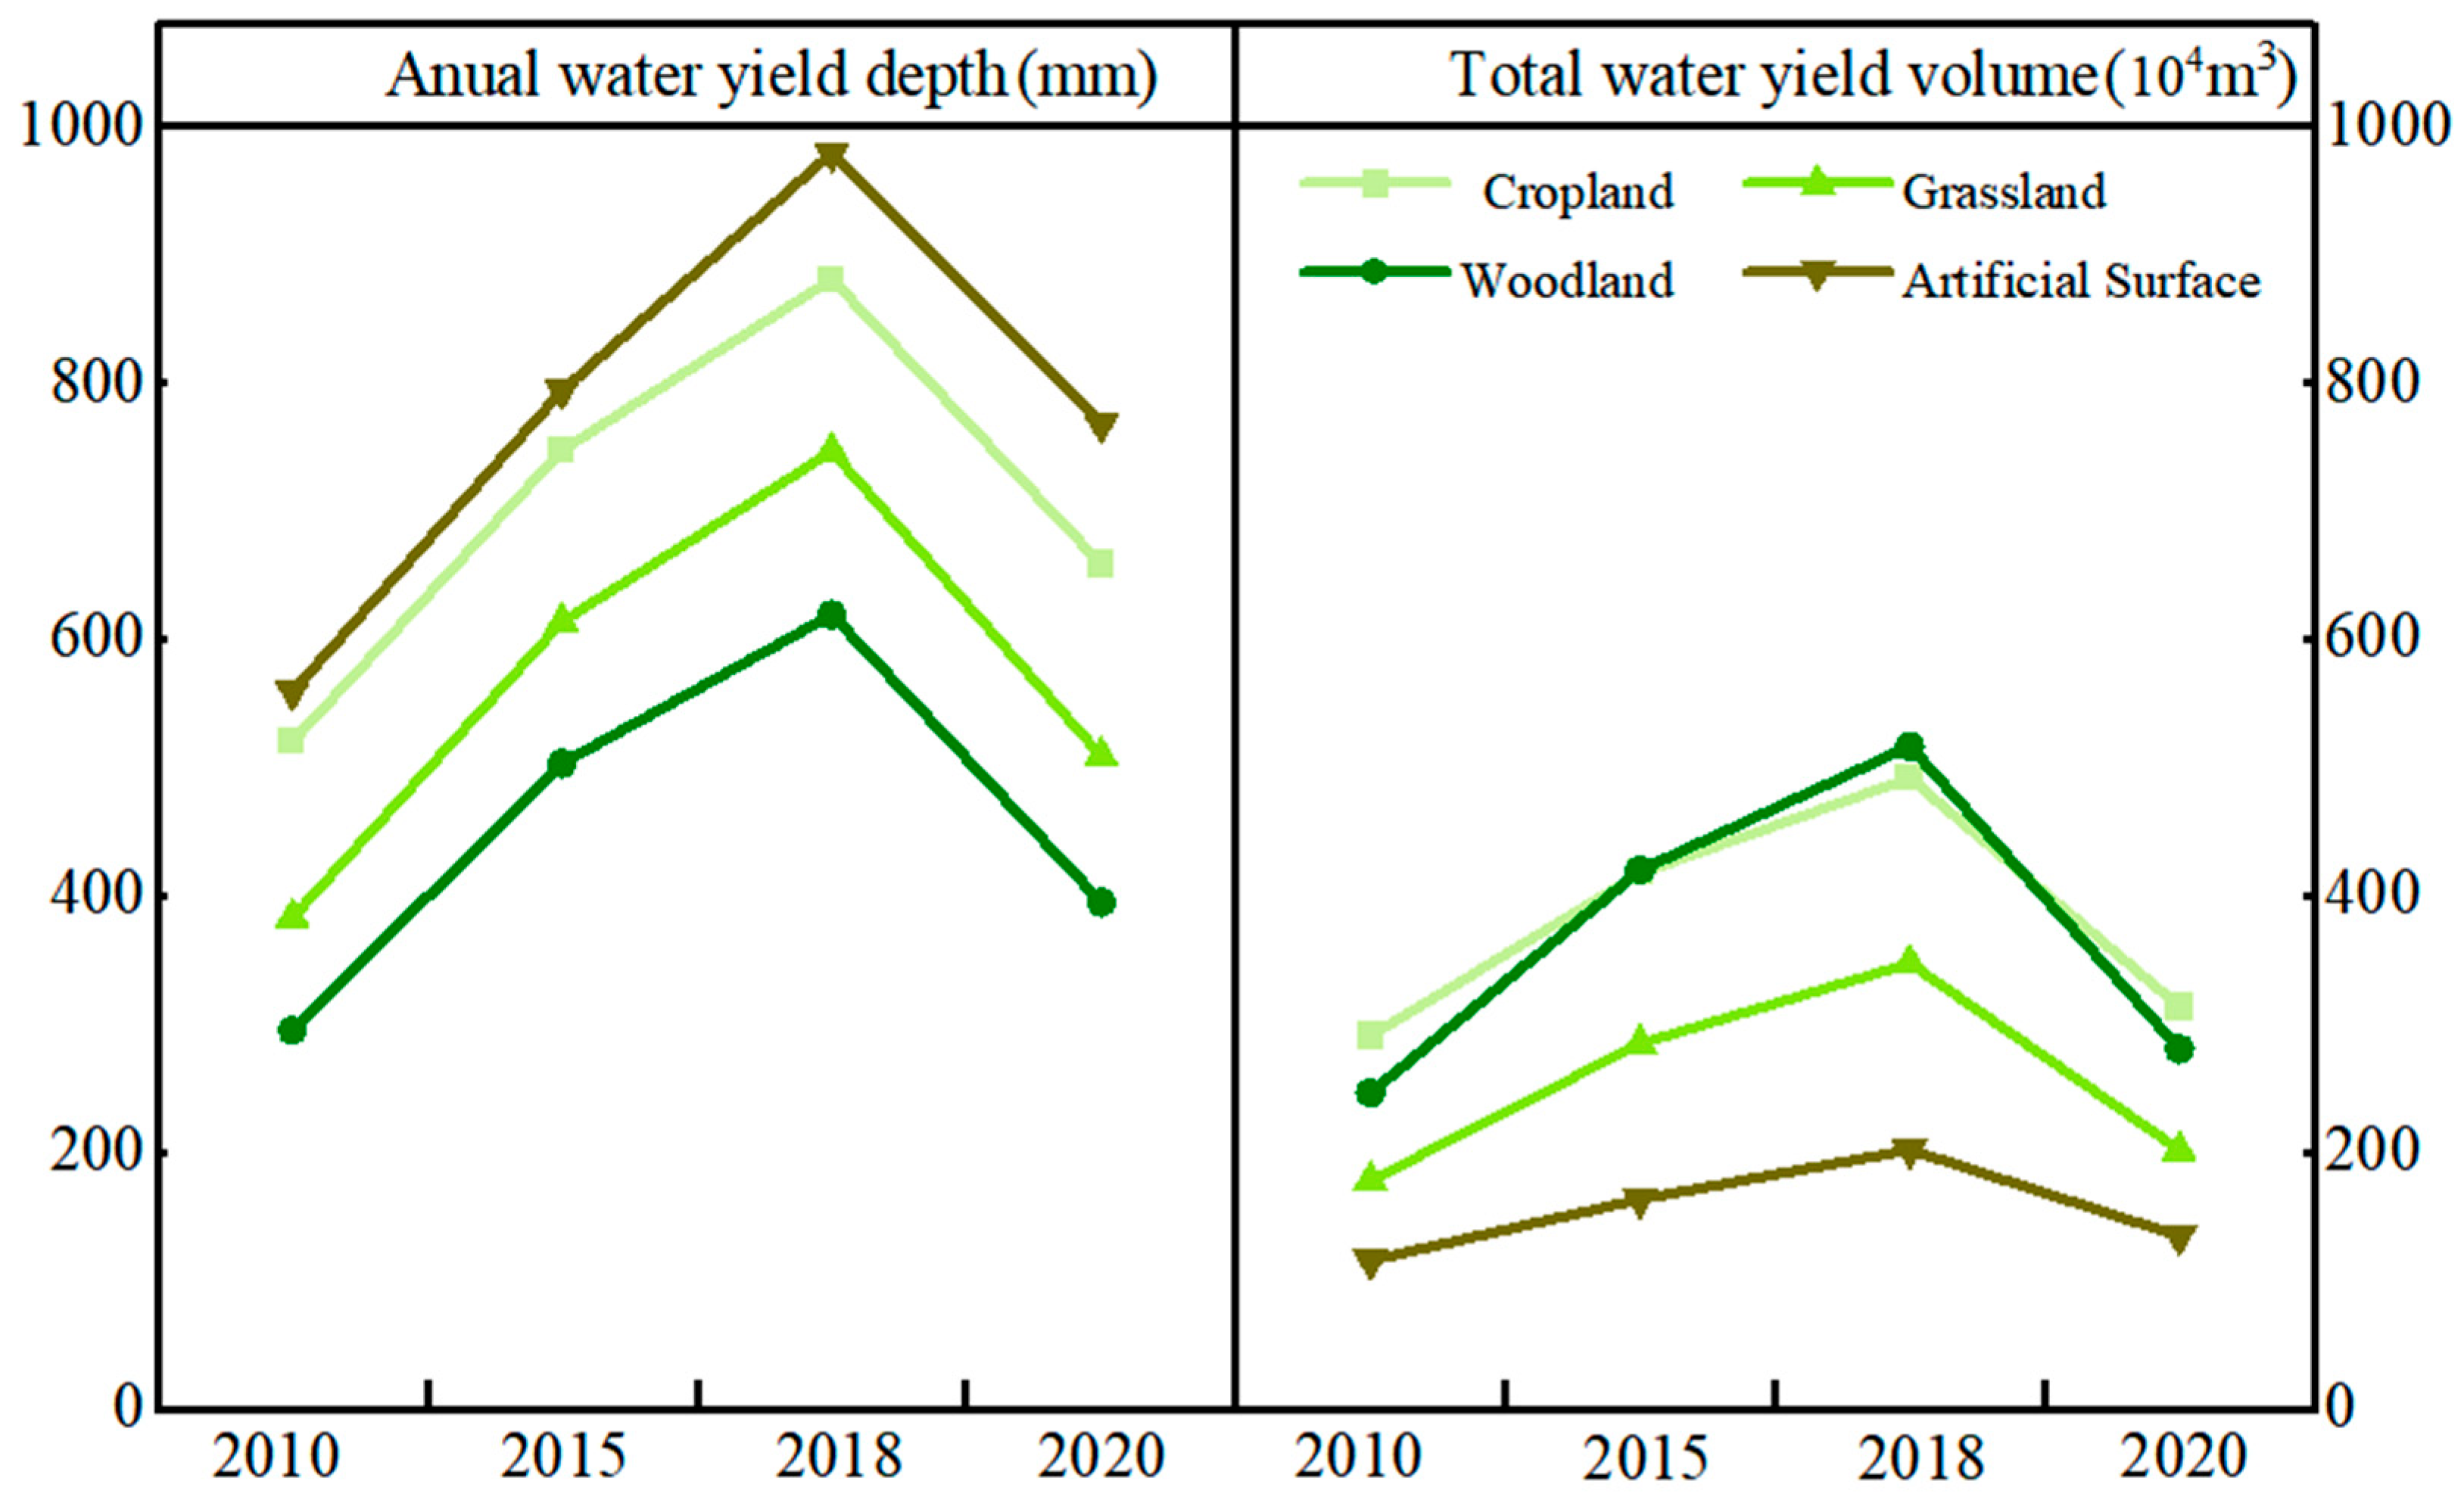
3.1. Rising and Falling Water Yields in the Hani Terraces

To optimize model performance, the climate seasonality factor (Z) in the InVEST model was iteratively adjusted within the range of 3.5 to 4.0. The optimal fit between modeled and observed water yields was achieved at Z = 3.5, resulting in a mean relative error (MRE) of less than 15%. This low error margin demonstrates that the InVEST model accurately captures the hydrological dynamics of the Hani Terraces, validating its suitability for spatially explicit water resource assessments in this vertically zoned agroecosystem.
From 2010 to 2020, Hani Rice Terraces’ water yield fluctuated, peaking in 2018 (732.68 mm) before declining to 505.83 mm in 2020, with a decadal average of 558.04 mm. Water-yield depth ranked 2018 > 2015 (606.73 mm) > 2020 > 2010 (387.03 mm). A 56.76% increase from 2010 to 2015, driven by higher precipitation and better terrace retention, contrasted with a 30.96% drop from 2018 to 2020 due to drought and land-use fragmentation. Total yield volume rose from 16.92 million m3 (2010) to 85.62 million m3 (2020), boosted by 12% more forest cover and improved infiltration in central-eastern villages (e.g., Aicun and Qingkou). Post-2018 declines were tied to abandoned southwestern croplands (e.g., Amengkong), where urbanization cut permeable surfaces by 18%.
Spatially, water-yield depth was highest in central regions, particularly Datianjie and Aichun paddy fields, followed by Dawazhe and Duoyishu, while southwestern areas (Amengkong, Baoshanzhai, and Mengpin) exhibited the lowest depths (Figure 4). Intermediate depths occurred in central villages (Shengcun, Quanfuzhuang, Malizhai, and Yiwanshui) and northern/southern areas (Zhulu, Gaocheng, and Huangxingzhai). Depths ranged from 42.47 to 195.24 mm over the decade, with central areas showing the greatest variability and southwestern/northeastern areas the least. Most regions exceeded the average depth, except in the southwest. By land use, water-yield depth ranked artificial surface > cropland > grassland > woodland, peaking in 2018 at 979.61 mm, 880.95 mm, 747.01 mm, and 619.42 mm, respectively (Figure 5). Total yield contributions were led by cropland (33.17% average) and woodland (31.41%), followed by grassland and artificial surfaces. In 2018, yields were 5.17 million m3 (woodland), 4.92 million m3 (cropland), 3.48 million m3 (grassland), and 2.02 million m3 (artificial surface). Cropland and woodland accounted for 64.73% of total yield, with cropland benefiting from high depth and woodland from extensive area (Figure 5).

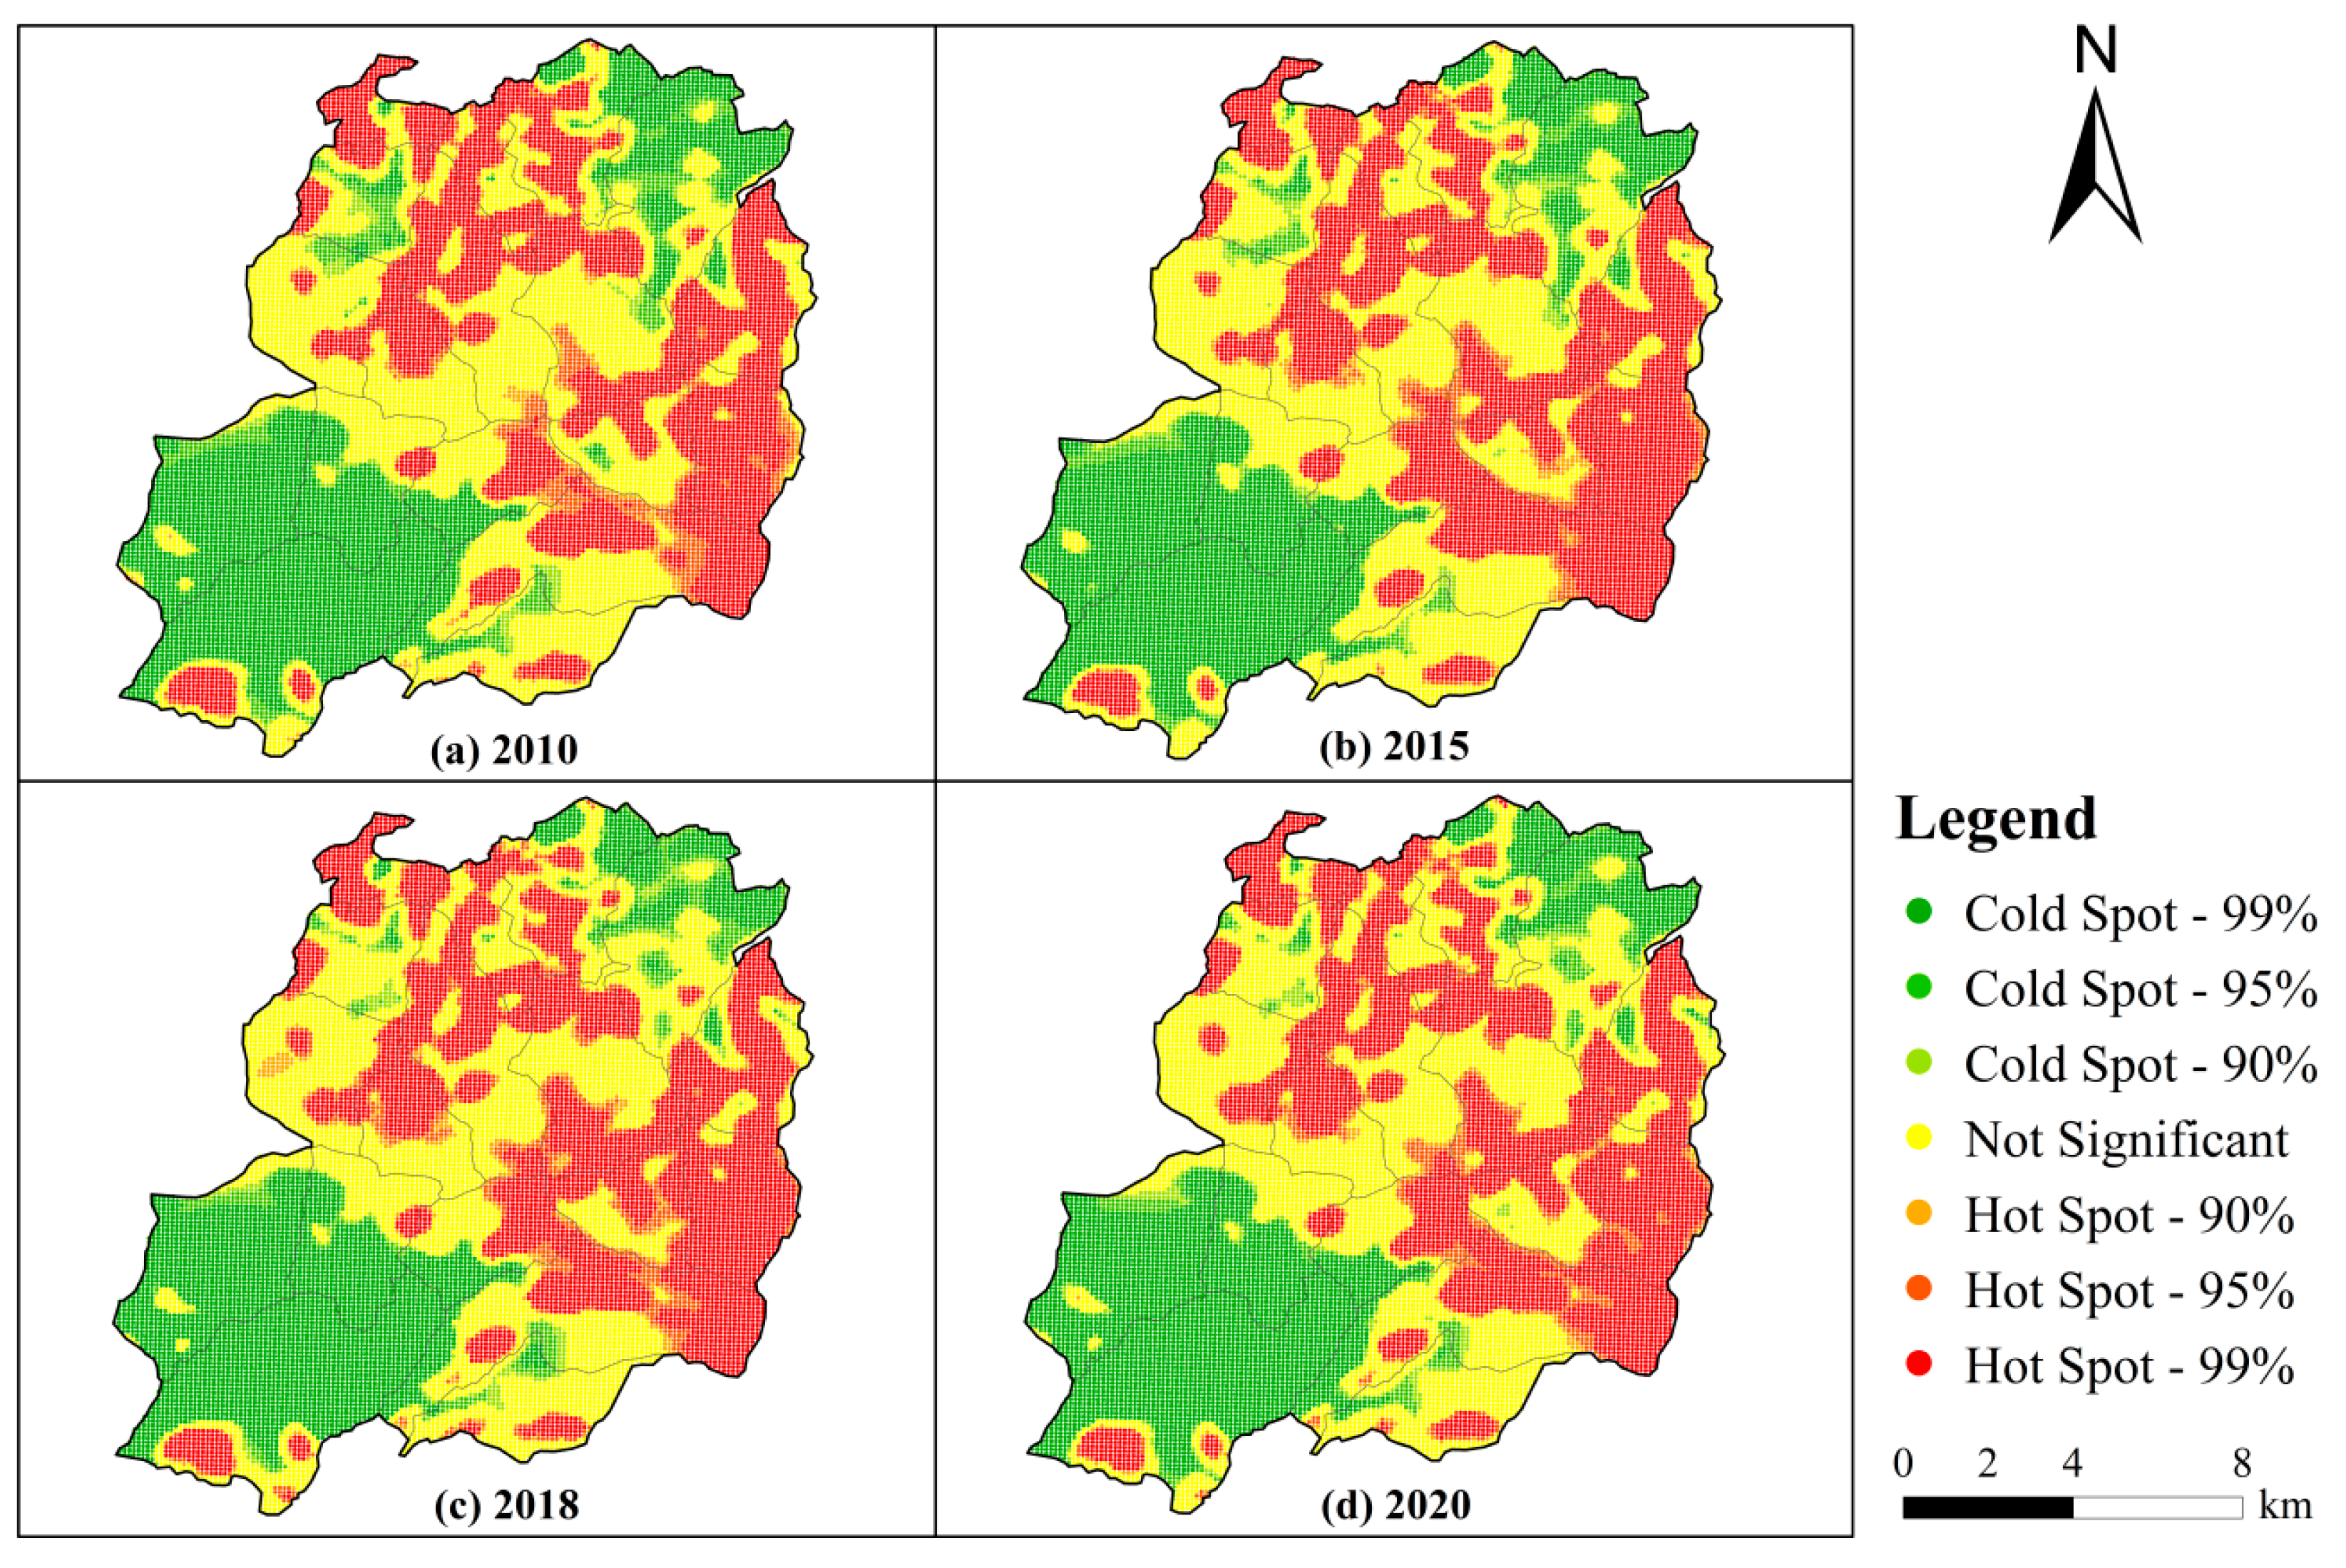
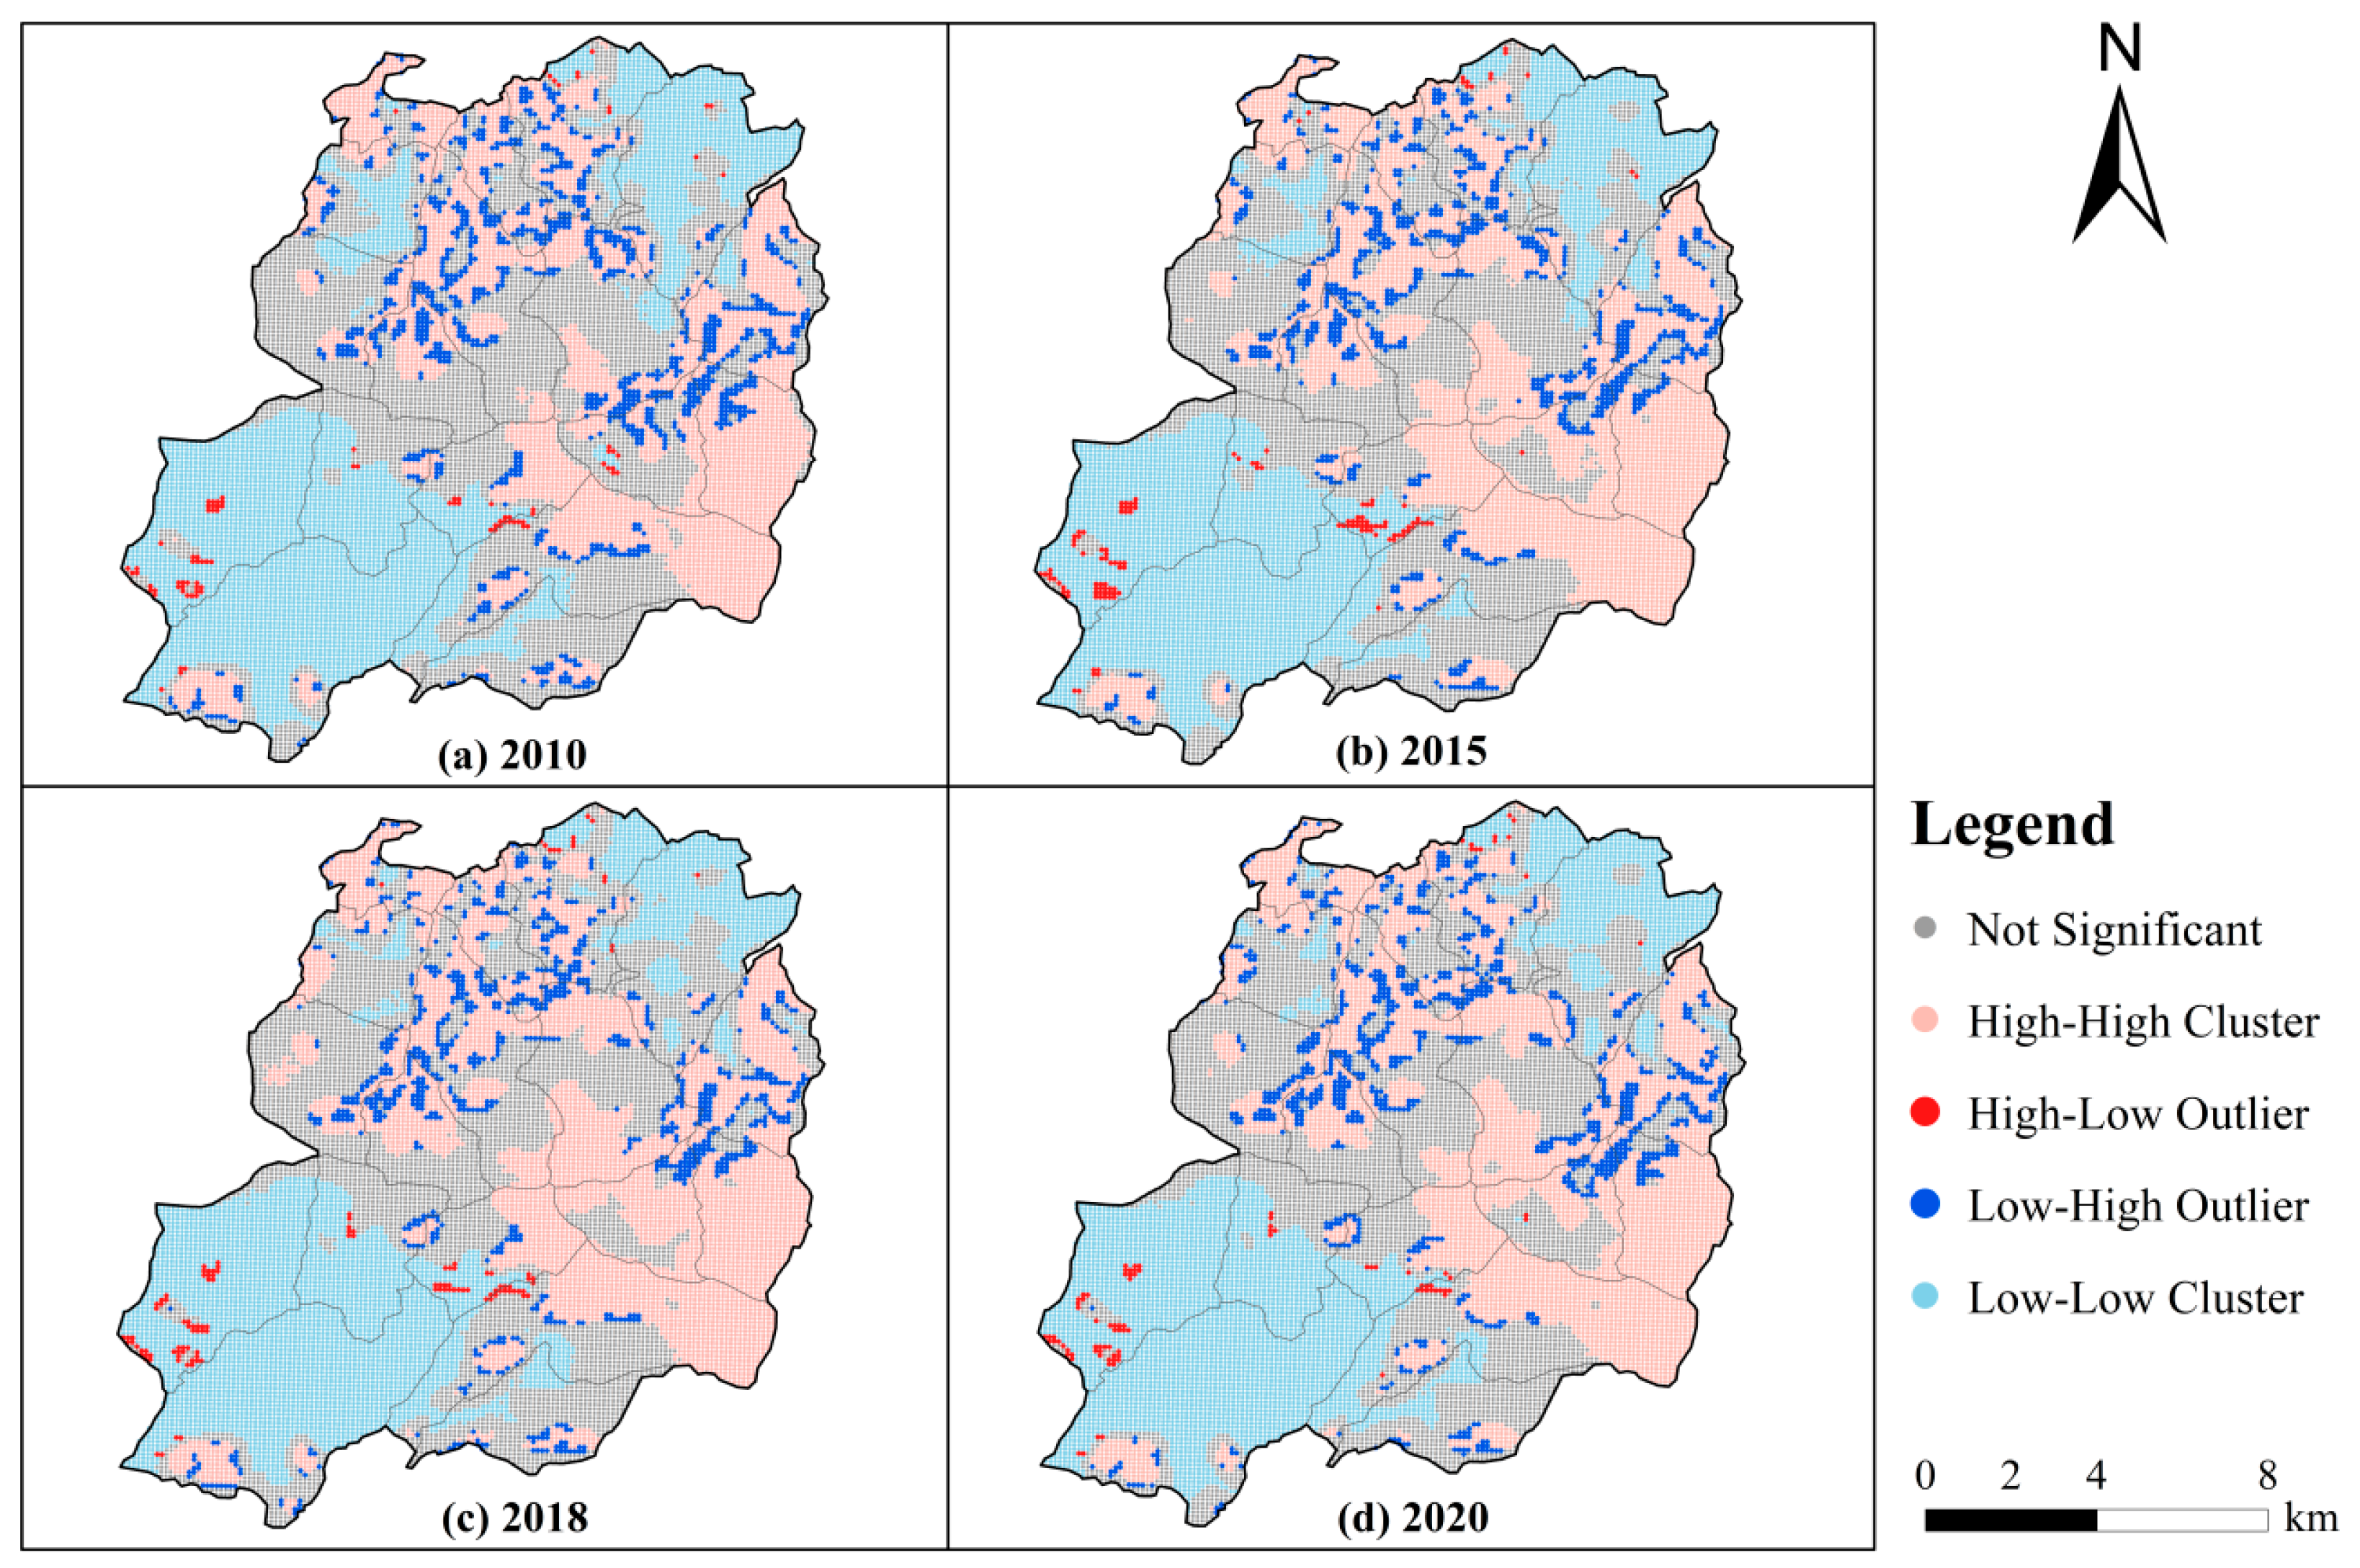
3.2. Growing High-Yield and Shrinking Low-Yield Zones

Global spatial autocorrelation analysis of water yield in the Honghe Hani Rice Terraces (2010, 2015, 2018, and 2020) yielded positive Moran’s I values, z-scores exceeding 145 (p < 0.01), and less than 1% likelihood of random clustering, indicating strong positive spatial correlation each year. Hotspot and cold spot analysis (Getis-Ord Gi*, p = 0.001) identified persistent spatial clustering (Figure 6). Cold spots, indicating low water yield, were concentrated in southwestern (Baoshanzhai, Amengkong, and Mengpin) and northeastern (Gaocheng) regions, while hotspots, reflecting high water yield, dominated southeastern areas (Aichun, Yiwanshui, and Dawazhe). Over the decade, cold spots contracted (e.g., Gaocheng and Shuibulong; Figure 6a vs. Figure 6c), whereas hotspots expanded in central regions (Shengcun and Dongpu; Figure 6a vs. Figure 6c). Hotspots consistently outnumbered cold spots, with cold spots prevalent in the southwest, hotspots in the east, and mixed patterns in central and northern areas.
Local clustering and outlier analysis (Anselin Local Moran’s I) corroborated these patterns, aligning low-value (LL) and high-value (HH) clusters with cold spots and hotspots, respectively (Figure 7). “High-Low” (HL) outliers, indicating high-yield areas surrounded by low-yield zones, emerged in southwestern (Amengkong and Dongpu) and northern regions, while “Low-High” (LH) outliers, reflecting low-yield areas amid high-yield zones, appeared in northern villages, eastern (Dawazhe), and southeastern (Huangxingzhai and Yiwanshui) areas, often near dryland edges or paddy fields. LH outliers, more prevalent than HL outliers, decreased over time (e.g., Shengcun and Duoyishu; Figure 7a vs. Figure 7c), while HL outliers slightly increased in Dongpu (Figure 7a vs. Figure 7b), primarily at central and eastern dryland boundaries due to land-use transitions.

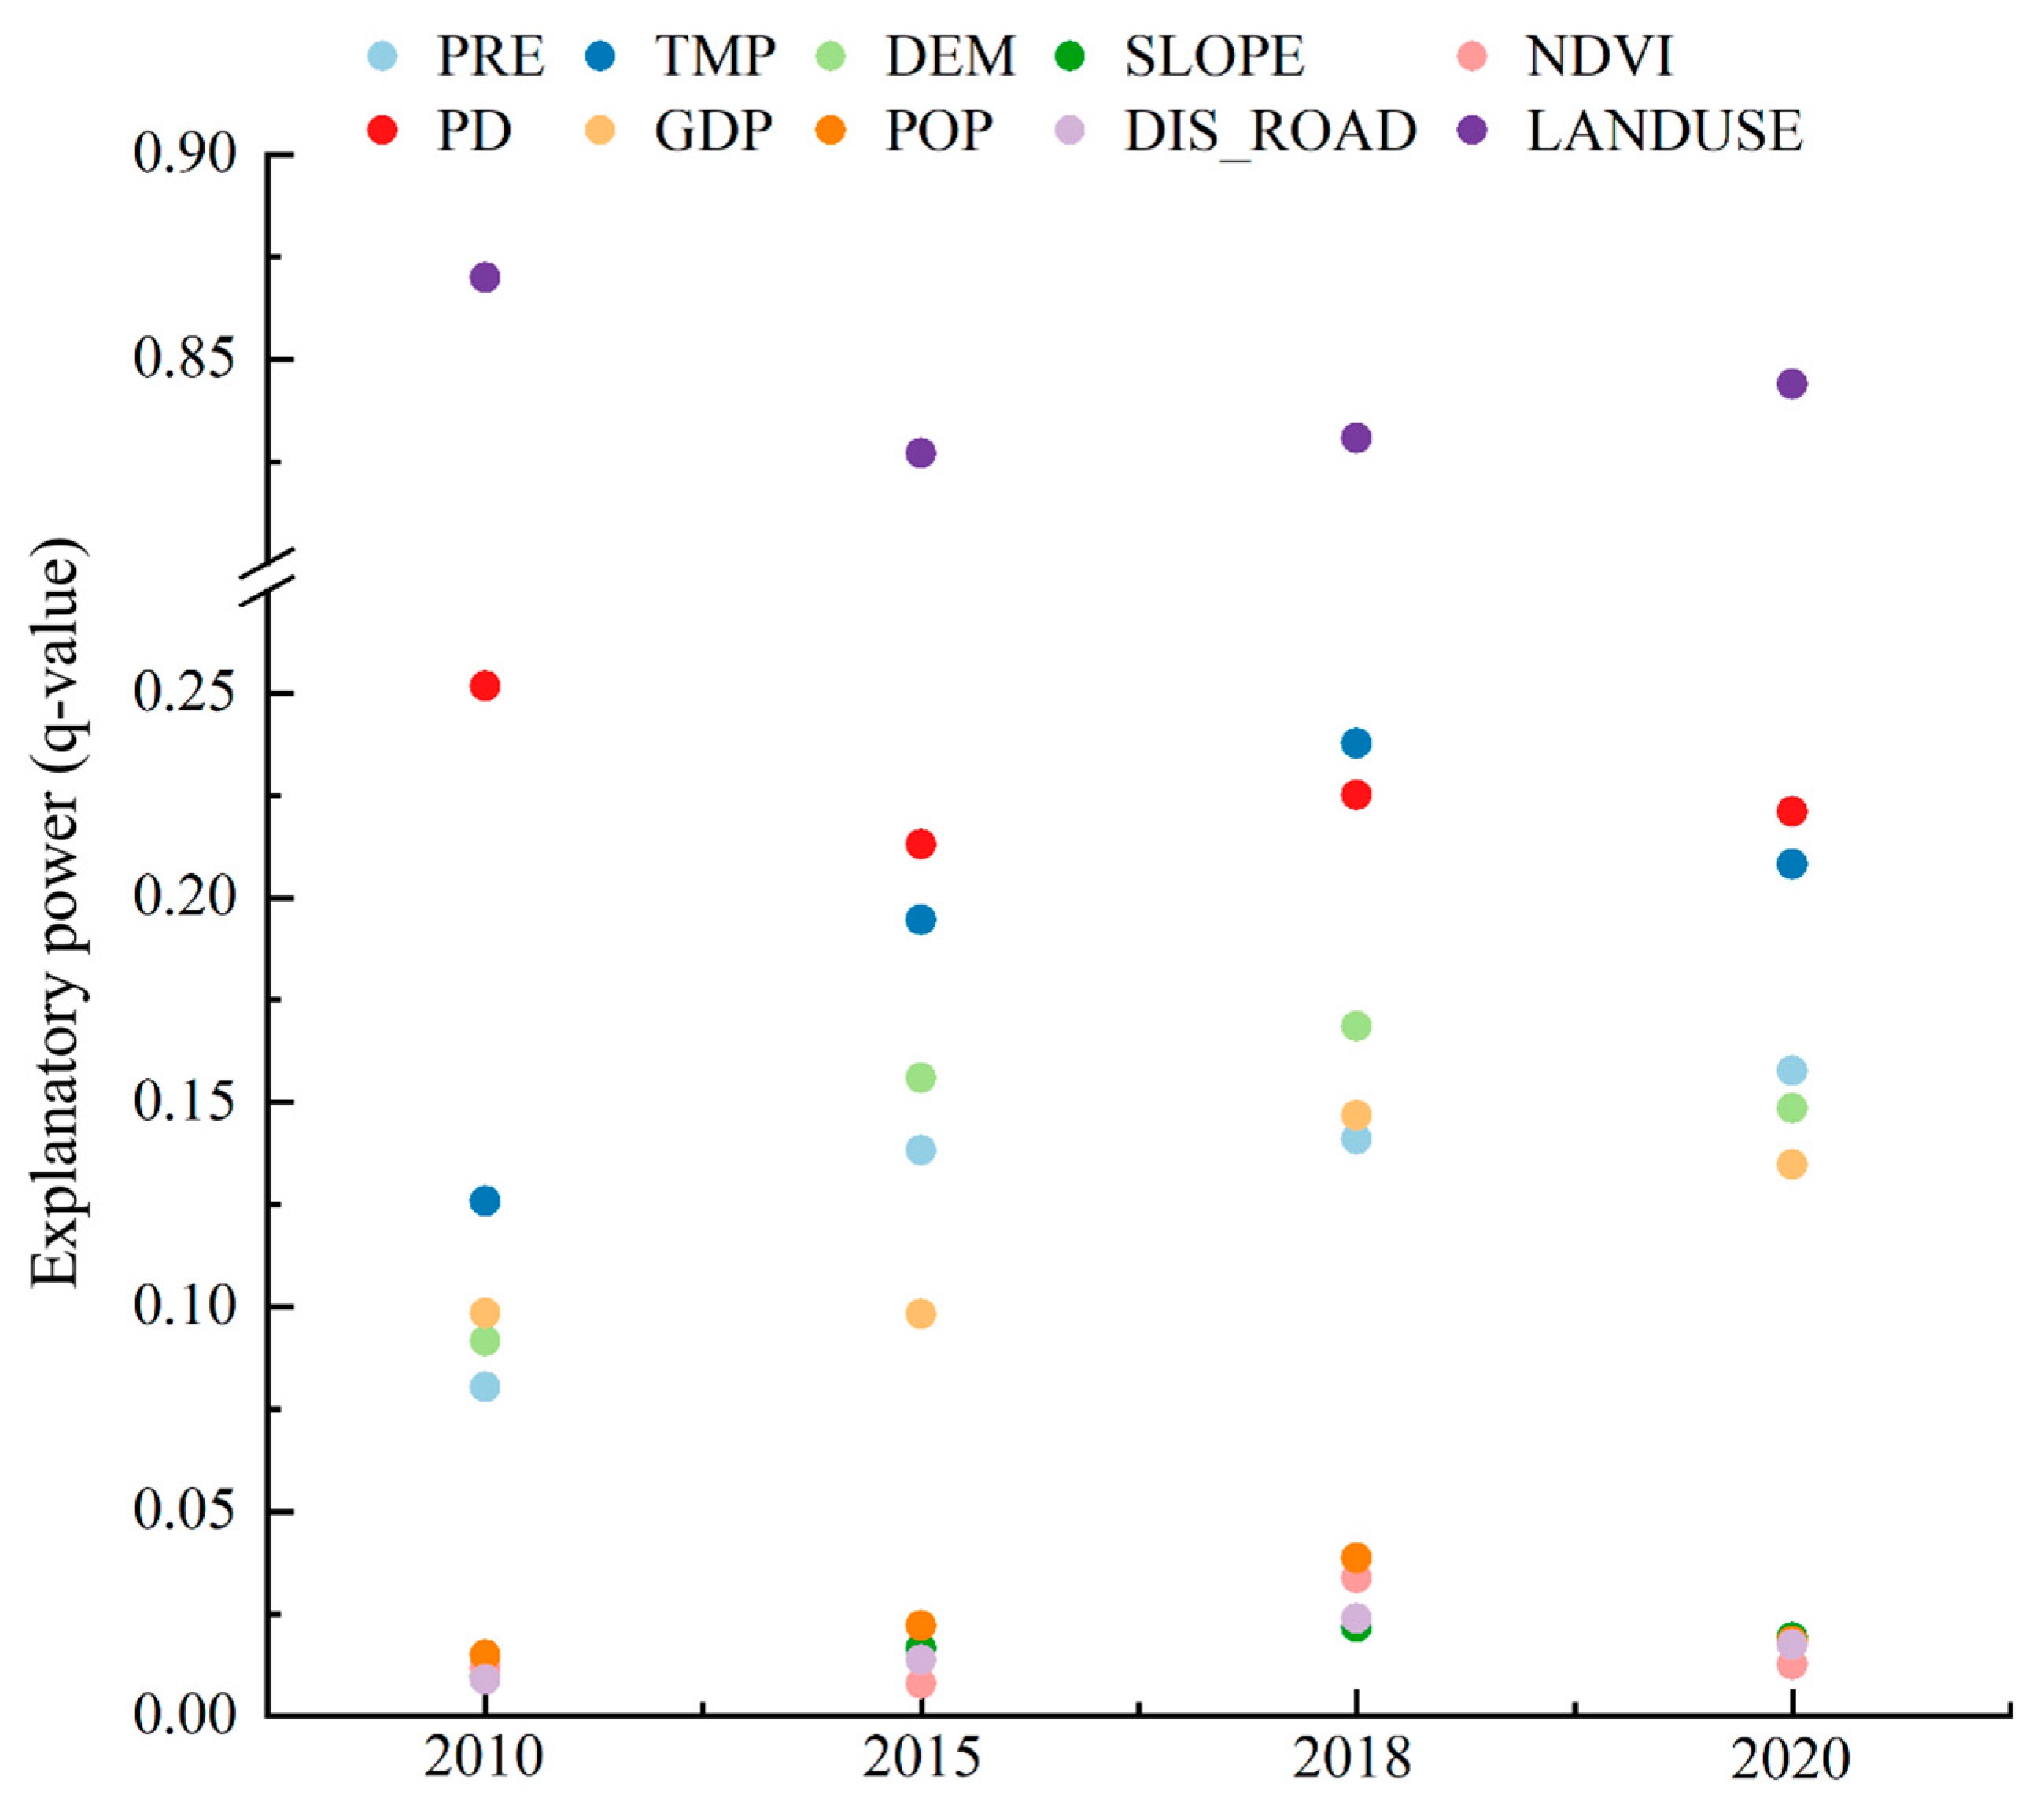
3.3. Land-Use Leads and Climate Enhances Water-Yield Changes

All factors influencing water yield in the Honghe Hani Rice Terraces exhibited significant correlations (p < 0.001; Table 3). Land use (LANDUSE) exerted the strongest influence on spatial heterogeneity, with q-values exceeding 0.8, peaking at 0.87 in 2010 (Figure 8). Cropland path density (PD) and temperature (TMP) followed, with q-values ranging from 0.21 to 0.25 and 0.12 to 0.23, respectively. Elevation (DEM), precipitation (PRE), and GDP had moderate effects, with q-values between 0.08 and 0.16, and PRE peaking in 2018 due to high rainfall. Slope (SLOPE), NDVI, population density (POP), and distance to roads (DIS_ROAD) showed minimal influence (q ≈ 0.01), while the Shannon Diversity Index (SHDI) was statistically insignificant (p = 0.99; Table 3).
Factor interactions displayed bilinear enhancement (BE) or nonlinear enhancement (NE), with BE being predominant (Table 3). Land-use interactions with other factors consistently yielded q-values above 0.8. Notable nonlinear interactions included “precipitation and land use” and “distance to roads and land use” in 2010 and 2015; “temperature and cropland fragmentation” in 2010, 2015, and 2018; and “NDVI and land use” plus “temperature and cropland fragmentation” in 2020. The “temperature and cropland fragmentation” interaction reached a q-value of approximately 0.5, ranking 10th overall. The strongest interactions involved precipitation, temperature, and elevation paired with land use. Interaction rankings remained stable in 2010 and 2018, with “precipitation and land use” ranking first in most years but dropping to third in 2018. In 2020, “NDVI and land use” interaction rose in prominence, reflecting increased vegetation influence.

4. Discussion

4.1. Land-Use and Climate Synergies

The Honghe Hani Rice Terraces, a UNESCO-recognized agroecological system, provide a critical case study for understanding water-yield dynamics under the combined pressures of land-use change, climate variability, and human activity. Our findings illuminate the interplay of these factors and their implications for sustainable management, offering lessons for terraced agroecosystems globally. This discussion synthesizes key results, examines spatial patterns, proposes a management framework, explores global relevance, and identifies future research priorities.
From 2010 to 2020, land-use and land-cover changes (LULC) accounted for over 80% of water-yield variability in the Hani Terraces. While LULC changes can result from both natural and anthropogenic processes, in this study area, human activities, especially agricultural and tourism development, were the main drivers during this period. Thus, references to landscape modification here specifically denote human-induced changes. This underscores the dominant role of anthropogenic landscape modification in hydrological regulation (Figure 7, Table 3).
The mechanisms underlying these changes are multifaceted. Forests, contributing 68.7 million m3 to water volume over the decade, enhance water retention and stabilize baseflows, consistent with the terraces’ traditional “forest–village–terrace-waterway” structure [16,30]. However, a 31% decline in water yield by 2020, driven by cropland fragmentation and abandonment, signals hydrological stress. Reduced vegetation cover resulting from land conversion increases surface runoff and decreases infiltration, while also raising evapotranspiration losses and disrupting soil moisture storage. These changes amplify runoff, particularly in degraded terraces, and reduce the system’s ability to buffer against hydrological extremes [31,32].
Rising temperatures, particularly evident in the wetter 2018 season, further exacerbate these effects by increasing potential evapotranspiration and accelerating runoff in areas with expanding impervious surfaces due to urbanization (Figure 7). The interaction between temperature and land use is nonlinear: the impact of temperature on water yield is magnified in landscapes where vegetation cover is low or impervious surfaces are prevalent, limiting infiltration and increasing direct runoff. These synergistic pressures align with trends observed in Asian rice terraces and subtropical agroecosystems, highlighting the need for integrated climate-adaptive strategies [33,34]. The interplay of LULC (q > 0.8) and temperature as a nonlinear enhancer (Table 3) underscores the complexity of these dynamics, necessitating targeted interventions to restore hydrological balance.

4.2. Spatial Mismatches in Water Provisioning

Spatially, water-yield patterns reveal stark contrasts that reflect the socio-ecological consequences of land-use change. High-yield hotspots, such as Aichun’s intact terraces, benefit from dense forest cover and traditional management practices, supporting ecosystem services like erosion control and groundwater recharge [35,36]. These areas illustrate how the preservation of traditional land use and vegetation structure can sustain hydrological function.
In contrast, low-yield cold spots, prevalent in fragmented areas like Baoshanzhai, demonstrate the hydrological toll of land conversion, with nearly 20% of croplands replaced by built-up areas by 2020, partly due to tourism expansion (Table 3). This mirrors trends in global heritage landscapes, from Andean to Mediterranean terraces, where development undermines agricultural resilience [37]. The loss of permeable cropland and vegetation cover in these regions increases surface runoff, reduces infiltration, and diminishes water storage capacity, leading to reduced water availability for downstream users. Scattered dryland patches along terrace margins further disrupt infiltration, reducing water availability for downstream farmers.
These spatial disparities highlight a critical mismatch between water provisioning and conservation priorities, threatening the terraces’ socio-ecological resilience [38]. The concentration of hydrological stress in cold spots underscores the need for spatially explicit management strategies to address localized degradation while preserving cultural and ecological integrity.

4.3. Policy Implications for Heritage Landscapes

To address these issues and enhance sustainable management, we propose a three-pronged framework rooted in ecosystem service optimization and socio-ecological resilience. First, reforestation in critical recharge zones, leveraging forests’ 68.7 million m3 contribution to water yield, can enhance retention, stabilize slopes, and mitigate runoff. Payment for ecosystem services (PES) schemes, successfully implemented in Southeast Asia, could incentivize farmer-led planting, aligning conservation with livelihoods [39]. For instance, Vietnam’s PES programs have increased forest cover in upland areas, offering a scalable model [40]. Second, restoring fragmented terraces in cold spots like Baoshanzhai can rebuild hydrological connectivity and preserve cultural practices, supporting UNESCO’s “living heritage” objectives. The Philippines’ Ifugao terraces provide a blueprint, where community-led restoration has revived a certain number of degraded terraces while sustaining traditional farming [41,42]. Third, managing tourism’s water demand in hubs like Duoyishu through rainwater harvesting and zoning regulations can reduce resource conflicts. Sustainable urban water management in Turin, Italy, demonstrates the efficacy of such measures, with rainwater harvesting systems achieving 29–62% non-potable water savings for domestic use and reducing sewerage system flow peaks by 57–67% during extreme storms [43]. These strategies require adaptive co-management to balance tourism revenue with water security, avoiding top-down policies that marginalize farmers, as observed in similar contexts [44,45].
The Hani Terraces’ challenges resonate with terraced agroecosystems worldwide, offering transferable lessons for regions like the Ethiopian highlands and Peruvian Andes. Their integrated forest–terrace design exemplifies nature-based solutions adaptable to climate-variable environments. However, trade-offs persist: prioritizing water yield may constrain tourism-driven income, necessitating policy frameworks that align conservation with livelihoods. Costa Rica’s eco-tourism model, generating $2 billion annually while protecting 70% of its watersheds [46], provides a blueprint for balancing these priorities. Governance challenges, such as integrating local knowledge into decision-making [47], are critical to ensuring equitable outcomes. By addressing these tensions, the Hani Terraces can inform global strategies for sustaining agroecological heritage under mounting environmental pressures.

4.4. Limitations and Future Work

Future research can strengthen these insights by addressing current limitations. Static LULC data from 2010 to 2020 obscure seasonal dynamics, particularly in tourism-impacted zones. High-resolution remote sensing and machine learning could enable real-time monitoring of land transitions [48,49]. These approaches require access to frequent satellite imagery (e.g., Sentinel-2), which is largely publicly available, as well as computational resources and technical expertise for data processing and analysis. The Geographic Detector Model, while robust, leaves causal pathways unclear; structural equation modeling could disentangle LULC–climate interactions [50]. This method depends on integrating multi-source datasets, such as LULC and climate data, which are often accessible through national or global repositories. The InVEST tool’s neglect of groundwater in karst landscapes may overestimate surface water yields; isotopic tracing could quantify subsurface flows for more accurate estimates [51]. Isotopic tracing is resource-intensive, requiring field sampling, laboratory analysis, and hydrological expertise, but provides valuable groundwater data. Finally, integrating hydrological data with ethnographic studies could capture farmer perceptions, fostering solutions grounded in socio-ecological realities [2,13,16]. This integration requires both quantitative environmental datasets, often available from government agencies, and qualitative fieldwork, necessitating interdisciplinary collaboration and local engagement. These advancements can refine management strategies and enhance the Hani Terraces’ role as a global model for agroecological resilience.

5. Conclusions

The Hani Rice Terraces, a UNESCO agroecological system, face hydrological challenges from land-use change and climate variability. Our study shows land-use shifts drove over 80% of water-yield variability from 2010 to 2020, with a 31% decline linked to cropland fragmentation and tourism growth. Forests, contributing 68.7 million m3 to water retention, highlight the value of traditional landscapes for hydrological stability. These findings advocate reforestation, terrace restoration, and regulated tourism to sustain water security and cultural heritage. Integrating local knowledge into policy design ensures that management strategies are context-specific and effective, while participatory management empowers communities and fosters a sense of ownership over conservation efforts. Globally, they offer a framework for managing terraced agroecosystems under environmental pressures. Future research should refine land-use monitoring and groundwater dynamics to strengthen adaptive governance, ensuring resilience in these vital landscapes.

Supplementary Materials

The following supporting information can be downloaded at: https://www.mdpi.com/article/10.3390/hydrology12060135/s1, Supplemental Datasets S1.

Author Contributions

L.H.: conceptualization, methodology, investigation, data curation, methodology, and writing—original draft. Y.L.: methodology, investigation, data curation, formal analysis, methodology, software, and writing—original draft. L.M.: methodology, data presentation, software, and validation. S.L.: conceptualization, methodology, resources, supervision, and writing—review. All authors have read and agreed to the published version of the manuscript.

Funding

This work was financially supported by the Yunnan Provincial Water Resources Science and Technology Project (Grant No. 2024BA203006).

Data Availability Statement

The data used to generate the results presented in this study are available in the supplementary materials.

Conflicts of Interest

The authors declare no conflict of interest.

References

  1. Ma, Z.; Song, W.; Ma, J.; Ma, J.; He, X. Dynamic change characteristics of soil moisture and its relationship with precipitation in Hani Rice Terraces water source area. Water 2022, 14, 2690. [Google Scholar] [CrossRef]
  2. Hua, H.L.; Zhou, S.Y. Human-environment system boundaries: A case study of the Honghe Hani Rice Terraces as a world heritage cultural landscape. Sustainability 2015, 7, 10733–10755. [Google Scholar] [CrossRef]
  3. Zhan, G.; Jin, Z. Hani Rice Terraces of Honghe-the harmonious landscape of nature and humans. Landsc. Res. 2015, 40, 655–667. [Google Scholar] [CrossRef]
  4. Li, F.F.; Gao, J.C.; Xu, Y.; Nie, Z.J.; Fang, J.H.; Zhou, Q.L.; Xu, G.C.; Shao, N.L.; Xu, D.P.; Xu, P.; et al. Biodiversity and sustainability of the integrated rice-fish system in Hani terraces, Yunnan province, China. Aquac. Rep. 2021, 20, 100763. [Google Scholar] [CrossRef]
  5. Yuan, Y.; Xu, G.; Shen, N.; Nie, Z.; Li, H.; Zhang, L.; Gong, Y.; He, Y.; Ma, X.; Zhang, H.; et al. Valuation of ecosystem services for the sustainable development of Hani Terraces: A Rice-Fish-Duck integrated farming model. Int. J. Environ. Res. Public Health 2022, 19, 8549. [Google Scholar] [CrossRef]
  6. Peng, S.Z.; Ding, Y.X.; Wen, Z.M.; Chen, Y.M.; Cao, Y.; Ren, J.Y. Spatiotemporal change and trend analysis of potential evapotranspiration over the Loess Plateau of China during 2011–2100. Agric. For. Meteorol. 2017, 233, 183–194. [Google Scholar] [CrossRef]
  7. Zha, Z.-Q.; Jiao, Y.-M.; Liu, Z.-L.; Liu, C.-J.; Gao, X.; Ding, Y.-P.; Zhao, D.-M. Evaluation on water eutrophication and retention effect in wetland landscape of Hani Rice Terraces. Chin. J. Ecol. 2018, 37, 3413–3421. [Google Scholar]
  8. Jiao, Y.M.; Zhao, D.M.; Ding, Y.P.; Liu, Y.; Xu, Q.E.; Qiu, Y.M.; Liv, C.J.; Liv, Z.L.; Zha, Z.Q.; Li, R. Performance evaluation for four GIS-based models purposed to predict and map landslide susceptibility: A case study at a World Heritage site in Southwest China. Catena 2019, 183, 104221. [Google Scholar] [CrossRef]
  9. Chan, J.H.; Iankova, K.; Zhang, Y.; McDonald, T.; Qi, X.G. The role of self-gentrification in sustainable tourism: Indigenous entrepreneurship at Honghe Hani Rice Terraces World Heritage Site, China. J. Sustain. Tour. 2016, 24, 1262–1279. [Google Scholar] [CrossRef]
  10. Fu, J.; Song, Y.X.; Sun, Y.H. Response relationship between tourism disturbance and community resilience in agricultural heritage site: A case study of Honghe Hani Rice Terraced System. J. Mt. Sci. 2025, 22, 652–665. [Google Scholar] [CrossRef]
  11. Su, M.M.; Wang, M.H.; Yu, J.J.; Wall, G.; Jin, M. Measuring tourism impacts on community well-being at the Hani Rice Terraces GIAHS Site, Yunnan Province of China. Soc. Nat. Resour. 2023, 36, 796–820. [Google Scholar] [CrossRef]
  12. Gao, Y.; Mao, Z.; Chen, X.; Yi, C. Resilience measurement of rural settlement in Hani terrace field heritage in Yuanyang and its optimization strategy: A case study of Duoyishu village. Econ. Geogr. 2023, 43, 220–228. [Google Scholar]
  13. Gao, J.; Lin, H.; Zhang, C. Locally situated rights and the ‘doing’ of responsibility for heritage conservation and tourism development at the cultural landscape of Honghe Hani Rice Terraces, China. J. Sustain. Tour. 2021, 29, 193–213. [Google Scholar] [CrossRef]
  14. Jiao, Y.M.; Zhao, D.M.; Xu, Q.E.; Liu, Z.L.; Ding, Z.Q.; Ding, Y.P.; Liu, C.J.; Zha, Z.Q. Mapping lateral and longitudinal hydrological connectivity to identify conservation priority areas in the water-holding forest in Honghe Hani Rice Terraces World Heritage Site. Landsc. Ecol. 2020, 35, 709–725. [Google Scholar] [CrossRef]
  15. Gu, H.Y.; Jiao, Y.M.; Liang, L.H. Strengthening the socio-ecological resilience of forest-dependent communities: The case of the Hani Rice Terraces in Yunnan, China. For. Policy Econ. 2012, 22, 53–59. [Google Scholar] [CrossRef]
  16. Zhang, Y.X.; Min, Q.W.; Zhang, C.Q.; He, L.L.; Zhang, S.; Yang, L.; Tian, M.; Xiong, Y. Traditional culture as an important power for maintaining agricultural landscapes in cultural heritage sites: A case study of the Hani terraces. J. Cult. Herit. 2017, 25, 170–179. [Google Scholar] [CrossRef]
  17. Chen, D.; Wei, W.; Chen, L.D. Effects of terracing practices on water erosion control in China: A meta analysis. Earth-Sci. Rev. 2017, 173, 109–121. [Google Scholar] [CrossRef]
  18. Zhang, X.; Tian, Y.Q.; Dong, N.; Wu, H.J.; Li, S. The projected futures of water resources vulnerability under climate and socioeconomic change in the Yangtze River Basin, China. Ecol. Indic. 2023, 147, 109933. [Google Scholar] [CrossRef]
  19. Zhang, X.; Zhang, G.S.; Long, X.; Zhang, Q.; Liu, D.S.; Wu, H.J.; Li, S. Identifying the drivers of water yield ecosystem service: A case study in the Yangtze River Basin, China. Ecol. Indic. 2021, 132, 108304. [Google Scholar] [CrossRef]
  20. Jia, H.; Wang, X.; Sun, W.; Mu, X.; Gao, P.; Zhao, G.; Li, Z. Estimation of soil erosion and evaluation of soil and water conservation benefit in terraces under extreme precipitation. Water 2022, 14, 1675. [Google Scholar] [CrossRef]
  21. Deng, C.; Zhang, G.; Liu, Y.; Nie, X.; Li, Z.; Liu, J.; Zhu, D. Advantages and disadvantages of terracing: A comprehensive review. Int. Soil Water Conserv. Res. 2021, 9, 344–359. [Google Scholar] [CrossRef]
  22. Soriano, M.A.; Herath, S. Quantifying the role of traditional rice terraces in regulating water resources: Implications for management and conservation efforts. Agroecol. Sustain. Food Syst. 2019, 42, 885–910. [Google Scholar] [CrossRef]
  23. Jiao, Y.; Liu, C.; Gao, X.; Xu, Q.; Ding, Y.; Liu, Z. Impacts of moisture sources on the isotopic inverse altitude effect and amount of precipitation in the Hani Rice Terraces region of the Ailao Mountains. Sci. Total Environ. 2019, 687, 470–478. [Google Scholar] [CrossRef] [PubMed]
  24. Luo, D. Beneficial Water Resources and Harmonious Relationship: A Study on Irrigation Order and Ethnic Relations in Hani Rice Terraces. Ph.D. Thesis, Yunan University, Kunming, China, 2019. [Google Scholar]
  25. Yang, J.B.; Xu, J.C.; Zhou, Y.; Zhai, D.L.; Chen, H.F.; Li, Q.; Zhao, G.J. Paddy rice phenological mapping throughout 30-years satellite images in the Honghe Hani Rice Terraces. Remote Sens. 2023, 15, 2398. [Google Scholar] [CrossRef]
  26. Xu, X.; Liu, J.; Zhang, S.; Li, R.; Yan, C.; Wu, S. China Multi-Period Land Use Remote Sensing Monitoring Dataset (CNLUCC). Data Registration and Publication System for Resources and Environmental Sciences. 2018. [Google Scholar] [CrossRef]
  27. Zhou, W.; Liu, G.; Pan, J.; Feng, X. Distribution of available soil water capacity in China. J. Geogr. Sci. 2005, 15, 3–12. [Google Scholar] [CrossRef]
  28. Qin, Z.; Yang, J.; Qiu, M.; Liu, Z. Spatial-temporal distribution and the influencing factors of water conservation function in Yunnan, China. Appl. Sci. 2023, 13, 11720. [Google Scholar] [CrossRef]
  29. Yu, Y.; Sun, X.; Wang, J.; Zhang, J. Using InVEST to evaluate water yield services in Shangri-La, Northwestern Yunnan, China. PeerJ 2022, 10, e12804. [Google Scholar] [CrossRef]
  30. Yuan, Z.; Lun, F.; He, L.; Cao, Z.; Min, Q.W.; Bai, Y.Y.; Liu, M.C.; Cheng, S.K.; Li, W.H.; Fuller, A.M. Exploring the state of retention of traditional ecological knowledge (TEK) in a Hani Rice Terrace village, Southwest China. Sustainability 2014, 6, 4497–4513. [Google Scholar] [CrossRef]
  31. Ma, S.; Zhou, S.; Yu, B.; Song, J. Deforestation-induced runoff changes dominated by forest-climate feedbacks. Sci. Adv. 2024, 10, eadp3964. [Google Scholar] [CrossRef]
  32. Nie, Y.X.; Huang, G.X.; Tong, S.C.; Chen, W.; Song, Y.H.; Wang, X.; Zhang, Q.H.; Jiang, P.F. Assessing the impacts of rice terraces and ponds on the sediment and phosphorus loads in a typical hilly watershed of three gorge reservoir, China. J. Clean. Prod. 2024, 459, 142560. [Google Scholar] [CrossRef]
  33. Welch, J.R.; Vincent, J.R.; Auffhammer, M.; Moya, P.F.; Dobermann, A.; Dawe, D. Rice yields in tropical/subtropical Asia exhibit large but opposing sensitivities to minimum and maximum temperatures. Proc. Natl. Acad. Sci. USA 2010, 107, 14562–14567. [Google Scholar] [CrossRef] [PubMed]
  34. Li, T.; Mcdermid, S.S.; Valdivia, R.O.; Sundaram, P. Climate change mitigation and adaptation for rice-based farming systems in the Red River Delta, Vietnam. CABI Agric. Biosci. 2024, 5, 109. [Google Scholar] [CrossRef]
  35. Goldscheider, N. A holistic approach to groundwater protection and ecosystem services in karst terrains. Carbonates Evaporites 2019, 34, 1241–1249. [Google Scholar] [CrossRef]
  36. Bangash, R.F.; Passuello, A.; Sanchez-Canales, M.; Terrado, M.; Lopez, A.; Elorza, F.J.; Ziv, G.; Acuna, V.; Schuhmacher, M. Ecosystem services in Mediterranean river basin: Climate change impact on water provisioning and erosion control. Sci. Total Environ. 2013, 458–460, 246–255. [Google Scholar] [CrossRef]
  37. Tarolli, P.; Preti, F.; Romano, N. Terraced landscapes: From an old best practice to a potential hazard for soil degradation due to land abandonment. Anthropocene 2014, 6, 10–25. [Google Scholar] [CrossRef]
  38. Folke, C.; Polasky, S.; Rockstrom, J.; Galaz, V.; Westley, F.; Lamont, M.; Scheffer, M.; Osterblom, H.; Carpenter, S.R.; Chapin, F.S., 3rd; et al. Our future in the Anthropocene biosphere. Ambio 2021, 50, 834–869. [Google Scholar] [CrossRef]
  39. Leimona, B.; van Noordwijk, M.; de Groot, R.; Leemans, R. Fairly efficient, efficiently fair: Lessons from designing and testing payment schemes for ecosystem services in Asia. Ecosyst. Serv. 2015, 12, 16–28. [Google Scholar] [CrossRef]
  40. McElwee, P.; Nghiem, T.; Le, H.; Vu, H.; Tran, N. Payments for environmental services and contested neoliberalisation in developing countries: A case study from Vietnam. J. Rural. Stud. 2014, 36, 423–440. [Google Scholar] [CrossRef]
  41. Calderon, M.M.; Bantayan, N.C.; Dizon, J.T.; Sajise, A.J.U.; Codilan, A.L.; Canceran, M.S. Community-based resource assessment and management planning for the rice terraces of Hungduan, Ifugao, Philippines. J. Environ. Sci. Manag. 2015, 18, 47–53. [Google Scholar] [CrossRef]
  42. Maharjan, K.L.; Gonzalvo, C.M.; Baggo, J.C. Balancing tradition and innovation: The role of environmental conservation agriculture in the sustainability of the Ifugao Rice Terraces. Agriculture 2025, 15, 246. [Google Scholar] [CrossRef]
  43. Carollo, M.; Butera, I.; Revelli, R. Water savings and urban storm water management: Evaluation of the potentiality of rainwater harvesting systems from the building to the city scale. PLoS ONE 2022, 17, e0278107. [Google Scholar] [CrossRef] [PubMed]
  44. Adade Williams, P.; Sikutshwa, L.; Shackleton, S. Acknowledging indigenous and local knowledge to facilitate collaboration in landscape approaches—Lessons from a systematic review. Land 2020, 9, 331. [Google Scholar] [CrossRef]
  45. Hu, H.S.; Hewitt, R.J. Understanding climate risks to world cultural heritage: A systematic analysis and assessment framework for the case of Spain. Heritage Science 2024, 12, 194. [Google Scholar] [CrossRef]
  46. Honey, M. Ecotourism and Sustainable Development. Who Owns Paradise? Island Press: Washington, DC, USA, 1999. [Google Scholar]
  47. Berkes, F. Advanced Introduction to Community-Based Conservation; Edward Elgar Publishing: Northampton, MA, USA, 2021. [Google Scholar]
  48. Zang, N.; Cao, Y.; Wang, Y.B.; Huang, B.; Zhang, L.Q.; Mathiopoulos, P.T. Land-use mapping for high-spatial resolution remote sensing image via deep learning: A review. IEEE J. Sel. Top. Appl. Earth Obs. Remote Sens. 2021, 14, 5372–5391. [Google Scholar] [CrossRef]
  49. Wang, J.; Bretz, M.; Dewan, M.A.A.; Delavar, M.A. Machine learning in modelling land-use and land cover-change (LULCC): Current status, challenges and prospects. Sci. Total Environ. 2022, 822, 153559. [Google Scholar] [CrossRef]
  50. Grace, J.B.; Scheiner, S.M.; Schoolmaster, D.R., Jr. Structural Equation Modeling: Building and Evaluating Causal Models. In Ecological Statistics: Contemporary Theory and Application; Oxford University Press: Cary, NC, USA, 2015. [Google Scholar]
  51. Sun, J.; Takahashi, Y.; Strosnider, W.H.J.; Kogure, T.; Wang, B.; Wu, P.; Zhu, L.; Dong, Z. Identification and quantification of contributions to karst groundwater using a triple stable isotope labeling and mass balance model. Chemosphere 2021, 263, 127946. [Google Scholar] [CrossRef]
Figure 1. Location of the Honghe Hani Rice Terraces in Yunnan Province, China, and field photograph (author-captured, 2025) illustrating the vertical zonation of forests, villages, and terraces.
Hydrology 12 00135 g001
Figure 2. Research workflow and data requirements.
Hydrology 12 00135 g002
Figure 3. Spatial distribution of InVEST model input data for the Honghe Hani Rice Terraces Heritage Area, Yunnan Province, 2020. (a) Annual precipitation (P); (b) annual potential evapotranspiration (PET); (c) plant available water content (PAWC); (d) maximum soil root depth; (e) land use/land cover (LULC); and (f) village names and boundaries.
Hydrology 12 00135 g003
Figure 4. Spatial distribution of water-yield depth and interannual variation in the study area: (a) 2010, (b) 2015, (c) 2018, (d) 2020, and (e) changes from 2010 to 2020.
Hydrology 12 00135 g004
Figure 5. Annual water-yield depth and total water-yield volume by land-use type (2010, 2015, 2018, and 2020).
Hydrology 12 00135 g005
Figure 6. Spatial distribution of water-yield hotspots and cold spots in the Honghe Hani Rice Terraces: (a) 2010, (b) 2015, (c) 2018, and (d) 2020.
Hydrology 12 00135 g006
Figure 7. Spatial clustering patterns of local autocorrelation indices for water yield: (a) 2010, (b) 2015, (c) 2018, and (d) 2020.
Hydrology 12 00135 g007
Figure 8. Relative impact of drivers on the spatial heterogeneity of water yield in the Hani Rice Terraces ecosystem.
Hydrology 12 00135 g008
Table 1. Biophysical parameters for InVEST water-yield model.
Land-Use/Land-Cover CategoriesLand-Use/Land-Cover TypeVegetation Cover (1 = Yes, 0 = No)Crop Coefficient (Kc)Maximum Root Depth (mm)
CroplandPaddy fields10.72000
Dryland crops10.5300
WoodlandDense forest113000
Shrubland10.851000
Sparse woodland113000
Other woodland10.851000
GrasslandHigh-coverage grassland10.651700
Medium-coverage grassland10.51300
Artificial surfaceUrban land00.31
Rural residential areas00.5100
Industrial/transportation land00.31
Table 2. List of impact factors for geographic detector analysis.
Primary CategorySecondary CategoryFactorsSources
Natural environmentClimate factorsAnnual precipitation (PRE)National Earth System Science Data Center
(https://www.geodata.cn, accessed on 1 May 2024)
Annual mean temperature (TMP)
Topographic factorsElevation (DEM)Geospatial Data Cloud
(https://www.gscloud.cn/)
Slope (P)
Socio-economicsEcological factorsNormalized difference vegetation index (NDVI)Resource and Environmental Science Data Center, Chinese Academy of Sciences
(https://www.resdc.cn, accessed on 1 May 2024)
Economic levelGross domestic product (GDP)
Social developmentPopulation density (POP)WorldPop dataset
(https://www.worldpop.org, accessed on 1 May 2024)
Transportation and locationDistance to roads (DIS_ROAD)OpenStreetMap data
(https://www.geofabrik.de); Euclidean distance calculated using ArcGIS
Land useLand-use types (LANDUSE)Resource and Environmental Science Data Center, Chinese Academy of Sciences
(https://www.resdc.cn, accessed on 1 May 2024)
Cropland fragmentation (PD)Calculated from land-use/land-cover data using ArcGIS and Fragstats
Land-use diversity (SHDI)
Table 3. Impact of driver interactions on spatial heterogeneity of water-yield services in the Hani Rice Terraces (2010–2020), including q-values and interaction types (BE: bilinear enhancement, NE: nonlinear enhancement).
Interactionq-ValueType
2010201520182020
PRE and LANDUSE0.9770.9740.9640.977NE (2010, 2015), BE (2018, 2020)
TMP and LANDUSE0.9690.9690.9720.969BE
DEM and LANDUSE0.9660.960.9640.966BE
GDP and LANDUSE0.8610.8620.8450.859BE
DIS_ROAD and LANDUSE0.8590.8440.8480.858NE (2010, 2015), BE (2018, 2020)
SLOPE and LANDUSE0.8580.8380.8430.856BE
NDVI and LANDUSE0.8560.8340.8390.861BE (2010–2018), NE (2020)
POP and LANDUSE0.8470.8310.8340.847BE
PD and LANDUSE0.8460.8290.8330.846BE
TMP and PD0.4280.4720.50.466NE
Disclaimer/Publisher’s Note: The statements, opinions and data contained in all publications are solely those of the individual author(s) and contributor(s) and not of MDPI and/or the editor(s). MDPI and/or the editor(s) disclaim responsibility for any injury to people or property resulting from any ideas, methods, instructions or products referred to in the content.

