
Assessing the Risk of Natural and Socioeconomic Hazards Caused by Rainfall in the Middle Yellow River Basin
Abstract
1. Introduction
2. Materials and Methods
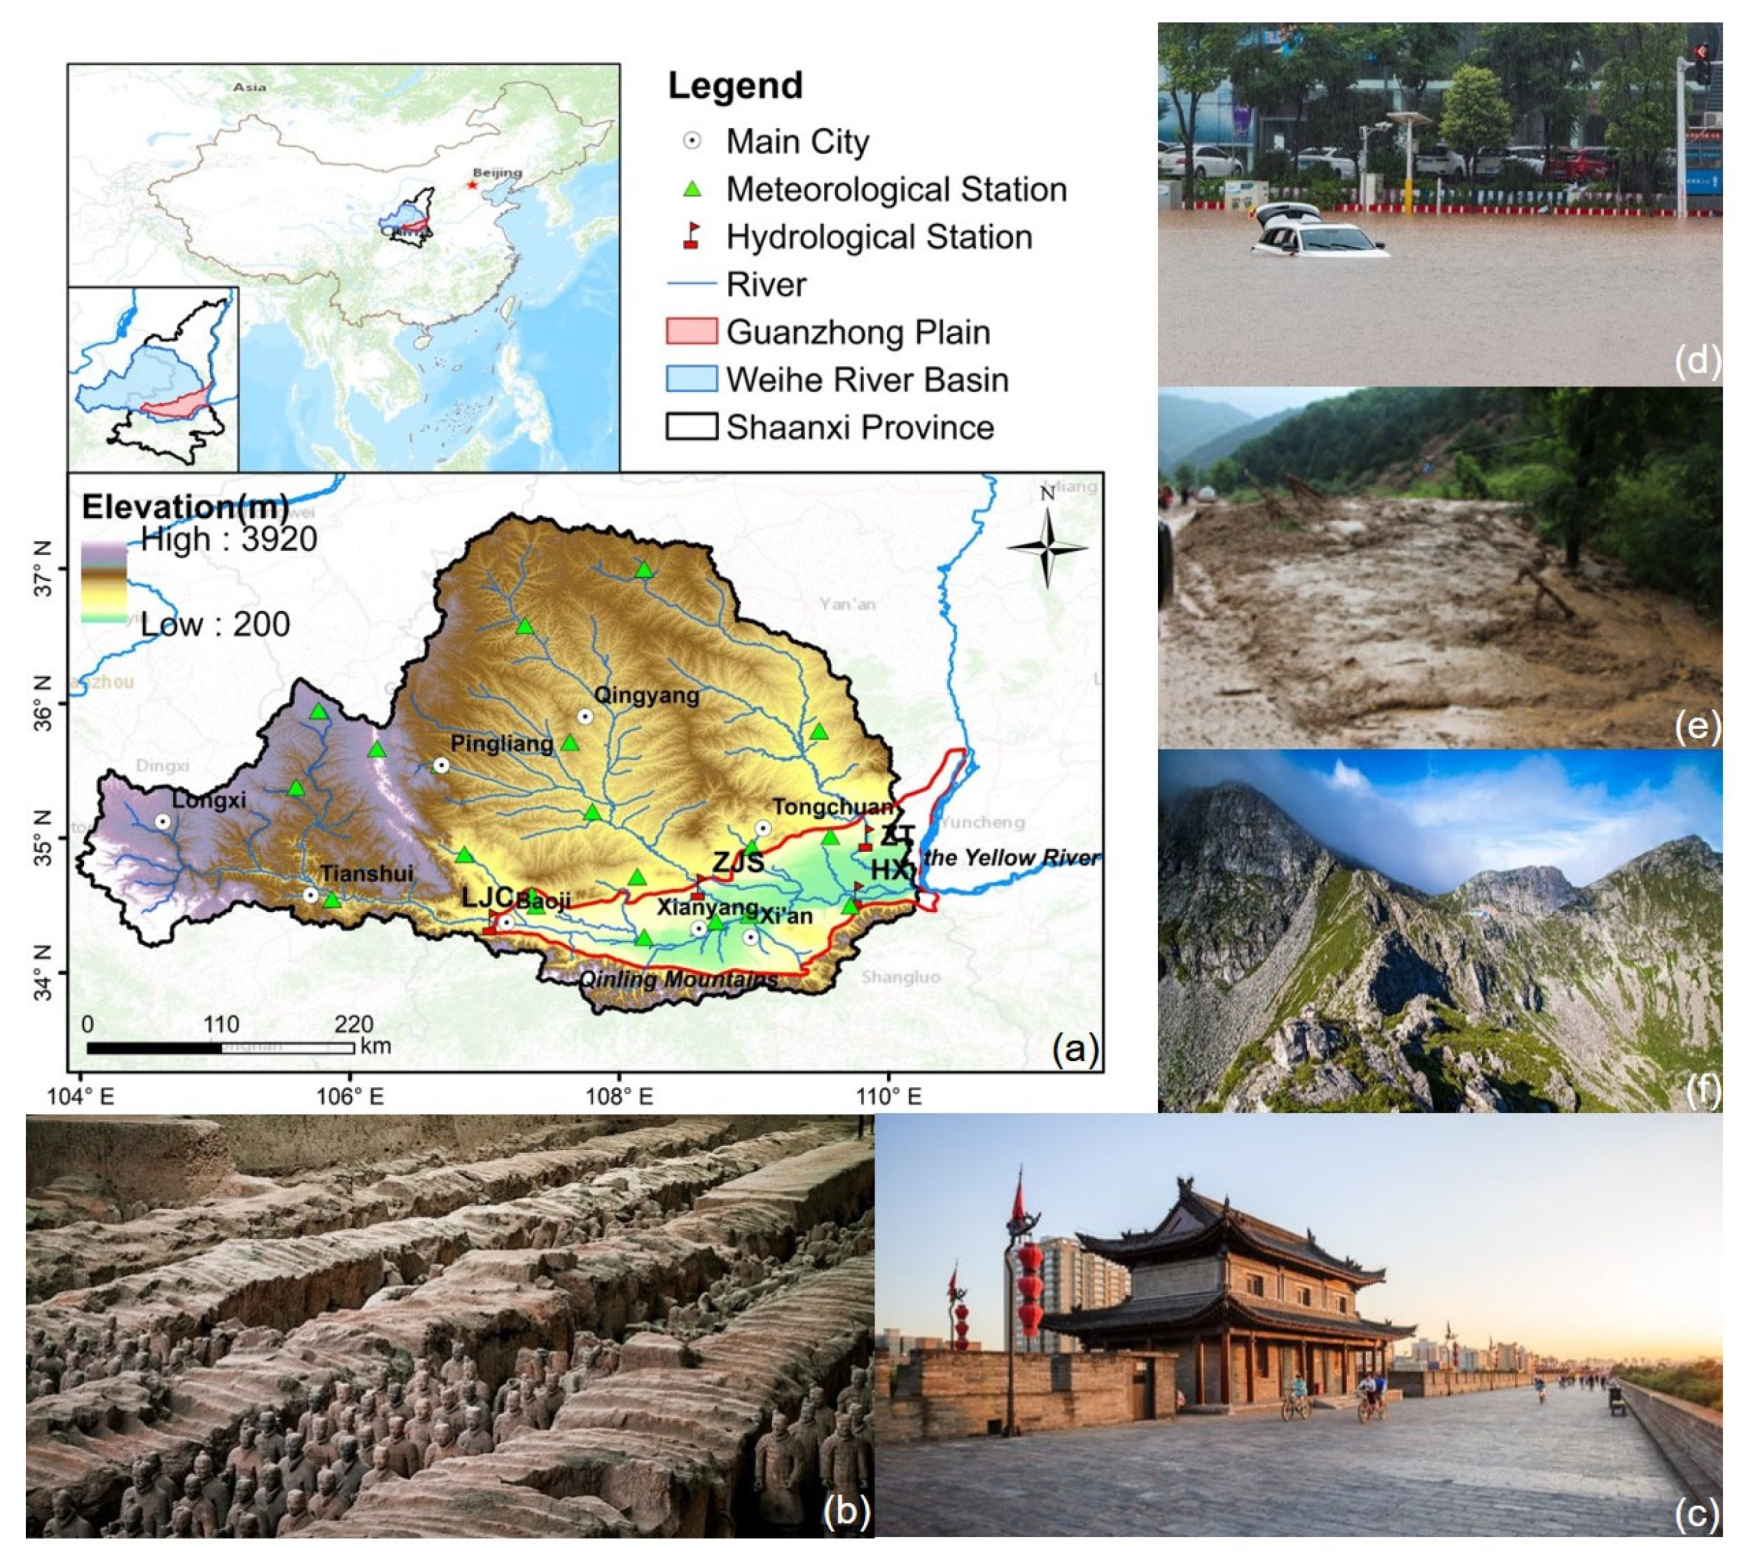
2.1. Description of the Study Area
2.2. Rainfall Analysis and Runoff Simulation
2.2.1. Rainfall Analysis
2.2.2. Runoff Simulation
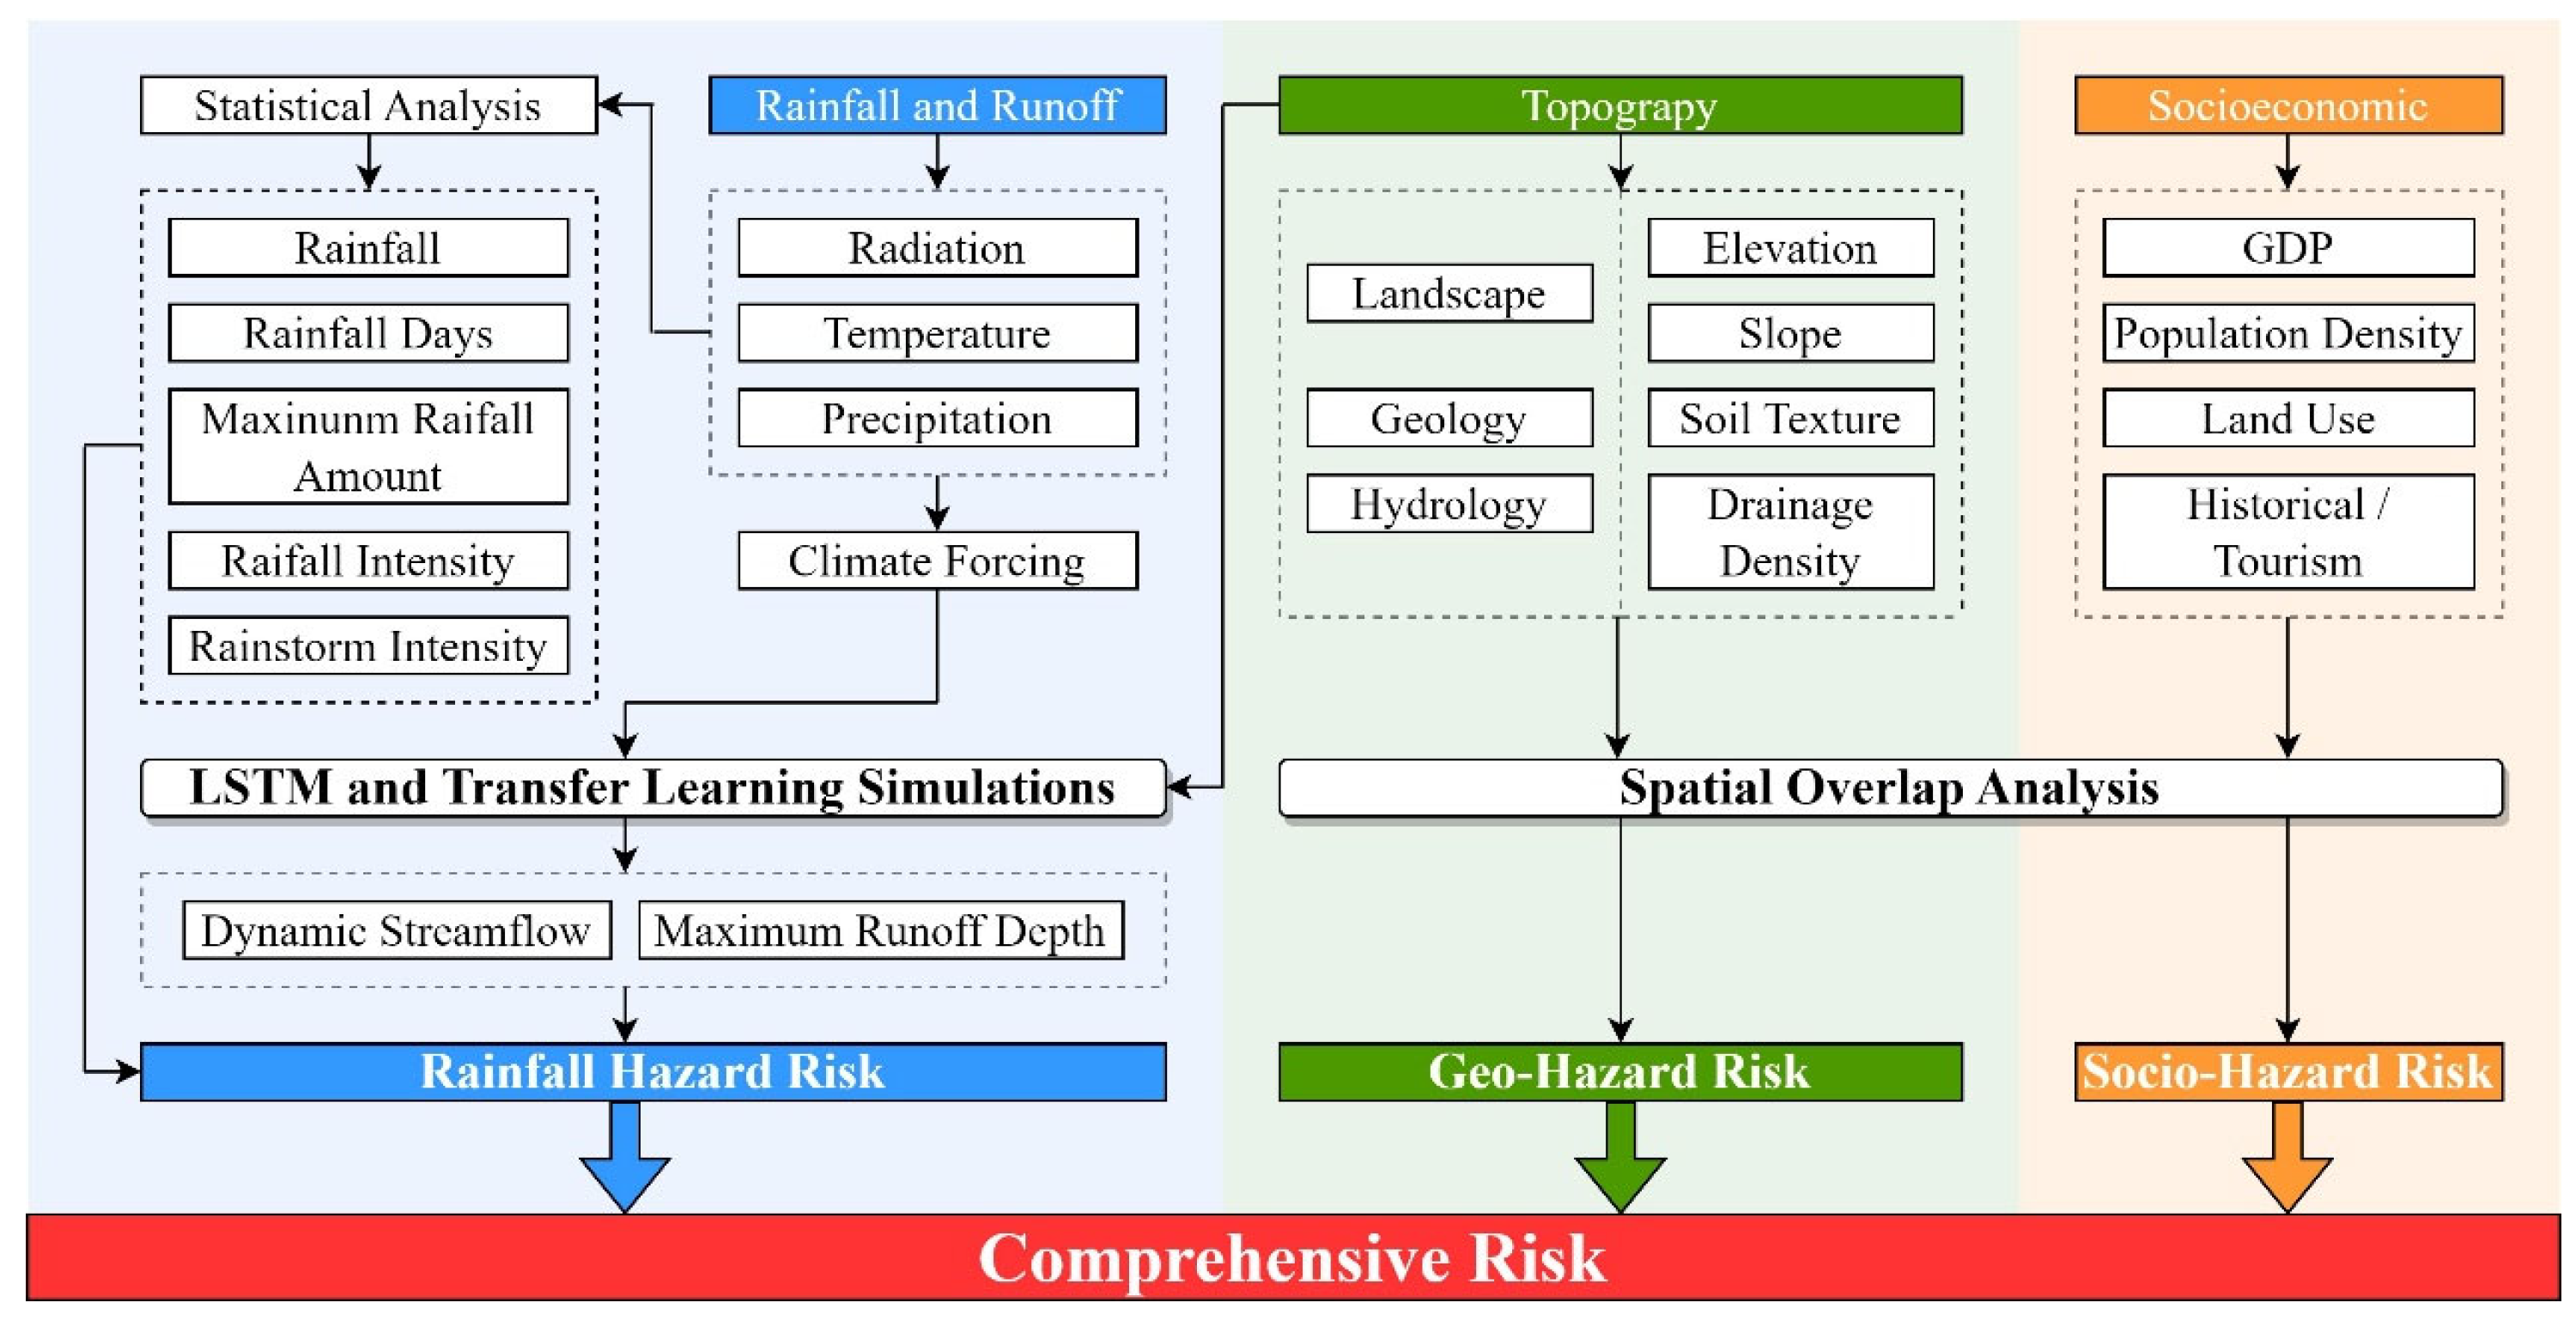
2.3. Risk Evaluation
2.3.1. Risk of Hazards and Vulnerability Index
2.3.2. Determining Risk Weights
2.3.3. Data Integration
3. Results
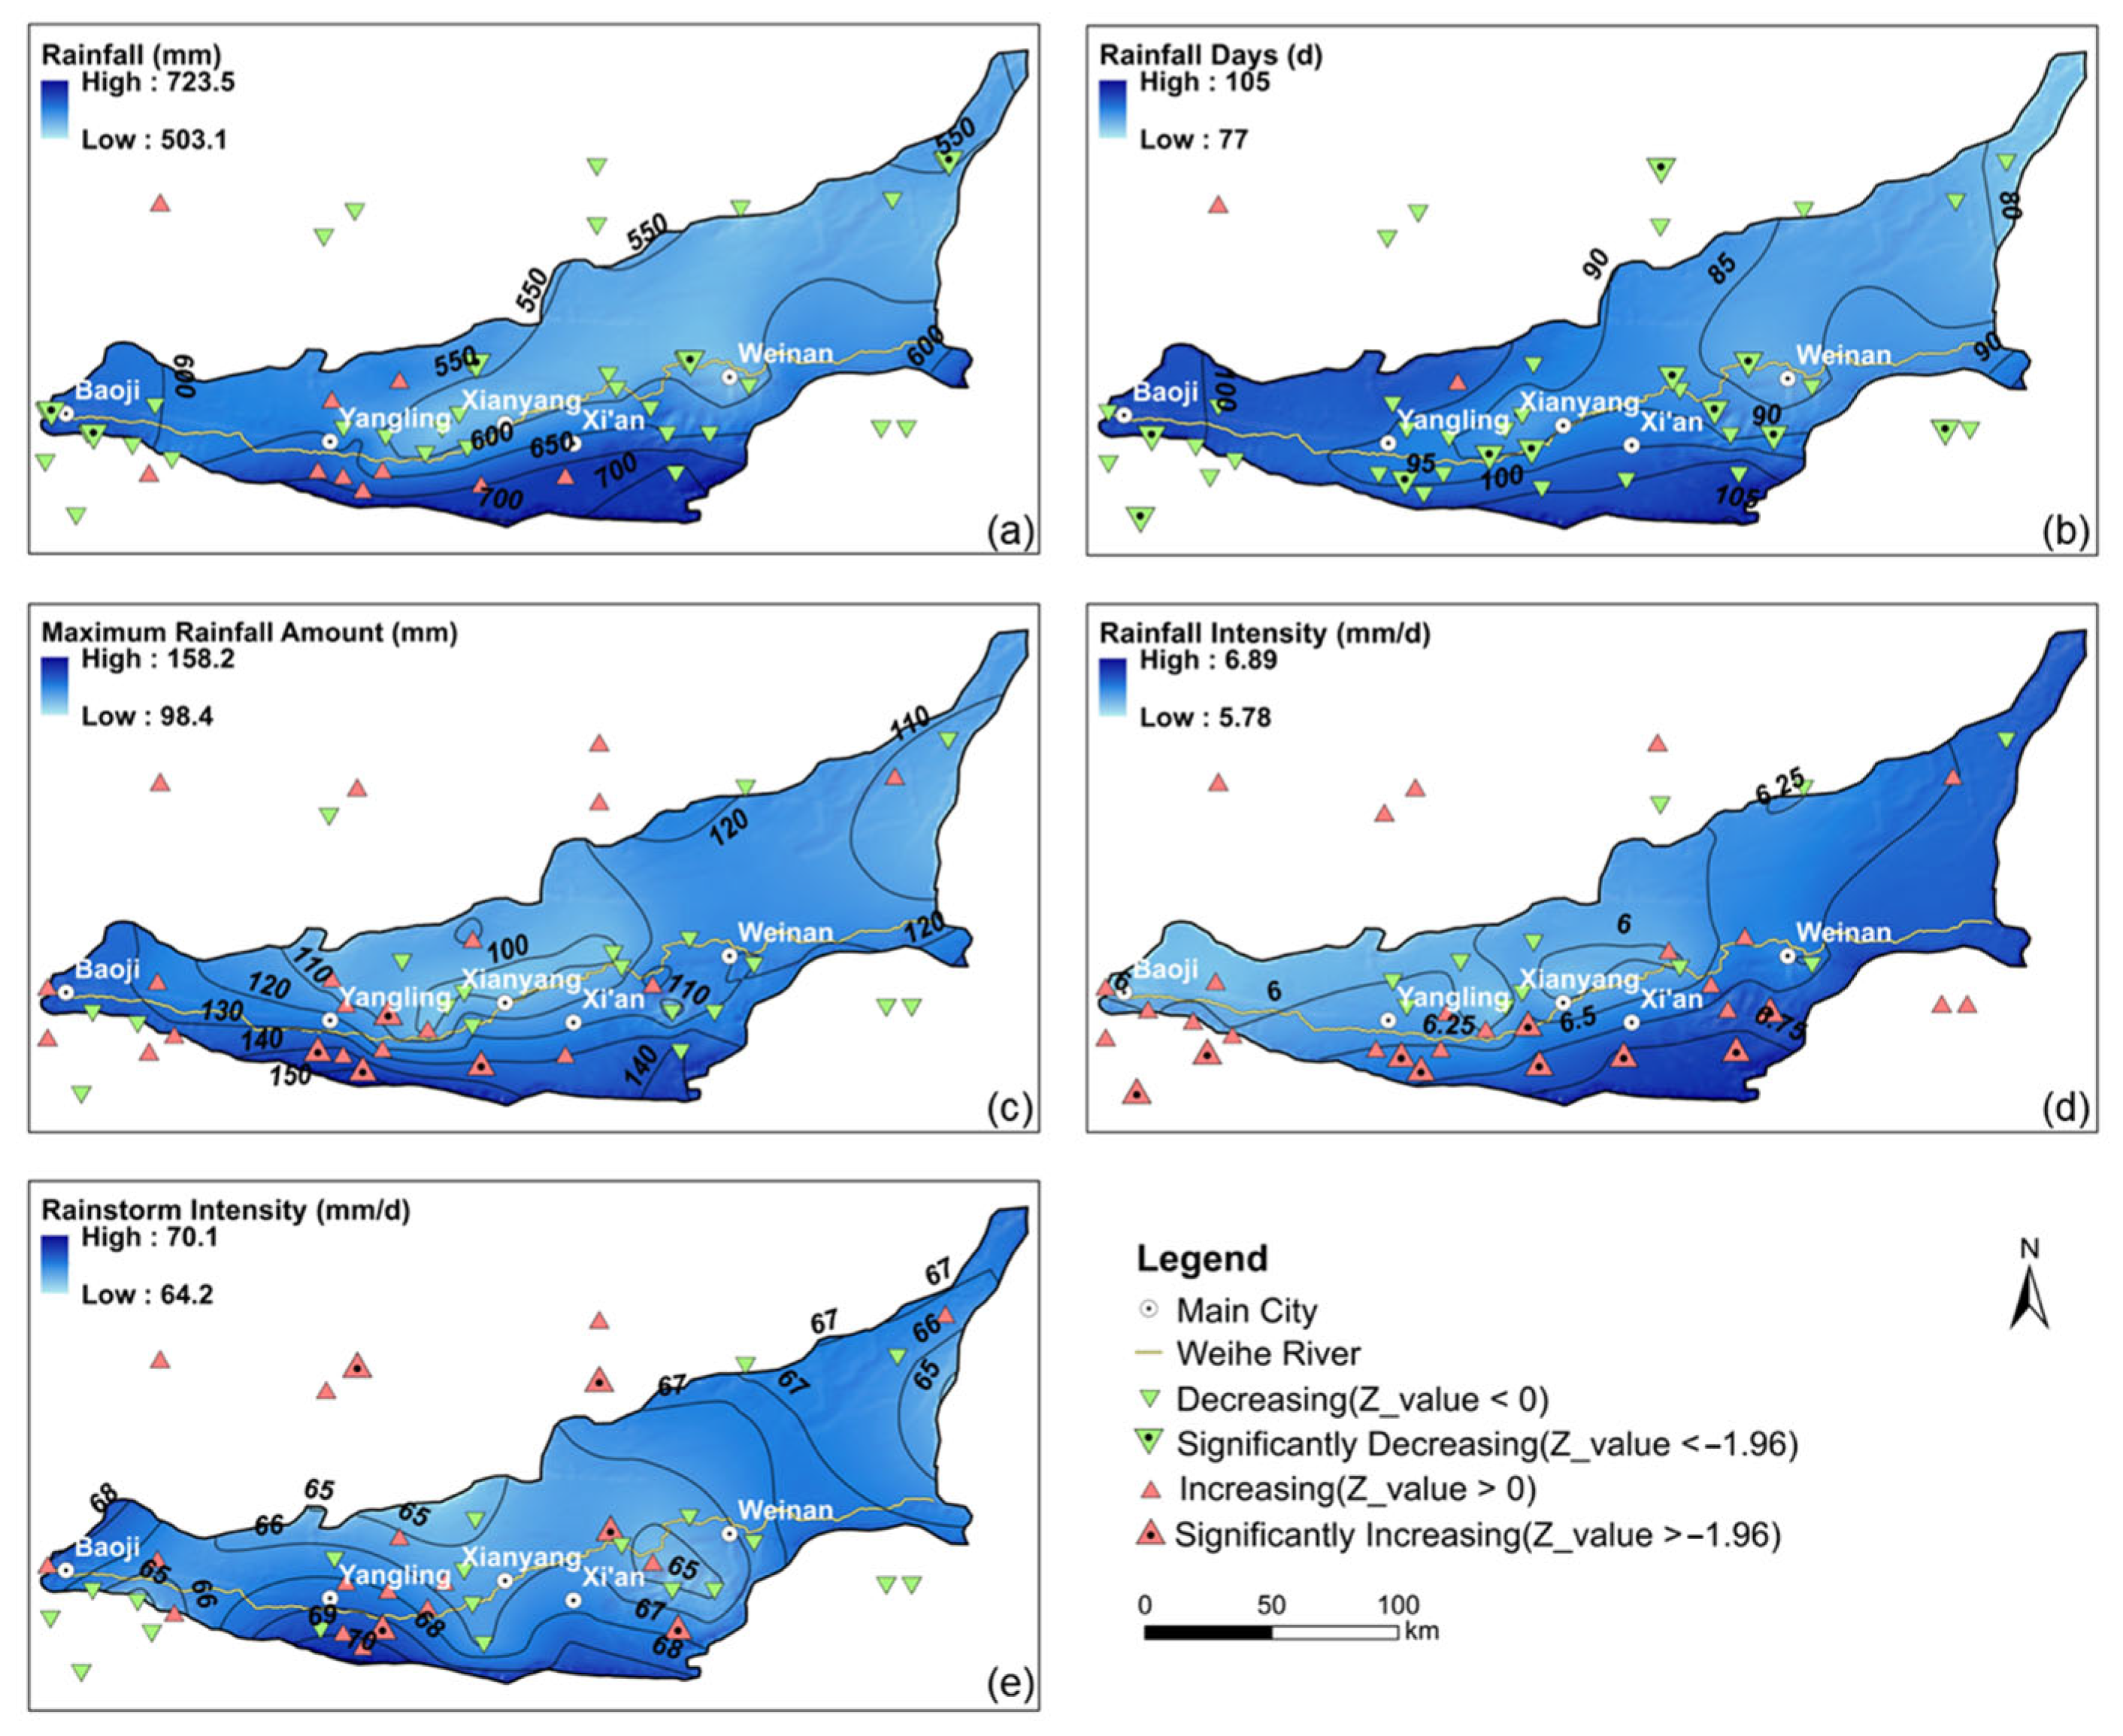
3.1. Spatiotemporal Variation in Rainfall
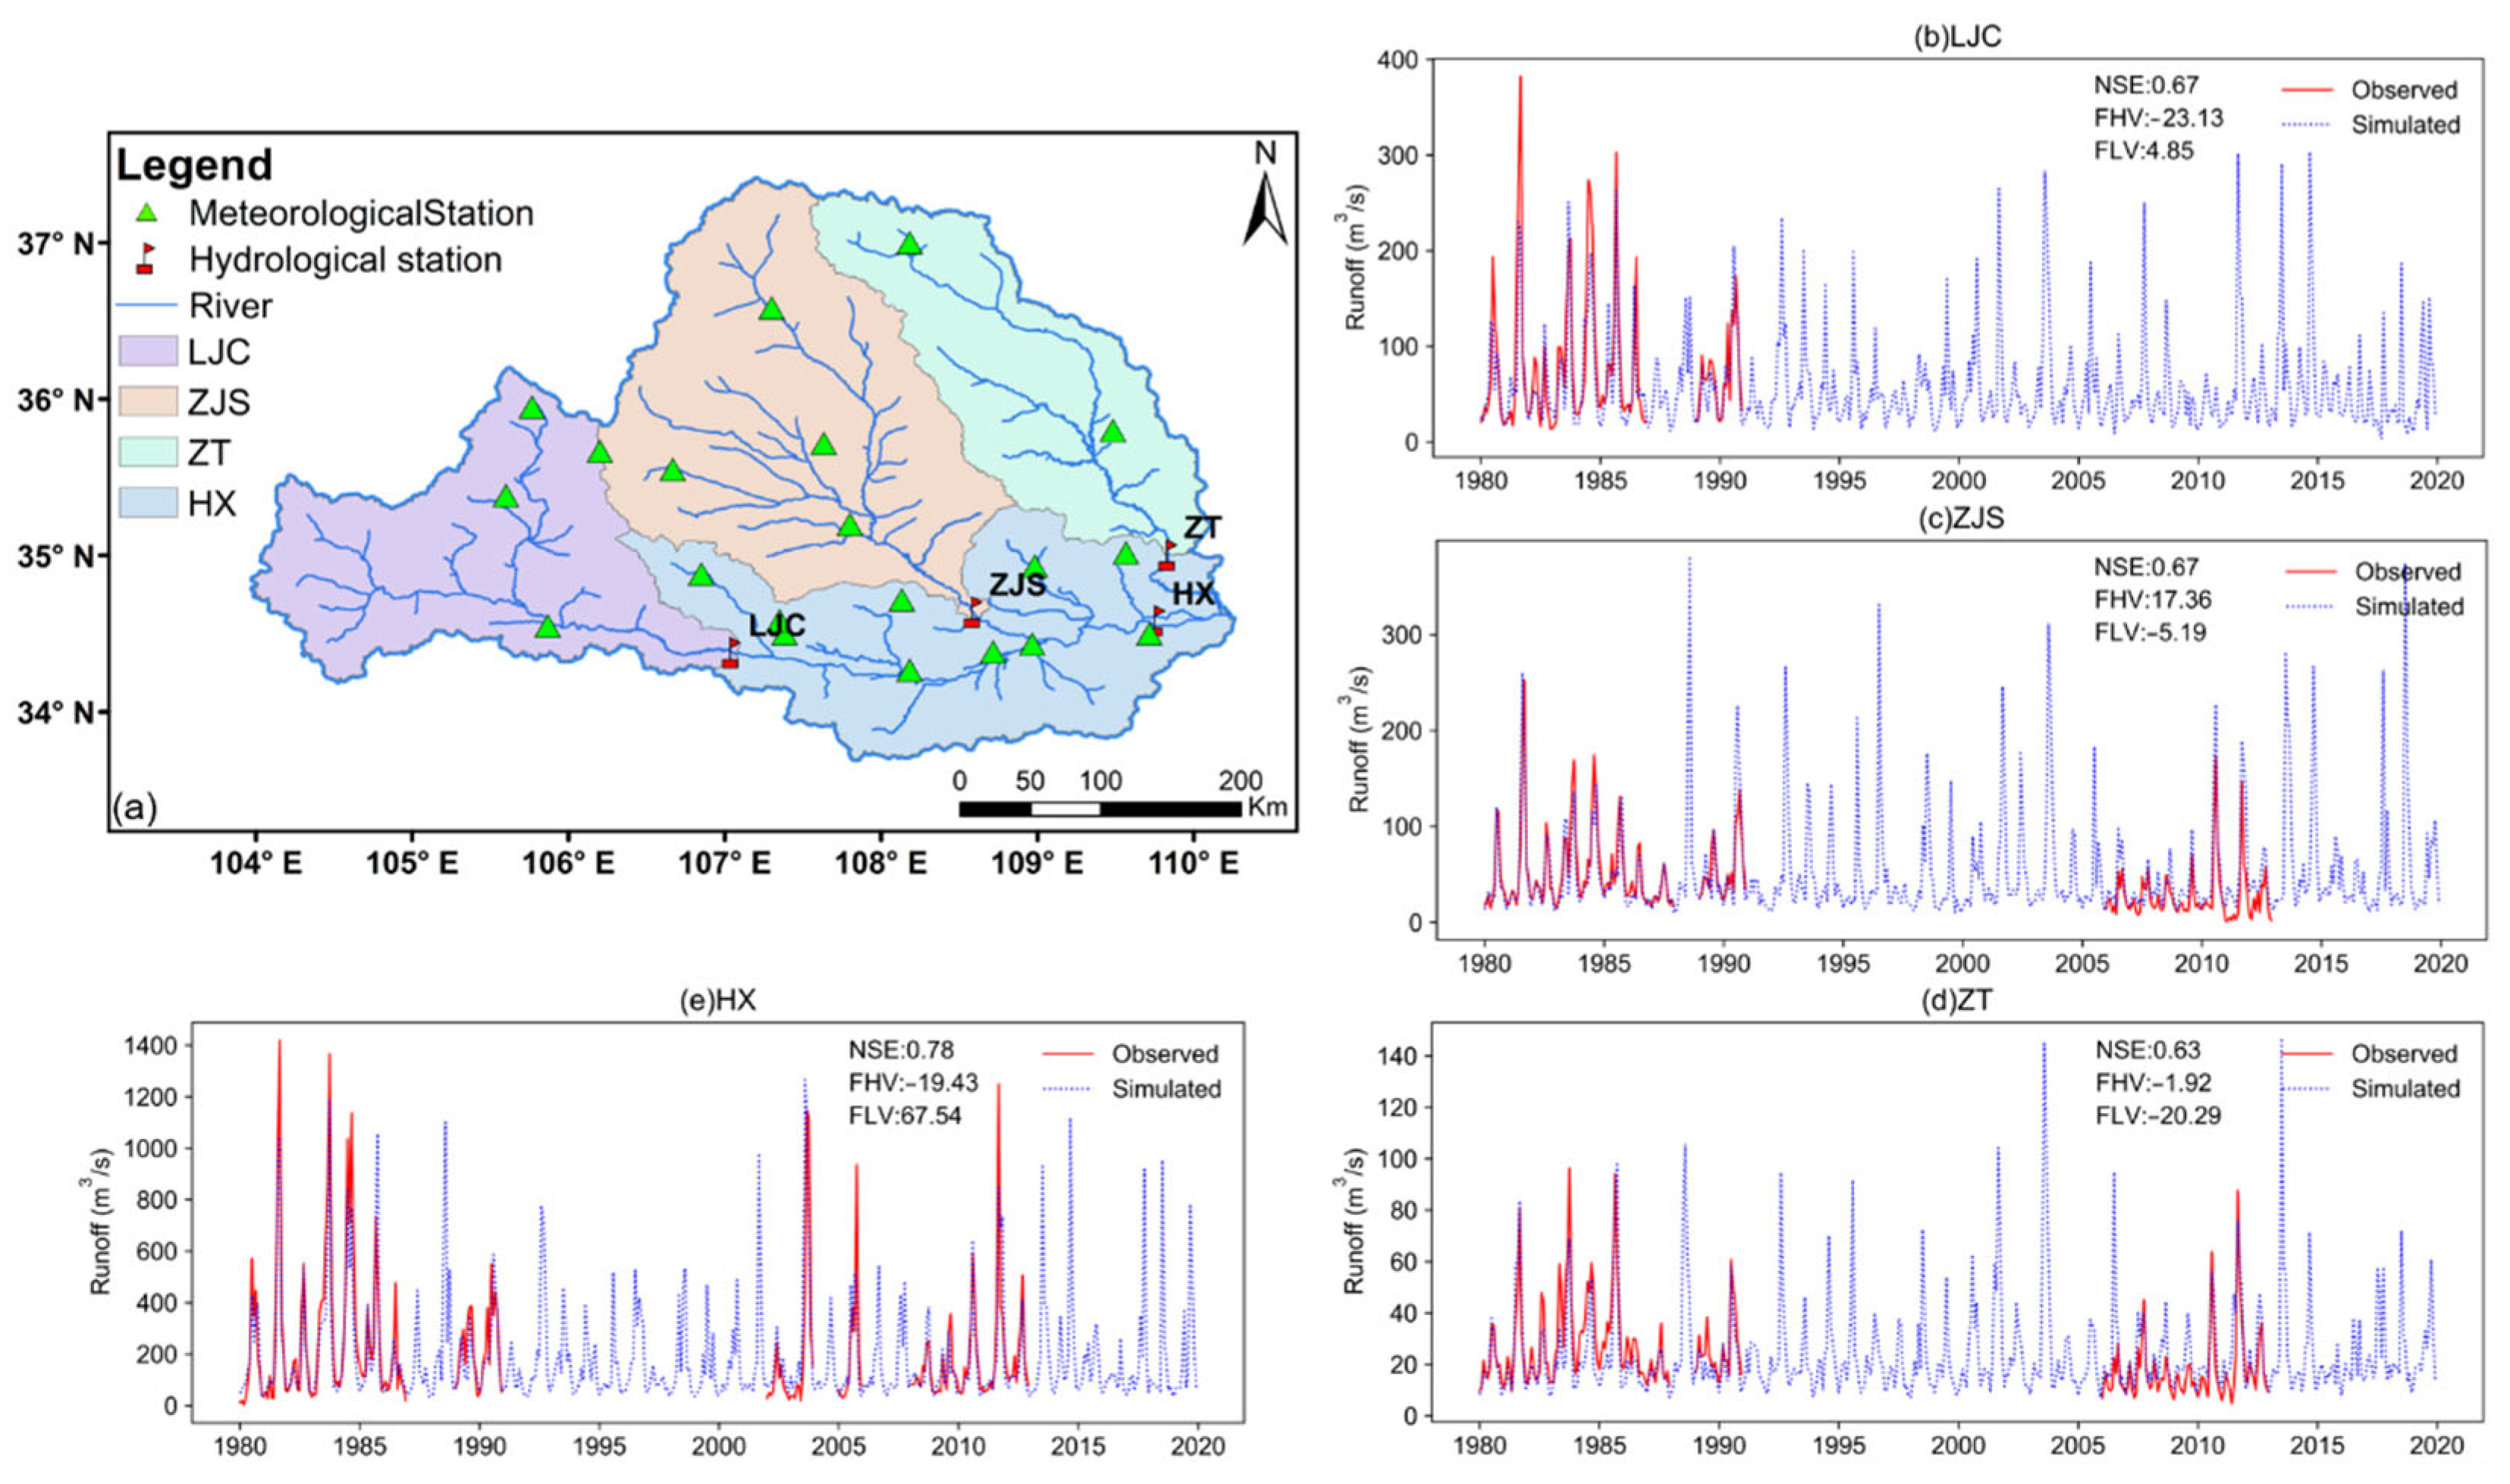
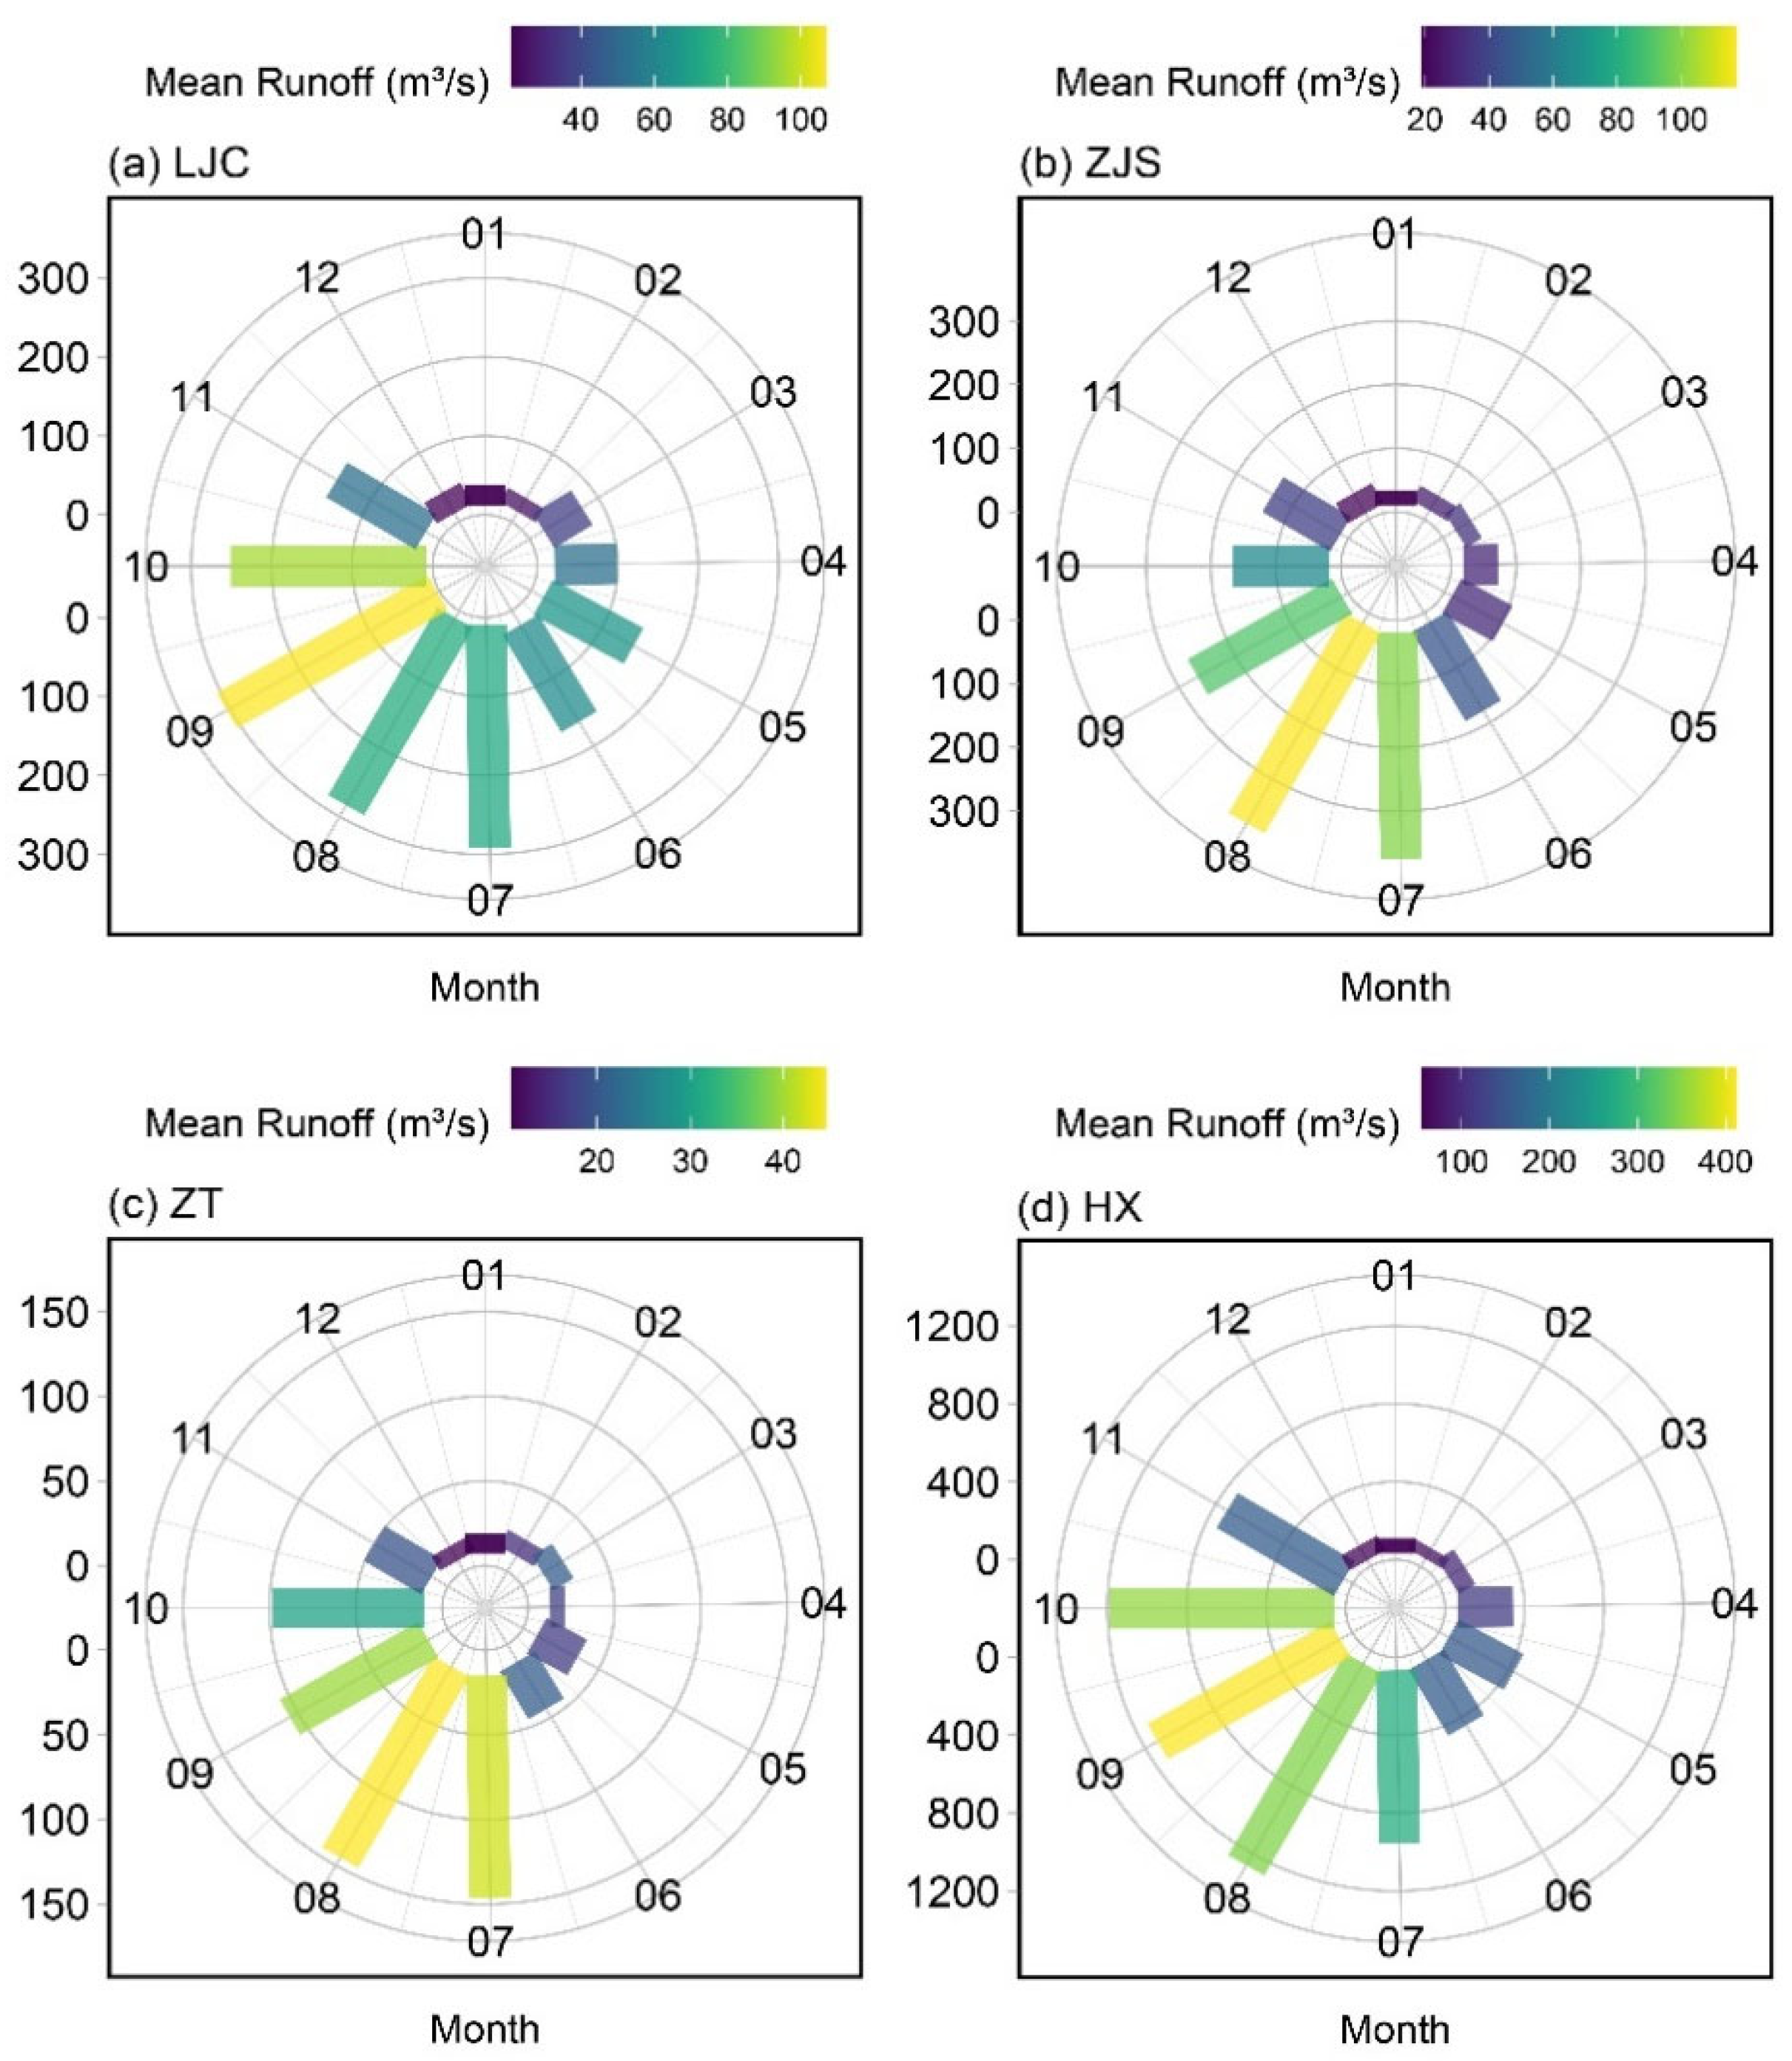
3.2. Variation in Runoff
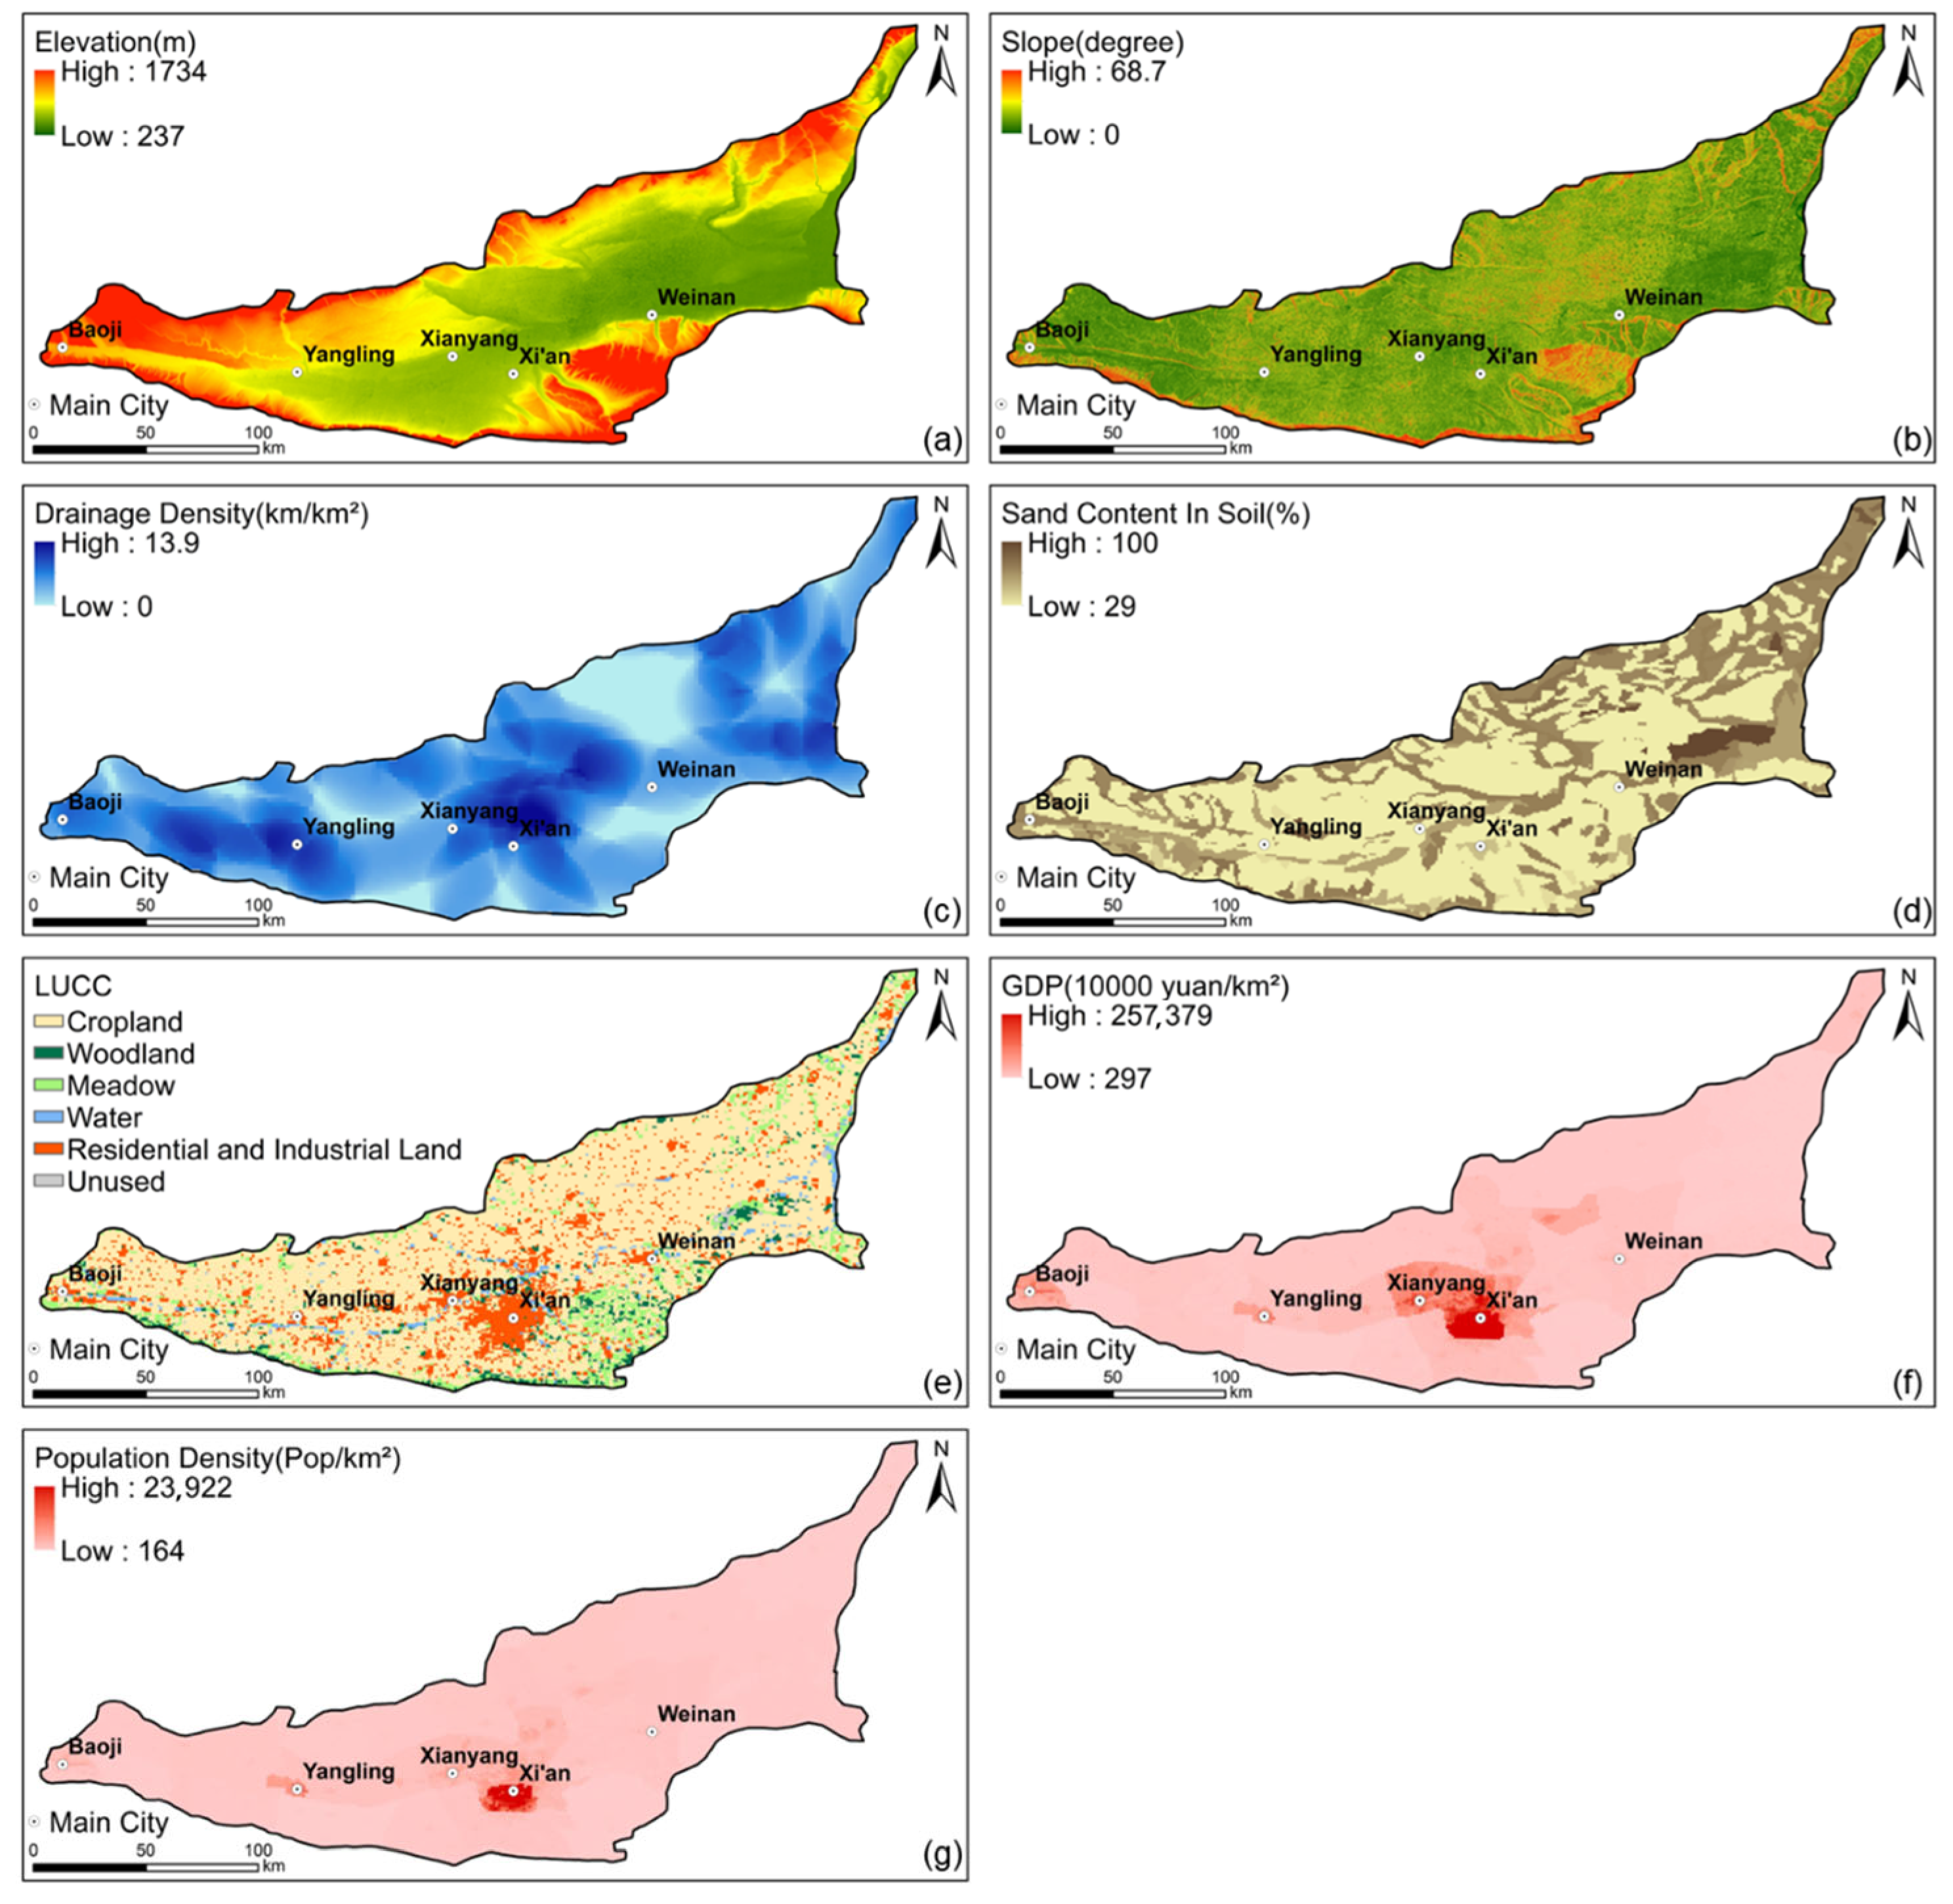
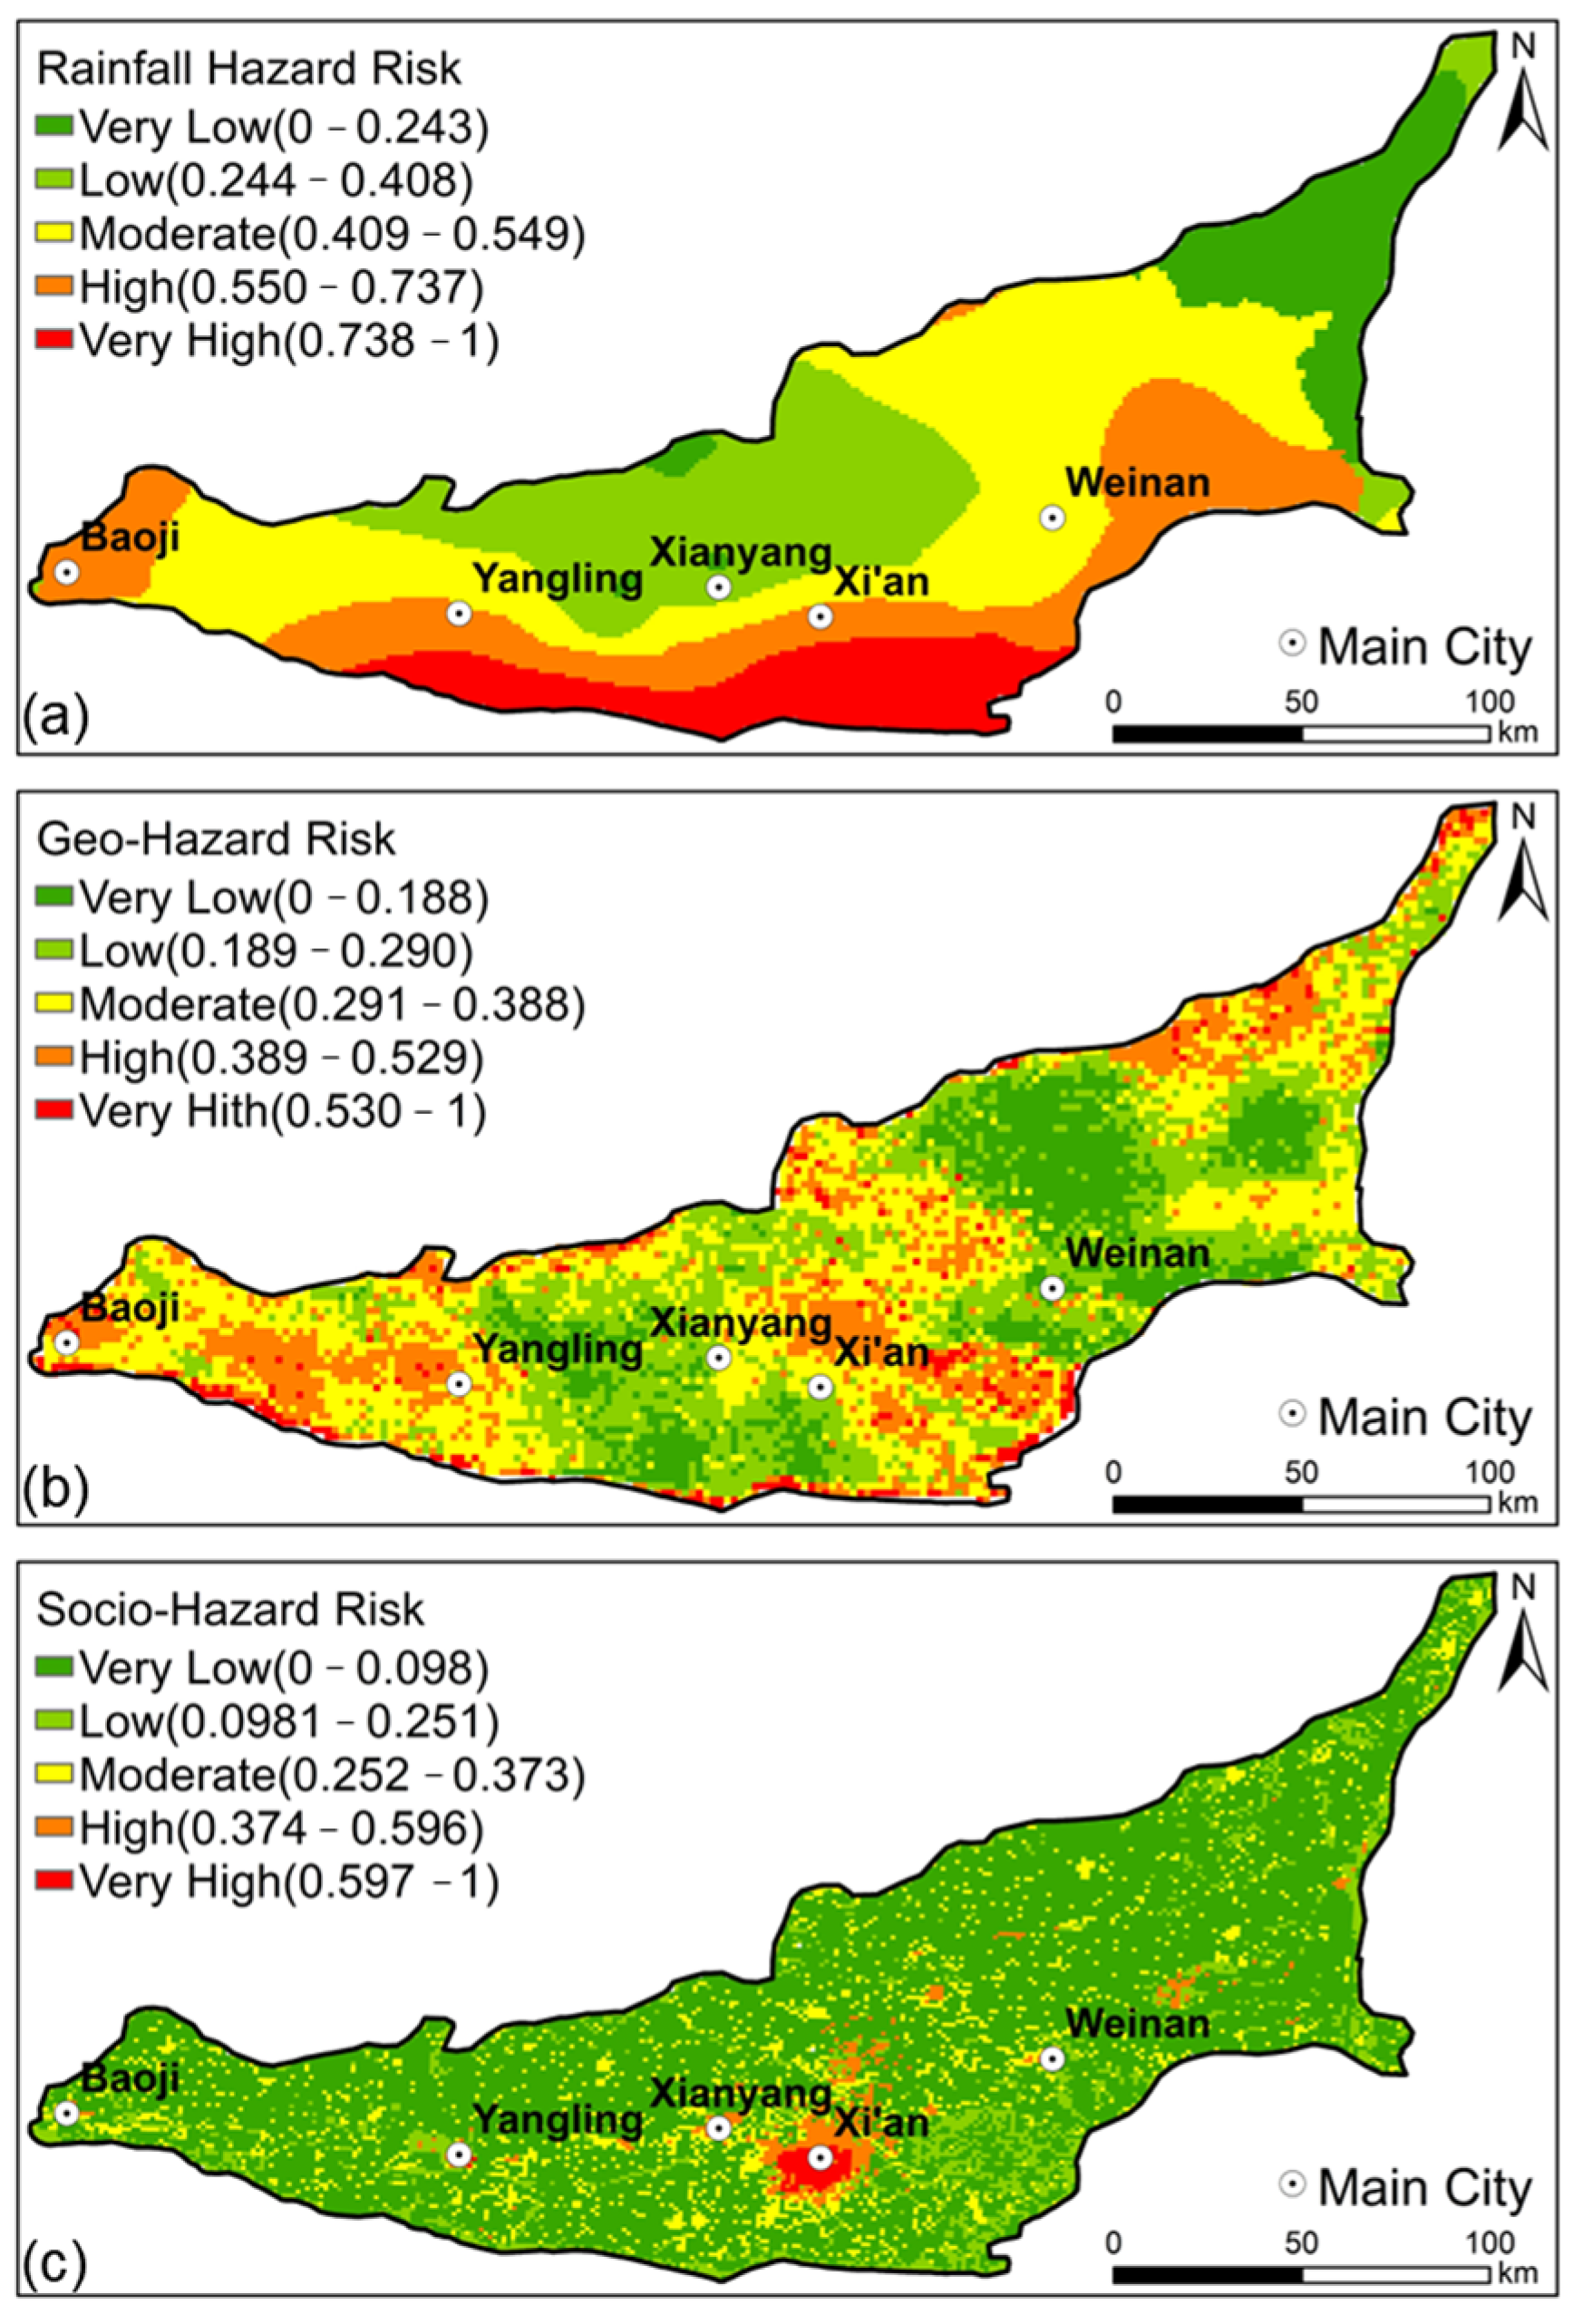
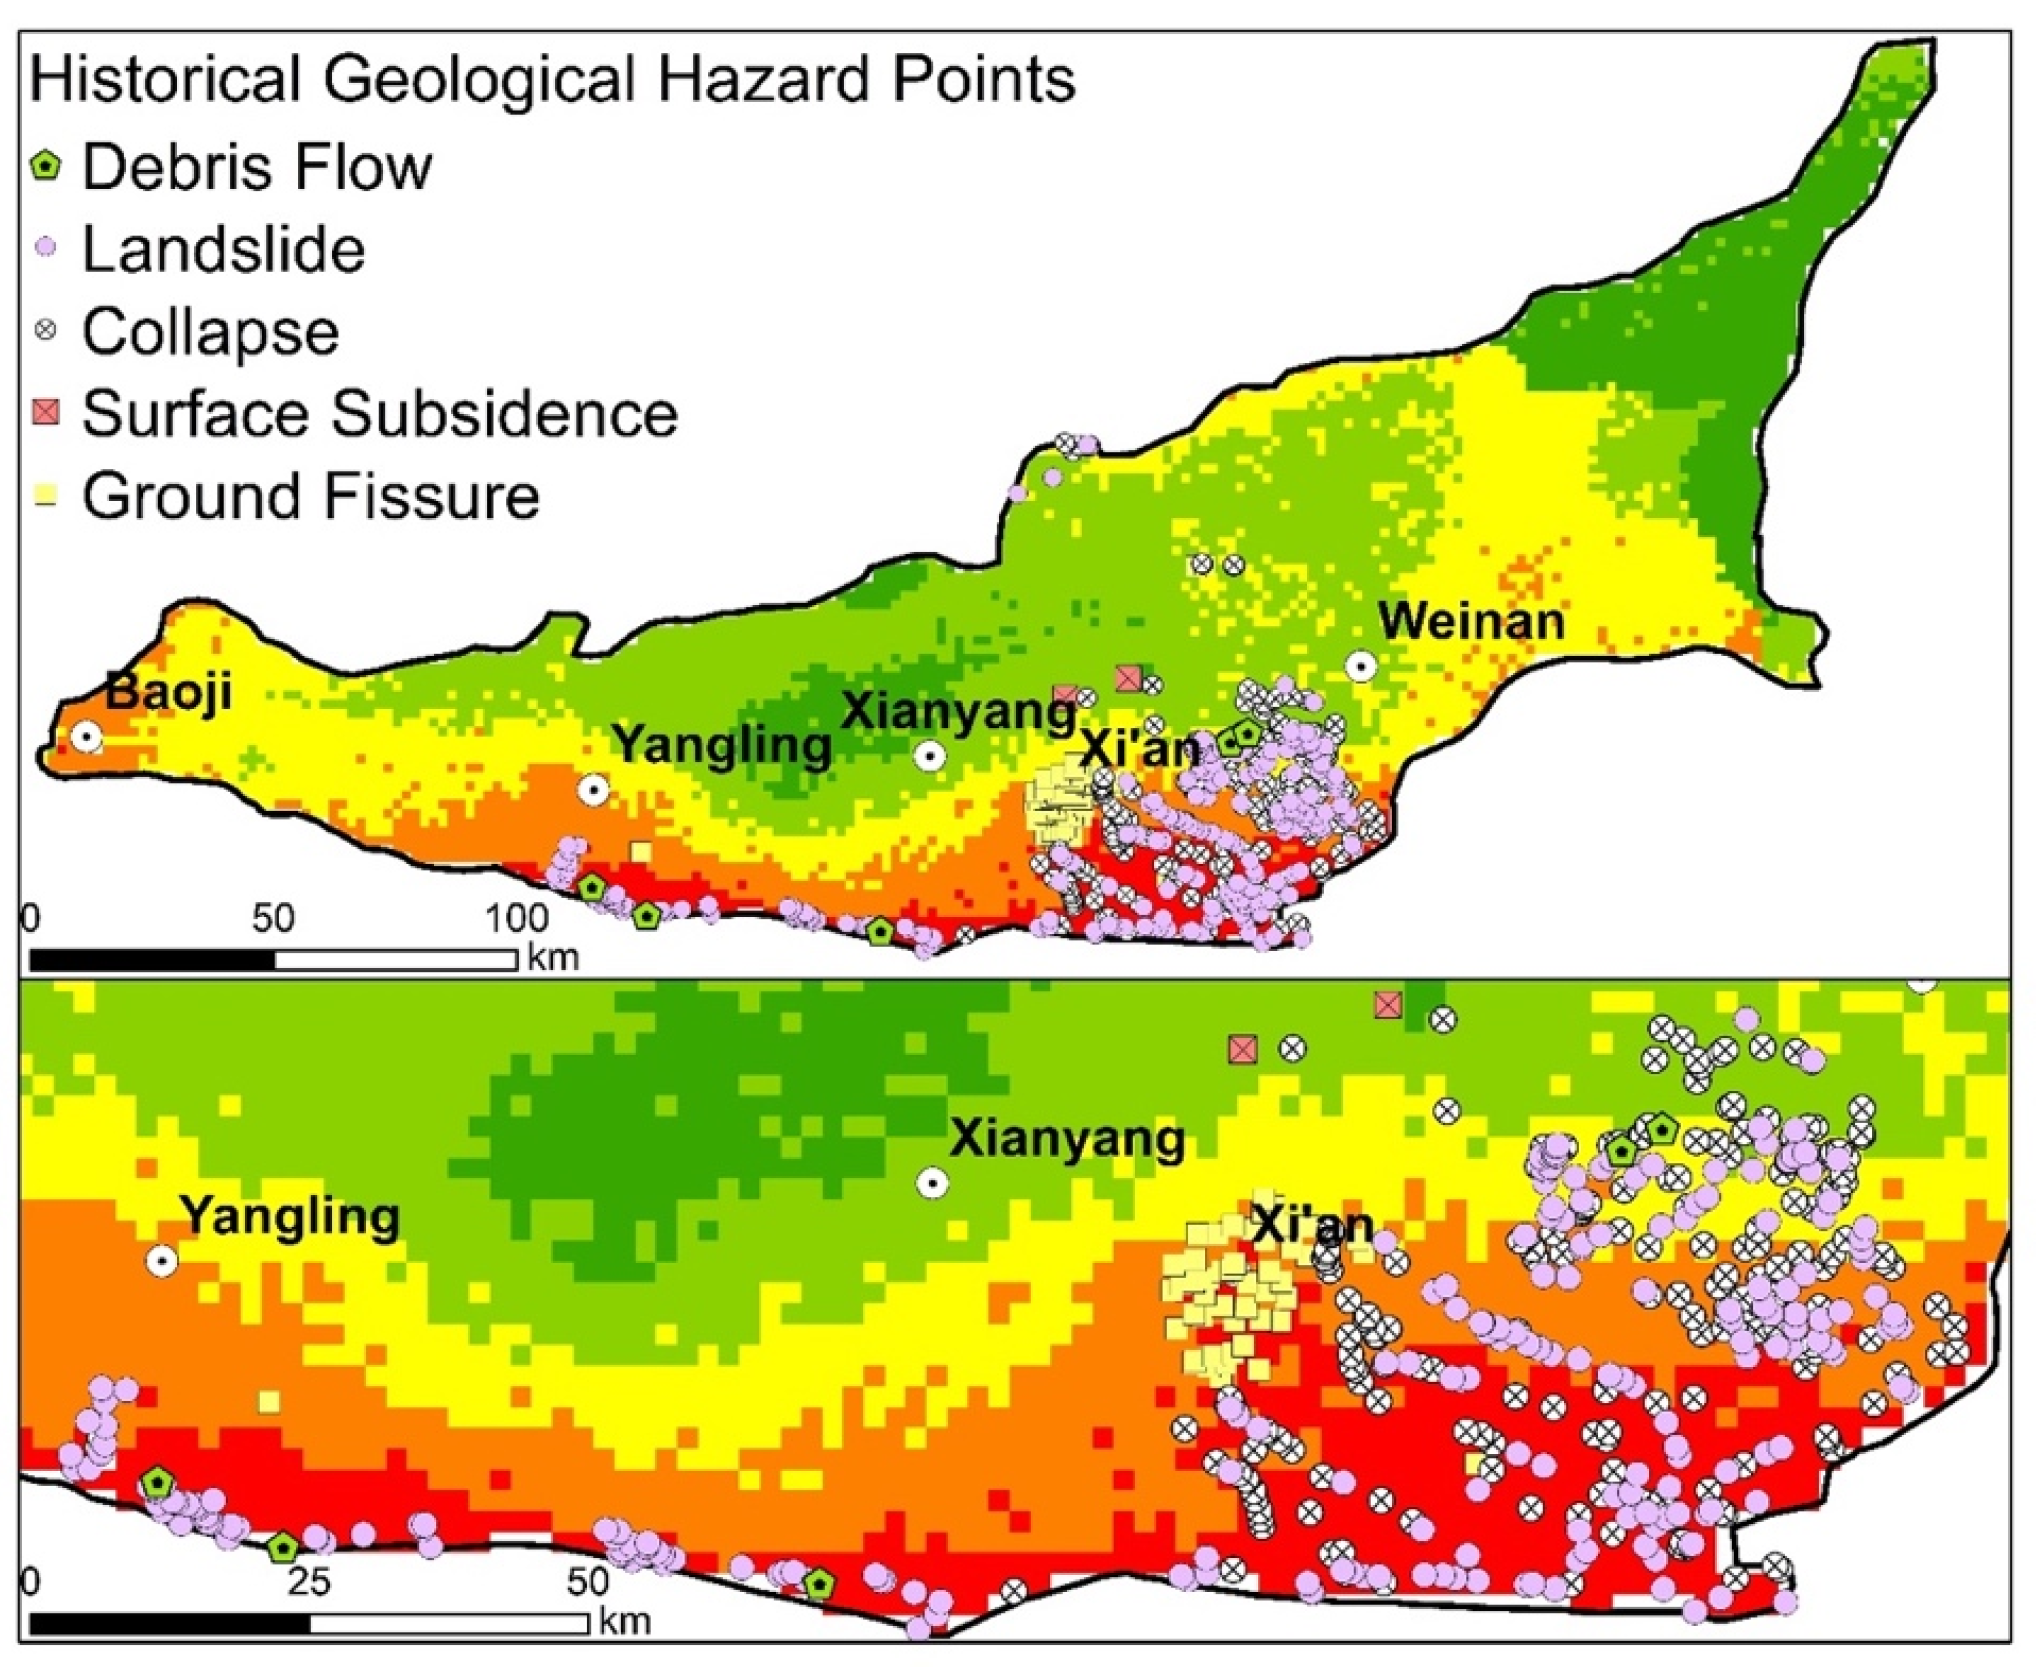
3.3. Spatial Risk Assessment
4. Discussion and Implications
5. Conclusions
- (1)
- Over the past four decades, the annual rainfall in the Guanzhong Basin of the Loess Plateau decreased at a rate of 1.46 mm/year, rainfall days decreased by 10.89%, the maximum rainfall amount increased by 5.34%, rainfall intensity increased by 7.66%, and rainstorm intensity increased by 4.68%.
- (2)
- The performance of our simulations using LSTM was acceptable, which indicated that runoff varied between 44.2 m3/s (42 mm/year) in the upstream and 187 m3/s (169.29 mm/year) in the downstream. A peak flow period was observed between July and September, which could exceed three to four times the monthly median flow in the upstream region. The downstream region could be at risk of flooding until October.
- (3)
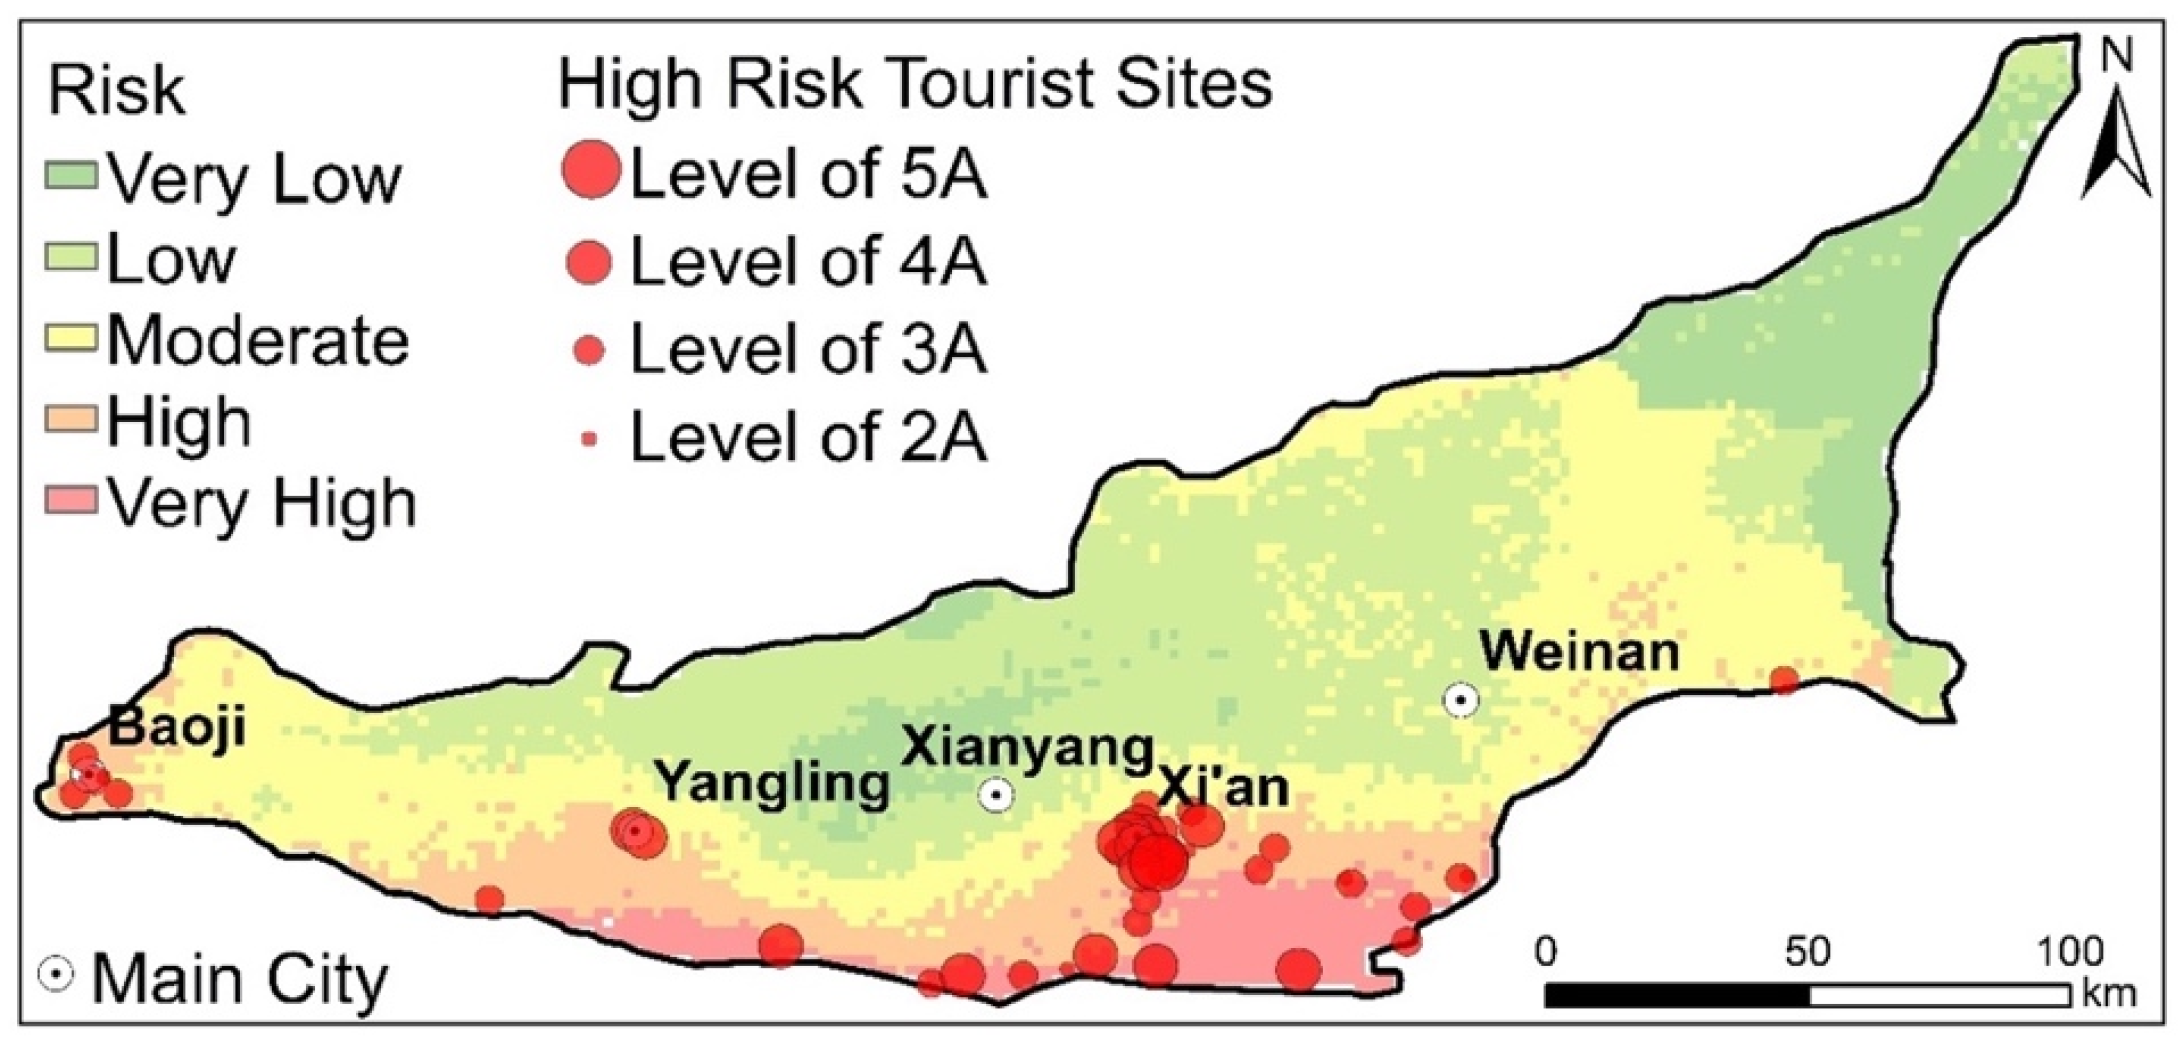
- The high-risk and very high-risk areas encompassed 4176.96 km2, which covered 20.3% of the total study area and were mainly located in the southern Qinglin Mountain terrain. Rainfall and runoff dominated the risk of hazards with a weight fraction of 53.9%, while geographical attributes contributed 29.72% and socioeconomic contributed 16.38%.
Author Contributions
Funding
Data Availability Statement
Conflicts of Interest
References
- Dano, U.L. An AHP-based assessment of flood triggering factors to enhance resiliency in Dammam, Saudi Arabia. GeoJournal 2022, 87, 1945–1960. [Google Scholar] [CrossRef]
- Borga, M.; Stoffel, M.; Marchi, L.; Marra, F.; Jakob, M. Hydrogeomorphic response to extreme rainfall in headwater systems: Flash floods and debris flows. J. Hydrol. 2014, 518, 194–205. [Google Scholar] [CrossRef]
- Tang, C.; Zhu, J.; Ding, J.; Cui, X.F.; Chen, L.; Zhang, J.S. Catastrophic debris flows triggered by a 14 August 2010 rainfall at the epicenter of the Wenchuan earthquake. Landslides 2011, 8, 485–497. [Google Scholar] [CrossRef]
- Dominguez, F.; Rivera, E.; Lettenmaier, D.; Castro, C. Changes in winter precipitation extremes for the western United States under a warmer climate as simulated by regional climate models. Geophys. Res. Lett. 2012, 39, 5. [Google Scholar] [CrossRef]
- Zhang, Y.; Zhou, D.; Guo, X. Regional climate response to global warming in the source region of the Yellow River and its impact on runoff. Sci. China Earth Sci. 2024, 67, 843–855. [Google Scholar] [CrossRef]
- Lu, J.; Qin, T.; Yan, D.; Zhang, X.; Jiang, S.; Yuan, Z.; Xu, S.; Gao, H.; Liu, H. Drought and wetness events encounter and cascade effect in the Yangtze River and Yellow River Basin. J. Hydrol. 2024, 639, 131608. [Google Scholar] [CrossRef]
- Yao, Y.; Zhang, M.; Deng, Y.; Dong, Y.; Wu, X.; Kuang, X. Evaluation of environmental engineering geology issues caused by rising groundwater levels in Xi’an, China. Eng. Geol. 2021, 294, 106350. [Google Scholar] [CrossRef]
- Chen, Y.; Zhao, L.; Wang, Y.; Wang, C. Review on Forecast Methods of Rainfall-induced Geo-hazards. J. Appl. Meteorol. Sci. 2019, 30, 142–153. [Google Scholar] [CrossRef]
- Jiang, W.; Tan, Y. Heavy rainfall-related excavation failures in China during 1994 to 2018: An overview. Eng. Fail. Anal. 2021, 129, 105695. [Google Scholar] [CrossRef]
- Yao, Y.; Khan, Z.A. Predicting Pakistan’s next flood. Science 2022, 378, 483. [Google Scholar] [CrossRef]
- Chong, Y.; Chen, G.; Meng, X.; Yang, Y.; Shi, W.; Bian, S.; Zhang, Y.; Yue, D. Quantitative analysis of artificial dam failure effects on debris flows—A case study of the Zhouqu ‘8.8’debris flow in northwestern China. Sci. Total Environ. 2021, 792, 148439. [Google Scholar] [CrossRef] [PubMed]
- Wang, G. Lessons learned from protective measures associated with the 2010 Zhouqu debris flow disaster in China. Nat. Hazards 2013, 69, 1835–1847. [Google Scholar] [CrossRef]
- Herrera, G.; Mateos, R.M.; García-Davalillo, J.C.; Grandjean, G.; Poyiadji, E.; Maftei, R.; Filipciuc, T.-C.; Jemec Auflič, M.; Jež, J.; Podolszki, L. Landslide databases in the Geological Surveys of Europe. Landslides 2018, 15, 359–379. [Google Scholar] [CrossRef]
- Miao, Q.; Yang, D.; Yang, H.; Li, Z. Establishing a rainfall threshold for flash flood warnings in China’s mountainous areas based on a distributed hydrological model. J. Hydrol. 2016, 541, 371–386. [Google Scholar] [CrossRef]
- O’Connor, J.E.; Costa, J.E. Spatial distribution of the largest rainfall-runoff floods from basins between 2.6 and 26,000 km2 in the United States and Puerto Rico. Water Resour. Res. 2004, 40, 1. [Google Scholar] [CrossRef]
- Liu, Z.; Zhang, H.; Liang, Q. A coupled hydrological and hydrodynamic model for flood simulation. Hydrol. Res. 2019, 50, 589–606. [Google Scholar] [CrossRef]
- Liu, S.; Yao, Y.; Kuang, X.; Zheng, C. A preliminary investigation on the climate-discharge relationship in the upper region of the Yarlung Zangbo River basin. J. Hydrol. 2021, 603, 127066. [Google Scholar] [CrossRef]
- Intrieri, E.; Carlà, T.; Gigli, G. Forecasting the time of failure of landslides at slope-scale: A literature review. Earth Sci. Rev. 2019, 193, 333–349. [Google Scholar] [CrossRef]
- Wang, X.; Huang, G.; Liu, J. Projected increases in intensity and frequency of rainfall extremes through a regional climate modeling approach. J. Geophys. Res. Atmos. 2014, 119, 13271–13286. [Google Scholar] [CrossRef]
- Mallick, J.; Alqadhi, S.; Talukdar, S.; AlSubih, M.; Ahmed, M.; Khan, R.A.; Kahla, N.B.; Abutayeh, S.M. Risk assessment of resources exposed to rainfall induced landslide with the development of GIS and RS based ensemble metaheuristic machine learning algorithms. Sustainability 2021, 13, 457. [Google Scholar] [CrossRef]
- Papathoma-Köhle, M.; Gems, B.; Sturm, M.; Fuchs, S. Matrices, curves and indicators: A review of approaches to assess physical vulnerability to debris flows. Earth Sci. Rev. 2017, 171, 272–288. [Google Scholar] [CrossRef]
- Pollock, W.; Wartman, J. Human vulnerability to landslides. GeoHealth 2020, 4, e2020GH000287. [Google Scholar] [CrossRef] [PubMed]
- Riedel, J.L.; Sarrantonio, S.M. Debris flow magnitude, frequency, and precipitation threshold in the eastern North Cascades, Washington, USA. Nat. Hazards 2021, 106, 2519–2544. [Google Scholar] [CrossRef]
- Hu, L.; Zhang, Q.; Singh, V.P.; Wang, G.; He, C.; Zhao, J. Escalating rainstorm-induced flood risks in the Yellow River Basin, China. Environ. Res. Lett. 2024, 19, 064006. [Google Scholar] [CrossRef]
- Lan, H.; Zhao, Z.; Li, L.; Li, J.; Fu, B.; Tian, N.; Lai, R.; Zhou, S.; Zhu, Y.; Zhang, F. Climate change drives flooding risk increases in the Yellow River Basin. Geogr. Sustain. 2024, 5, 193–199. [Google Scholar] [CrossRef]
- Sun, Y.; Zhang, Q.; Singh, V.P. Flooding in the Yellow River Basin, China: Spatiotemporal patterns, drivers and future tendency. J. Hydrol. Reg. Stud. 2024, 52, 101706. [Google Scholar] [CrossRef]
- Myhre, G.; Alterskjær, K.; Stjern, C.W.; Hodnebrog, Ø.; Marelle, L.; Samset, B.H.; Sillmann, J.; Schaller, N.; Fischer, E.; Schulz, M. Frequency of extreme precipitation increases extensively with event rareness under global warming. Sci. Rep. 2019, 9, 16063. [Google Scholar] [CrossRef]
- Zhao, Z.; Huo, A.; Liu, Q.; Yang, L.; Luo, C.; Ahmed, A.; Elbeltagi, A. Assessment of urban inundation and prediction of combined flood disaster in the middle reaches of Yellow river basin under extreme precipitation. J. Hydrol. 2024, 640, 131707. [Google Scholar] [CrossRef]
- Xu, S.; Zhang, M.; Ma, Y.; Liu, J.; Wang, Y.; Ma, X.; Chen, J. Multiclassification method of landslide risk assessment in consideration of disaster levels: A case study of Xianyang City, Shaanxi Province. ISPRS Int. J. Geo-Inf. 2021, 10, 646. [Google Scholar] [CrossRef]
- Liang, S.; Chen, D.; Li, D.; Qi, Y.; Zhao, Z. Spatial and temporal distribution of geologic hazards in Shaanxi Province. Remote Sens. 2021, 13, 4259. [Google Scholar] [CrossRef]
- Zhuang, J.; Peng, J.; Wang, G.; Javed, I.; Wang, Y.; Li, W. Distribution and characteristics of landslide in Loess Plateau: A case study in Shaanxi province. Eng. Geol. 2018, 236, 89–96. [Google Scholar] [CrossRef]
- Zhou, Y.; Liu, Y.; Wu, W.; Li, N. Integrated risk assessment of multi-hazards in China. Nat. Hazards 2015, 78, 257–280. [Google Scholar] [CrossRef]
- Hu, L.; Zhang, Q.; Wang, G.; Singh, V.P.; Wu, W.; Fan, K.; Shen, Z. Flood disaster risk and socioeconomy in the Yellow River Basin, China. J. Hydrol. Reg. Stud. 2022, 44, 101272. [Google Scholar] [CrossRef]
- Liu, Z.; Xu, Z.; Charles, S.P.; Fu, G.; Liu, L. Evaluation of two statistical downscaling models for daily precipitation over an arid basin in China. Int. J. Climatol. 2011, 31, 2006–2020. [Google Scholar] [CrossRef]
- Ma, S.; Zhou, T.; Dai, A.; Han, Z. Observed changes in the distributions of daily precipitation frequency and amount over China from 1960 to 2013. J. Clim. 2015, 28, 6960–6978. [Google Scholar] [CrossRef]
- Penalba, O.C.; Robledo, F.A. Spatial and temporal variability of the frequency of extreme daily rainfall regime in the La Plata Basin during the 20th century. Clim. Chang. 2010, 98, 531–550. [Google Scholar] [CrossRef]
- Neeti, N.; Eastman, J.R. A contextual mann-kendall approach for the assessment of trend significance in image time series. Trans. GIS 2011, 15, 599–611. [Google Scholar] [CrossRef]
- Feng, D.; Fang, K.; Shen, C. Enhancing streamflow forecast and extracting insights using long-short term memory networks with data integration at continental scales. Water Resour. Res. 2020, 56, e2019WR026793. [Google Scholar] [CrossRef]
- Gauch, M.; Mai, J.; Lin, J. The proper care and feeding of CAMELS: How limited training data affects streamflow prediction. Environ. Model. Softw. 2021, 135, 104926. [Google Scholar] [CrossRef]
- Kratzert, F.; Klotz, D.; Shalev, G.; Klambauer, G.; Hochreiter, S.; Nearing, G. Benchmarking a catchment-aware long short-term memory network (LSTM) for large-scale hydrological modeling. Hydrol. Earth Syst. Sci. Discuss 2019, 2019, 5089–5110. [Google Scholar] [CrossRef]
- Yao, Y.; Zhao, Y.; Li, X.; Feng, D.; Shen, C.; Liu, C.; Kuang, X.; Zheng, C. Can transfer learning improve hydrological predictions in the alpine regions? J. Hydrol. 2023, 625, 130038. [Google Scholar] [CrossRef]
- Man, Y.; Yang, Q.; Shao, J.; Wang, G.; Bai, L.; Xue, Y. Enhanced LSTM Model for Daily Runoff Prediction in the Upper Huai River Basin, China. Engineering 2022, 24, 229–238. [Google Scholar] [CrossRef]
- Yilmaz, K.K.; Gupta, H.V.; Wagener, T. A process-based diagnostic approach to model evaluation: Application to the NWS distributed hydrologic model. Water Resour. Res. 2008, 44, 9. [Google Scholar] [CrossRef]
- Aydin, M.C.; Sevgi Birincioğlu, E. Flood risk analysis using gis-based analytical hierarchy process: A case study of Bitlis Province. Appl. Water Sci. 2022, 12, 122. [Google Scholar] [CrossRef]
- He, Y.; Wang, Q.; Xu, Y.; Li, Z.; Yuan, J.; Lu, M.; Lin, Z. Climate change increased the compound extreme precipitation-flood events in a representative watershed of the Yangtze River Delta, China. Stoch. Environ. Res. Risk Assess. 2022, 36, 3803–3813. [Google Scholar] [CrossRef]
- Zhang, Y.; You, W. Social vulnerability to floods: A case study of Huaihe River Basin. Nat. Hazards 2014, 71, 2113–2125. [Google Scholar] [CrossRef]
- Saaty, T.L. What is the analytic hierarchy process. In Mathematical Models for Decision Support; Springer: Berlin/Heidelberg, Germany, 1988; pp. 109–121. [Google Scholar]
- Saaty, T.L. How to make a decision: The analytic hierarchy process. Eur. J. Oper. Res. 1990, 48, 9–26. [Google Scholar] [CrossRef]
- Lyu, H.; Sun, W.; Shen, S.; Arulrajah, A. Flood risk assessment in metro systems of mega-cities using a GIS-based modeling approach. Sci. Total Environ. 2018, 626, 1012–1025. [Google Scholar] [CrossRef]
- Dou, J.; Yunus, A.P.; Bui, D.T.; Merghadi, A.; Sahana, M.; Zhu, Z.; Chen, C.; Khosravi, K.; Yang, Y.; Pham, B.T. Assessment of advanced random forest and decision tree algorithms for modeling rainfall-induced landslide susceptibility in the Izu-Oshima Volcanic Island, Japan. Sci. Total Environ. 2019, 662, 332–346. [Google Scholar] [CrossRef]
- Stefanidis, S.; Stathis, D. Assessment of flood hazard based on natural and anthropogenic factors using analytic hierarchy process (AHP). Nat. Hazards 2013, 68, 569–585. [Google Scholar] [CrossRef]
- Salo, A.A.; Hämäläinen, R.P. On the measurement of preferences in the analytic hierarchy process. J. Multi-Crit. Decis. Anal. 1997, 6, 309–319. [Google Scholar] [CrossRef]
- Tang, J. Prioritizing User Requirements based on Analytic Hierarchy Process. Proc. J. Phys. Conf. Ser. 2021, 1861, 012021. [Google Scholar] [CrossRef]
- Pollesch, N.L.; Dale, V.H. Normalization in sustainability assessment: Methods and implications. Ecol. Econ. 2016, 130, 195–208. [Google Scholar] [CrossRef]
- Chang, J.; Wang, Y.; Istanbulluoglu, E.; Bai, T.; Huang, Q.; Yang, D.; Huang, S. Impact of climate change and human activities on runoff in the Weihe River Basin, China. Quat. Int. 2015, 380, 169–179. [Google Scholar] [CrossRef]
- Li, Y.; Chang, J.; Jin, W.; Guo, A.; Wang, D. Runoff simulation in subzones of the Wei River Basin based on the SWAT model. J. Northwest A F Univ. (Nat. Sci. Ed.) 2017, 45, 204–212. [Google Scholar]
- Yang, S.; Kang, T.; Bu, J.; Chen, J.; Wang, Z.; Gao, Y. Detection and Attribution of Runoff Reduction of Weihe River over Different Periods during 1961–2016. Water 2020, 12, 1416. [Google Scholar] [CrossRef]
- Qi, Q.; Ju, Y.W. Study on Rainfall-induced Loess Geological Hazards Characteristics and Preventive Measures in Shanxi Province. Proc. Appl. Mech. Mater. 2015, 744–746, 1741–1744. [Google Scholar] [CrossRef]
- Zhuang, J.; Iqbal, J.; Peng, J.; Liu, T. Probability prediction model for landslide occurrences in Xi’an, Shaanxi Province, China. J. Mt. Sci. 2014, 11, 345–359. [Google Scholar] [CrossRef]
- Tian, S.; Luo, W.; Jia, Z.; Butalia, R.S. Temporal variation of over-bank flooding of Wei River and its impact on a riparian wetland in Xi’an, China. Hydrol. Process. 2010, 24, 1296–1307. [Google Scholar] [CrossRef]
- Pavlova, I.; Makarigakis, A.; Depret, T.; Jomelli, V. Global overview of the geological hazard exposure and disaster risk awareness at world heritage sites. J. Cult. Herit. 2017, 28, 151–157. [Google Scholar] [CrossRef]


| Step | Procedure |
|---|---|
| 1 | Develop a hierarchy of indicators and criteria |
| 2 | Develop a pairwise comparison matrix |
| 3 | Check for consistency |
| 4 | Obtain the relative weights |
| 1 | 2 | 3 | 4 | 5 | 6 | 7 | 8 | 9 | |
| 0 | 0 | 0.52 | 0.89 | 1.12 | 1.24 | 1.36 | 1.41 | 1.46 |
| Name | Description | Format | Source | Resolution |
|---|---|---|---|---|
| Precipitation | Daily precipitation (from 20:00 to 20:00 the next day) data from 1980 to 2019 | Text | National Meteorological Bureau and Shaanxi Meteorological Bureau | Daily |
| Temperature | Air temperature | Text | Meteorological Bureau | Monthly |
| DEM | Electronic topographic map | Grid | http://www.csdb.cn/ | 30 m |
| Slope | The slowness of surface units | Grid | Based on DEM | 30 m |
| Land use | Cultivated land, woodland, grassland, waters, residential, and unused land | Grid | https://www.resdc.cn/ | 1 km |
| Drainage network | Ratio of total river length to basin area of main and tributaries. | Grid | Based on DEM | 1 km |
| Sand content in soil | Use percentage to reflect the content of sand particles. | Shapefile | https://www.resdc.cn/ | 1 km |
| GDP | Gross Domestic Product | Grid | https://www.resdc.cn/ | 1 km |
| Population density | Population per square kilometer | Grid | https://www.resdc.cn/ | 1 km |
| Streamflow | Daily or monthly runoff data | Text | Monthly | |
| Geological hazard points | Dataset of geological hazard points in Weihe River Basin | Shapefile | http://www.ncdc.ac.cn/ | 1 km |
| Tourism points | Location and description of tourist spots | Shapefile | 1 km |
| Level | Rainfall Hazard Risk | Geo-Hazard Risk | Socio-Hazard Risk |
|---|---|---|---|
| Very Low | 0–0.243 | 0–0.188 | 0–0.098 |
| Low | 0.244–0.408 | 0.189–0.290 | 0.0981–0.251 |
| Moderate | 0.409–0.549 | 0.291–0.388 | 0.252–0.373 |
| High | 0.550–0.737 | 0.389–0.529 | 0.374–0.596 |
| Very High | 0.738–1 | 0.530–1 | 0.597–1 |
| Target | Variable | Weight of Criterion Layer | Index | Weight of Index Layer | Comprehensive Weight | ||
|---|---|---|---|---|---|---|---|
| Risk of floods, landslides, mudslides, and other disasters caused by rainfall | Rainfall and Runoff | (B1) | 0.5390 | Rainfall (mm) | (C1) | 0.0582 | 0.0314 |
| Rainfall Days (d) | (C2) | 0.0397 | 0.0214 | ||||
| Rainfall Intensity (mm/d) | (C3) | 0.1280 | 0.0690 | ||||
| Maximum Rainfall Amount (mm) | (C4) | 0.1783 | 0.0961 | ||||
| Rainstorm Intensity (mm/d) | (C5) | 0.2092 | 0.1127 | ||||
| Average runoff depth (mm) | (C6) | 0.0740 | 0.0399 | ||||
| Runoff depth in flood season (mm) | (C7) | 0.3126 | 0.1685 | ||||
| Geographical | (B2) | 0.2972 | Elevation (m) | (C8) | 0.1187 | 0.0353 | |
| Slope (degree) | (C9) | 0.1671 | 0.0497 | ||||
| Soil Texture | (C10) | 0.2427 | 0.0721 | ||||
| Drainage Density (km/km2) | (C11) | 0.4715 | 0.1402 | ||||
| Socio-economic | (B3) | 0.1638 | Population Density (pop/km2) | (C12) | 0.5247 | 0.0859 | |
| GDP | (C13) | 0.3338 | 0.0547 | ||||
| Land Use | (C14) | 0.1416 | 0.0232 | ||||
| Risk Level | Number of Historical Geological Hazard Points/Piece | Proportion/% |
|---|---|---|
| Very Low | 0 | 0 |
| Low | 42 | 8.24 |
| Moderate | 96 | 18.82 |
| High | 158 | 30.98 |
| Very High | 214 | 41.96 |
Disclaimer/Publisher’s Note: The statements, opinions and data contained in all publications are solely those of the individual author(s) and contributor(s) and not of MDPI and/or the editor(s). MDPI and/or the editor(s) disclaim responsibility for any injury to people or property resulting from any ideas, methods, instructions or products referred to in the content. |
© 2025 by the authors. Licensee MDPI, Basel, Switzerland. This article is an open access article distributed under the terms and conditions of the Creative Commons Attribution (CC BY) license (https://creativecommons.org/licenses/by/4.0/).
Share and Cite
Zhao, Y.; Xiao, S.; Wu, X.; Guo, S.; Yao, Y. Assessing the Risk of Natural and Socioeconomic Hazards Caused by Rainfall in the Middle Yellow River Basin. Hydrology 2025, 12, 134. https://doi.org/10.3390/hydrology12060134
Zhao Y, Xiao S, Wu X, Guo S, Yao Y. Assessing the Risk of Natural and Socioeconomic Hazards Caused by Rainfall in the Middle Yellow River Basin. Hydrology. 2025; 12(6):134. https://doi.org/10.3390/hydrology12060134
Chicago/Turabian StyleZhao, Yufeng, Shun Xiao, Xinshuang Wu, Shuitao Guo, and Yingying Yao. 2025. "Assessing the Risk of Natural and Socioeconomic Hazards Caused by Rainfall in the Middle Yellow River Basin" Hydrology 12, no. 6: 134. https://doi.org/10.3390/hydrology12060134
APA StyleZhao, Y., Xiao, S., Wu, X., Guo, S., & Yao, Y. (2025). Assessing the Risk of Natural and Socioeconomic Hazards Caused by Rainfall in the Middle Yellow River Basin. Hydrology, 12(6), 134. https://doi.org/10.3390/hydrology12060134