
Comparison and Prediction of the Ecological Footprint of Water Resources—Taking Guizhou Province as an Example
Abstract
1. Introduction
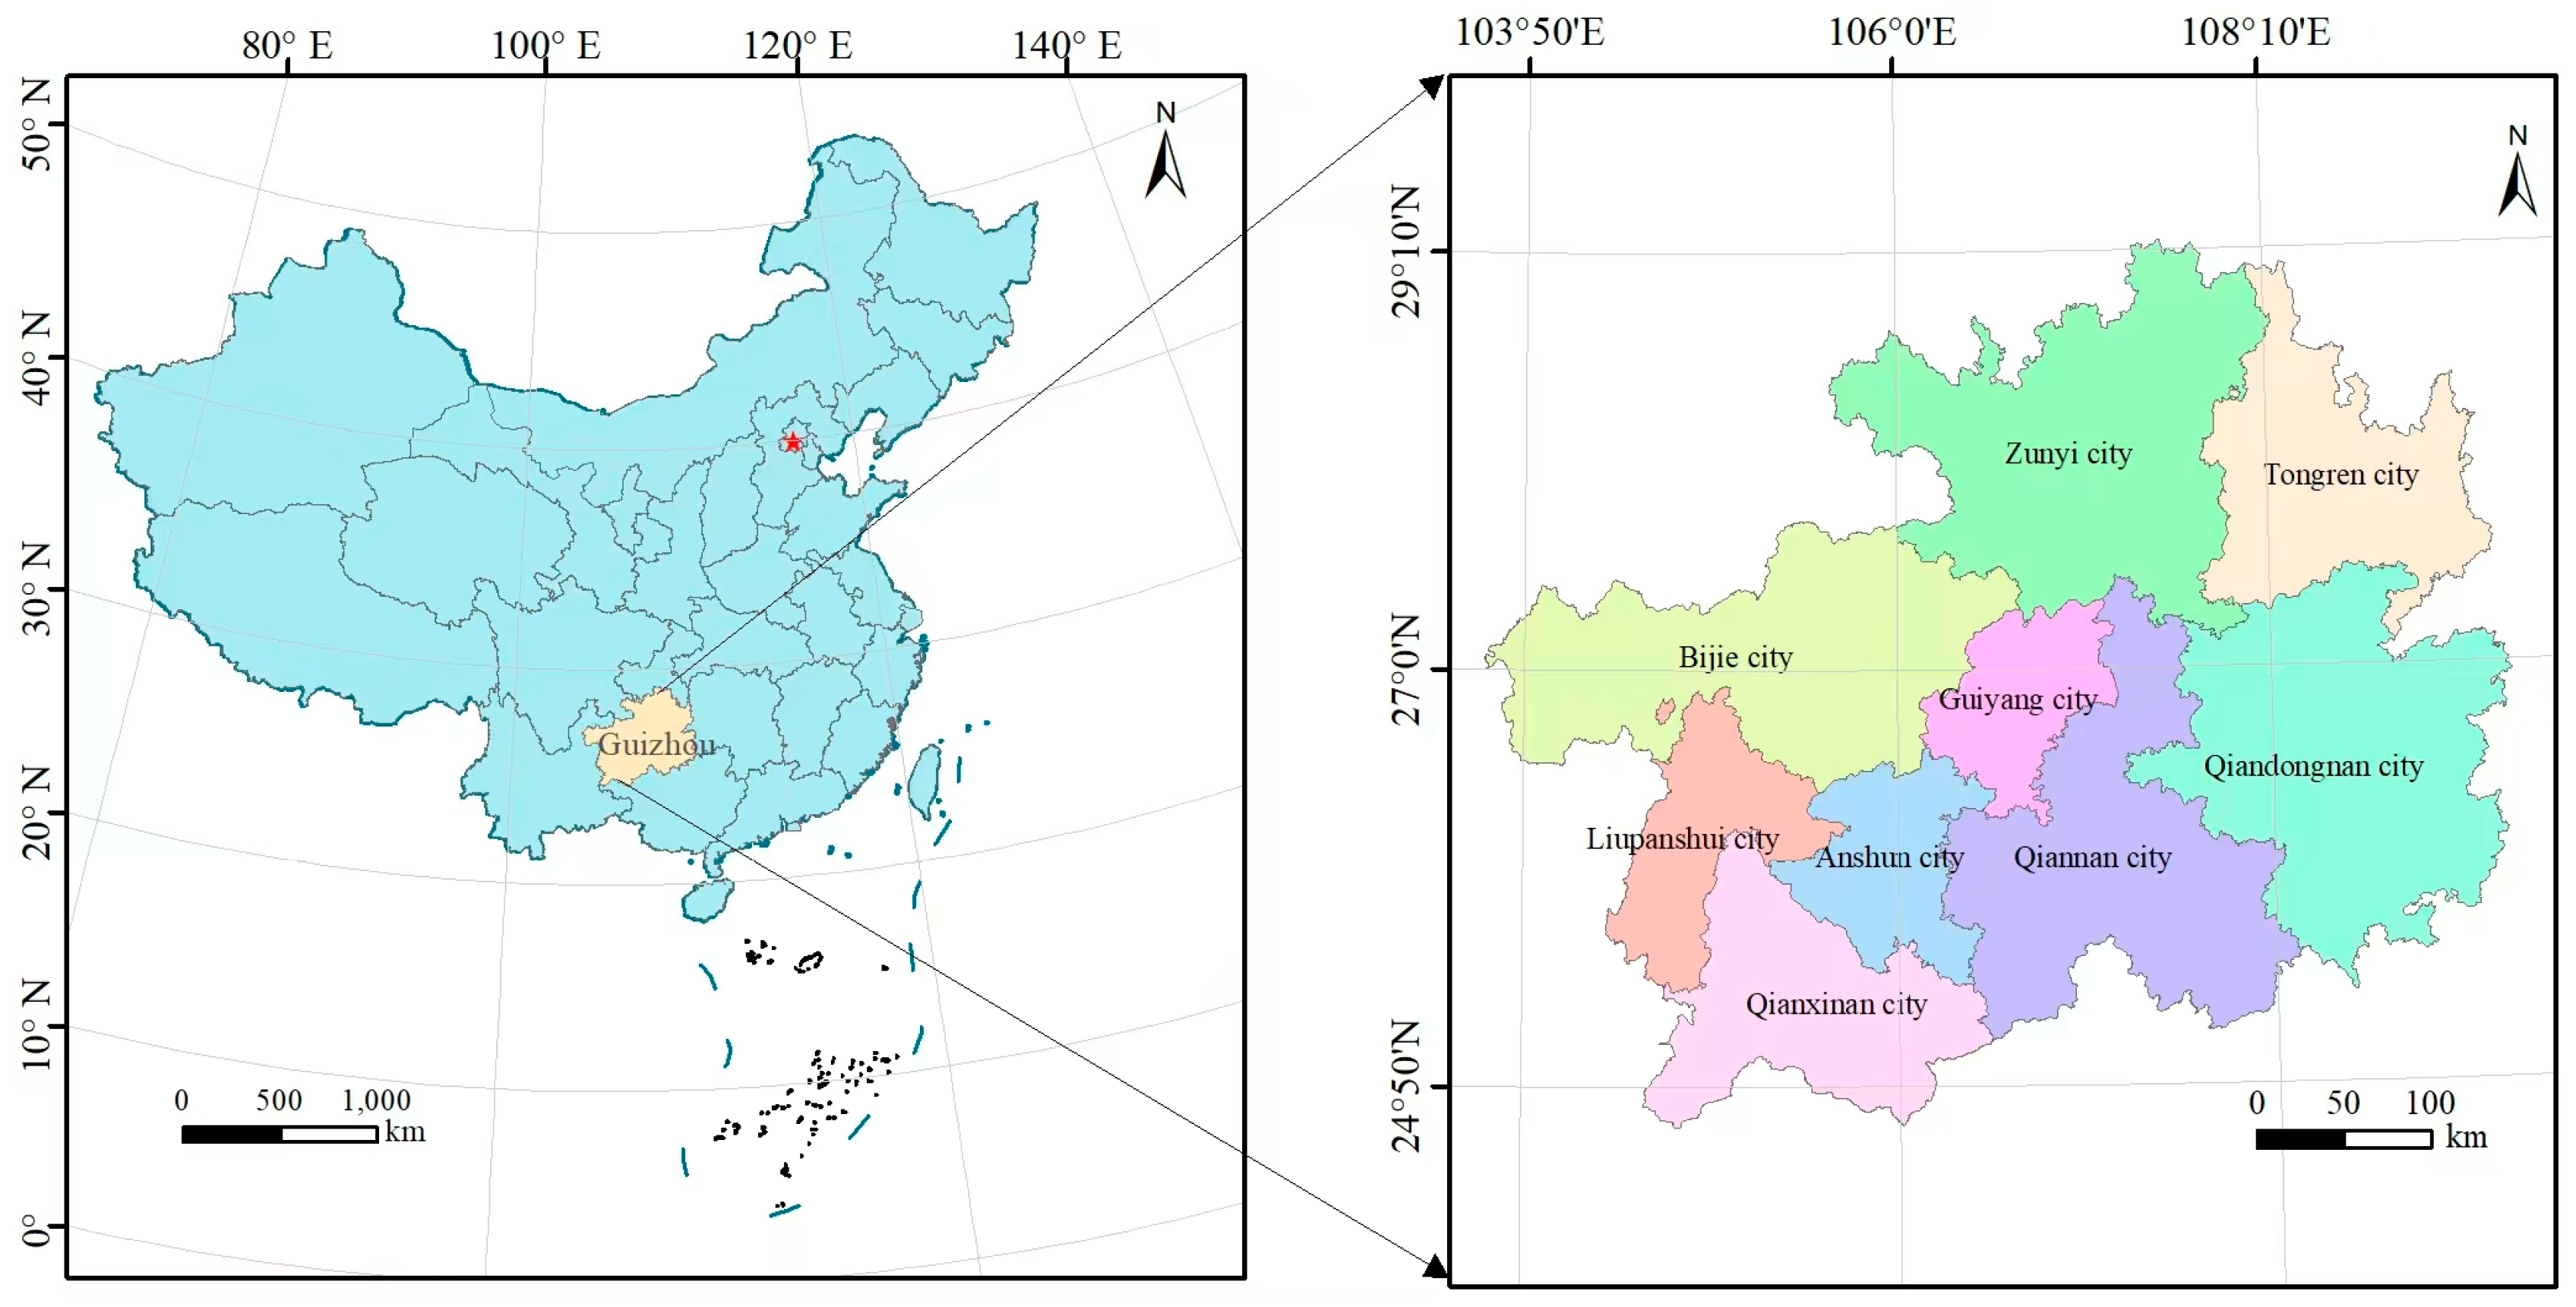
2. Study Zone Characteristics and Dataset Provenance Analysis
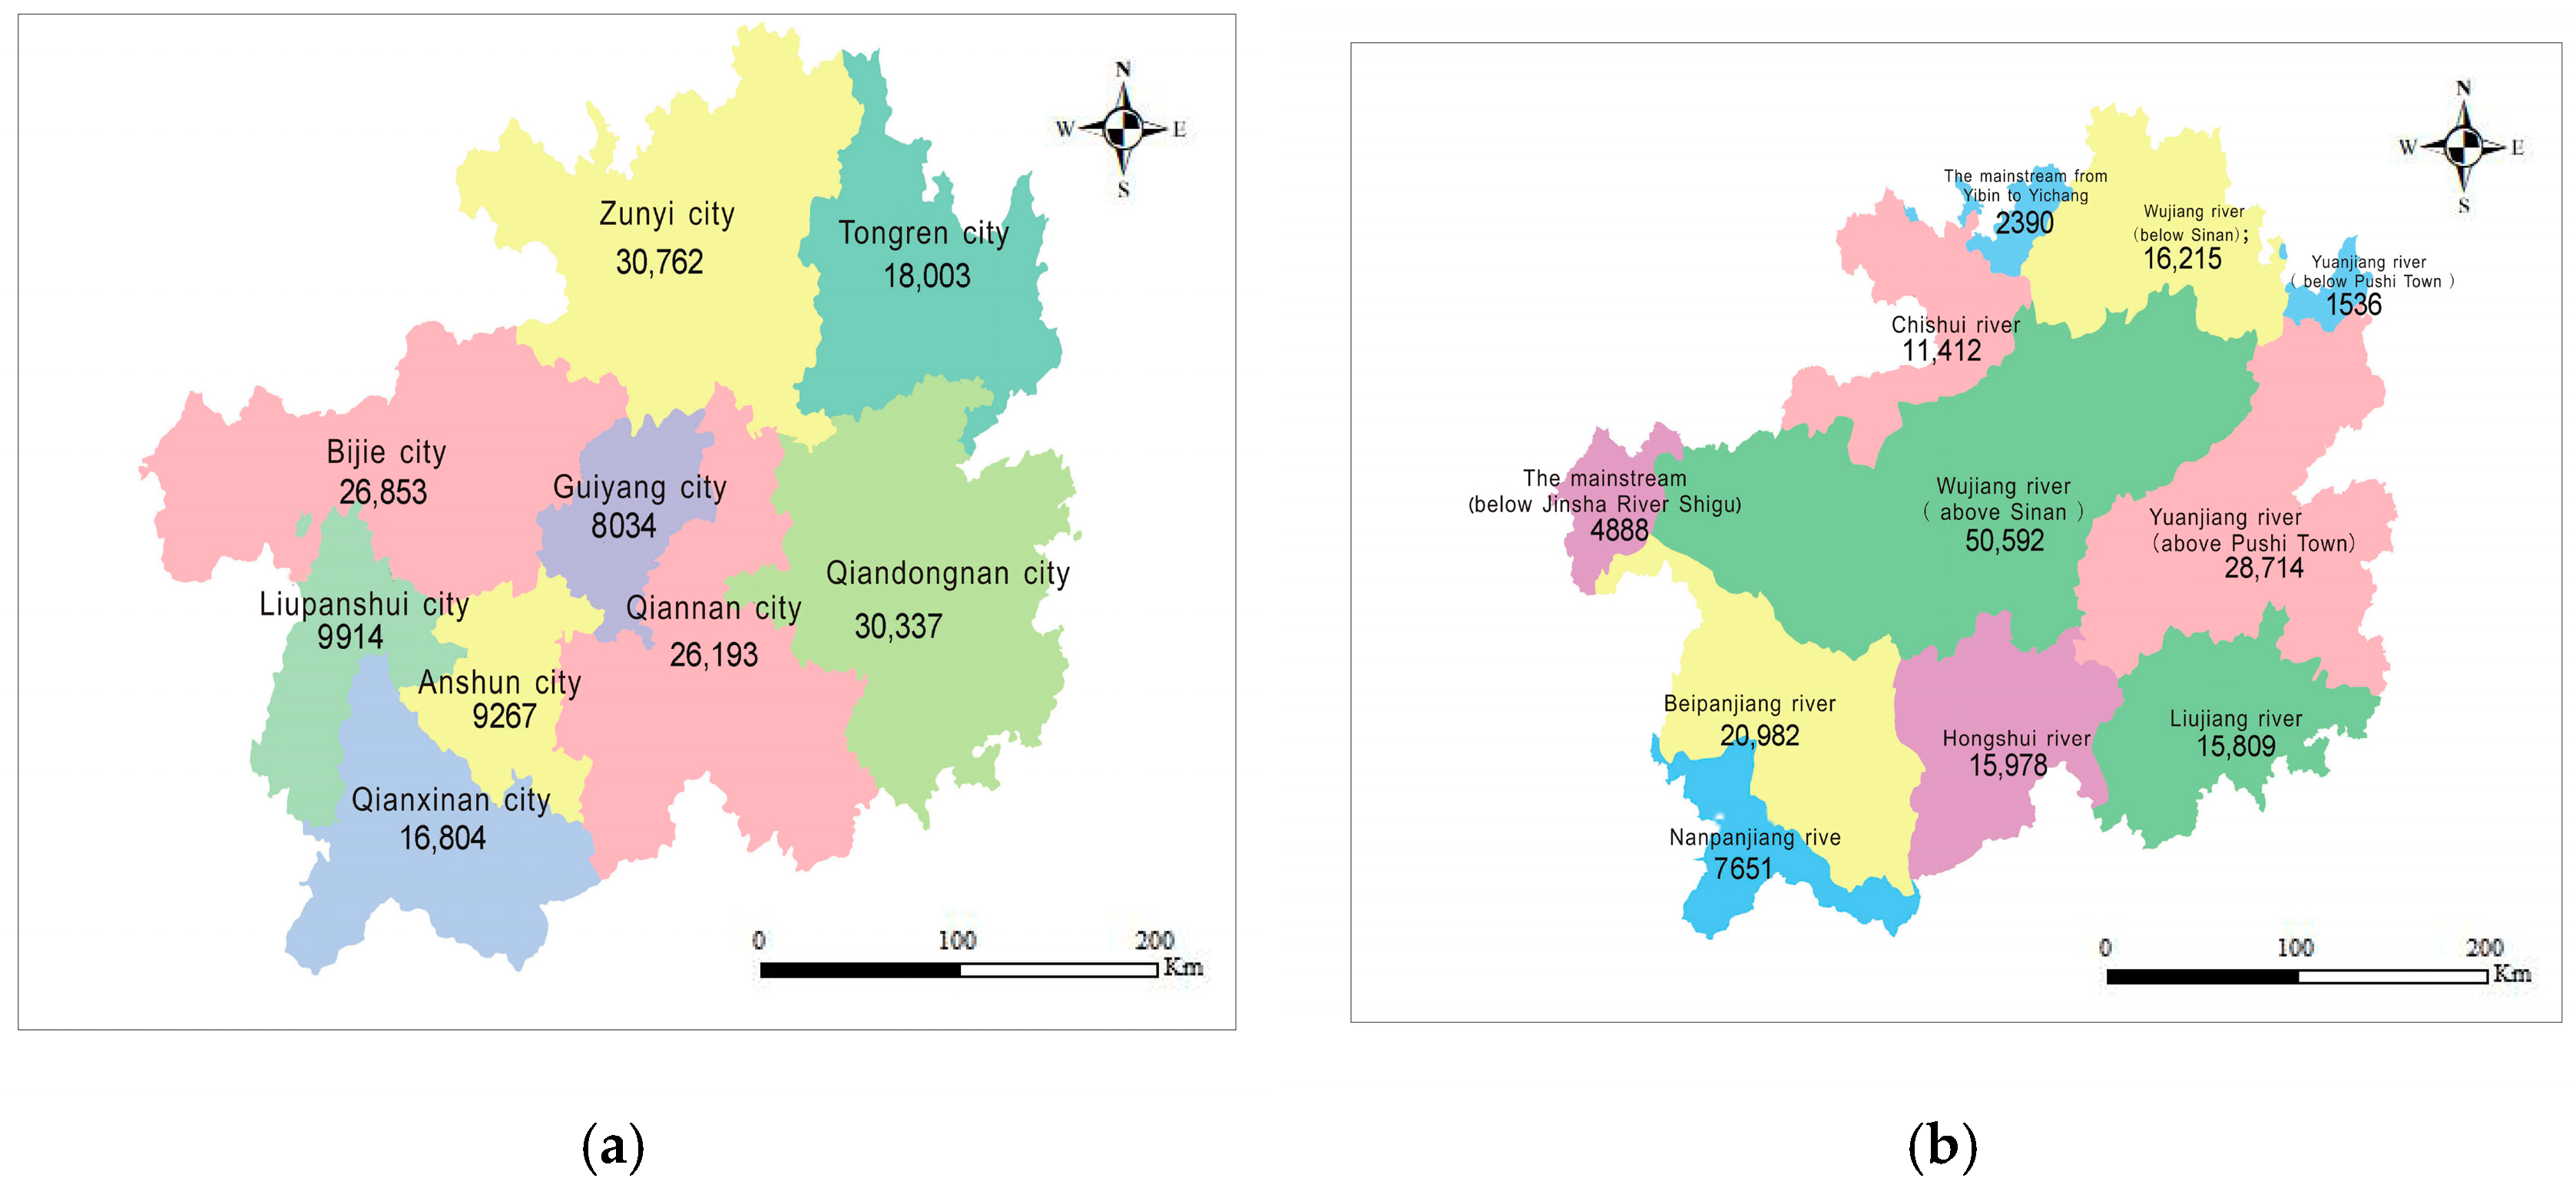
2.1. Composite Analysis of the Research Sector
2.2. Dimensional Data Origins and Principal Metric Attributes
3. Research Methodology
3.1. WEF Model
3.2. Water Carrying Capacity Model
3.3. Metric Framework for Hydro-Resource Stewardship Assessment
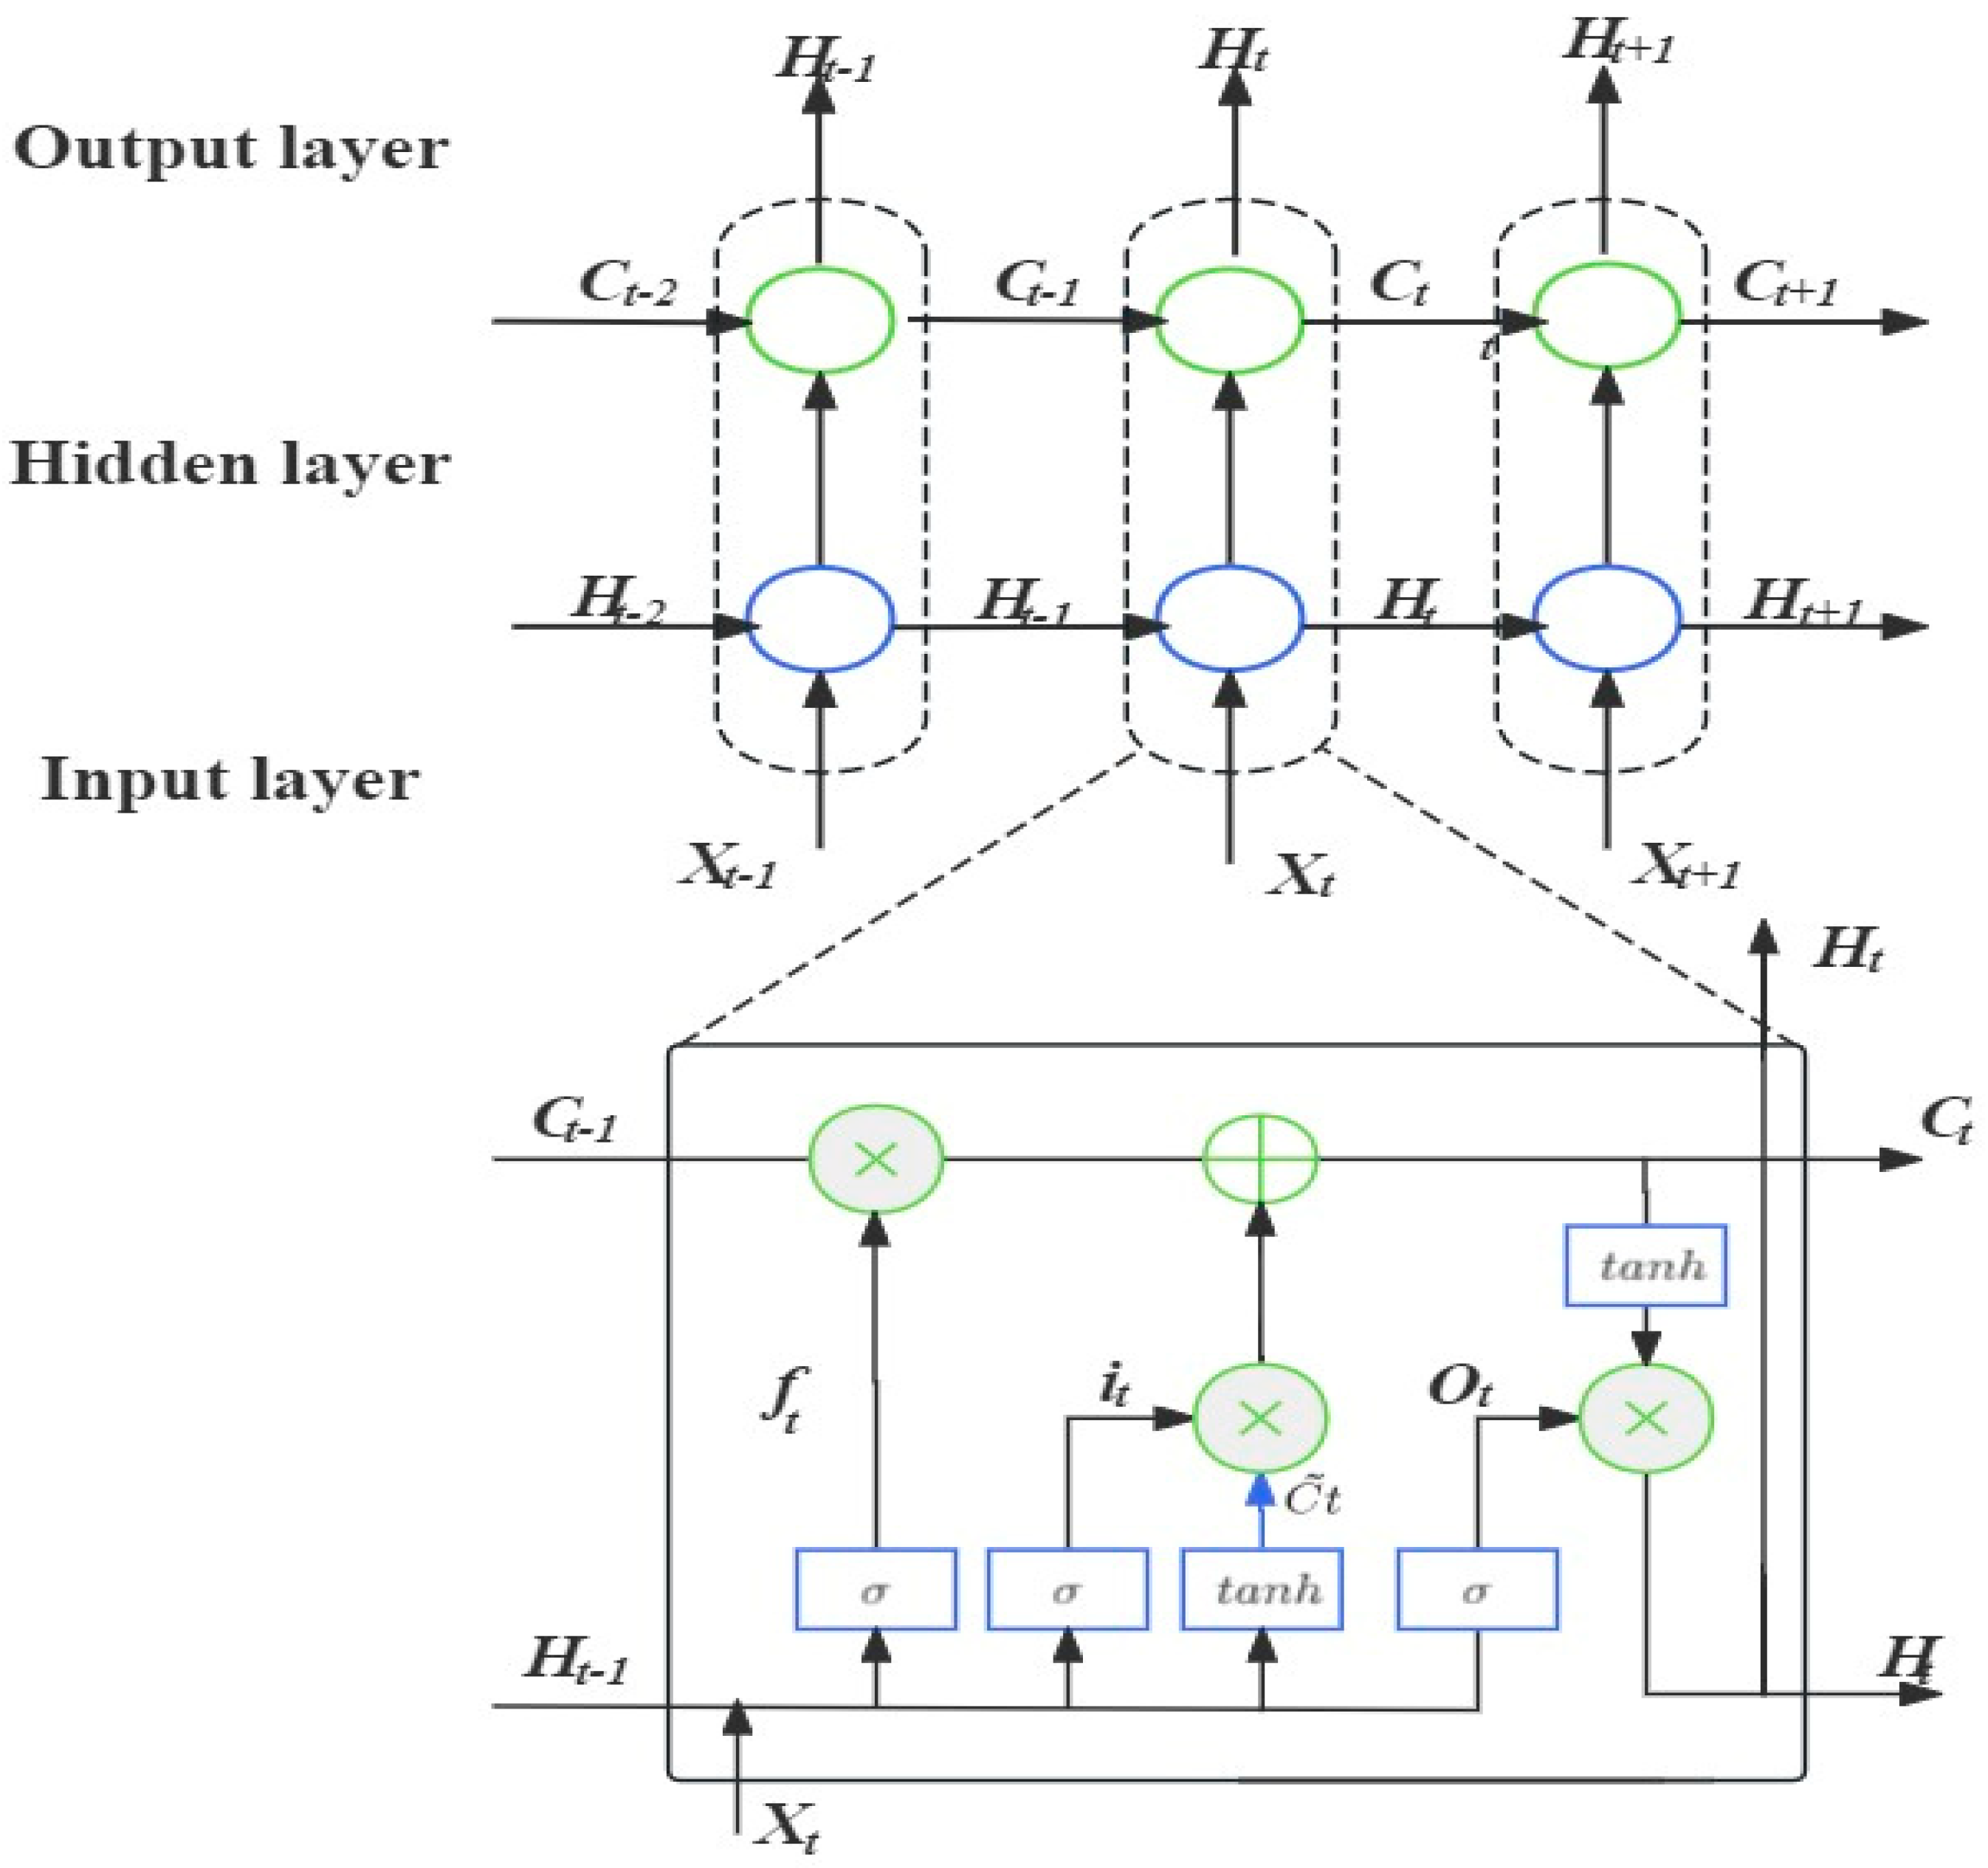
3.4. LSTM Time-Series Neural Network Model
- (1)
- Memory Mechanisms: cell state preservation through time, self-regulating memory updates via gate operations.
- (2)
- Gating Architecture: input gate—controls new information flow; forget gate—manages memory retention; output gate—governs prediction outputs.
- (3)
- Temporal Processing Advantages: maintains stable gradient flow during backpropagation, captures multi-scale dependencies (short/long-term), and demonstrates particular efficacy for hydrological time series forecasting [29].
- (1)
- Architecture specifications—network topology: single hidden layer LSTM; hidden units: 20 neurons (optimized for water resource time-series complexity); input/output dimensions: matched to hydrological feature dimensions.
- (2)
- Numerical parametrization framework—gradient descent operations employed the adaptive moment estimation algorithm (Adam optimizer, β1 = 0.9, β2 = 0.999 with coefficient-preserved initialization) with step size magnitude α = 0.01.
- (3)
- Learning rate scheduling protocol: the optimizer adopted a progressive scaling strategy wherein the initial learning rate received a multiplicative factor of 1.2 (Δ = +0.2) post-training phase transition at epoch 20, balancing convergence acceleration with regularization requirements; training duration was bounded at 100 epochs, incorporating real-time validation loss plateau detection (patience = 5 epochs) to prevent model over-specialization.
- (4)
- Regularization strategy—implicit learning rate reduction for loss plateau avoidance, batch normalization between layers, and gradient clipping (threshold = 1.0) for stability.
- (5)
- Hydrological data considerations—input window size: [X] temporal steps (aligns with water cycle periodicity); output horizon: [Y] steps (matching forecast requirements); feature scaling: standardized to N (0,1) using training set statistics [30].
3.5. Evaluation of Projected Results
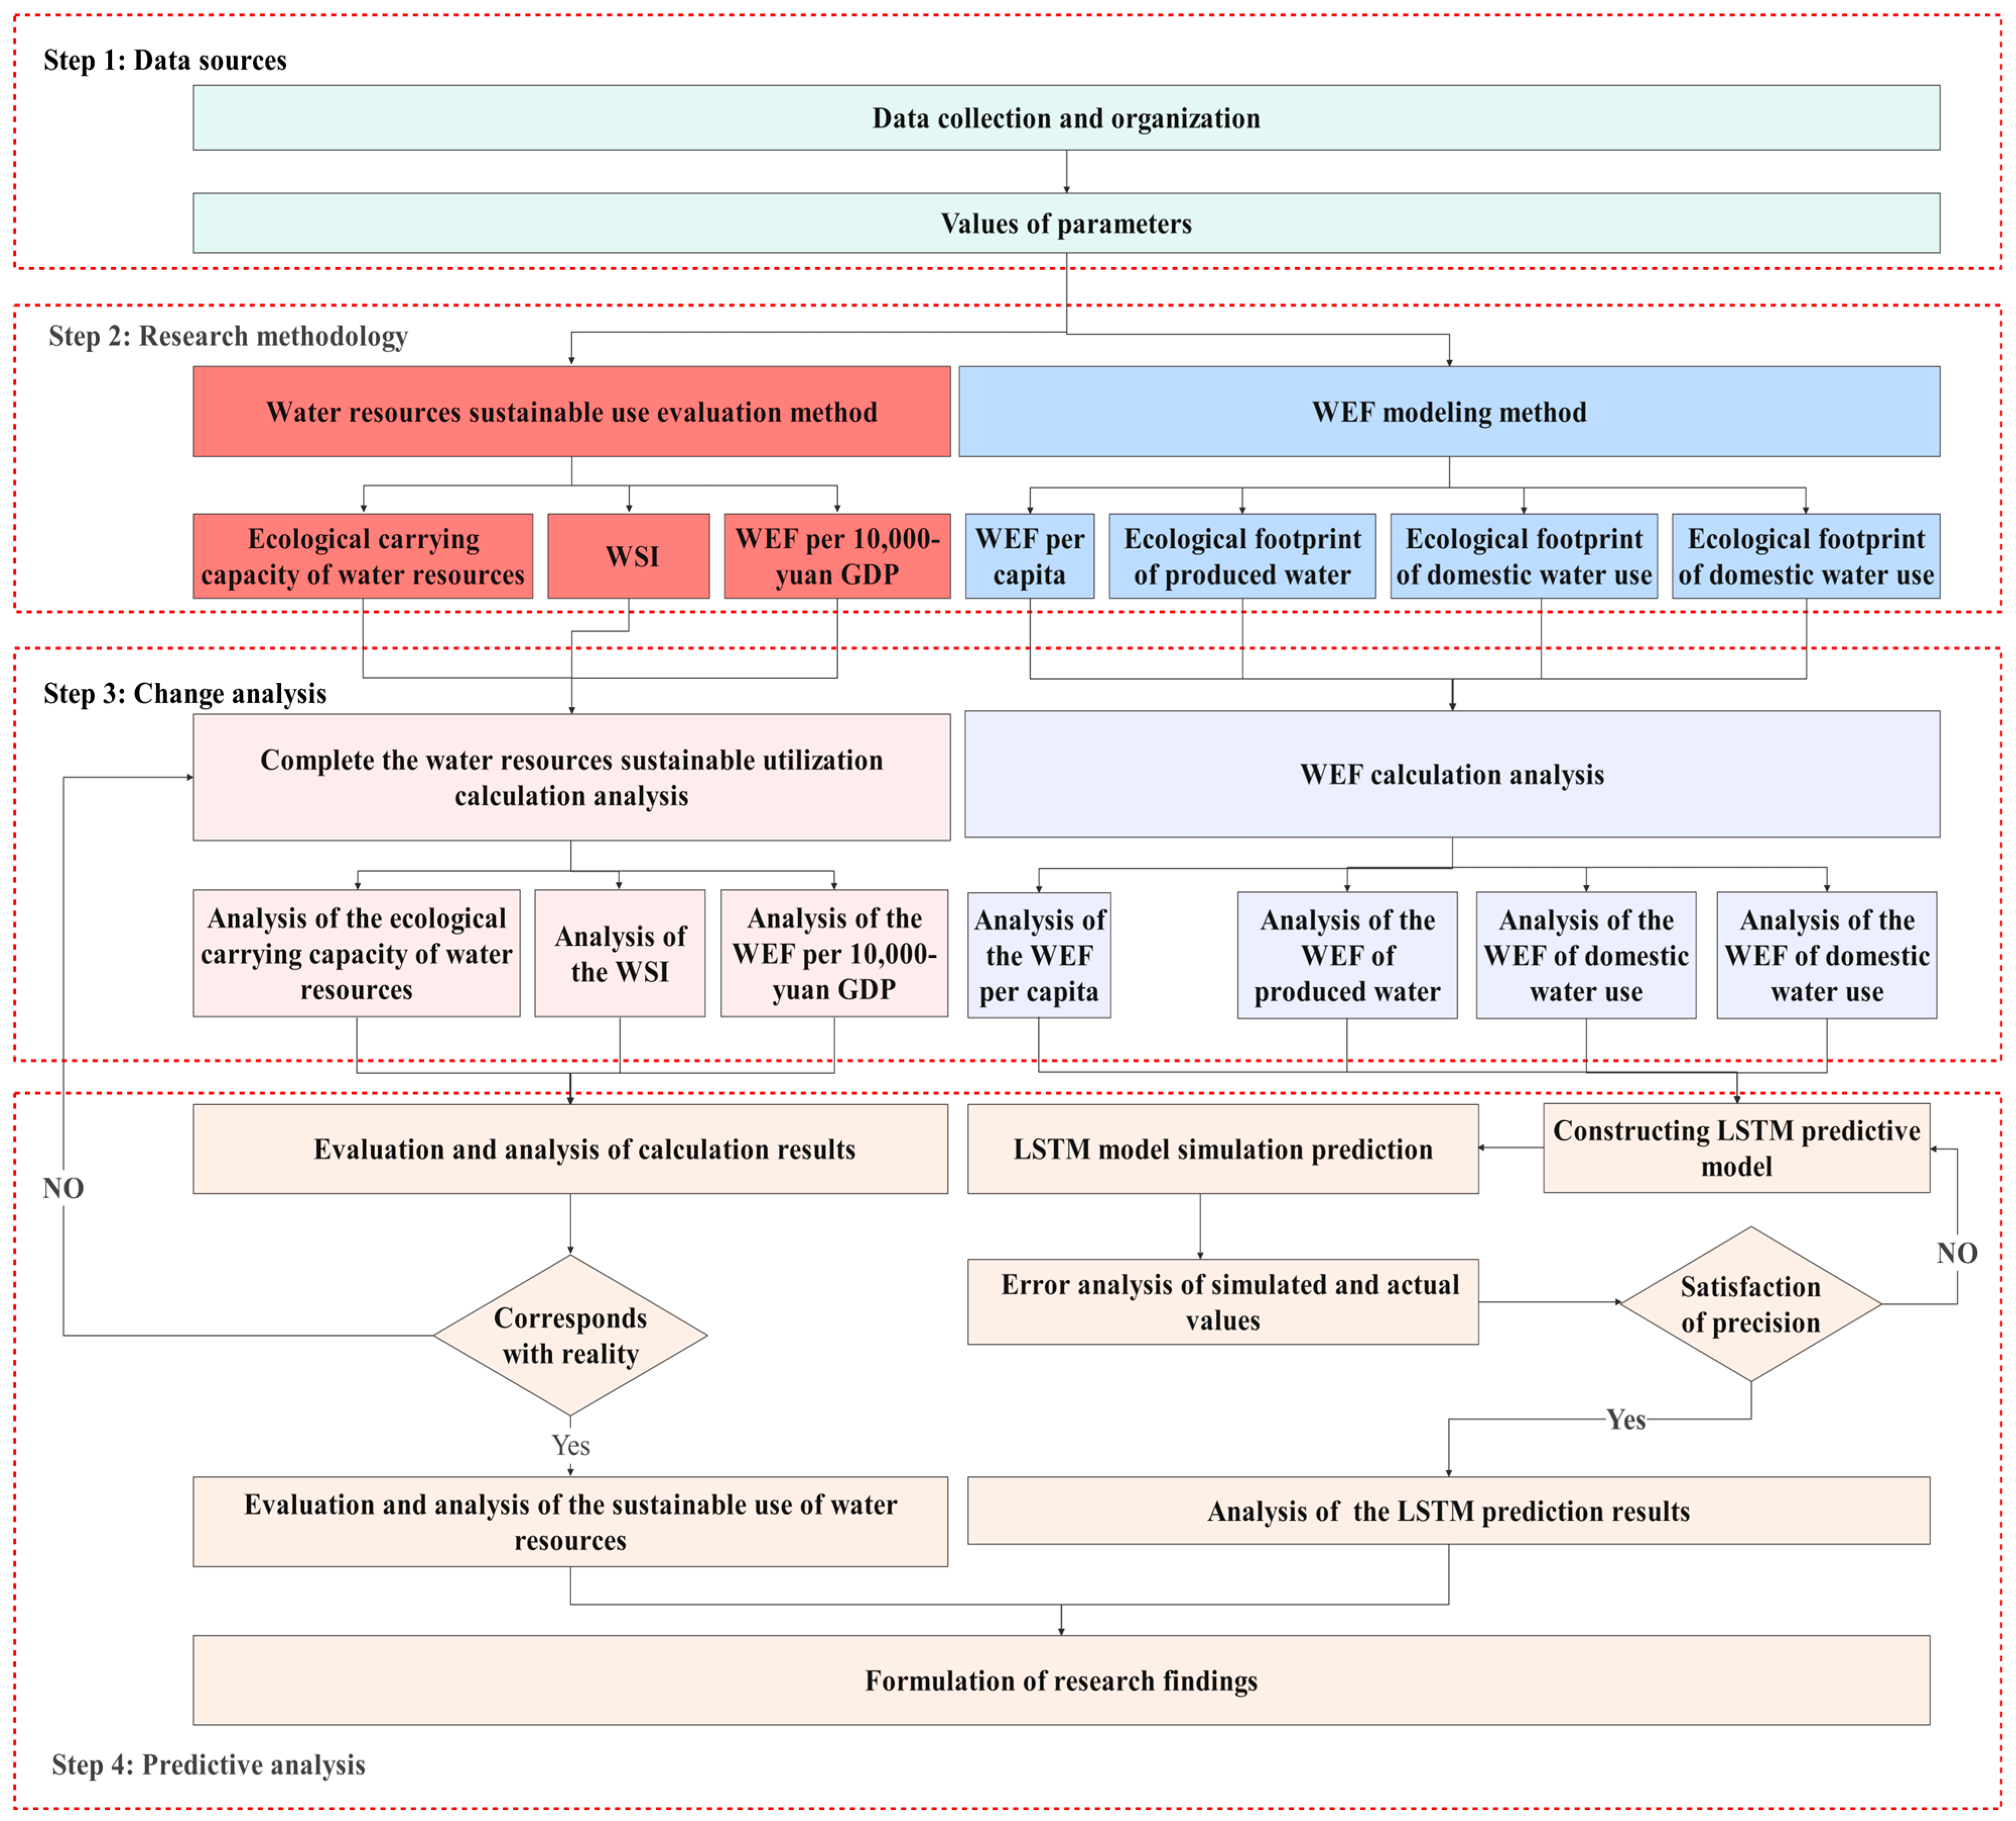
3.6. Technical Route of the Study
4. Variation Dynamics Characterization
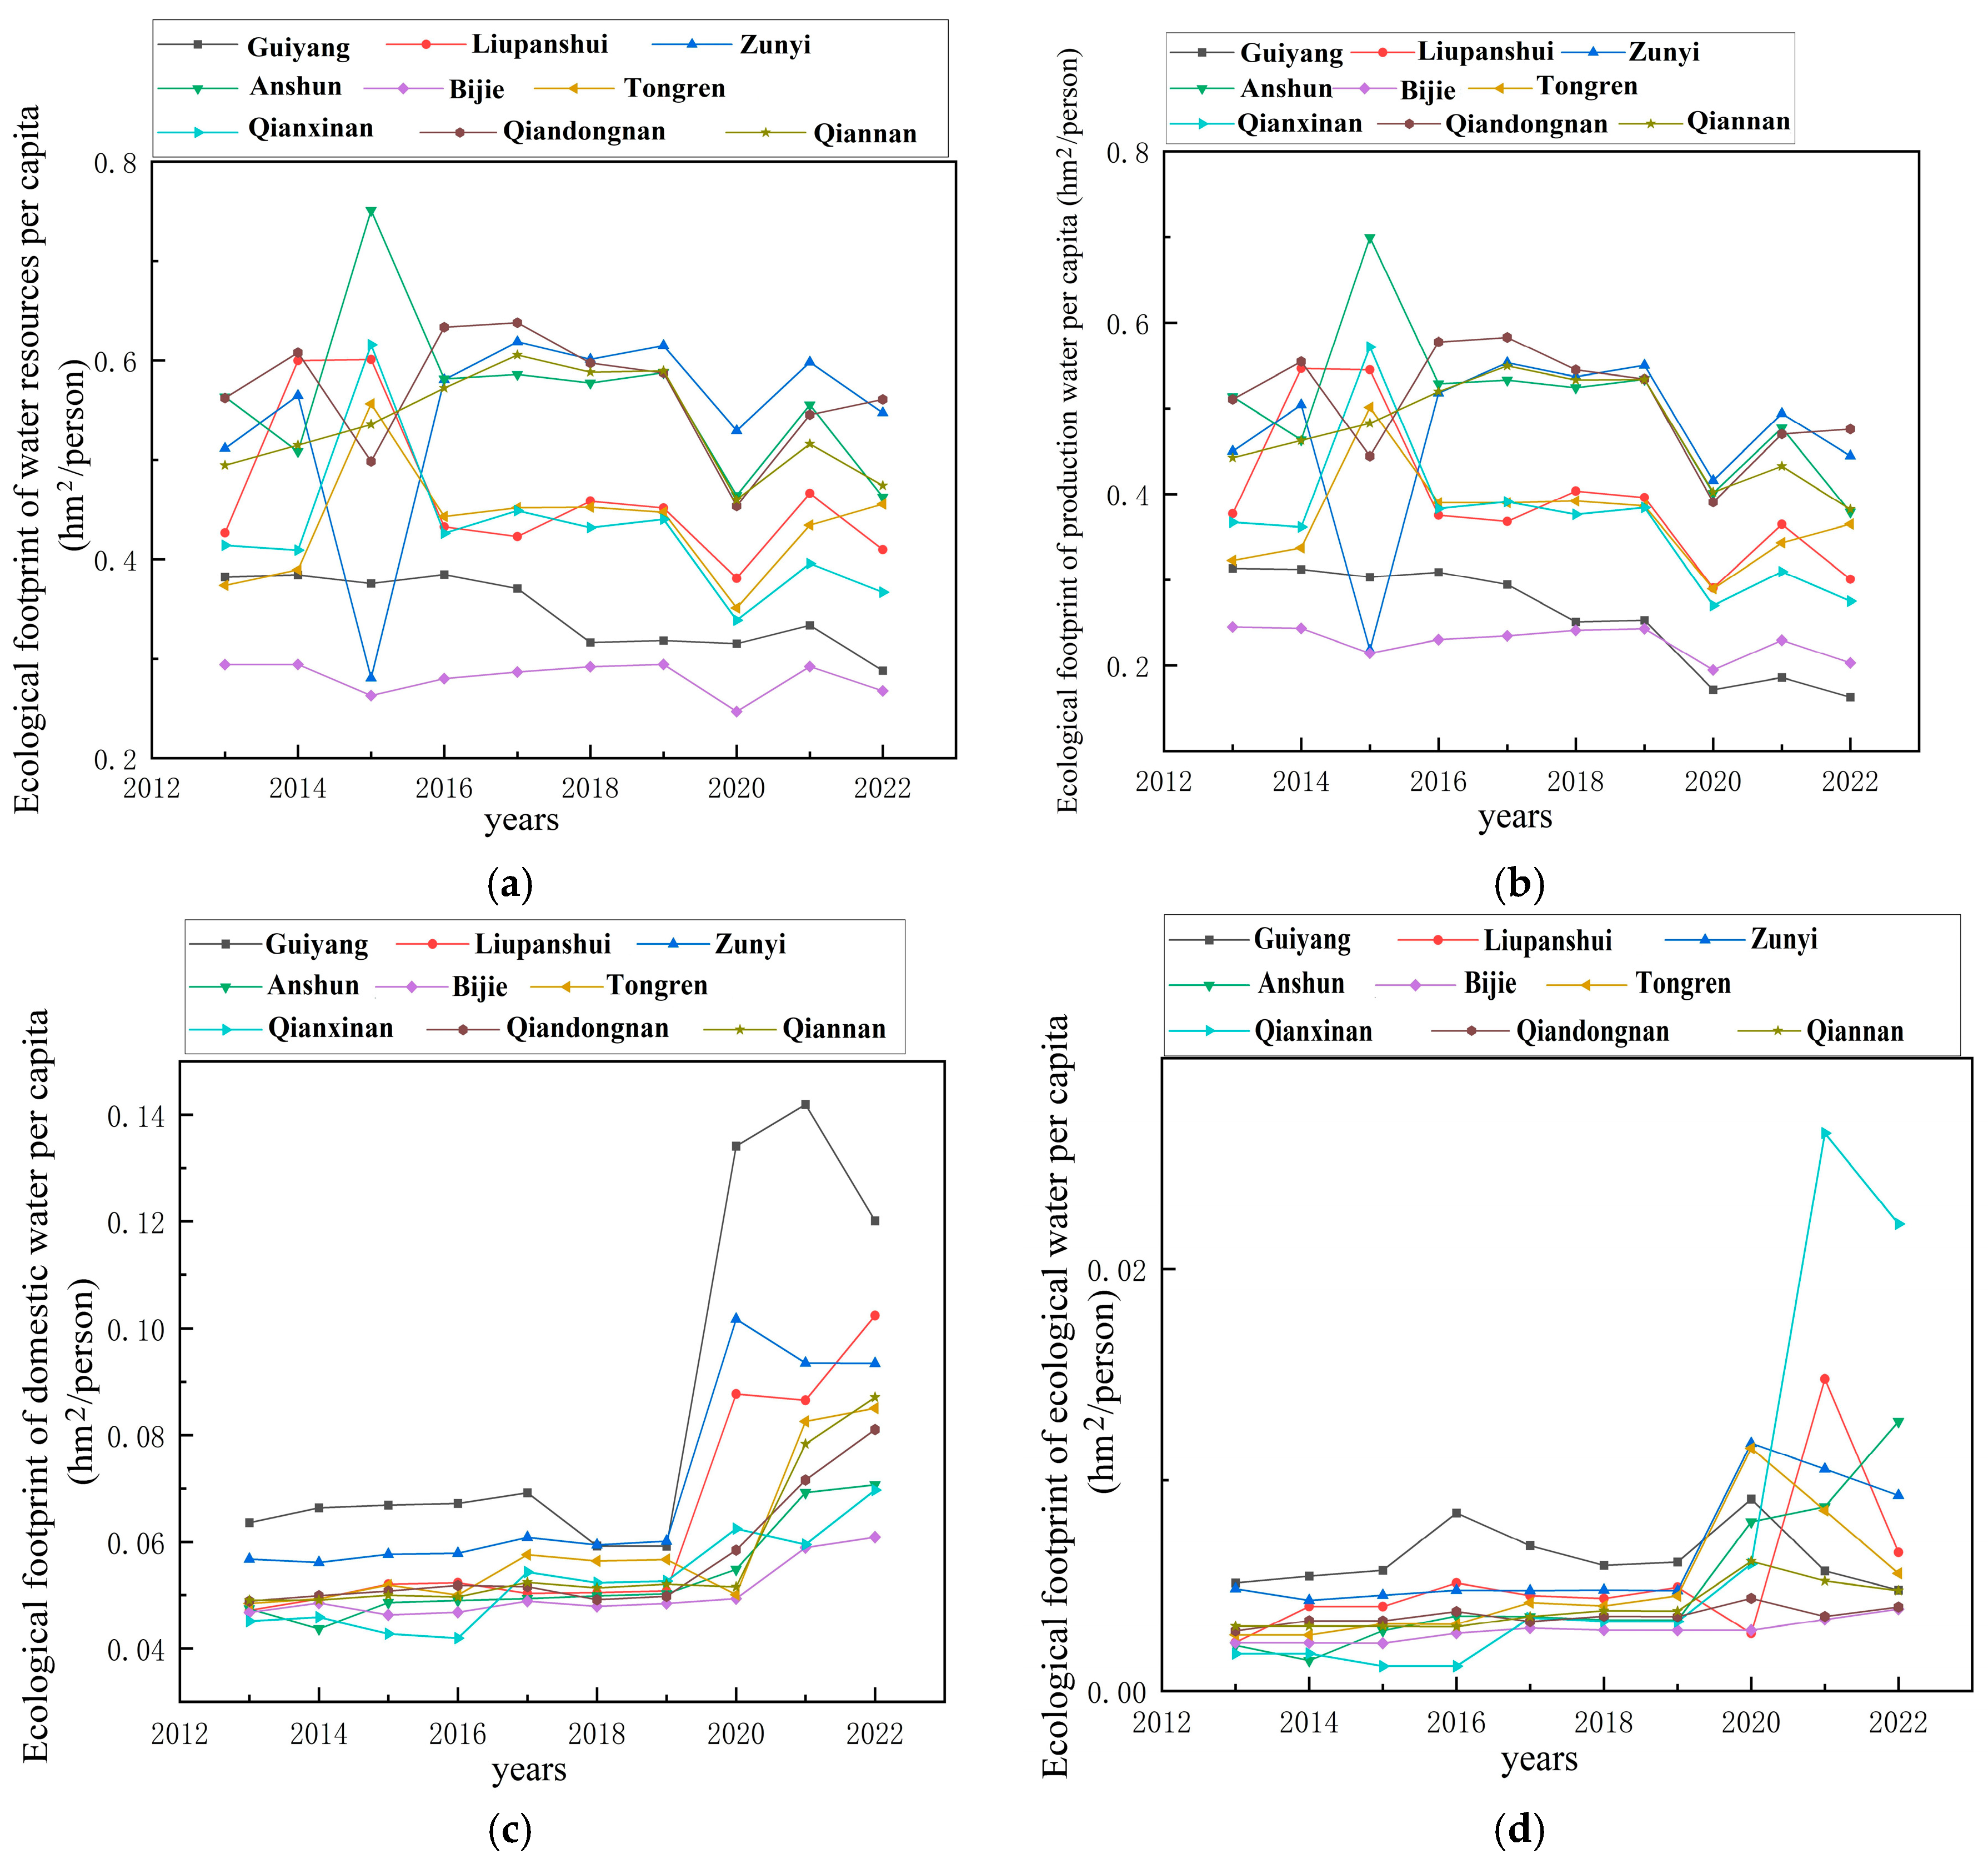
4.1. Spatiotemporal Variation in WEF Nexus Coupling Mechanisms
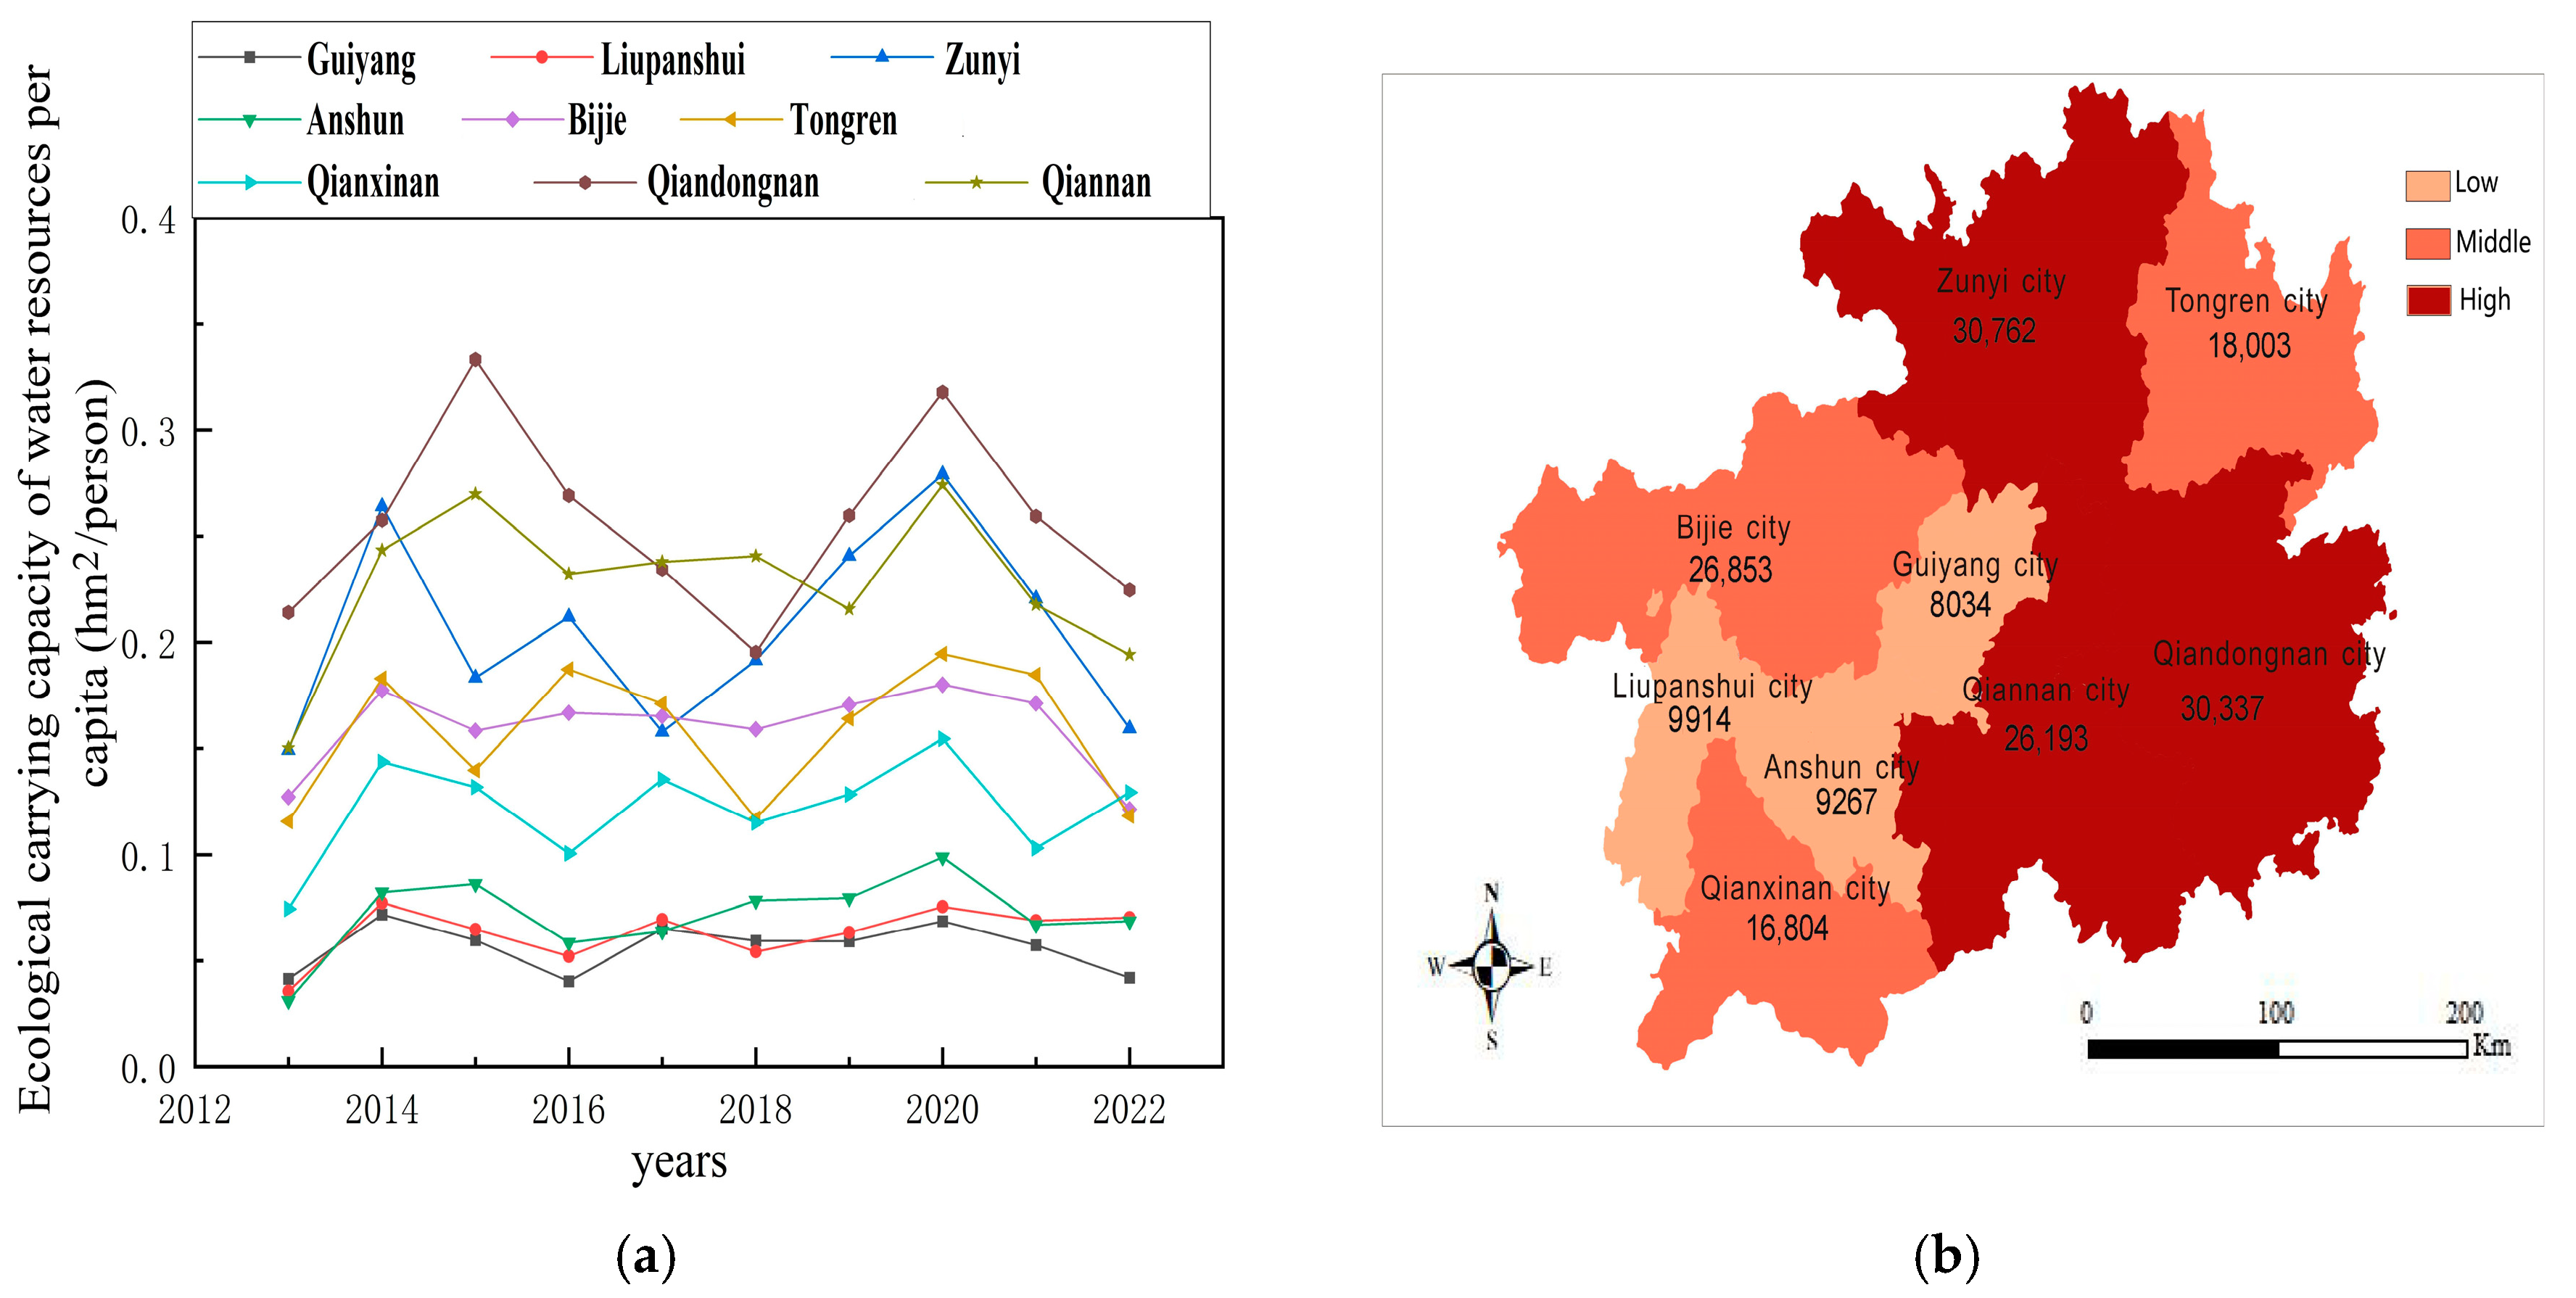
4.2. Changes in the Distribution of the WECC
4.3. Changes in the WSI
4.4. Changes in the WEF per CNY 10,000 of GDP
5. Spatiotemporal Coupling Assessment of Water–Energy–Food Nexus Footprints in Guizhou
5.1. Diagnostic Evaluation on Model Authenticity Metrics
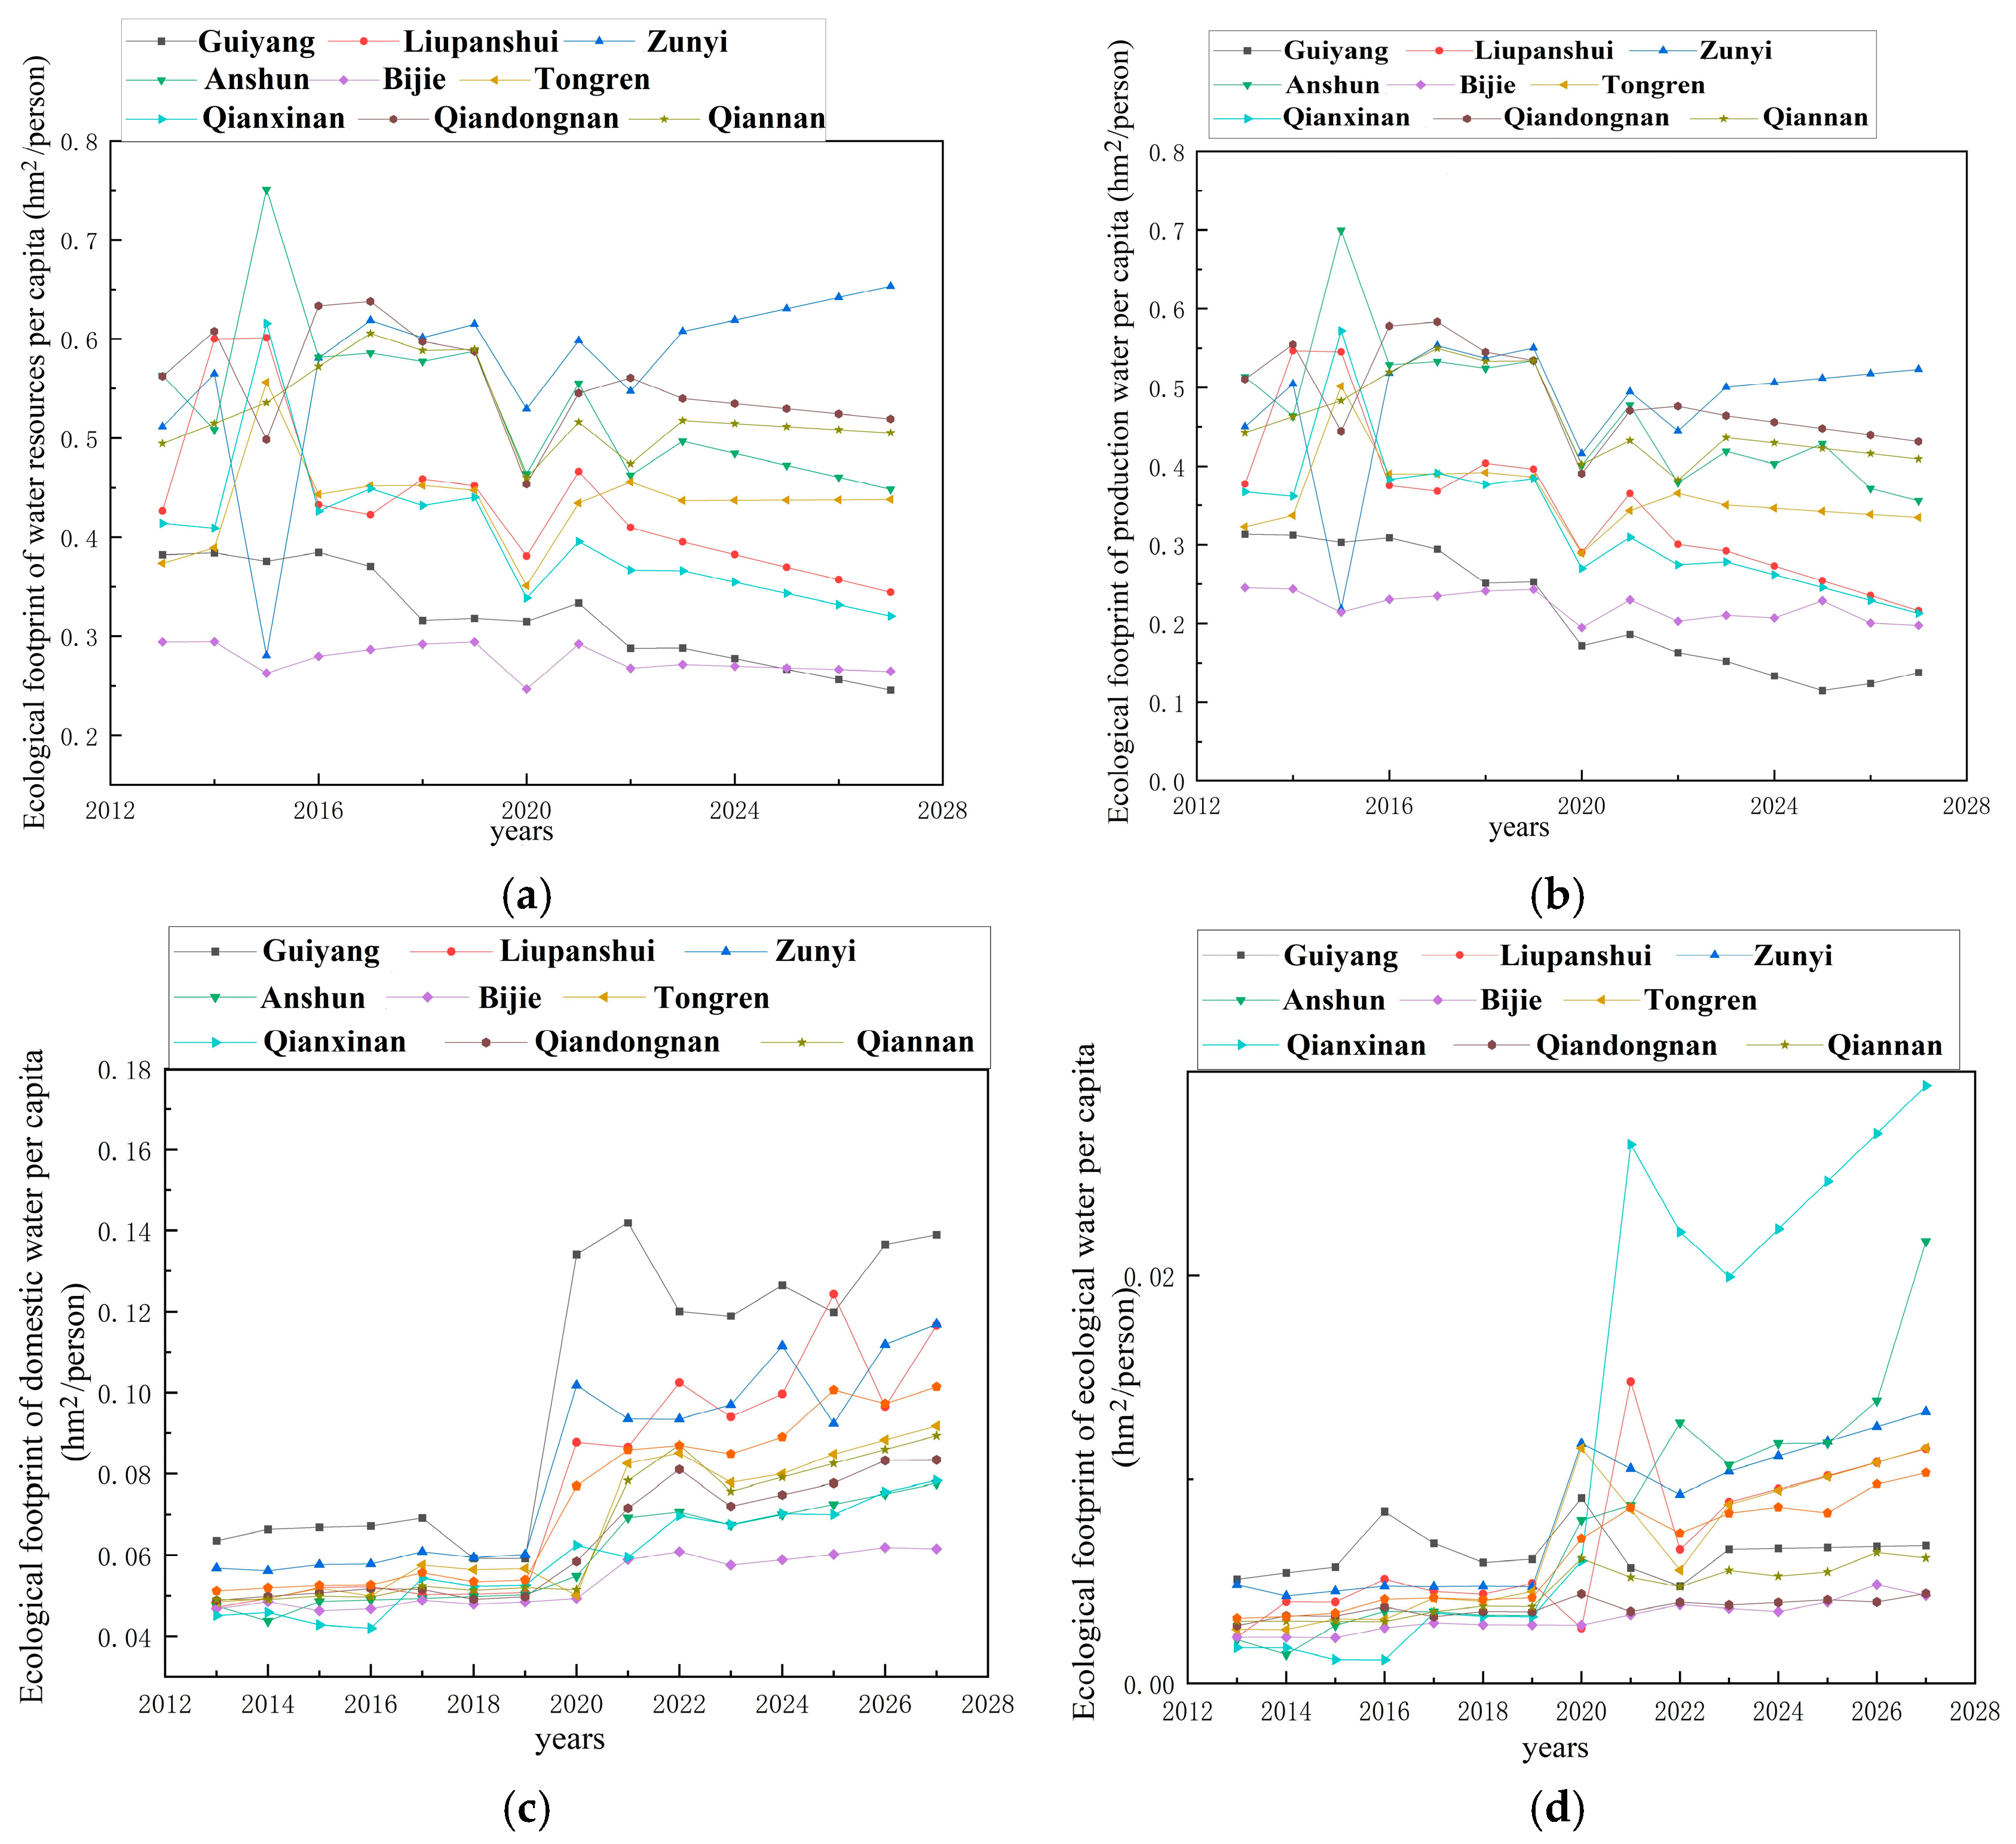
5.2. Analysis of the Projected Results
6. Conclusions
Author Contributions
Funding
Data Availability Statement
Conflicts of Interest
References
- Chen, Q. Virtual Water Shortage Risk Assessment Based on Water Quantity-Water Quality. Ph.D. Thesis, Guangdong University of Technology, Guangzhou, China, 2022. [Google Scholar]
- Sun, D.; Yu, M.; Ma, J.; Wang, H. Application of bankruptcy theory to basin water allocation under changing supply and demand scenarios. J. Yangtze River Acad. Sci. 2023, 40, 17–23+31. [Google Scholar]
- Zhao, X.; Gao, Z.; Ma, Y.; Chen, H.; Xue, B. A spatio-temporal coupling study of rural water poverty and agricultural modernization in China from 2005 to 2014. Geoscience 2018, 38, 717–726. [Google Scholar]
- Rees, W. Ecological footprints and appropriated carrying capacity: What urban economics leaves out. Environ. Urban. 1992, 4, 121–130. [Google Scholar] [CrossRef]
- Wackernagel, M.R.; Rees, W. Our Ecological Footprint: Reducing Human Impact on the Earth; New Society Publishers: Gabriola Island, BC, Canada, 1998. [Google Scholar]
- Sun, F.; Jia, Z.; Shen, J.; Xu, C.; Huang, X.; Shang, Z.; Li, S.; Zhang, S. Research on the Accounting and Spatial Effects of Emergy Ecological Footprint and Industrial Green GDP--The Case of Yangtze River Economic Belt. Ecol. Indic. 2024, 163, 112055. [Google Scholar] [CrossRef]
- Zhang, J.; Hao, X.; Li, X.; Fan, X.; Zhang, S. Evaluation and regulation strategy for ecological security in the Tarim River Basin based on the ecological footprint. J. Clean. Prod. Jan. 2024, 5, 435. [Google Scholar] [CrossRef]
- Bai, X.; Hao, G.; Li, C.; Liu, Y.; Chen, H.; Wang, S.; Dong, G.; He, H.; Zhao, Y.; Miao, Y. Interpretation of the international standard ISO14046:2014 Principles, Requirements and Guidelines for Water Footprinting in Environmental Management. Stand. Sci. 2015, 9, 56–60. [Google Scholar]
- Wackernagel, M.; Onisto, L.; Bello, P.; Linares, A.; Ina, S.; Jesus, M.; Guerrero, A.; Guerrero, M. National natural capital accounting with the ecological footprint concept. Ecol. Econ. 1999, 29, 375–390. [Google Scholar] [CrossRef]
- Huang, L.; Zhang, W.; Jiang, C.; Fan, X. Calculation method of ecological footprint of water resources. J. Ecol. 2008, 28, 1279–1286. [Google Scholar]
- Li, J. Comparison of the ecological footprint of water resources among four major urban agglomerations in China. People’s Yangtze River 2024, 55, 109–115. [Google Scholar] [CrossRef]
- Bin, Z.; Jiang, R.; Cao, Y.; Xu, K.; Han, Z. Dynamic change and prediction of ecological footprint of water resources in Beijing-Tianjin-Hebei. Water Resour. Conserv. 2023, 39, 32–38+57. [Google Scholar]
- Yang, D.; Hu, Y.; Yu, J.; Chen, Y.; Tang, H. Study on the ecological footprint and sustainability of water resources in the MinTuo River Basin. People’s Yangtze River 2023, 54, 67–75. [Google Scholar] [CrossRef]
- Qin, H.; Huang, L. Evaluation and prediction of ecological footprint of water resources in Jiangxi Province. People’s Yangtze River 2023, 54, 104–112. [Google Scholar] [CrossRef]
- Wang, G.; Dou, S.; Fan, Y.; Yu, S.; Dai, W.; Wu, Y. Spatial and temporal analysis and prediction of the ecological footprint of water resources in the lower Yellow River. Soil Water Conserv. Bull. 2023, 43, 117–123+132. [Google Scholar] [CrossRef]
- WEI, Y.; Zhu, Y.; Kang, Y. Study on the ecological footprint of water resources along the Yellow River provinces and regions based on a combined prediction model. Hydrology 2022, 42, 52–55+72. [Google Scholar] [CrossRef]
- Wang, J.; Qin, H. Analysis and prediction of ecological footprint of water resources in Hebei Province. People’s Yangtze River 2024, 55, 114–124+132. [Google Scholar]
- Chang, L.; Rui, X.; Hei, Z.; Tang, L. Safety Evaluation of Water Environment Carrying Capacity of Five Cities in Ningxia Based on Ecological Footprint of Water Resources. Asian Agric. Res. 2022, 14, 11–16. [Google Scholar]
- Ma, X.; Liu, C.; Zhang, N. Spatio-temporal pattern and prediction of agricultural blue and green water footprint scarcity index in the lower reaches of the Yellow River Basin. J. Clean. Prod. 2024, 437, 140691.1–140691.14. [Google Scholar] [CrossRef]
- Qiao, Y.; Li, Y.; Chen, Y.; Wang, T.; Hao, C. Evolution and matching characteristics of urbanization and sustainable use of water resources in Beijing-Tianjin-Hebei region. J. Water Resour. Water Eng. 2023, 34, 64–73+82. [Google Scholar]
- Zhu, G.; Zhao, C.; Zhu, W.; Tong, S. Evaluation of sustainable utilization of water resources in Jilin province based on ecological footprint model. J. China Agric. Univ. 2020, 25, 131–143. [Google Scholar]
- Zhang, W.; Liu, D.; Chen, Y. Driving factors for decoupling water resources ecological footprint and economic growth in water-deficient cities dominated by agriculture. Water Sci. Technol. A J. Int. Assoc. Water Pollut. Res. 2023, 88, 1246–1268. [Google Scholar] [CrossRef]
- National Standard Project—National Standards Information Service Platform. National Standard Plan for National Water Resources Zoning. Available online: https://std.samr.gov.cn/gb/search/gbDetailed?id=233F23C71D8B3291E06397BE0A0ADA7E (accessed on 16 April 2025).
- Ministry of Ecology and Environment of the People’s Republic of China. *Notice on Issuing the Technical Specifications for Environmental Impact Assessment of Construction Projects—Ecological Impact*. [Announcement No. 1087810]. 10 October 2024. Available online: https://www.mee.gov.cn/xxgk2018/xxgk/xxgk06/202410/t20241010_1087810.html (accessed on 16 April 2025).
- Guizhou Hydrology and Water Resources Bureau. Surface Water Resources of Guizhou Province; China Water Resources and Hydropower Press: Beijing, China, 2023.
- People’s Government of Guizhou Province. Circular of the General Office of the Provincial People’s Government on the Issuance of the Three-Year Action Plan for the Construction of Water Networks in Guizhou Province (2023–2025) (Qianfu Banhan [2023] No. 23) [EB/OL]. (2023-05-18). Available online: https://www.guizhou.gov.cn/zwgk/zcfg/szfwj/qfbh/202305/t20230518_79785839.html (accessed on 16 April 2025).
- Zhang, Q.; Xie, S. Analysis and evaluation of sustainable utilization of water resources in Chongqing based on water ecological footprint model. J. Irrig. Drain. 2019, 38, 93–100. [Google Scholar]
- Ren, Z.; Huang, Q.; Li, J. Quantitative analysis of ecological security and spatial differences in Shaanxi Province. J. Geogr. 2005, 60, 597–606. [Google Scholar]
- Ma, C.; Liu, T. Survey of short-term traffic flow prediction based on LSTM. Int. J. Mod. Phys. C Comput. Phys. Phys. Comput. 2025, 36, 1–23. [Google Scholar] [CrossRef]
- Ren, D.; Hu, Q.; Zhang, T. EKLT: Kolmogorov-Arnold attention-driven LSTM with Transformer model for river water level prediction. J. Hydrol. 2025, 649, 132430. [Google Scholar] [CrossRef]
- Pai, P. Study on water resources potential assessment in Chongqing based on LSTM deep learning model. Water Resour. Plan. Des. 2021, 2, 41–45. [Google Scholar]
- Li, T.; Zeng, X. Water-sand simulation in the Yanhe River basin based on particle swarm algorithm optimized support vector machine. J. Appl. Basic Eng. Sci. 2015, 23, 79–87. [Google Scholar] [CrossRef]
- Wang, Y.; Liu, J.; Li, R.; Suo, X.; Lu, E. Medium and Long-term Precipitation Prediction Using Wavelet Decomposition-prediction-reconstruction Model. Water Resour. Manag. 2020, 37, 1473–1483. [Google Scholar] [CrossRef]


| City (State) | Zonal Ecological Balance Status (Surpluses/Deficits) of Water Resources (hm2/Person) | |||||||||
|---|---|---|---|---|---|---|---|---|---|---|
| 2013 | 2014 | 2015 | 2016 | 2017 | 2018 | 2019 | 2020 | 2021 | 2022 | |
| Guiyang | 0.024 | 0.054 | 0.042 | 0.022 | 0.047 | 0.041 | 0.040 | 0.050 | 0.037 | 0.024 |
| Liupanshui | 0.023 | 0.060 | 0.047 | 0.039 | 0.057 | 0.040 | 0.050 | 0.064 | 0.055 | 0.058 |
| Zunyi | 0.118 | 0.229 | 0.166 | 0.176 | 0.119 | 0.152 | 0.200 | 0.244 | 0.181 | 0.123 |
| Anshun | 0.018 | 0.071 | 0.069 | 0.045 | 0.050 | 0.064 | 0.065 | 0.087 | 0.053 | 0.057 |
| Bijie | 0.108 | 0.158 | 0.141 | 0.148 | 0.146 | 0.139 | 0.150 | 0.163 | 0.151 | 0.103 |
| Tongren | 0.104 | 0.171 | 0.122 | 0.173 | 0.157 | 0.102 | 0.149 | 0.183 | 0.170 | 0.103 |
| Qianxinan | 0.063 | 0.132 | 0.114 | 0.088 | 0.122 | 0.102 | 0.115 | 0.144 | 0.091 | 0.118 |
| Qiandongnan | 0.194 | 0.236 | 0.316 | 0.247 | 0.212 | 0.173 | 0.238 | 0.301 | 0.239 | 0.204 |
| Qiannan | 0.134 | 0.227 | 0.252 | 0.213 | 0.218 | 0.220 | 0.195 | 0.258 | 0.200 | 0.178 |
| City (State) | WEF (hm2/Person) | Evaluation of Results | ||||||
|---|---|---|---|---|---|---|---|---|
| 2020 | 2021 | 2022 | MAPE | RMSE | ||||
| Guiyang | Actual Value | 0.0189 | 0.0204 | 0.0179 | 0.0287 | 0.0007 | 0.5785 | 0.5042 |
| Predicted Value | 0.0187 | 0.0192 | 0.0182 | |||||
| Liupanshui | Actual Value | 0.0116 | 0.0141 | 0.0124 | 0.0507 | 0.0007 | 0.6780 | 0.5675 |
| Predicted Value | 0.0121 | 0.0145 | 0.0134 | |||||
| Zunyi | Actual Value | 0.035 | 0.0394 | 0.0361 | 0.0250 | 0.0011 | 0.6441 | 0.6662 |
| Predicted Value | 0.0361 | 0.0379 | 0.0359 | |||||
| Anshun | Actual Value | 0.0115 | 0.0137 | 0.0114 | 0.0505 | 0.0006 | 0.6538 | 0.6391 |
| Predicted Value | 0.012 | 0.0141 | 0.0123 | |||||
| Bijie | Actual Value | 0.017 | 0.02 | 0.0182 | 0.0300 | 0.0006 | 0.7901 | 0.7259 |
| Predicted Value | 0.0166 | 0.021 | 0.0179 | |||||
| Tongren | Actual Value | 0.0116 | 0.0143 | 0.0149 | 0.0492 | 0.0007 | 0.7727 | 0.7832 |
| Predicted Value | 0.0122 | 0.015 | 0.0156 | |||||
| Qianxinnan | Actual Value | 0.0102 | 0.0119 | 0.012 | 0.0652 | 0.0009 | 0.5106 | −0.2948 |
| Predicted Value | 0.01 | 0.0104 | 0.0114 | |||||
| Qiandongnan | Actual Value | 0.0171 | 0.0204 | 0.021 | 0.0233 | 0.0005 | 0.8727 | 0.9116 |
| Predicted Value | 0.0169 | 0.0211 | 0.0215 | |||||
| Qiannan | Actual Value | 0.0161 | 0.018 | 0.0165 | 0.0154 | 0.0003 | 0.7857 | 0.8505 |
| Predicted Value | 0.0163 | 0.0175 | 0.0166 | |||||
Disclaimer/Publisher’s Note: The statements, opinions and data contained in all publications are solely those of the individual author(s) and contributor(s) and not of MDPI and/or the editor(s). MDPI and/or the editor(s) disclaim responsibility for any injury to people or property resulting from any ideas, methods, instructions or products referred to in the content. |
© 2025 by the authors. Licensee MDPI, Basel, Switzerland. This article is an open access article distributed under the terms and conditions of the Creative Commons Attribution (CC BY) license (https://creativecommons.org/licenses/by/4.0/).
Share and Cite
Wang, Y.; Yang, W.; Liu, J.; Lu, E.; Li, Y.; Chen, N. Comparison and Prediction of the Ecological Footprint of Water Resources—Taking Guizhou Province as an Example. Hydrology 2025, 12, 99. https://doi.org/10.3390/hydrology12050099
Wang Y, Yang W, Liu J, Lu E, Li Y, Chen N. Comparison and Prediction of the Ecological Footprint of Water Resources—Taking Guizhou Province as an Example. Hydrology. 2025; 12(5):99. https://doi.org/10.3390/hydrology12050099
Chicago/Turabian StyleWang, Yongtao, Wenfeng Yang, Jian Liu, Enhui Lu, Ye Li, and Ning Chen. 2025. "Comparison and Prediction of the Ecological Footprint of Water Resources—Taking Guizhou Province as an Example" Hydrology 12, no. 5: 99. https://doi.org/10.3390/hydrology12050099
APA StyleWang, Y., Yang, W., Liu, J., Lu, E., Li, Y., & Chen, N. (2025). Comparison and Prediction of the Ecological Footprint of Water Resources—Taking Guizhou Province as an Example. Hydrology, 12(5), 99. https://doi.org/10.3390/hydrology12050099