River Stage Variability and Extremes in the Itacaiúnas Basin in the Eastern Amazon: Machine Learning-Based Modeling
Abstract
1. Introduction
2. Materials and Methods
2.1. Study Area and Databases
2.2. Statistical and Computational Methods
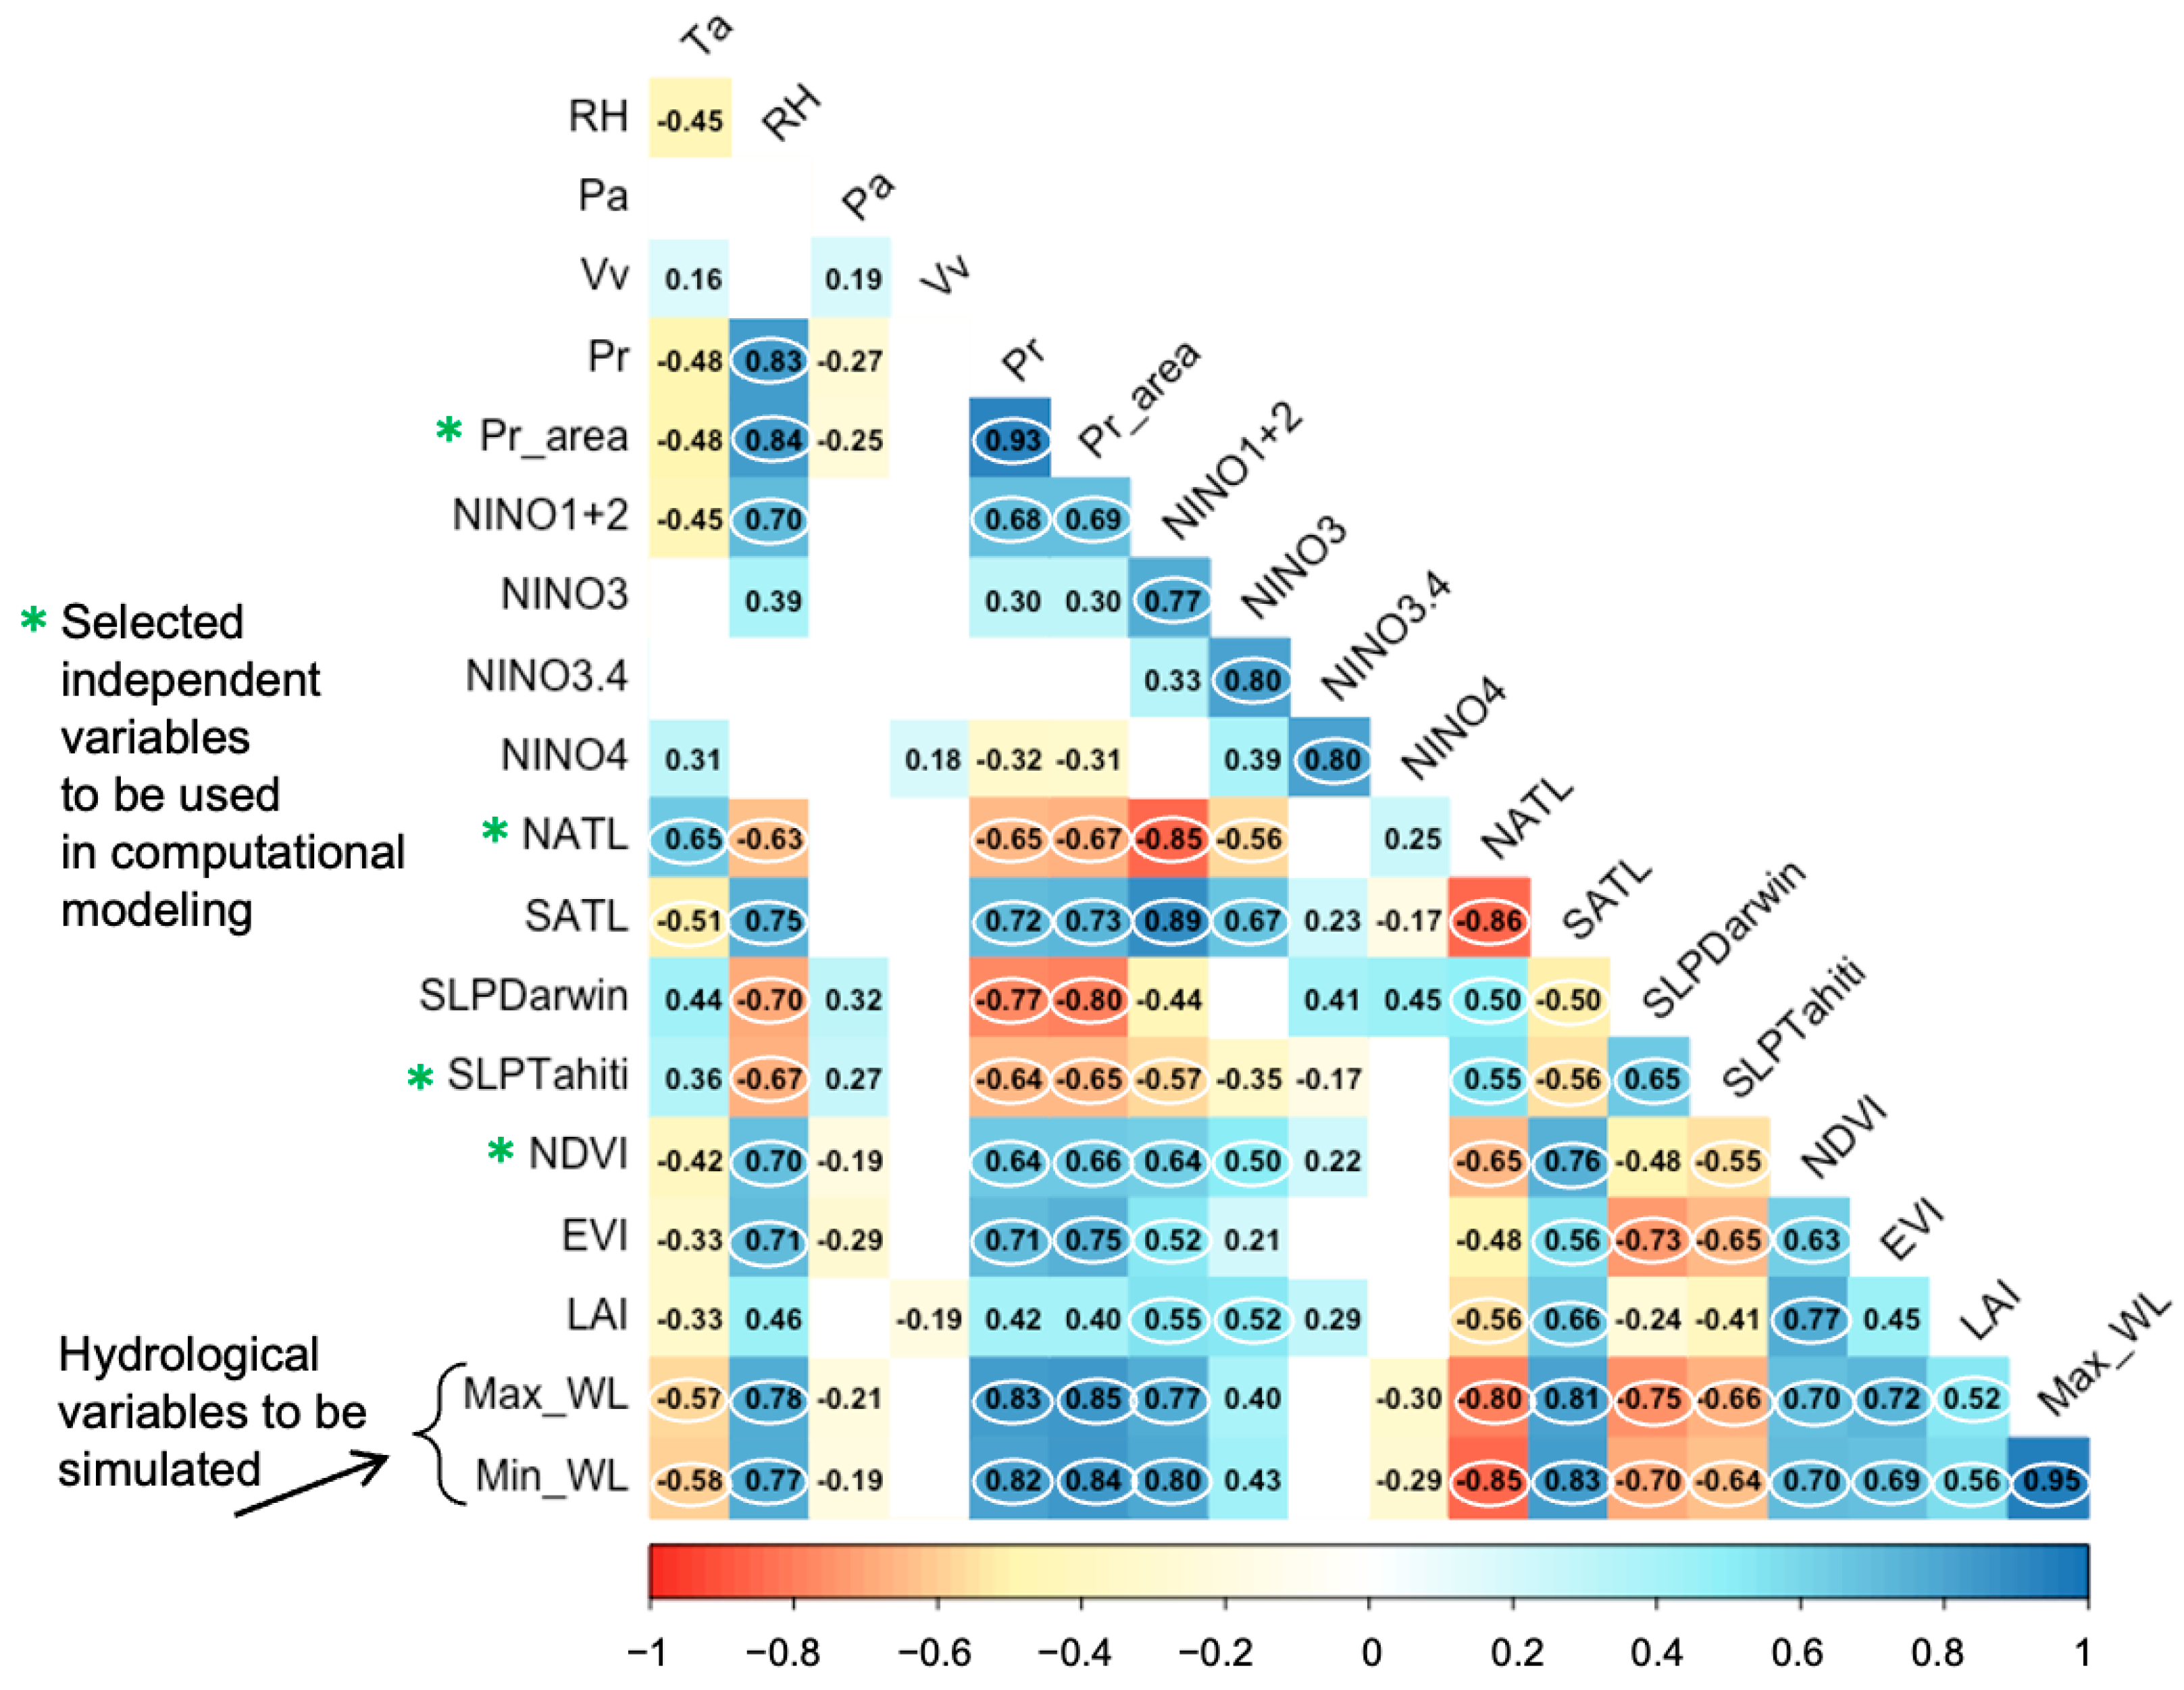
2.2.1. Spearman Correlation
2.2.2. Data Normalization
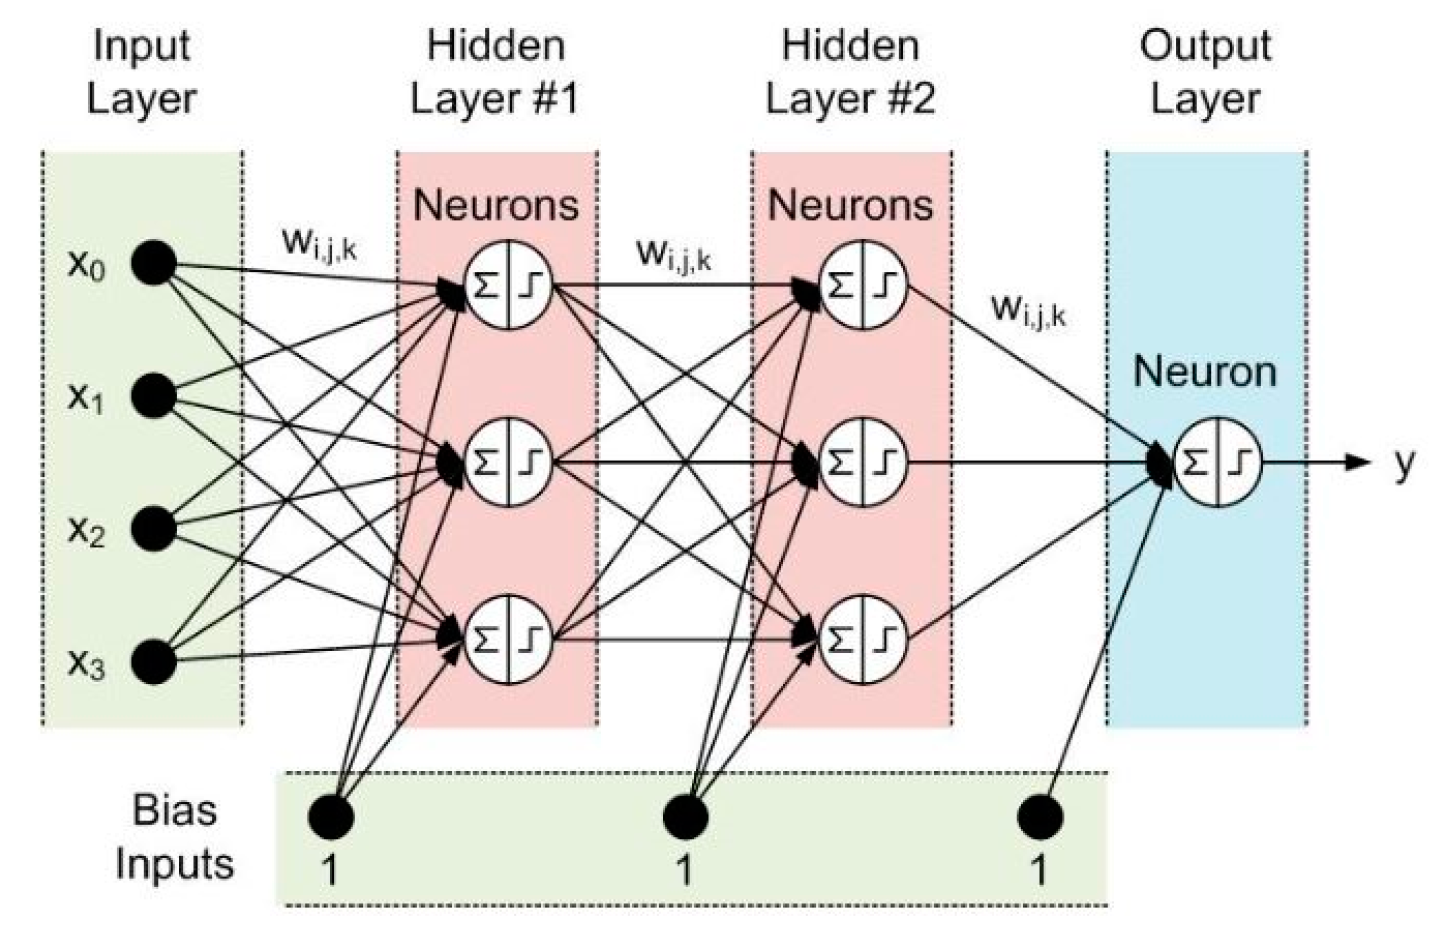
2.2.3. Artificial Neural Networks (ANNs)
2.2.4. Support Vector Machine (SVM)
2.2.5. Setup of Computational Simulations and Performance Analysis
- A network with 1 hidden layer was assembled, with the number of neurons varying from 5 to 30 neurons.
- An additional hidden layer was incorporated in which each value from the first hidden layer used was combined with all the values from the second hidden layer, with the latter also varying from 5 to 5 neurons.
3. Results
3.1. Correlation Analysis and Objective Selection of Independent Variables
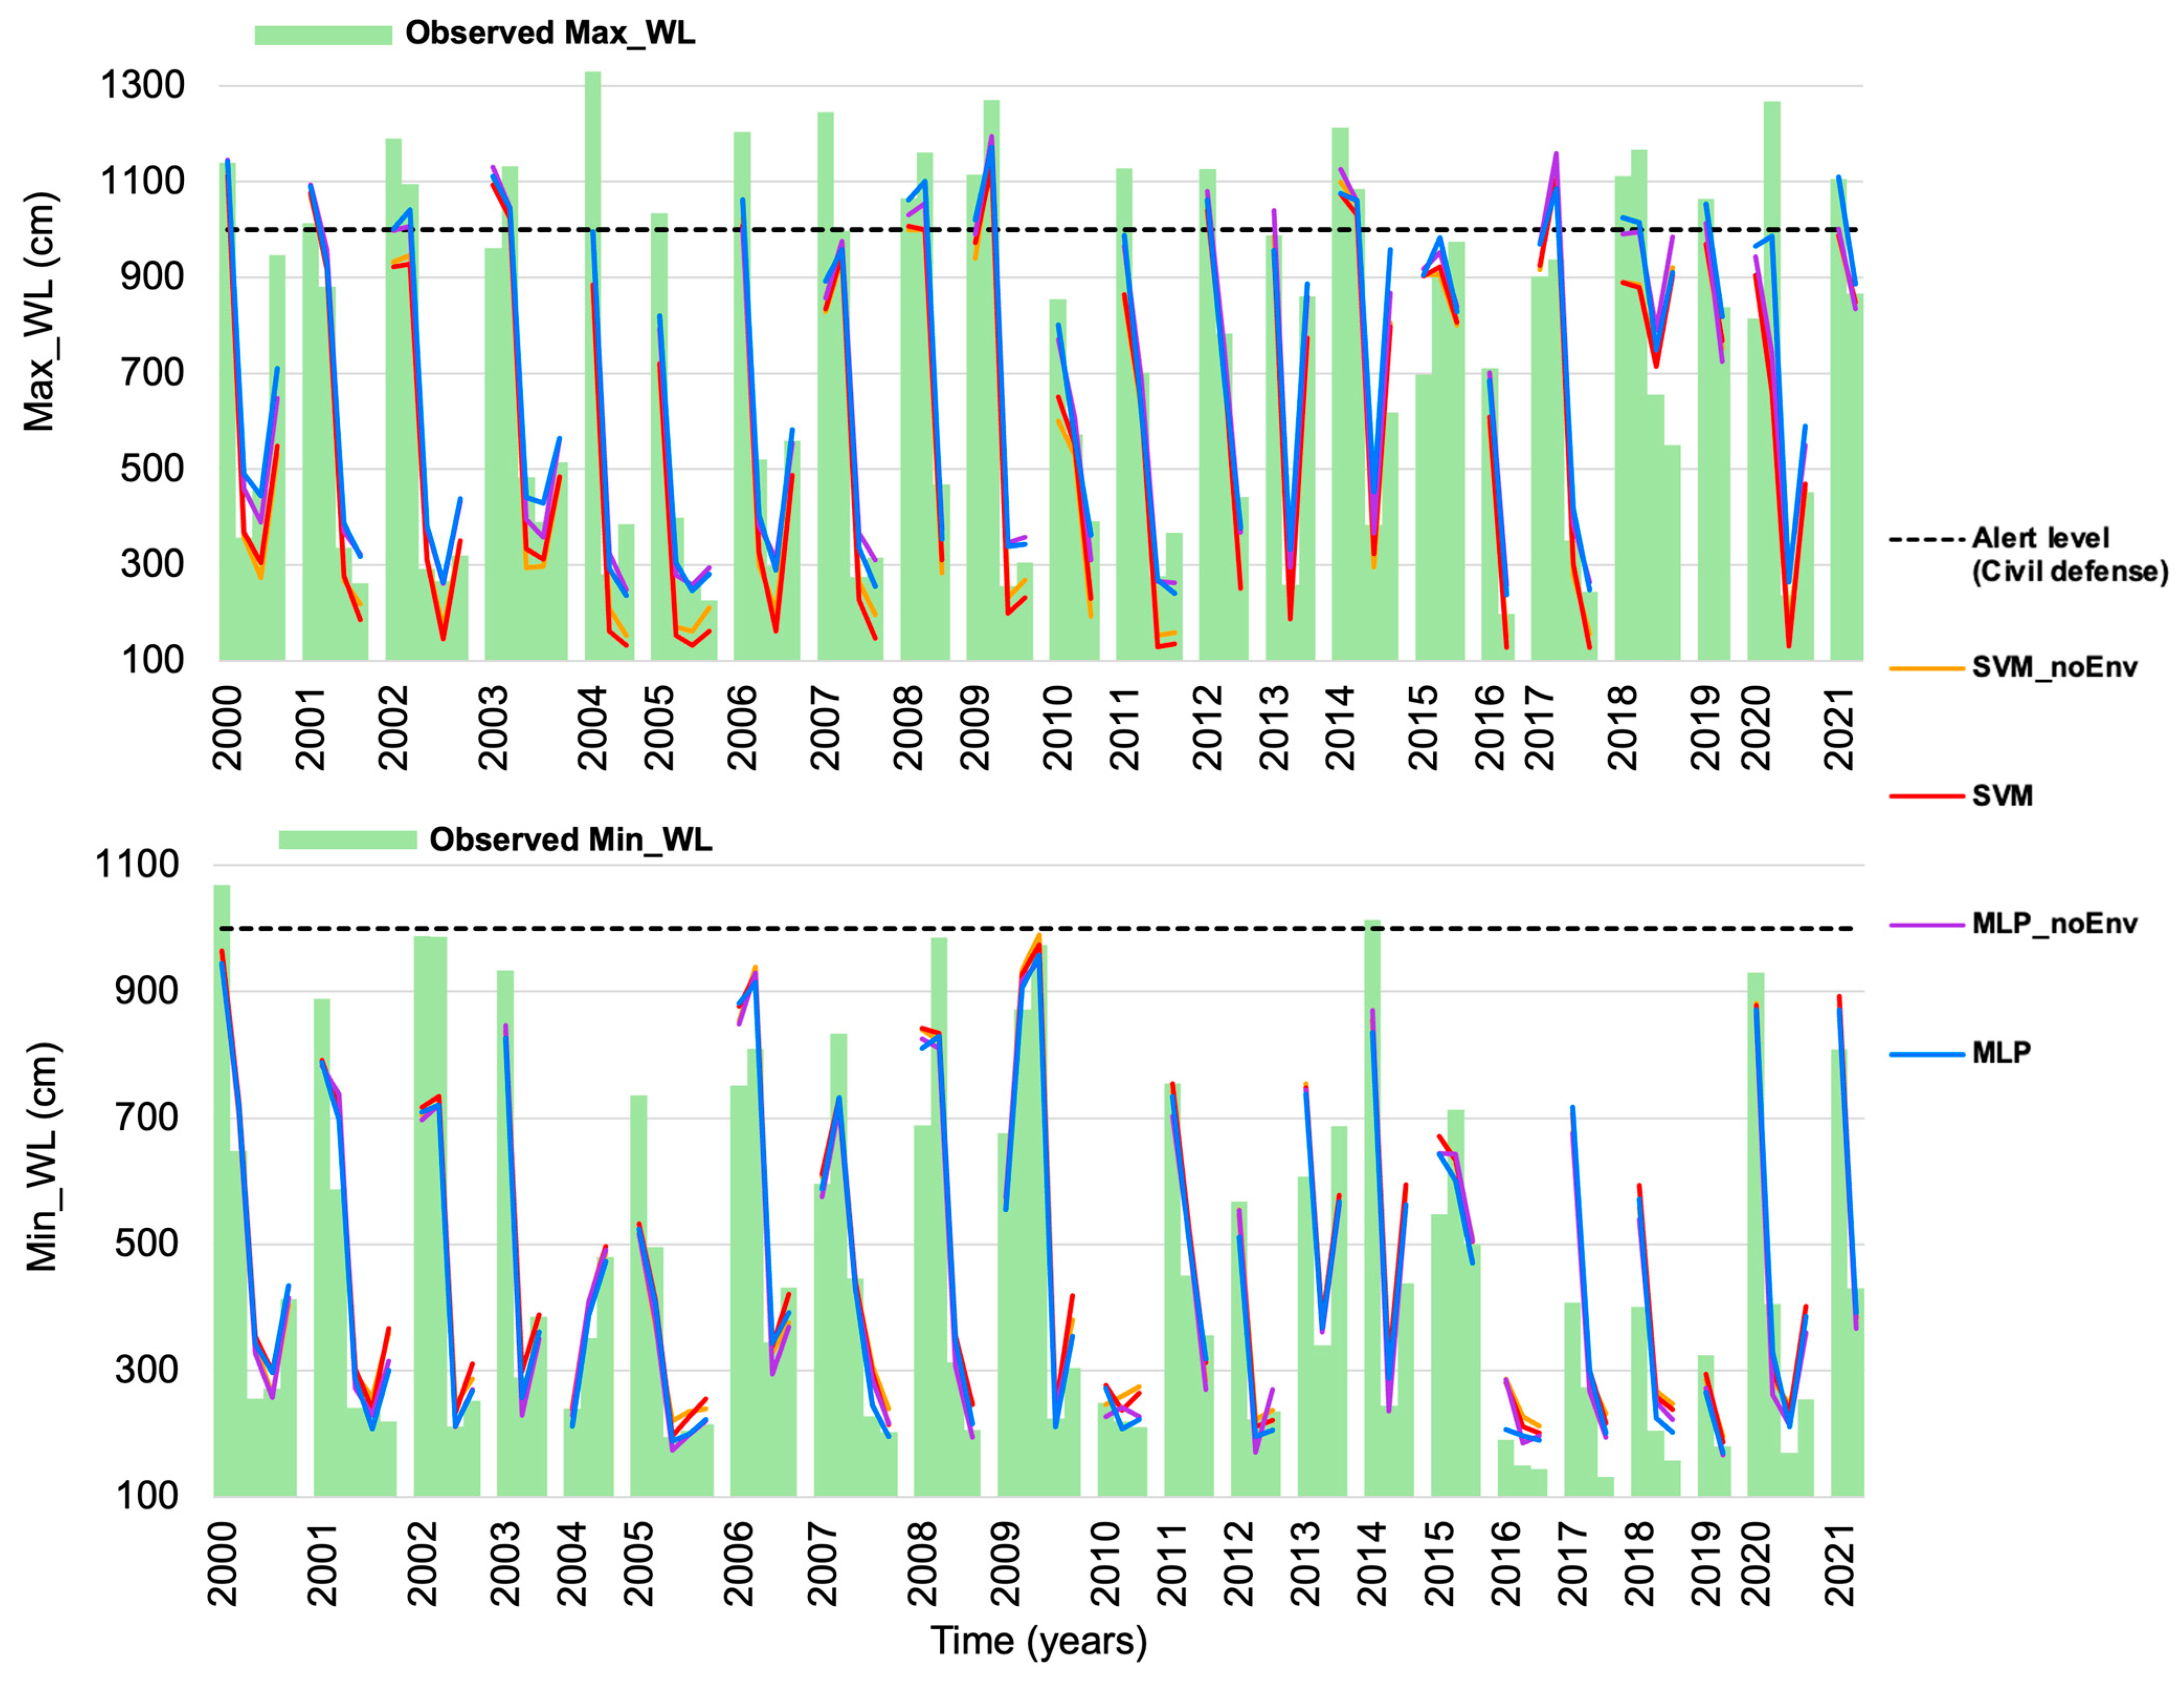
3.2. Observations and Simulations over the Whole Period, Including Extreme Hydrological Years with Natural Disasters
3.3. Analysis of Seasonal Hydrological Regimes
4. Discussion
5. Conclusions
Author Contributions
Funding
Data Availability Statement
Acknowledgments
Conflicts of Interest
Appendix A
| Max_WL | Min_WL |
|---|---|
| Mar-00, Jul-00, Oct-00, Nov-00 Mar-01, Apr-01, Jul-01, Aug-01, Jan-02, Feb-02, Jul-02, Sep-02, Oct-02 Jan-03, Mar-03, Jun-03, Oct-03, Nov-03 Jan-04, Aug-04, Oct-04, Jan-05, Jul-05, Aug-05, Sep-05 Apr-06, Jun-06, Aug-06, Nov-06 Jan-07, Mar-07, Jul-07, Sep-07 Feb-08, Mar-08, Jun-08 Mar-09, Apr-09, Aug-09, Sep-09 Apr-10, May-10, Jun-10, Apr-11, May-11, Aug-11, Sep-11 Jan-12, Apr-12, Jun-12, Apr-13, Sep-13, Dec-13 Feb-14, Mar-14, Oct-14, Dec-14 Jan-15, Feb-15, Apr-15 Feb-16, Aug-16 Jan-17, Feb-17, Jun-17, Aug-17 Jan-18, Feb-18, Nov-18, Dec-18 Mar-19, Apr-19 Jan-20, Feb-20, Aug-20, Nov-20 Feb-21, Apr-21 | Mar-00, Apr-00, Jul-00, Oct-00, Nov-00 Mar-01, Apr-01, Jul-01, Aug-01, Sep-01 Jan-02, Feb-02, Aug-02, Oct-02 Mar-03, Oct-03, Nov-03 Aug-04, Nov-04, Dec-04 Jan-05, May-05, Aug-05, Sep-05, Oct-05 Jan-06, Fev-06, Jun-06, Nov-06 Jan-07, Mar-07, Apr-07, Jul-07, Sep-07 Fev-08, Mar-08, Jun-08, Sep-08 Jan-09, fev-09, Apr-09, Aug-09, Oct-09 Jun-10, Jul-10, Sep-10 Jan-11, May-11, Jun-11 Apr-12, Sep-12, Oct-12 Apr-13, Nov-13, Dec-13 Mar-14, Oct-14, Dec-14 Jan-15, Apr-15, May-15 Jul-16, Aug-16, Sep-16 Jan-17, Jun-17, Aug-17 Jun-18, Jul-18, Aug-18 Jul-19, Aug-19 Mar-20, Jun-20, Aug-20, Nov-20 Mar-21, Jun-21 |
References
- Paiva, R.C.D.; Buarque, D.C.; Collischonn, V.; Bonnet, M.-P.; Frappart, F.; Calmant, S.; Mendes, C.A.B. Large-scale hydrologic and hydrodynamic modeling of the Amazon River basin. Water Resour. Res. 2013, 49, 1226–1243. [Google Scholar] [CrossRef]
- Towner, J.; Cloke, H.L.; Zsoter, E.; Flamig, Z.; Hoch, J.M.; Bazo, J.; Coughlan de Perez, E.; Stephens, E.M. Assessing the performance of global hydrological models for capturing peak river flows in the Amazon basin. Hydrol. Earth Syst. Sci. 2019, 23, 3057–3080. [Google Scholar] [CrossRef]
- Marengo, J.A.; Souza, C.M., Jr.; Thonicke, K.; Burton, C.; Halladay, K.; Betts, R.A.; Alves, L.M.; Soares, W.R. Changes in Climate and Land Use Over the Amazon Region: Current and Future Variability and Trends. Front. Earth Sci. 2018, 6, 228. [Google Scholar] [CrossRef]
- Gloor, M.; Brienen, R.J.W.; Galbraith, D.; Feldpausch, T.R.; Schöngart, J.; Guyot, J.-L.; Espinoza, J.C.; Lloyd, J.; Phillips, O.L. Intensification of the Amazon hydrological cycle over the last two decades. Geophys. Res. Lett. 2013, 40, 1729–1733. [Google Scholar] [CrossRef]
- Barichivich, J.; Gloor, E.; Peylin, P.; Brienen, R.J.W.; Schöngart, J.; Espinoza, J.C.; Pattnayak, K.C. Recent intensification of Amazon flooding extremes driven by strengthened Walker circulation. Sci. Adv. 2018, 4, eaat8785. [Google Scholar] [CrossRef] [PubMed]
- de Souza, E.B.; Ferreira, D.B.S.; Anjos, L.J.S.; Cunha, A.C.; Silva, J.A., Jr.; Coutinho, E.C.; Sousa, A.M.L.; Souza, P.J.O.P.; Correa, W.P.M.; Dias, T.S.S.; et al. Intensification of Natural Disasters in the State of Pará and the Triggering Mechanisms Across the Eastern Amazon. Atmosphere 2025, 16, 7. [Google Scholar] [CrossRef]
- Brasil Ministério da Integração e do Desenvolvimento Regional; Secretaria de Proteção e Defesa Civil; Universidade Federal de Santa Catarina; Centro de Estudos e Pesquisas em Engenharia e Defesa Civil. Atlas Digital de Desastres no Brasil; MIDR: Brasília, Brazil, 2023. Available online: https://atlasdigital.mdr.gov.br/arquivos/Atlas_Digital_Desastres_Manual_Aplicacao.pdf (accessed on 2 August 2024).
- Oliveira, E.C.L.; Nogueira Neto, A.V.; Santos, A.P.P.; da Costa, C.P.W.; Freitas, J.C.G.; Souza-Filho, P.W.M.; Rocha, R.L.; Alves, R.C.; Franco, V.S.; Carvalho, E.C.; et al. Precipitation forecasting: From geophysical aspects to machine learning applications. Front. Clim. 2023, 5, 1250201. [Google Scholar] [CrossRef]
- Rozos, E.; Dimitriadis, P.; Bellos, V. Machine Learning in Assessing the Performance of Hydrological Models. Hydrology 2022, 9, 5. [Google Scholar] [CrossRef]
- Hornik, K.; Stinchcombe, M.; White, H. Multilayer feedforward networks are universal approximators. Neural Netw. 1989, 2, 359–366. [Google Scholar] [CrossRef]
- Minns, A.W.; Hall, M.J. Artificial neural networks as rainfall-runoff models. Hydrol. Sci. J. 1996, 41, 399–417. [Google Scholar] [CrossRef]
- Dawson, C.W.; Wilby, R.L. Hydrological modelling using artificial neural networks. Prog. Phys. Geogr. 2001, 25, 80–108. [Google Scholar] [CrossRef]
- Samper-Pilar, J.; Samper-Calvete, J.; Mon, A.; Pisani, B.; Paz-González, A. Machine Learning Analysis of Hydrological and Hydrochemical Data from the Abelar Pilot Basin in Abegondo (Coruña, Spain). Hydrology 2025, 12, 49. [Google Scholar] [CrossRef]
- Silva, A.G.; Castro, A.R.G.; Vieira, A.C. Modelo de previsão hidrológica utilizando redes neurais artificiais: Um estudo de caso na bacia do Rio Xingu—Altamira-PA. Rev. Bras. Comput. Apl. 2018, 10, 55–62. [Google Scholar] [CrossRef]
- Salame, C.W.; Queiroz, J.C.B.; Souza, E.B.; Farias, V.J.C.; Rocha, E.J.P.; Moura, H.P. A comparative study of Box Jenkins models and artificial neural networks in forecasting pluviometric flows and precipitations of Araguaia-Tocantins basin/Brazil. Rev. Bras. Ciências Ambient. 2019, 52, 28–43. [Google Scholar] [CrossRef]
- Santos Neto, L.A.; Maniesi, V.; Querino, C.A.S.; Silva, M.J.G.; Brown, V.R. Modelagem hidroclimatologica utilizando redes neurais multilayer perceptron em bacia hidrográfica no sudoeste da Amazônia. Rev. Bras. Climatol. 2021, 16, 26. [Google Scholar] [CrossRef]
- Duarte, V.B.R.; Viola, M.R.; Giongo, M.; Uliana, E.M.; Mello, C.R. Streamflow forecasting in Tocantins river basins using machine learning. Water Supply 2022, 22, 6230–6244. [Google Scholar] [CrossRef]
- Brandão, J.F.S.; Correa, F.W.S.; Guedes, E.B. A Comparative Analysis of Artificial Neural Networks on River Level Forecasting for the Rio Madeira Basin. In Proceedings of the Encontro Nacional de Inteligência Artificial e Computacional (ENIAC), Belo Horizonte, Brazil, 25–29 September 2023; Belo Horizonte/MG. Anais. Sociedade Brasileira de Computação: Porto Alegre, Brazil, 2023; pp. 141–155. [Google Scholar] [CrossRef]
- Souza-Filho, P.W.M.; de Souza, E.B.; Silva Júnior, R.O.; Nascimento, W.R.; Versiani de Mendonça, B.R.; Guimarães, J.T.F.; Dall’Agnol, R.; Siqueira, J.O. Four decades of land-cover, land-use and hydroclimatology changes in the Itacaiúnas River watershed, southeastern Amazon. J. Environ. Manag. 2016, 167, 175–184. [Google Scholar] [CrossRef]
- Serrão, E.A.O.; Silva, M.T.; Sousa, F.A.S.; Lima, A.M.M.; Santos, C.A.; Ataide, L.C.P.; Silva, V.P.R. Four decades of hydrological process simulation of the Itacaiúnas river watershed, southeast Amazon. Bol. Ciências Geodésicas 2019, 25, e2019018. [Google Scholar] [CrossRef]
- Pontes, P.R.M.; Cavalcante, R.B.L.; Sahoo, P.K.; Silva Júnior, R.O.; da Silva, M.S.; Dall’Agnol, R.; Siqueira, J.O. The role of protected and deforested areas in the hydrological processes of Itacaiúnas River Basin, eastern Amazonia. J. Environ. Manag. 2019, 235, 489–499. [Google Scholar] [CrossRef]
- Nunes, S.; Cavalcante, R.B.L.; Nascimento, W.R., Jr.; Souza-Filho, P.W.M.; Santos, D. Potential for Forest Restoration and Deficit Compensation in Itacaiúnas Watershed, Southeastern Brazilian Amazon. Forests 2019, 10, 439. [Google Scholar] [CrossRef]
- Ibrahim, K.S.M.H.; Huang, Y.F.; Ahmed, A.N.; Koo, C.H.; El-Shafie, A. A review of the hybrid artificial intelligence and optimization modelling of hydrological streamflow forecasting. Alex. Eng. J. 2022, 61, 279–303. [Google Scholar] [CrossRef]
- Silva, R.C.F.; Pimentel, M.A.D.S.; Araújo, A.N. Caracterização Morfométrica e Geomorfológica da Bacia Hidrográfica do Rio Itacaiunas (BHRI), Amazônia Oriental, Brasil. Rev. Bras. Geogr. Física 2022, 15, 1556–1563. [Google Scholar] [CrossRef]
- Viana, P.L.; Gil, A.S.B. Flora das cangas da Serra dos Carajás, Pará, Brasil: Cannabaceae. Rev. Rodriguésia 2018, 69, 49–51. [Google Scholar] [CrossRef]
- Silva, R.O.; de Souza, E.B.; Tavares, A.L.; Mota, J.A.; Ferreira, D.B.S.; Souza-Filho, P.W.M.; Rocha, E.J.D. Three decades of reference evapotranspiration estimates for a tropical watershed in the eastern Amazon. Acad. Bras. Ciênc. 2017, 89, 1985–2002. [Google Scholar] [CrossRef]
- Carvalho, G.L.B.; Ferreira, D.H.L.; Sugahara, C.R. Aplicação da análise envoltória de dados na gestão de recursos hídricos. Rev. Bras. De Iniciação Científica 2022, 9, e022021. Available online: https://periodicoscientificos.itp.ifsp.edu.br/index.php/rbic/article/view/612 (accessed on 10 January 2025).
- Razali, N.; Wah, Y. Power Comparisons of Shapiro-Wilk, Kolmogorov-Smirnov, Lilliefors and Anderson-Darling tests. J. Stat. Model. Anal. 2011, 2, 21–33. Available online: https://www.nrc.gov/docs/ml1714/ml17143a100.pdf (accessed on 2 December 2024).
- Shah, H.; Ghazali, R. Prediction of Earthquake Magnitude by an Improved ABC-MLP. In Proceedings of the 2011 Developments in E-systems Engineering, Dubai, United Arab Emirates, 6–8 December 2011. [Google Scholar] [CrossRef]
- Coutinho, E.R.; Silva, R.M.; Delgado, A.R.S. Utilização de Técnicas de Inteligência Computacional na Predição de Dados Meteorológicos. Rev. Bras. Meteorol. 2016, 31, 24–36. [Google Scholar] [CrossRef]
- Hall, T.; Brooks, H.R.; Doswell, C.A. Precipitation Forecasting Using a Neural Network. Wea. Forecast. 1999, 14, 338–345. [Google Scholar] [CrossRef]
- Asaduzzaman, M.; Ahmed, S.U.; Khan, F.E.; Shahjahan, M.; Murase, K. Making use of damped noisy gradient in training neural network. In Proceedings of the 2010 International Joint Conference on Neural Networks (IJCNN), Barcelona, Spain, 18–23 July 2010; pp. 1–5. [Google Scholar] [CrossRef]
- Leonel, J.S. Deep Learning. Available online: https://deeplearningbrasil.wordpress.com/author/jorgesleonel (accessed on 15 December 2024).
- Haykin, S. Neural Networks: A Comprehensive Foundation; Prentice Hall PTR: Hoboken, NJ, USA, 1998. [Google Scholar]
- Nair, V.; Hinton, G.E. Rectified Linear Units Improve Restricted Boltzmann Machines. In Proceedings of the International Conference on Machine Learning 2020, Haifa, Israel, 12–18 July 2020. [Google Scholar]
- Godinho, J.; Gomes, J.S.G.; Malheiro, R.; Santana, L.E. Previsão hidrológica na bacia do rio Macaé com redes neurais artificiais. Rev. Bras. Comput. Apl. 2022, 14, 70–80. Available online: http://seer.upf.br/index.php/rbca/article/view/12964 (accessed on 3 December 2024).
- Chollet, F. Deep Learning with Python; Manning Publications: Shelter Island, NY, USA, 2018. [Google Scholar]
- Géron, A. Hands-On Machine Learning with Scikit-Learn and TensorFlow: Concepts, Tools, and Techniques to Build Intelligent Systems, 1st ed.; O’Reilly Media: Sebastopol, CA, USA, 2017. [Google Scholar]
- Debastiani, A.B.; Da Silva, R.D.; Neto, S.L.R. Eficácia da arquitetura MLP em modo closed-loop para simulação de um Sistema Hidrológico. Revista Bras. Recur. Hídricos 2016, 21, 821–831. [Google Scholar] [CrossRef][Green Version]
- Mendonça, L.M.; Gomide, I.S.; Sousa, J.V.; Blanco, C.J.C. Modelagem chuva-vazão via redes neurais artificiais para simulação de vazões de uma bacia hidrográfica da Amazônia. Rev. Gestão Água América Lat. 2021, 18, e2. [Google Scholar] [CrossRef]
- Simpson, P.K. Artificial Neural Systems: Foundations, Paradigms, Applications, and Implementations; Pergamon Press: Oxford, UK, 1999. [Google Scholar]
- Albarakati, N.; Kecman, V. Fast neural network algorithm for solving classification tasks: Batch error back-propagation algorithm. In Proceedings of the IEEE Southeastcon 2013, Jacksonville, FL, USA, 4–7 April 2013; pp. 1–8. [Google Scholar] [CrossRef]
- Diederik, P.K.; Ba, J. Adam: A method for stochastic optimization. arXiv 2014, arXiv:1412.6980. [Google Scholar] [CrossRef]
- Cortes, C.; Vapnik, V. Support-Vector Networks. Mach. Learn. 1995, 20, 273–297. [Google Scholar] [CrossRef]
- Vapnik, V.; Golowich, S.E.; Smola, A. Support vector method for function approximation, regression estimation and signal processing. Adv. Neural Inf. Process. Syst. 1997, 9, 281–287. Available online: https://dl.acm.org/doi/abs/10.5555/2998981.2999021 (accessed on 2 December 2024).
- Li, X.-L.; Lü, H.; Horton, R.; An, T.; Yu, Z. Real-time flood forecast using the coupling support vector machine and data assimilation method. J. Hydroinform. 2014, 16, 973–988. [Google Scholar] [CrossRef]
- Roy, C.; Motamedi, S.; Hashim, R.; Shamshirband, S.; Petković, D. A comparative study for estimation of wave height using traditional and hybrid soft-computing methods. Environ. Earth Sci 2016, 75, 590. [Google Scholar] [CrossRef]
- Nash, J.E.; Sutcliffe, J.V. River flow forecasting through conceptual models part I—A discussion of principles. J. Hydrol. 1970, 10, 3. [Google Scholar] [CrossRef]
- Gupta, H.V.; Kling, H.; Yilmaz, K.K.; Martinez, G.F. Decomposition of the mean squared error and NSE performance criteria: Implications for improving hydrological modelling. J. Hydrol. 2009, 377, 80–91. [Google Scholar] [CrossRef]
- Oliveira, R.F.; Zolin, C.A.; Victoria, D.C.; Lopes, T.R.; Vendrusculo, L.G.; Paulino, J. Hydrological calibration and validation of the MGB-IPH model for water resource management in the upper Teles Pires River basin in the Amazon-Cerrado ecotone in Brazil. Acta Amaz. 2019, 49, 54–63. [Google Scholar] [CrossRef]
- Oliveira, D.M.; Ribeiro, J.G.M.; De Faria, L.F.; Reboita, M.S. Performance dos modelos climáticos do CMIP6 em simular a precipitação em subdomínios da América do Sul no período histórico. Rev. Bras. Geogr. Física 2023, 16, 116–133. [Google Scholar] [CrossRef]
- Medeiros, F.J.; Oliveira, C.P.; Avila-Diaz, A. Evaluation of extreme precipitation climate indices and their projected changes for Brazil: From CMIP3 to CMIP6. Weather Clim. Extrem. 2022, 38, 100511. [Google Scholar] [CrossRef]
- De Souza, E.B.; Ferreira, D.B.S.; Guimarães, J.T.F.; Franco, V.S.; Azevedo, F.T.M.; Moraes, B.C.; Souza, P.J.O.P. Padrões clima- tológicos e tendências da precipitação nos regimes chuvoso e seco da Amazônia oriental. Rev. Bras. Clim. 2017, 21, 81–93. [Google Scholar] [CrossRef]
- Espinoza Villar, J.C.; Ronchail, J.; Guyot, J.L.; Cochonneau, G.; Naziano, F.; Lavado, W.; De Oliveira, E.; Pombosa, R.; Vauchel, P. Spatio-temporal rainfall variability in the Amazon basin countries (Brazil, Peru, Bolivia, Colombia, and Ecuador). Int. J. Climatol. 2009, 29, 1574–1594. [Google Scholar] [CrossRef]
- Franco, V.S.; de Souza, E.B.; Lima, A.M.M.; Sousa, A.M.L.; Pinheiro, A.N.; Dias, T.S.S.; Azevedo, F.T.M. Previsão hidrológica de cheia sazonal do rio Xingu, Altamira-PA. Rev. Bras. Climatol. 2018, 14, 22. [Google Scholar] [CrossRef][Green Version]
- Batista, R.G.; Costa, C.E.A.S. Influence of climatic phenomena on rainfall in the Tapajós River Basin. Rev. Agrogeoambiental 2024, 16, e20241847. [Google Scholar] [CrossRef]
- Collischonn, B.; Collischonn, W.; Tucci, C.E.M. Daily hydrological modeling in the Amazon basin using TRMM rainfall estimates. J. Hydrol. 2008, 360, 207–216. [Google Scholar] [CrossRef]
- Ronchail, J.; Cochonneau, G.; Molinier, M.; Guyot, J.L.; De Miranda Chaves, A.G.; Guimarães, V.; De Oliveira, E. Interannual rainfall variability in the Amazon basin and sea-surface temperatures in the Equatorial Pacific and the tropical Atlantic Oceans. Int. J. Climatol. 2002, 22, 1663–1686. [Google Scholar] [CrossRef]
- De Linage, C.; Famiglietti, J.S.; Randerson, J.T. Statistical prediction of terrestrial water storage changes in the Amazon Basin using tropical Pacific and North Atlantic Sea surface temperature anomalies. Hydrol. Earth Syst. Sci. 2014, 18, 2089–2102. [Google Scholar] [CrossRef]
- Yoon, J.H.; Zeng, N. An Atlantic influence on Amazon rainfall. Clim. Dyn. 2010, 34, 249–264. [Google Scholar] [CrossRef]
- Marengo, J.A.; Espinoza, J.C. Extreme seasonal droughts and floods in Amazonia: Causes, trends and impacts. Int. J. Climatol. 2016, 36, 1033–1050. [Google Scholar] [CrossRef]
- Ambrizzi, T.; de Souza, E.B.; Pulwarty, R.S. The Hadley and Walker Regional Circulations and Associated ENSO Impacts on South American Seasonal Rainfall. In The Hadley Circulation: Present, Past and Future. Advances in Global Change Research; Diaz, H.F., Bradley, R.S., Eds.; Springer: Dordrecht, The Netherlands, 2004; Volume 21. [Google Scholar] [CrossRef]
- de Souza, E.B.; Kayano, M.; Ambrizzi, T. Intraseasonal and submonthly variability over the Eastern Amazon and Northeast Brazil during the autumn rainy season. Theor. Appl. Climatol. 2005, 81, 177–191. [Google Scholar] [CrossRef]
- Sousa, M.F.; Uliana, E.M.; Aires, R.V.U.; Rápalo, L.M.C.; da Silva, D.D.; Moreira, M.C.; Lisboa, L.; da Silva Rondon, D. Streamflow prediction based on machine learning models and rainfall estimated by remote sensing in the Brazilian Savanna and Amazon biomes transition. Model. Earth Syst. Environ. 2024, 10, 1191–1202. [Google Scholar] [CrossRef]
- Liu, W.T.; Ayres, F.M. Upper Paraguay River inundation prediction using rainfall and NDVI. Int. J. Remote Sens. 2005, 26, 4455–4470. [Google Scholar] [CrossRef]
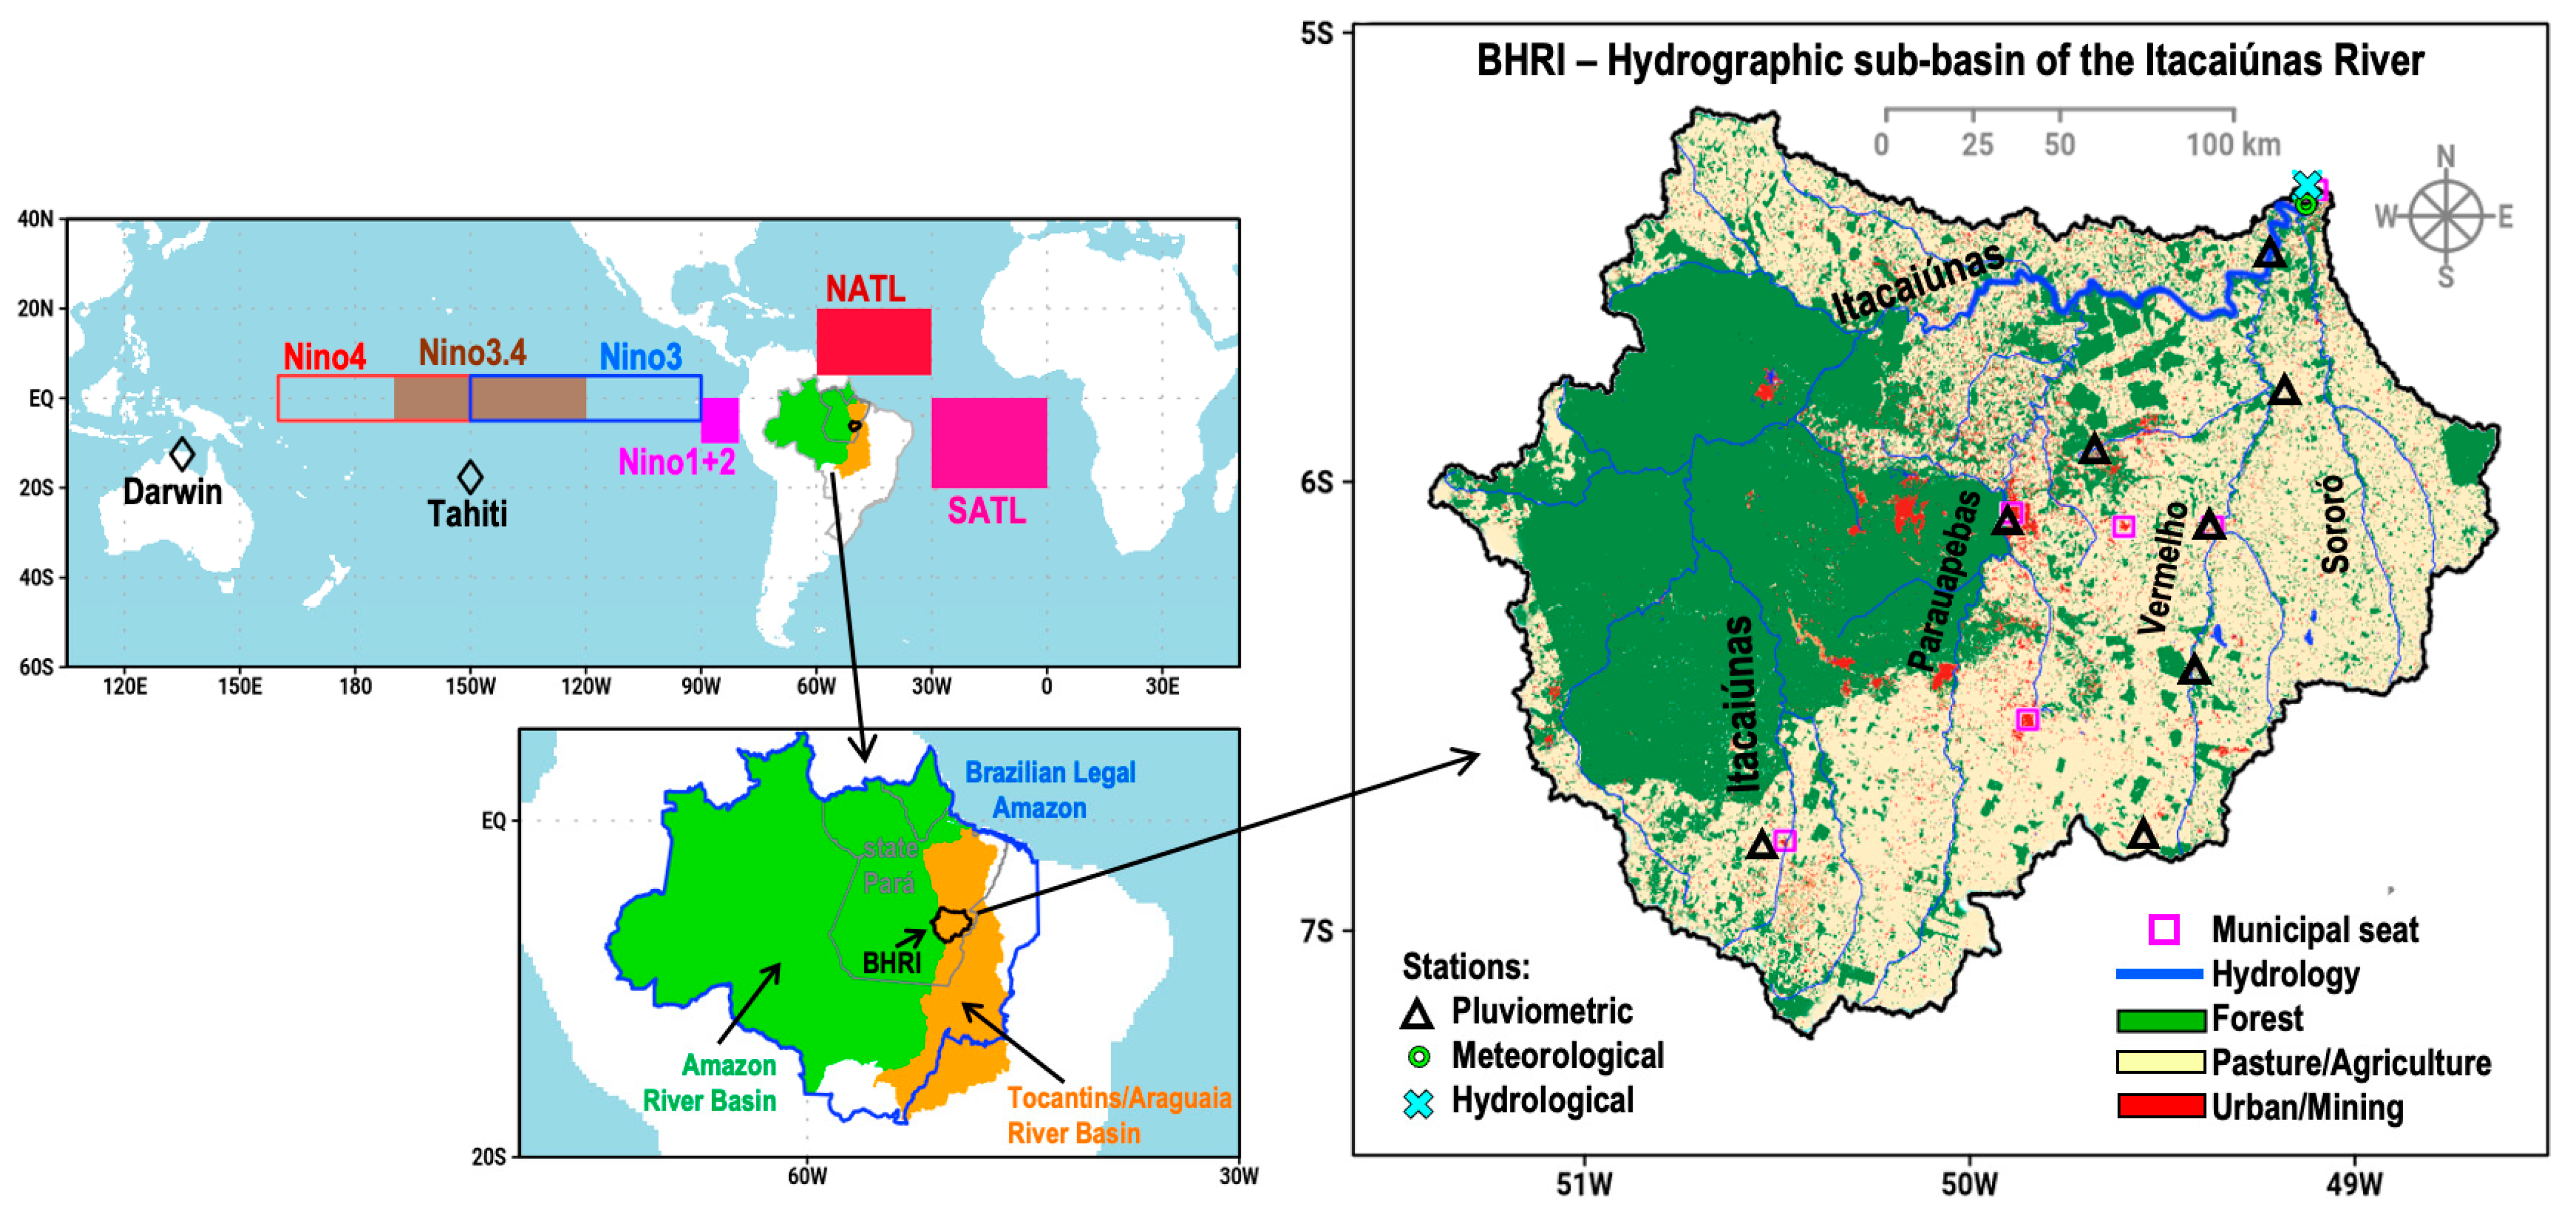
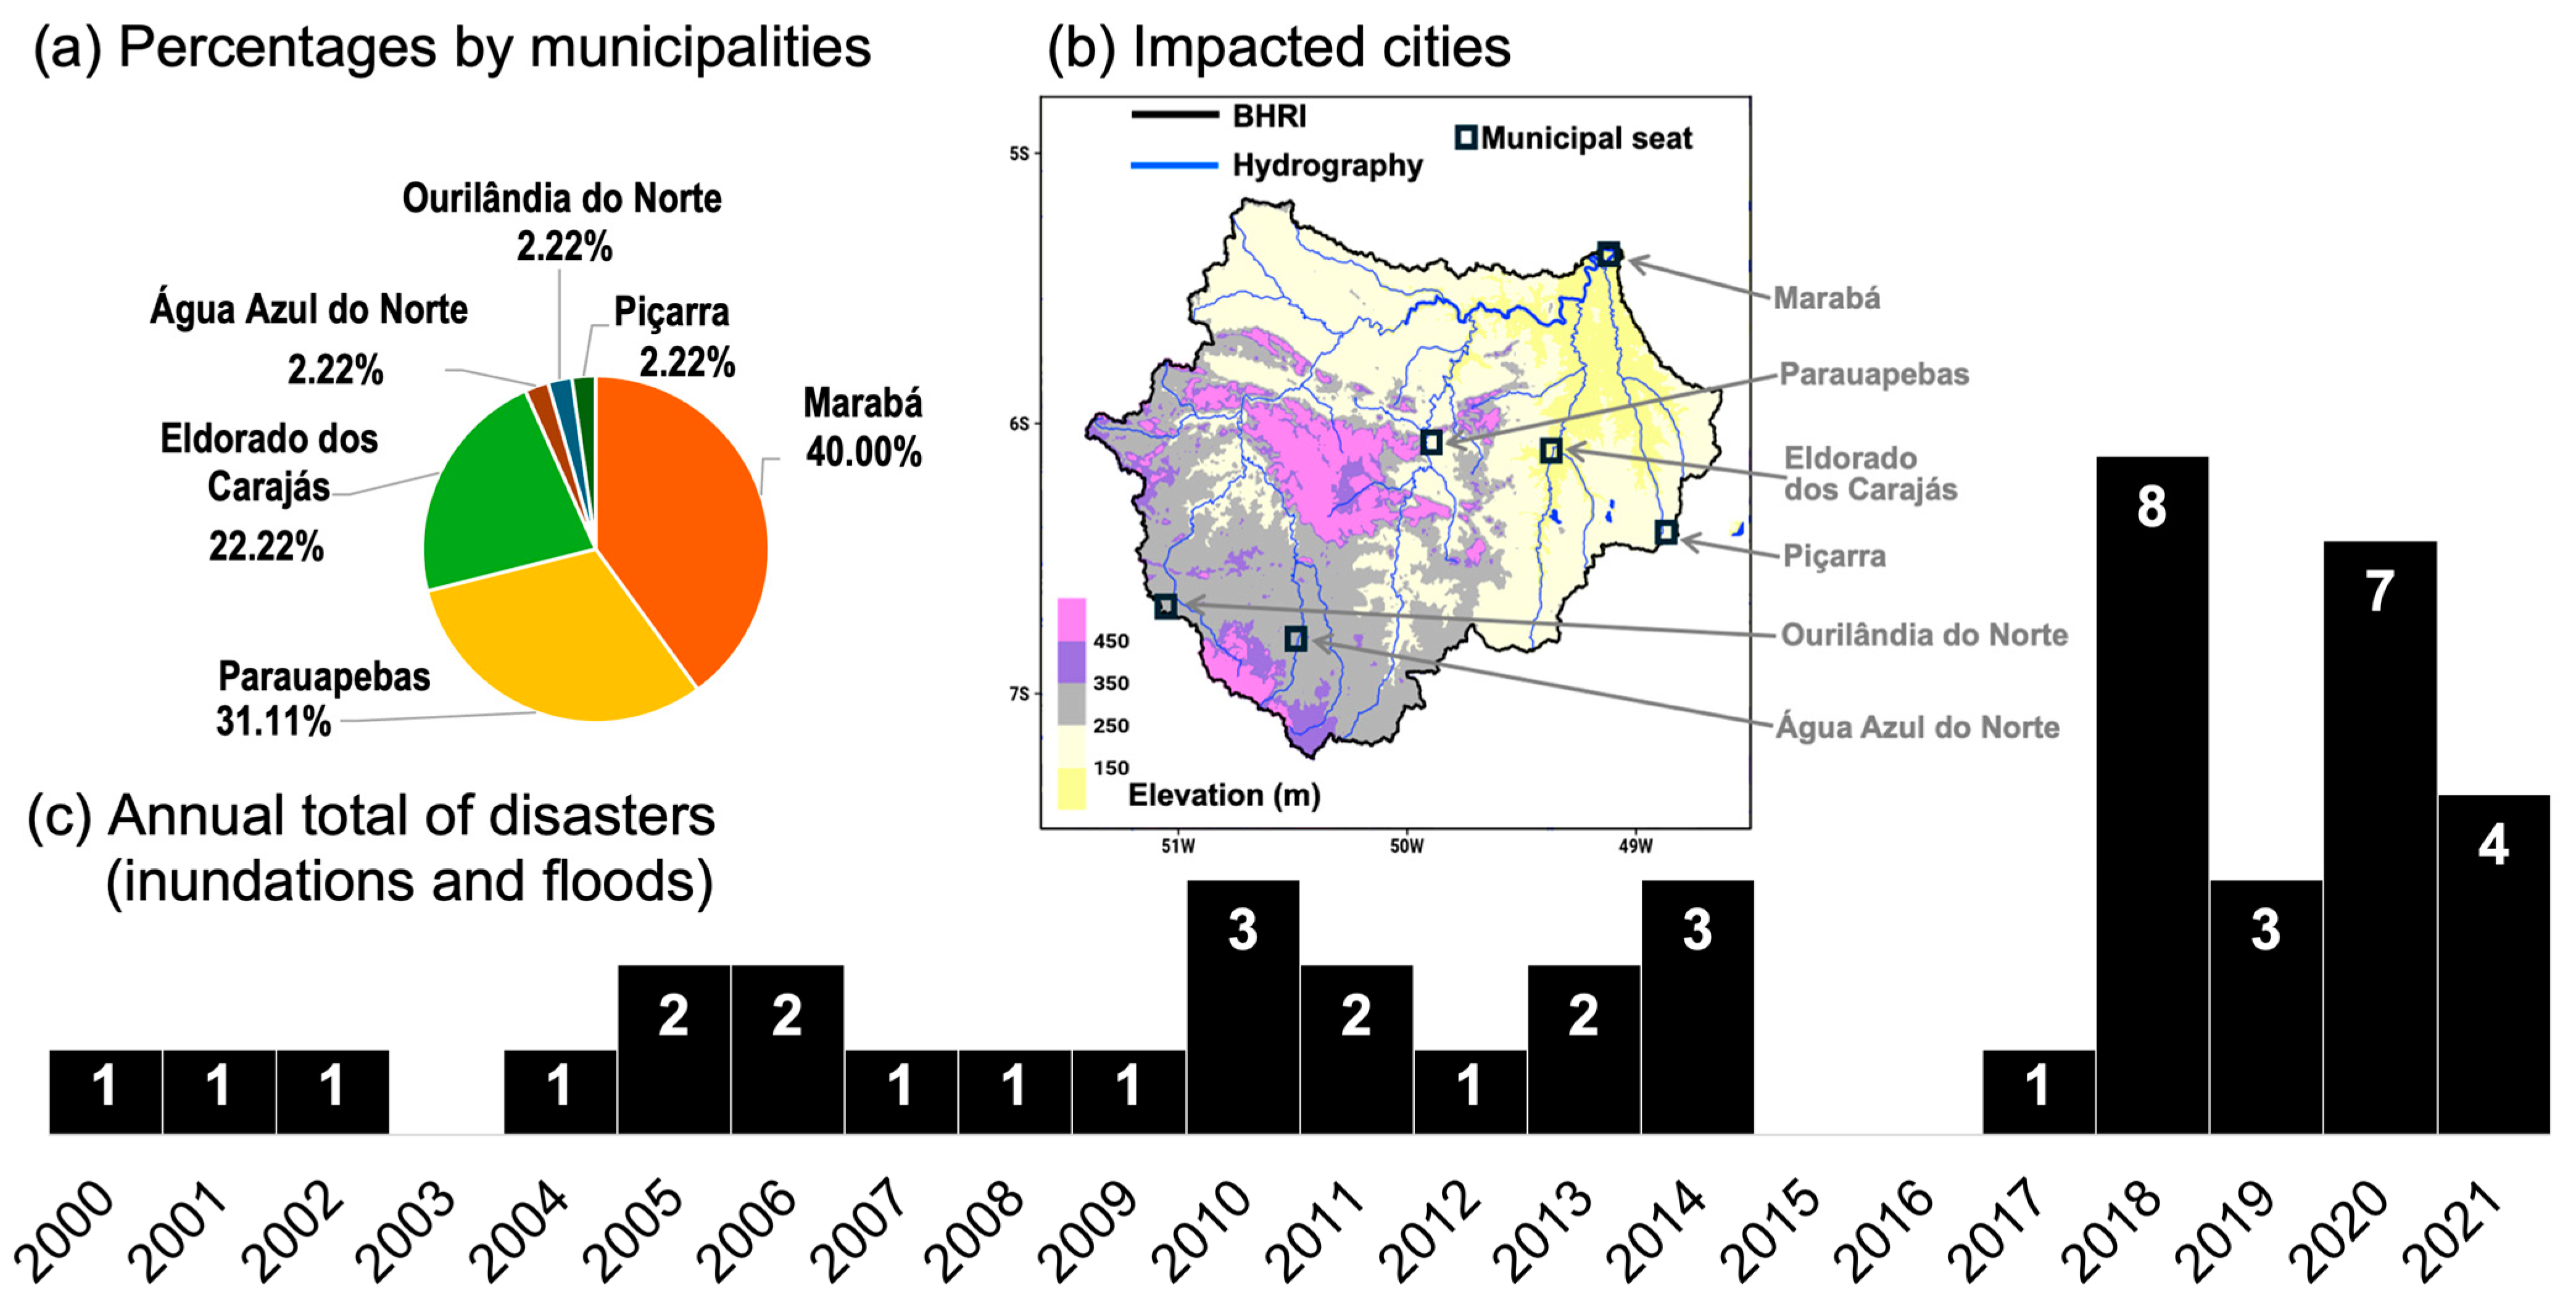

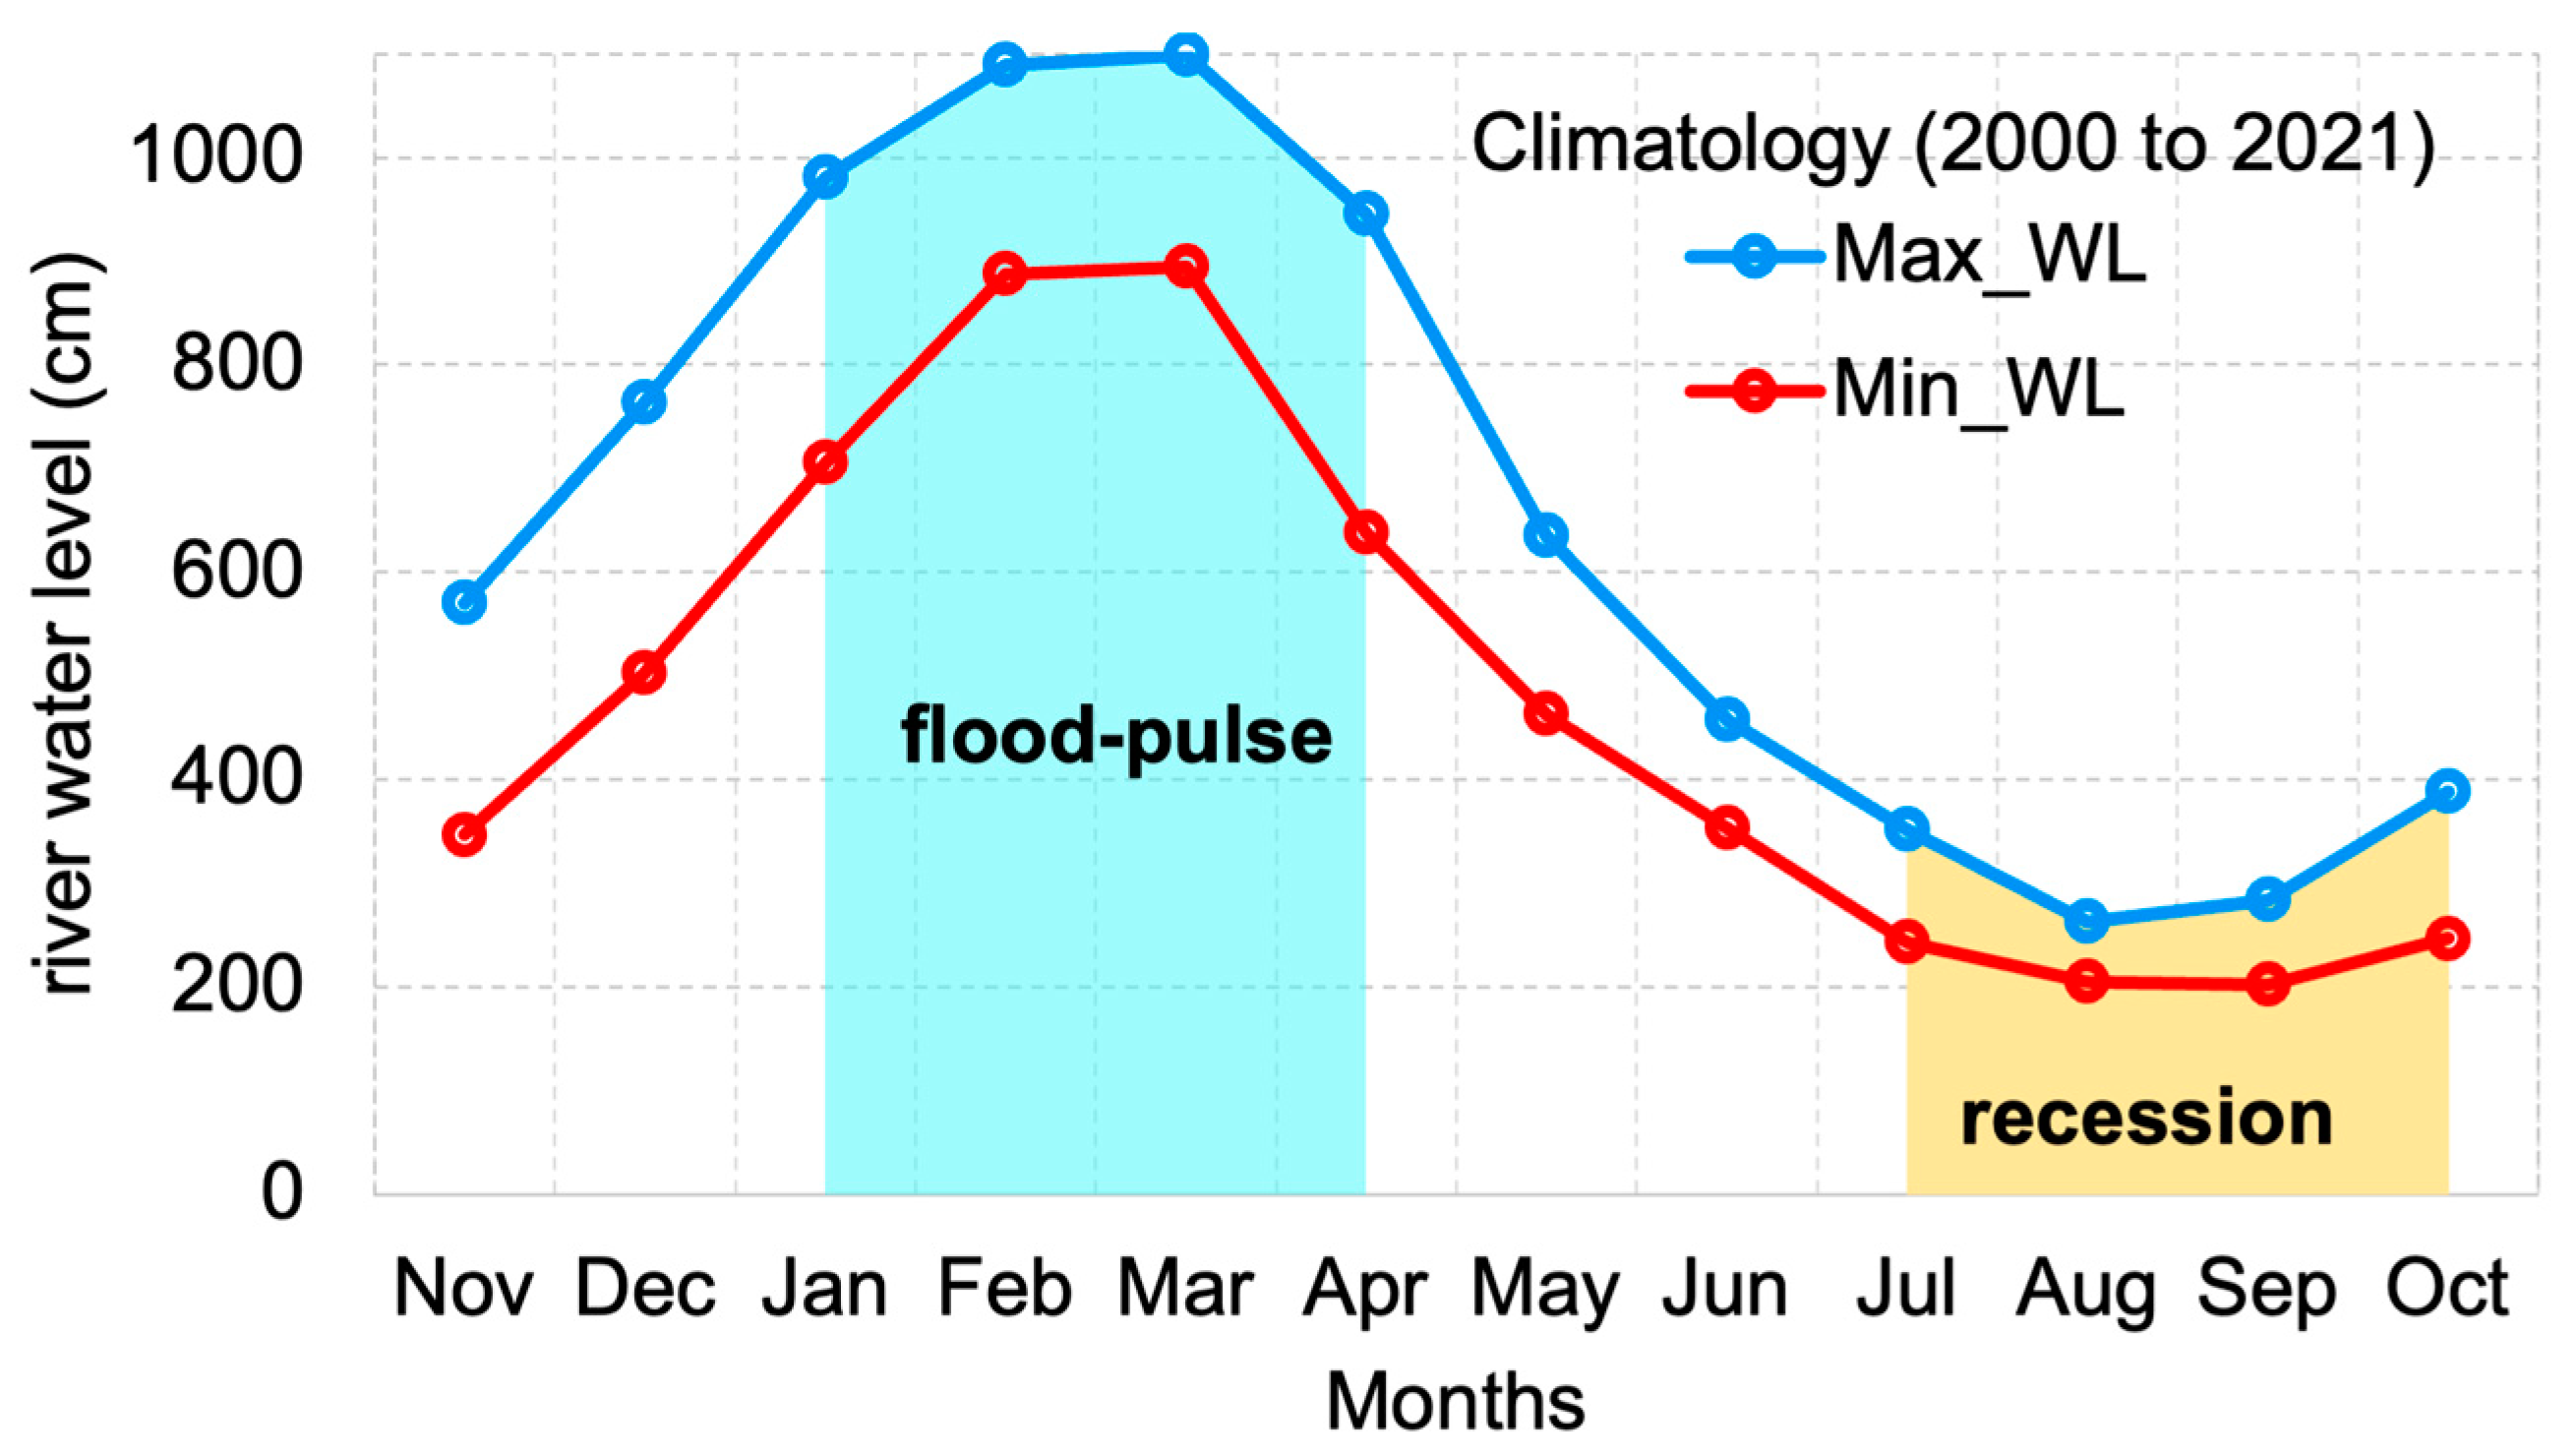
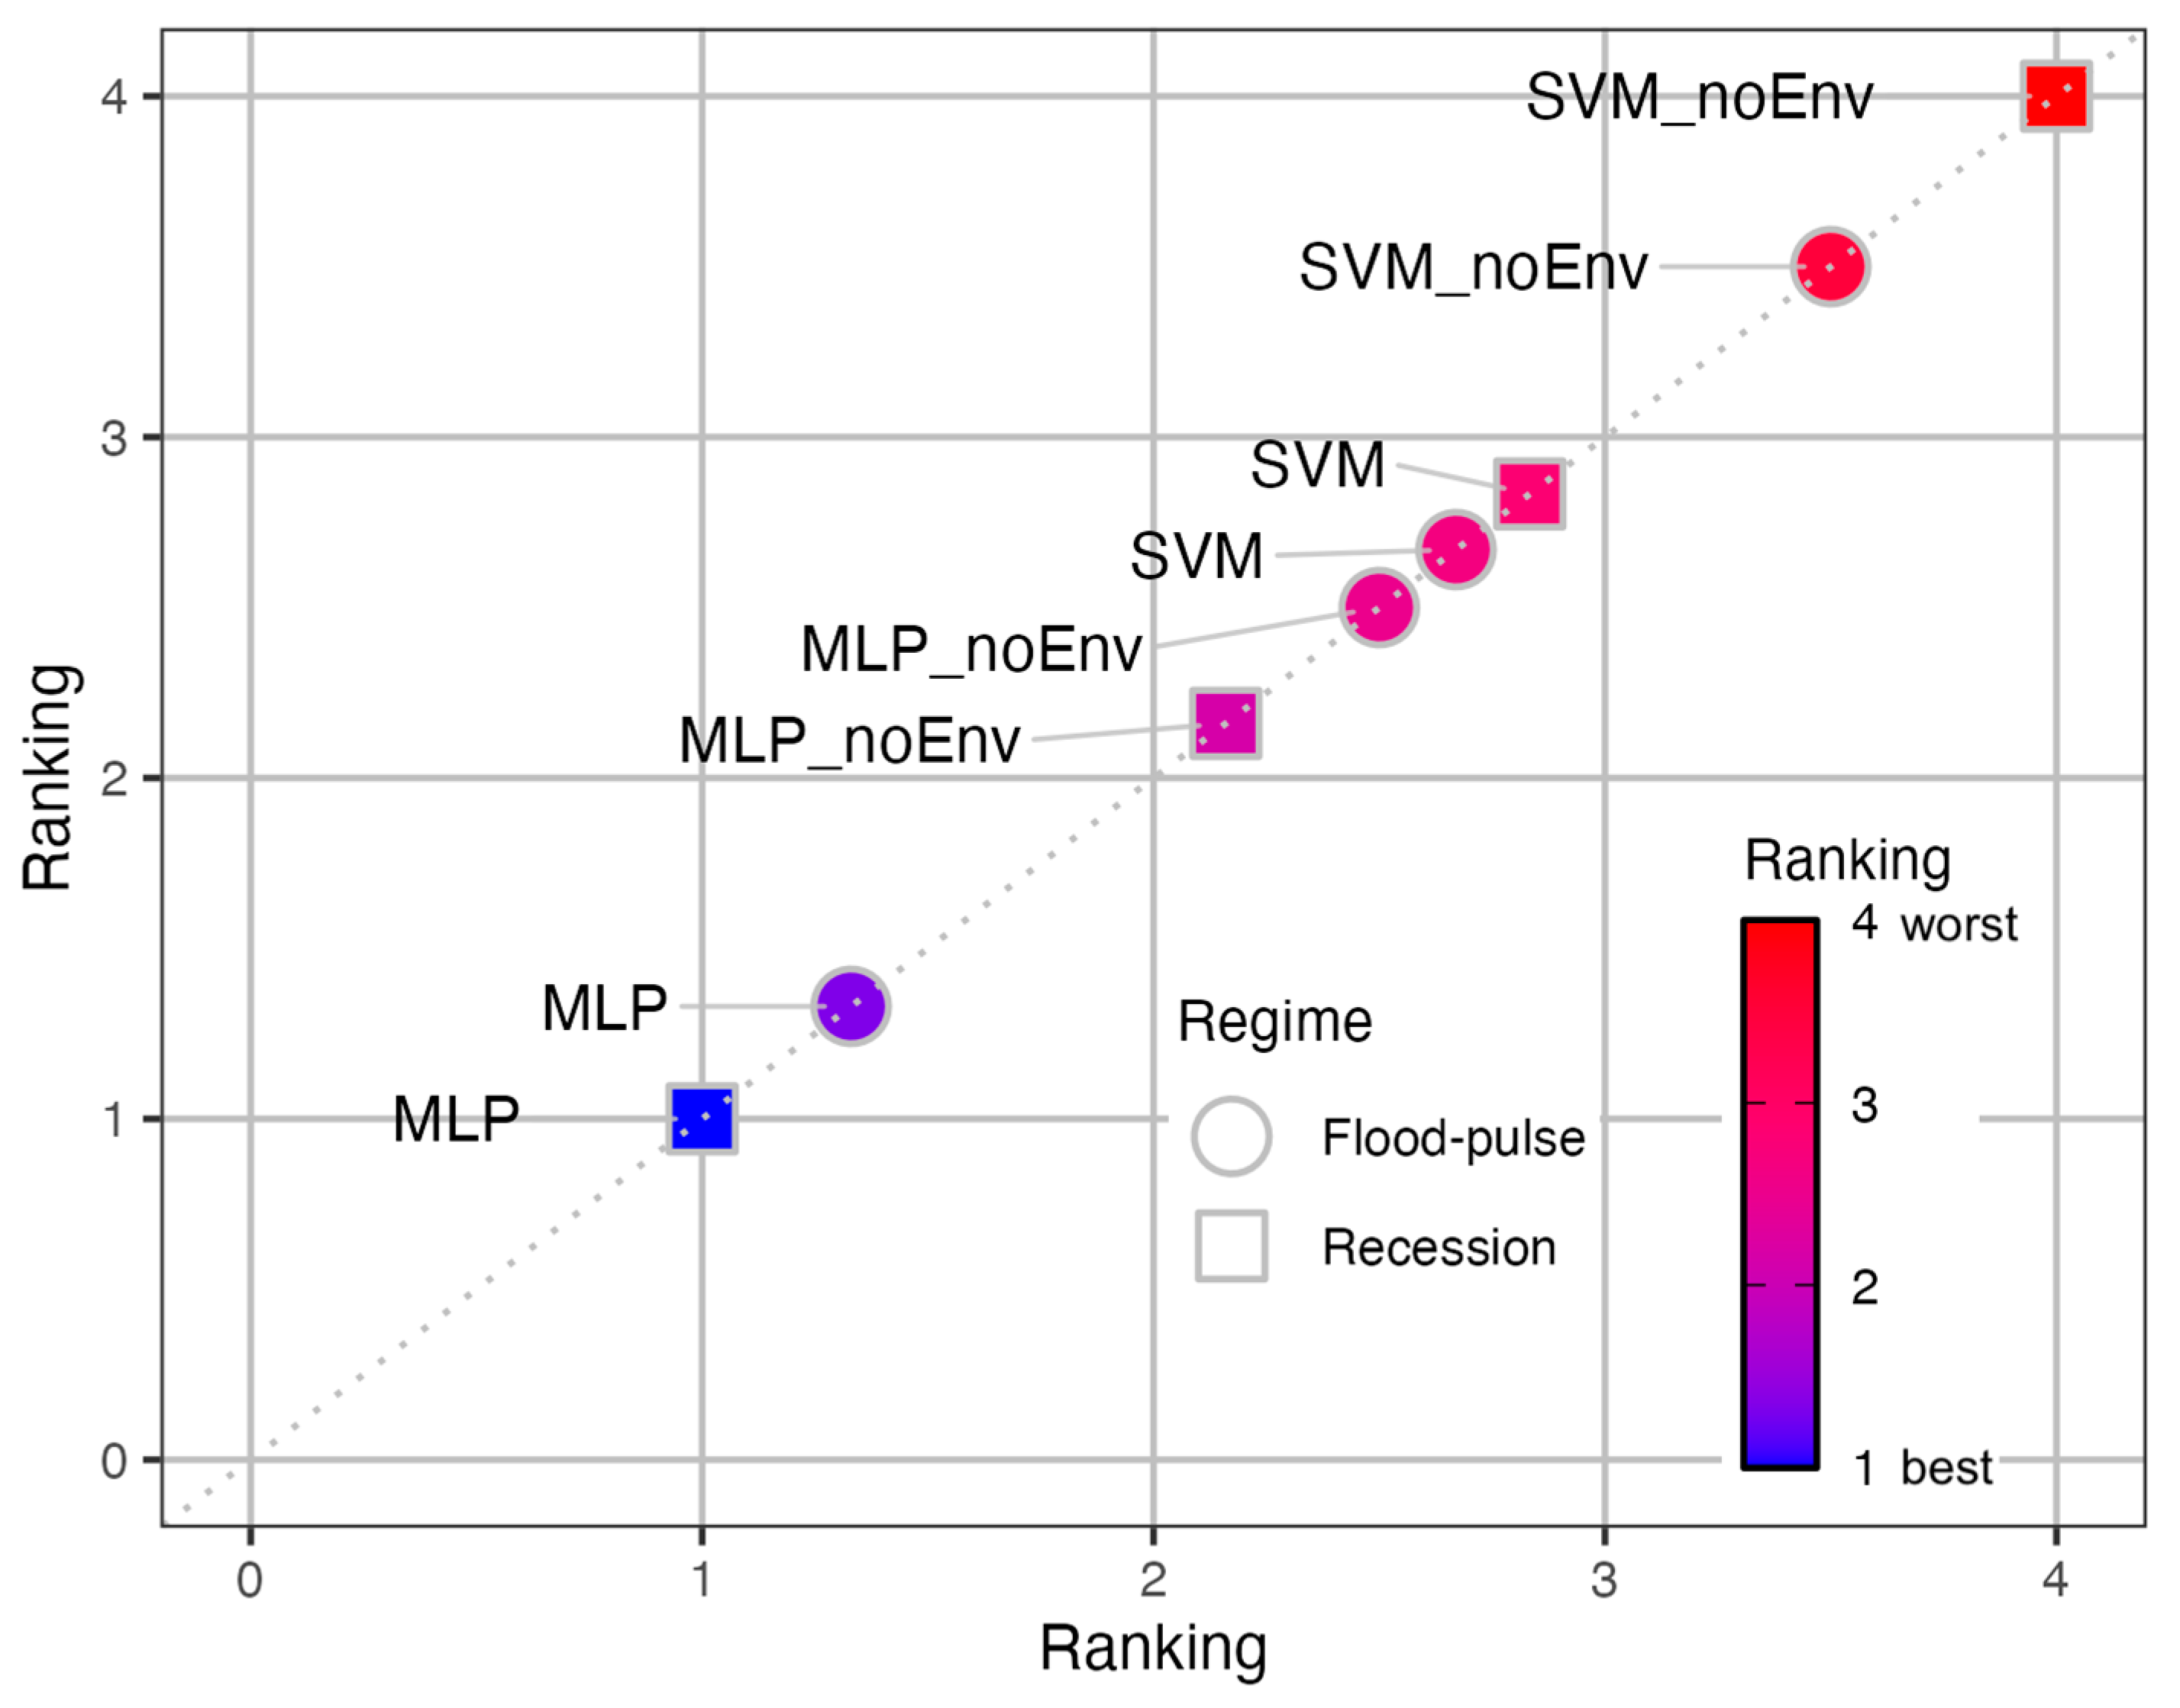
| Dimension | Variables | Acronym | Location | Unit | Source |
|---|---|---|---|---|---|
| Meteorological | Air temperature | Ta | Marabá station | °C | INMET |
| Relative humidity | RH | % | |||
| Surface atmospheric pressure | Pa | hPa | |||
| Wind speed | Vv | m/s | |||
| Precipitation | Pr | mm | |||
| Precipitation | Pr_area | Average of the 9 stations within the basin | mm | ANA | |
| Climatological | Mean sea level pressure | SLP | Darwin and Tahiti | hPa | CPC/NOAA |
| Sea surface temperature | SST | NINO1+2, NINO3, NINO3.4, NINO4, NATL, and SATL | °C | ||
| Environmental | Normalized Difference Vegetation Index | NDVI | Spatial average within the basin | USGS, NASA | |
| Enhanced Vegetation Index | EVI | ||||
| Leaf Area Index | Lai | ||||
| Hydrological | Maximum river water level | Max_WL | Marabá station | cm | ANA |
| Minimum river water level | Min_WL | ||||
| Natural disasters | Annual number of hydrological disasters | – | Municipalities within the basin | – | SEDEC/MDR |
| Model | 1st HL | 2nd HL | F1st HL | F2nd HL | FCS | NI |
|---|---|---|---|---|---|---|
| MLP | 5, 10, 15, 20, 25 and 30 | 5, 10, 15, 20, 25 and 30 | Tanh | Tanh | Relu | up to 4000 |
| Model | K | C | ϵ | γ |
|---|---|---|---|---|
| SVM | FBR | 1 | 0,1 | 1 |
| Metric | Description | Range and Interpretation of Quantitative Results |
|---|---|---|
| RMSE | Root Mean Square Error: This measures the square root of the mean of the squared errors. It penalizes larger errors more heavily than smaller errors. | [0, +∞) lower is better |
| NSE | Nash–Sutcliffe Efficiency: This measures the predictive quality of the model relative to the mean of the observed values. | (−∞, 1] values close to 1 indicate better fit |
| KGE | Kling–Gupta Efficiency: This improves the NSE by decomposing performance into three components, namely linear correlation, bias, and variability. | (−∞, 1] values close to 1 indicate better fit |
| MAE | Mean Absolute Error: This is the average of the absolute error values. It is less sensitive to outliers than the RMSE. | [0, +∞) lower is better |
| PBIAS | Percent Bias: This measures the average tendency of the simulated values to be higher (underestimation) or lower (overestimation) than the observed values. | (−∞, +∞) values close to 0 indicate less bias |
| R2 | Coefficient of Determination: This is the proportion of the variance in the simulated variable from the observed variable. It measures the strength of the linear relationship between observed and simulated values. | [0, 1] values close to 1 indicate better correlation |
| Variable | Model | Network Architecture | Statistical Metrics | Average Rank | |||||||
|---|---|---|---|---|---|---|---|---|---|---|---|
| HL1 | HL2 | Epoch | RMSE | NSE | KGE | MAE | PBIAS | R2 | |||
| Max_WL | MLP | 25 | 10 | 4000 | 123.48 | 0.878 | 0.881 | 90.89 | 2.07 | 0.882 | 1.00 |
| SVM | – | – | – | 174.51 | 0.840 | 0.860 | 135.58 | 14.14 | 0.840 | 2.00 | |
| MLP_noEnv | 30 | 20 | 2000 | 141.44 | 0.757 | 0.834 | 101.13 | 3.46 | 0.846 | 3.50 | |
| SVM_noEnv | – | – | – | 175.33 | 0.755 | 0.835 | 133.07 | 13.55 | 0.831 | 3.50 | |
| Min_WL | MLP | 30 | 5 | 1000 | 92.99 | 0.880 | 0.884 | 66.76 | 0.29 | 0.881 | 1.17 |
| SVM | – | – | – | 96.98 | 0.878 | 0.887 | 72.47 | –3.76 | 0.876 | 1.83 | |
| MLP_noEnv | 25 | 15 | 1000 | 93.53 | 0.869 | 0.865 | 69.19 | 1.00 | 0.880 | 3.17 | |
| SVM_noEnv | – | – | – | 97.20 | 0.869 | 0.863 | 73.63 | –2.23 | 0.873 | 3.83 | |
| Variable and Seasonal Regime | Model | RMSE | NSE | KGE | MAE | PBIAS | R2 | Average Rank |
|---|---|---|---|---|---|---|---|---|
| Max_WL Flood pulse (January to April) | MLP | 130.01 | 0.518 | 0.653 | 108.80 | –3.04 | 0.535 | 1.33 |
| MLP_noEnv | 132.99 | 0.495 | 0.632 | 110.80 | –3.18 | 0.514 | 2.50 | |
| SVM | 133.23 | 0.494 | 0.626 | 109.87 | –1.38 | 0.500 | 2.67 | |
| SVM_noEnv | 134.85 | 0.481 | 0.632 | 111.13 | –2.18 | 0.495 | 3.50 | |
| Min_WL Recession (July to October) | MLP | 37.56 | 0.253 | 0.682 | 30.31 | 6.19 | 0.479 | 1.00 |
| MLP_noEnv | 43.53 | −0.004 | 0.591 | 34.92 | 8.27 | 0.361 | 2.16 | |
| SVM | 58.46 | −0.810 | 0.556 | 46.00 | 19.34 | 0.444 | 2.83 | |
| SVM_noEnv | 58.65 | −0.822 | 0.510 | 48.12 | 19.70 | 0.308 | 4.00 |
Disclaimer/Publisher’s Note: The statements, opinions and data contained in all publications are solely those of the individual author(s) and contributor(s) and not of MDPI and/or the editor(s). MDPI and/or the editor(s) disclaim responsibility for any injury to people or property resulting from any ideas, methods, instructions or products referred to in the content. |
© 2025 by the authors. Licensee MDPI, Basel, Switzerland. This article is an open access article distributed under the terms and conditions of the Creative Commons Attribution (CC BY) license (https://creativecommons.org/licenses/by/4.0/).
Share and Cite
Costa, L.R.R.; Ferreira, D.B.d.S.; Senna, R.C.; de Sousa, A.M.L.; Carmo, A.M.C.d.; Silva, J.d.A., Jr.; de Souza, F.G.; de Souza, E.B. River Stage Variability and Extremes in the Itacaiúnas Basin in the Eastern Amazon: Machine Learning-Based Modeling. Hydrology 2025, 12, 115. https://doi.org/10.3390/hydrology12050115
Costa LRR, Ferreira DBdS, Senna RC, de Sousa AML, Carmo AMCd, Silva JdA Jr., de Souza FG, de Souza EB. River Stage Variability and Extremes in the Itacaiúnas Basin in the Eastern Amazon: Machine Learning-Based Modeling. Hydrology. 2025; 12(5):115. https://doi.org/10.3390/hydrology12050115
Chicago/Turabian StyleCosta, Luiz Rodolfo Reis, Douglas Batista da Silva Ferreira, Renato Cruz Senna, Adriano Marlisom Leão de Sousa, Alexandre Melo Casseb do Carmo, João de Athaydes Silva, Jr., Felipe Gouvea de Souza, and Everaldo Barreiros de Souza. 2025. "River Stage Variability and Extremes in the Itacaiúnas Basin in the Eastern Amazon: Machine Learning-Based Modeling" Hydrology 12, no. 5: 115. https://doi.org/10.3390/hydrology12050115
APA StyleCosta, L. R. R., Ferreira, D. B. d. S., Senna, R. C., de Sousa, A. M. L., Carmo, A. M. C. d., Silva, J. d. A., Jr., de Souza, F. G., & de Souza, E. B. (2025). River Stage Variability and Extremes in the Itacaiúnas Basin in the Eastern Amazon: Machine Learning-Based Modeling. Hydrology, 12(5), 115. https://doi.org/10.3390/hydrology12050115


