

Surface and Subsurface Heatwaves in the Hypersaline Dead Sea Caused by Severe Dust Intrusion


Abstract
1. Introduction
2. Materials and Methods
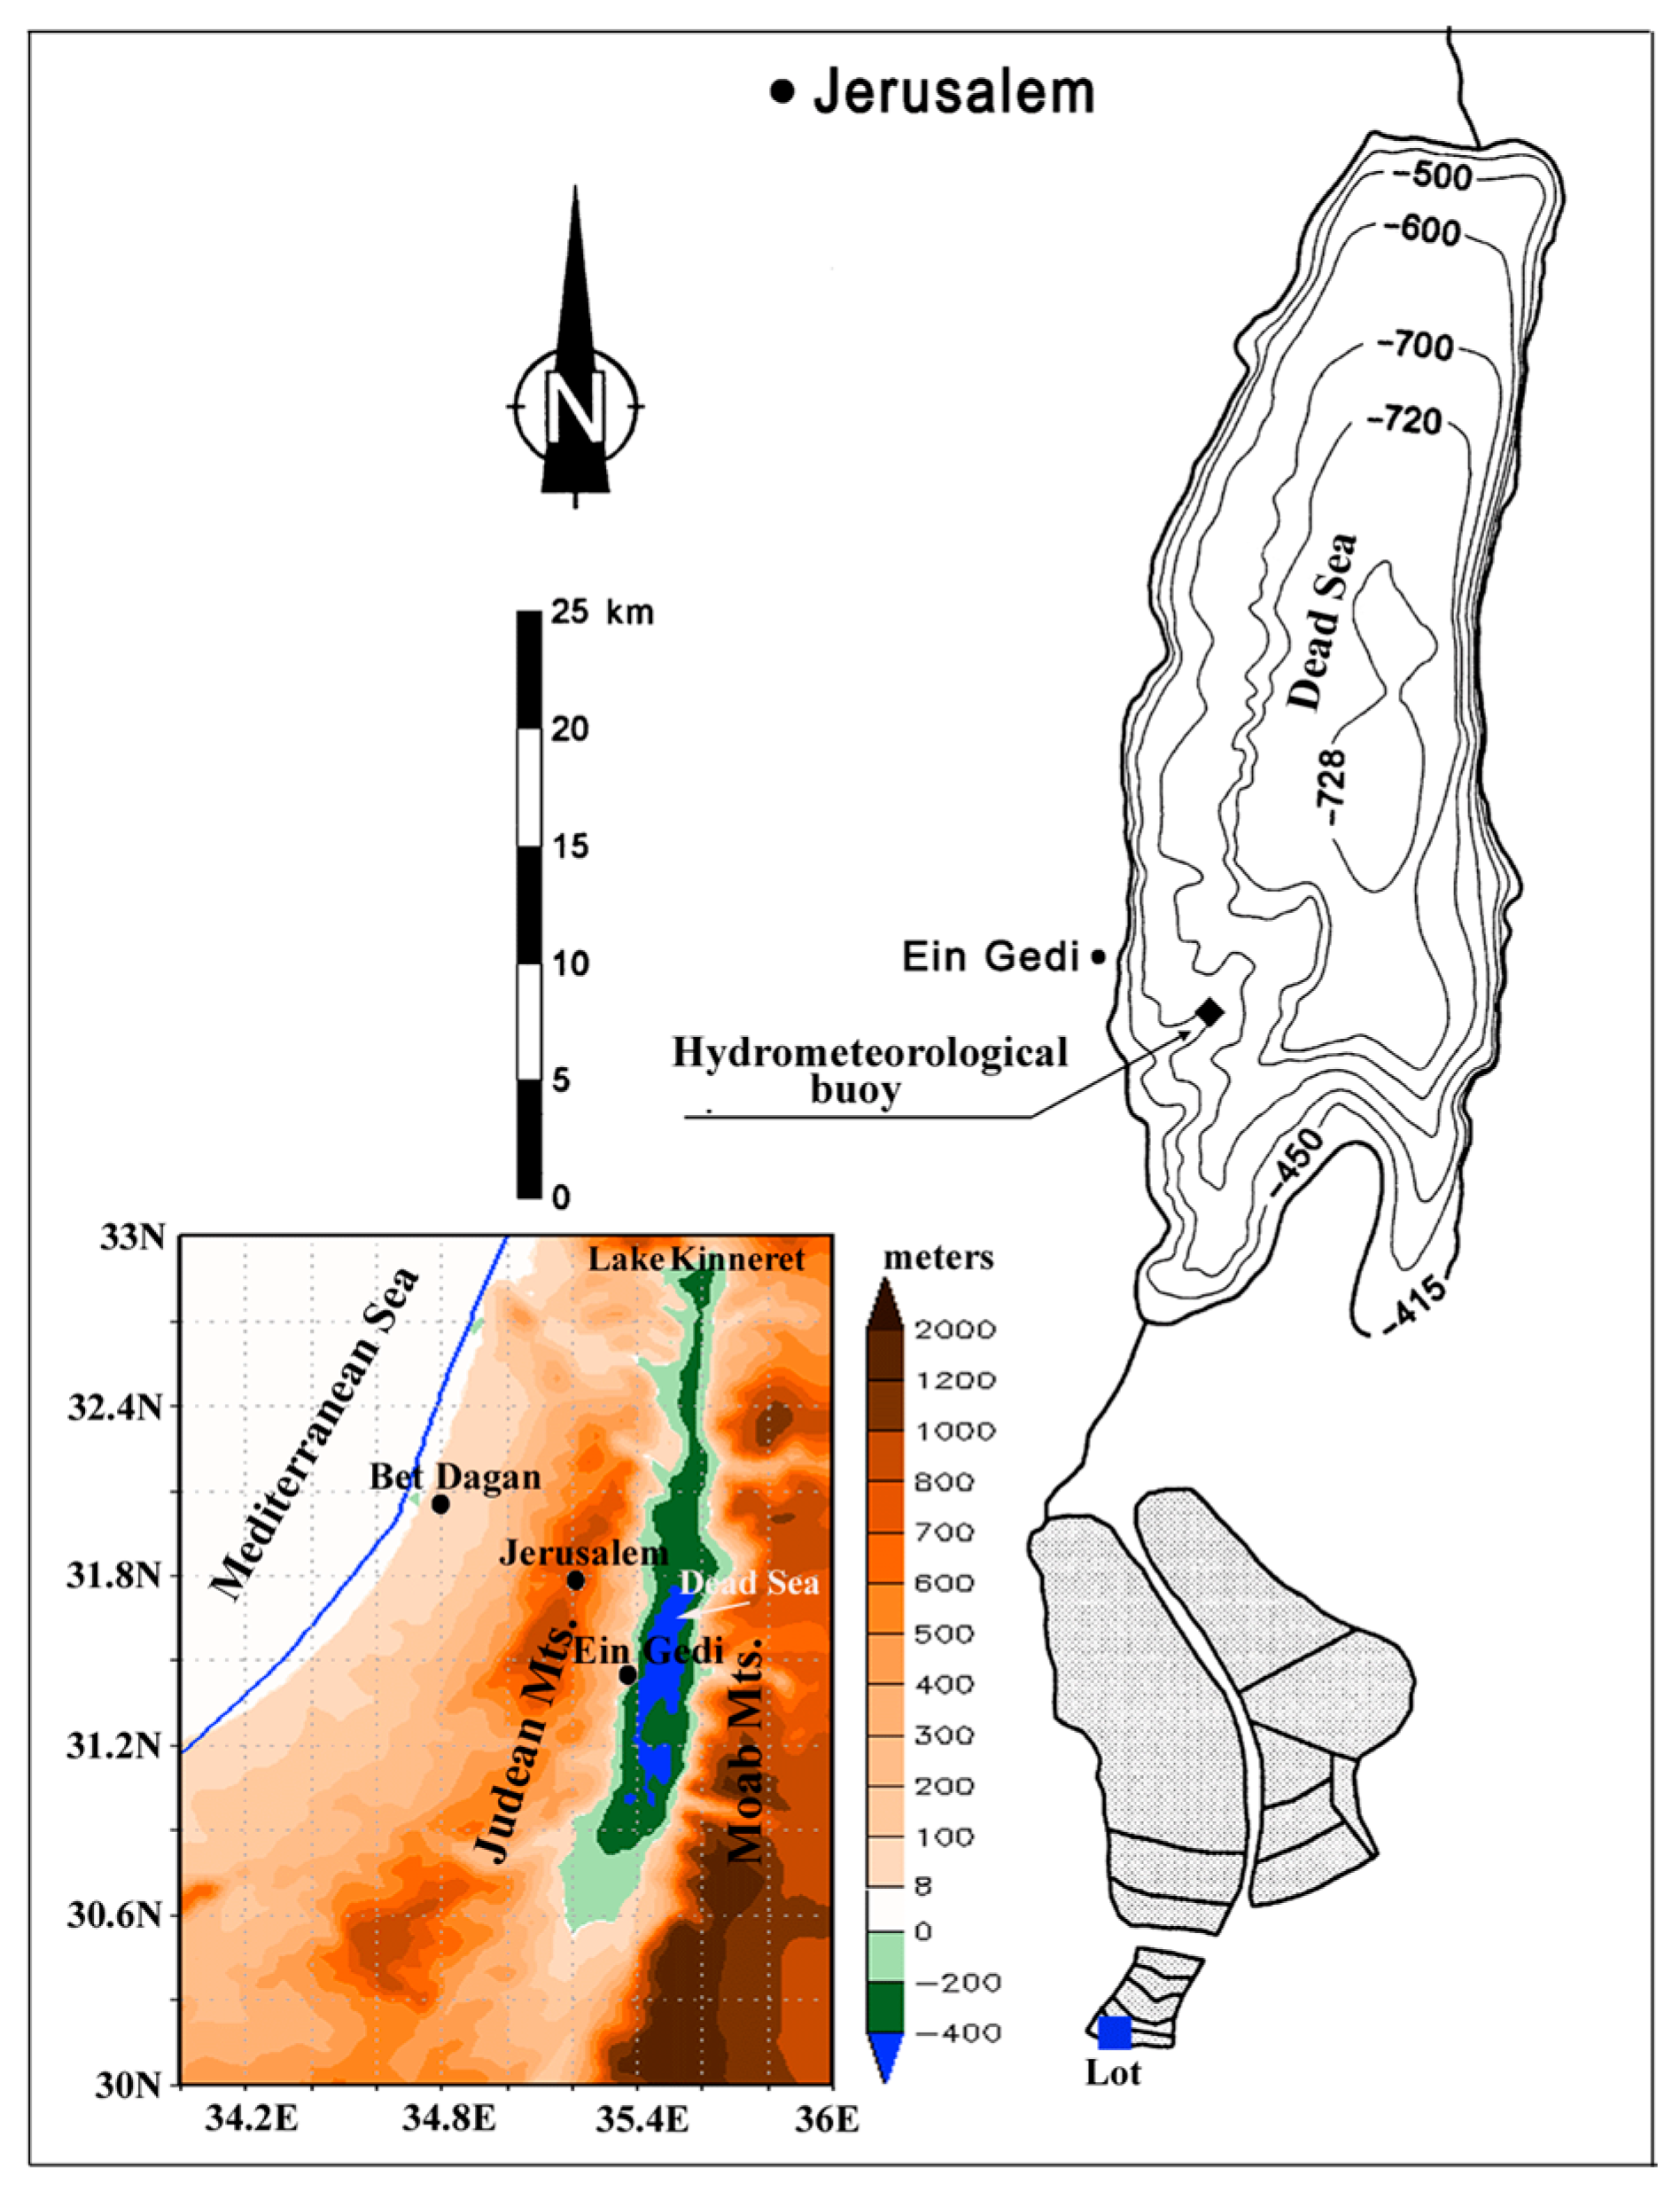
2.1. Dead Sea Study Area
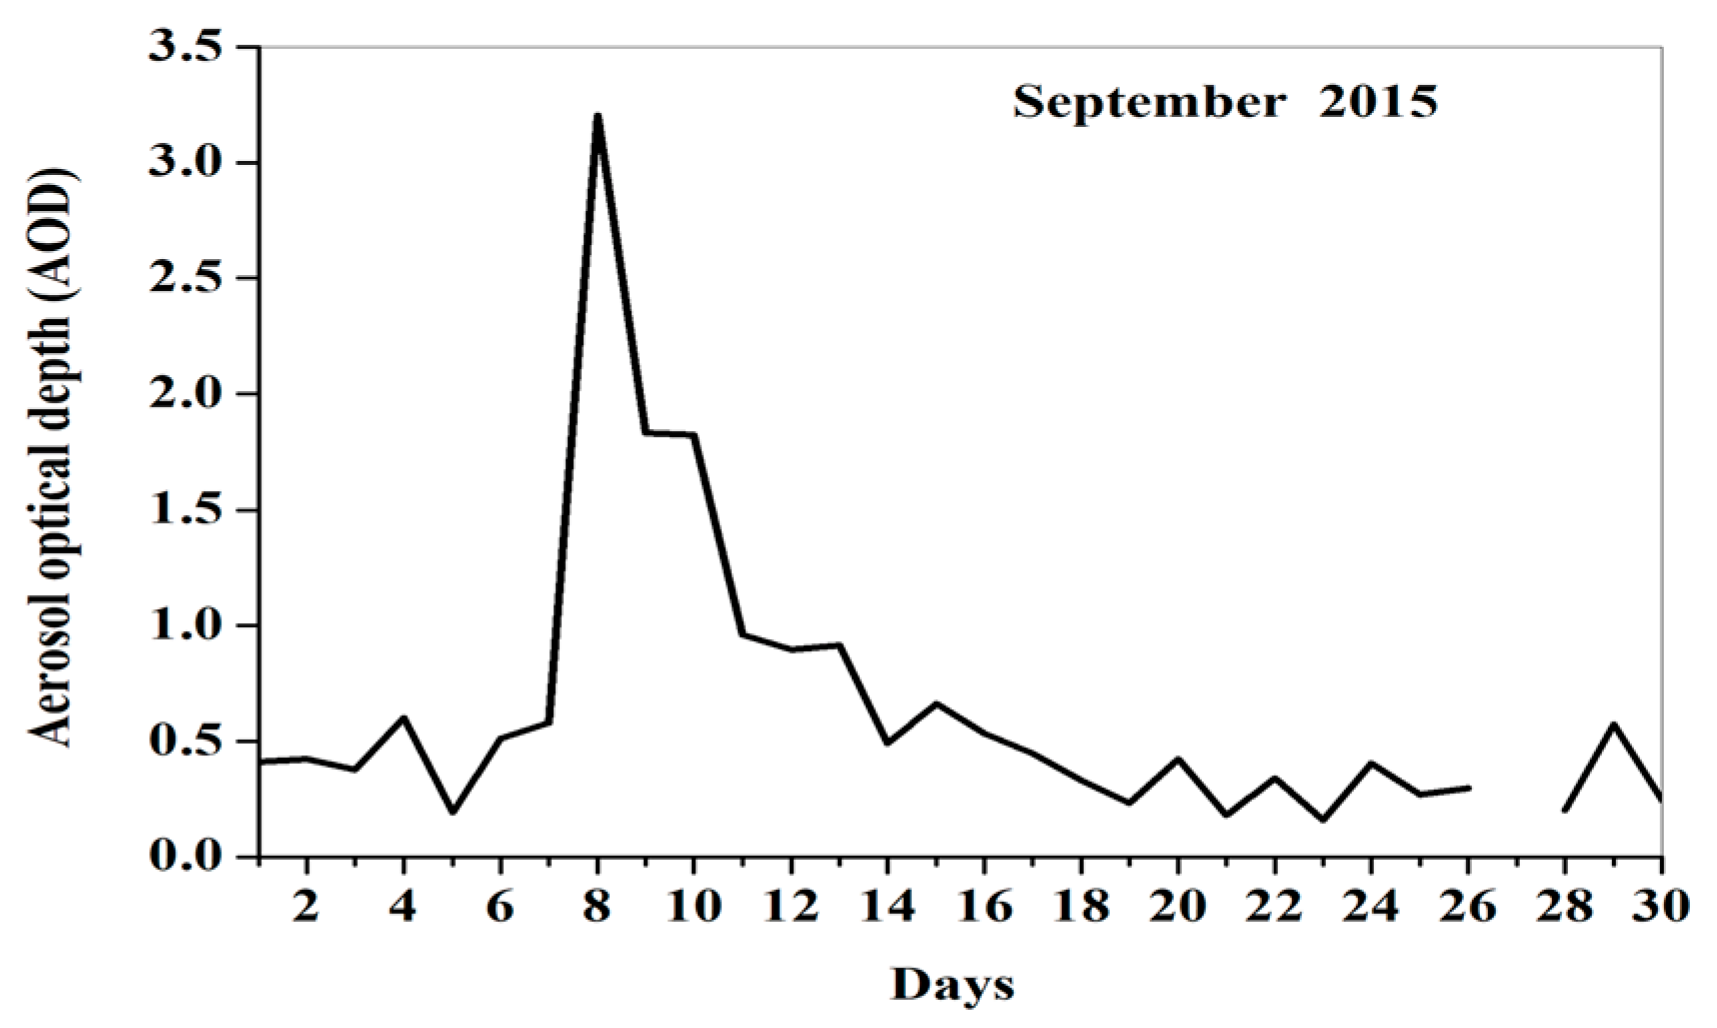
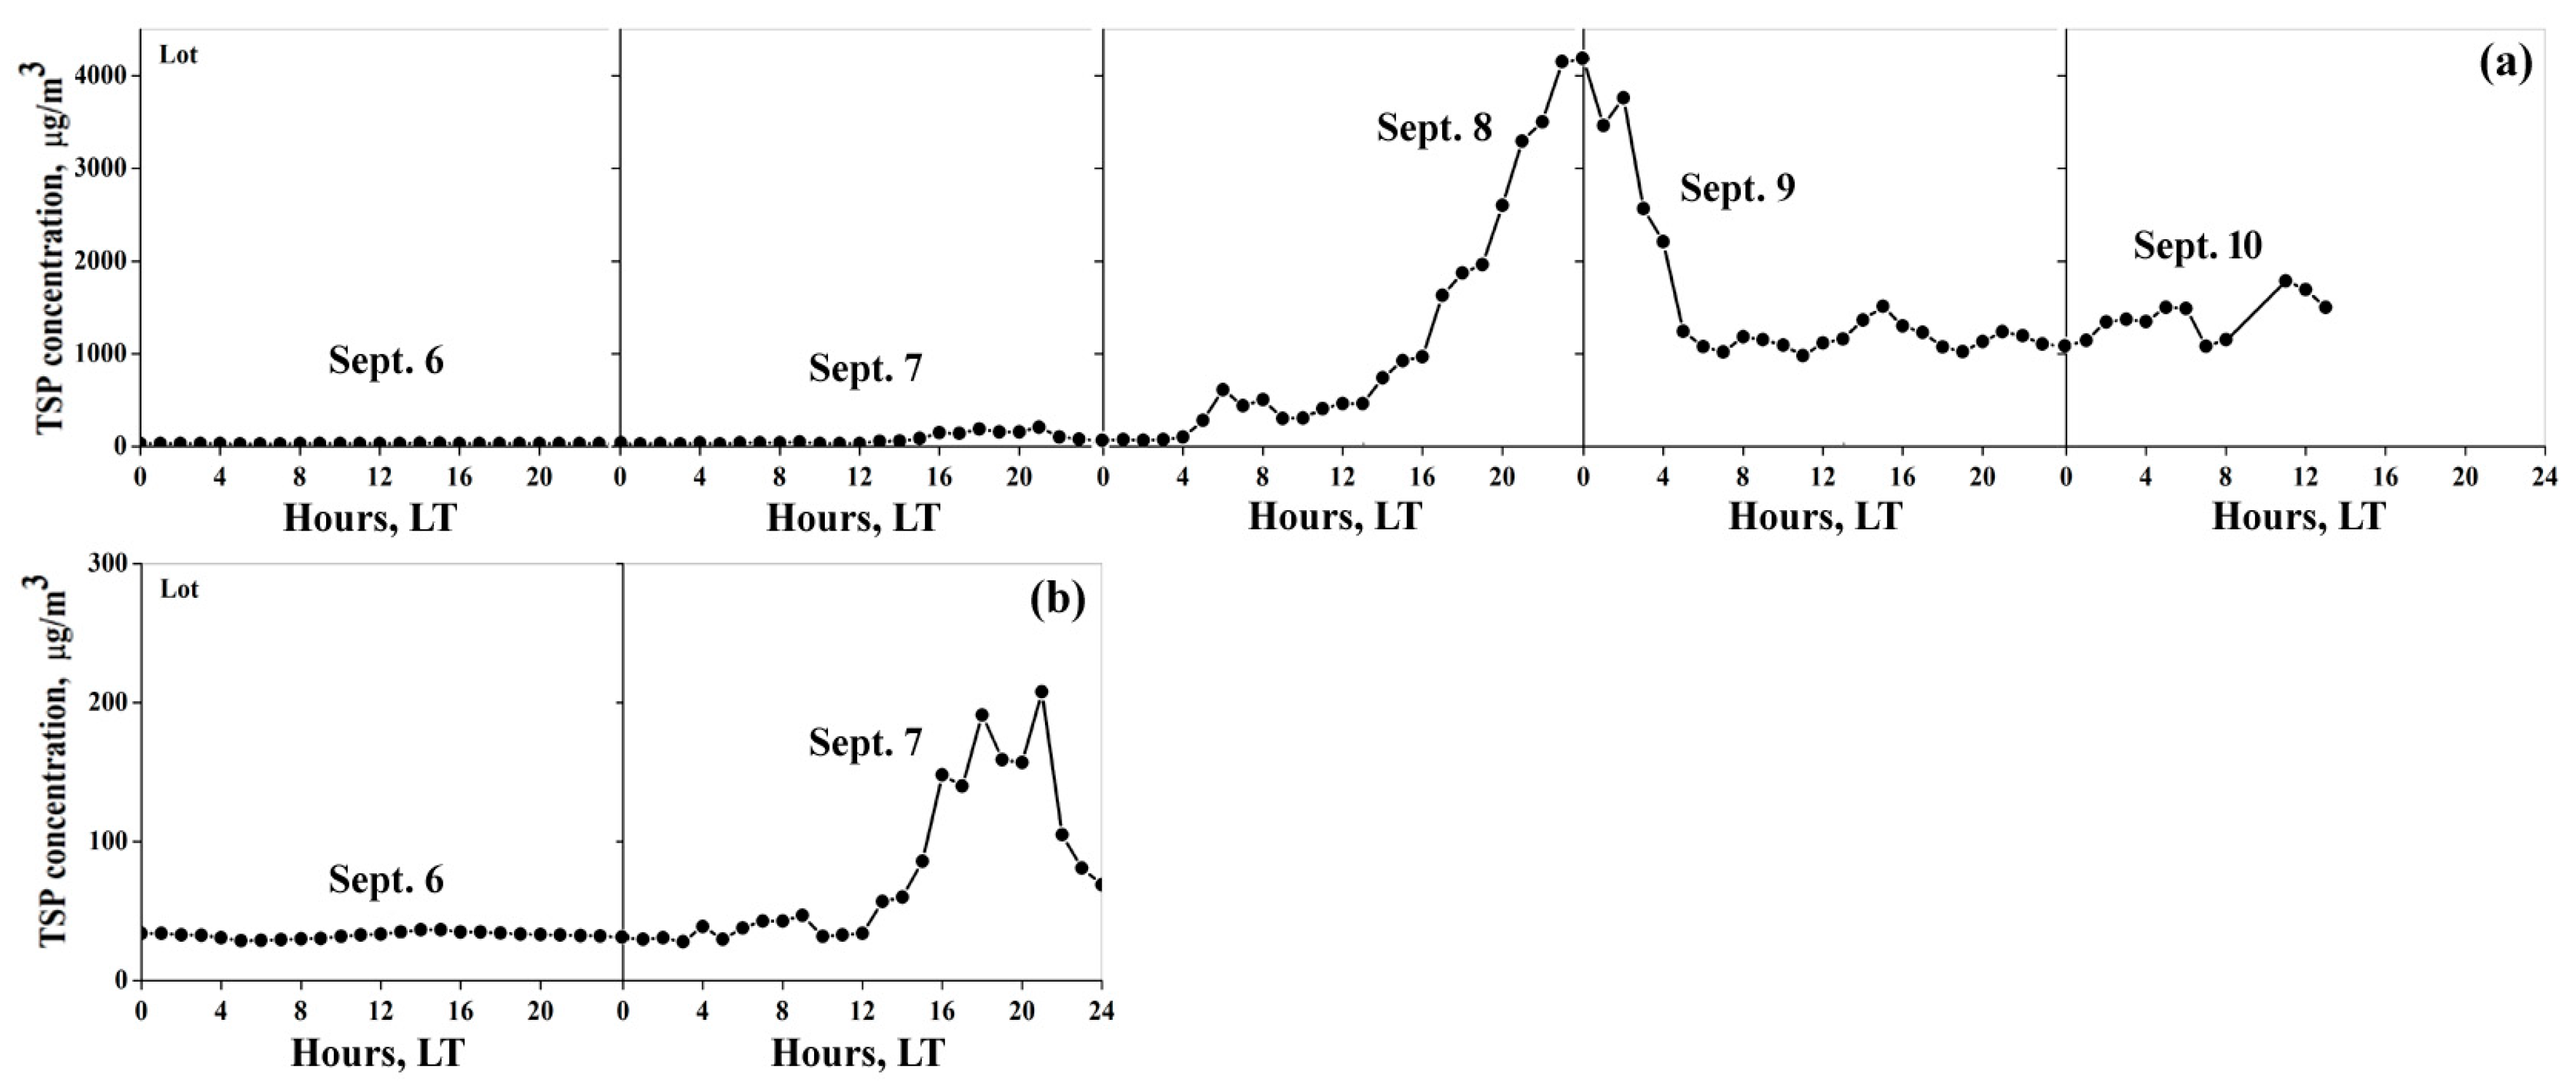
2.2. Severe Dust Intrusion in September 2015
2.3. Method
2.4. Data
3. Results
3.1. Dust Impact on SR
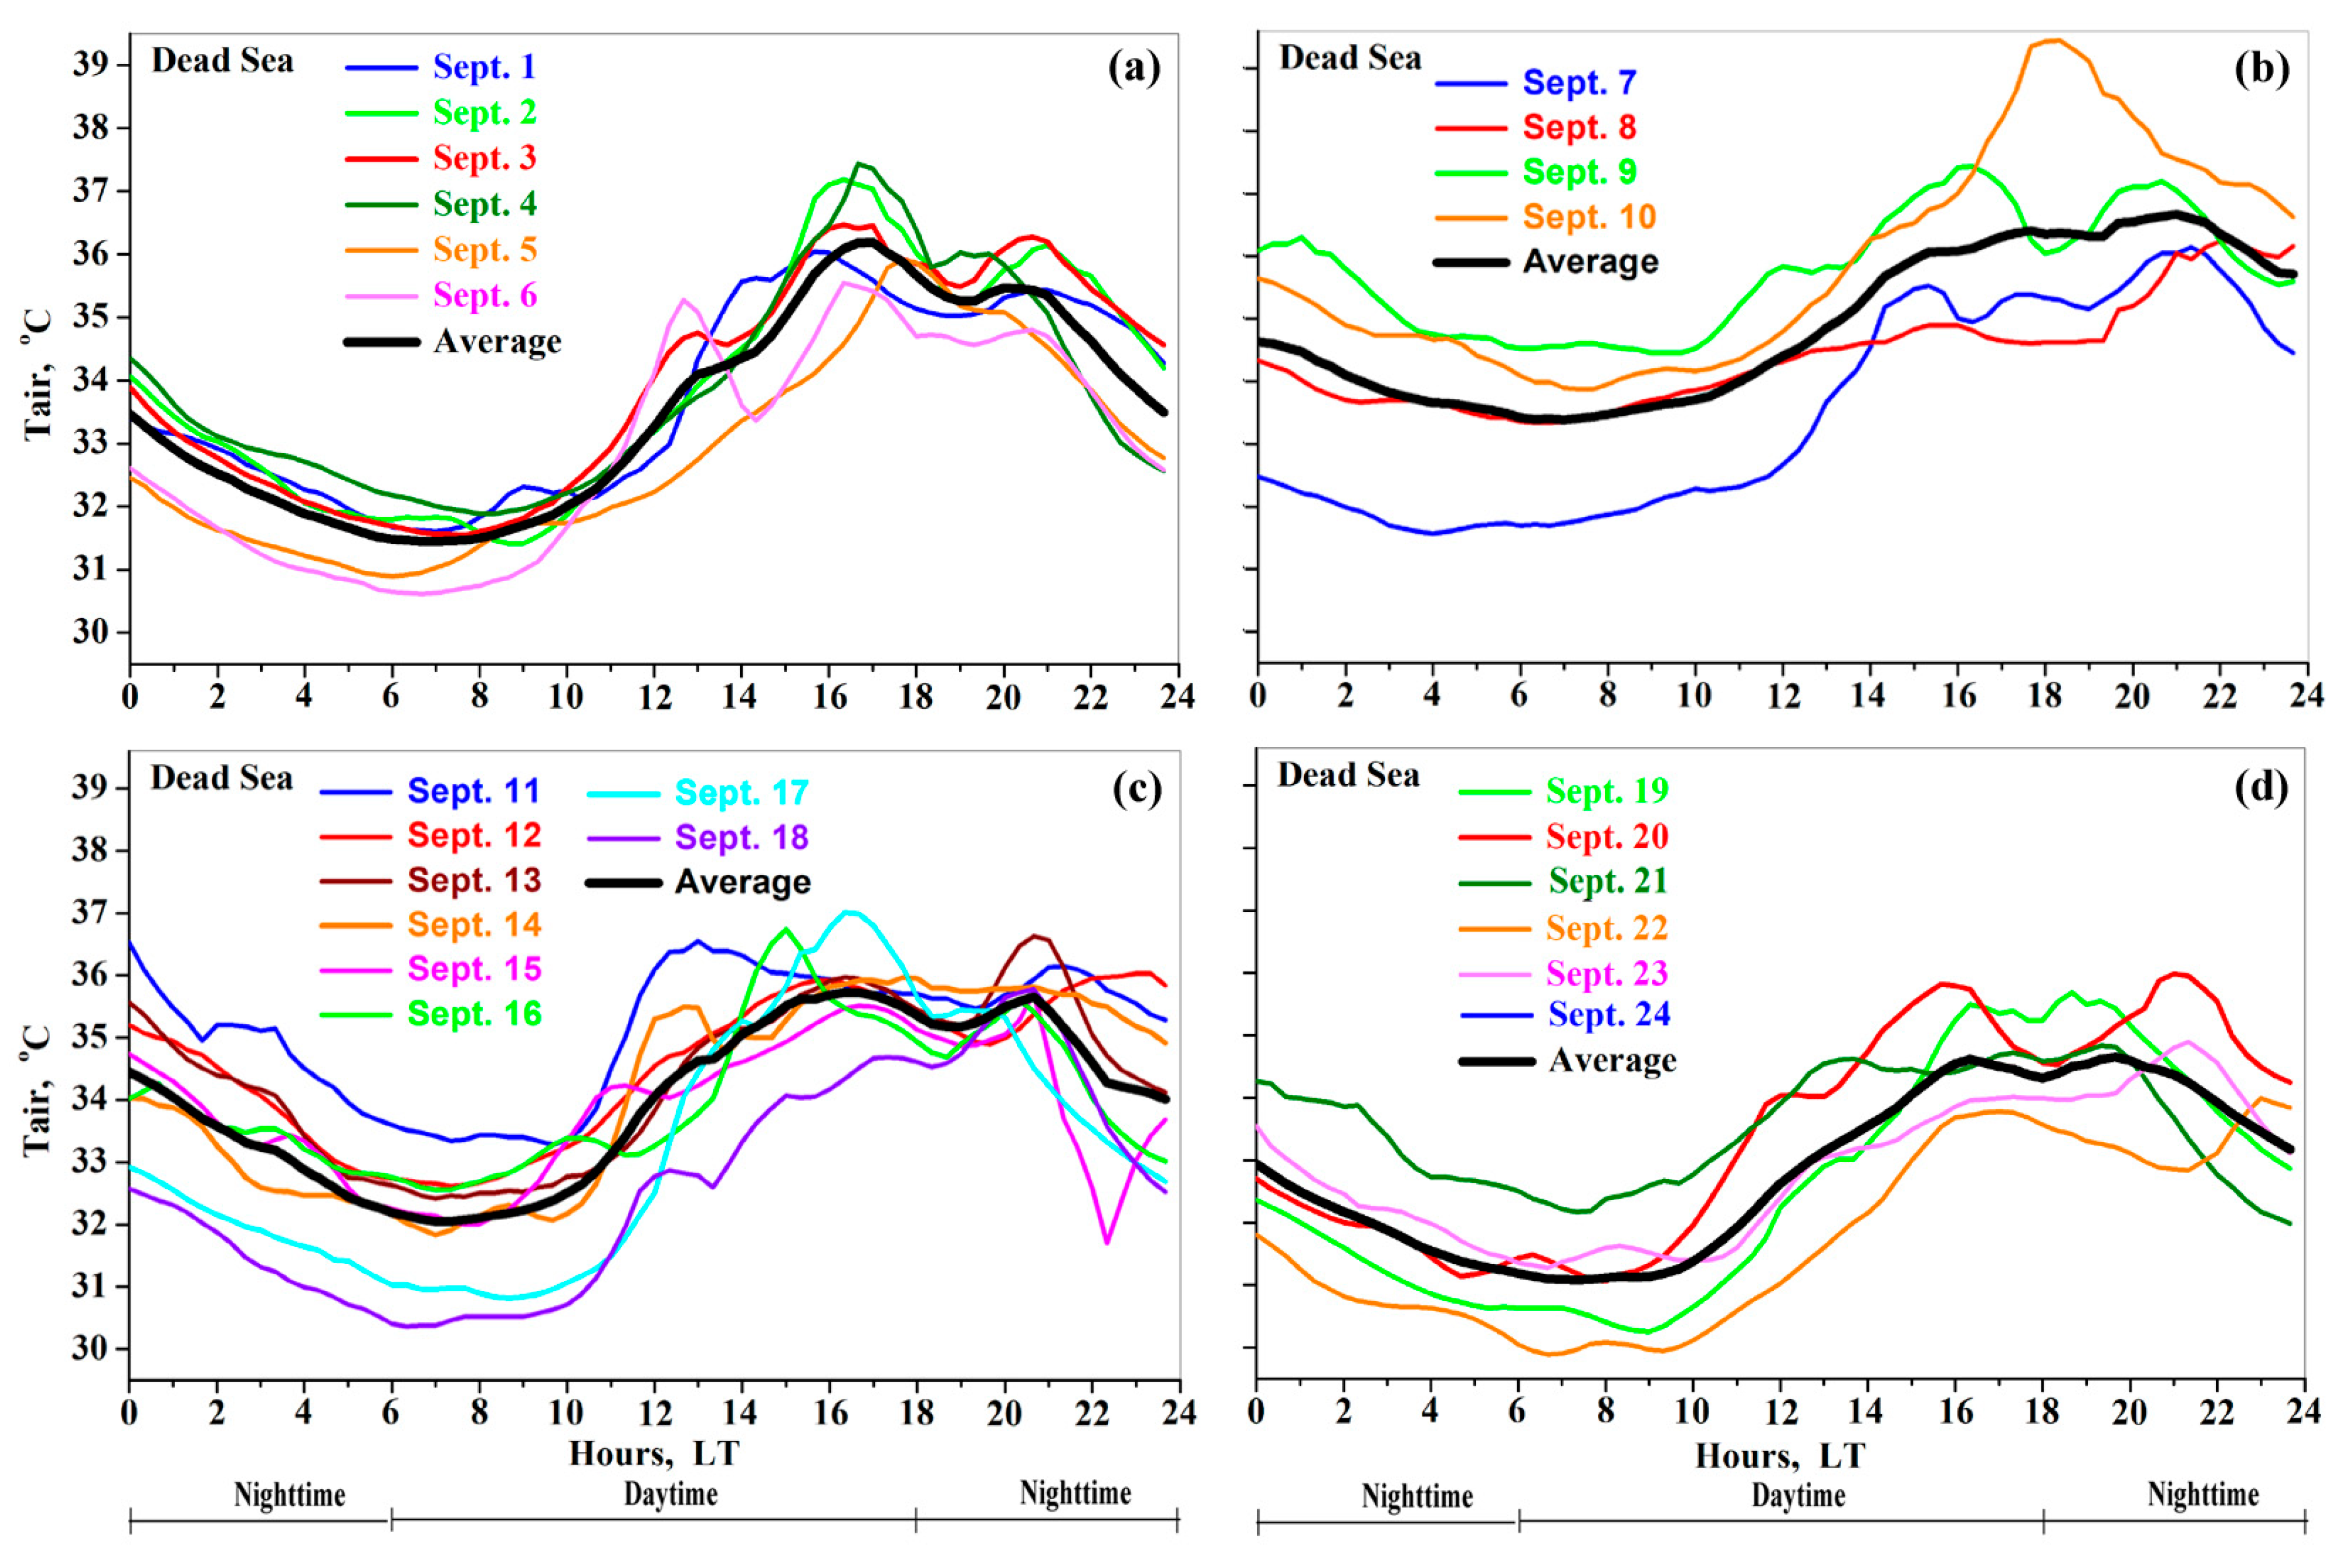
3.2. Dust Impact on Tair
3.3. AHWs over the Dead Sea
3.4. LHWs in the Dead Sea
3.4.1. Buoy SWT
3.4.2. Satellite-Based SWT
3.4.3. Subsurface Lake Heatwaves
4. Discussion
5. Conclusions
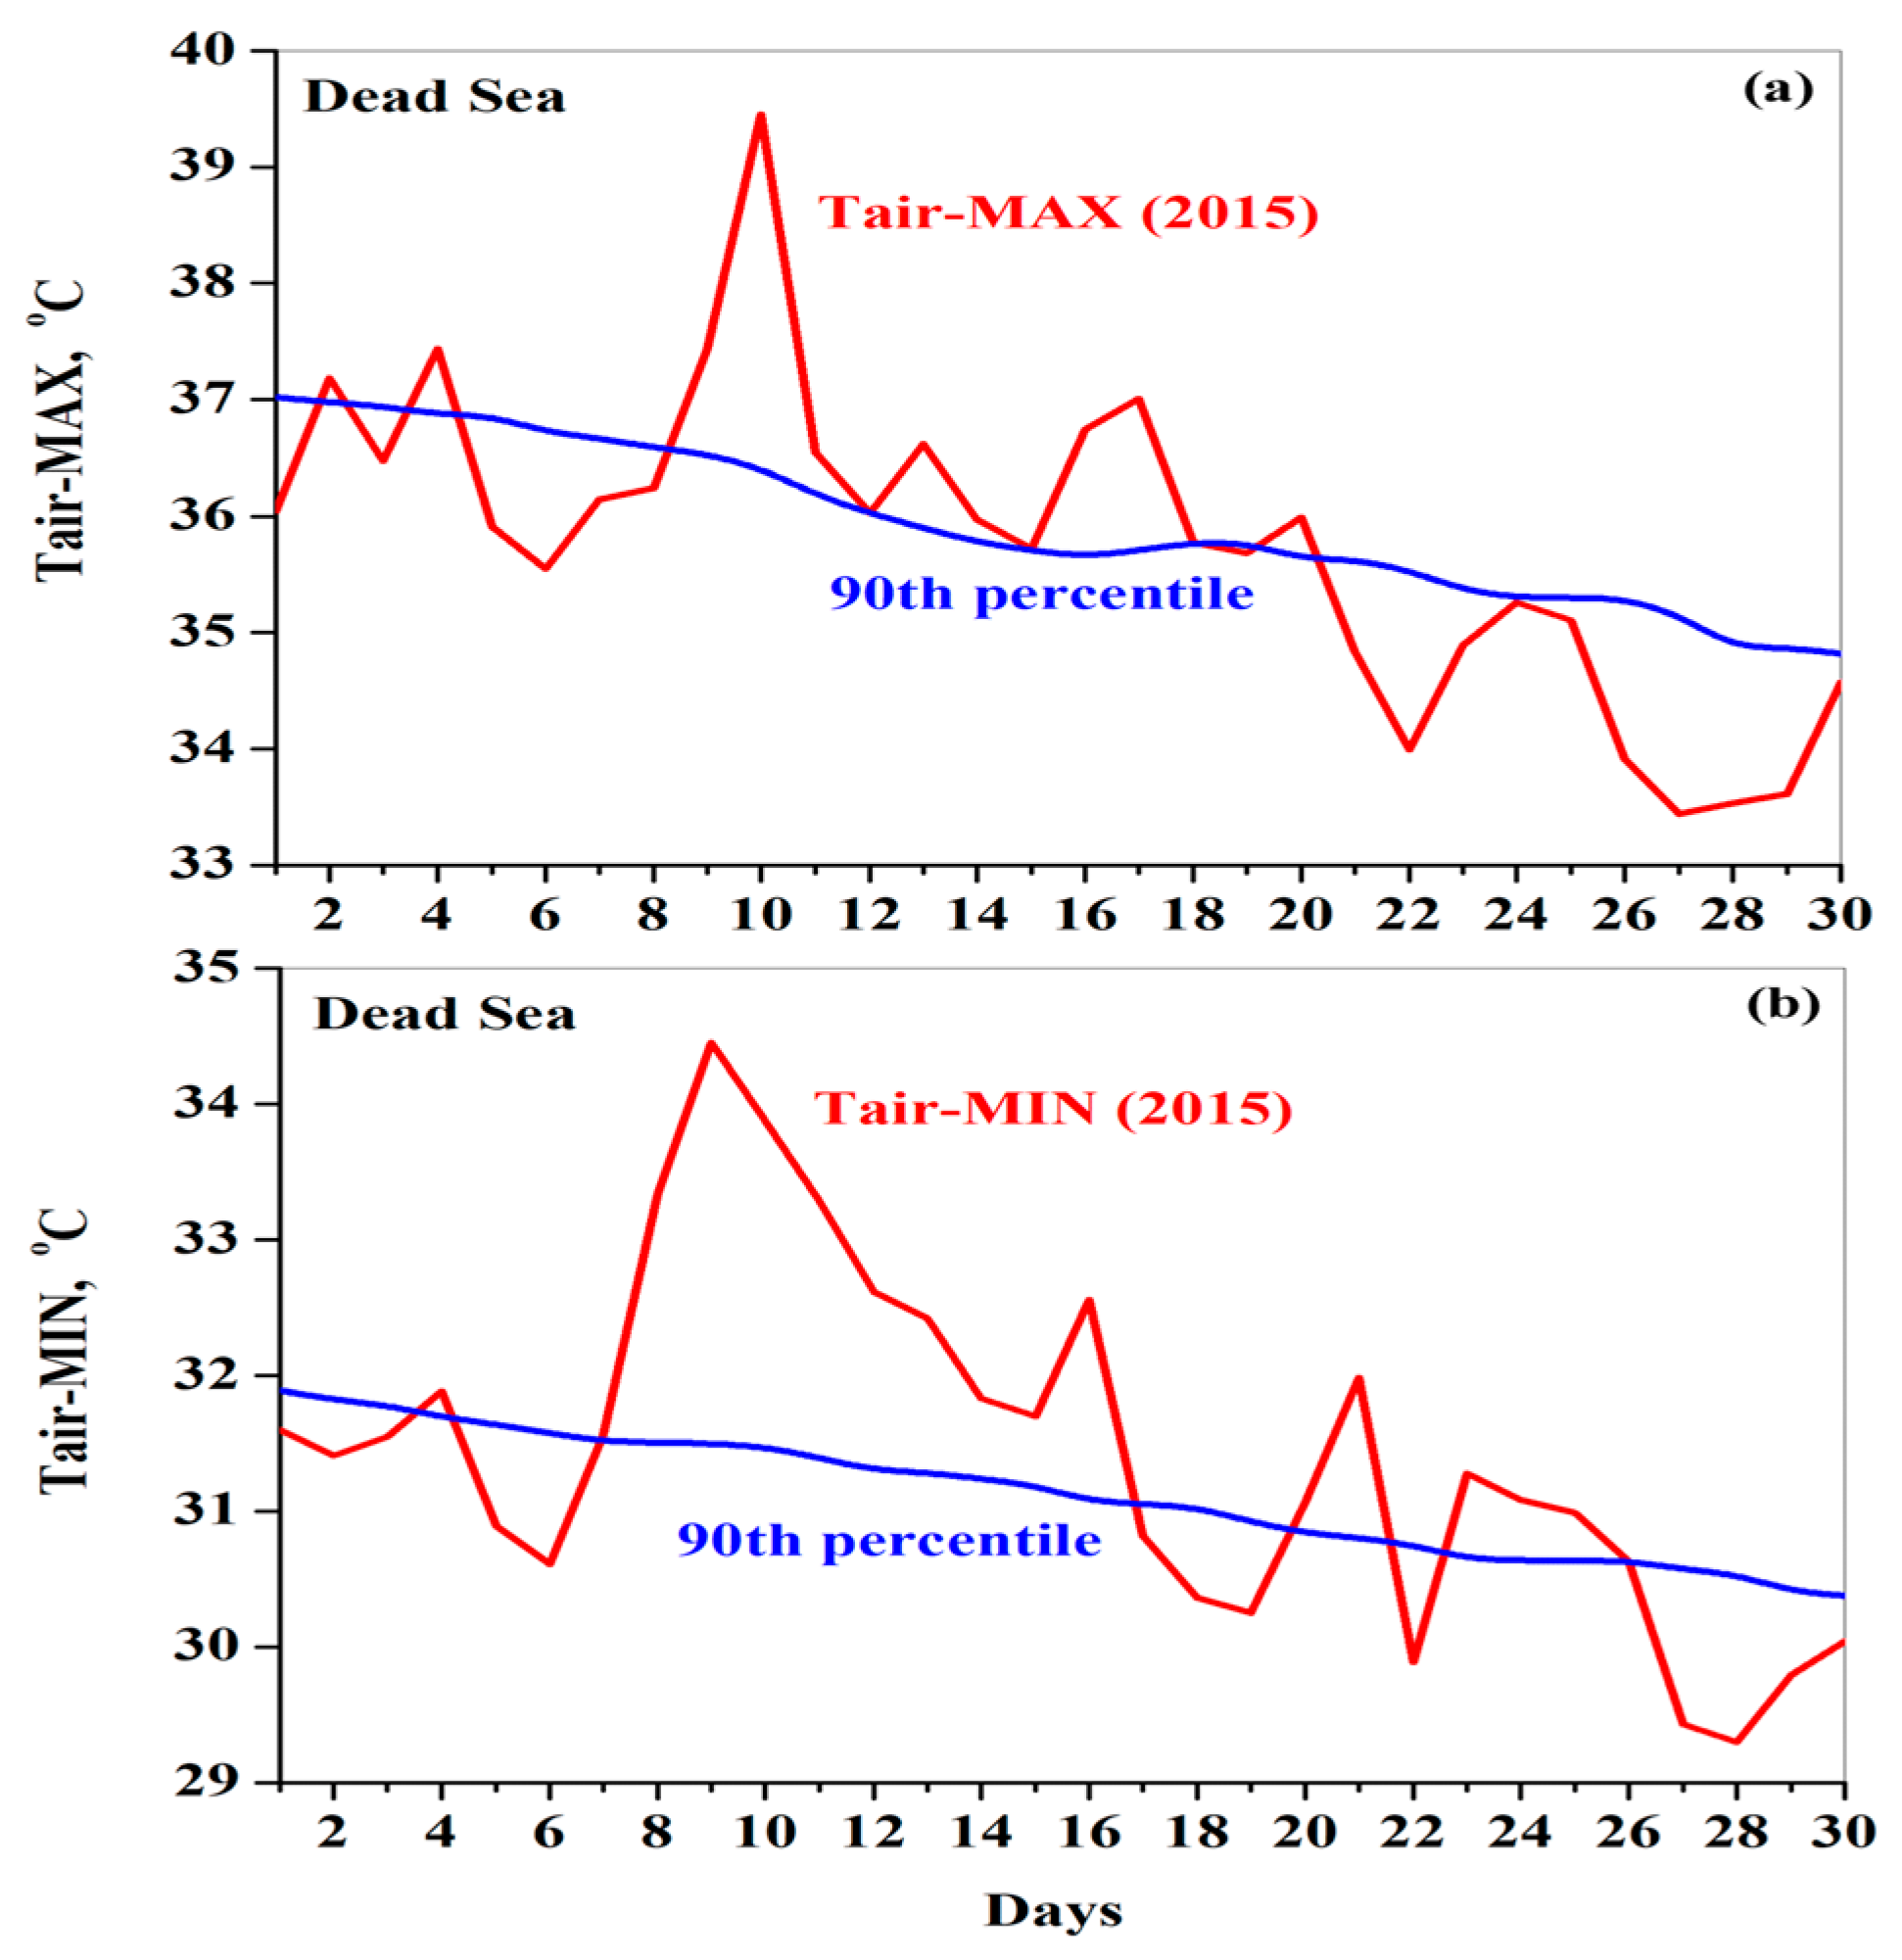
- At the water surface, the LHWs were represented by abnormally high daily maximal and minimal SWT in comparison with their seasonally varied 90th PTHs for 10 consecutive days (7–17 September). In situ-measured Tair and its daily maxima (Tair-MAX) and minima (Tair-MIN) were used as proxies of SWT-MAX and SWT-MIN. The intensity of the surface LHWs was as high as 3 °C.
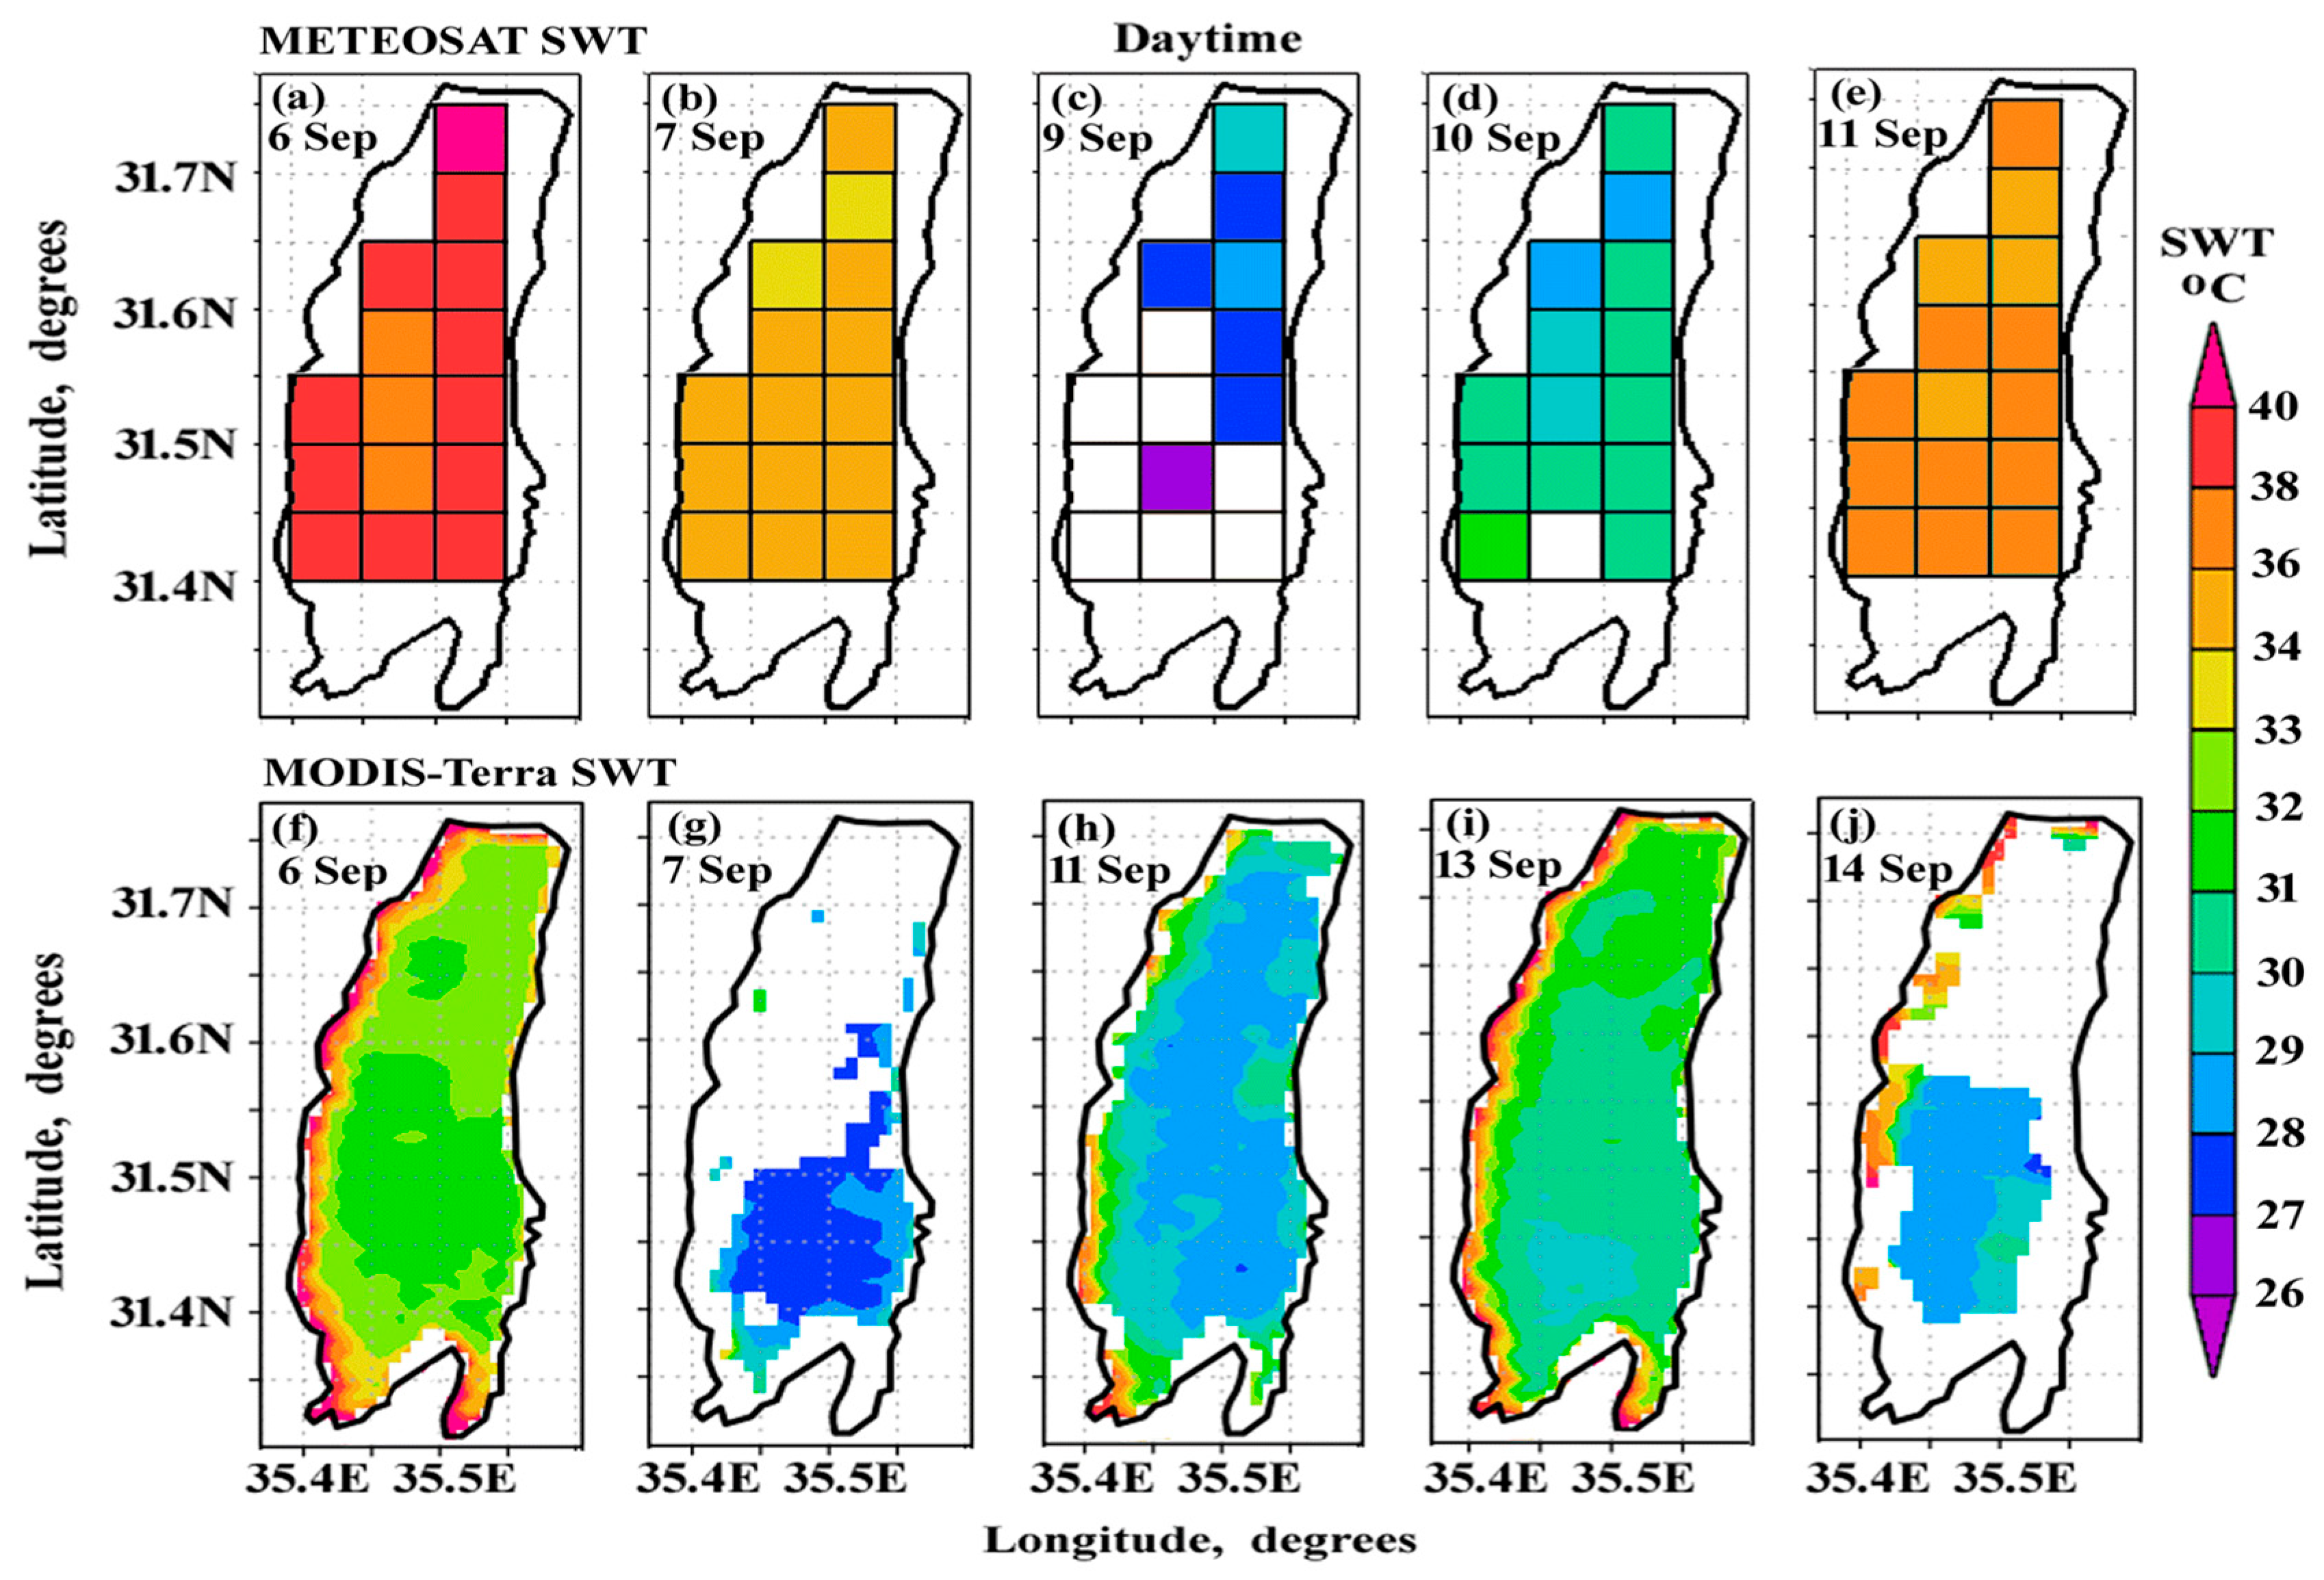
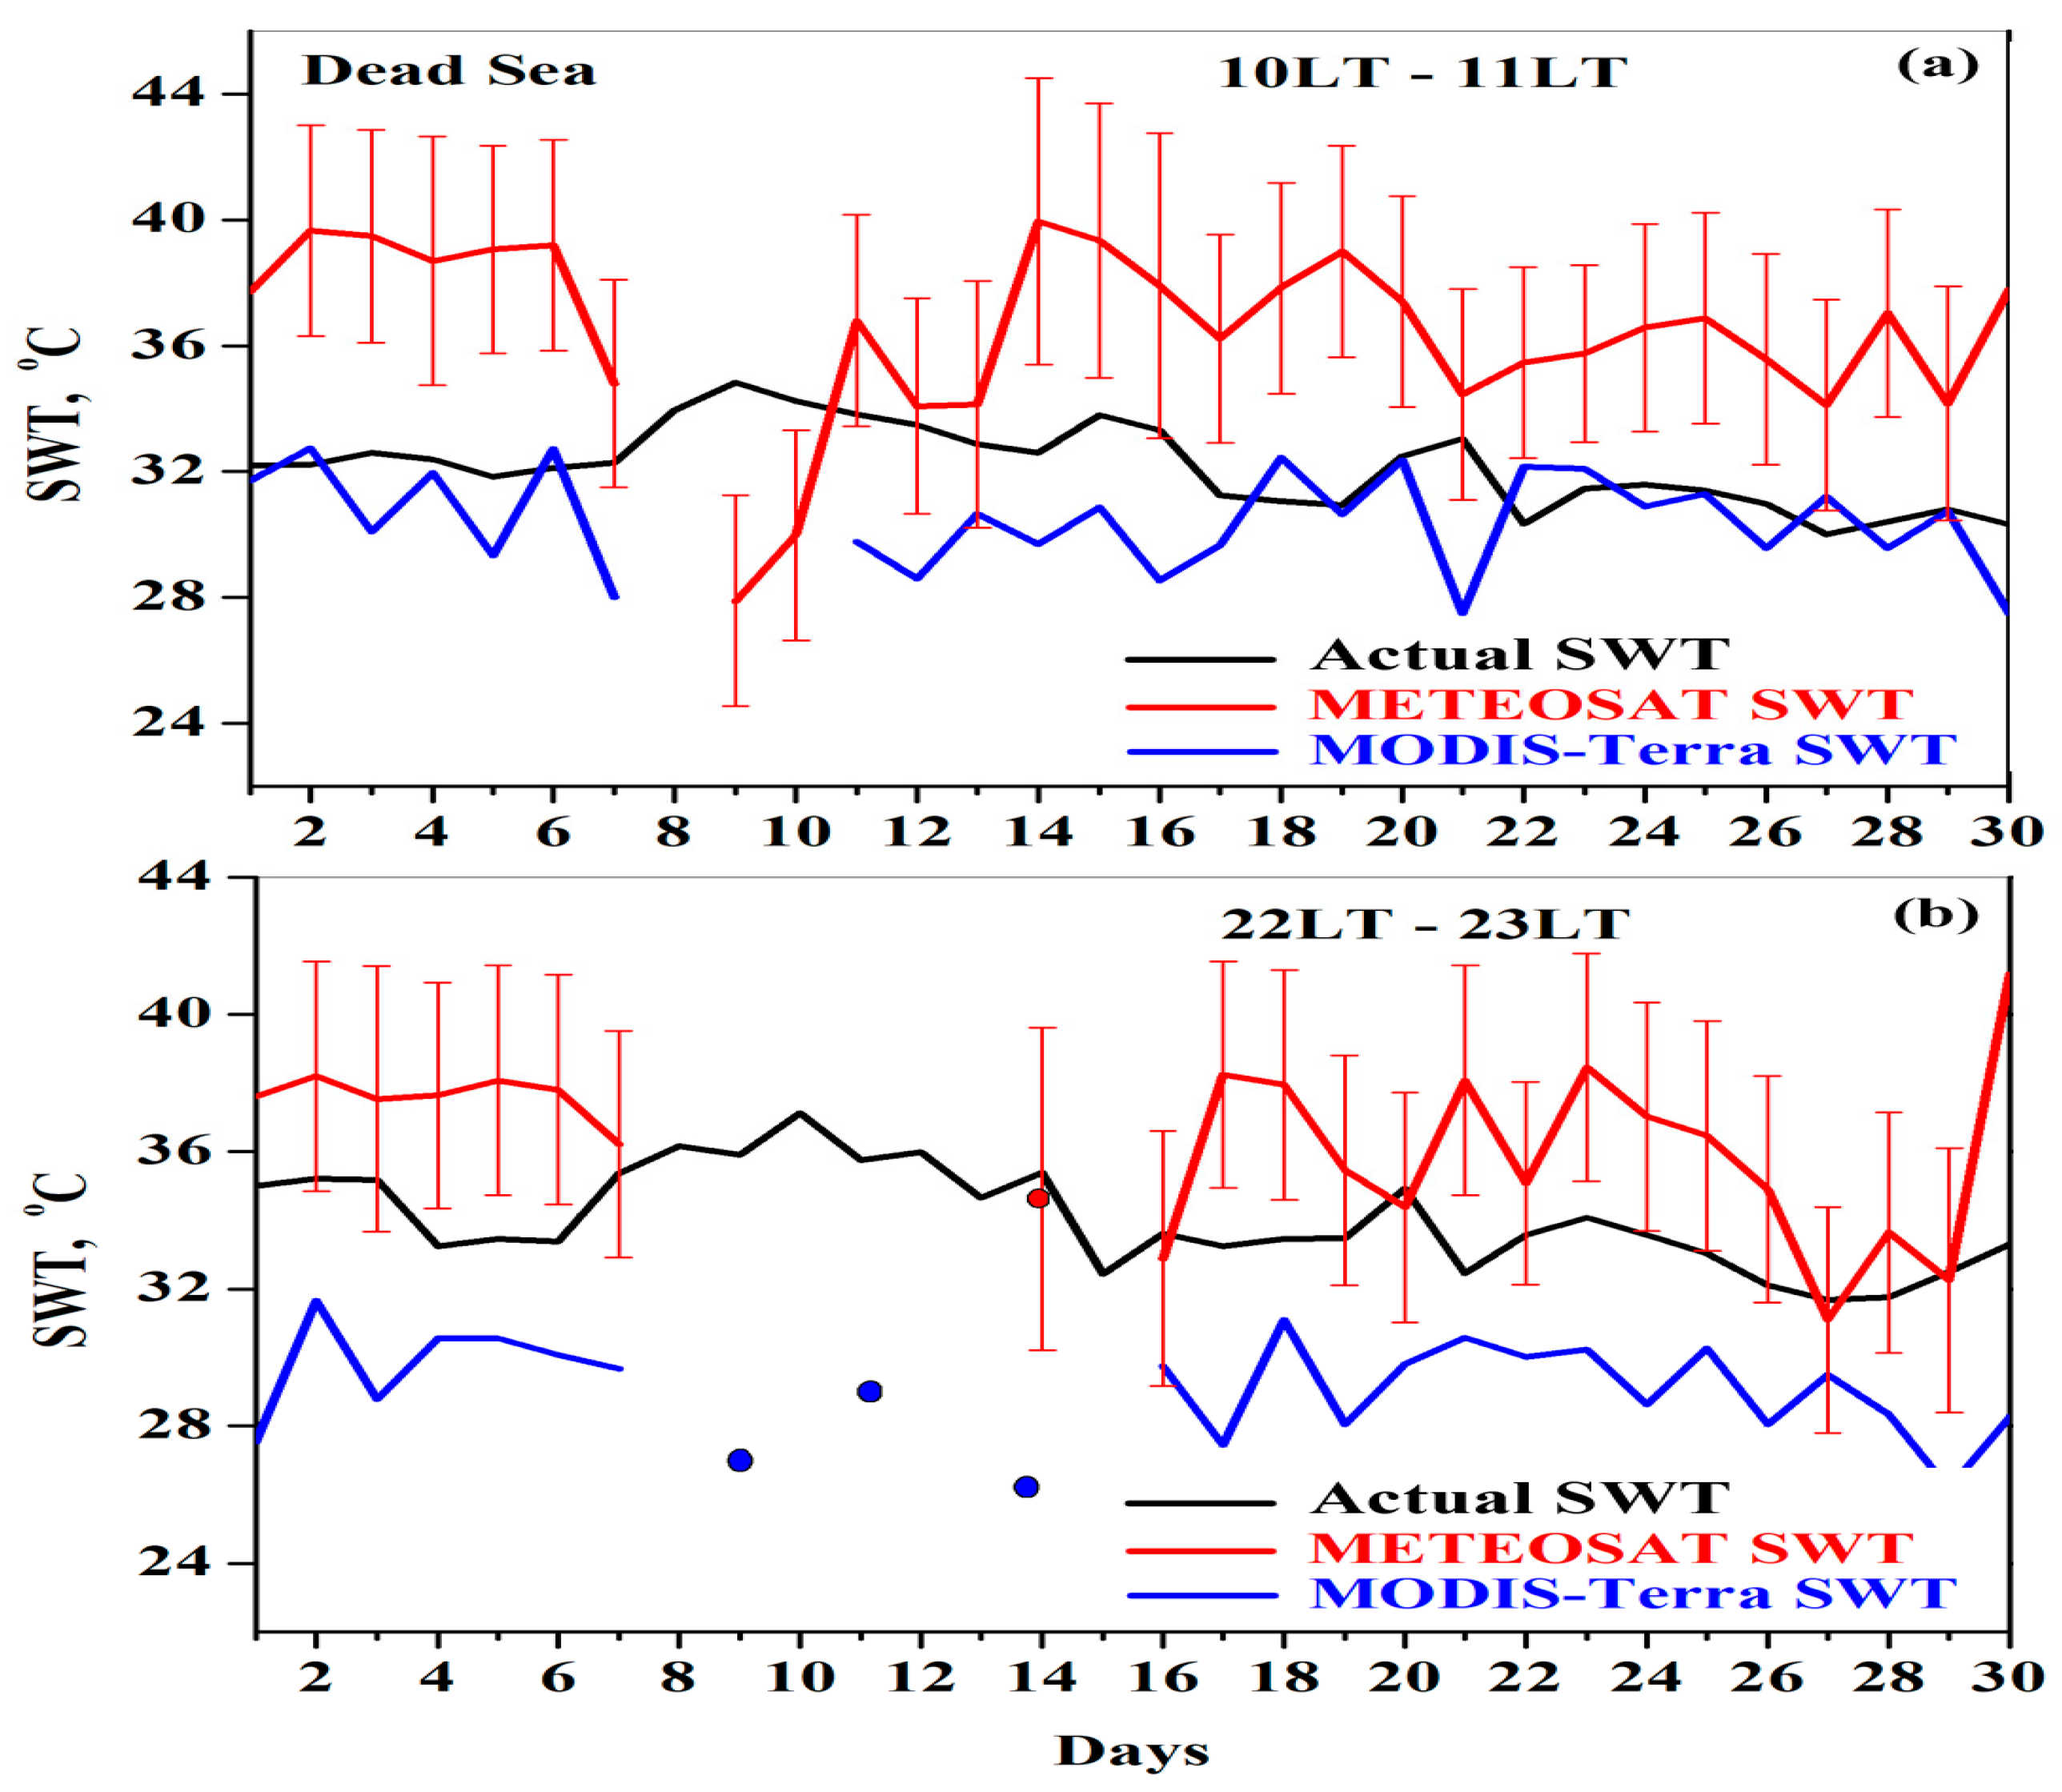
- Satellite SWT data from both orbital (MODIS-Terra) and geostationary (METEOSAT) satellites did not detect the LHWs observed at the Dead Sea surface, in the presence of severe dust intrusion. Instead of an increase in SWT, satellites showed a decrease in SWT, underestimating actual SWT by up to 10 °C. This is because dust-caused infrared (IR) perturbations prevented satellites from conducting accurate IR measurements of SWT.
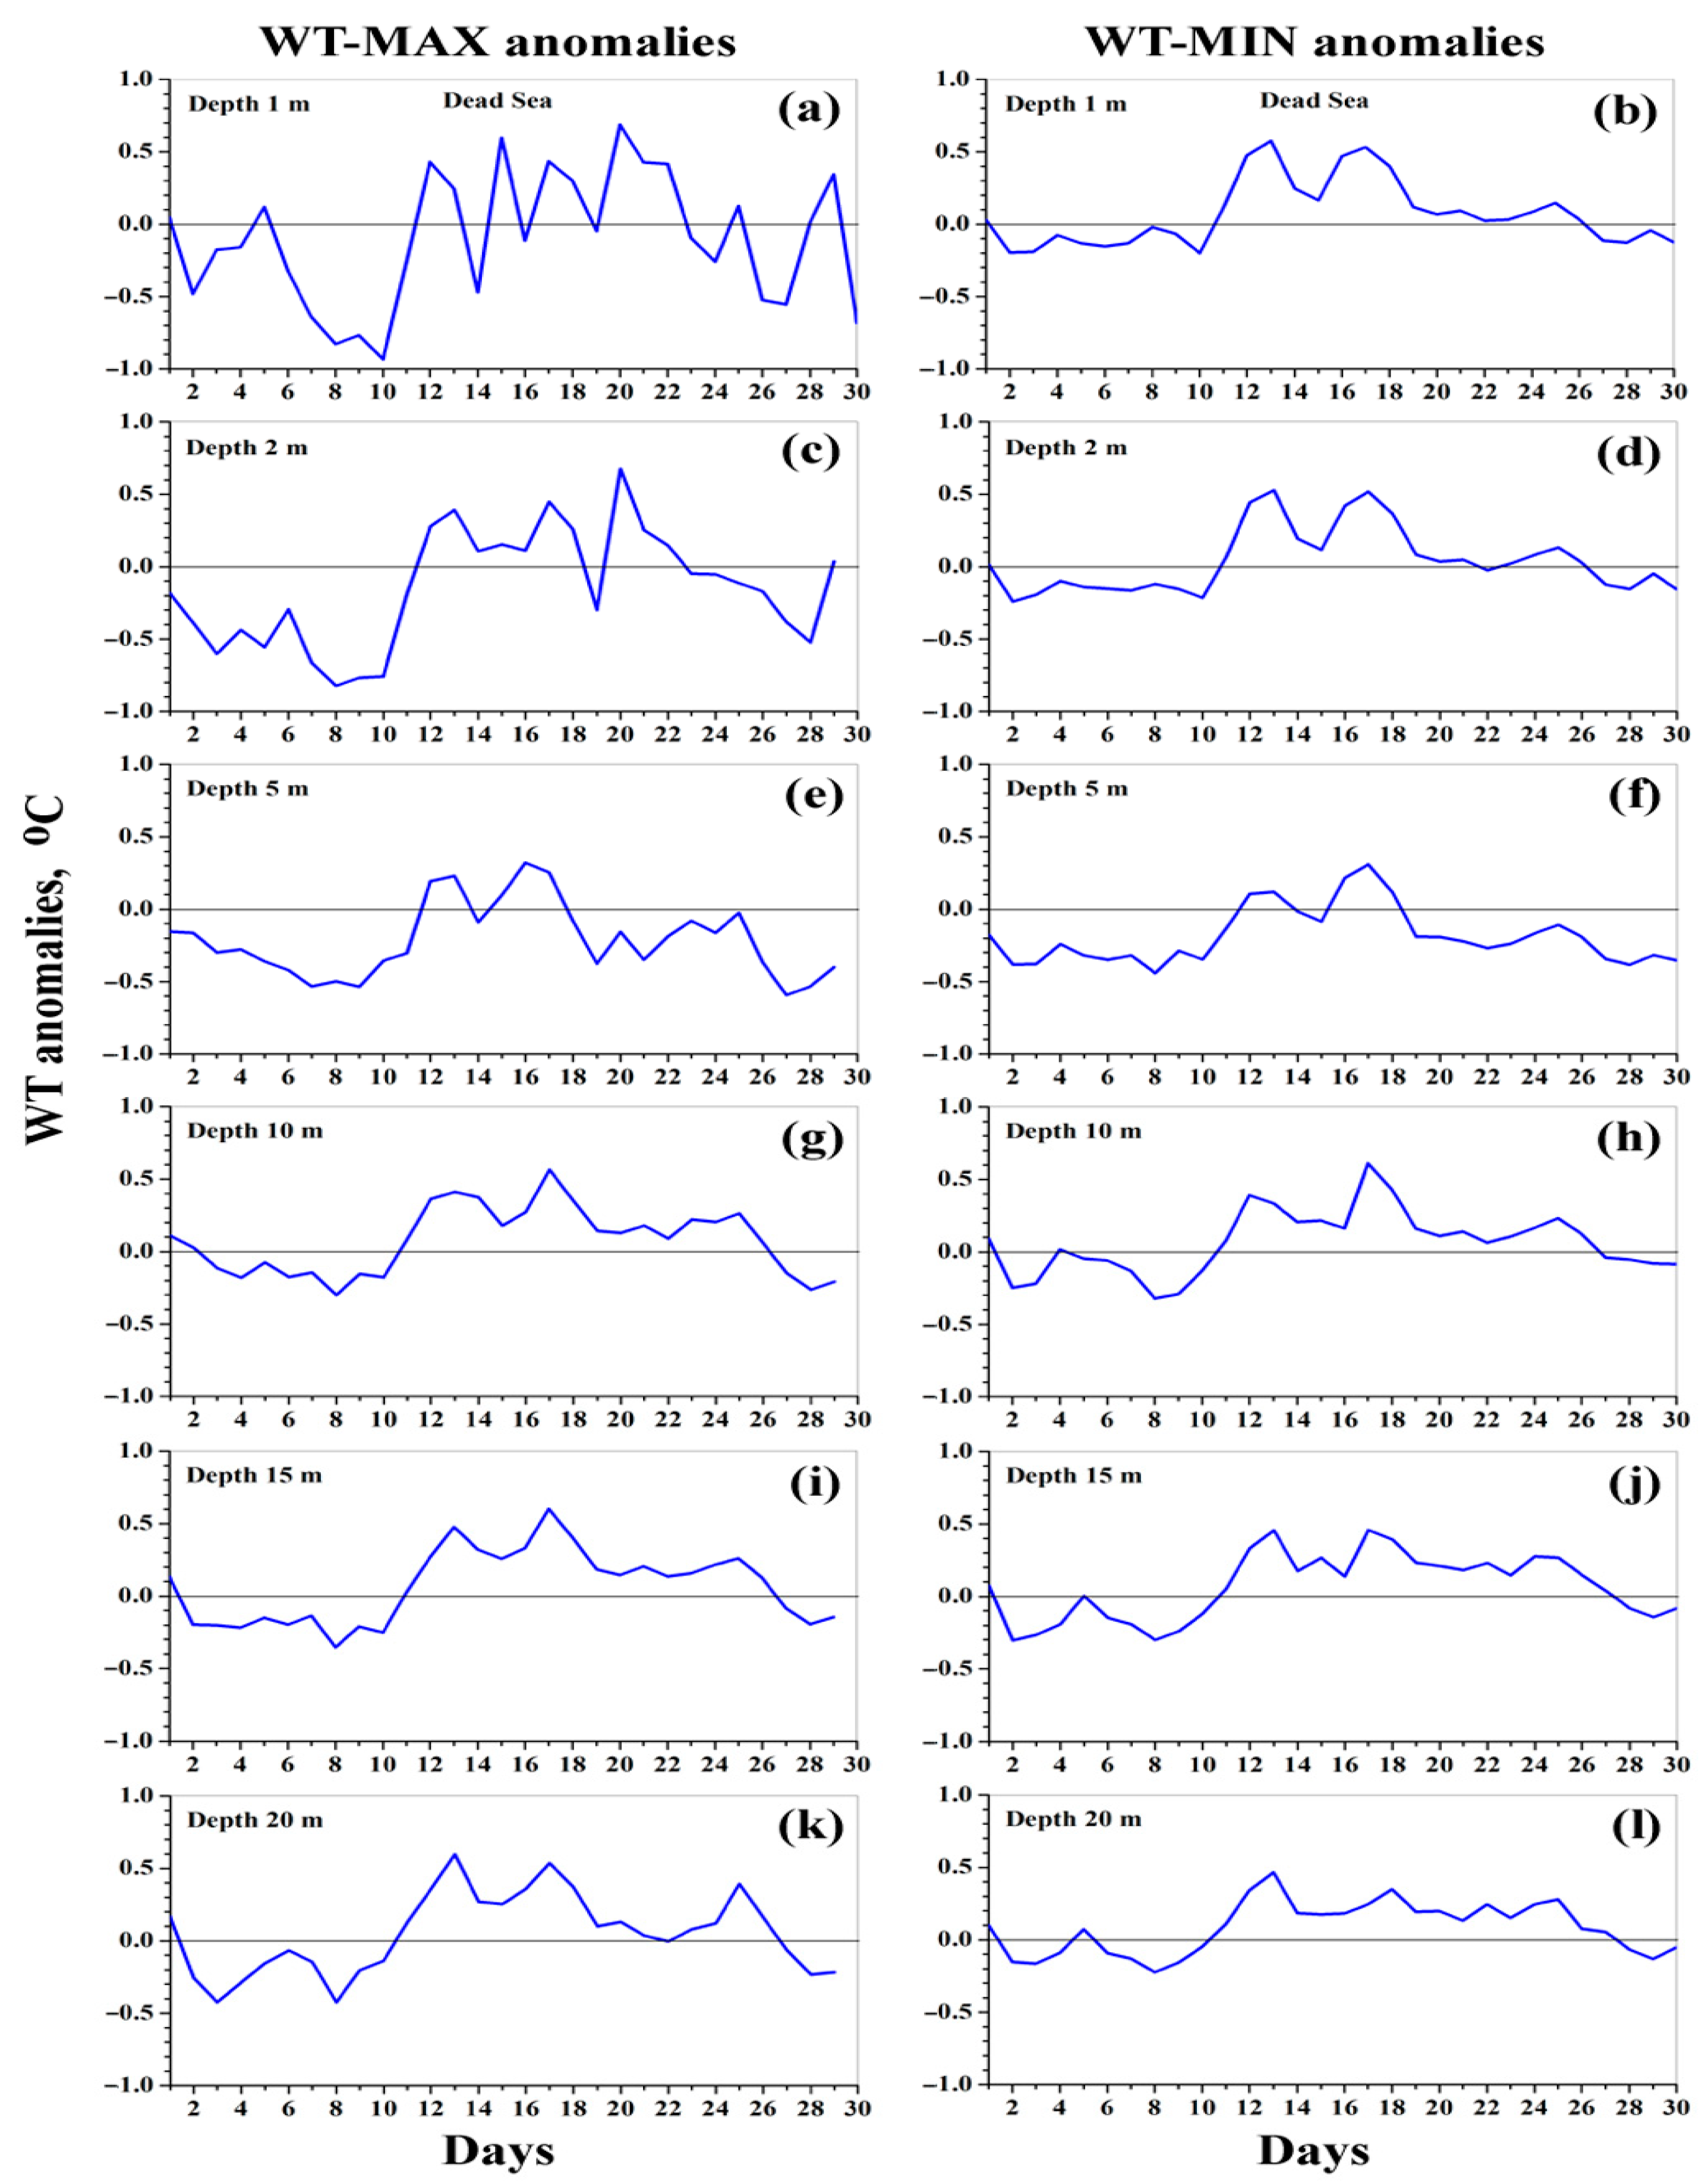
- The formation of surface LHWs was accompanied by the development of subsurface LHWs to a depth of 20 m. The subsurface LHWs lasted longer (16 days) than the surface LHWs (10 days). There was a 4-day delay between the first date of the surface LHWs (7 September) and the start date of the subsurface LHWs (11 September). The maximal intensity of the subsurface LHWs decreased with depth from 1m (0.6 °C) to 5 m (0.3 °C), followed by an increase (up to 0.6 °C) at the deeper layers (from 10 m to 20 m).
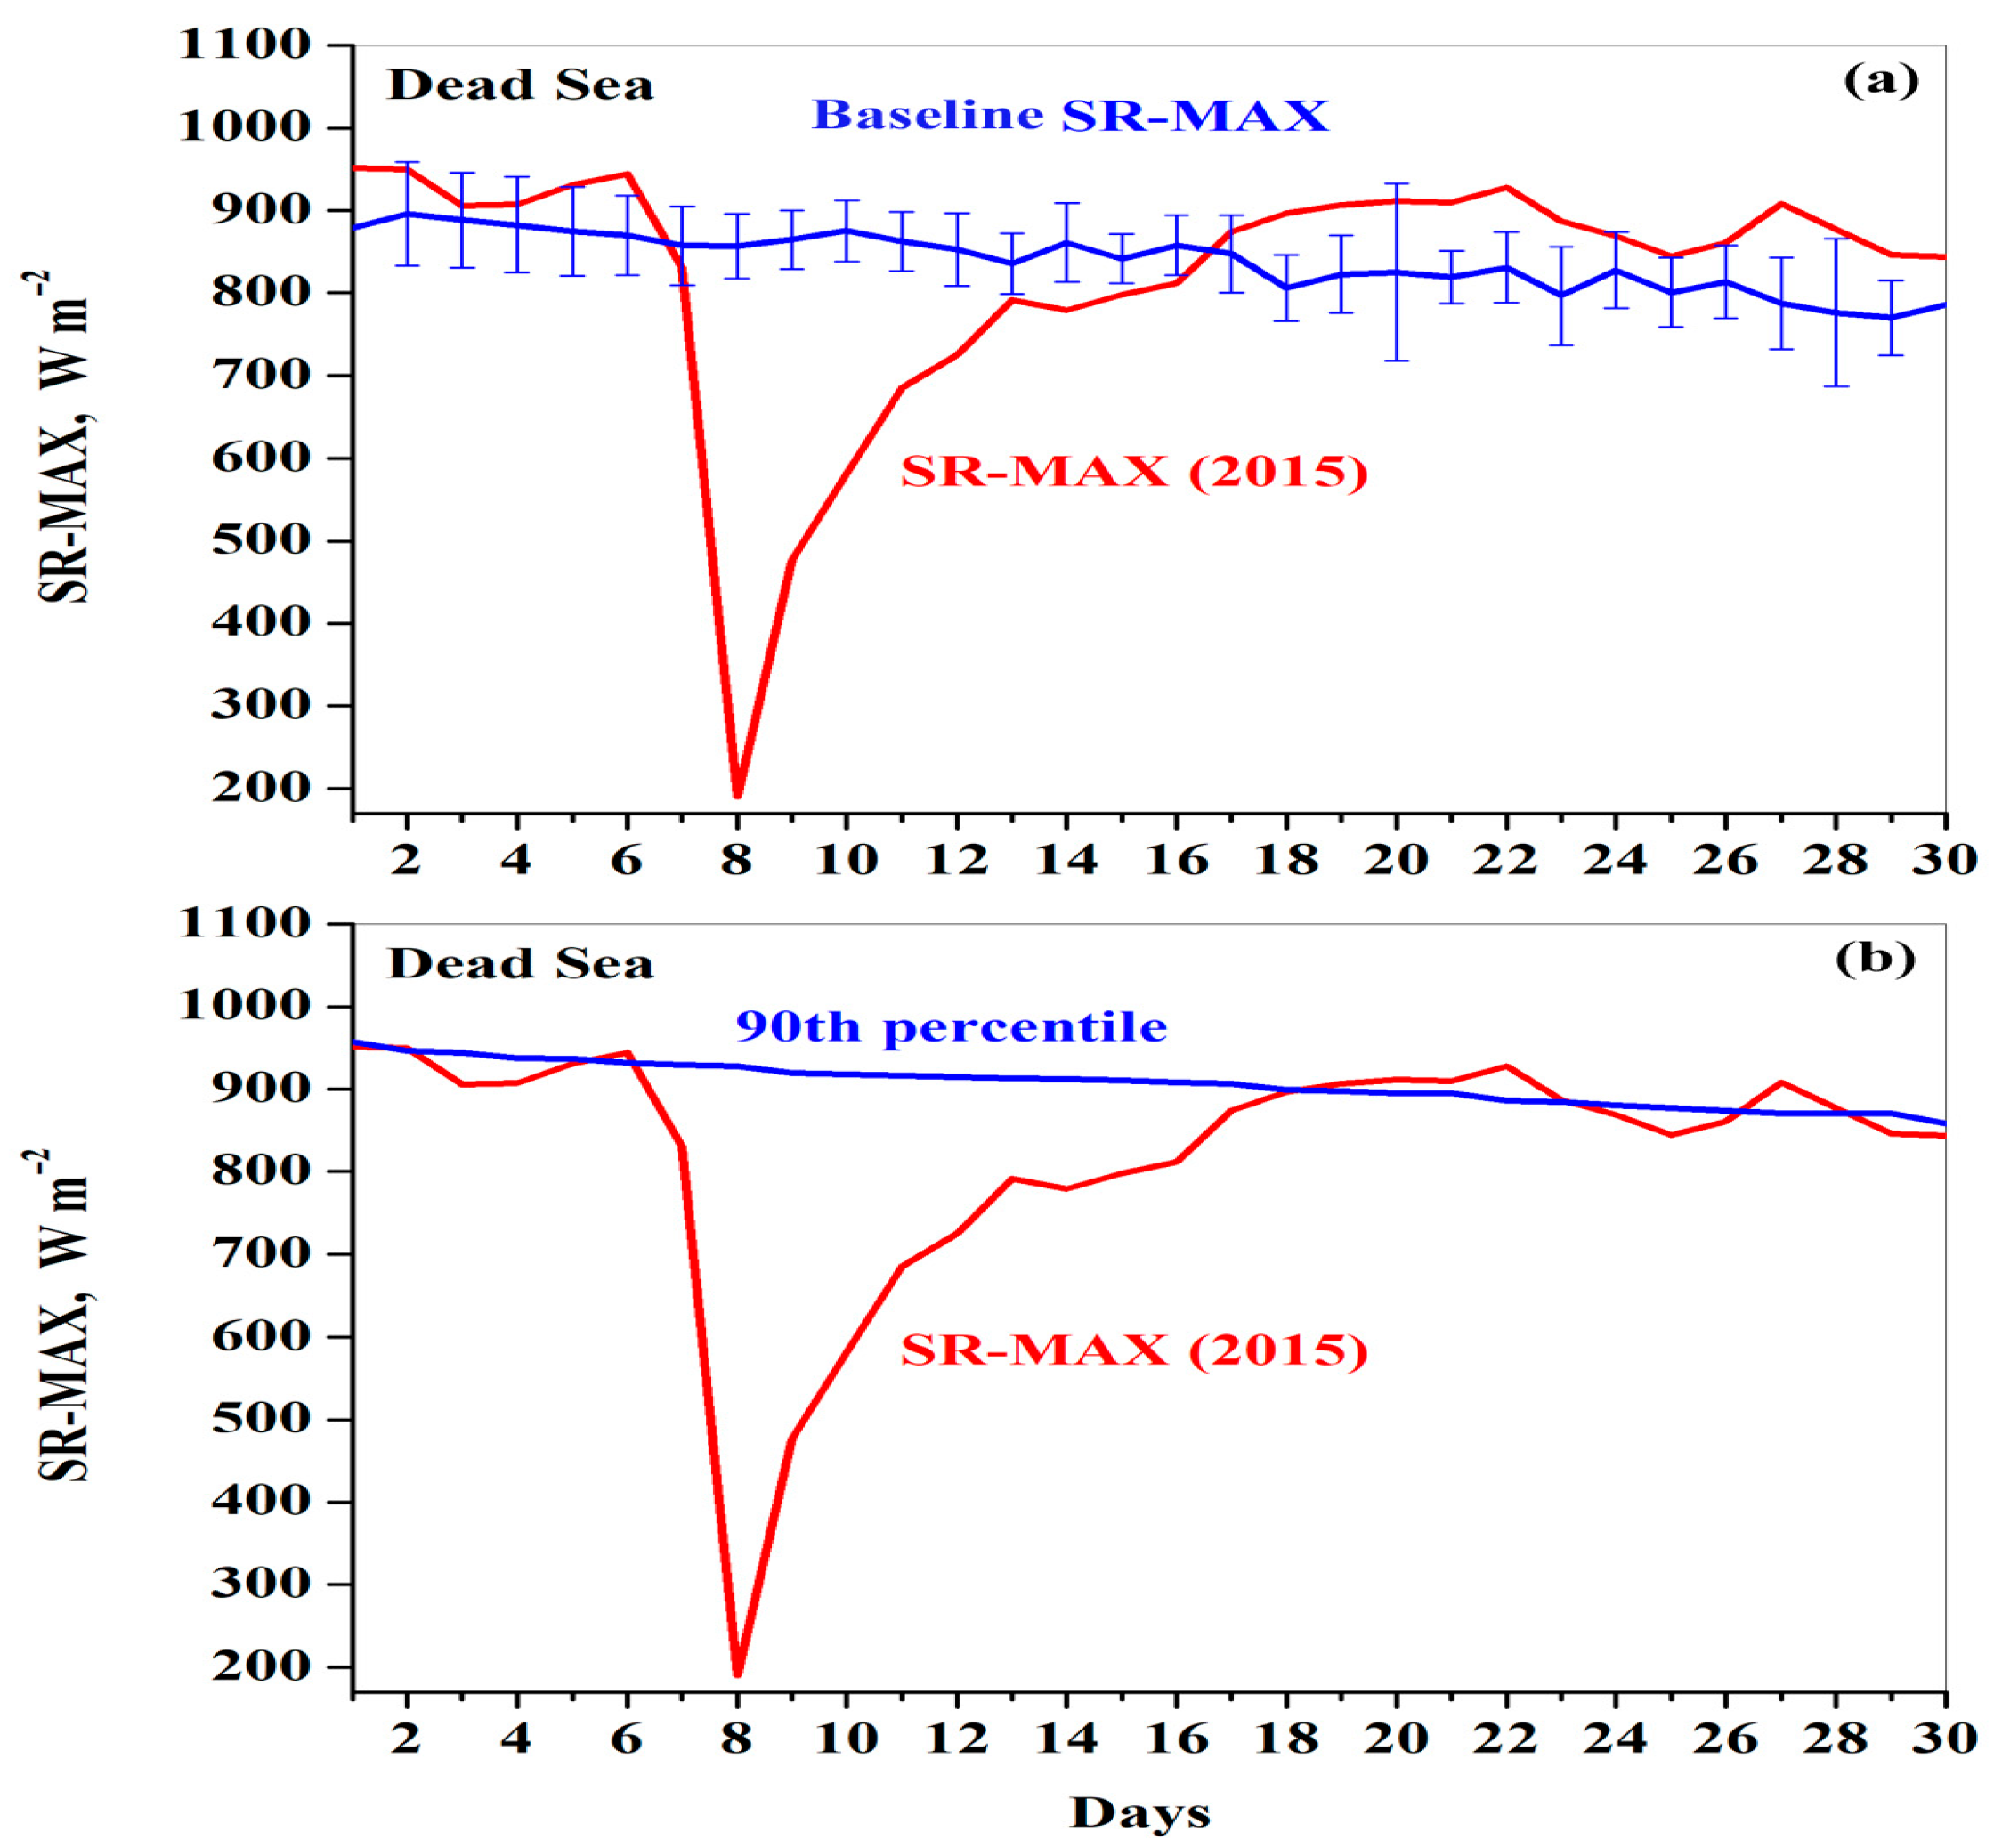
- In the presence of dust intrusion, measurements of daily maximal solar radiation (SR-MAX) showed a dramatic decrease from ~900 W m−2 on clear sky 6 September to ~200 W m−2 on dusty 8 September. After the dusty period (18–30 September), SR-MAX noticeably increased and became higher than its seasonally varied 90th PTH (Figure 5b). This exceedance of SR-MAX over its 90th PTH indicated that, after the dusty period, the atmosphere over the Dead Sea became clearer than usual. This phenomenon can be explained by the disappearance of haze particles due to the formation of atmospheric instability encouraging upwelling vertical motion.
- Taking into account that, over the Eastern Mediterranean, desert dust has increased during the past several decades, one can expect frequent occurrence of dust-related intense persistent heatwaves in the Dead Sea. This will contribute to additional water heating and further drying up of the Dead Sea.
Author Contributions
Funding
Data Availability Statement
Acknowledgments
Conflicts of Interest
Abbreviations
| AHW | atmospheric heatwave |
| LHW | lake heatwave |
| LT | local time |
| 90th PTH | ninetieth percentile threshold |
| Tair | air temperature at a height of 2 m |
| Tair-MAX | daily maximal Tair |
| Tair-MIN | daily minimal Tair |
| TSP | total suspended particles |
| WT | water temperature |
| WT-MAX | daily maximal WT |
| WT-MIN | daily minimal WT |
| WT-1m | WT at a depth of 1 m |
| WT-2m | WT at a depth of 2 m |
| WT-5m | WT at a depth of 5 m |
| WT-10m | WT at a depth of 10 m |
| WT-15m | WT at a depth of 15 m |
| WT-20m | WT at a depth of 20 m |
| SR | solar radiation |
| SR-MAX | daily maximal SR |
| SWT | surface WT |
| SWT-MAX | daily maximal SWT |
| SWT-MIN | daily minimal SWT |
| WS | wind speed |
References
- Messager, M.L.; Lehner, B.; Grill, G.; Nedeva, I.; Schmitt, O. Estimating the volume and age of water stored in global lakes using a geo-statistical approach. Nat. Commun. 2016, 7, 13603. [Google Scholar] [CrossRef] [PubMed]
- Wurtsbaugh, W.A.; Miller, C.; Null, S.E.; DeRose, R.J.; Wilcock, P.; Hahnenberger, M.; Howe, F.; Moore, J. Decline of the world’s saline lakes. Nat. Geosci. 2017, 10, 816–821. [Google Scholar] [CrossRef]
- Levin, Z.; Gershon, H.; Ganor, E. Vertical distribution of physical and chemical properties of haze particles in the Dead Sea valley. Atmos. Environ. 2005, 39, 4937–4945. [Google Scholar] [CrossRef]
- Kottmeier, C.; Agnon, A.; Al-Halbounib, D.; Alpert, P.; Corsmeier, U.; Dahm, T.; Eshel, A.; Geyer, S.; Haas, M.; Holohan, E.; et al. New perspectives on interdisciplinary earth science at the Dead Sea: The DESERVE project. Sci. Total Environ. 2015, 544, 1045–1058. [Google Scholar] [CrossRef]
- Kishcha, P.; Pinker, R.T.; Gertman, I.; Starobinets, B.; Alpert, P. Observations of positive sea surface temperature trends in the steadily shrinking Dead Sea. Nat. Hazards Earth Syst. Sci. 2018, 18, 3007–3018. [Google Scholar] [CrossRef]
- Ziv, B.; Saaroni, H.; Pargament, R.; Harpaz, T.; Alpert, P. Trends in rainfall regime over Israel, 1975–2010, and their relationship to large-scale variability. Reg. Environ. Change 2013, 14, 1751–1764. [Google Scholar] [CrossRef]
- El-Hallaq, A.; Habboub, M.O. Using GIS for time series analysis of the Dead Sea from remotely sensing data. Open J. Civ. Eng. 2014, 4, 386–396. [Google Scholar] [CrossRef]
- Kishcha, P.; Starobinets, B.; Lechinsky, Y.; Alpert, P. Absence of Surface Water Temperature Trends in Lake Kinneret despite Present Atmospheric Warming: Comparisons with Dead Sea Trends. Remote Sens. 2021, 13, 3461. [Google Scholar] [CrossRef]
- Woolway, I.; Eleanor Jennings, E.; Carrea, L. Impact of the 2018 European heatwave on lake surface water temperature. Inland Waters 2020, 10, 322–332. [Google Scholar] [CrossRef]
- Woolway, I.; Jennings, E.; Shatwell, T.; Golub, M.; Pierson, D.C.; Maberly, S.C. Lake heatwaves under climate change. Nature 2021, 589, 402–407. [Google Scholar] [CrossRef]
- Woolway, I.; Anderson, E.; Albergel, C. Rapidly expanding lake heatwaves under climate change. Environ. Res. Lett. 2021, 16, 094013. [Google Scholar] [CrossRef]
- Barriopedro, D.; García-Herrera, R.; Ordóñez, C.; Miralles, D.G.; Salcedo-Sanz, S. Heat waves: Physical understanding and scientific challenges. Rev. Geophys. 2023, 61, e2022RG000780. [Google Scholar] [CrossRef]
- Zittis, G.; Almazroui, M.; Alpert, P.; Ciais, P.; Cramer, W.; Dahdal, Y.; Fnais, M.; Francis, D.; Hadjinicolaou, P.; Howari, F.; et al. Climate change and weather extremes in the Eastern Mediterranean and Middle East. Rev. Geophys. 2022, 60, e2021RG000762. [Google Scholar] [CrossRef]
- Tsikerdekis, A.; Zanis, P.; Georgoulias, A.K.; Alexandri, G.; Katragkou, E.; Karacostas, T.; Solmon, F. Direct and semi-direct radiative effect of North African dust in present and future regional climate simulations. Clim. Dyn. 2019, 53, 4311–4336. [Google Scholar] [CrossRef]
- Shaheen, A.; Wu, R.; Lelieveld, J.; Yousefi, R.; Aldabash, M. Winter AOD trend changes over the Eastern Mediterranean and Middle East region. Int. J. Climatol. 2021, 41, 5516–5535. [Google Scholar] [CrossRef]
- De Meij, A.; Lelieveld, J. Evaluating aerosol optical properties observed by ground-based and satellite remote sensing over the Mediterranean and the Middle East in 2006. Atmos. Res. 2011, 99, 415–433. [Google Scholar] [CrossRef]
- Yu, Y.; Kalashnikova, O.V.; Garay, M.J.; Lee, H.; Notaro, M. Identification and characterization of dust source regions across North Africa and the Middle East using MISR satellite observations. Geophys. Res. Lett. 2018, 45, 6690–6701. [Google Scholar] [CrossRef]
- Haywood, J.M.; Francis, P.; Osborne, S.; Glew, M.; Loeb, N.; Highwood, E.; Tanré, D.; Myhre, G.; Formenti, P.; Hirst, E. Radiative properties and direct radiative effect of Saharan dust measured by the C-130 aircraft during SHADE: 1. Solar spectrum. J. Geophys. Res. 2003, 108, 8577. [Google Scholar] [CrossRef]
- Haywood, J.M.; Allan, R.P.; Culverwell, I.; Slingo, T.; Milton, S.; Edwards, J.; Clerbaux, N. Can desert dust explain the outgoing longwave radiation anomaly over the Sahara during July 2003? J. Geophys. Res. 2005, 110, D05105. [Google Scholar] [CrossRef]
- Brindley, H.E.; Russell, J.E. An assessment of Saharan dust loading and the corresponding cloud-free longwave direct radiative effect from geostationary satellite observations. J. Geophys. Res. 2009, 114, D23201. [Google Scholar] [CrossRef]
- Kishcha, P.; Lechinsky, Y.; Starobinets, B. Impact of a Severe Dust Event on Diurnal Behavior of Surface Water Temperature in Subtropical Lake Kinneret. Remote Sens. 2023, 15, 5297. [Google Scholar] [CrossRef]
- Kishcha, P.; Lechinsky, Y.; Starobinets, B. Lake and Atmospheric Heatwaves Caused by Extreme Dust Intrusion in Freshwater Lake Kinneret in the Eastern Mediterranean. Remote Sens. 2024, 16, 2314. [Google Scholar] [CrossRef]
- Oren, A.; Shilo, M. Population dynamics of Dunaliella parva in the Dead Sea1. Limnol. Oceanogr. 1982, 27, 201–211. [Google Scholar] [CrossRef]
- Singer, A.; Ganor, E.; Dultz, S.; Fischer, W. Dust deposition over the Dead Sea. J. Arid Environ. 2003, 53, 4159. [Google Scholar] [CrossRef]
- Singer, A.; Dultz, S.; Argaman, E. Properties of the non-soluble fractions of suspended dust over the Dead Sea. Atmos. Environ. 2004, 38, 17451753. [Google Scholar] [CrossRef]
- Bitan, A. The wind regime in the north-west section of the Dead-Sea. Arch. Meteorol. Geophys. Bioklim. Ser. B 1974, 22, 313–335. [Google Scholar] [CrossRef]
- Bitan, A. The influence of the special shape of the Dead-Sea and its environment on the local wind system. Arch. Meteorol. Geophys. Bioklim. Ser. B 1976, 24, 283–301. [Google Scholar] [CrossRef]
- Shafir, H.; Alpert, P. Regional and local climatic effects on the Dead Sea evaporation. Clim. Change 2011, 105, 455–468. [Google Scholar] [CrossRef]
- Shafir, H.; Jin, F.J.; Lati, Y.; Alpert, P. Wind Channeling by the Dead-Sea Wadis. Open Atmos. Sci. J. 2008, 2, 139–152. [Google Scholar] [CrossRef]
- Paperman, J.; Potchter, O.; Alpert, P. Characteristics of the summer 3-D katabatic flow in a semi-arid zone. The case of the Dead Sea. Int. J. Climatol. 2022, 42, 1975–1984. [Google Scholar] [CrossRef]
- Kishcha, P.; Volpov, E.; Starobinets, B.; Alpert, P.; Nickovic, S. Dust Dry Deposition over Israel. Atmosphere 2020, 11, 197. [Google Scholar] [CrossRef]
- Gertman, I.; Hecht, A. The Dead Sea hydrography from 1992 to 2000. J. Mar. Syst. 2002, 35, 169–181. [Google Scholar] [CrossRef]
- Hecht, A.; Gertman, I. Dead Sea meteorological climate. In Book Fungal Life in the Dead Sea; Nevo, E., Oren, A., Wasser, S.P., Eds.; A.R.G. Ganter: Ruggell, Lichtenstein, 2003; pp. 68–114. [Google Scholar]
- Stommel, H.; Arons, A.B.; Blanchard, D. An oceanographical curiosity: The perpetual salt fountain. Deep Sea Res. 1956, 3, 152–153. [Google Scholar] [CrossRef]
- Stern, M.E. The “Salt-Fountain” and thermohaline convection. Tellus 1960, 12, 172–175. [Google Scholar] [CrossRef]
- Arnon, A.; Selker, J.S.; Lensky, N.G. Thermohaline stratification and double diffusion diapycnal fluxes in the hypersaline Dead Sea. Limnol. Oceanogr. 2016, 61, 1214–1231. [Google Scholar] [CrossRef]
- Kishcha, P.; Starobinets, B.; Gertman, I.; Ozer, T.; Alpert, P. Observations of unexpected short-term heating in the uppermost layer of the Dead Sea after a sharp decrease in solar radiation. Int. J. Oceanogr. 2017, 2017, 5810575. [Google Scholar] [CrossRef]
- Bardell, D. Life in the Dead Sea. Bios 2009, 80, 149–152. Available online: http://www.jstor.org/stable/25691098 (accessed on 21 February 2025). [CrossRef]
- Uzan, L.; Egert, S.; Alpert, P. Ceilometer evaluation of the eastern Mediterranean summer boundary layer height—First study of two Israeli sites. Atmos. Meas. Tech. 2016, 9, 4387–4398. [Google Scholar] [CrossRef]
- Uzan, L.; Egert, S.; Alpert, P. New insights into the vertical structure of the September 2015 dust storm employing eight ceilometers and auxiliary measurements over Israel. Atmos. Chem. Phys. 2018, 18, 3203–3221. [Google Scholar] [CrossRef]
- Gasch, P.; Rieger, D.; Walter, C.; Khain, P.; Levi, Y.; Knippertz, P.; Vogel, B. Revealing the meteorological drivers of the September 2015 severe dust event in the Eastern Mediterranean. Atmos. Chem. Phys. 2017, 17, 13573–13604. [Google Scholar] [CrossRef]
- Hobday, A.J.; Alexander, L.V.; Perkins, S.E.; Smale, D.A.; Straub, S.C.; Oliver, E.C.J.; Benthuysen, J.A.; Burrows, M.T.; Donat, M.G.; Peng, M.; et al. A hierarchical approach to defining marine heatwaves. Prog. Oceanogr. 2016, 141, 227–238. [Google Scholar] [CrossRef]
- Duguay-Tetzlaff, A.; Bento, V.A.; Göttsche, F.-M.; Stöckli, R.; Martins, J.P.A.; Trigo, I.; Olesen, F.-S.; Bojanowski, J.S.; Dacamara, C.C.; Kunz, H. Meteosat Land Surface Temperature Climate Data Record: Achievable Accuracy and Potential Uncertainties. Remote Sens. 2015, 7, 13139–13156. [Google Scholar] [CrossRef]
- Product User Manual (PUM) Meteosat Land Surface Temperature. 2017. Available online: https://www.cmsaf.eu/SharedDocs/Literatur/document/2017/saf_cm_meteoswiss_pum_met_lst_1_1_pdf.pdf?__blob=publicationFile (accessed on 21 February 2025).
- LP DAAC Land Processes Distributed Active Archive Center: MOD11A1.006 MODIS/Terra Land Surface Temperature/Emissivity Daily L3 Global 1 km V006. Available online: https://e4ftl01.cr.usgs.gov/MOLT/MOD11A1.061/ (accessed on 3 May 2025).
- Emery, W.J.; Castro, S.; Wick, G.A.; Schluessel, P.; Donlon, C. Estimating sea surface temperature from infrared satellite and in situ temperature data. Bull. Am. Meteorol. Soc. 2001, 82, 2773–2785. [Google Scholar] [CrossRef]
- Platnick, S.; Hubanks, P.; Meyer, K.; King, M.D. MODIS Atmosphere L3 Monthly Product; NASA MODIS Adaptive Processing System; Goddard Space Flight Center: Greenbelt, MD, USA, 2015. [CrossRef]


| Date | AOD | SR-MAX, W/m2 | Actual SWT, °C | METEOSAT SWT, °C | MODIS-Terra SWT, °C |
|---|---|---|---|---|---|
| Daytime 10 LT–11 LT | |||||
| 6 September | 0.4 | 940 | 32.1 | 39.2 | 32.7 |
| 7 September | 0.6 | 830 | 32.3 | 34.8 | 28.0 |
| 8 September | 3.2 | 190 | 34.0 | - | - |
| 9 September | 1.8 | 470 | 34.8 | 27.9 | - |
| 10 September | 1.8 | 580 | 34.3 | 30.0 | - |
| 11 September | 1.0 | 680 | 33.8 | 36.8 | 29.8 |
| Nighttime 22 LT–23 LT | |||||
| 6 September | - | - | 33.4 | 37.8 | 30.0 |
| 7 September | - | - | 35.3 | 36.2 | 29.6 |
| 8 September | - | - | 36.1 | - | - |
| 9 September | - | - | 35.9 | - | 26.9 |
| 10 September | - | - | 37.1 | - | - |
| 11 September | - | - | 35.7 | - | 29.1 |
| Depth, m | Start Date | End Date | Duration, Days | MI, °C | CI, °C Days |
|---|---|---|---|---|---|
| WT-MAX anomalies | |||||
| 1 | - | - | - | - | - |
| 2 | 12 September | 22 September | 11 | 0.68 | 2.52 |
| 5 | 12 September | 17 September | 6 | 0.32 | 1.00 |
| 10 | 11 September | 26 September | 16 | 0.56 | 3.88 |
| 15 | 11 September | 26 September | 16 | 0.60 | 4.11 |
| 20 | 11 September | 27 September | 17 | 0.60 | 4.00 |
| WT-MIN anomalies | |||||
| 1 | 11 September | 26 September | 16 | 0.57 | 3.58 |
| 2 | 11 September | 21 September | 11 | 0.52 | 2.82 |
| 5 | - | - | - | - | - |
| 10 | 11 September | 26 September | 16 | 0.61 | 3.53 |
| 15 | 11 September | 27 September | 17 | 0.45 | 4.00 |
| 20 | 11 September | 27 September | 17 | 0.46 | 3.62 |
Disclaimer/Publisher’s Note: The statements, opinions and data contained in all publications are solely those of the individual author(s) and contributor(s) and not of MDPI and/or the editor(s). MDPI and/or the editor(s) disclaim responsibility for any injury to people or property resulting from any ideas, methods, instructions or products referred to in the content. |
© 2025 by the authors. Licensee MDPI, Basel, Switzerland. This article is an open access article distributed under the terms and conditions of the Creative Commons Attribution (CC BY) license (https://creativecommons.org/licenses/by/4.0/).
Share and Cite
Kishcha, P.; Gertman, I.; Starobinets, B. Surface and Subsurface Heatwaves in the Hypersaline Dead Sea Caused by Severe Dust Intrusion. Hydrology 2025, 12, 114. https://doi.org/10.3390/hydrology12050114
Kishcha P, Gertman I, Starobinets B. Surface and Subsurface Heatwaves in the Hypersaline Dead Sea Caused by Severe Dust Intrusion. Hydrology. 2025; 12(5):114. https://doi.org/10.3390/hydrology12050114
Chicago/Turabian StyleKishcha, Pavel, Isaac Gertman, and Boris Starobinets. 2025. "Surface and Subsurface Heatwaves in the Hypersaline Dead Sea Caused by Severe Dust Intrusion" Hydrology 12, no. 5: 114. https://doi.org/10.3390/hydrology12050114
APA StyleKishcha, P., Gertman, I., & Starobinets, B. (2025). Surface and Subsurface Heatwaves in the Hypersaline Dead Sea Caused by Severe Dust Intrusion. Hydrology, 12(5), 114. https://doi.org/10.3390/hydrology12050114