1. Introduction
Rainfall plays a critical role in water resource modeling, management, agricultural planning, and the design of hydrological infrastructure such as culverts, roadside channels, drainage systems, and irrigation networks as noted by Kimani et al. [
1] and other authors [
2,
3,
4]. Reliable rainfall data are globally of critical importance for assessing water availability, predicting flood risks, and addressing the challenges posed by climate variability and change according to Katiraie [
4] and Maheswaran [
5]. In regions with robust observational networks, ground-based rain gauges provide accurate and reliable rainfall measurements. However, according to Nkunzimana et al. [
6] and other authors [
7,
8], in some African regions with sparse and unevenly distributed gauge networks such as Uganda, there are often significant uncertainties in rainfall estimates.
Remotely sensed rainfall (RSR) products offer a promising alternative, providing spatially continuous and near-real-time precipitation estimates as noted by Kimani et al. [
1] and Mekonnen et al. [
9]. Despite their potential, RSR products are not without flaws. Mekonnen et at. note that biases stemming from sensor calibration, retrieval algorithms, and the complexities of converting satellite signals into accurate rainfall rates limit their reliability [
9]. Correcting these biases is essential before RSR data can be confidently applied to hydrological infrastructure design, especially in ungauged catchments where traditional gauge data are scarce or absent.
In recent years, flood-related disasters have caused widespread economic damage, infrastructure destruction, population displacement, and, in extreme cases, loss of life. In Uganda, Onyutha [
10] and Ngoma et al. [
11] in their research have reported the severe impacts of such flood events, while other researchers like Li et al. [
12] predict that flood frequency and intensity will continue to rise. The approaches to design and build resilient hydrological infrastructure such as culverts, drainage channels, and bridges, particularly in ungauged catchments, need to be explored more. At least, it is among those strategies that minimize disruptions to economic development as floods grow more frequent and severe due to climate change and other factors. A key parameter in the design process is the design discharge, often derived from Intensity–Duration–Frequency (IDF) curves according to Andre et al. [
13]. These curves relate rainfall duration and intensity to specific return periods, enabling engineers to design infrastructure capable of withstanding floods of a given magnitude as suggested by Galiatsatou [
13] and others [
14,
15,
16]. Subramanya [
17] notes that constructing IDF curves requires an Annual Maximum Series (AMS), a record of the highest daily rainfall values for each year over an extended period, ideally spanning at least 25 years for hydrological purposes. AMS is a key component of extreme value analysis and plays a critical role in hydrological infrastructure design, including flood control structures, bridges, and drainage systems according to Gupta [
18]. In data-scarce regions like Uganda, where rainfall monitoring stations are sparse or nonexistent, analyzing the applicability of the AMS of RSR data becomes essential. Therefore, the inherent biases in RSR products must be assessed and corrected according to Gumindoga et al. [
19] and Mekonnen et al. [
9] to ensure their suitability for the estimation of design discharge.
Previous studies have explored the performance of RSR products in Uganda. For instance, Okirya and Du Plessis [
3] evaluated the AMS of seven RSR products across different climate zones. They identified top performers like Global Precipitation Climatology Center (GPCC) (at the Gulu, Jinja, and Soroti stations) and National Oceanic and Atmospheric Administration Climate Prediction Center (NOAA_CPC) (at the Mbarara station) based on statistical metrics and goodness-of-fit performance tests. While their work highlighted variations in RSR performance tied to product type and location, it did not address the correction of inherent biases. Similarly, Onyutha [
20] used AMS from observed data to evaluate Coordinated Regional Climate Downscaling Experiment (CORDEX) Regional Climate Model (RCM) simulations of extreme rainfall in East Africa, constructing IDF curves using data for the period 1961–1990 for the Lake Victoria Basin. However, the focus of his study was to evaluate the performance of CORDEX Africa RCMs, driven by Coupled Model Inter-comparison Project Phase 5 (CMIP5) General Circulation Models (GCMs) in reproducing Extreme Rainfall Indices (ERIs) and not bias correction. Other studies in Uganda and East Africa by Macharia [
7] and others [
21,
22] have evaluated RSR products, with Climate Hazards Group InfraRed Precipitation with Station data (CHIRPS) being the most extensively studied. Further research is still needed to explore and correct the biases in the AMS of RSR products. The biases need to be systematically evaluated and corrected to ensure the accuracy and reliability of RSR products for hydrological applications in ungauged or sparsely gauged catchments.
Previous studies have investigated various Bias Correction Techniques (BCTs) to address the challenge of inherent biases in RSR products. For instance, Ajaaj et al. [
23] evaluated five BCTs to adjust GPCC rainfall data in Iraq, finding that Quantile Mapping and mean bias removal methods outperformed others, with performance varying by season and climate zone. Similarly, Ouatiki et al. [
24] evaluated five bias correction techniques (BCTs) across eight satellite-based rainfall datasets in Morocco. The study revealed improvements in bias correction for the RSR dataset using methods such as Random Forest, with effectiveness varying based on local climatology.
In Uganda, Nakkazi et al. [
8] used Local Intensity Scaling (LOCI) and Linear Scaling (LS) to correct precipitation data for the Soil and Water Assessment Tool (SWAT) model in the Manafwa catchment. In their study, the LS method failed to capture extreme events, while LOCI only partially addressed heavy rainfall. Their study highlighted the need for further research into extreme-value correction. These studies demonstrate that while bias correction is effective in regions with dense gauge networks, its application in ungauged or poorly gauged areas remains challenging. Uganda’s diverse climate, from western highlands to eastern lowlands, further complicates matters, as correction parameters may not be transferable across regions with different climatology.
Emerging research has turned to machine learning (ML) approaches for bias correction, with studies like those by Nguyen et al. [
25] and others [
26,
27,
28,
29,
30] showing improved RSR accuracy. However, ML methods often rely on historical gauge rainfall data, incur high computational costs, and lack transferability, posing obstacles for data-scarce regions like Uganda. Addressing these challenges requires a flexible, locally tailored bias correction framework that can enhance RSR data for hydrological infrastructure design in ungauged catchments. Several studies, including those by Dao et al. [
26] and others [
27,
28,
29], have applied ML-based bias correction frameworks to RSR datasets and registered promising results. For example, Chen et al. [
28] developed a deep Convolutional Neural Network (CNN) framework and successfully reduced biases in the NOAA Climate Prediction Center Morphing Technique (CMORPH) rainfall product. While ML approaches yield promising results, they also introduce uncertainties related to assumptions of regional homogeneity and transferability of bias correction parameters across different climate zones. In Uganda, Nakkazi et al. [
8] applied a bias correction framework based on the Soil and Water Assessment Tool (SWAT) model to validate bias-corrected RSR datasets in the Manafwa catchment. The SWAT model was calibrated using the bias-corrected RSR datasets (Climate Forecasting System Reanalysis (CFSR), MERRA-2, and TRMM3B42) as input rainfall data. The effectiveness of RSR data bias correction was assessed by how well SWAT-simulated streamflow matched observed streamflow, using performance metrics such as Nash–Sutcliffe Efficiency (NSE), PBIAS, and RMSE. The bias correction framework by Nakkazi et al. [
8] was applied in a small catchment and considered a monthly temporal scale and not daily scale, which is relevant to hydrological infrastructure designs and planning.
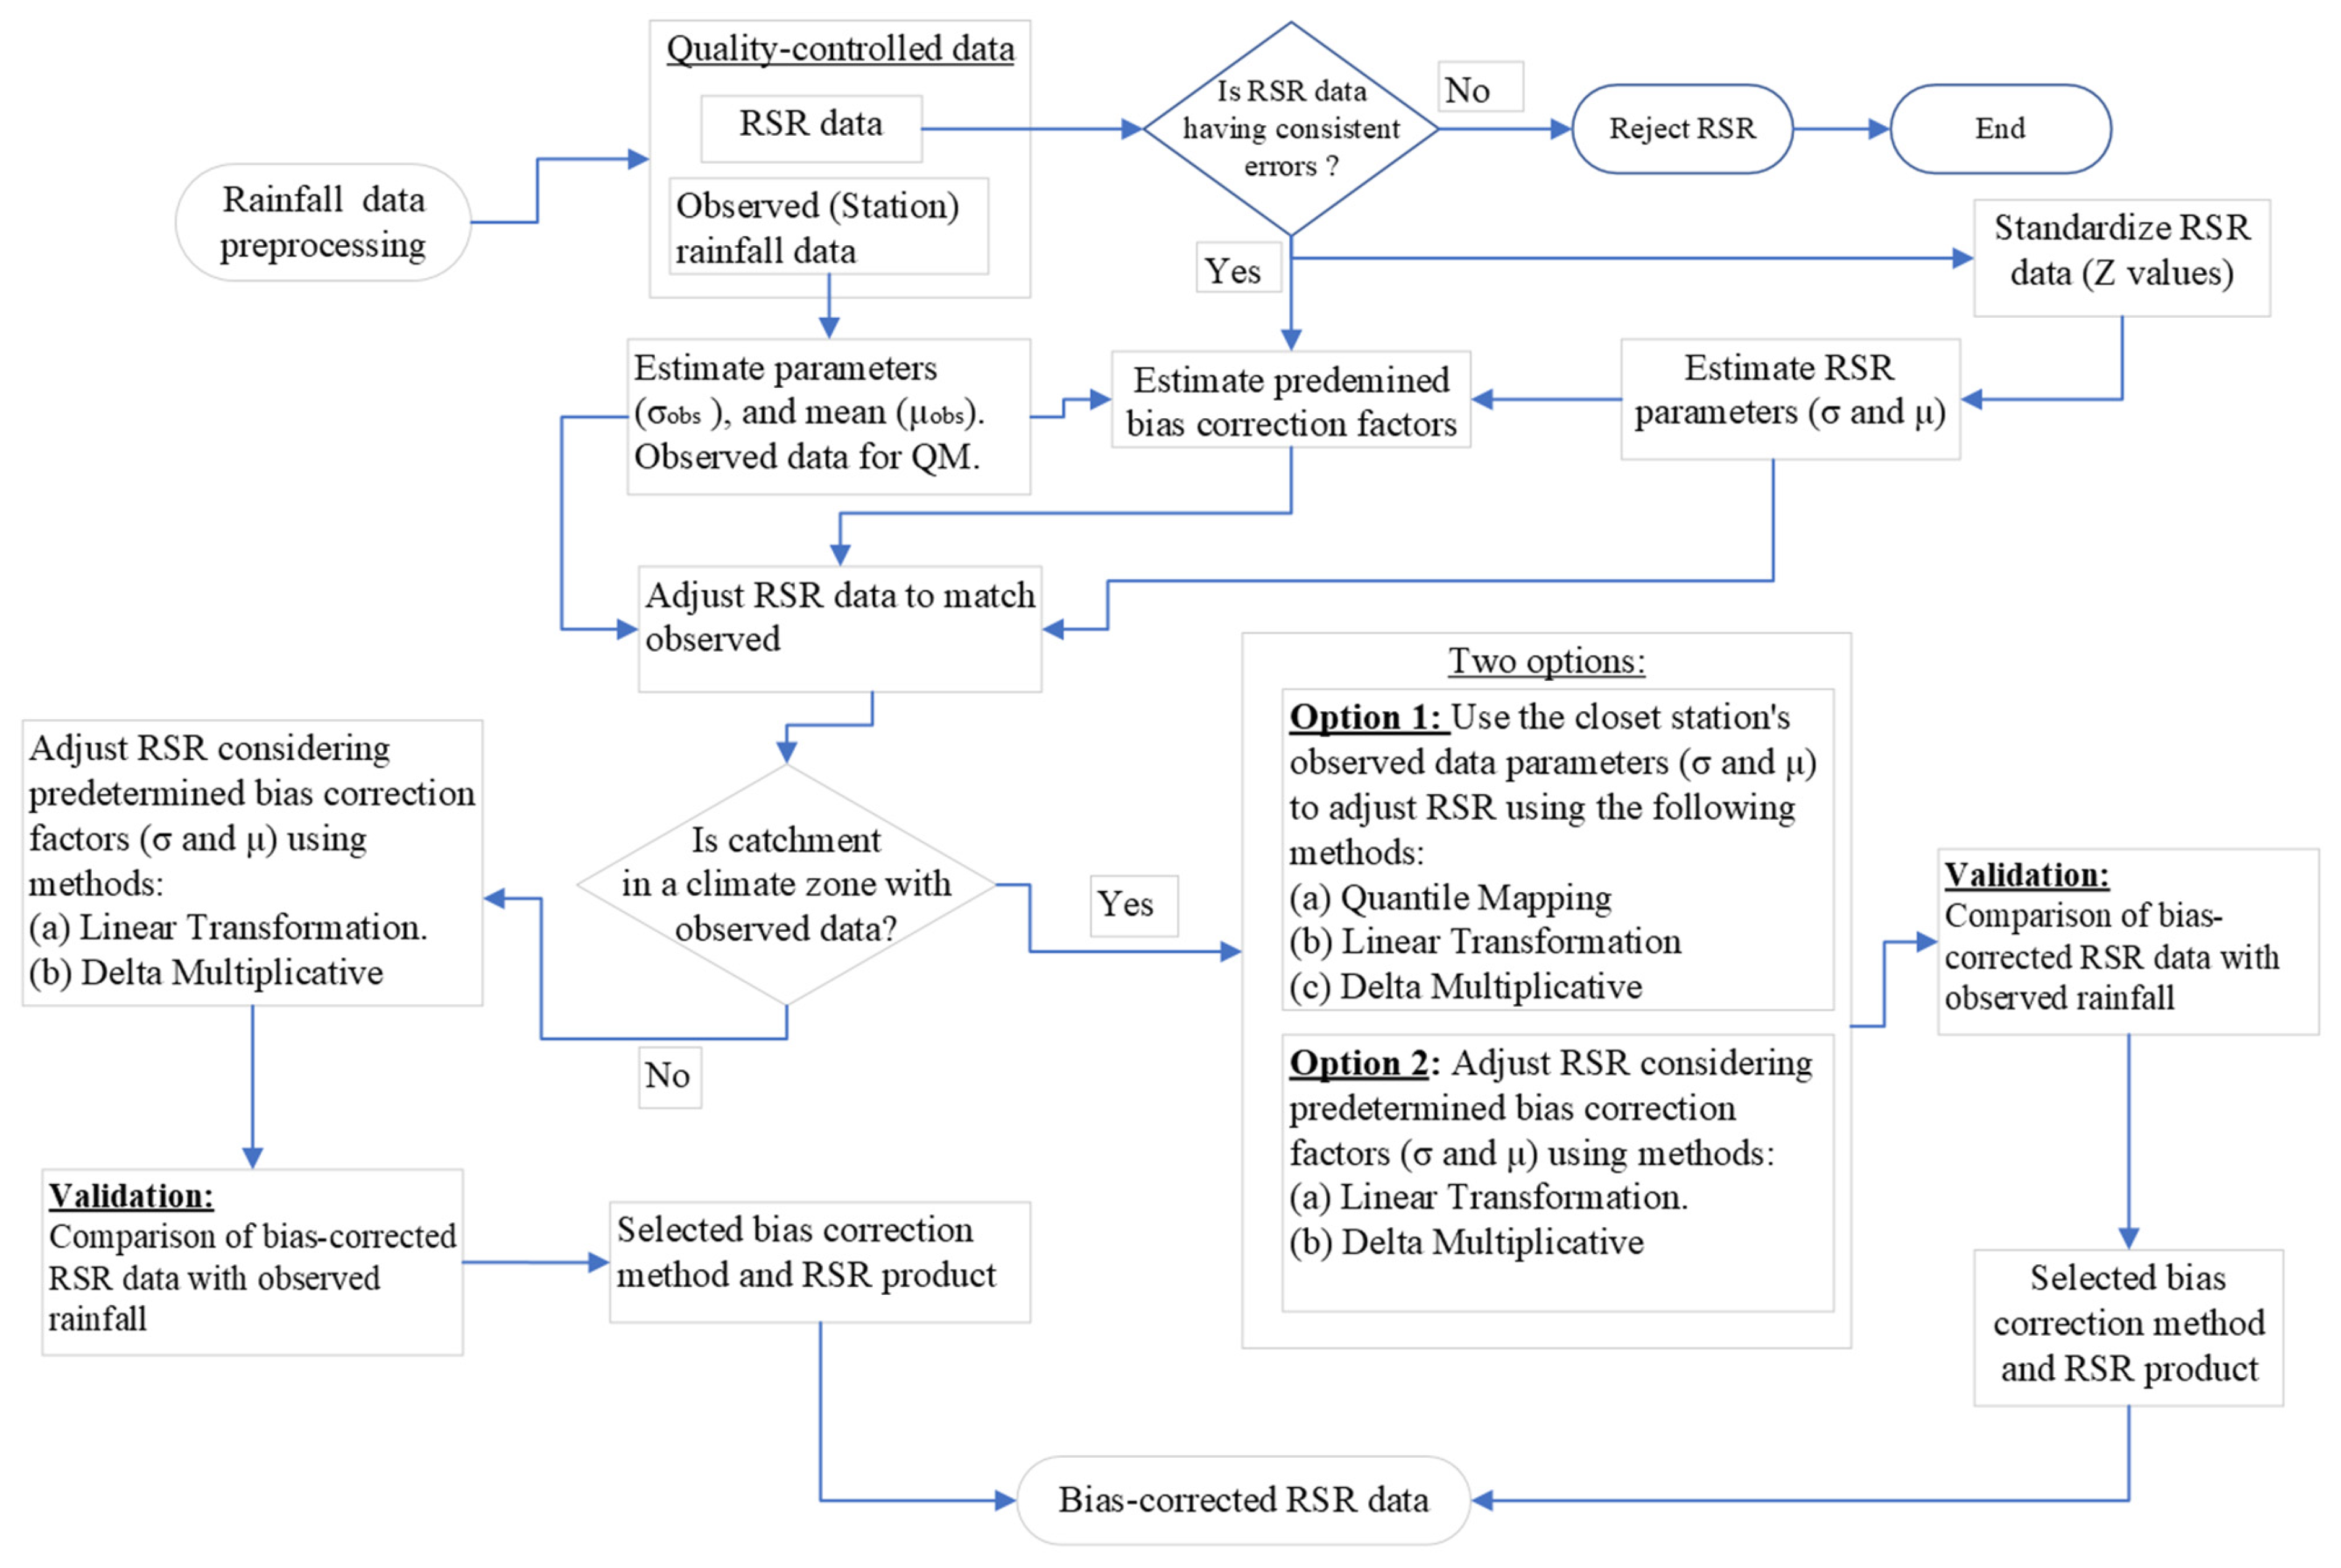
Reliable rainfall data underpin effective hydrological infrastructure design, flood risk management, water supply, and agricultural planning. In Uganda, where many catchments lack sufficient ground-based observations, refining RSR data through bias correction offers viable alternatives to observed measurements. This research addresses a key scientific question: how can bias correction methods, effective in gauged catchments, be extended to ungauged catchments while maintaining the accuracy and reliability of RSR data for hydrological applications? To address this question, we propose a framework that evaluates bias correction techniques in gauged environments and adapts them for ungauged contexts using regionalized parameters and transferable predetermined bias correction factors. This research introduces a novel regionalized bias correction framework for RSR data in Uganda, specifically targeting ungauged catchments. Unlike previous studies, our approach uses predetermined bias correction factors derived from observed biases in mean rainfall and standard deviation at representative gauged stations and applies them to ungauged catchments. The findings provide a practical, scalable approach for improving the reliability of RSR datasets in hydrological modeling and infrastructure design in data-poor environments.
1.1. Objectives
The research’s main and specific objectives are outlined below.
1.1.1. Main Objective
The primary goal is to evaluate and compare bias correction methods, then develop and validate a framework for correcting remotely sensed rainfall data in ungauged catchments in Uganda.
1.1.2. Specific Objectives
The specific objectives are as follows:
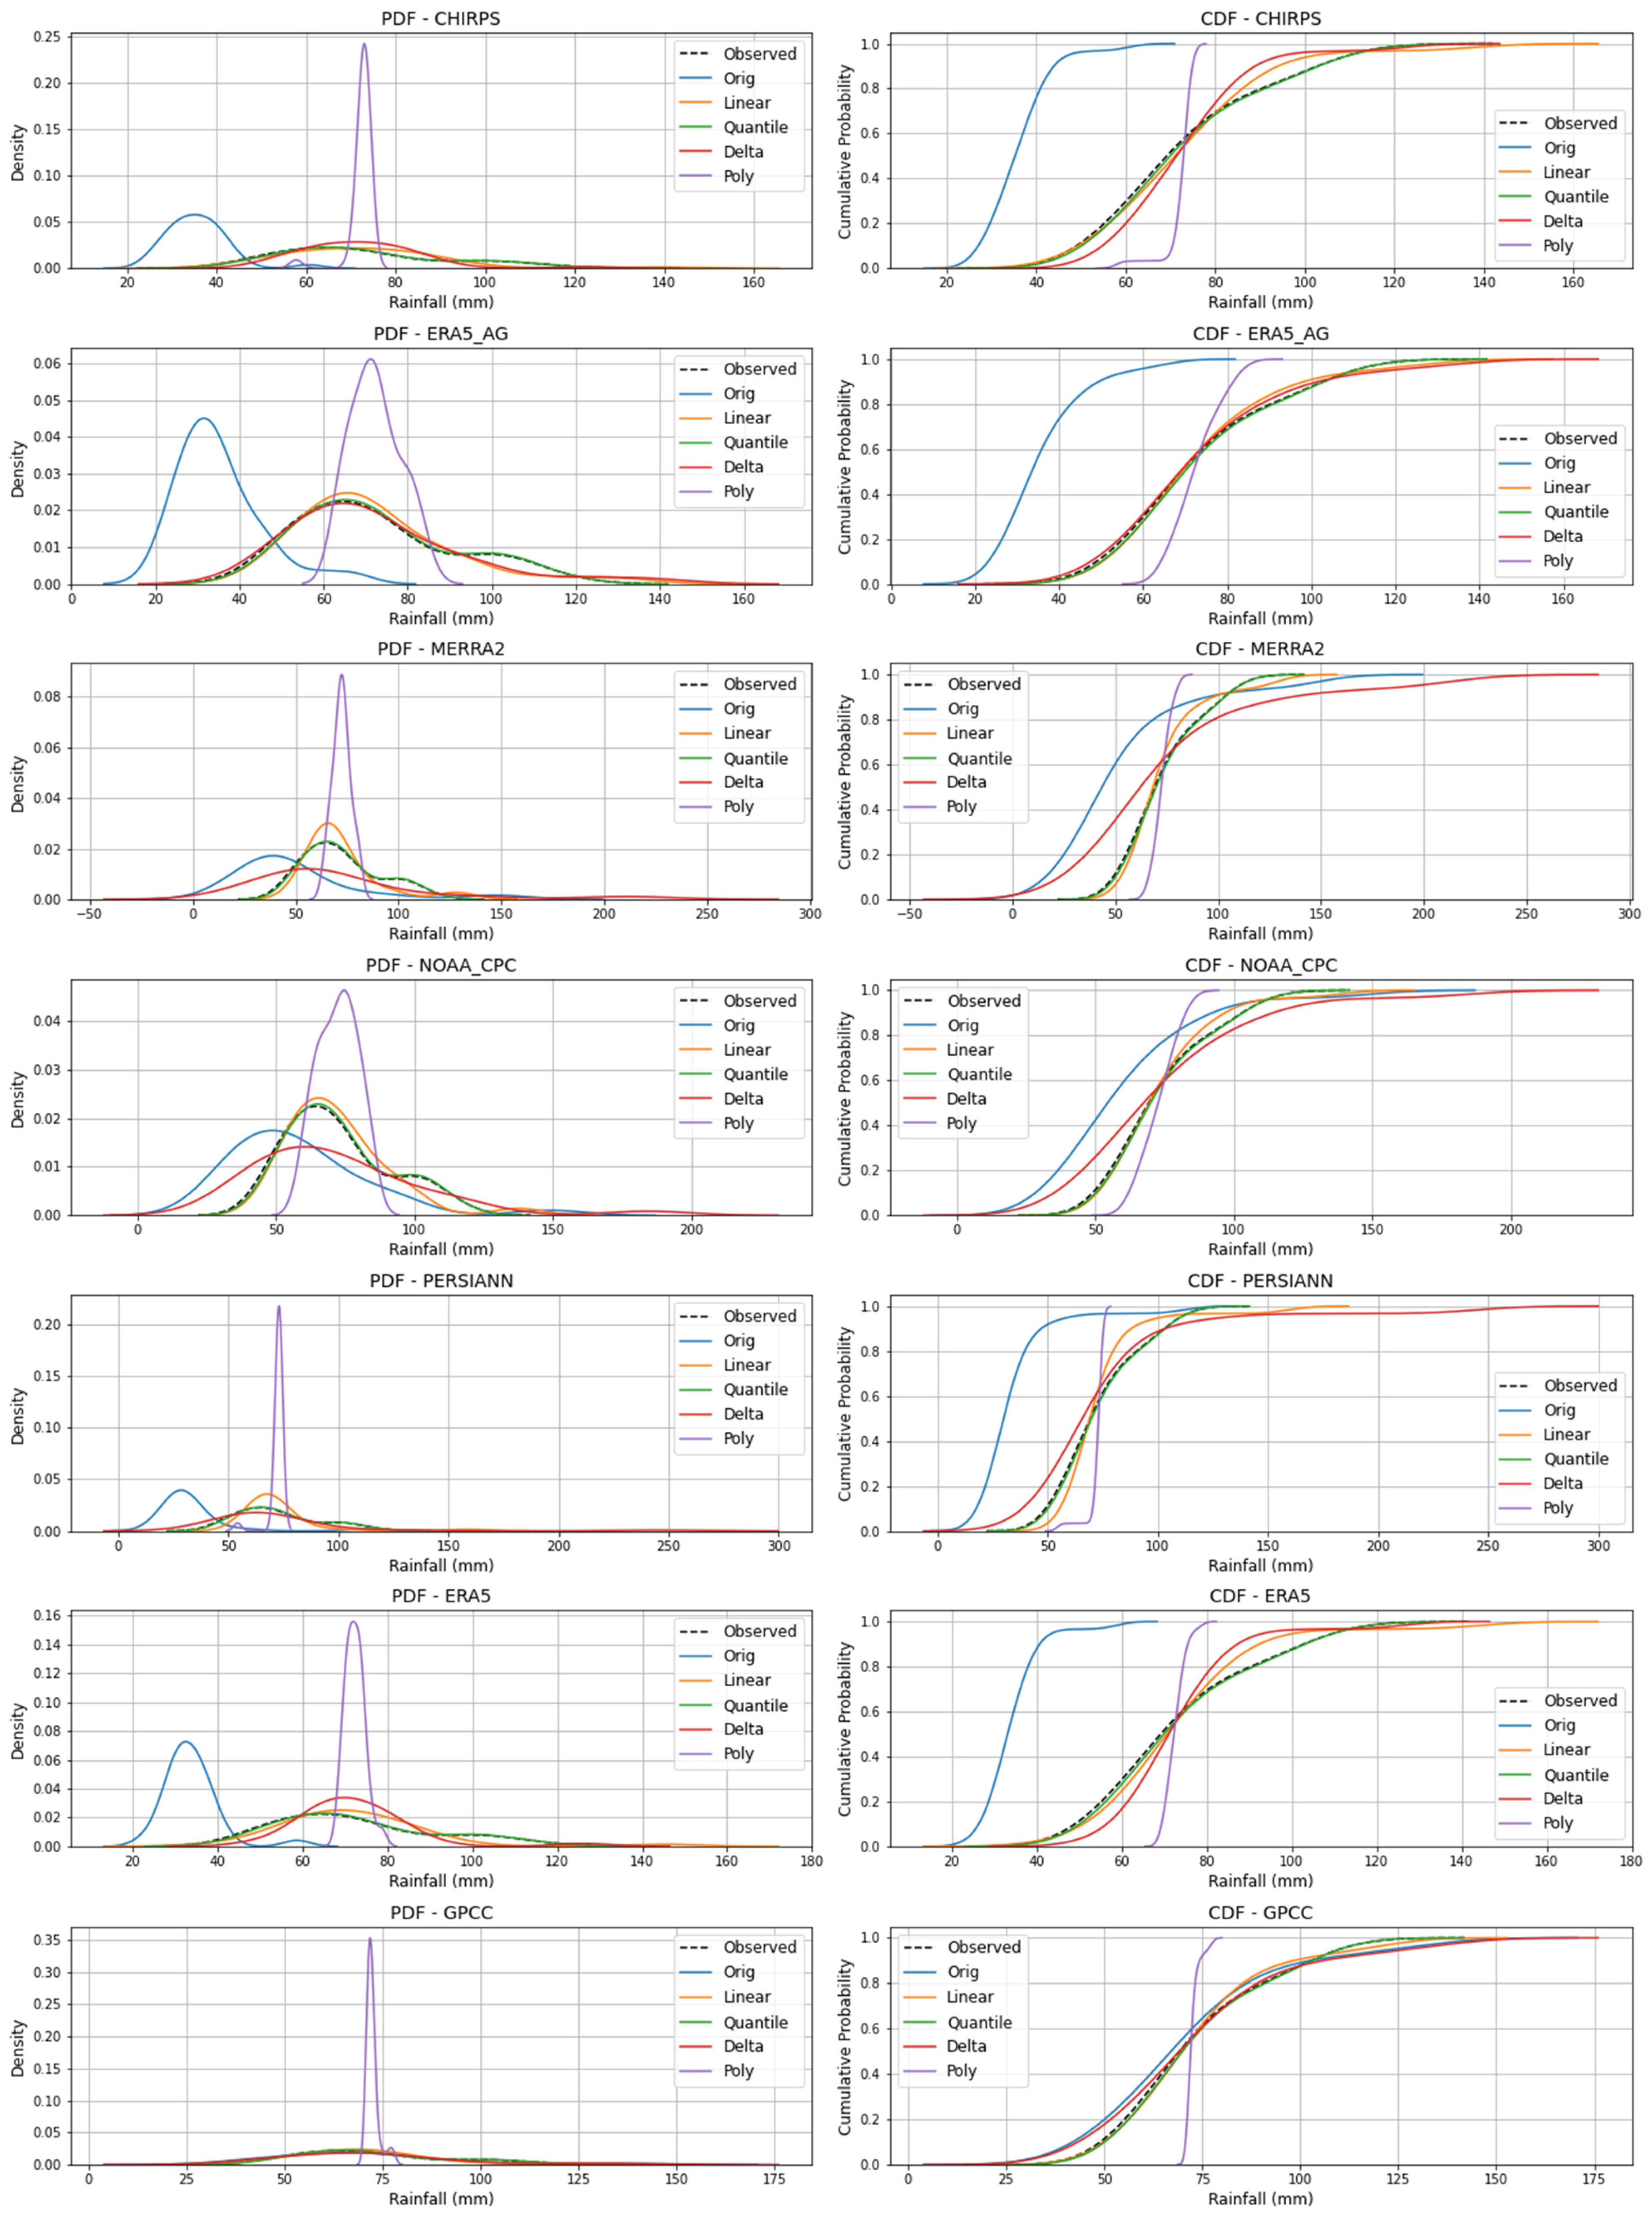
To evaluate and compare the performance of four bias correction methods, Linear Transformation, Quantile Mapping, Delta Multiplicative, and Polynomial Regression, in gauged catchments.
To develop a bias correction framework for ungauged catchments by adapting the best-performing methods from gauged catchments.
To validate the framework using an independent dataset from selected gauged stations.
1.2. Research Questions
The research addresses the following questions:
How do bias correction methods compare in their ability to adjust RSR data in gauged catchments in Uganda?
How can the optimal bias correction methods from gauged catchments be adapted for use in ungauged catchments?
How effective is the bias correction framework in ungauged catchments in Uganda?
5. Conclusions and Recommendations
5.1. Conclusions
This research aimed at evaluating and comparing the performance of four bias correction methods, QM, LT, DM, and PR, on seven RSR datasets (CHIRPS, ERA5, ERA5_AG, MERRA2, PERSIANN_CDR, NOAA_CPC, and GPCC), with the goal of developing and validating a bias correction framework for ungauged catchments in Uganda.
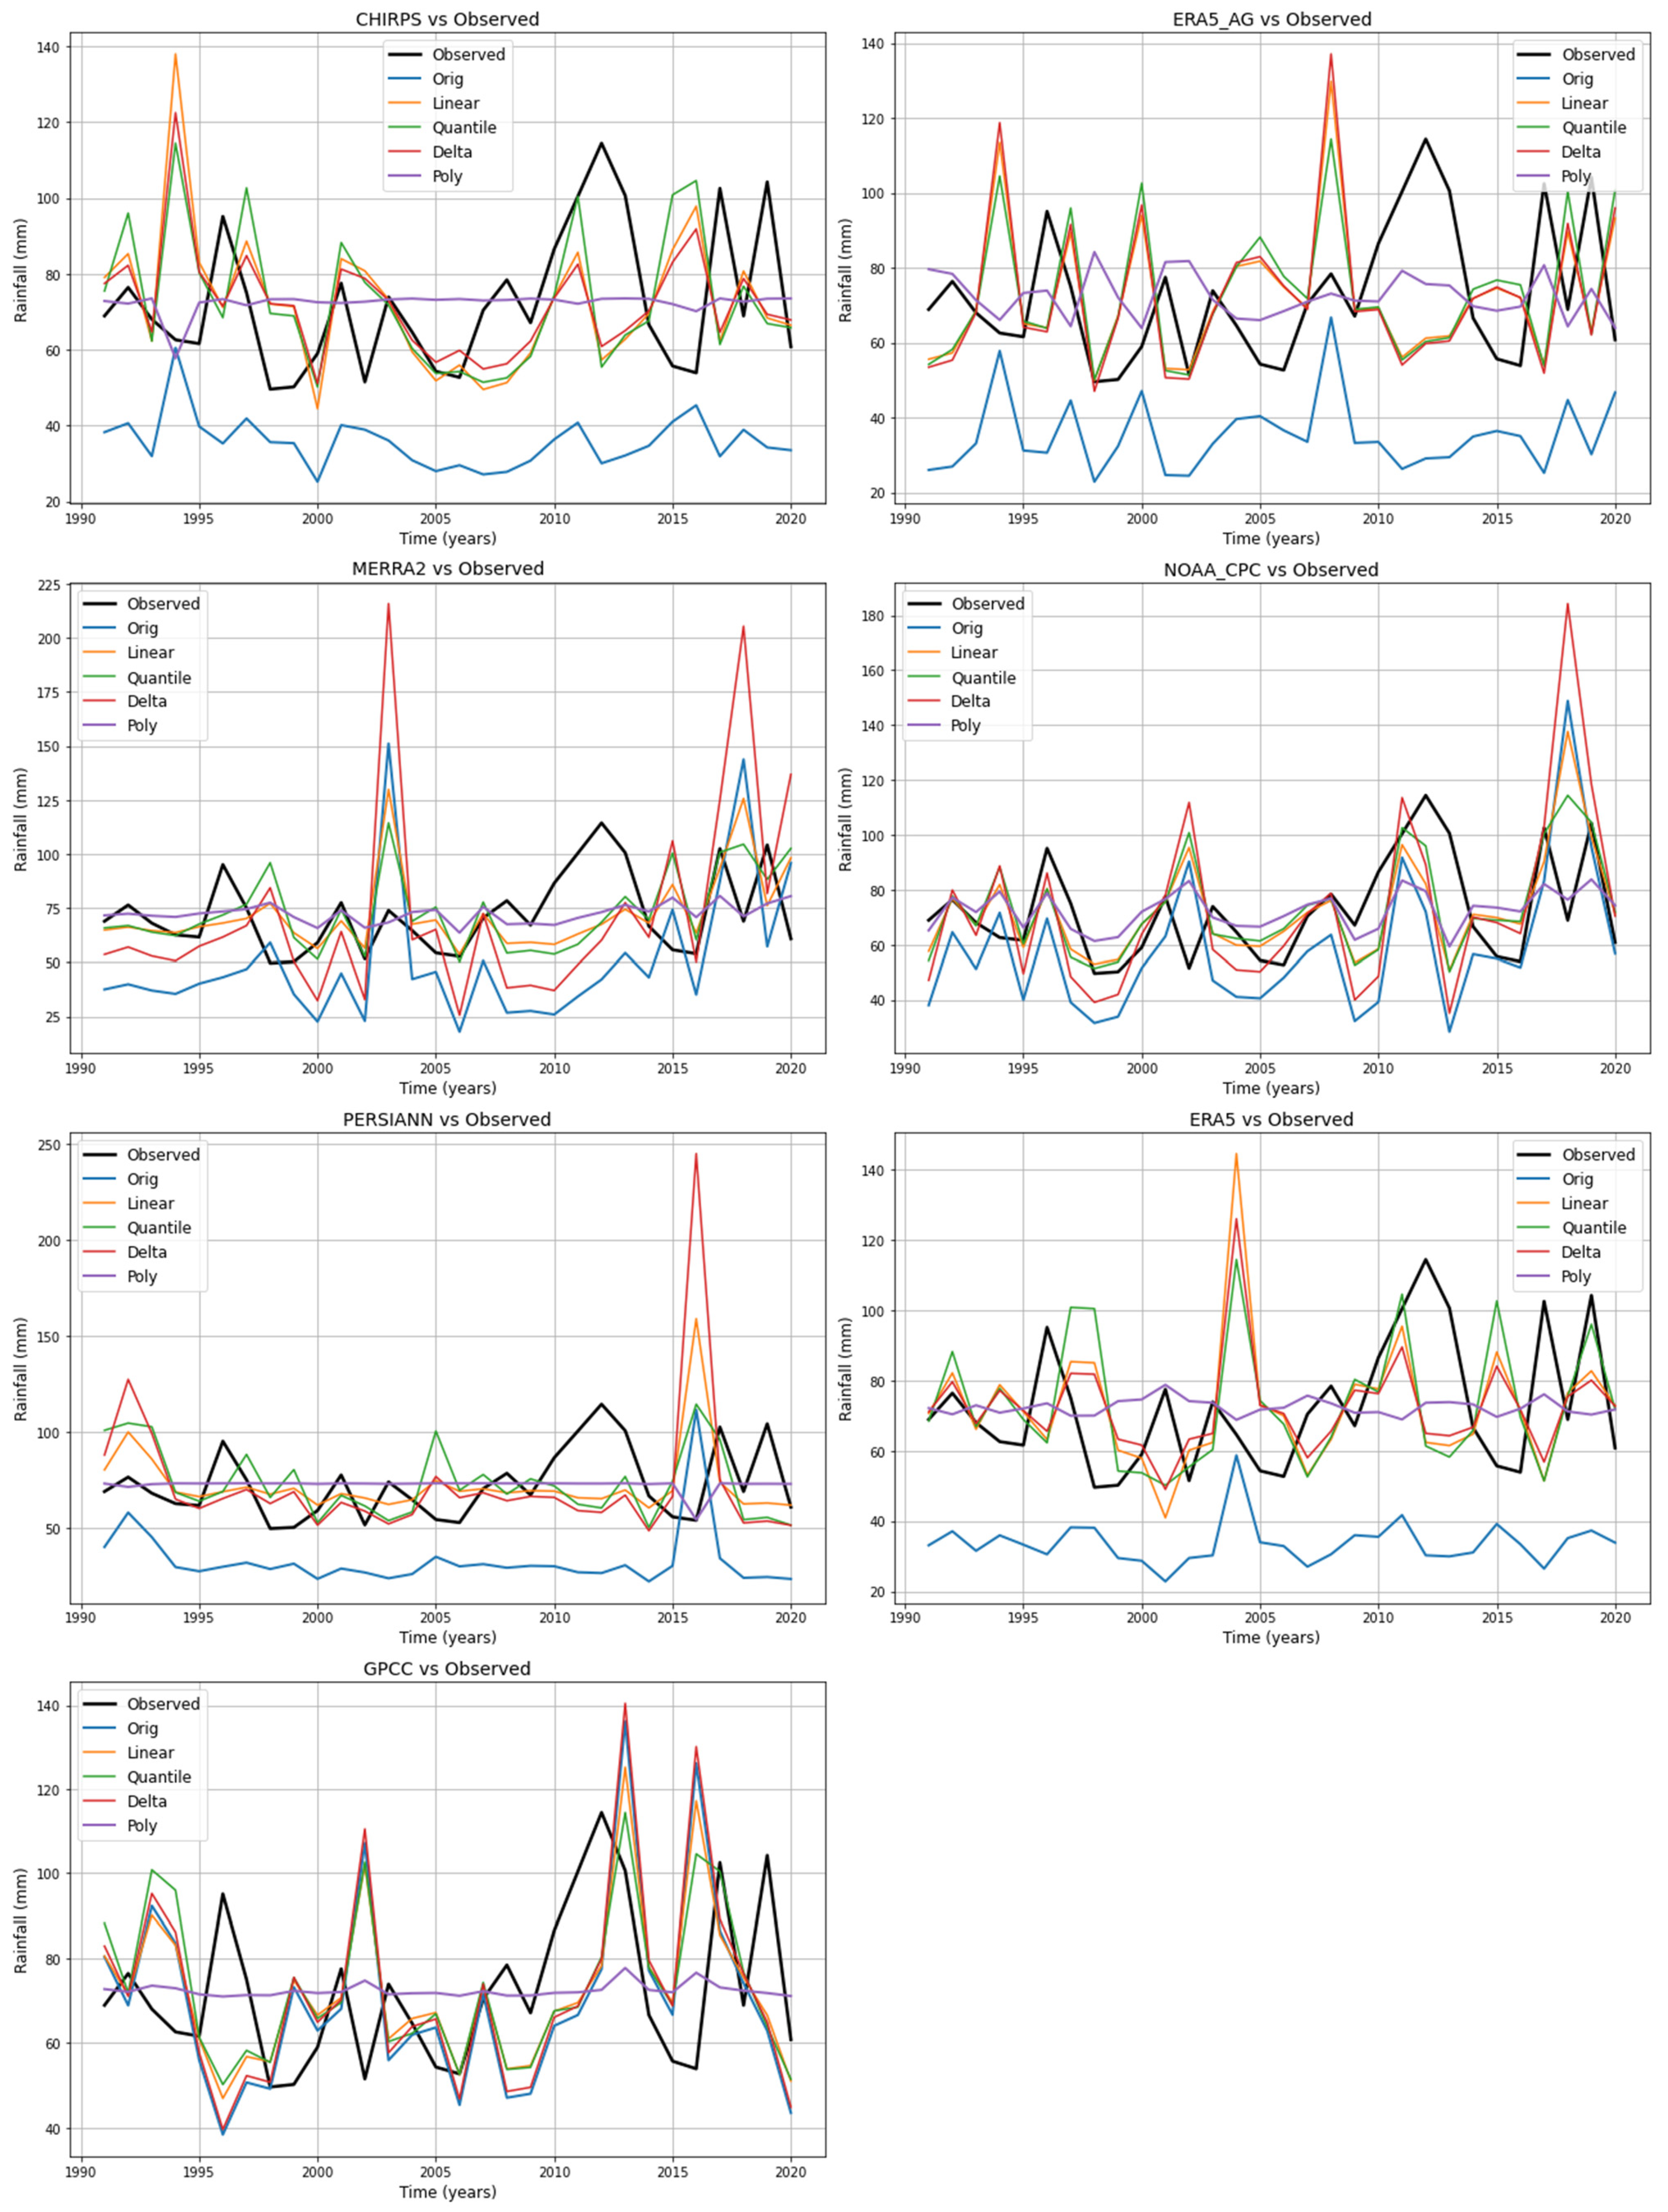
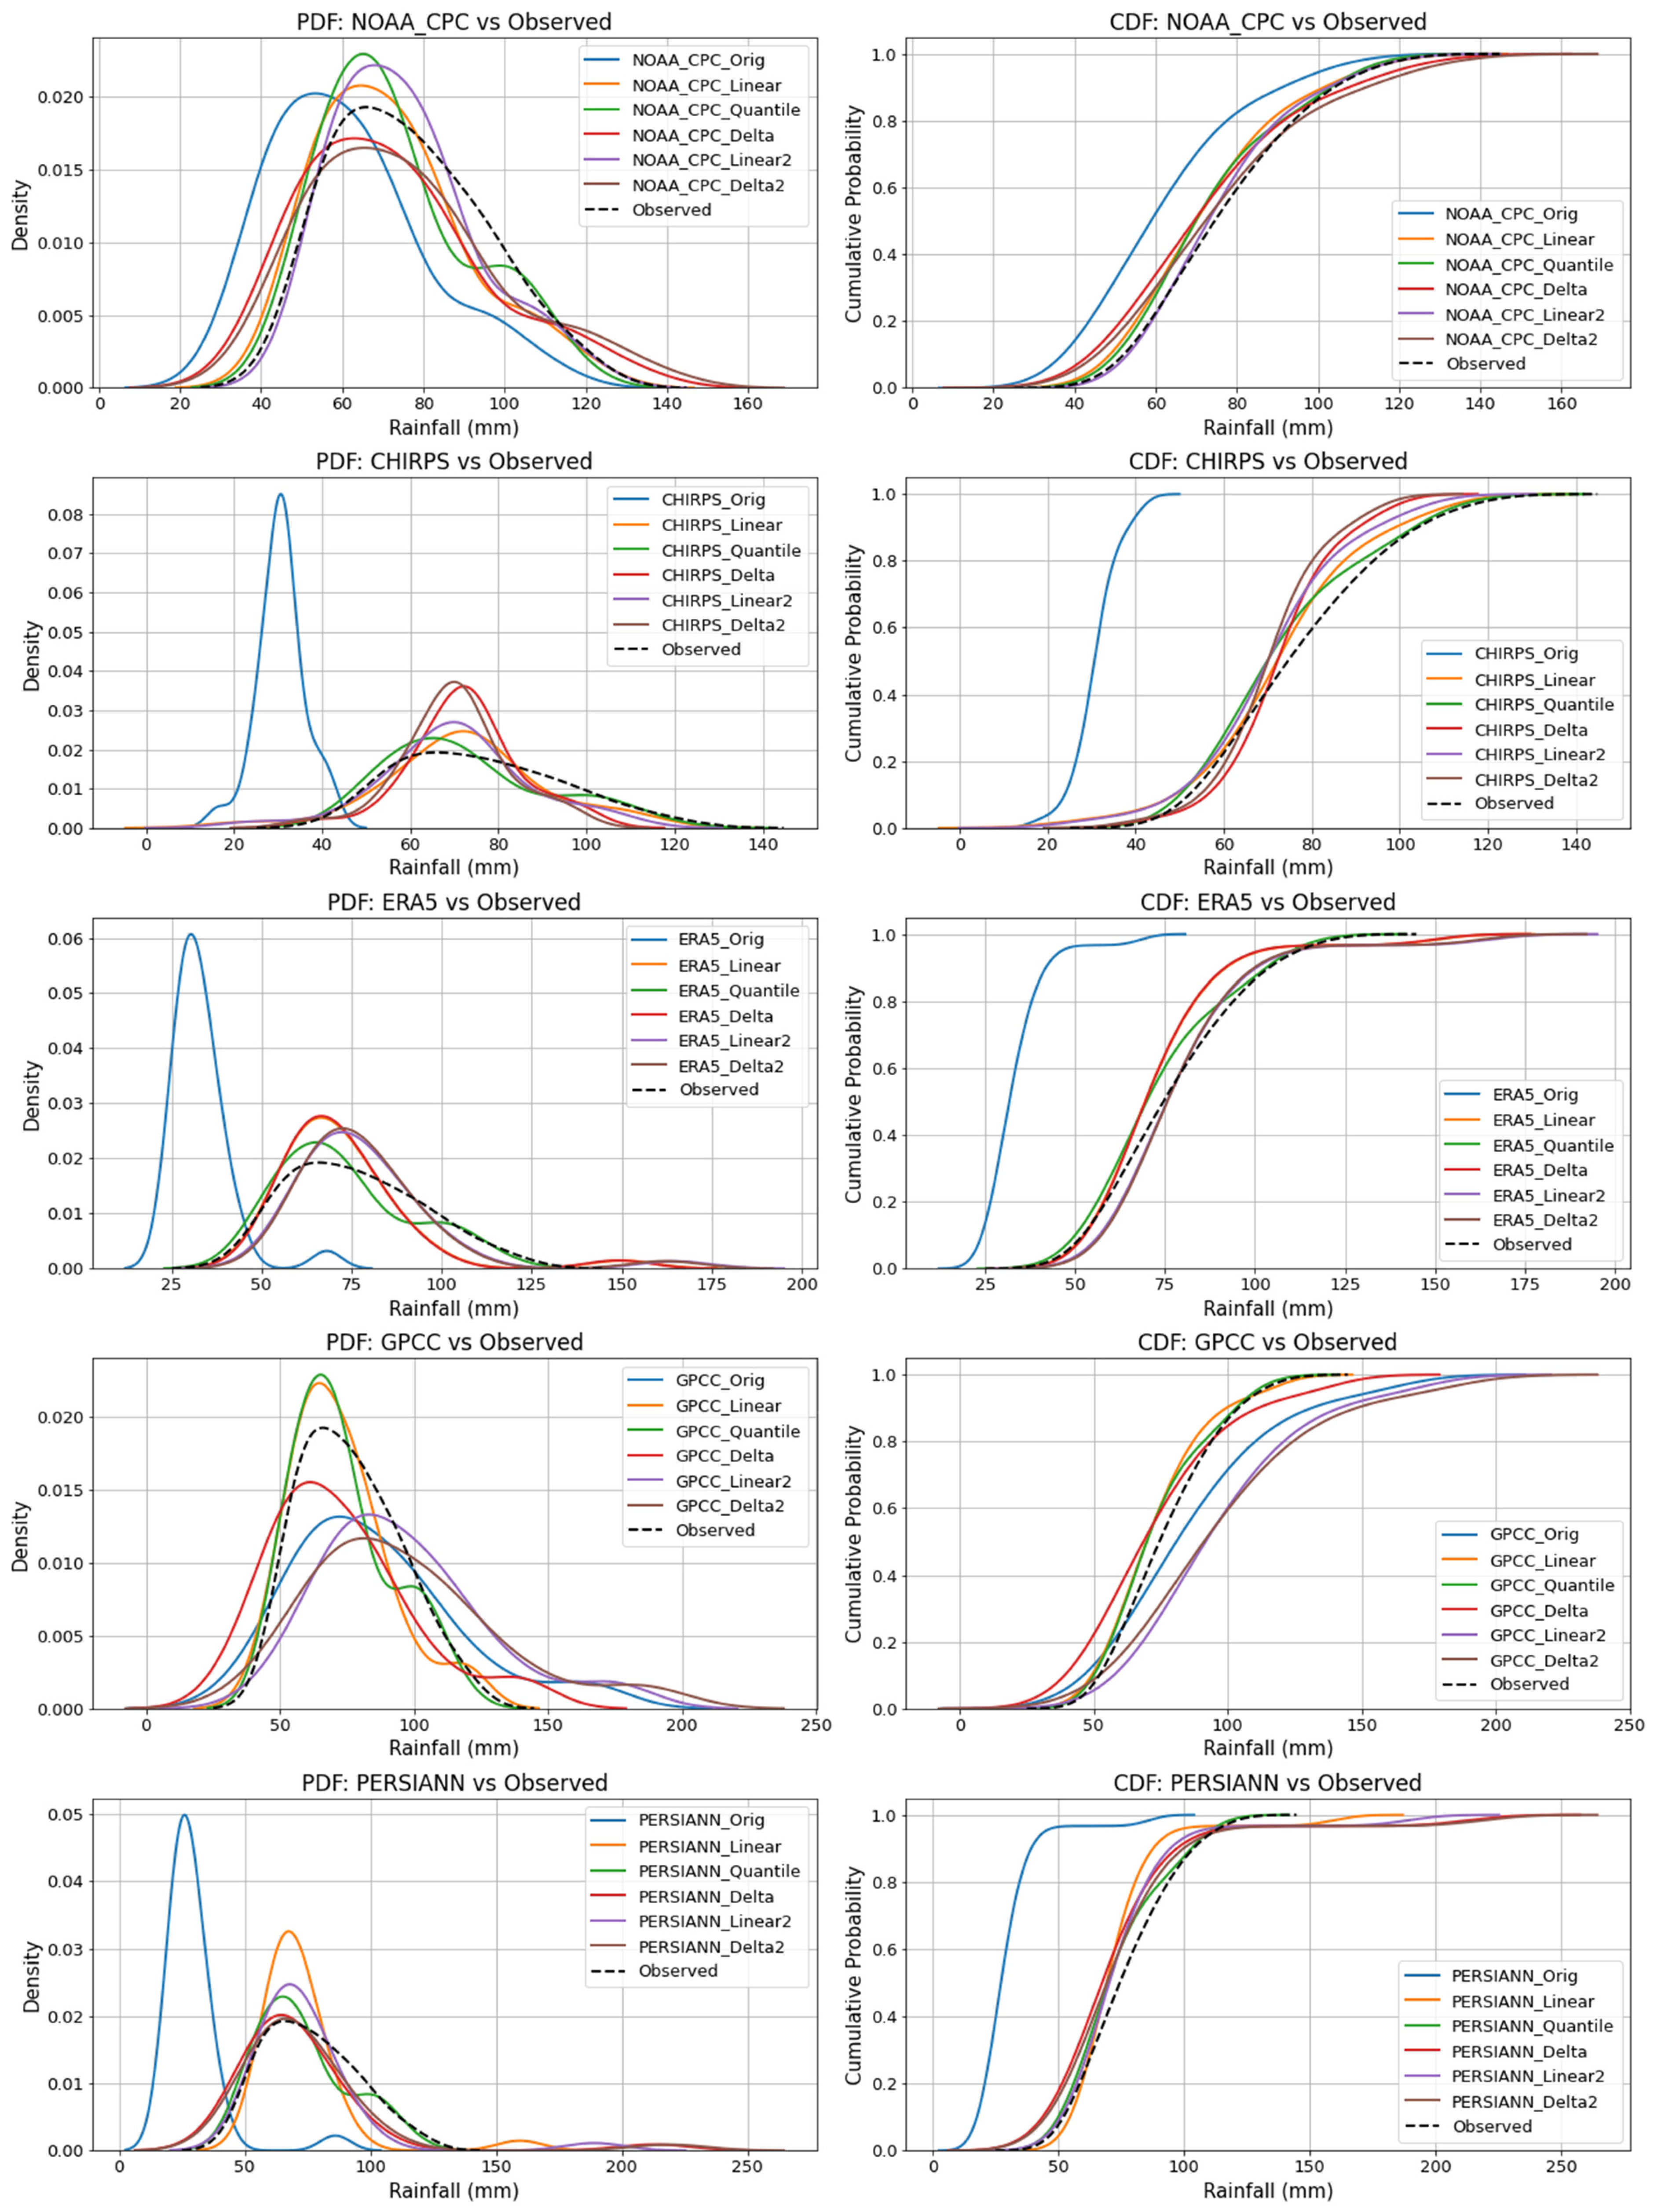
The first objective, to evaluate and compare the bias correction methods in gauged catchments, was successfully achieved. Among all methods assessed, QM consistently emerged as the most effective, delivering strong statistical improvements across all stations and RSR datasets. For instance, at Gulu, applying QM to the NOAA_CPC dataset reduced the RMSE from 29.20 mm to 19.00 mm (a 35% improvement), MAE from 22.44 mm to 12.84 mm (a 43% improvement), and PBIAS from −19.23% to 1.05% (a 95% improvement). At Jinja, QM applied to the GPCC dataset achieved an RMSE of 17.96 mm, down from 22.22 mm (a 19% improvement), MAE of 14.36 mm from 17.56 mm (an 18% improvement), and PBIAS of 1.25% from −14.64% (a 91% improvement). In contrast, Polynomial Regression, despite favorable statistical performance, showed poor time series alignment and overfitting, misrepresenting inter-annual variability and extremes. The strong performance of the QM method demonstrated its ability to adjust not only mean biases but also the entire distribution of rainfall, preserving variability and capturing extremes more effectively than the other techniques. This is in agreement with findings from previous studies such as those by [
24,
43] which highlighted the robustness of QM in bias correction. The LT demonstrated strong performance, particularly at Mbarara, where it effectively corrected bias in the GPCC dataset, achieving improvements of 9% in RMSE, 10% in MAE, and eliminating systematic bias with a PBIAS of 0.00%. The DM method, although less consistent overall, was most effective at Soroti for the CHIRPS dataset, where it reduced the RMSE and MAE by 45% and 53% respectively, and corrected PBIAS from −45% to 0.00%. Polynomial Regression (PR) yielded the best statistical performance across all stations, with the lowest RMSE and MAE and the highest NSE values. However, as revealed from the time series plots and goodness-of-fit test results, it overfitted the data, producing smoothed outputs that failed to capture rainfall variability and extremes, as also noted by [
23].
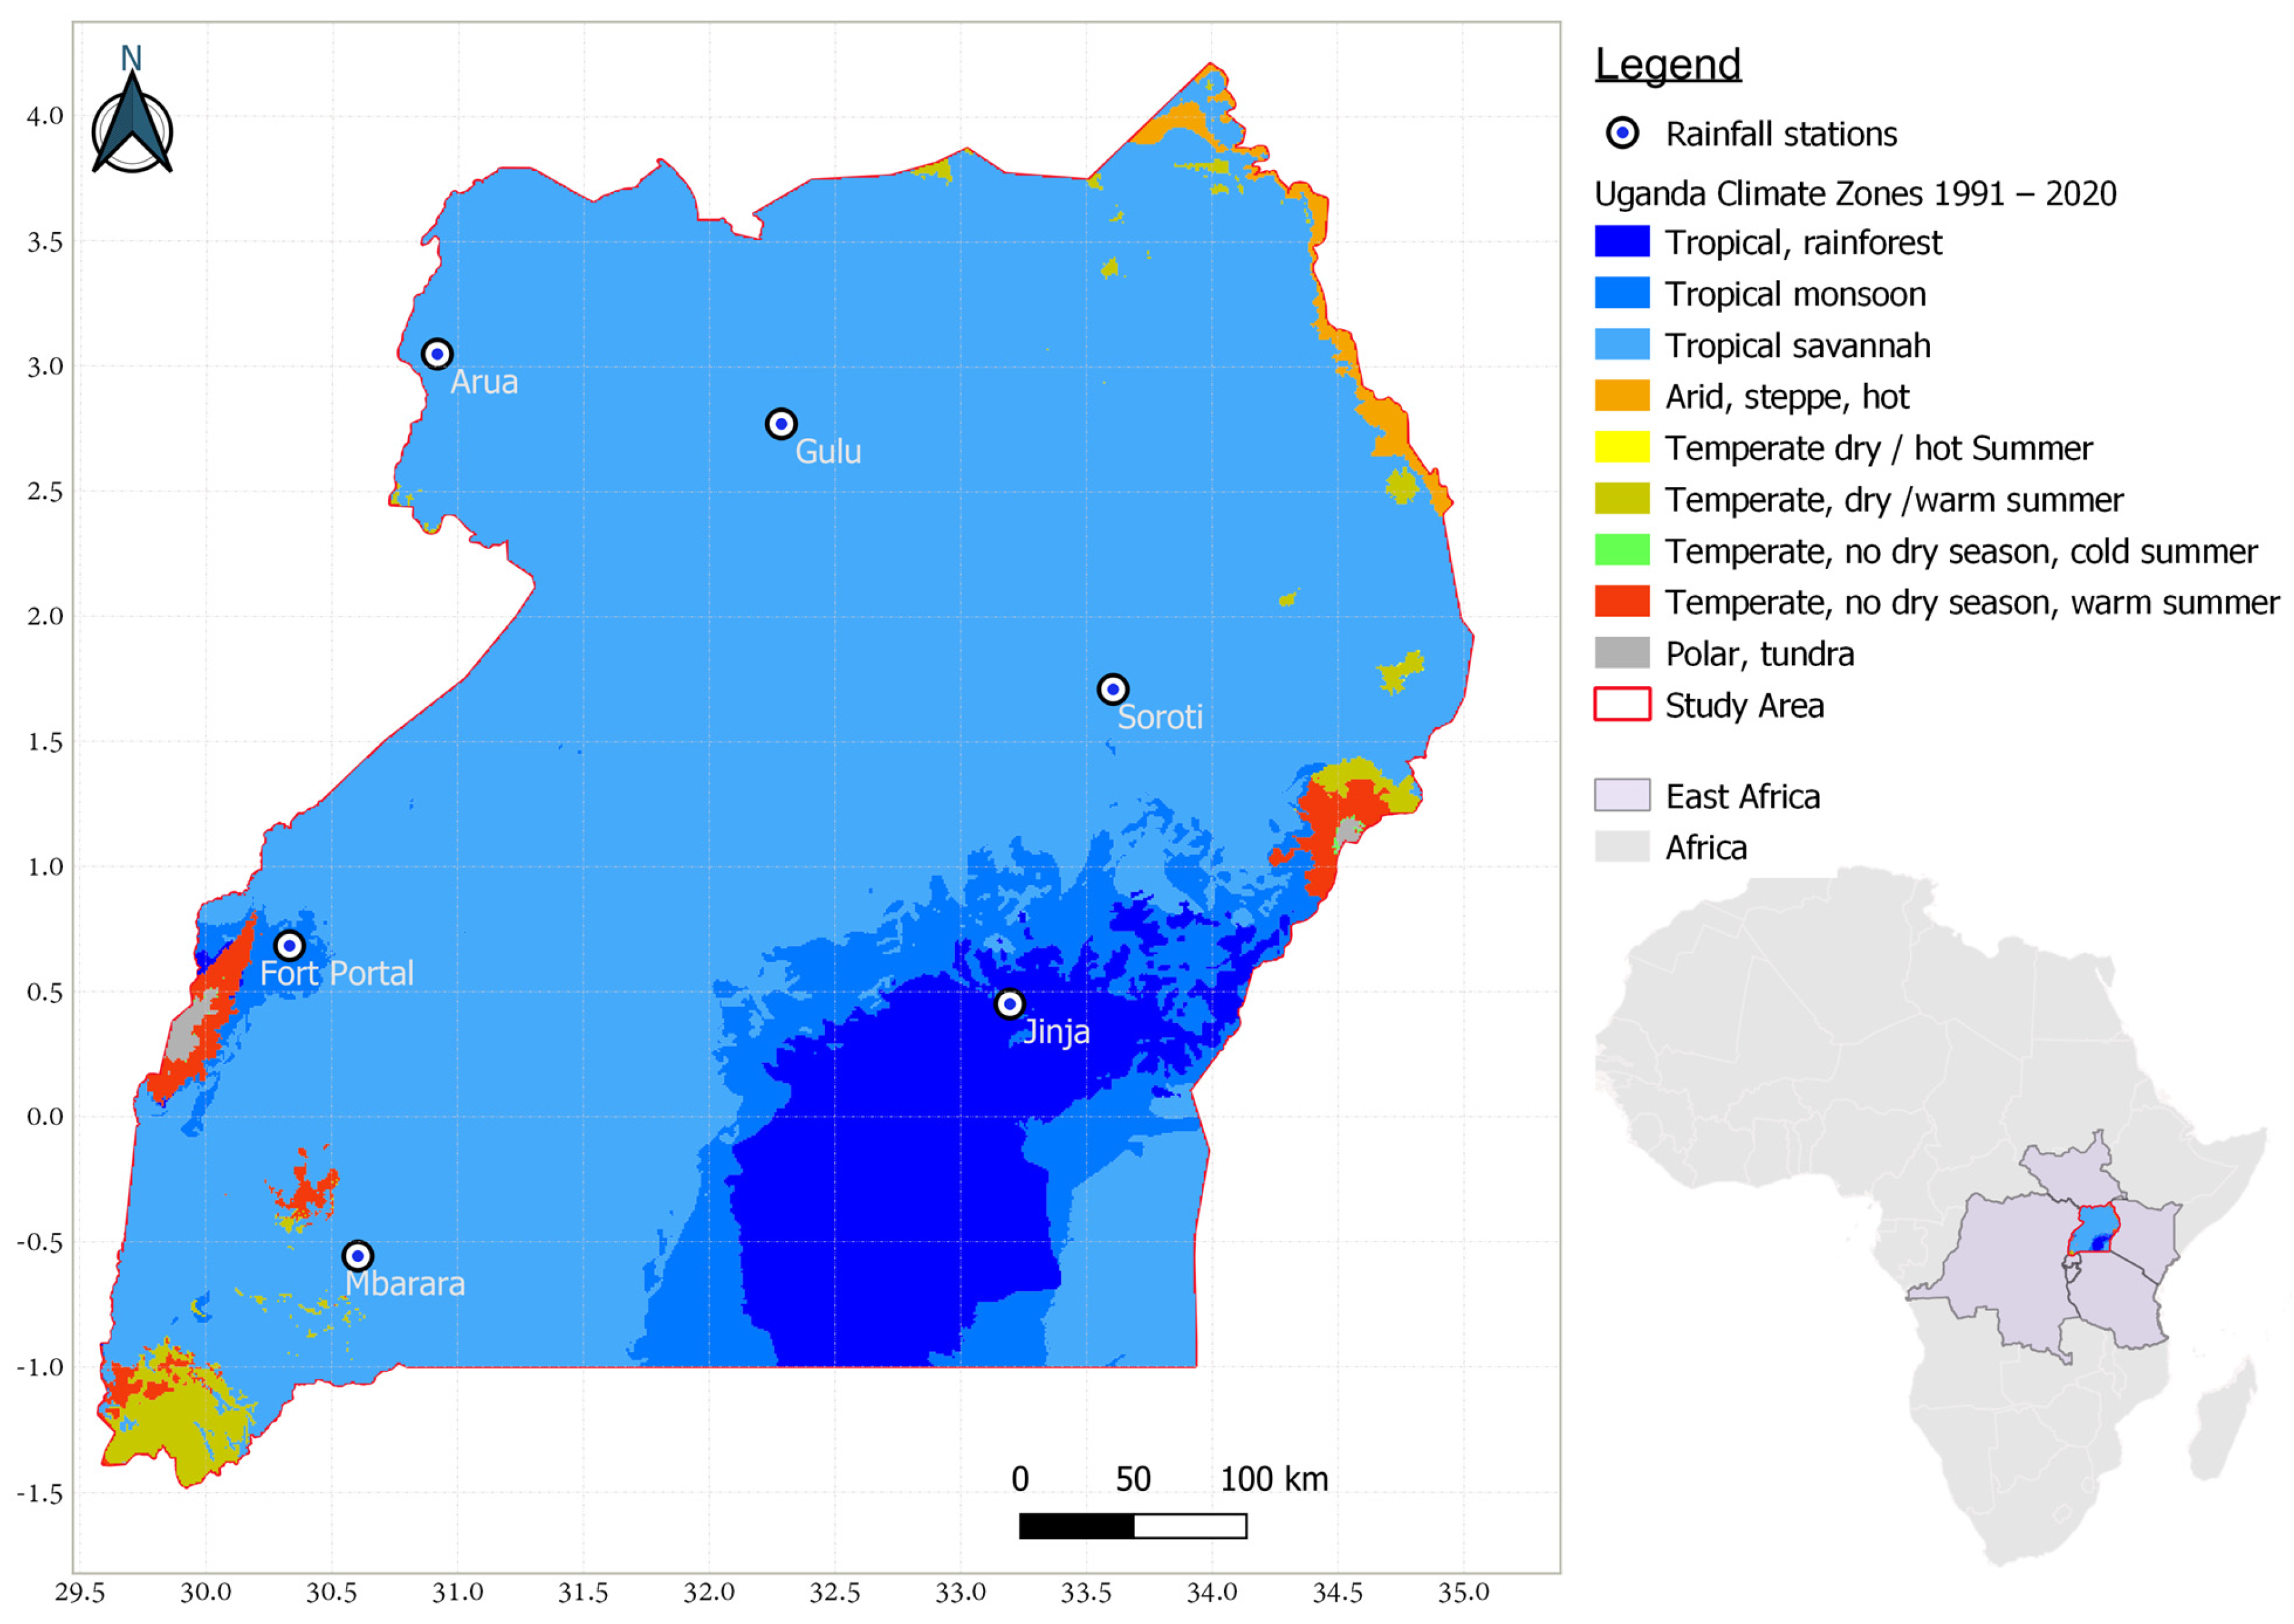
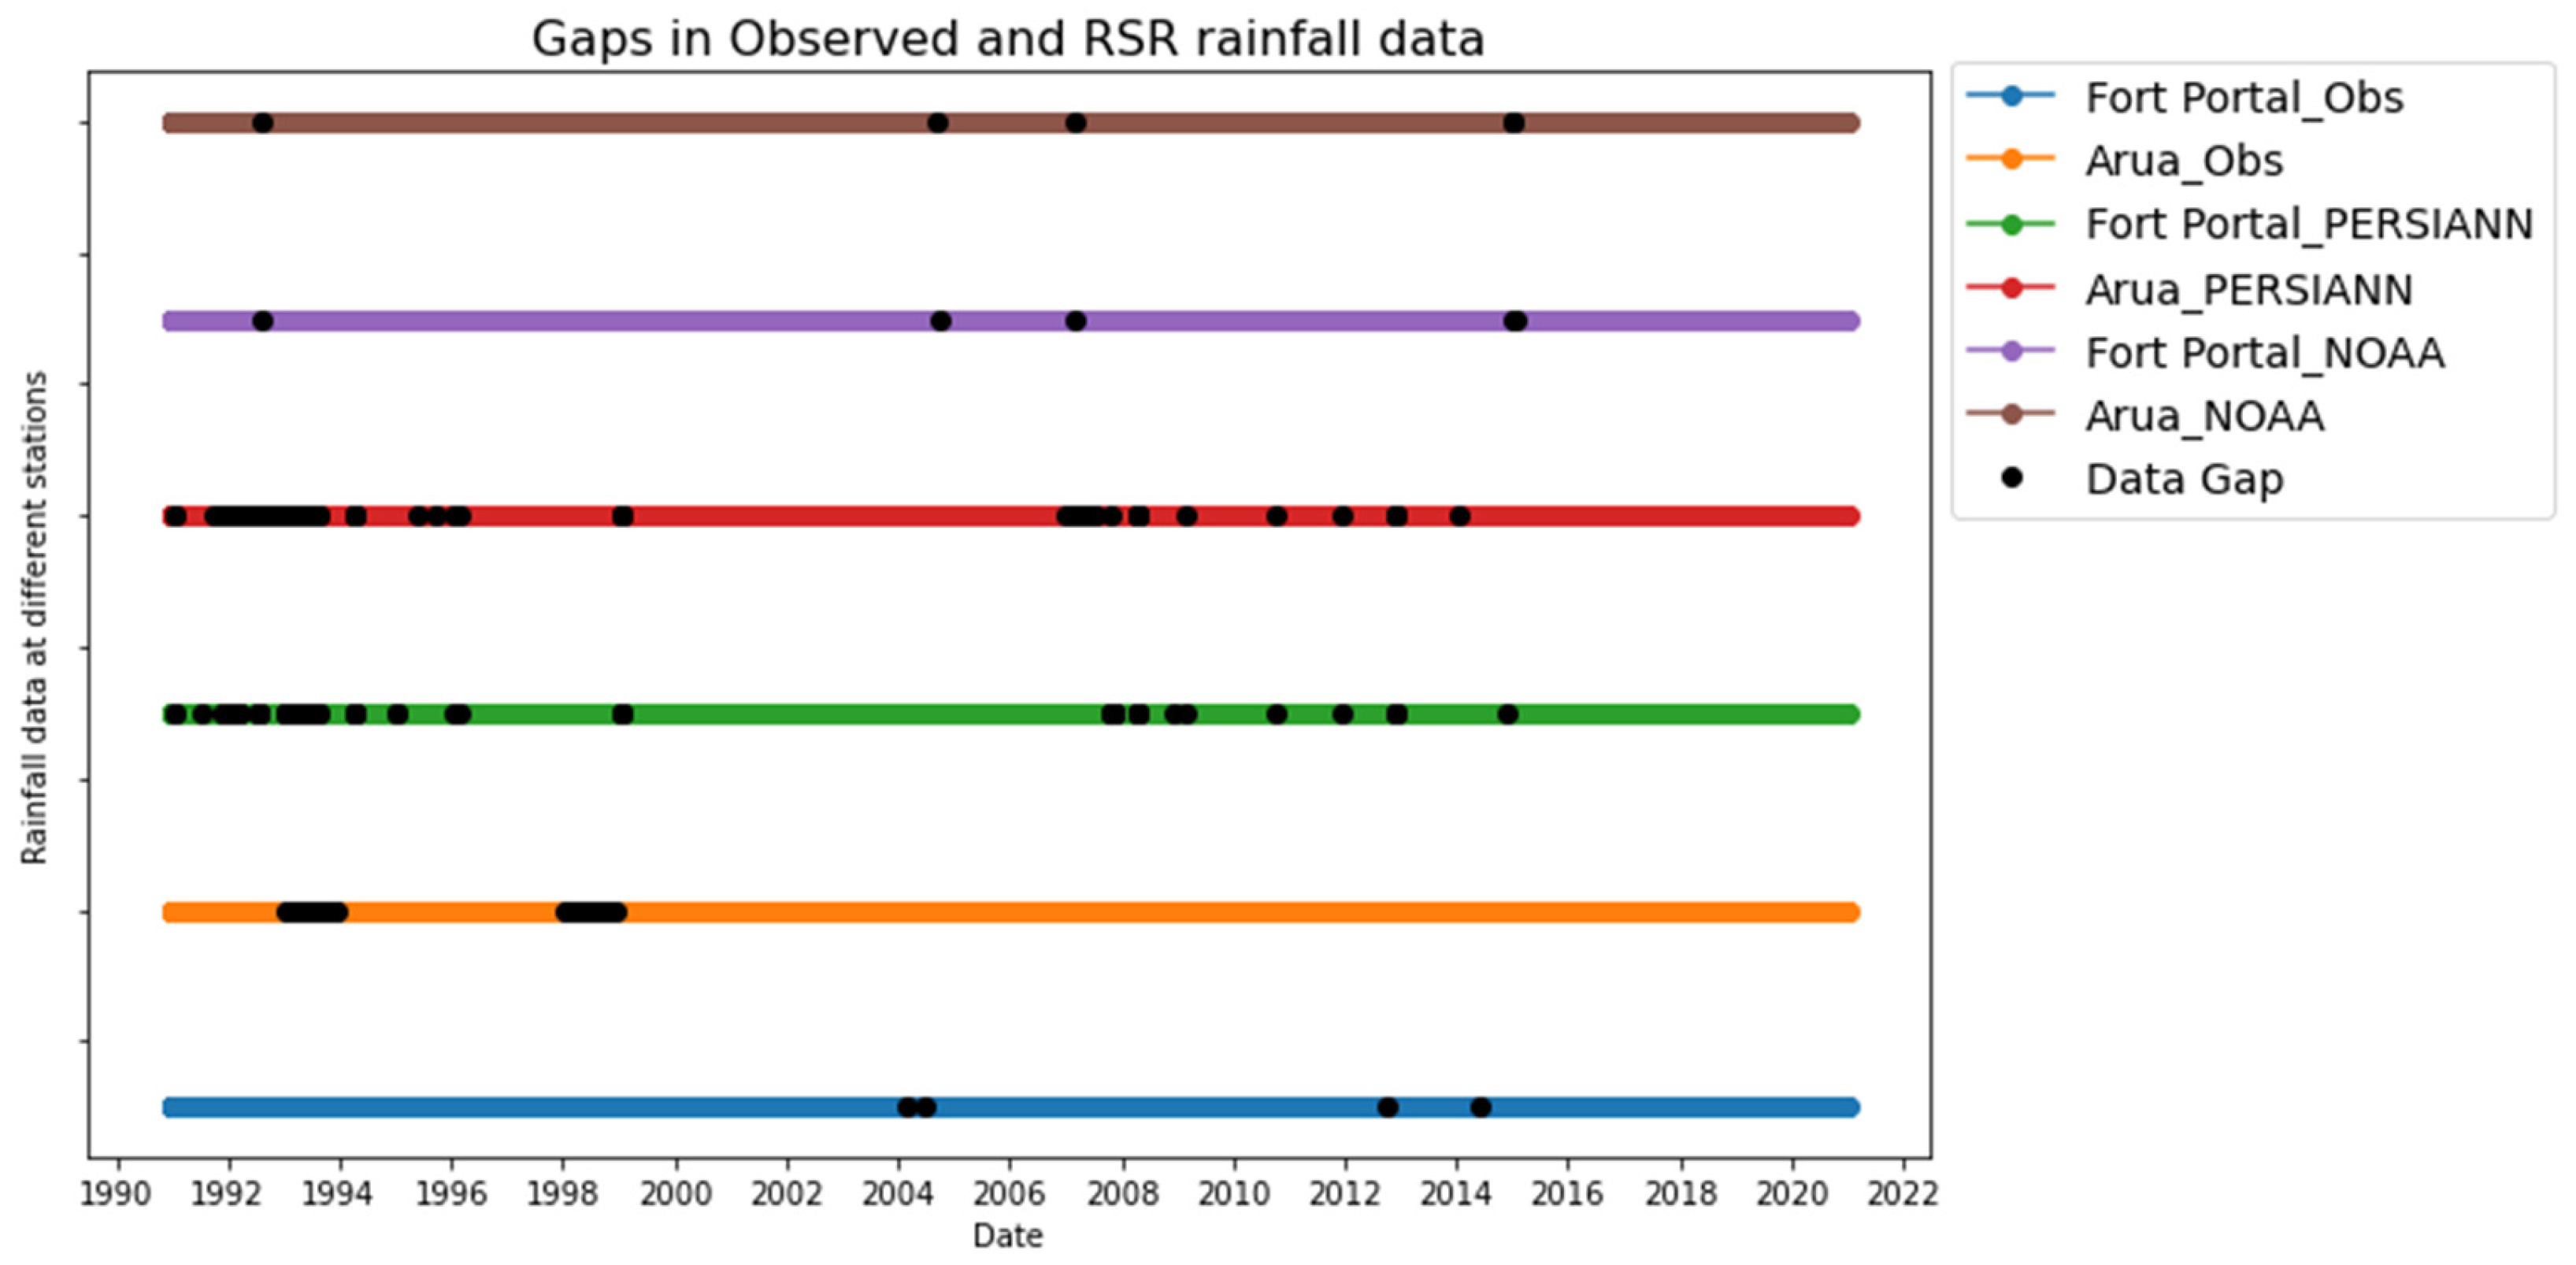
For the second objective, our research successfully developed a flexible bias correction framework that adapted the better-performing methods in gauged catchments to ungauged catchments. This was achieved through the use of predetermined bias correction factors (mean and standard deviation biases) derived from four gauged stations. These factors are particularly valuable in regions with no observed data, supporting flexible bias correction across different climate zones. Validation at the Arua station, located in a tropical savannah climate zone, showed that applying the maximum observed biases yielded the best performance. In contrast, at the Fort Portal station, situated in a tropical monsoon climate zone, minimum bias values led to better results. These contrasting outcomes reveal the importance of considering regional climate variability in bias correction, an insight supported by previous research such as that by [
54,
55], who noted similar regional effects in hydrological modeling.
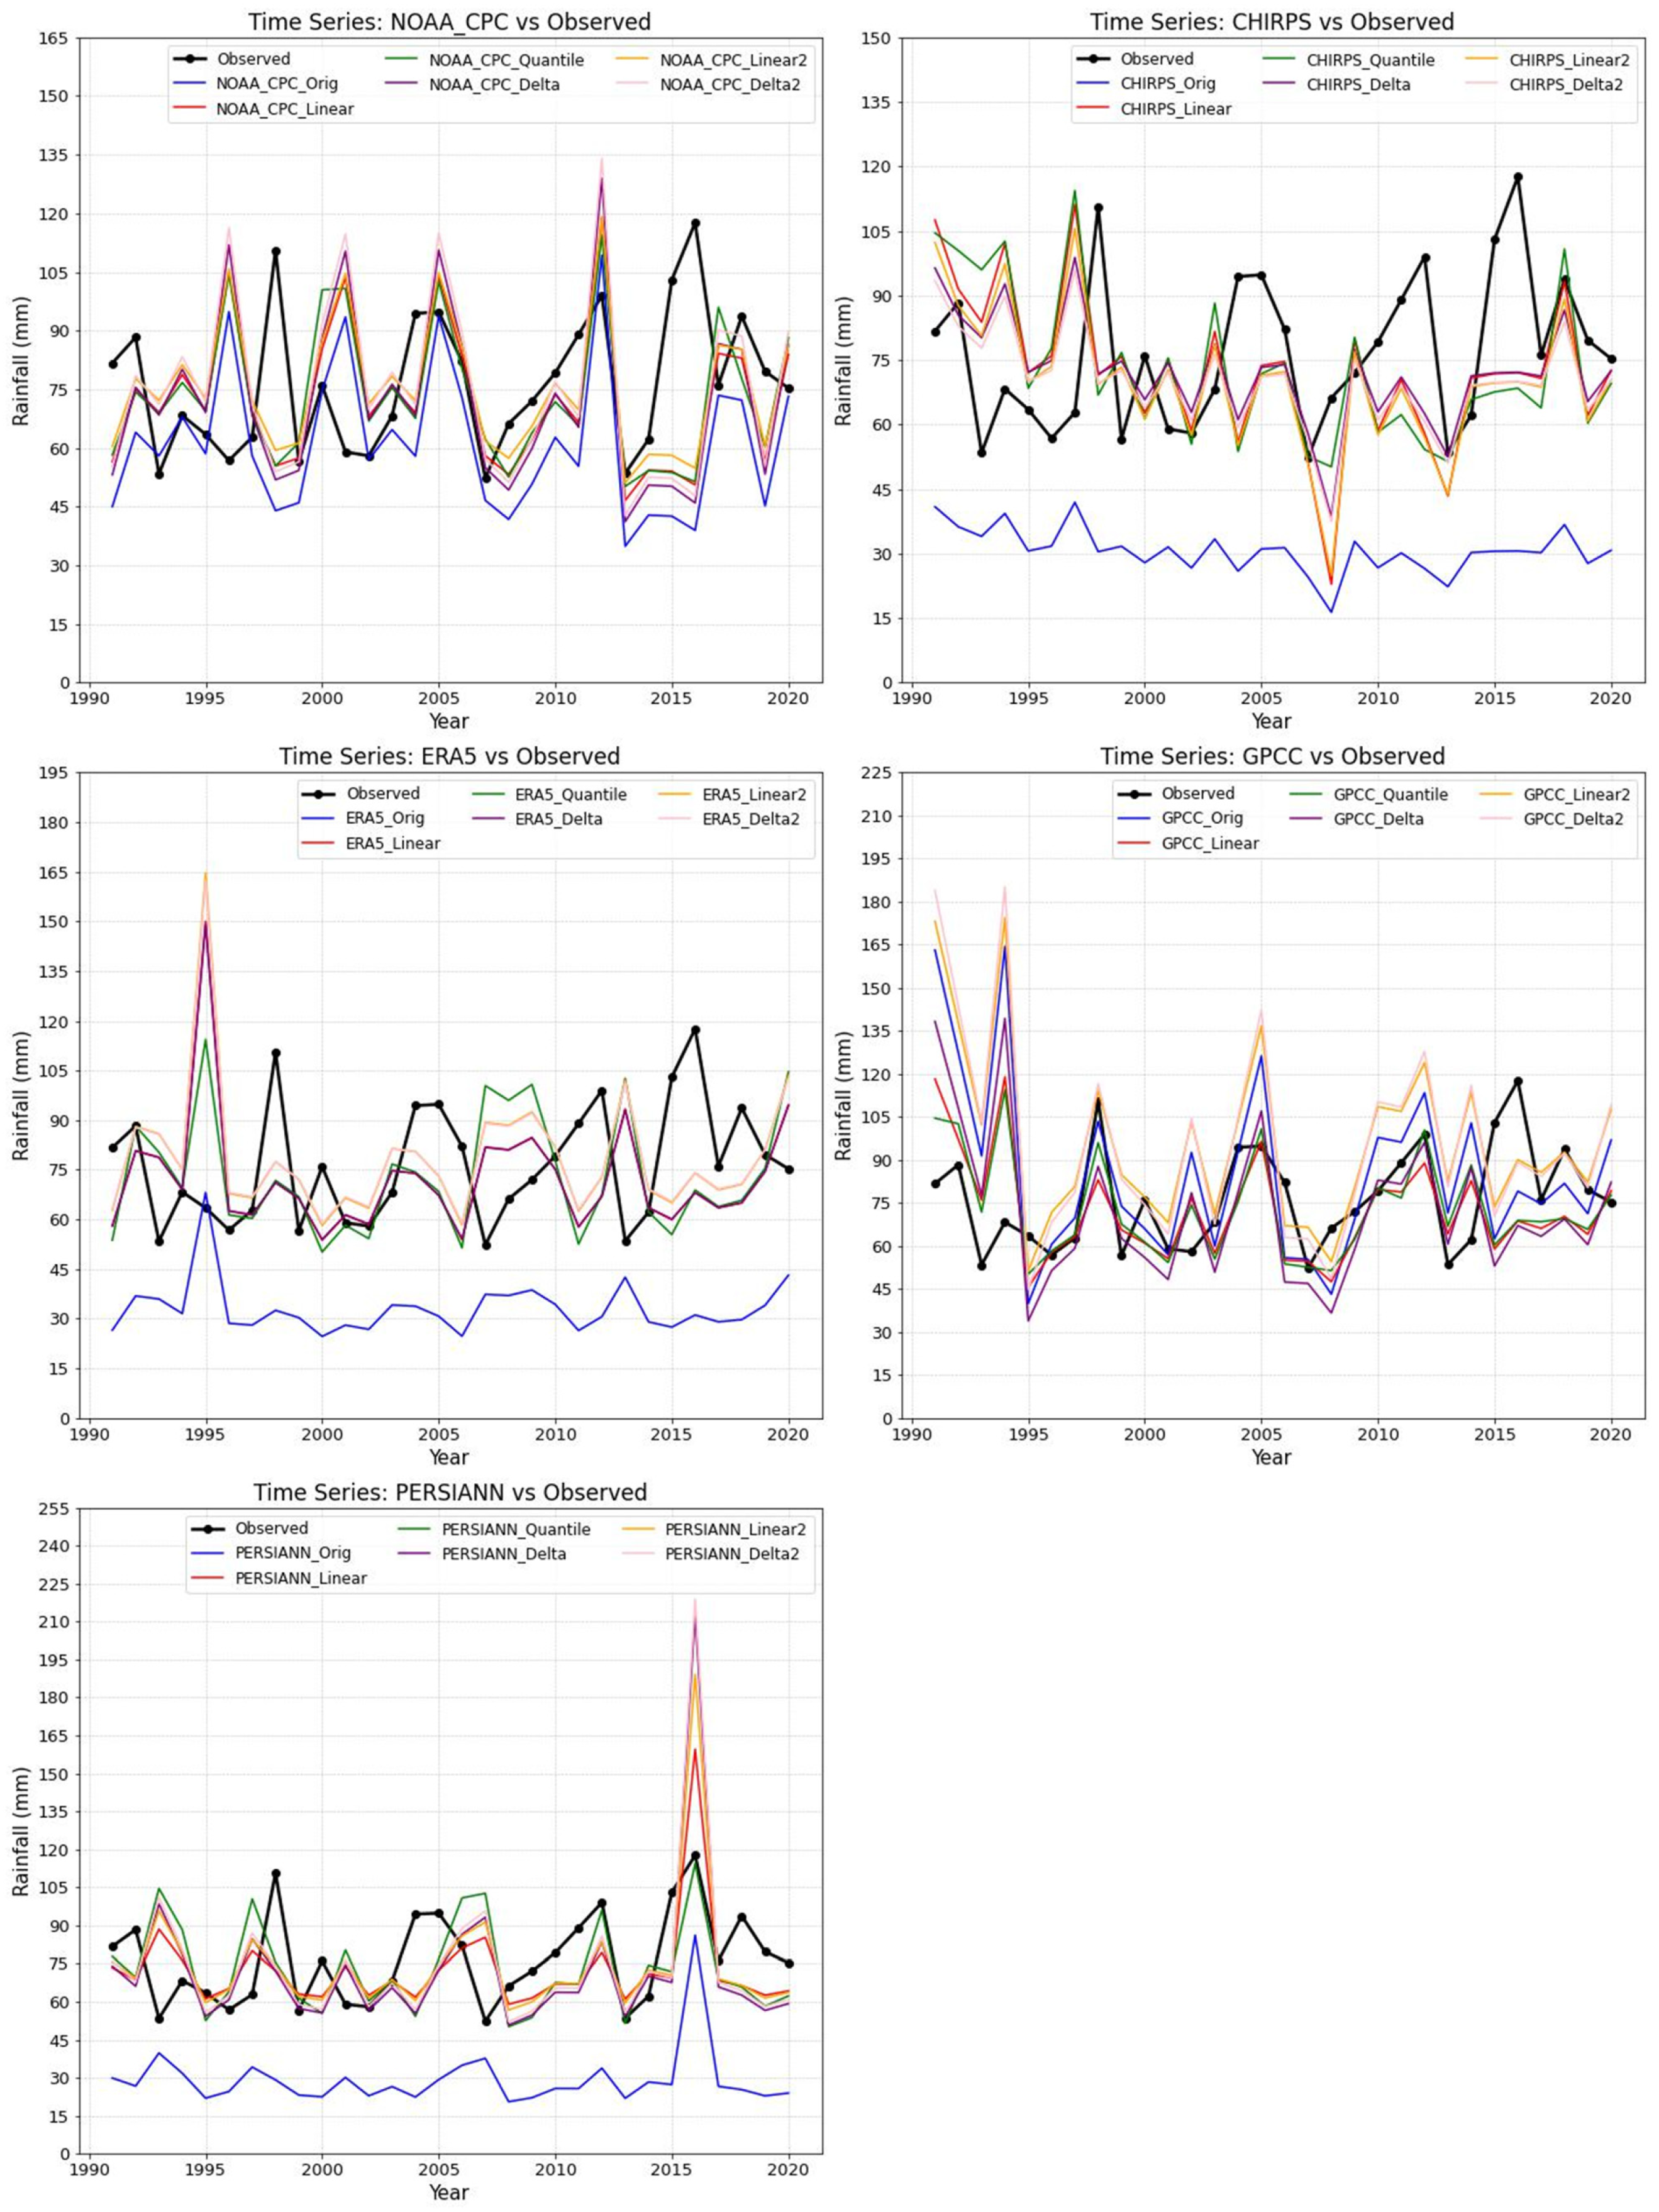
The third objective focused on validating the framework using independent stations, Arua (in a tropical savannah climate zone) and Fort Portal (in a tropical monsoon climate zone). The results confirmed the framework’s adaptability and effectiveness. For example, at Arua, validation using CHIRPS data, the Delta2 method (using predetermined factors) performed strongly, reducing the RMSE from 49.14 mm to 21.41 mm (56% improvement), MAE from 45.74 mm to 17.38 mm (62% better), and PBIAS from −59.83% to −8.18% (86% improvement). At Fort Portal, CHIRPS-Delta2 proved most effective, lowering the RMSE from 28.35 mm to 15.02 mm (47% improvement), MAE from 25.28 mm to 11.35 mm (55% better), and PBIAS from −46.2% to 4.74% (90% improvement), indicating substantial improvement. Furthermore, goodness-of-fit tests confirmed distributional alignment. At Arua, Quantile Mapping recorded KS statistics as low as 0.17 with p-values of 0.81, while Linear Transformation outperformed others at Fort Portal using minimum predetermined bias values. These results demonstrate the importance of climate zone-specific corrections, with maximum bias values performing better in savannah zones and minimum values in monsoon zones.
5.2. Recommendations
Based on this research’s findings and results, the following recommendations are proposed:
Quantile Mapping should be the primary bias correction method where sufficient historical data are available or can be inferred from nearby stations. It consistently delivered the lowest RMSE and best distributional fits across all datasets and gauging stations (e.g., KS = 0.03, p = 1.00 across multiple locations).
Where QM is not feasible due to data limitations, LT and DM methods offer a viable alternative, especially in ungauged areas where predetermined bias correction factors can be used. LT and DM methods offer useful alternatives in ungauged catchments, particularly when combined with predetermined bias correction factors. Their performance was notable in the absence of local observed data, such as at the Arua station.
Polynomial Regression should be avoided despite its statistically favorable metrics in most cases. It demonstrated a poor visual fit, over-smoothed time series, and failed to capture rainfall extremes.
The developed bias correction framework can be implemented in ungauged catchments across Uganda, particularly in remote areas where observed data are sparse. Option 1, which uses the closest station’s observed data in the same climatic zone, should be prioritized where feasible, as it provides more accurate results. Option 2, which relies on predefined bias correction factors, remains a valuable alternative in the absence of nearby stations.
For ungauged catchments, it is recommended to use predetermined bias correction factors tailored to specific climate zones. This research showed that maximum bias factors worked best in the tropical savannah (e.g., Arua), while minimum bias values were more effective in the tropical monsoon (e.g., Fort Portal). Practitioners should therefore adjust correction strategies based on regional climatic conditions.
From a policy and infrastructure planning perspective, institutions such as the Ministry of Water and Environment and the Ministry of Works and Transport of the Republic of Uganda should explore the use of bias-corrected RSR datasets into flood risk assessment and infrastructure design frameworks in data scarce or ungauged catchments. These corrected RSR datasets are viable alternatives to observed rainfall data as inputs for models used in designing culverts, bridges, and drainage systems. Additionally, policymakers and research institutions should consider prioritizing investments in expanding ground-based rainfall monitoring networks, as improved observational data will strengthen the calibration and validation of bias correction models and support better water resource planning under changing climatic conditions.
5.3. Research Assumptions and Limitations
Despite the promising results reported earlier, the research has certain limitations. In terms of scope, the research focused on bias correction for Annual Maximum Series (AMS) of daily RSR datasets (CHIRPS, GPCC, NOAA_CPC, ERA5, PERSIANN, MERRA2, and ERA5_AG) across the four gauged stations (Gulu, Soroti, Jinja, and Mbarara), with validations at the Arua and Fort Portal stations in Uganda. It analyzed RSR data from 1991 to 2020, evaluating bias correction methods for their ability to align with AMS of observed rainfall patterns. Some of the key assumptions and limitations of the research are as follows:
The research focused on Annual Maximum Series (AMS) rainfall data, which may not adequately capture short-duration extreme rainfall events that are critical for flood modeling.
The predetermined bias correction factors, derived from four gauged stations and regionalized parameters (mean and standard deviation), proved effective at the validation sites. However, their generalizability to other ungauged locations remains uncertain without further testing. The reliance on four stations may not fully capture spatial variability across Uganda.
Stationarity of RSR bias in time and space: It was assumed that the nature and magnitude of biases in RSR data remained stable over time and across stations. This assumption may not hold in the context of climate change or evolving land-use patterns as also noted by Maraun [
59]. In addition, while the framework was validated at two additional stations, further testing across more ungauged catchments in various climate zones is necessary to generalize its application.
5.4. Areas for Future Research
While this research made contributions to the evaluation, development, and validation of RSR bias correction framework, there are several areas that warrant further investigation:
Future research could explore other RSR products not tested in this study to evaluate the applicability and effectiveness of the developed framework across a broader range of RSR datasets.
Future research could build on this research by examining short-duration RSR products or exploring methods to disaggregate daily rainfall data. Such disaggregation would facilitate the generation of sub-daily rainfall estimates, enhancing flood risk modeling, hydrological infrastructure design, and water resource management.
Application of the developed bias correction framework to larger scale hydrological models. Future studies should test the application of the bias correction framework on large-scale hydrological models to assess its impact on water resource management and planning.
Further research could also explore the integration of machine learning models to enhance the adaptability and precision of bias correction, especially in complex terrains or data-sparse regions. In addition, the development of multivariate bias correction frameworks, which account for interactions between rainfall and other climatic variables like temperature or humidity, could significantly improve the physical realism of corrected datasets.
Finally, validating this framework in more gauged and ungauged catchments across climate zones in Uganda is important to help determine its scalability and reliability in other regions.
5.5. Principal Conclusions
This research concludes that the bias correction of RSR datasets is essential for improving rainfall estimation in ungauged catchments, particularly in regions like Uganda, where observational data are limited. The proposed framework, anchored on the use of predetermined bias correction factors, including regionalized parameters, was validated through independent gauged stations. The framework proved effective in reducing systematic errors and aligning RSR data more closely with observed rainfall. Quantile Mapping emerged as the most effective method, while the Delta Multiplicative and Linear Transformation approaches also offered substantial improvements to RSR datasets at some stations and in some climatic zones. However, dataset-specific and climate zone-specific adjustments remain necessary, pointing to the need for tailored bias correction strategies.
The findings of this research can be broadly applied to other regions in Uganda with similar climatic and hydrological conditions, particularly in tropical and data-scarce areas that rely on RSR products. The bias correction framework, centered on regionalization and climate zone-based correction factors, is transferable to ungauged catchments within tropical savannah, monsoon, and rainforest zones, assuming similar RSR bias patterns. However, its applicability may be limited by regional variations in topography, rainfall mechanisms, and land use, which can influence both the magnitude and nature of RSR biases. Therefore, while the methodology is broadly adaptable, local recalibration and validation against representative stations in the target region are necessary to ensure accuracy in different settings.
The research contributes practical tools for hydrological applications in data-scarce environments and lays the groundwork for more adaptive, data-driven approaches to bias correction of AMS of daily RSR datasets in East Africa and beyond.


