

Responses of Terrestrial Water Storage to Climate Change in the Closed Alpine Qaidam Basin

 ,
,
Abstract
1. Introduction
2. Study Area, Data, and Methods
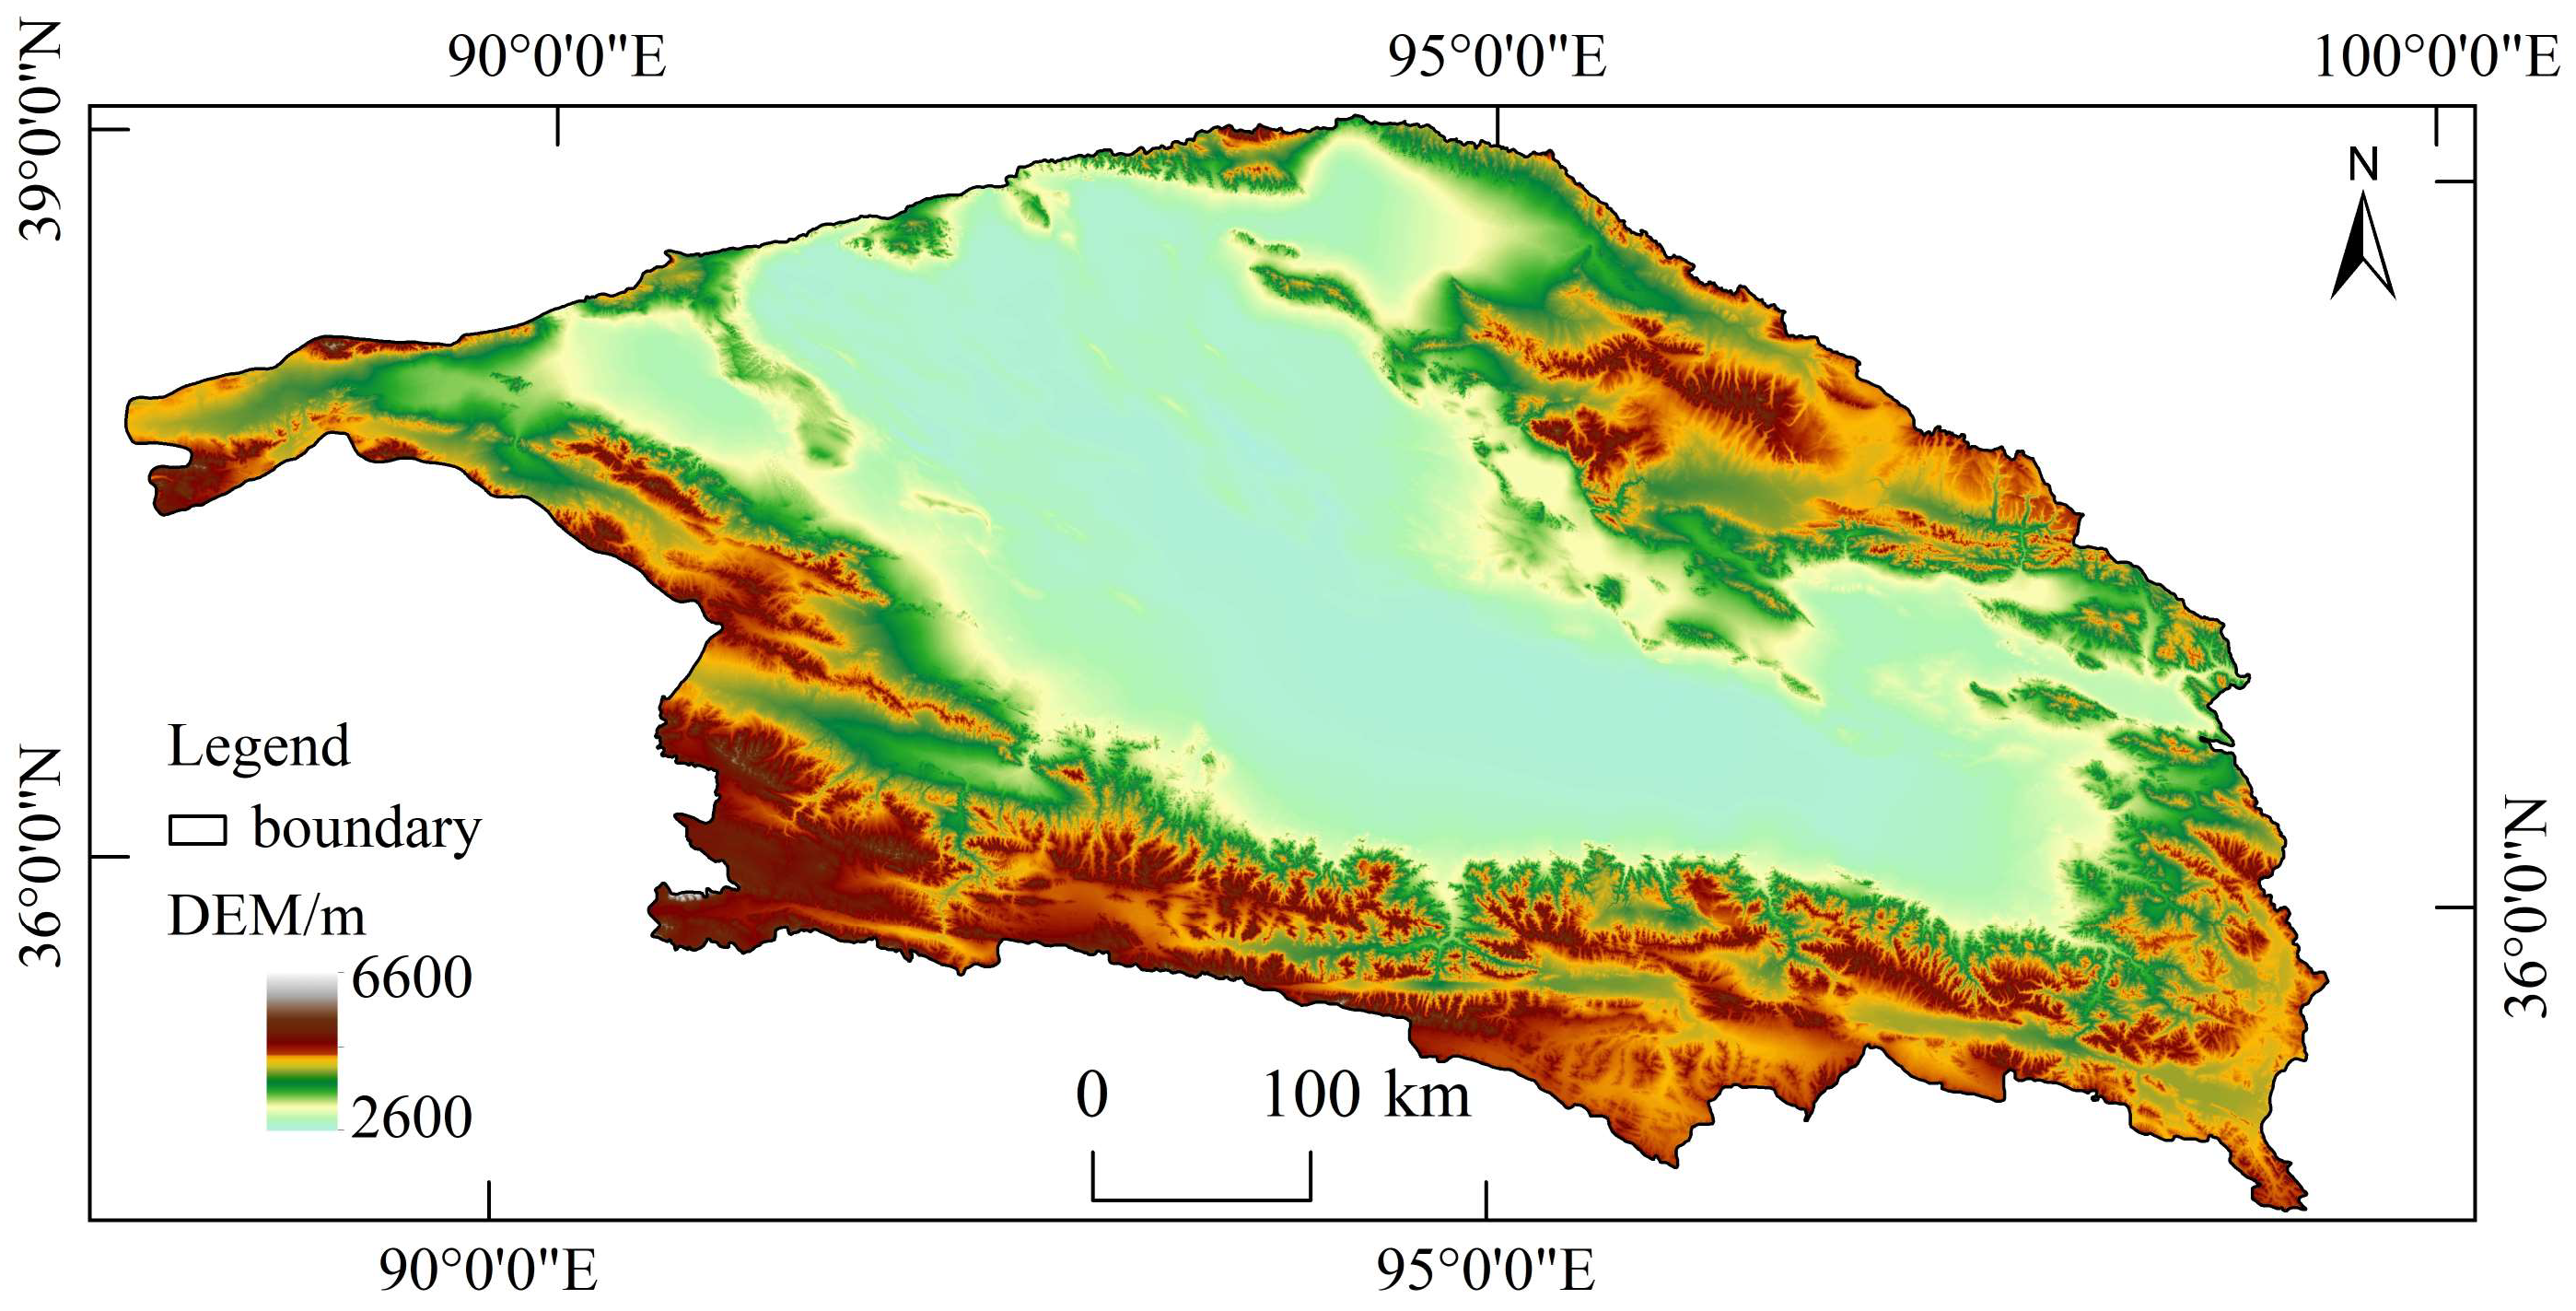
2.1. Study Area
2.2. Data
2.2.1. GRACE Mascon Products
2.2.2. GLDAS
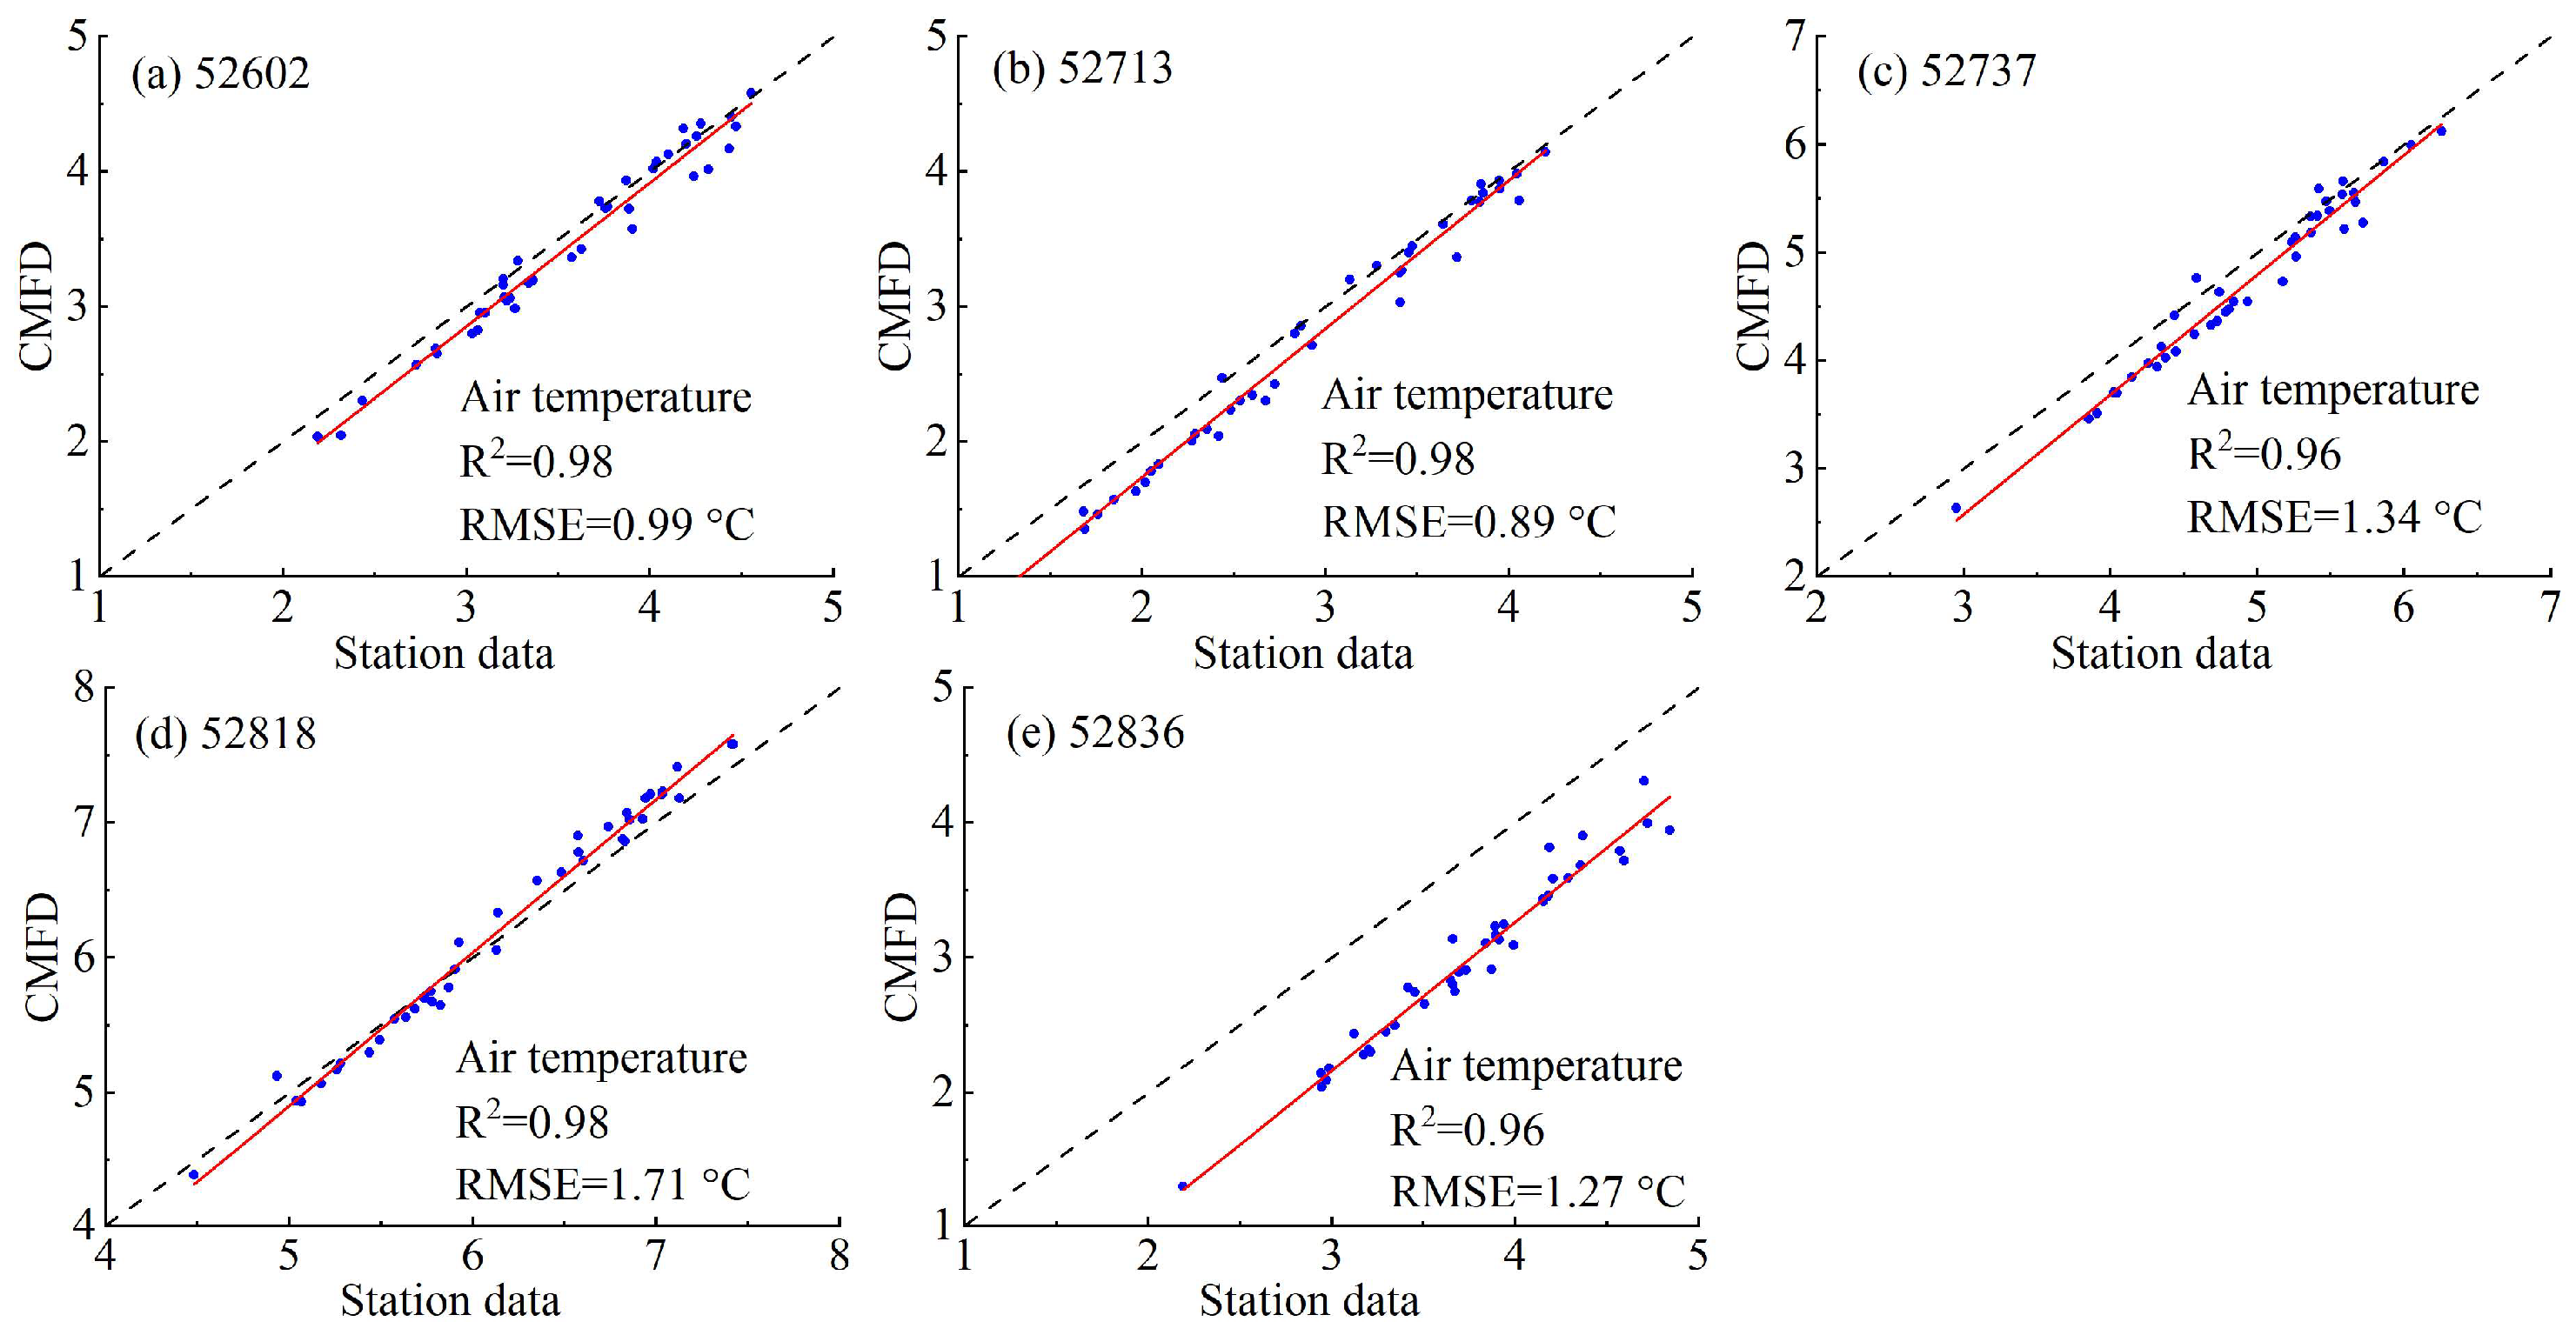
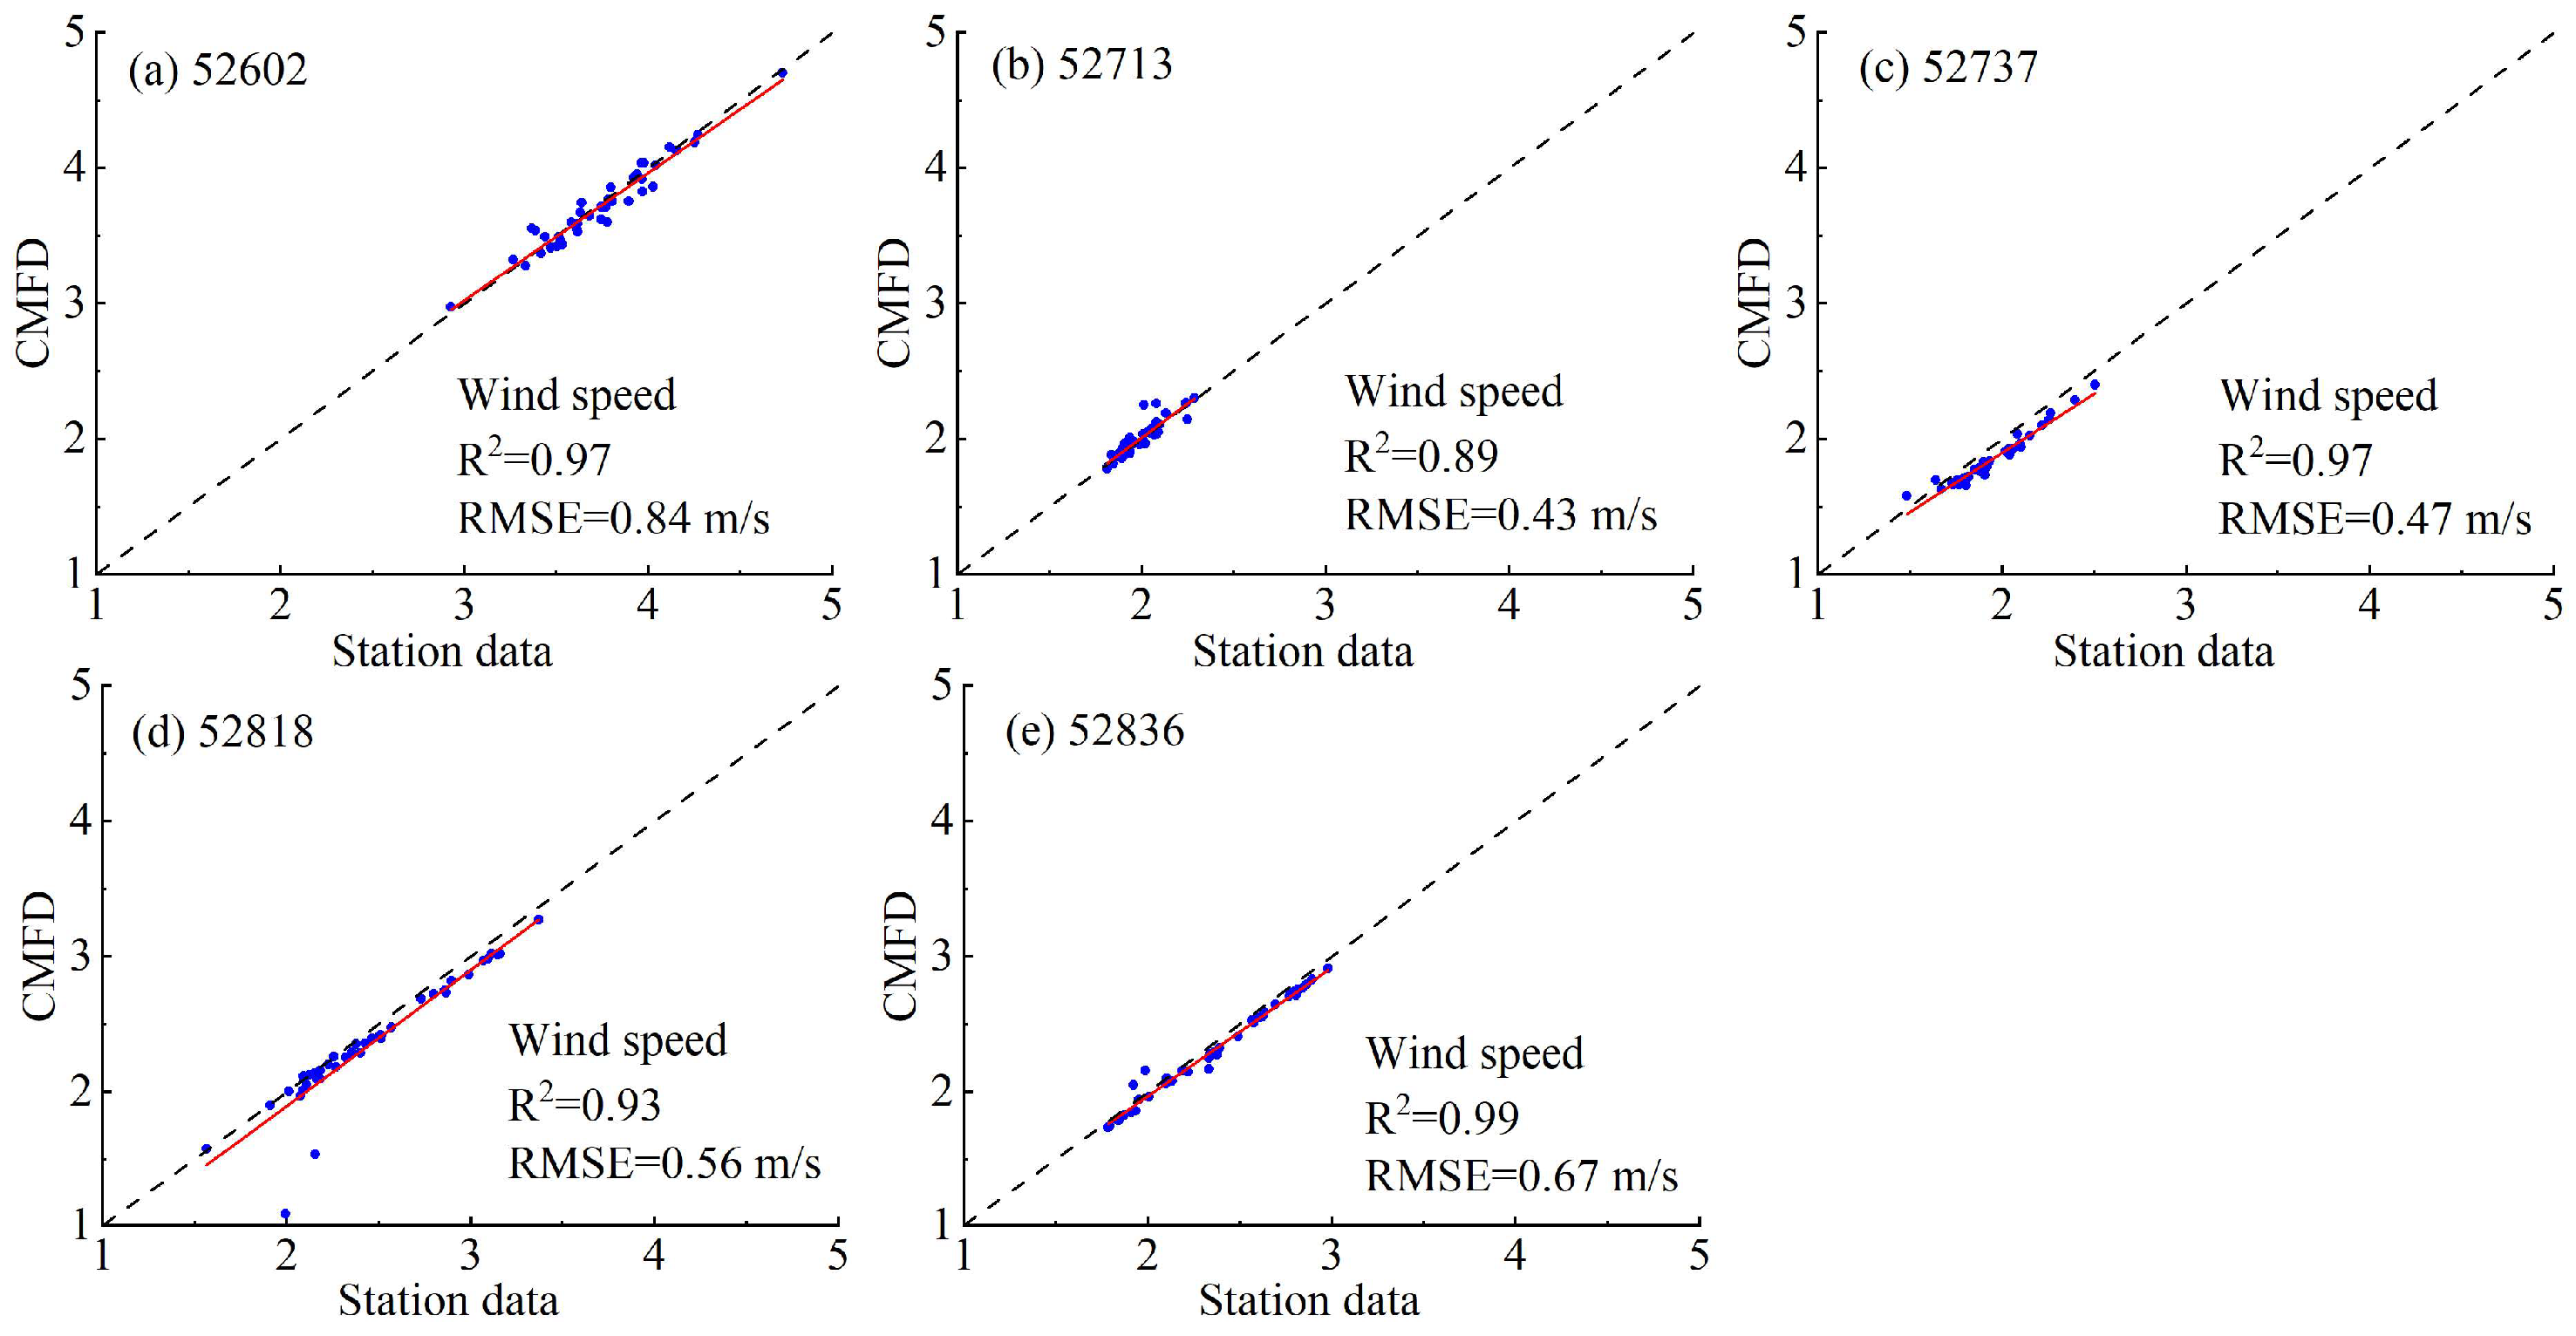
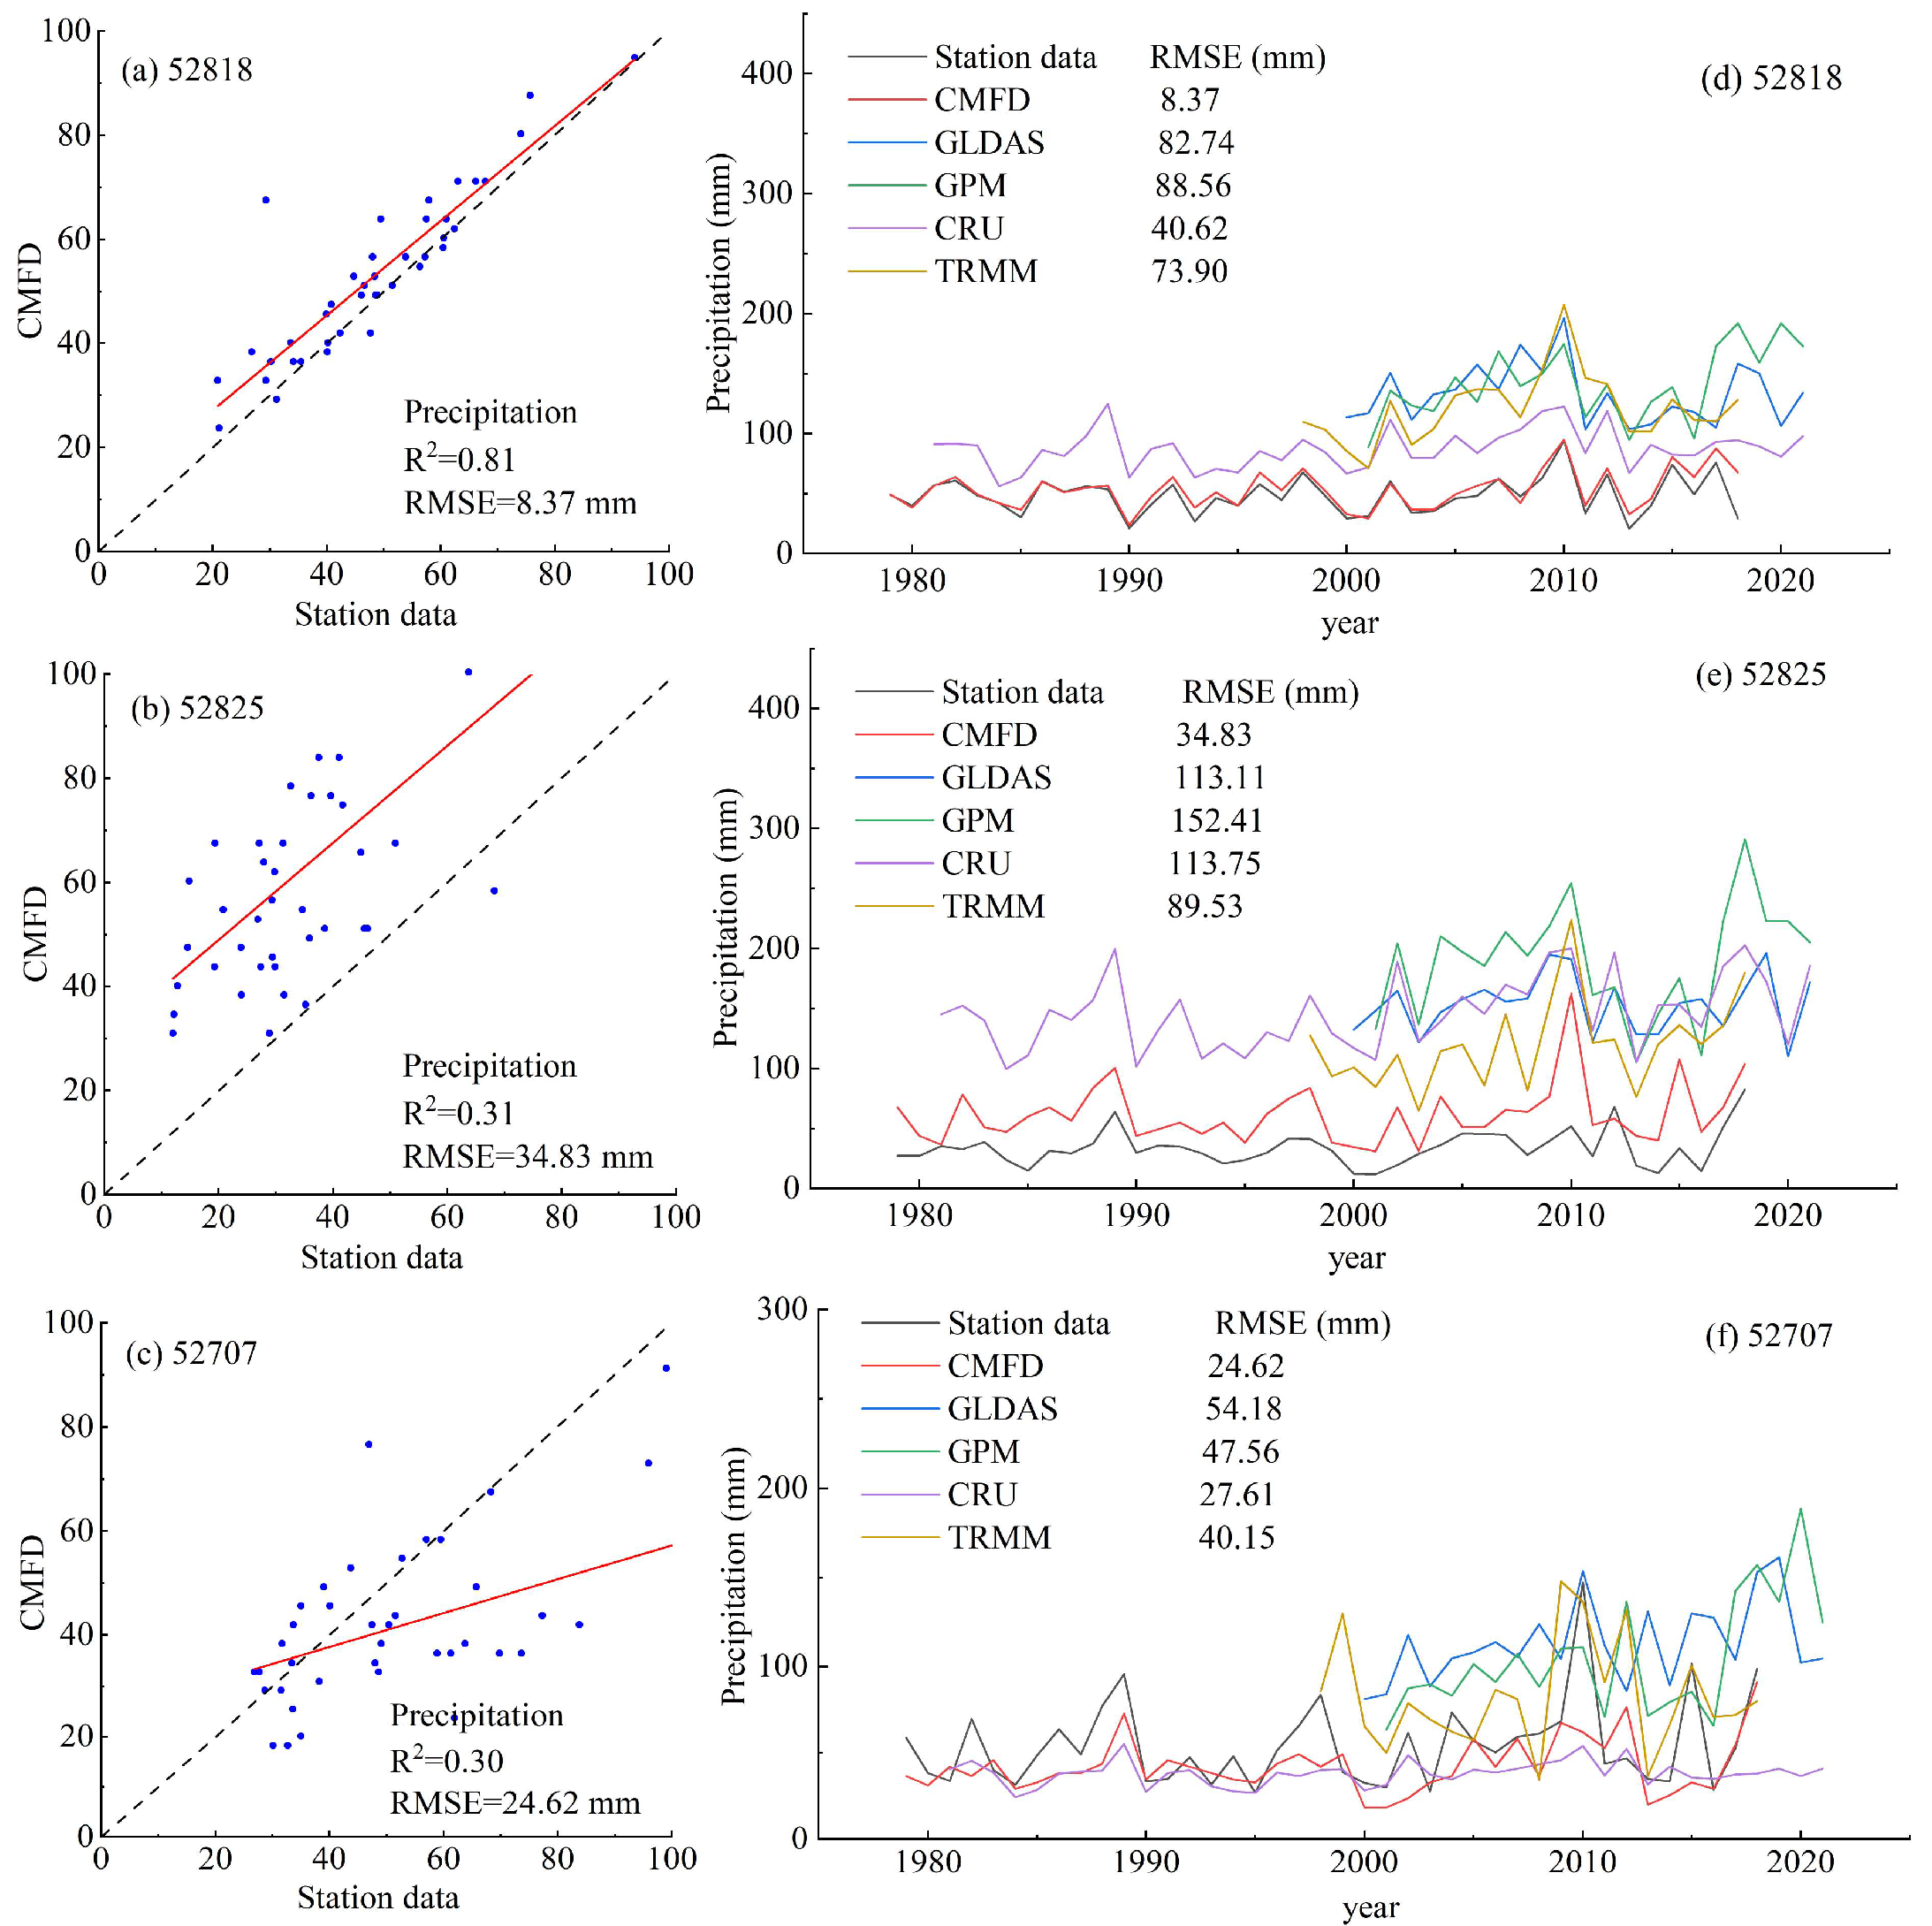
2.2.3. CMFD
2.3. Methods
2.3.1. Water Balance Analysis
2.3.2. Regression Model
3. Results
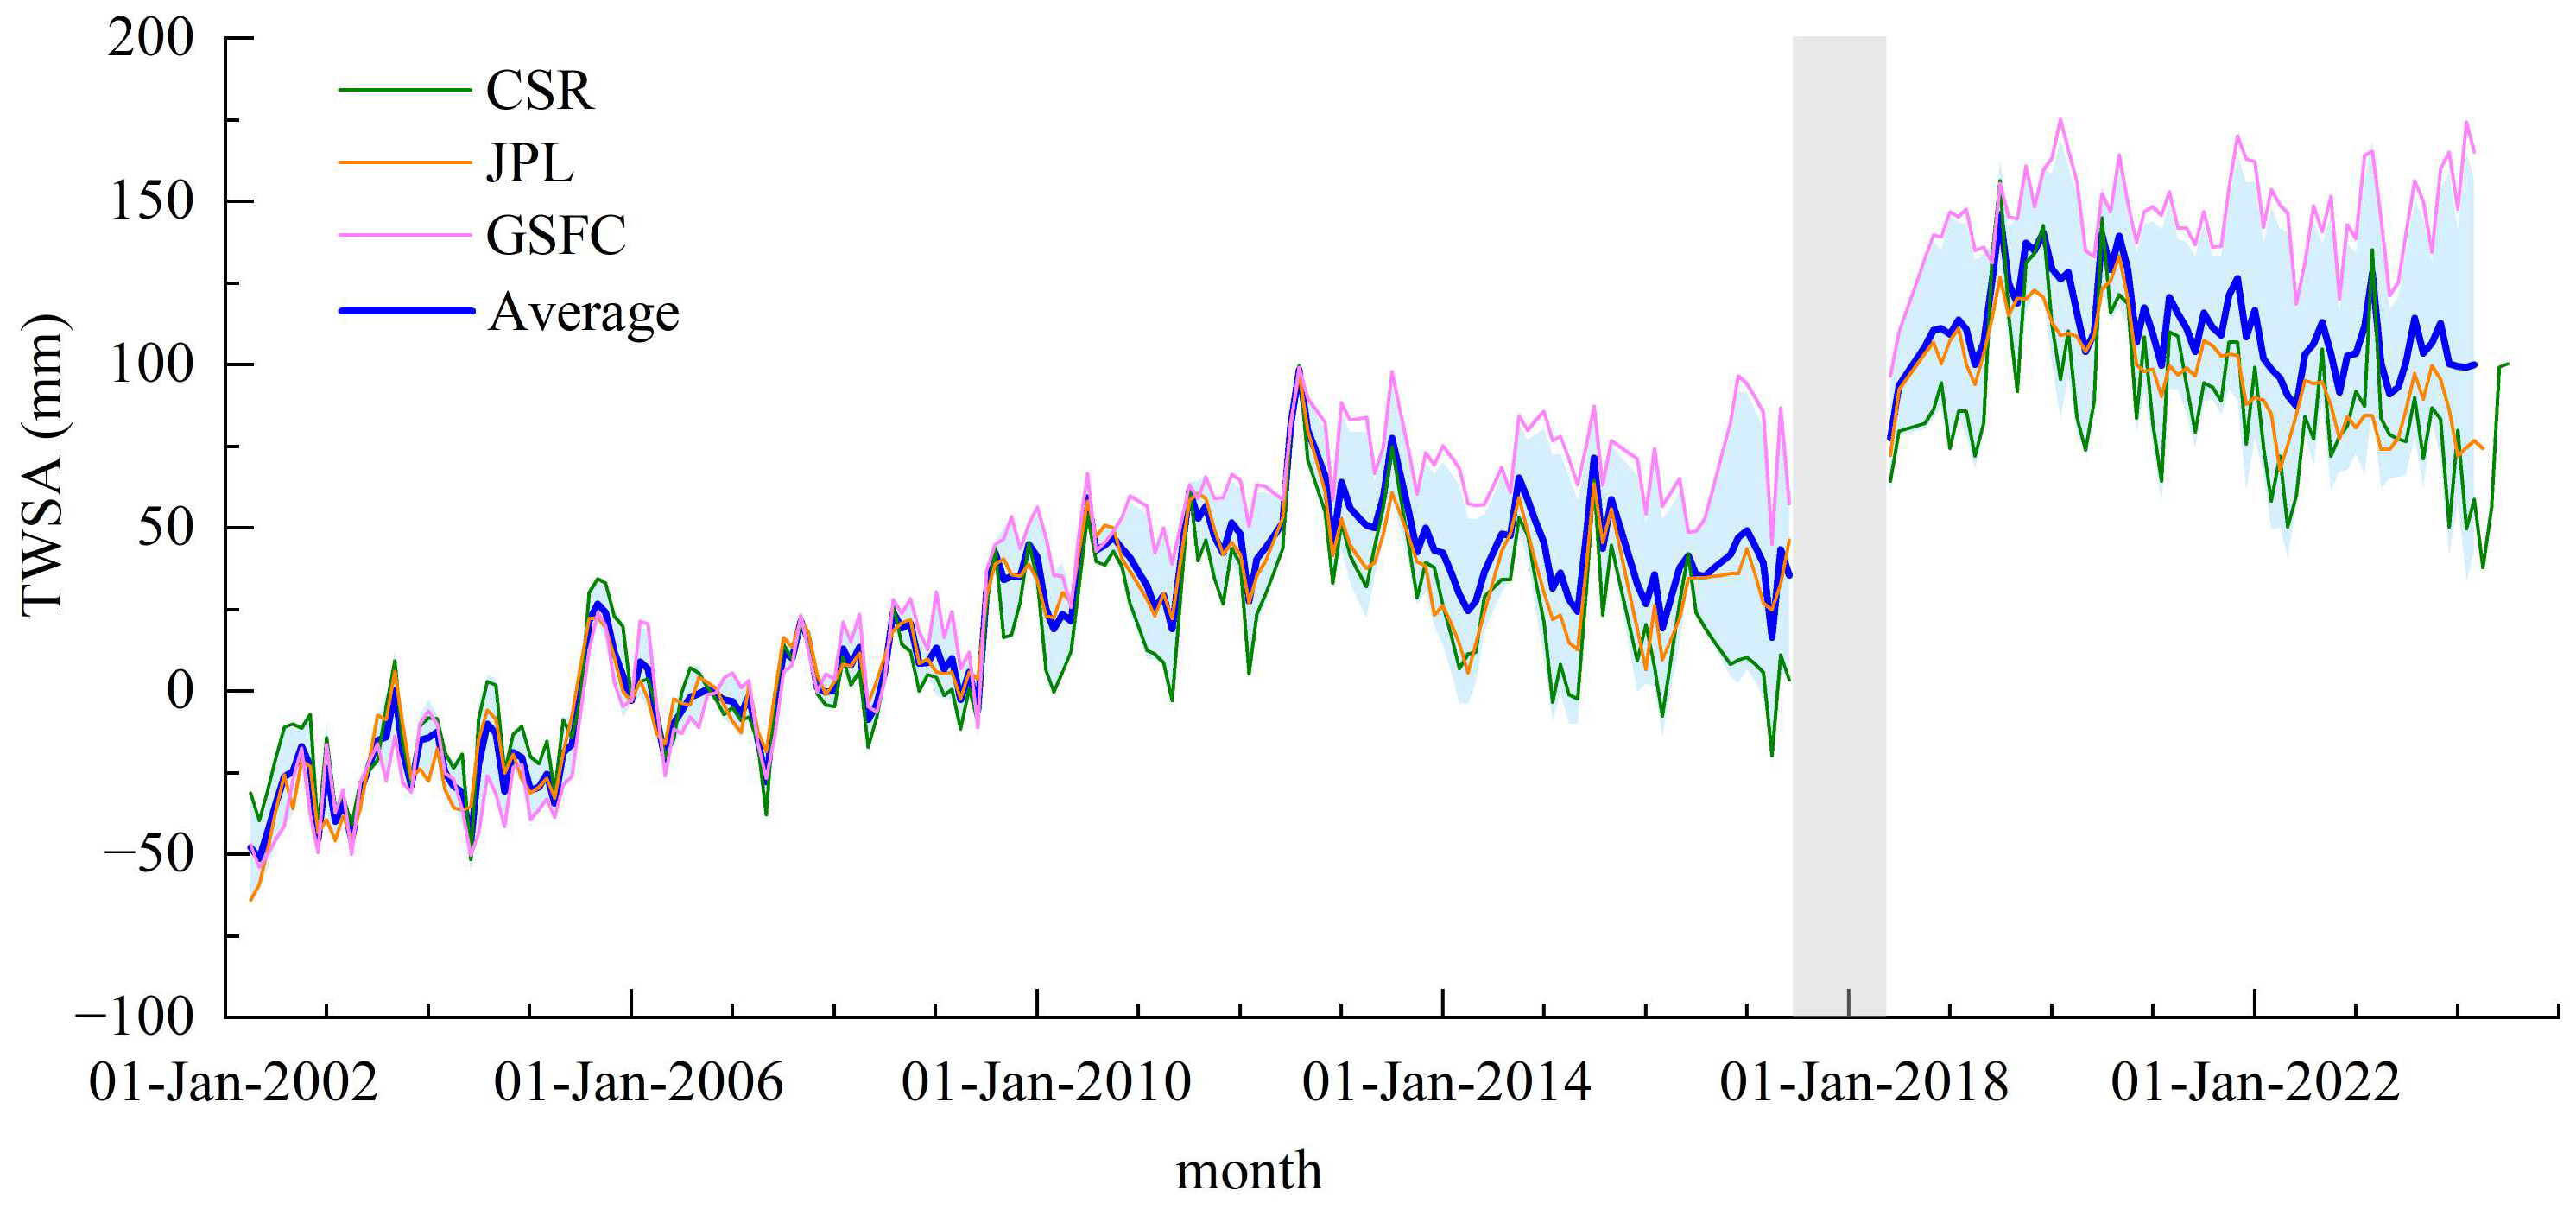
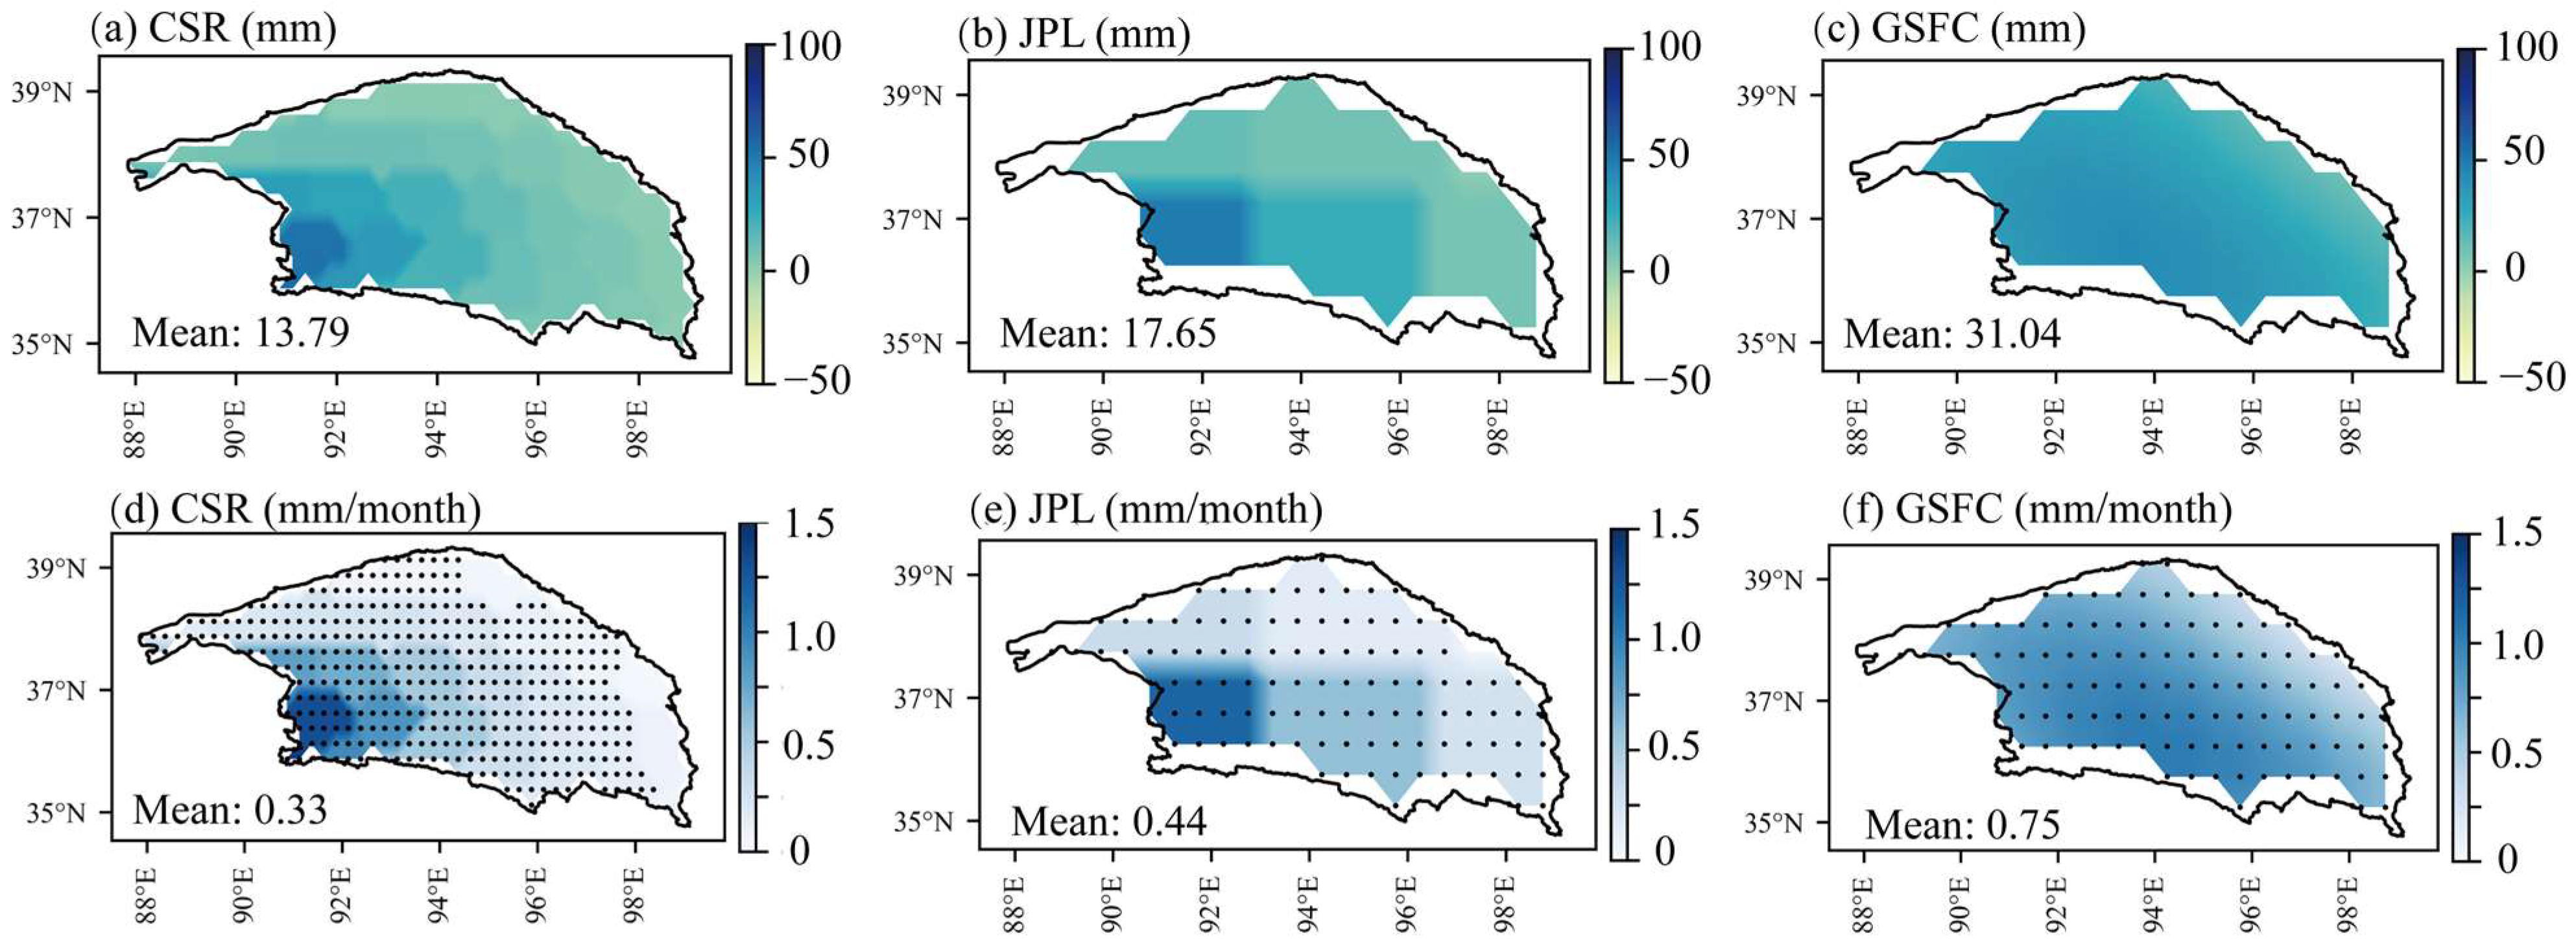
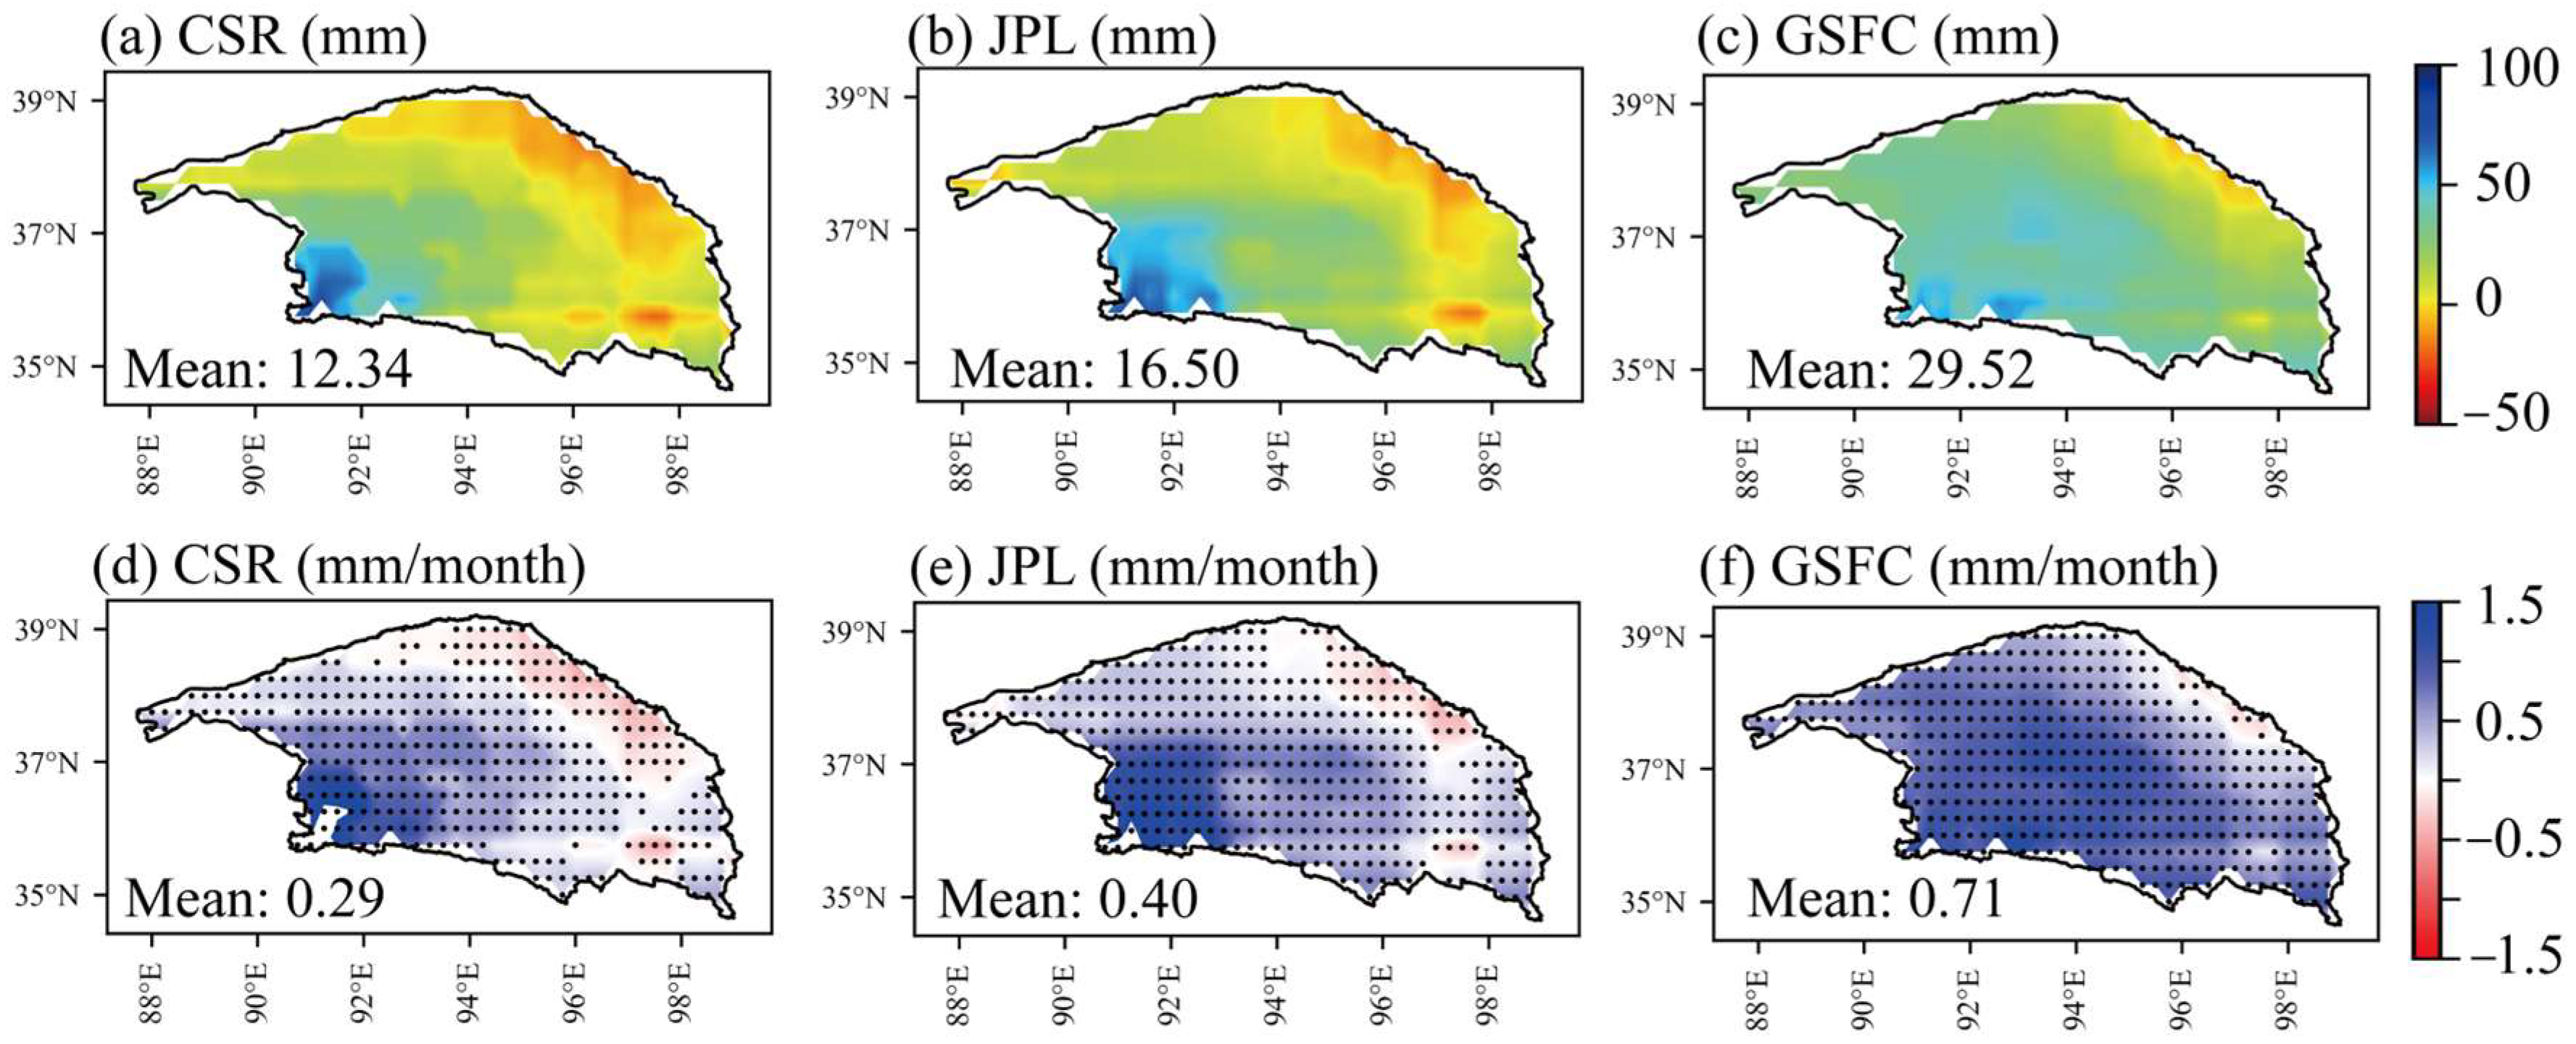
3.1. Variations in TWSAs
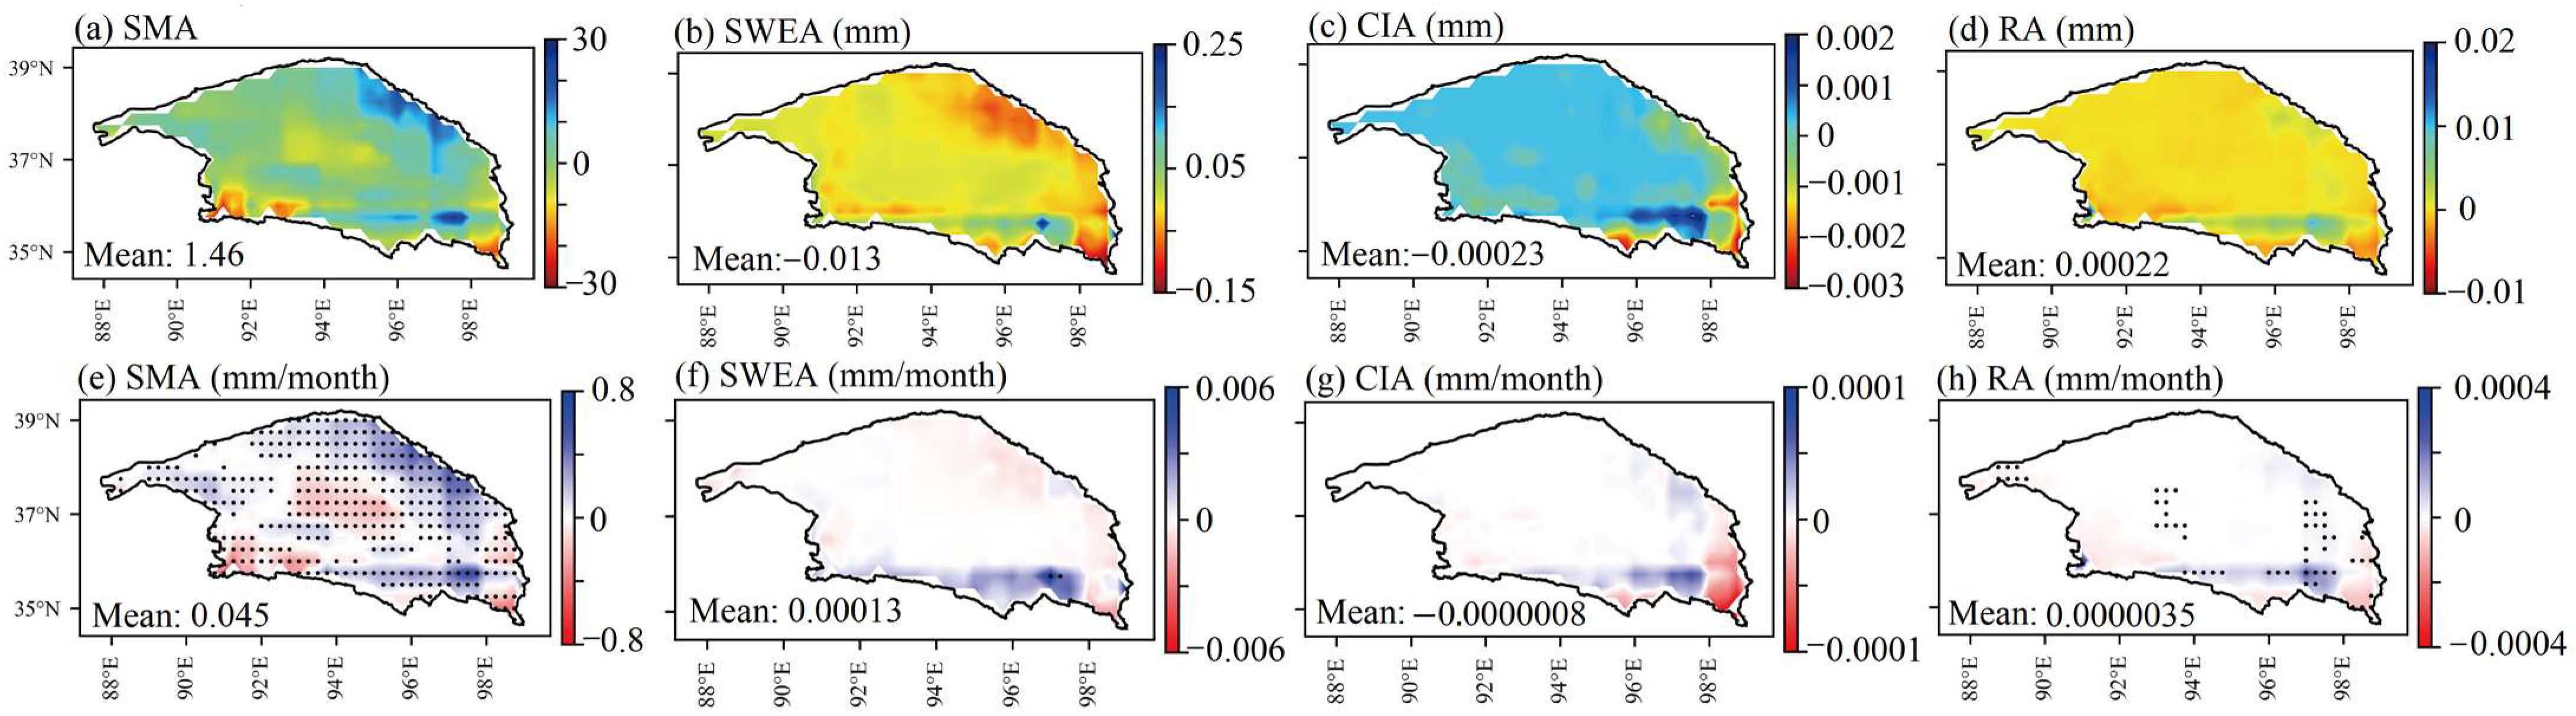
3.2. Variations of Individual Water Storage Components
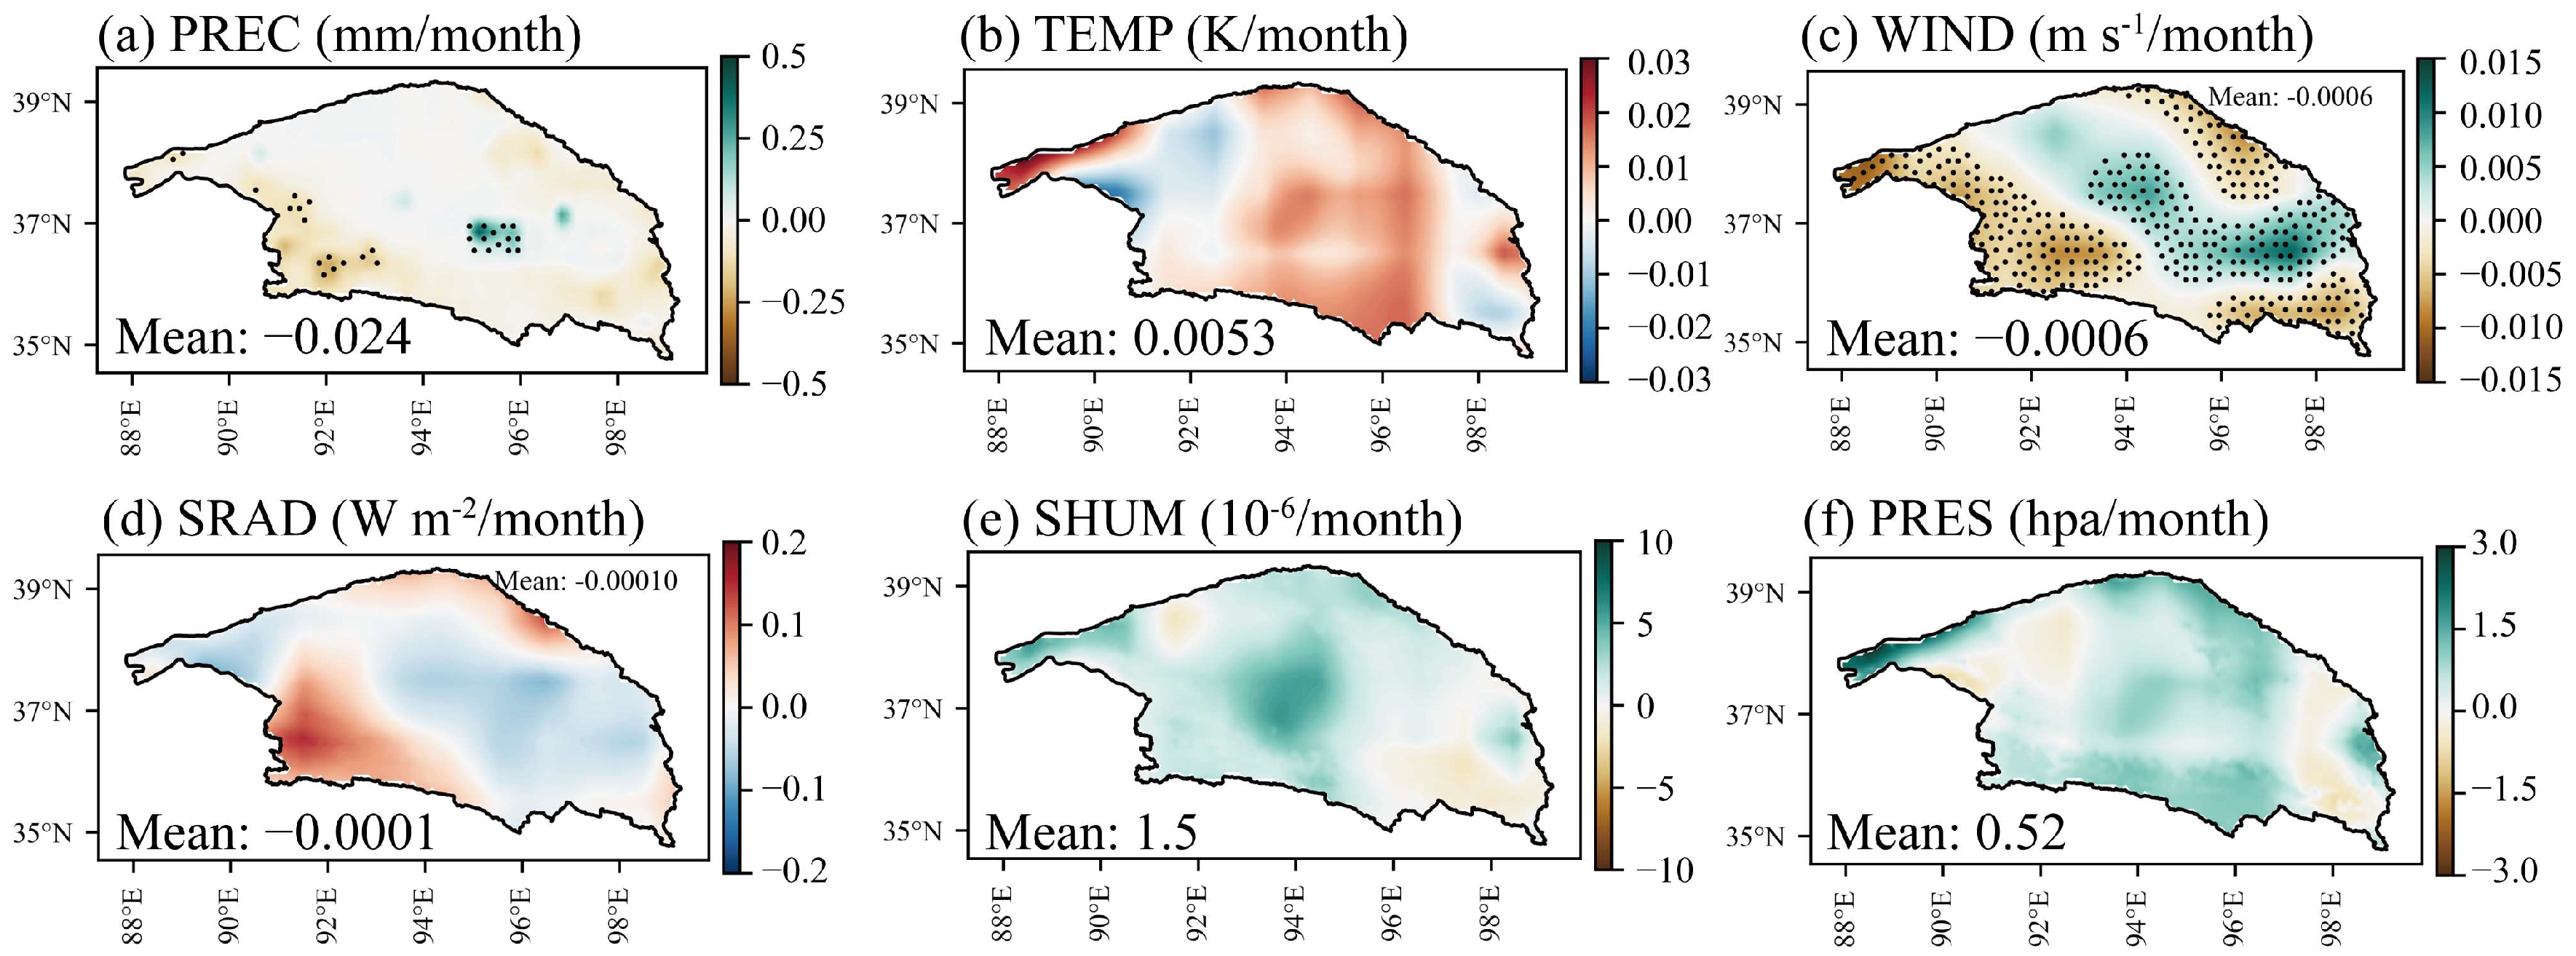
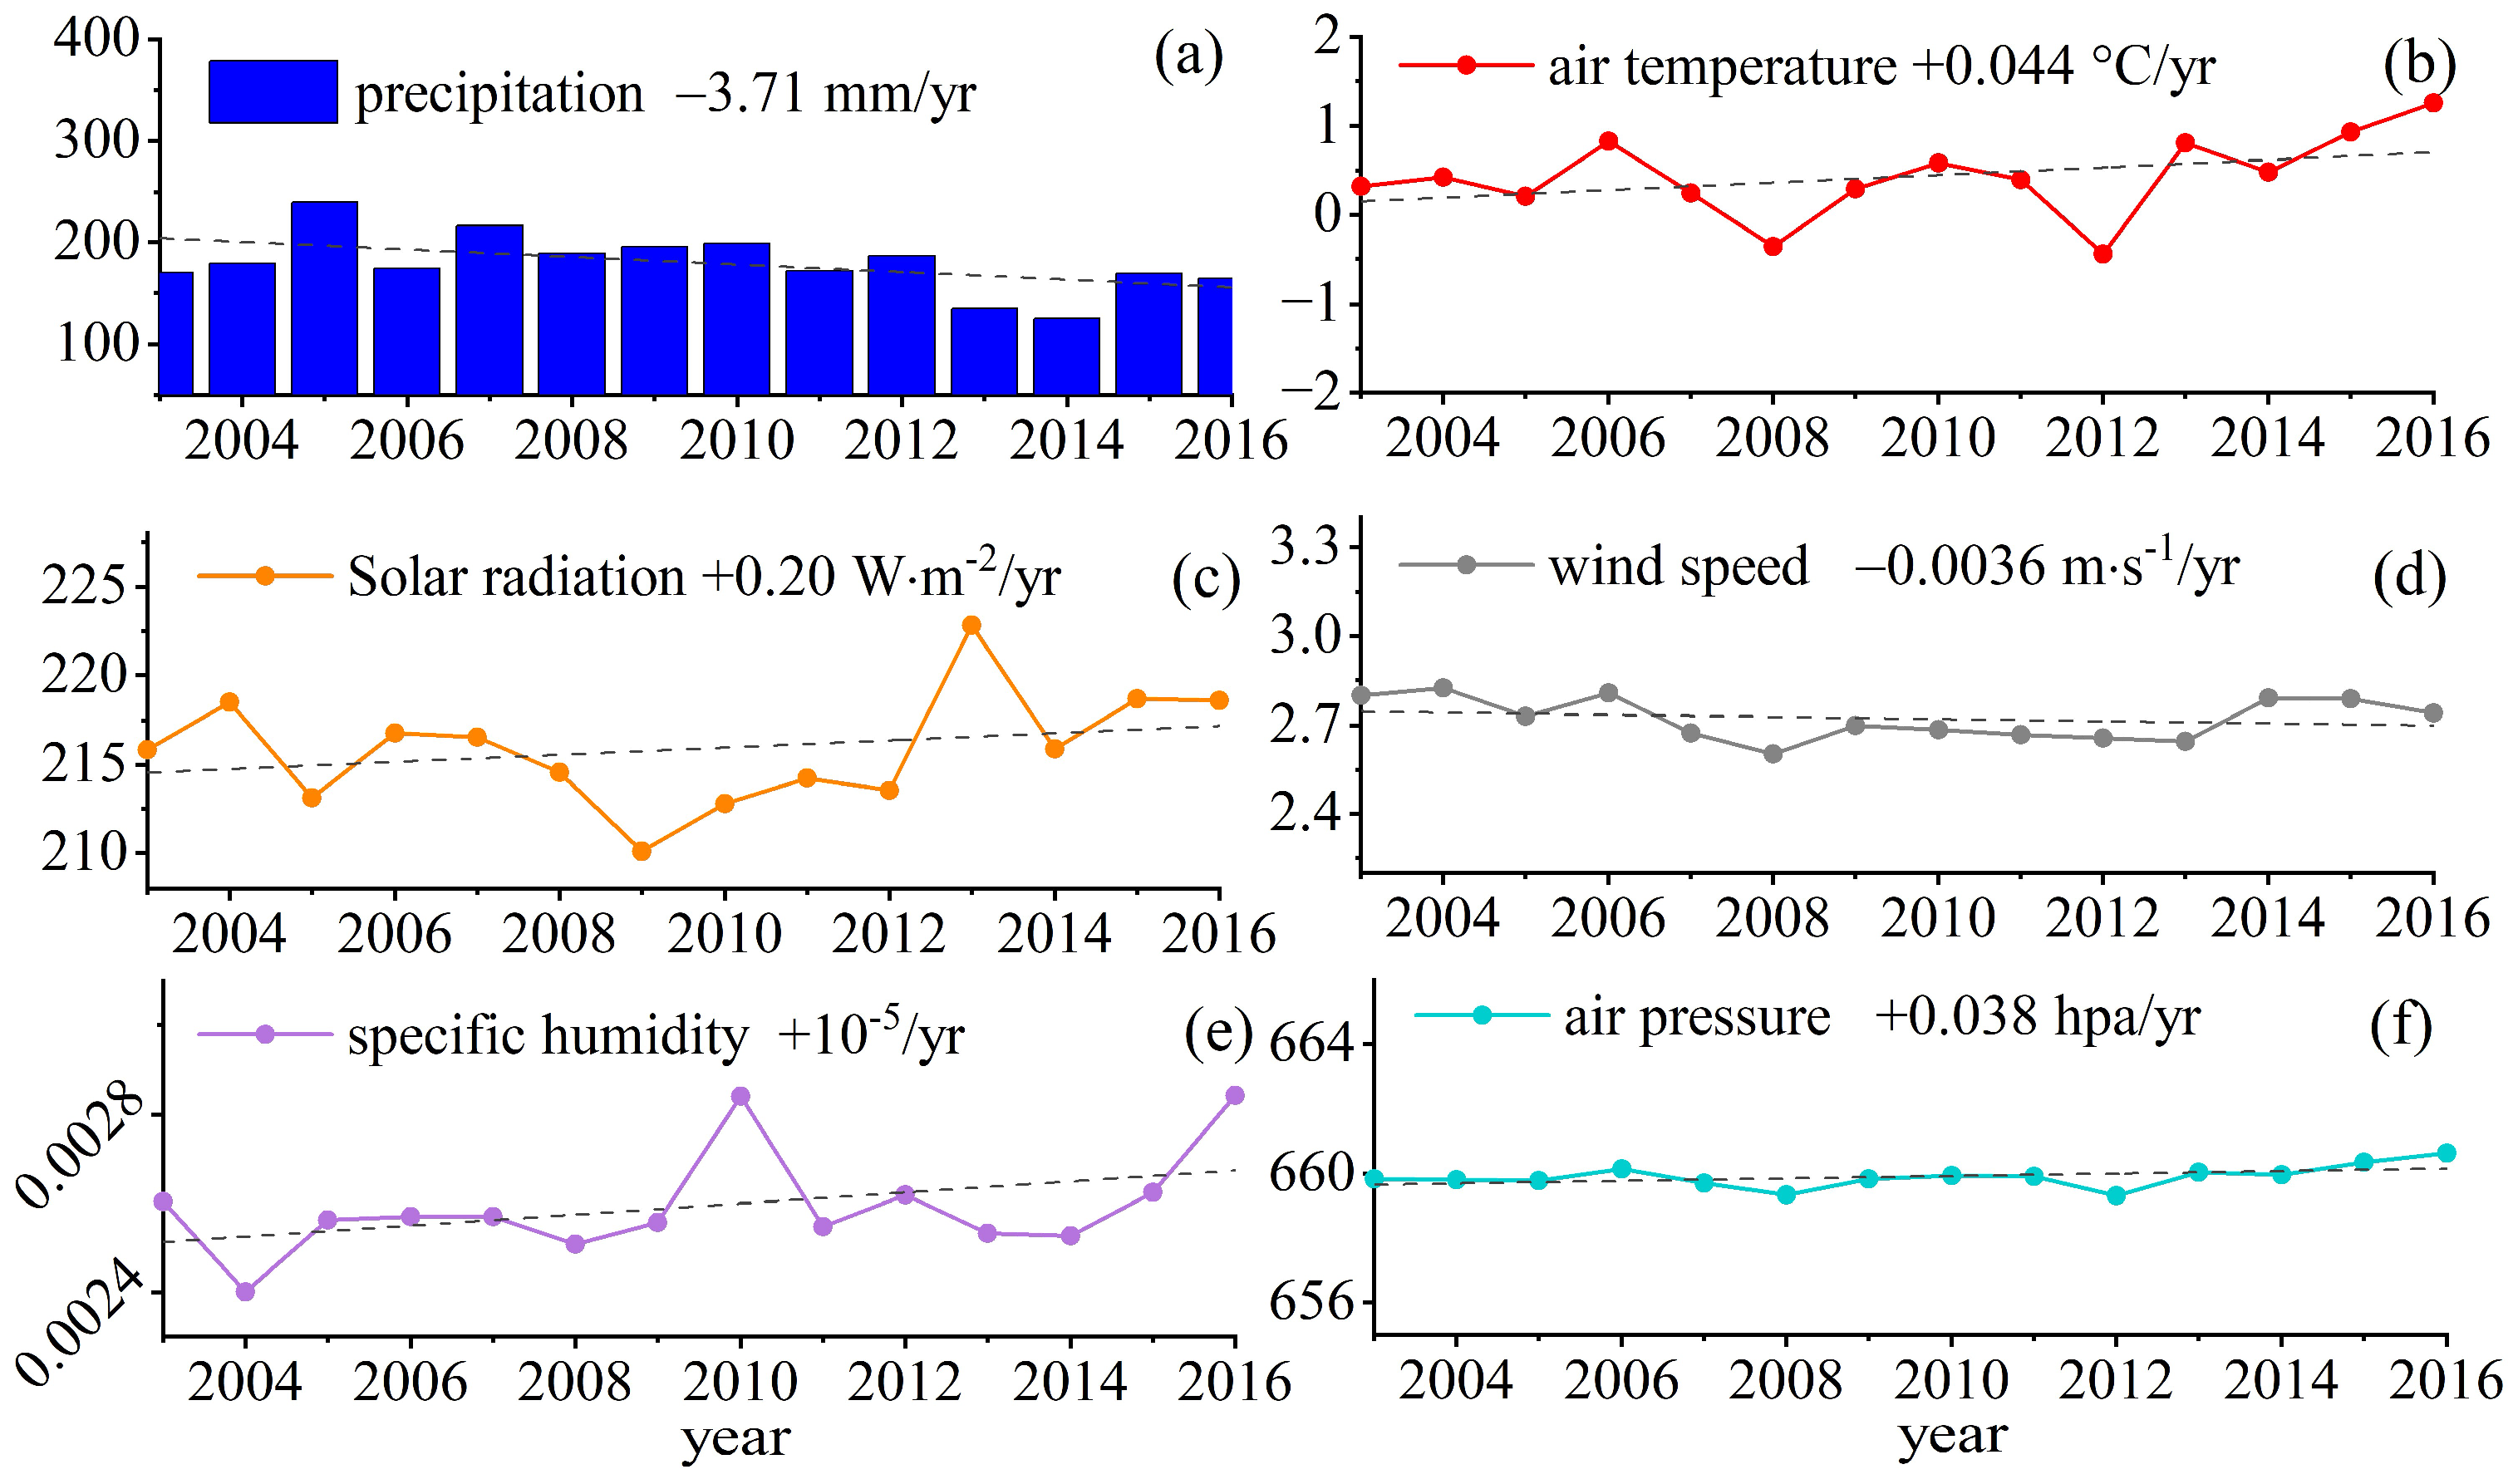
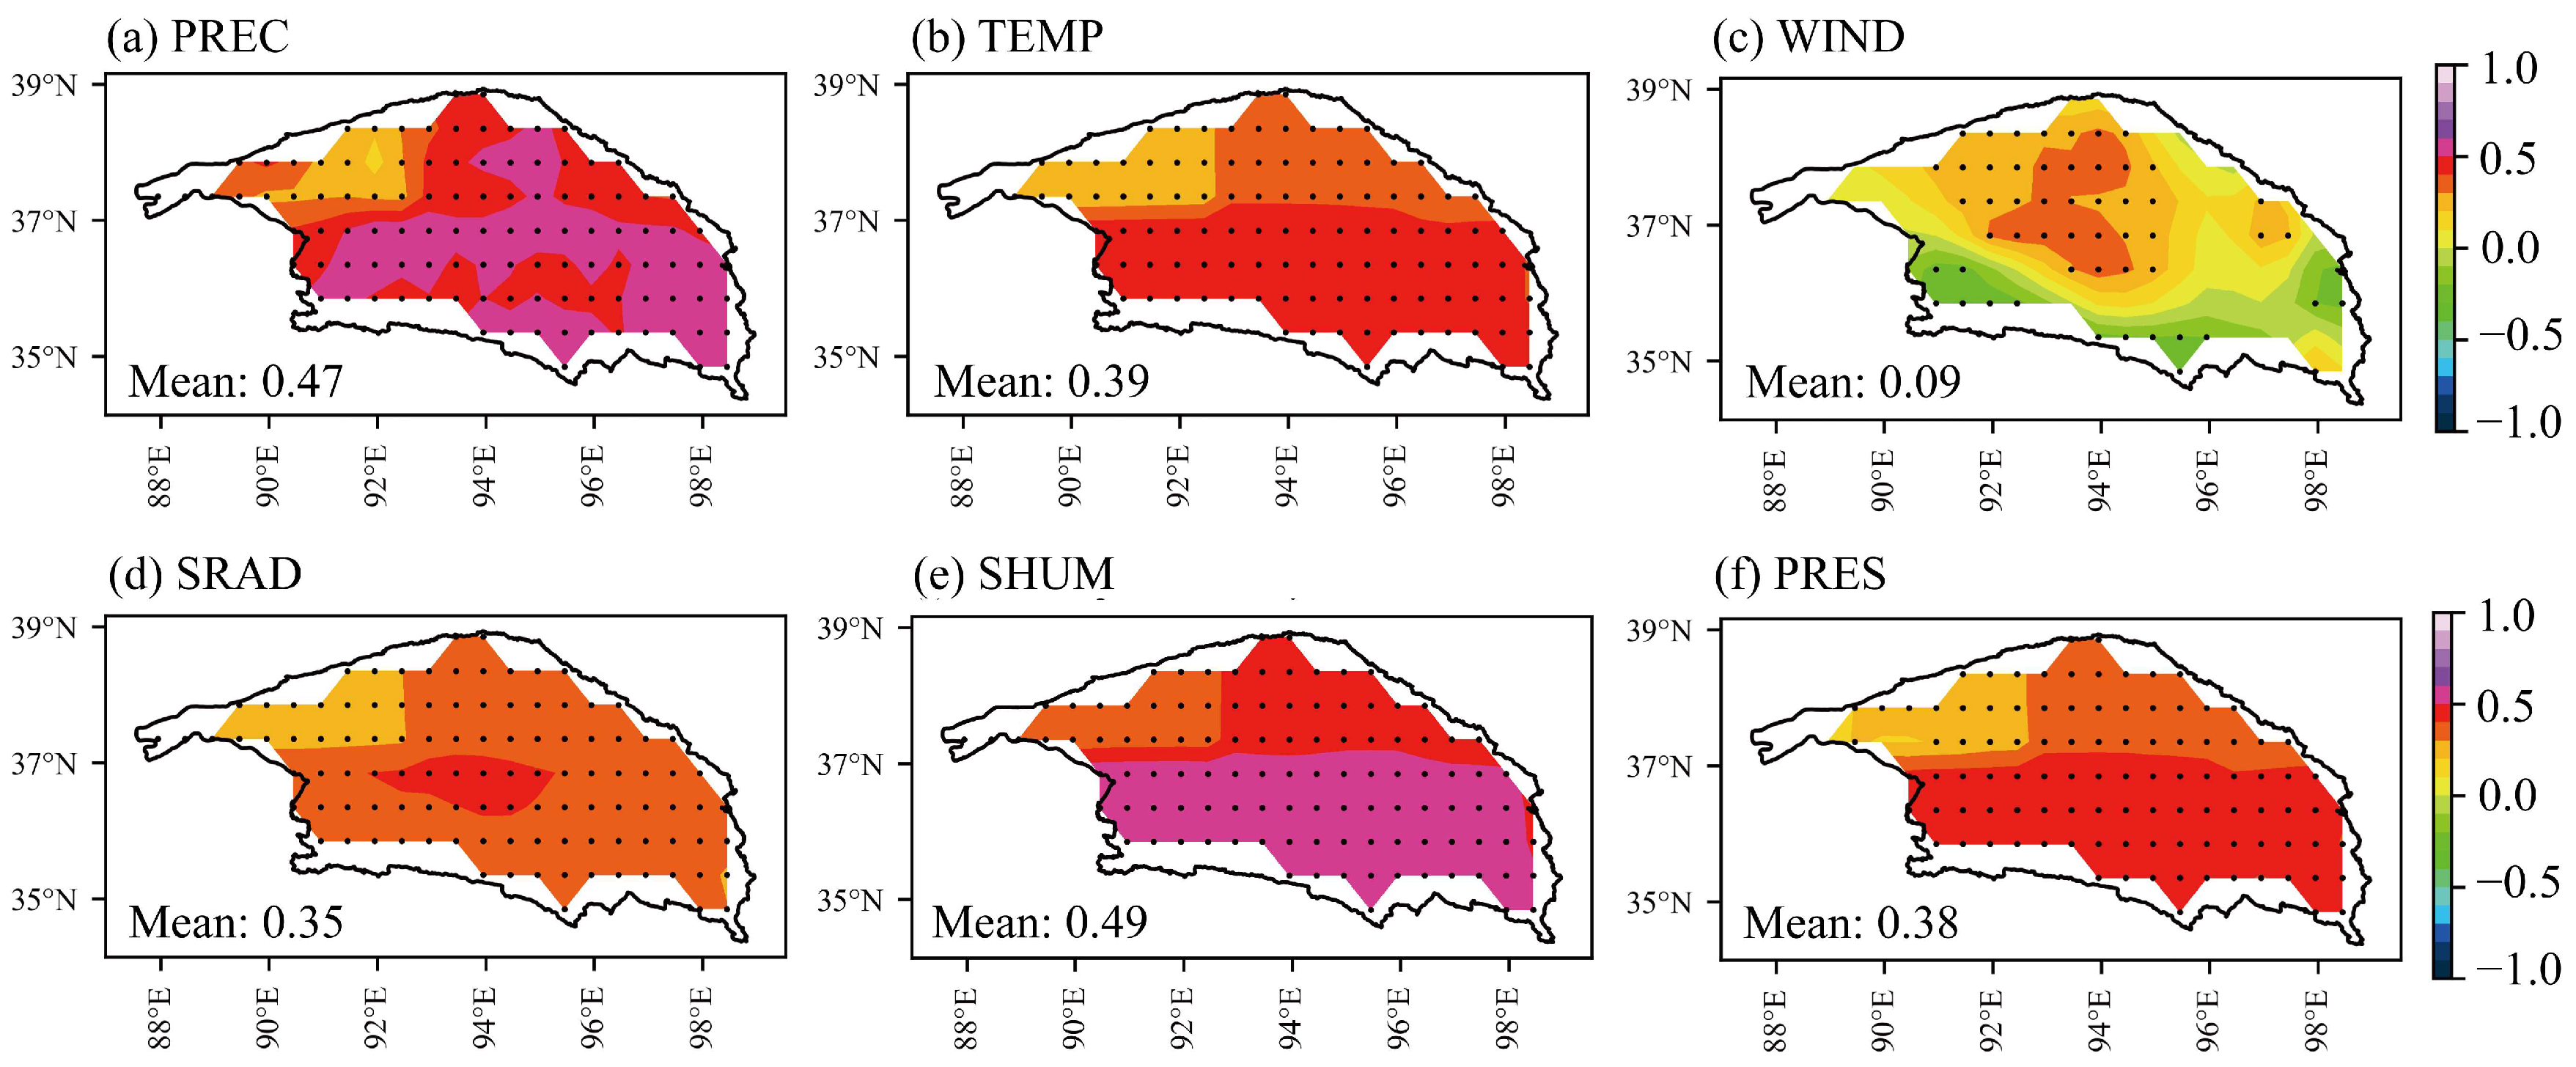
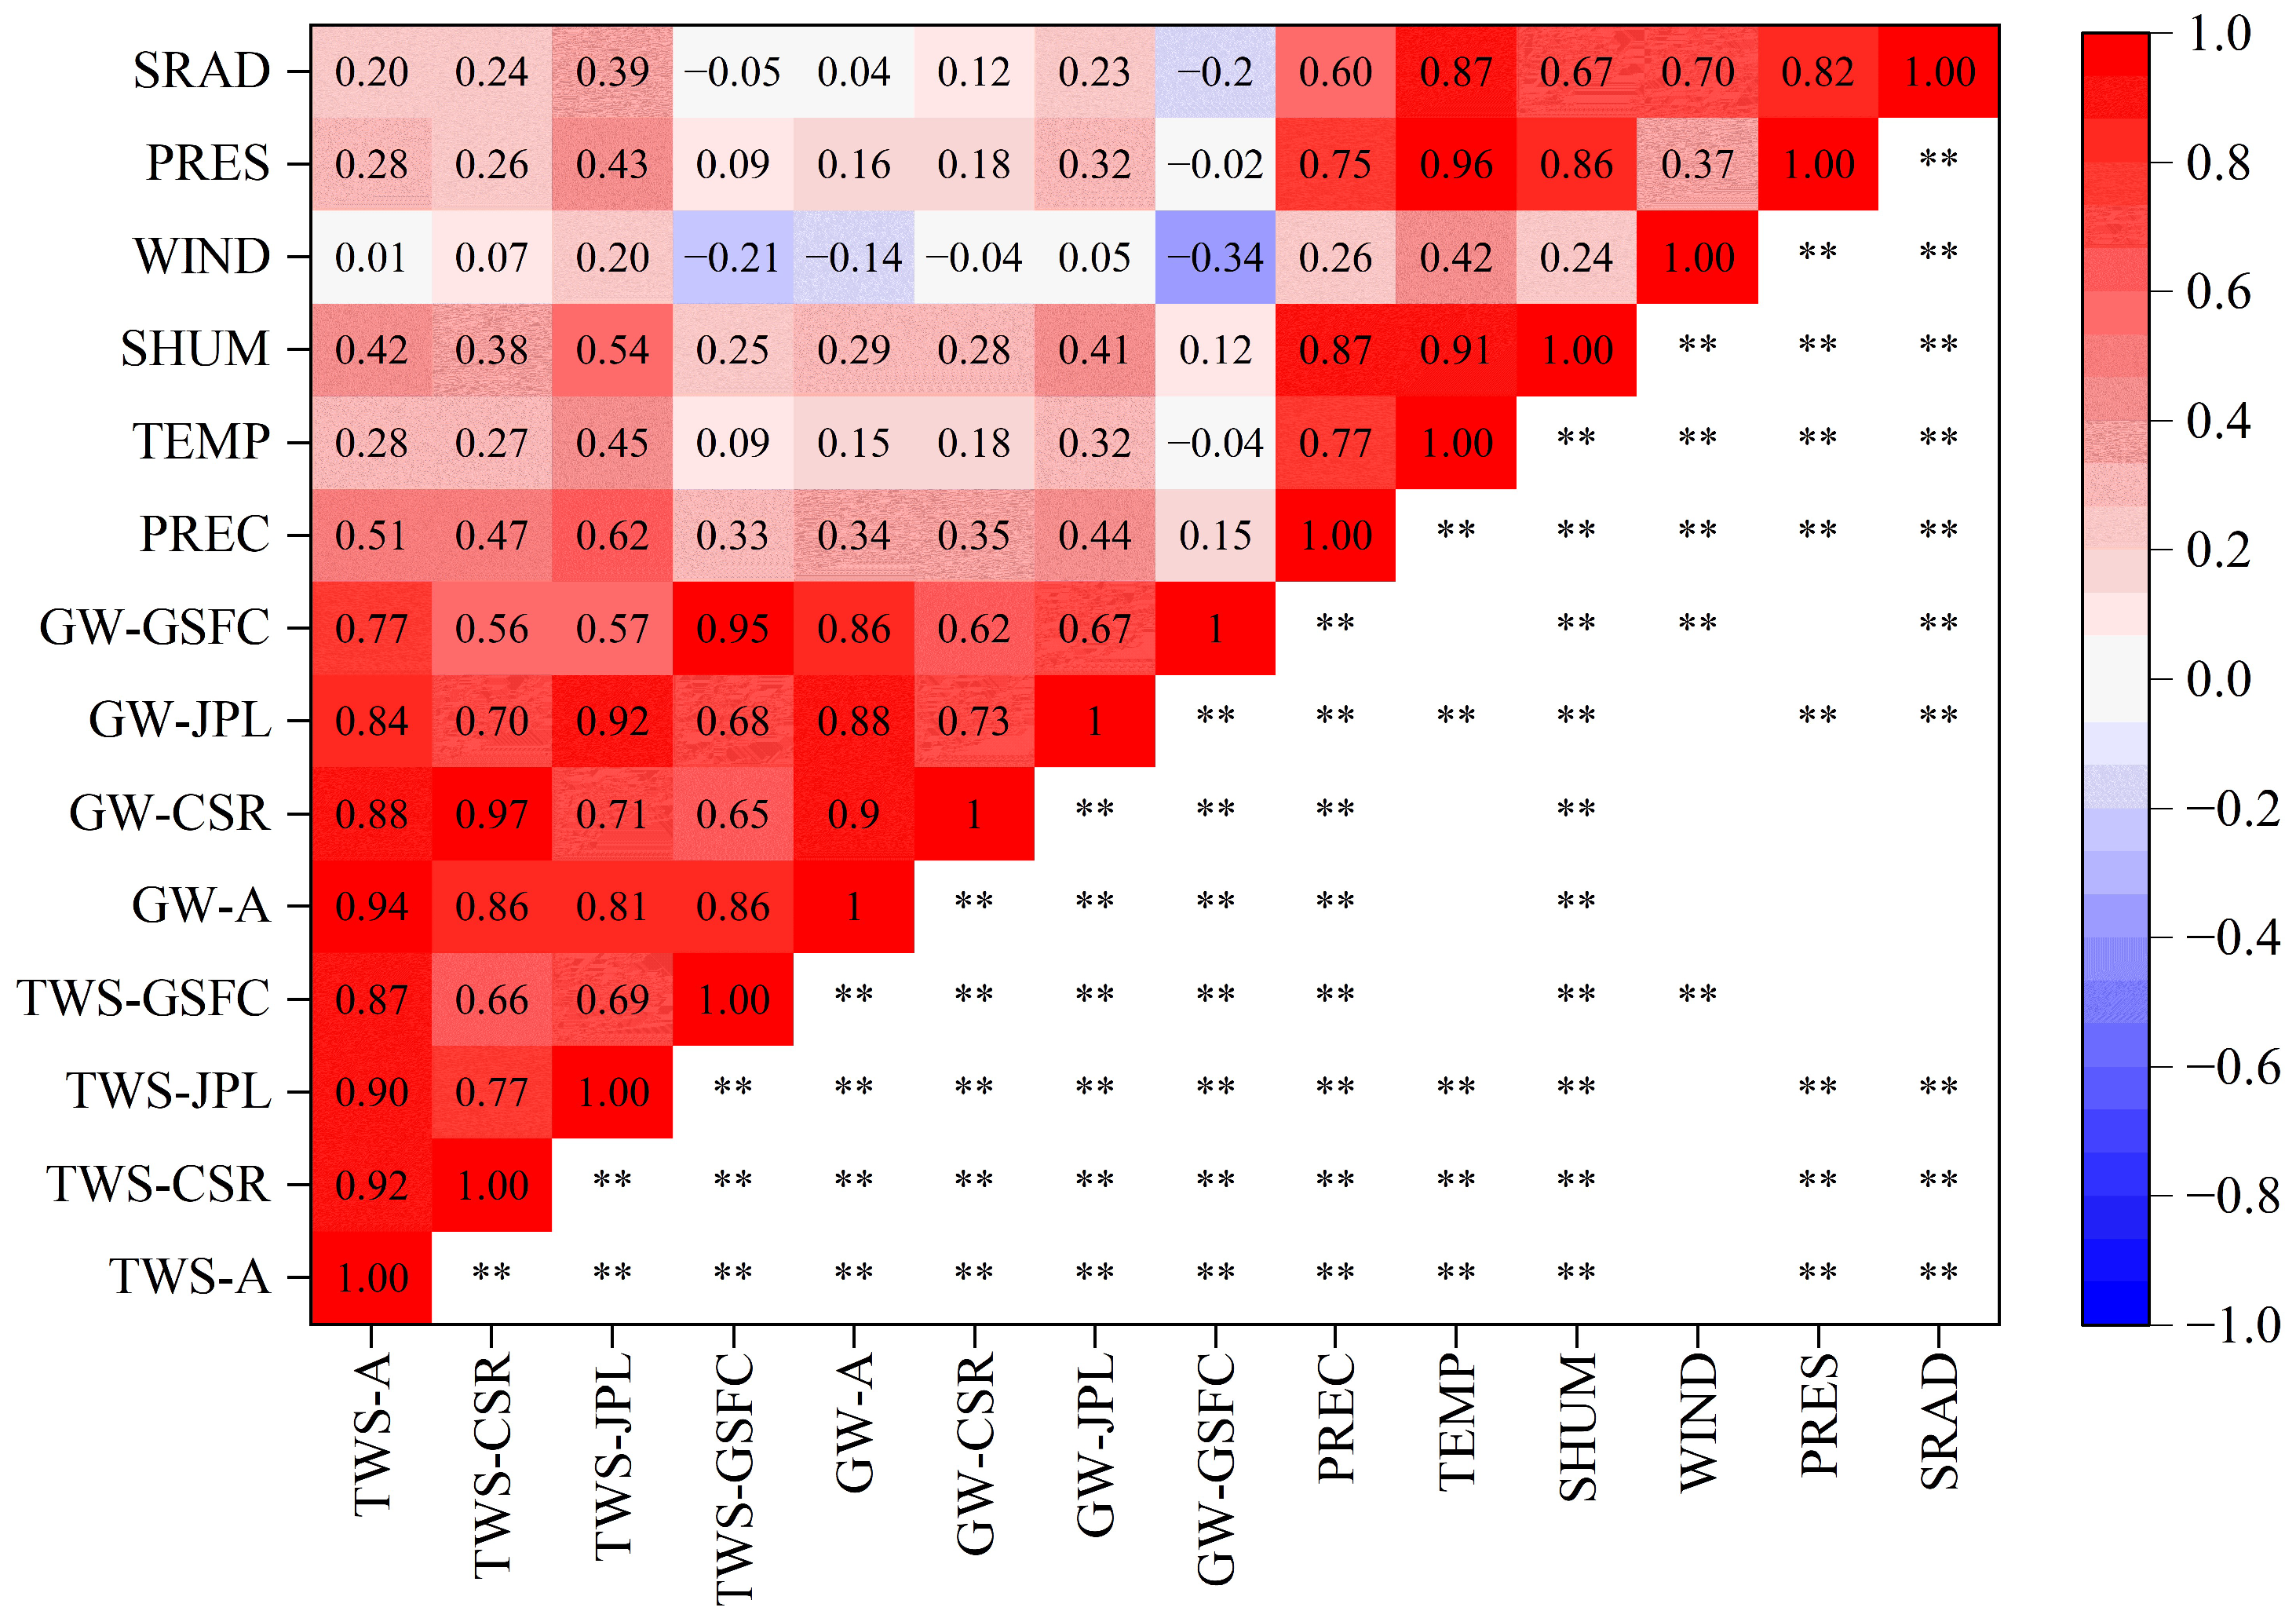
3.3. The Impact of the Meteorological Elements on TWSAs and GWAs
4. Discussion
4.1. Uncertainties and Implications
4.2. The Impact of Human Activities
4.3. Limitations
5. Conclusions
Author Contributions
Funding
Data Availability Statement
Acknowledgments
Conflicts of Interest
References
- Xu, F.; Zhang, G.; Woolway, R.I.; Yang, K.; Wada, Y.; Wang, J.; Crétaux, J. Widespread societal and ecological impacts from projected Tibetan Plateau lake expansion. Nat. Geosci. 2024, 17, 516–523. [Google Scholar] [CrossRef]
- Wang, T.; Zhao, Y.; Xu, C.; Ciais, P.; Liu, D.; Yang, H.; Piao, S.; Yao, T. Atmospheric dynamic constraints on Tibetan Plateau freshwater under Paris climate targets. Nat. Clim. Change 2021, 11, 219–225. [Google Scholar] [CrossRef]
- Li, L.; Zhang, R.; Wen, M.; Lv, J. Regionally Different Precipitation Trends Over the Tibetan Plateau in the Warming Context: A Perspective of the Tibetan Plateau Vortices. Geophys. Res. Lett. 2021, 48, e2020GL091680. [Google Scholar] [CrossRef]
- Li, X.; Long, D.; Scanlon, B.R.; Mann, M.E.; Li, X.; Tian, F.; Sun, Z.; Wang, G. Climate change threatens terrestrial water storage over the Tibetan Plateau. Nat. Clim. Change 2022, 12, 801–807. [Google Scholar] [CrossRef]
- Wang, B.; Bao, Q.; Hoskins, B.; Wu, G.; Liu, Y. Tibetan Plateau warming and precipitation changes in East Asia. Geophys. Res. Lett. 2008, 35, L14702. [Google Scholar] [CrossRef]
- Li, L.; Yang, S.; Wang, Z.; Zhu, X.; Tang, H. Evidence of Warming and Wetting Climate over the Qinghai-Tibet Plateau. Arct. Antarct. Alp. Res. 2010, 42, 449–457. [Google Scholar] [CrossRef]
- Bibi, S.; Wang, L.; Li, X.; Zhou, J.; Chen, D.; Yao, T. Climatic and associated cryospheric, biospheric, and hydrological changes on the Tibetan Plateau: A review. Int. J. Climatol. 2018, 38, e1–e17. [Google Scholar] [CrossRef]
- Ehlers, T.A.; Chen, D.; Appel, E.; Bolch, T.; Chen, F.; Diekmann, B.; Dippold, M.A.; Giese, M.; Guggenberger, G.; Lai, H.; et al. Past, present, and future geo-biosphere interactions on the Tibetan Plateau and implications for permafrost. Earth-Sci. Rev. 2022, 234, 104197. [Google Scholar] [CrossRef]
- Wang, Y.; Xie, X.; Shi, J.; Zhu, B.; Jiang, F.; Chen, Y.; Liu, Y. Accelerated Hydrological Cycle on the Tibetan Plateau Evidenced by Ensemble Modeling of Long-term Water Budgets. J. Hydrol. 2022, 615, 128710. [Google Scholar] [CrossRef]
- Wang, J.; Chen, X.; Hu, Q.; Liu, J. Responses of terrestrial water storage to climate variation in the Tibetan Plateau. J. Hydrol. 2020, 584, 124652. [Google Scholar] [CrossRef]
- Yang, N.; Wang, G.; Liao, F.; Dang, X.; Gu, X. Insights into moisture sources and evolution from groundwater isotopes (2H, 18O, and 14C) in Northeastern Qaidam Basin, Northeast Tibetan Plateau, China. Sci. Total Environ. 2023, 864, 160981. [Google Scholar] [CrossRef] [PubMed]
- Bibi, S.; Wang, L.; Li, X.; Zhang, X.; Chen, D. Response of Groundwater Storage and Recharge in the Qaidam Basin (Tibetan Plateau) to Climate Variations from 2002 to 2016. J. Geophys. Res. Atmos. 2019, 124, 9918–9934. [Google Scholar] [CrossRef]
- Wang, Z.; Lei, Y.; Che, H.; Wu, B.; Zhang, X. Aerosol forcing regulating recent decadal change of summer water vapor budget over the Tibetan Plateau. Nat. Commun. 2024, 15, 2233. [Google Scholar] [CrossRef]
- Xu, P.; Yan, D.; Weng, B.; Bian, J.; Wu, C.; Wang, H. Evolution trends and driving factors of groundwater storage, recharge, and discharge in the Qinghai-Tibet Plateau: Study progress and challenges. J. Hydrol. 2024, 631, 130815. [Google Scholar] [CrossRef]
- Bringeland, S.; Fotopoulos, G. Analysis of gap filling techniques for GRACE/GRACE-FO terrestrial water storage anomalies in Canada. J. Hydrol. 2024, 630, 130644. [Google Scholar] [CrossRef]
- Wei, W.; Wang, J.; Wang, X.; Yan, P.; Xie, B.; Zhou, J.; Liu, T.; Lu, D. The response of global terrestrial water storage to drought based on multiple climate scenarios. Atmos. Res. 2024, 303, 107331. [Google Scholar] [CrossRef]
- Zhu, E.; Wang, Y.; Yuan, X. Changes of terrestrial water storage during 1981–2020 over China based on dynamic-machine learning model. J. Hydrol. 2023, 621, 129576. [Google Scholar] [CrossRef]
- Nourani, V.; Paknezhad, N.J.; Ng, A.; Wen, Z.; Dabrowska, D.; Üzelaltınbulat, S. Application of the machine learning methods for GRACE data based groundwater modeling, a systematic review. Groundwater Sust. Dev. 2024, 25, 101113. [Google Scholar] [CrossRef]
- Soltani, S.S.; Ataie-Ashtiani, B.; Simmons, C.T. Review of assimilating GRACE terrestrial water storage data into hydrological models: Advances, challenges and opportunities. Earth-Sci. Rev. 2021, 213, 103487. [Google Scholar] [CrossRef]
- Akl, M.; Thomas, B.F. Challenges in applying water budget framework for estimating groundwater storage changes from GRACE observations. J. Hydrol. 2024, 639, 131600. [Google Scholar] [CrossRef]
- Rodell, M.; Houser, P.R.; Jambor, U.; Gottschalck, J.; Mitchell, K.; Meng, C.J.; Arsenault, K.; Cosgrove, B.; Radakovich, J.; Bosilovich, M.; et al. The Global Land Data Assimilation System; American Meteorological Society: Boston, MA, USA, 2004; Volume 85, pp. 381–394. [Google Scholar]
- Gautam, P.K.; Chandra, S.; Henry, P.K. Monitoring of the Groundwater Level using GRACE with GLDAS Satellite Data in Ganga Plain, India to Understand the Challenges of Groundwater, Depletion, Problems, and Strategies for Mitigation. Environ. Chall. 2024, 15, 100874. [Google Scholar] [CrossRef]
- Nenweli, R.; Watson, A.; Brookfield, A.; Münch, Z.; Chow, R. Is groundwater running out in the Western Cape, South Africa? Evaluating GRACE data to assess groundwater storage during droughts. J. Hydrol. Reg. Stud. 2024, 52, 101699. [Google Scholar] [CrossRef]
- Viviers, C.; van der Laan, M.; Gaffoor, Z.; Dippenaar, M. Downscaling and validating GLDAS groundwater storage anomalies by integrating precipitation for recharge and actual evapotranspiration for discharge. J. Hydrol. Reg. Stud. 2024, 54, 101879. [Google Scholar] [CrossRef]
- Cheng, W.; Feng, Q.; Xi, H.; Yin, X.; Sindikubwabo, C.; Habiyakare, T.; Chen, Y.; Zhao, X. Spatiotemporal variability and controlling factors of groundwater depletion in endorheic basins of Northwest China. J. Environ. Manag. 2023, 344, 118468. [Google Scholar] [CrossRef] [PubMed]
- Meng, F.; Su, F.; Li, Y.; Tong, K. Changes in Terrestrial Water Storage During 2003–2014 and Possible Causes in Tibetan Plateau. J. Geophys. Res. Atmos. 2019, 124, 2909–2931. [Google Scholar] [CrossRef]
- Wei, L.; Jiang, S.; Ren, L.; Tan, H.; Ta, W.; Liu, Y.; Yang, X.; Zhang, L.; Duan, Z. Spatiotemporal changes of terrestrial water storage and possible causes in the closed Qaidam Basin, China using GRACE and GRACE Follow-On data. J. Hydrol. 2021, 598, 126274. [Google Scholar] [CrossRef]
- Save, H.; Bettadpur, S.; Tapley, B.D. High-resolution CSR GRACE RL05 mascons. J. Geophys. Res. Solid. Earth 2016, 121, 7547–7569. [Google Scholar] [CrossRef]
- Wiese, D.N.; Landerer, F.W.; Watkins, M.M. Quantifying and reducing leakage errors in the JPL RL05M GRACE mascon solution. Water Resour. Res. 2016, 52, 7490–7502. [Google Scholar] [CrossRef]
- Loomis, B.D.; Luthcke, S.B.; Sabaka, T.J. Regularization and error characterization of GRACE mascons. J. Geodesy 2019, 93, 1381–1398. [Google Scholar] [CrossRef]
- Zhao, K.; Fang, Z.; Li, J.; He, C. Spatial-temporal variations of groundwater storage in China: A multiscale analysis based on GRACE data. Resour. Conserv. Recycl. 2023, 197, 107088. [Google Scholar] [CrossRef]
- He, J.; Yang, K.; Tang, W.; Lu, H.; Qin, J.; Chen, Y.; Li, X. The first high-resolution meteorological forcing dataset for land process studies over China. Sci. Data 2020, 7, 25. [Google Scholar] [CrossRef] [PubMed]
- Yang, K.; He, J.; Tang, W.; Lu, H.; Qin, J.; Chen, Y.; Li, X. China Meteorological Forcing Dataset (1979–2018). National Tibetan Plateau Data Center: Beijing, China, 2015. [Google Scholar]
- Du, Y.; Wang, D.; Zhu, J.; Lin, Z.; Zhong, Y. Intercomparison of multiple high-resolution precipitation products over China: Climatology and extremes. Atmos. Res. 2022, 278, 106342. [Google Scholar] [CrossRef]
- Zhang, Q.; Jin, J.; Wang, X.; Budy, P.; Barrett, N.; Null, S.E. Improving lake mixing process simulations in the Community Land Model by using K profile parameterization. Hydrol. Earth Syst. Sci. 2019, 23, 4969–4982. [Google Scholar] [CrossRef]
- Zou, Y.; Kuang, X.; Feng, Y.; Jiao, J.J.; Liu, J.; Wang, C.; Fan, L.; Wang, Q.; Chen, J.; Ji, F.; et al. Solid Water Melt Dominates the Increase of Total Groundwater Storage in the Tibetan Plateau. Geophys. Res. Lett. 2022, 49, e2022GL100092. [Google Scholar] [CrossRef]
- Xiao, Y.; Liu, K.; Zhang, Y.; Yang, H.; Wang, S.; Qi, Z.; Hao, Q.; Wang, L.; Luo, Y.; Yin, S. Numerical investigation of groundwater flow systems and their evolution due to climate change in the arid Golmud river watershed on the Tibetan Plateau. Front. Earth Sci. 2022, 10, 943075. [Google Scholar] [CrossRef]
- Dang, X.; Gu, X.; Chang, L. Prevention and Cure Countermeasures on Groundwater Table Rising Disaster in the Qaidam Basin. J. Chongqing Jiaotong Univ. (Nat. Sci.) 2023, 42, 64–69, (In Chinese abstract). [Google Scholar]
- Ferreira, V.; Yong, B.; Montecino, H.; Ndehedehe, C.E.; Seitz, K.; Kutterer, H.; Yang, K. Estimating GRACE terrestrial water storage anomaly using an improved point mass solution. Sci. Data 2023, 10, 234. [Google Scholar] [CrossRef] [PubMed]
- Forootan, E.; Mehrnegar, N.; Schumacher, M.; Schiettekatte, L.A.R.; Jagdhuber, T.; Farzaneh, S.; van Dijk, A.I.J.M.; Shamsudduha, M.; Shum, C.K. Global groundwater droughts are more severe than they appear in hydrological models: An investigation through a Bayesian merging of GRACE and GRACE-FO data with a water balance model. Sci. Total Environ. 2024, 912, 169476. [Google Scholar] [CrossRef]
- Raju, A.; Singh, R.P.; Kannojiya, P.K.; Patel, A.; Singh, S.; Sinha, M. Declining groundwater and its impacts along Ganga riverfronts using combined Sentinel-1, GRACE, water levels, and rainfall data. Sci. Total Environ. 2024, 920, 170932. [Google Scholar] [CrossRef]
- Song, X.; Chen, H.; Chen, T.; Qin, Z.; Chen, S.; Yang, N.; Deng, S. GRACE-based groundwater drought in the Indochina Peninsula during 1979–2020: Changing properties and possible teleconnection mechanisms. Sci. Total Environ. 2024, 908, 168423. [Google Scholar] [CrossRef]
- Bao, J.; Wu, Y.; Huang, X.; Peng, Q.; Yuan, Y.; Li, T.; Tao, Y.; Wang, T.; Zhang, P.; Nzabarinda, V.; et al. Changes in Surface and Terrestrial Waters in the China–Pakistan Economic Corridor Due to Climate Change and Human Activities. Remote Sens. 2024, 16, 1437. [Google Scholar] [CrossRef]
- Liu, B.; Zou, X.; Yi, S.; Sneeuw, N.; Cai, J.; Li, J. Identifying and separating climate- and human-driven water storage anomalies using GRACE satellite data. Remote Sens. Environ. 2021, 263, 112559. [Google Scholar] [CrossRef]
- Wang, L.; Zhu, M.; Zhong, Y.; Sun, J.; Peng, Z. Impacts of artificial dams on terrestrial water storage changes and the Earth’s elastic load response during 1950–2016: A case study of medium and large reservoirs in Chinese mainland. Geod. Geodyn. 2024, 15, 252–263. [Google Scholar] [CrossRef]
- Yang, X.; Wang, N.; Chen, A.; Li, Z.; Liang, Q.; Zhang, Y. Impacts of Climate Change, Glacier Mass Loss and Human Activities on Spatiotemporal Variations in Terrestrial Water Storage of the Qaidam Basin, China. Remote Sens. 2022, 14, 2186. [Google Scholar] [CrossRef]
- Yao, T.; Bolch, T.; Chen, D.; Gao, J.; Immerzeel, W.; Piao, S.; Su, F.; Thompson, L.; Wada, Y.; Wang, L.; et al. The imbalance of the Asian water tower. Nat. Rev. Earth Environ. 2022, 3, 618–632. [Google Scholar] [CrossRef]


| Number | Station | Code | Latitude (°N) | Longitude (°E) | Altitude (m) |
|---|---|---|---|---|---|
| 1 | Dachaidan | 52713 | 37.85 | 95.35 | 3173.20 |
| 2 | Delingha | 52737 | 37.37 | 97.38 | 2981.50 |
| 3 | Dulan | 52836 | 36.30 | 98.10 | 3189.00 |
| 4 | Golmud | 52818 | 36.42 | 94.92 | 2807.60 |
| 5 | Lenghu | 52602 | 38.75 | 93.33 | 2770.00 |
| 6 | Nuomuhong | 52825 | 36.43 | 96.43 | 2790.40 |
| 7 | Xiaozaohuo | 52707 | 36.80 | 93.68 | 2767.00 |
| Data | Range (mm) | Mean (mm) | Trend (mm/month) | ||||
|---|---|---|---|---|---|---|---|
| P1 | P2 | P1 | P2 | P1 | P2 | ||
| Original | CSR | –51.63~99.69 | 49.74~156.41 | 10.46 ± 2.06 | 90.95 ± 2.82 | 0.31 ** | –0.43 |
| JPL | –64.14~97.43 | 67.63~133.40 | 13.89 ± 2.35 | 97.83 ± 1.85 | 0.45 ** | –0.48 | |
| GSFC | –53.87~99.21 | 96.66~175.20 | 25.76 ± 3.27 | 146.07 ± 1.78 | 0.74 ** | 0.16 | |
| Average | –50.94~98.78 | 77.66~146.27 | 16.70 ± 2.45 | 111.62 ± 1.70 | 0.50 ± 0.13 ** | –0.25 ± 0.21 | |
| Interpolation | CSR | –51.63~99.69 | 49.74~156.41 | 11.65 ± 1.95 | 90.66 ± 2.77 | 0.30 ** | –0.38 |
| JPL | –64.14~97.43 | 67.63~133.40 | 15.39 ± 2.24 | 97.83 ± 1.81 | 0.45 ** | –0.45 | |
| GSFC | –53.87~99.21 | 96.66~175.20 | 28.99 ± 3.17 | 145.36 ± 1.80 | 0.74 ** | 0.20 | |
| Average | –50.94~98.78 | 77.66~146.27 | 18.68 ± 2.34 | 111.28 ± 1.68 | 0.50 ± 0.13 ** | –0.21 ± 0.21 | |
Disclaimer/Publisher’s Note: The statements, opinions and data contained in all publications are solely those of the individual author(s) and contributor(s) and not of MDPI and/or the editor(s). MDPI and/or the editor(s) disclaim responsibility for any injury to people or property resulting from any ideas, methods, instructions or products referred to in the content. |
© 2025 by the authors. Licensee MDPI, Basel, Switzerland. This article is an open access article distributed under the terms and conditions of the Creative Commons Attribution (CC BY) license (https://creativecommons.org/licenses/by/4.0/).
Share and Cite
Chang, L.; Zhang, Q.; Gu, X.; Duan, R.; Wang, Q.; You, X. Responses of Terrestrial Water Storage to Climate Change in the Closed Alpine Qaidam Basin. Hydrology 2025, 12, 105. https://doi.org/10.3390/hydrology12050105
Chang L, Zhang Q, Gu X, Duan R, Wang Q, You X. Responses of Terrestrial Water Storage to Climate Change in the Closed Alpine Qaidam Basin. Hydrology. 2025; 12(5):105. https://doi.org/10.3390/hydrology12050105
Chicago/Turabian StyleChang, Liang, Qunhui Zhang, Xiaofan Gu, Rui Duan, Qian Wang, and Xiangzhi You. 2025. "Responses of Terrestrial Water Storage to Climate Change in the Closed Alpine Qaidam Basin" Hydrology 12, no. 5: 105. https://doi.org/10.3390/hydrology12050105
APA StyleChang, L., Zhang, Q., Gu, X., Duan, R., Wang, Q., & You, X. (2025). Responses of Terrestrial Water Storage to Climate Change in the Closed Alpine Qaidam Basin. Hydrology, 12(5), 105. https://doi.org/10.3390/hydrology12050105