Article

Identification and Temporal Distribution of Typical Rainfall Types Based on K-Means++ Clustering and Probability Distribution Analysis

1
School of Marine Engineering Equipment, Zhejiang Ocean University, Zhoushan 316022, China
2
School of Hydraulic Engineering, Zhejiang University of Water Resources and Electric Power, Hangzhou 310018, China
*
Author to whom correspondence should be addressed.
Hydrology 2025, 12(4), 88; https://doi.org/10.3390/hydrology12040088
Submission received: 14 March 2025 / Revised: 9 April 2025 / Accepted: 11 April 2025 / Published: 14 April 2025

Abstract

Characterizing rainfall events with recurrence periods of 1–5 years is crucial for urban flood risk assessment and water management system design. Traditional hydrological frequency analysis methods inadequately describe the temporal structure and intensity distribution of rainfall. In this study, we analyzed 1580 independent rainfall events in central Hangzhou (1950–2023) using PCA dimension reduction and K-means++ clustering to investigate typical rainfall types across different recurrence periods. The integrated approach effectively captures temporal characteristics while reducing dimensionality and improving clustering efficiency. Our results indicate that concentrated single-peak rainfall with short duration and a mid-to-late peak dominates the region, with longer recurrence periods exhibiting higher intensity, shorter duration, and greater temporal concentration. Furthermore, cumulative distribution function (CDF) and probability density function (PDF) analyses were conducted on these typical rainfall types, quantifying their distributional characteristics and yielding precise mathematical expressions. These standardized rainfall curves provide direct applications for engineering design and hydrological modeling, enabling more accurate flood prediction and mitigation strategies for Hangzhou’s urban infrastructure.

1. Introduction

The efficacy of regional flood control and watershed hydrology are directly influenced by the temporal and spatial distribution of rainfall events [1]. The analysis of rainfall processes includes the temporal distribution and peak features of rainfall in addition to the overall intensity and amount of rainfall [2,3]. With global climate change intensifying extreme rainfall events, precise characterization of temporal rainfall distribution has become increasingly critical [3,4,5]. While long-duration rainfall significantly impacts soil water balance and resource distribution, short-duration heavy precipitation poses greater threats to urban areas experiencing rapid development [5,6,7,8]. Therefore, in order to improve flood risk assessment, optimize integrated stormwater management systems, and enhance regional water resource utilization, it is crucial to systematically analyze the temporal structure of rainfall events and quantify their statistical characteristics in association with the recurrence period [8,9,10].
Traditional hydrological frequency analysis methods primarily focus on rainfall amount and duration, failing to adequately characterize temporal structure and intensity distribution [11,12]. Evidence indicates that rainfall peak position, intensity variations, and overall temporal structure significantly influence flood response processes, even with identical cumulative rainfall [13,14]. Early-peak rainfall typically generates faster runoff, while late-peak rainfall may delay flood peaks but produce higher cumulative runoff volumes [15]. Several analytical approaches have been explored to address these limitations. While singular value decomposition [16,17] and Fourier analysis [18,19] have been applied to extract rainfall characteristics, these methods, when used independently, often struggle with the interpretability of physical significance in high-dimensional rainfall data and capturing non-periodic temporal structures, limiting their effectiveness in identifying meaningful rainfall types. Traditional clustering algorithms [20] face challenges with multidimensional rainfall data, and basic K-means methods suffer from initial condition sensitivity and difficulty in determining optimal cluster numbers. The integration of principal component analysis with K-means++ clustering offers promising potential to overcome these limitations yet remains underexplored in rainfall research.
A core element of hydrological frequency analysis is characterizing rainfall based on recurrence periods, which supports the optimization of flood forecasting and urban stormwater management by quantifying rainfall event probability over specific time scales [8,9,10]. An extensive number of studies has examined rainfall temporal distributions across various recurrence periods. Huff [21] established a temporal distribution model for storm events using long-term rainfall records, providing a foundational classification framework for synthesizing rainfall patterns across recurrence periods. Building on this, Pilgrim and Cordery [22] developed a statistically driven framework to systematically quantify the temporal distribution characteristics of rainfall for recurrence periods spanning 1 to 100 years. Willems [23] compared intensity-duration-frequency (IDF) relationships for extreme rainfall across seasons and storm types, revealing spatiotemporal variability in compound rainfall events. This work directly informs adaptive urban stormwater network design under multi-recurrence-period scenarios. Koutsoyiannis et al. [24] proposed a unified mathematical framework to resolve nonlinear IDF relationships for rainfall with return periods of 10 to 100 years, advancing probabilistic modeling of extreme rainfall in flood defense engineering.
China’s flood control planning and engineering design standards emphasize the significance of varied recurrence period rainfall events for urban drainage, flood detention, storage, and water resource utilization, aligning with China’s sponge city construction concept and water conservation policy [10,25]. While many studies focus on extreme rainfall with long recurrence periods (10–100 years) for major flood defense infrastructure [26], there is growing recognition of more frequent rainfall events that regularly impact urban areas [27]. In particular, typical rainfall events with recurrence periods of 1, 2, 3, and 5 years provide vital information for understanding regional rainfall temporal distributions and improving urban stormwater management systems. One -year recurrence period rainfall primarily evaluates urban drainage capacity and water storage potential, while 3- and 5-year periods are frequently utilized in basin flood forecasting and river protection standards [25]. Though longer recurrence periods are crucial for major infrastructure design [28], more frequent events (1–5 years) determine the day-to-day functionality of urban stormwater systems and represent the majority of rainfall conditions in rapidly developing urban areas [29,30].
Despite the recognized importance of rainfall temporal distributions, there remains a notable research gap in effectively capturing the essential characteristics of rainfall temporal structures while maintaining regional specificity for frequent recurrence periods (1–5 years) in rapidly urbanizing Chinese cities like Hangzhou. Previous studies have either focused on extreme events, employed simplified representations that fail to capture the temporal complexity of rainfall processes, or been unable to efficiently reduce dimensionality while preserving critical pattern information. A methodological approach that can simultaneously address dimensionality reduction, pattern recognition, and probability distribution characterization is needed to advance understanding of typical urban rainfall events across different recurrence periods.
To address these issues, this study utilized hourly rainfall data from 1950 to 2023 from ERA5-Land in Hangzhou to extract 1580 independent rainfall events. Using the K-means++ method, rain type clustering analyses were performed to identify the typical temporal distributions of historical rainfall events. This study examines their application value in flood risk assessment and integrated stormwater management by quantifying the hourly distribution characteristics of typical rainfall types based on the analysis of cumulative distribution function (CDF) and probability density function (PDF) for typical rainfall samples with recurrence periods of 1, 2, 3, and 5 years. By focusing on these more frequent recurrence periods rather than extreme events, this study aims to provide practical guidance for managing the rainfall events that most commonly affect urban stormwater management systems, including both drainage and storage components, in alignment with sustainable water resource utilization principles in Hangzhou.

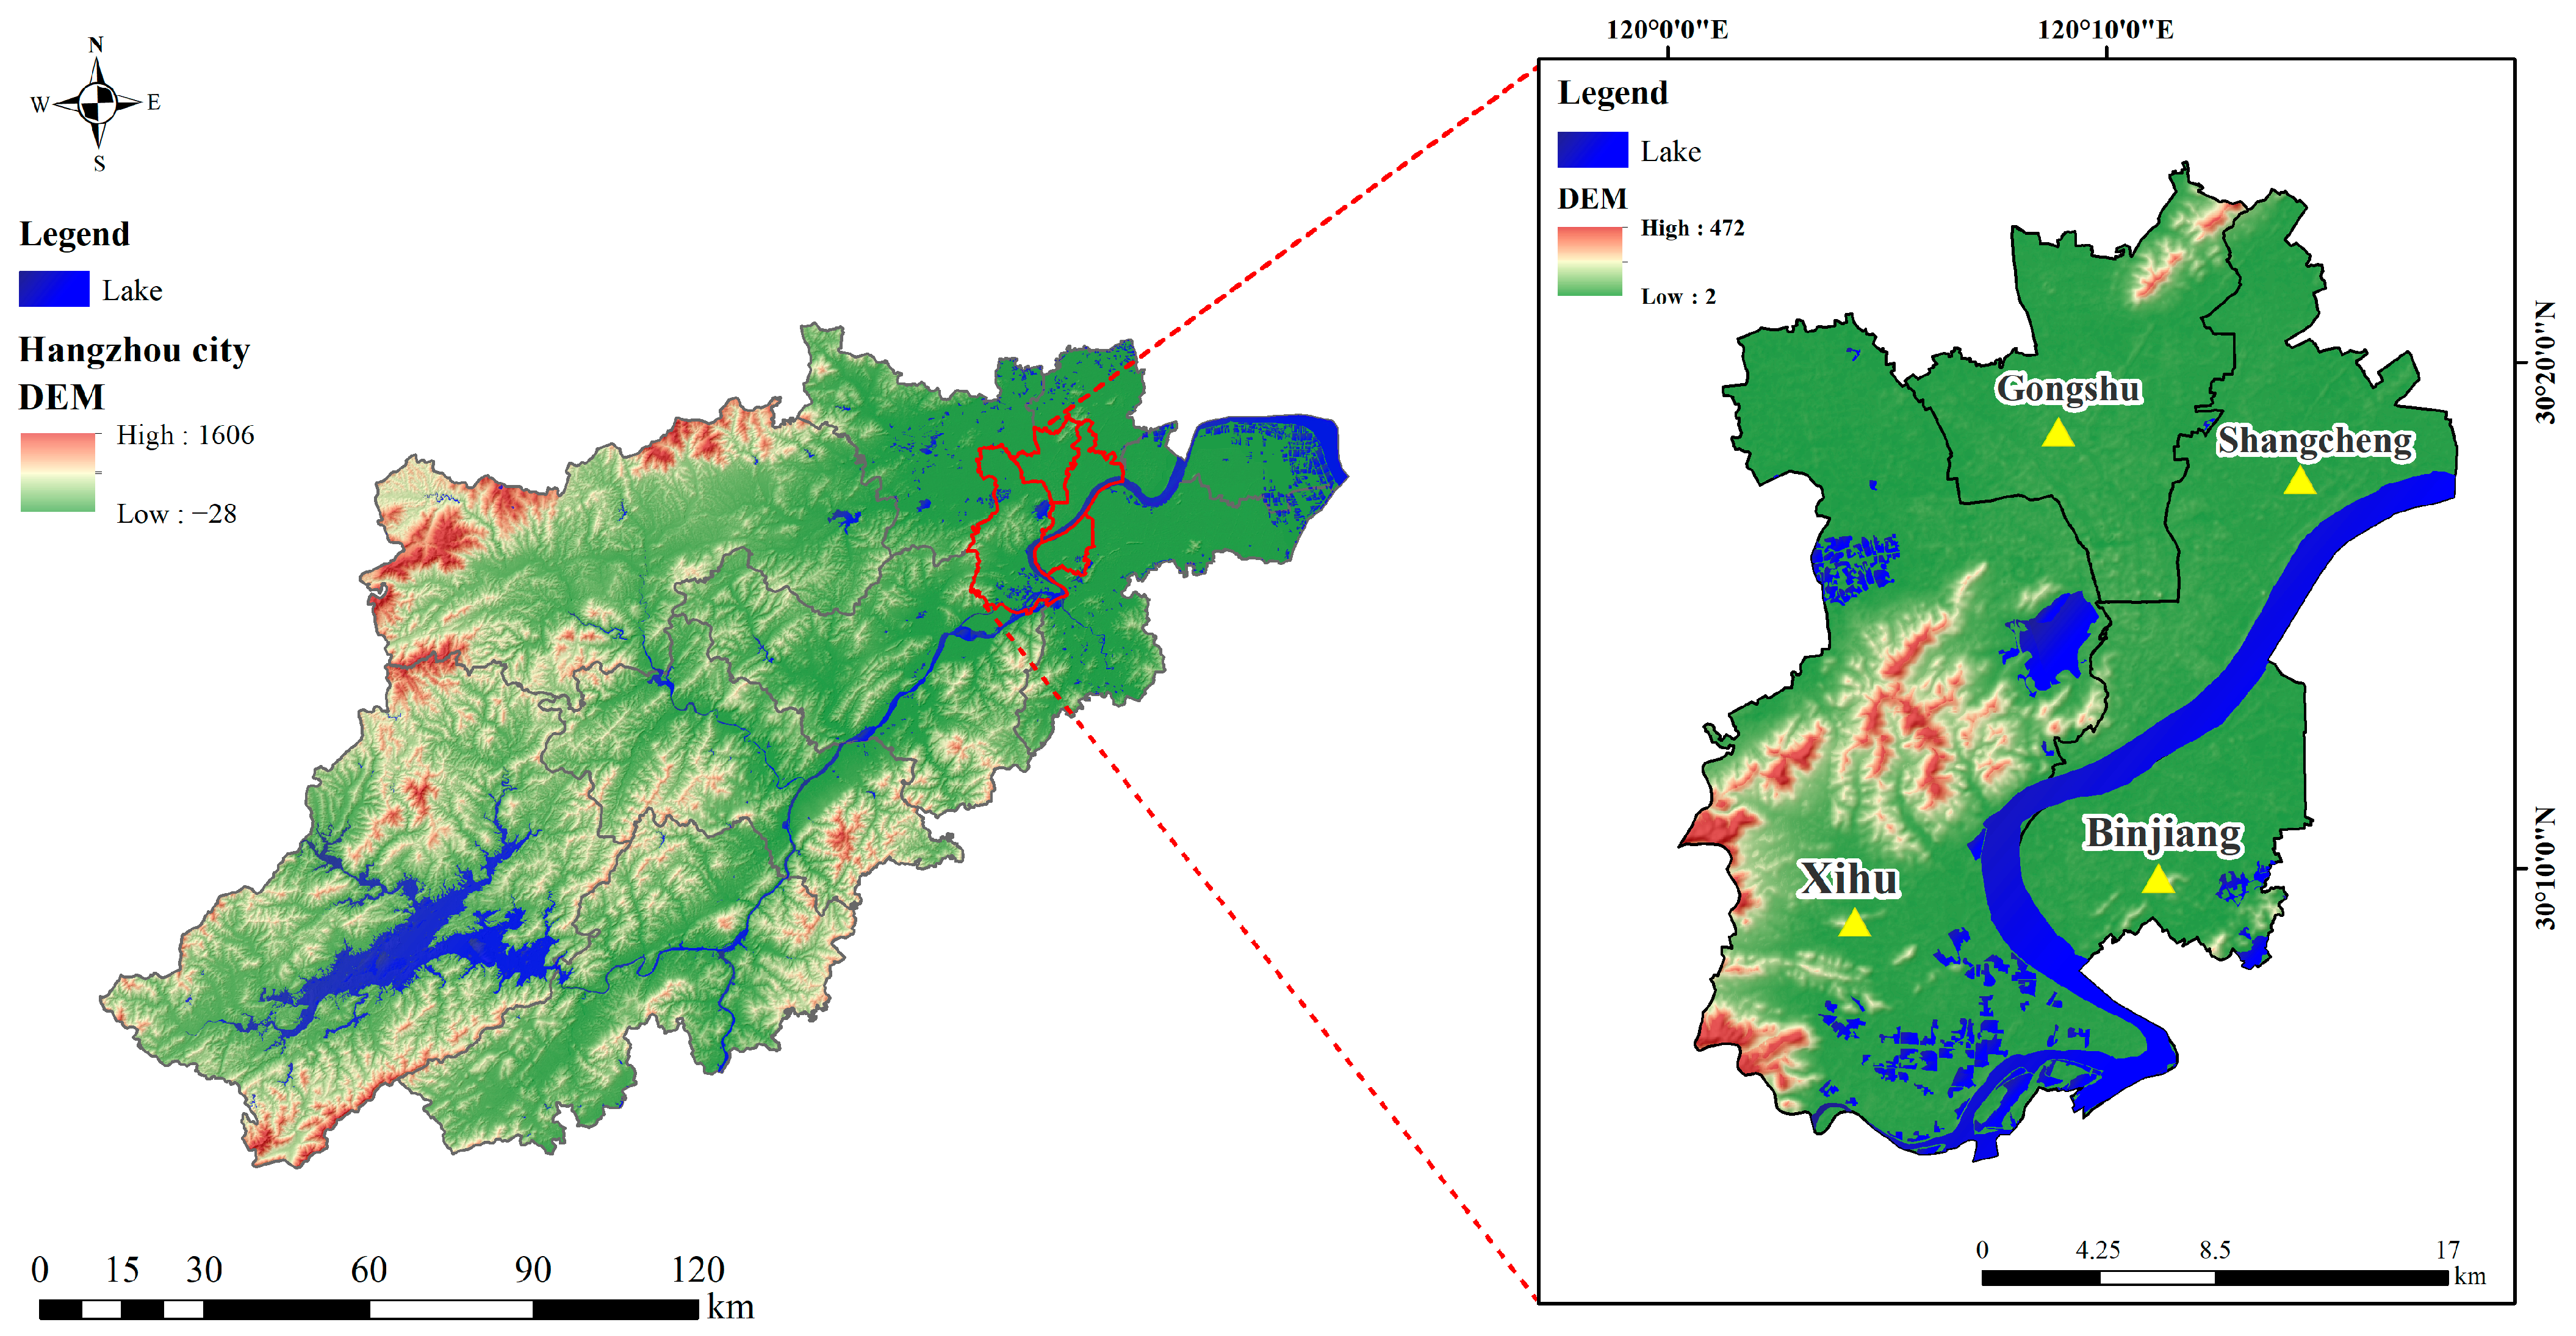
2. Overview of the Study Area and Data

The four main central urban regions of Hangzhou—Xihu District, Shangcheng District, Gongshu District, and Binjiang District—are the subject of this study’s rainfall characteristics (see Figure 1). With high rates of urbanization, high building densities, and a large percentage of impervious surface area, these four urban areas serve as Hangzhou’s administrative, cultural, and economic centers. As such, the effects of rainfall events on integrated urban water management systems and flood risk management are especially noteworthy [31]. At the center of the Yangtze River Delta in China’s eastern coastal region, Hangzhou boasts a humid subtropical monsoon climate that is influenced by the alternating southeastern and southwest monsoons. It also has a clear seasonal precipitation distribution. The rainy season (June–July) and the typhoon influence period (August–September) account for the majority of the region’s 1400–1600 mm of annual precipitation. Short-duration heavy rainfall events have become much more frequent in central Hangzhou in recent years due to the combined effects of global climate change and increasing urbanization. A systematic study of the rainfall pattern and its recurrence periods characteristics in this region is of practical value for improving the level of urban water safety management [9]. Regional water resource scheduling has been seriously challenged by the uneven distribution of precipitation over time and the frequent occurrence of extreme rainfall events.
The European Centre for Medium-Range Weather Forecasts (ECMWF) provided the ERA5-LAND reanalysis dataset that was used in this study. Rainfall, air temperature, wind speed, soil moisture, and other surface meteorological and hydrological data can be downloaded hourly by ERA5-LAND, one of the current global high-resolution reanalysis datasets [32]. Global hydrometeorological studies have made extensive use of this dataset, which is produced by sophisticated numerical weather prediction models using satellite and ground observation data assimilation techniques. It has good geographical and temporal consistency [32,33].
With a spatial resolution of 0.1° × 0.1° (about 10 km × 10 km), the hourly rainfall data of Hangzhou from 1950 to 2023 were used for this study. The data were obtained from the Copernicus Climate Data Repository (CDS) (https://cds.climate.copernicus.eu/), accessed on 31 May 2024. The credibility of the data source in this research is guaranteed by the shown superior simulation capabilities of the ERA5-LAND data for East Asian extreme precipitation events, which can more precisely capture the precipitation intensity and time distribution characteristics [32].

3. Methodology

3.1. Data Pre-Processing Methods

Reanalysis precipitation data are not direct observations; rather, they are precipitation estimation products derived from the assimilation of data from several sources (e.g., satellite remote sensing, radar, ground stations, etc.) and numerical weather prediction models [33]. Because of geography, surface vegetation cover, the sparsity of weather stations, and model parameterization techniques, reanalysis of precipitation data may result in some inaccuracies at local scales [33]. Therefore, to increase the data’s dependability and the accuracy of the analysis’s findings, rigorous quality control and pre-processing were carried out in this study prior to the formal analysis. These pre-processing steps primarily involved outlier detection, missing data imputation, and data smoothing.
This study filters representative samples of typical rainfall processes and classifies independent rainfall events using the following criteria, based on hourly rainfall data of Hangzhou’s four key urban regions from 1950 to 2023:
(1)
Definition of independent rainfall events
To rationally identify individual rainfall events, this study divides continuous rainfall processes into independent rainfall events based on the rainfall interval time threshold [2]. The selection of a 6 h precipitation-free interval, in conjunction with Hangzhou’s precipitation characteristics and previous study findings, can more effectively mitigate the impact of short rainfall intervals and eigenvalues on the classification of rainfall events; that is, two rainfall events are considered independent if there are at least 6 h without precipitation in between [34].
(2)
Establishing a minimum rainfall criterion
This study establishes a minimum precipitation threshold of 2 mm, meaning that rainfall processes below this value are not included in the analysis. This means that the total precipitation of a single rainfall event should not be less than 2 mm. In addition to making sure the study object is a rainfall event with a clear hydrological response, this screening criterion can effectively eliminate trace precipitation (such as light fog and drizzle) and lessen the impact of minor rainfall events on rainfall classification and recurrence period analysis [35].
(3)
Screening of typical rainfall events
1580 samples were acquired following the initial classification of separate precipitation episodes. The bulk of independent rainfall events in the region occurred within 24 h, with only 0.38% of the 1580 individual rainfall occurrences lasting longer than 24 h, according to preliminary statistical analysis of the samples. Urban drainage systems typically respond quickly to short-duration rainfall, while rainfall events lasting less than three hours tend to be insufficient to create a complete rainfall process, and their data may be susceptible to high errors [2]. In order to analyze the temporal characteristics and distribution law of rainfall with different frequencies and to offer data support for flood risk assessment, typical rainfall events lasting 3–24 h and having a recurrence period of 1, 2, 3, and 5 years were chosen for this study. In all, around 300 examples of typical rainfall events covering representative precipitation processes with numerous recurrence periods were found using the aforementioned screening criteria. These samples were then used to classify rainfall patterns and describe time-course features.
This study’s data pre-processing method ensures the physical consistency and spatial and temporal continuity of the data, considers the scientific and rationality of data quality control, rainfall event classification, and screening of representative rainfall processes, and establishes a solid data foundation for the subsequent classification of precipitation types and probability distribution analysis.

3.2. Clustering Algorithm

3.2.1. Principal Component Analysis (PCA)

This study presents principal component analysis (PCA) as a pre-processing step for dimensionality reduction based on the K-means++ algorithm, which is a classical unsupervised linear dimensionality reduction technique that projects the original features (see Table 1) to the new low-dimensional feature space through orthogonal transformation. This effectively reduces the feature dimensionality while preserving the main variation characteristics of the original data [36]. This method aims to solve the problem of “dimensionality catastrophe” in the high-dimensional feature space and increase clustering efficiency. This approach can improve robustness, decrease the multicollinearity problem, and lessen feature redundancy.
The covariance matrix’s eigenvalue decomposition serves as the foundation for PCA’s mathematics. The steps of PCA in conjunction with K-means++ in this rainfall type classification investigation are as follows [36]:
(1)
Create the initial data matrix using the number of eigenvalues (m) and samples (n), which together make up the data matrix X:
X = x 11 x 12 . . . x 1 m x 21 x 22 . . . x 2 m x n 1 x n 2 . . . x n m
(2)
To create a standardization matrix X n o r m , the data were standardized to eliminate dimensional differences.
(3)
Determine the eigenvalues and eigenvectors by solving for the covariance matrix of the normalized data.
(4)
Based on Kaiser’s criterion, the number of principal components was determined with the cumulative contribution rate greater than 90%, and the low-dimensional feature space was constructed.
(5)
The K-means++ algorithm is used for cluster analysis with the dimensionality-reduced principal component features as input.

3.2.2. K-Means++ Cluster Analysis

Cluster analysis, as an unsupervised machine learning method, has been widely used in rainfall event classification studies [38,39,40]. Because of its computational effectiveness, simplicity of usage, and suitability for large-scale datasets, the K-means clustering algorithm is one of the most used among them in meteorological and hydrological research [38,39]. However, the traditional K-means method is sensitive to the selection of the initial clustering center and is prone to fall into local optimal solutions, which affects classification stability. In this work, we used the K-means++ algorithm, which optimizes the selection of the initial clustering centers through probability distributions, increasing clustering accuracy and decreasing the number of iterations, to enhance the convergence and stability of clustering [40]. It has been demonstrated that K-means++ is well suited for the classification of rainfall patterns and the identification of extreme rainfall events [41].
The basic idea behind the K-means++ algorithm, which is an enhancement of the traditional K-means algorithm, is to optimize the ultimate clustering effect by introducing a probability mechanism into the selection of the initial clustering centers. This ensures that the starting centers are as widely distributed as feasible. The algorithm’s steps are as follows [40]:
(1)
Choose a sample point at random to serve as the initial clustering center.
(2)
To ensure that points farther away have a higher chance of being chosen as the next cluster center, find the minimum distance D(x) between all unselected samples and any existing cluster center. Then, choose the next center with probability proportional to D ( x ) 2 (weighted probability selection).
(3)
Repeat step 2 until K initial clustering centers are selected.
(4)
Use the traditional K-means algorithm for iterative optimization until the termination condition is satisfied or the clustering centers converge.
The K-means++ method’s major advantage is that it optimizes the distribution of the initial clustering centers, which results in a more stable final clustering effect. This lowers the K-means algorithm’s sensitivity to the initial point selection and increases clustering efficiency [40].
Finding an appropriate number of clusters (K-value) is key to the K-means++ cluster analysis procedure. While a K-value that is too large could result in the same type of rainfall event being divided into many categories, which would damage the results’ generalizability, a K-value that is too low could cause various rainfall patterns to merge and lessen the classification’s discriminative capability. The ideal K-value to ensure the stability and rationality of rainfall pattern classification was found in this study using the elbow method [40]. In addition to methodically identifying the main types of central Hangzhou’s rainfall types, this study offers a scientific foundation for the categorization and temporal characterization of typical rainfall events during the recurrence period by using the K-means++ algorithm for clustering analysis of historical rainfall events.

3.3. Probability Distribution Analysis Method

For hydrological simulation, flood forecasting, and flood management planning, the temporal distribution of rainfall has a direct impact on surface runoff generation, catchment processes, and flood evolution features [1,12]. According to studies, distinct rainfall time distributions can result in notable variations in flood peaks, peak times, and runoff coefficients, even when the overall amount of rainfall is the same [34]. The rainfall temporal distribution method based on the cumulative distribution function (CDF) and probability density function (PDF) is an important tool for rainfall pattern studies. The PDF shows the distribution characteristics of rainfall intensity over time; the cumulative distribution function can describe the trend of the cumulative probability of the rainfall process, and the combination of the two can fully characterize the model of temporal evolution of rainfall events [42]. To better comprehend the dynamic evolution law of the rainfall process and quantitatively characterize the temporal distribution of various rainfall types, the PDF is derived in this work via differentiation based on the cumulative rainfall CDF.
There is only one major peak in the rainfall process during a single-peak rainfall event [43], and this peak may occur in the early, middle, or late stages of the rainfall process. For the single-peak rainfall events [44], this study further classifies them into early-peak, middle-peak, and late-peak types based on the location of the rainfall peaks and fits the time-course distributions of rainfall events with different recurrence periods (T = 1-, 2-, 3- and 5-year). The Logistic5 distribution, Weibull distribution, gamma distribution, and lognormal distribution were among the models that matched the single-peak rainfall CDF. The best model was chosen by modifying the R2, AIC criterion, and K-S test to evaluate the fit’s efficacy. The PDFs were calculated from the derivatives of the fitted CDFs, which further revealed the evolution pattern of the rainfall intensity over time. Different rainfall temporal patterns have different impacts on the runoff process and flood response, which are important references for flood control scheduling and watershed management.

4. Results and Discussion

4.1. Clustering Results

The PCA degradation and K-means++ algorithm clustering analysis produced five clusters with considerable differentiation (see Figure 2). The rainfall types in the metropolitan region of Hangzhou can be categorized into five groups, I–V, and Figure 3b–f displays the unique rainfall distributions.
According to the results of principal component analysis, the four principal components that were obtained explain 92.50% of the total variance while preserving the majority of the information found in the original data. Table 2 displays the variance (eigenvalues) and contribution rate of each principal component, with the first principal component (PC1) contributing 43.09% and the second principal component (PC2) contributing 23.80%.
In the first principal component, the rainfall duration, cumulative rainfall, and variables like the precipitation concentration index and peak precipitation ratio—which show the duration and intensity of rainfall events—largely dominate.
The second primary component, which reflects the volatility of the rainfall process, is composed of the coefficient of variation.
The third principal component, which describes the temporal distribution of rainfall peaks, is dominated by the peak position ratio.
The fourth primary component is regulated by the quantity of peaks.
Figure 2 illustrates the distribution of rainfall events in a two-dimensional space consisting of the first two principal components (cumulatively explaining 66.89% of the variance), with different colors representing the clustering results. The clustering analysis categorized the rainfall types into five types (I–V). The clustering results show that the single-peak rainfall event is the most common type of rainfall in the study area. While double-peak rainfall is regarded as a significant rainfall pattern in some studies, it is less frequent in the current study’s data and is therefore excluded from the analysis of typical rainfall that follows.
There were significant differences in rainfall duration, peak rainfall position, and cumulative rainfall distribution among the five rainfall distribution types. To identify the typical rainfall characteristics of the study area, we focused on rainfall events with recurrence periods of 1, 2, 3, and 5 years, as these represent common recurring rainfall events rather than extreme or rare events (such as those with 50- or 100-year recurrence periods). As shown in Figure 3a, our analysis revealed that these typical rainfall events (with 1-, 2-, 3-, and 5-year recurrence periods) primarily fall into two categories: Type I and Type II, with Type I being overwhelmingly dominant. Specifically, among all of the rainfall events analyzed across these four recurrence periods, 96% were classified as Type I, while only 4% were classified as Type II. Type III, IV, and V distributions did not appear in any of the analyzed recurrence periods. The actual numbers of rainfall events for each recurrence period and type are as follows: for T-1, 43 events with 39 Type I and 4 Type II; for T-2, 36 events with 35 Type I and 1 Type II; for T-3, 31 events all Type I; and for T-5, 15 events all Type I. This clearly indicates that rainfall ‘Type I’, which is characterized by concentrated rainfall of brief duration, as shown in Figure 3b, is the predominant temporal distribution of typical rainfall processes in this study area.

4.2. Results of the Temporal Distribution of Typical Rainfall Events

The cluster analysis of rainfall events in the central region of Hangzhou revealed five distinct rainfall temporal distributions (I–V), with Type I emerging as the predominant temporal profile for typical rainfall events in this region. Therefore, to thoroughly study the temporal distribution characteristics of the most representative rainfall type, this study focused on a detailed analysis of Type I rainfall events.
While the cluster analysis effectively identified the major type of rainfall temporal distributions, it could not fully capture the internal variability of peak timing within Type I events. Since the position of rainfall peak significantly influences hydrological processes, including runoff generation and concentration, Type I rainfall events were further subdivided based on peak position into three subtypes: early-peak, middle-peak, and late-peak (see Table 3). This approach follows the methodologies of Yin et al. [45] and provides a more refined understanding of temporal distribution characteristics within the dominant rainfall type.
Table 3 presents the statistical analysis of rainfall peak position across different recurrence periods. The data show distinct proportional differences in the three peak timing categories. For events with longer recurrence periods (from T = 1 to T = 5), the percentage of late-peak rainfall distributions (where 0.6 ≤ Rt ≤ 1) increases from 35.3% to 66.7%. Conversely, the percentage of early-peak rainfall distributions (where 0 ≤ Rt < 0.4) decreases from 17.6% to 0%. The middle-peak rainfall distributions (where 0.4 ≤ Rt < 0.6) show less dramatic changes, with percentages moving from 47.1% to 33.3%. These results indicate that for higher recurrence periods, the rainfall intensity in the study area tends to reach its peak later in the rainfall duration, suggesting that more extreme rainfall events (with longer recurrence periods) are more likely to have their peak intensities occurring in the latter part of the rainfall event.
To characterize these rainfall distributions systematically and provide quantitative descriptions for engineering applications, a mathematical representation of each rainfall type was necessary. Thus, this study proceeded to fit the temporal distribution curves of Type I rainfall events for each peak position category and recurrence period. By computing the probability density function (PDF) and the cumulative distribution function (CDF) for each distinct category, it was possible to develop standardized rainfall profiles that quantitatively describe the rainfall intensity distributions. And the results of the calculations are shown in Table 4. Each CDF fitting result shows typical S-shaped distribution characteristics and demonstrates good agreement with the measured data. The results (see Figure 4) show that the Logistic5 model exhibits excellent adaptability in describing the rainfall accumulation process across all categories of peak position and recurrence periods.
The temporal distribution law of rainfall at different peak positions is further disclosed by the probability density function (PDF) curves. Although all three varieties of PDF curves displayed single-peak distributions, the peak position time and curve shape varied significantly:
The early-type rainfall peaks between 0.2 and 0.4 at the dimensionless time. The intensity of the rainfall peaks in the early stage of the rainfall course and then rapidly decays, with an exponential decay at the tail of the curve. However, the rate of decay is slower, suggesting that the early-peak rainfall maintains a certain intensity in the later part of the rainfall course. The rainfall process structure of early-peak rainfall with different recurrence periods is similar; yet, as recurrence periods rise, the peak area becomes slower and wider, and the peak position of this type of rainfall event is slightly displaced backward.
The middle-type rainfall peaks between 0.45 and 0.5 at the dimensionless time, and the rising and declining phases of the curve basically follow the same trend. With the increase in the recurrence period, the symmetry of the time distribution of the curves decreases slightly but still maintains significant symmetry, and the morphology is relatively stable but shows significant differences in the peak intensity. The peak intensity of the 5-year recurrence period is noticeably higher than that of the other recurrence periods, and the morphology is steeper, with a more concentrated intensity of rainfall.
The late-type rainfall peaks between 0.7 and 0.8 at the dimensionless time, and the curves of these rainfall events all exhibit the traits of “gradual-violent-rapidly decreasing”. The longer the recurrence period, the narrower the late-type rainfall peak area and the greater the peak intensity. The nonlinear change of extreme rainfall occurrences ought to be taken into consideration because the curve peak of T = 5-year recurrence period is the largest among them and its peak position is slightly ahead (0.65–0.7). This ‘warm-up-burst’ rainfall model poses a unique challenge to urban drainage systems, especially for underground spaces (e.g., underground shopping malls, underground stations, underground garages, etc.) in central Hangzhou.
In summary, the efficient drainage capacity should be reinforced in the mid and late stage for the central area of Hangzhou, and the characteristics of late-peak rainfall dominance should be thought of in the design of the infrastructure under the high recurrence period (e.g., T = 5 years) criterion, so as to build a more sophisticated management system based on the characteristics of the rainfall time-course distribution.

4.3. Discussion

Our analysis identifies typical rainfall temporal structures for frequent events (1–5 year recurrence periods) in central Hangzhou, addressing key research gaps in regional-specific characterization. The PCA with the K-means++ clustering approach effectively captures temporal complexity while reducing dimensionality—a limitation in traditional frequency analysis methods. Through this methodology, the Type I rainfall type emerges as Hangzhou’s predominant precipitation temporal structure, characterized by short-duration concentrated mid-to-late peaks. This identified type offers a more precise representation of local rainfall characteristics than conventional approaches.
The frequency distribution of rainfall types exhibits notable variation across different recurrence periods in central Hangzhou. Statistical analysis indicates that early-peak types represent 17.6% of 1-year recurrence period events while declining to 0% in 5-year events. Conversely, late-peak types increase from 35.3% to 66.7% when comparing 1-year to 5-year recurrence periods. Byunghwa et al. [15] have demonstrated the critical impact of peak position on urban runoff response, underscoring the hydrological significance of these distribution changes. These region-specific temporal characteristics provide valuable guidance for flood infrastructure planning in Hangzhou.
Despite these advancements, several limitations exist. Our analysis involved the use of hourly rainfall data from central Hangzhou, potentially missing high-intensity rainfall peaks occurring within periods shorter than one hour and seasonal variations influenced by the East Asian monsoon system. Zhang et al. [6] demonstrated that these temporal variations significantly affect urban flood processes in rapidly developing Chinese cities. The authors of future studies should expand the spatial coverage to encompass the entire metropolitan area and incorporate analyses of how these rainfall types interact with Hangzhou’s varied urban surfaces and drainage network configurations.
To build upon our findings, future research should focus on the following:
(1)
How these typical patterns interact with Hangzhou’s urban landscape and drainage infrastructure;
(2)
Investigating pattern stability under climate change scenarios would support long-term planning, particularly relevant given Liu et al.’s [13] findings on changing precipitation patterns in eastern China.
(3)
Additionally, expanding this analysis to include sub-hourly rainfall data and seasonal variations would provide a more comprehensive understanding of Hangzhou’s precipitation characteristics, especially in the context of East Asian monsoon influences.
The Logistic5 model provides a precise mathematical representation of typical rainfall processes across different peak positions and recurrence periods. These derived CDF and PDF expressions offer standardized rainfall curves directly applicable to flood control planning and engineering design and modeling.
For Hangzhou’s urban water management, the prevalence of late-peak rainfall events with longer recurrence periods necessitates adequate storage capacity rather than simply increasing drainage capacity. This aligns with China’s sponge city concept, which prioritizes water conservation through the systematic integration of various facilities. The standardized rainfall curves developed offer region-specific design tools that respond to Hangzhou’s actual rainfall characteristics rather than relying on simplified representations that fail to capture the temporal complexity identified in our research.

5. Conclusions

In this study, we employed the PCA downscaling technique and K-means++ clustering algorithm to identify and determine representative precipitation types for the central Hangzhou region. To further quantify the rainfall characteristics in this area, we constructed cumulative distribution function (CDF) and probability density function (PDF) curves for typical rainfall events, focusing on common precipitation events with 1-year, 2-year, 3-year, and 5-year recurrence periods. These mathematical descriptions effectively characterize rainfall intensities throughout the durations and provide a comprehensive understanding of the temporal distribution of precipitation in the study area. The main conclusions of this study are as follows:
(1)
Rainfall in central Hangzhou is predominantly characterized by Type I rainfall—short-duration, concentrated single-peak events typically occurring in the mid to late portion of the duration. This Type I rainfall type accounts for over 96% of all rainfall events across the selected recurrence periods (1, 2, 3, and 5 years), which were chosen to represent common precipitation scenarios relevant for integrated urban water management. The prevalence of Type I rainfall establishes it as the most representative precipitation type for central Hangzhou’s typical hydrological conditions.
(2)
Through secondary classification of Type I rainfall types based on peak position (early peak, middle peak, and late peak), we identified distinct statistical distributions across different recurrence periods. The proportion of late-peak types is higher in events with longer recurrence periods, while early-peak types constitute a larger percentage in events with shorter recurrence periods. This distribution characteristic is significant for hydrological applications as it indicates that more severe typical rainfall events in central Hangzhou are more likely to exhibit late-peak features.
(3)
The probability density function curves for rainfall events at all peak positions show higher peaks and narrower distributions as the recurrence period increases. This indicates that typical rainfall events with longer recurrence periods exhibit shorter durations, higher intensities, and greater temporal concentration. The 5-year recurrence period late-peak type shows a slightly advanced peak position, suggesting potential nonlinear variations that warrant further investigation.

Author Contributions

Conceptualization, Q.Z. and J.Q.; methodology, Q.Z. and J.Q.; software, Q.Z.; validation, Q.Z. and J.Q.; formal analysis, Q.Z.; investigation, Q.Z.; resources, Q.Z. and J.Q.; data curation, Q.Z.; writing—original draft preparation, Q.Z.; writing—review and editing, Q.Z. and J.Q.; visualization, Q.Z.; supervision, J.Q.; project administration, J.Q.; funding acquisition, J.Q. All authors have read and agreed to the published version of the manuscript.

Funding

This research was supported by the Joint Fund of Zhejiang Provincial Natural Science Foundation of China under Grant No LZJWZ24E090003.

Data Availability Statement

Public datasets from ERA5-Land utilized in this study are available at https://cds.climate.copernicus.eu/datasets/reanalysis-era5-land?tab=download (accessed on 31 May 2024).

Conflicts of Interest

The authors declare no conflict of interest.

References

  1. Paschalis, A.; Fatichi, S.; Molnar, P.; Rimkus, S.; Burlando, P. On the Effects of Small Scale Space–Time Variability of Rainfall on Basin Flood Response. J. Hydrol. 2014, 514, 313–327. [Google Scholar] [CrossRef]
  2. Ghate, A.S.; Timbadiya, P.V. True Interval Non-Stationary Intensity-Duration-Frequency Curves under Changing Climate and Effect of Temporal Discretisation on Rainfall Extremes. J. Hydrol. 2023, 618, 129136. [Google Scholar] [CrossRef]
  3. IPCC. 2023: Climate Change 2023: Synthesis Report. 2023. Available online: https://www.ipcc.ch/report/sixth-assessment-report-cycle/ (accessed on 1 September 2024).
  4. Sun, Q.; Zhang, X.; Zwiers, F.; Westra, S.; Alexander, L.V. A Global, Continental, and Regional Analysis of Changes in Extreme Precipitation. J. Clim. 2021, 34, 243–258. [Google Scholar] [CrossRef]
  5. Hirabayashi, Y.; Mahendran, R.; Koirala, S.; Konoshima, L.; Yamazaki, D.; Watanabe, S.; Kim, H.; Kanae, S. Global flood risk under climate change. Nat. Clim. Change 2013, 3, 816–821. [Google Scholar] [CrossRef]
  6. Zhang, D. Rapid urbanization and more extreme rainfall events. Sci. Bull. 2020, 65, 516–518. [Google Scholar] [CrossRef] [PubMed]
  7. Ren, X.; Hong, N.; Li, L.; Kang, J.; Li, J. Effect of infiltration rate changes in urban soils on stormwater runoff process. Geoderma 2020, 363, 114158. [Google Scholar] [CrossRef]
  8. Ding, Y.; Wang, H.; Liu, Y.; Chai, B.; Bin, C. The spatial overlay effect of urban waterlogging risk and land use value. Sci. Total Environ. 2024, 947, 174290. [Google Scholar] [CrossRef]
  9. Zhou, Z.; Smith, J.A.; Baeck, M.L.; Wright, D.B.; Smith, B.K.; Liu, S. The Impact of the Spatiotemporal Structure of Rainfall on Flood Frequency over a Small Urban Watershed: An Approach Coupling Stochastic Storm Transposition and Hydrologic Modeling. Hydrol. Earth Syst. Sci. 2021, 25, 4701–4717. [Google Scholar] [CrossRef]
  10. Cristiano, E.; ten Veldhuis, M.-C.; van de Giesen, N. Spatial and Temporal Variability of Rainfall and Their Effects on Hydrological Response in Urban Areas—A Review. Hydrol. Earth Syst. Sci. 2017, 21, 3859–3878. [Google Scholar] [CrossRef]
  11. Qi, W.; Liu, Y.; Ma, C.; Xu, H.; Lian, J.; Xu, K.; Yao, Y. A combined qualitative–quantitative method for adaptive configuration of urban flood mitigation measure. Urban Clim. 2024, 56, 102004. [Google Scholar] [CrossRef]
  12. Zhu, Z.; Wright, D.B.; Yu, G. The Impact of Rainfall Space-Time Structure in Flood Frequency Analysis. Water Resour. Res. 2018, 54, 8983–8998. [Google Scholar] [CrossRef]
  13. Liu, J.; Li, B.; Ma, M. Spatiotemporal Variation and Causes of Typical Extreme Precipitation Events in Shandong Province over the Last 50 Years. Remote Sens. 2023, 16, 1283. [Google Scholar] [CrossRef]
  14. Chen, G.; Hou, J.; Liu, Y.; Xue, S.; Wu, H.; Wang, T.; Lv, J.; Jing, J.; Yang, S. Urban inundation rapid prediction method based on multi-machine learning algorithm and rain pattern analysis. J. Hydrol. 2024, 633, 131059. [Google Scholar] [CrossRef]
  15. Oh, B.; Kim, J.; Hwang, S. Influence of Rainfall Patterns on Rainfall–Runoff Processes: Indices for the Quantification of Temporal Distribution of Rainfall. Water 2023, 16, 2904. [Google Scholar] [CrossRef]
  16. Ghajarnia, N.; Arasteh, P.; Araghinejad, S.; Liaghat, M. The hybrid Bayesian-SVD based method to detect false alarms in PERSIANN precipitation estimation product using related physical parameters. J. Hydrol. 2016, 538, 640–650. [Google Scholar] [CrossRef]
  17. An, D.; Du, Y.; Berndtsson, R.; Niu, Z.; Zhang, L.; Yuan, F. Evidence of climate shift for temperature and precipitation extremes across Gansu Province in China. Theor. Appl. Climatol. 2020, 139, 1137–1149. [Google Scholar] [CrossRef]
  18. Guenni, L.; Degaetano, A.; Subba Rao, T.; Serio, G. A model for seasonal variation of rainfall at Adelaide and Turen. Ecol. Model. 1996, 85, 203–217. [Google Scholar] [CrossRef]
  19. Machiwal, D.; Jha, M.K. Comparative evaluation of statistical tests for time series analysis: Application to hydrological time series. Hydrol. Sci. J. 2008, 53, 353–366. [Google Scholar] [CrossRef]
  20. Jin, H.; Chen, X.; Wu, P.; Song, C.; Xia, W. Evaluation of spatial-temporal distribution of precipitation in mainland China by statistic and clustering methods. Atmos. Res. 2021, 262, 105772. [Google Scholar] [CrossRef]
  21. Huff, F.A. Time distribution of rainfall in heavy storms. Water Resour. Res. 1967, 3, 1007–1019. [Google Scholar] [CrossRef]
  22. Pilgrim, D.H.; Cordery, I. Rainfall temporal patterns for design floods. J. Hydraul. Div. 1975, 101, 81–95. [Google Scholar] [CrossRef]
  23. Willems, P. Compound intensity/duration/frequency-relationships of extreme precipitation for two seasons and two storm types. J. Hydrol. 2000, 233, 189–205. [Google Scholar] [CrossRef]
  24. Koutsoyiannis, D.; Kozonis, D.; Manetas, A. A mathematical framework for studying rainfall intensity-duration-frequency relationships. J. Hydrol. 1998, 206, 118–135. [Google Scholar] [CrossRef]
  25. Tanguy, M.; Chokmani, K.; Bernier, M.; Poulin, J.; Raymond, S. River flood mapping in urban areas combining Radarsat-2 data and flood return period data. Remote Sens. Environ. 2017, 198, 442–459. [Google Scholar] [CrossRef]
  26. Guo, Y.P.; Adams, B.J. Hydrologic analysis of urban catchments with event-based probabilistic models: 1. Runoff volume. Water Resour. Res. 1998, 34, 3421–3431. [Google Scholar] [CrossRef]
  27. Medina-Cetina, Z.; Nadim, F. Stochastic design of an early warning system. Georisk Assess. Manag. Risk Eng. Syst. Geohazards 2008, 2, 223–236. [Google Scholar] [CrossRef]
  28. Fletcher, T.D.; Andrieu, H.; Hamel, P. Understanding, management and modelling of urban hydrology and its consequences for receiving waters: A state of the art. Adv. Water Resour. 2013, 51, 261–279. [Google Scholar] [CrossRef]
  29. Arnbjerg-Nielsen, K.; Willems, P.; Olsson, J.; Beecham, S.; Pathirana, A.; Bülow Gregersen, I.; Madsen, H.; Nguyen, V.T.V. Impacts of climate change on rainfall extremes and urban drainage systems: A review. Water Sci. Technol. 2013, 68, 16–28. [Google Scholar] [CrossRef]
  30. Burns, M.J.; Fletcher, T.D.; Walsh, C.J.; Ladson, A.R.; Hatt, B.E. Hydrologic shortcomings of conventional urban stormwater management and opportunities for reform. Landsc. Urban Plan. 2012, 105, 230–240. [Google Scholar] [CrossRef]
  31. Qiao, Y.; Wang, Y.; Jin, N.; Zhang, S.; Giustozzi, F.; Ma, T. Assessing flood risk to urban road users based on rainfall scenario simulations. Transp. Res. Part D Transp. Environ. 2023, 123, 103919. [Google Scholar] [CrossRef]
  32. Jiang, Q.; Li, W.; Fan, Z.; He, X.; Sun, W.; Chen, S.; Wen, J.; Gao, J.; Wang, J. Evaluation of the ERA5 Reanalysis Precipitation Dataset over Chinese Mainland. J. Hydrol. 2021, 595, 125660. [Google Scholar] [CrossRef]
  33. Gomis-Cebolla, J.; Rattayova, V.; Salazar-Galán, S.; Francés, F. Evaluation of ERA5 and ERA5-Land Reanalysis Precipitation Datasets over Spain (1951–2020). Atmos. Res. 2023, 284, 106606. [Google Scholar] [CrossRef]
  34. Dunkerley, D. Identifying individual rain events from pluviograph records: A review with analysis of data from an Australian dryland site. Hydrol. Process. 2008, 22, 5024–5036. [Google Scholar] [CrossRef]
  35. Bell, C.D.; McMillan, S.K.; Clinton, S.M.; Jefferson, A.J. Hydrologic response to stormwater control measures in urban watersheds. J. Hydrol. 2016, 541, 1488–1500. [Google Scholar] [CrossRef]
  36. Greenacre, M.; Groenen, P.J.; Hastie, T.; Iodice, A.; Markos, A.; Tuzhilina, E. Principal component analysis. Nat. Rev. Methods Primers 2022, 2, 100. [Google Scholar] [CrossRef]
  37. Chatterjee, S.; Khan, A.; Akbari, H.; Wang, Y. Monotonic trends in spatio-temporal distribution and concentration of monsoon precipitation (1901–2002), West Bengal, India. Atmos. Res. 2016, 182, 54–75. [Google Scholar] [CrossRef]
  38. Zhang, Z.; Chen, X.; Wang, C.; Wang, R.; Song, W.; Nie, F. Structured multi-view k-means clustering. Pattern Recognit. 2025, 160, 111113. [Google Scholar] [CrossRef]
  39. Abdi, A.; Hassanzadeh, Y.; Ouarda, T.B. Regional frequency analysis using Growing Neural Gas network. J. Hydrol. 2017, 550, 92–102. [Google Scholar] [CrossRef]
  40. Kapoor, A.; Singhal, A. A Comparative Study of K-Means, K-Means++ and Fuzzy C-Means Clustering Algorithms. In Proceedings of the 2017 3rd International Conference on Computational Intelligence & Communication Technology (CICT), Ghaziabad, India, 9–10 February 2017; pp. 1–6. [Google Scholar]
  41. Deka, P.; Saha, U. Introduction of k-means clustering into random cascade model for disaggregation of rainfall from daily to 1-hour resolution with improved preservation of extreme rainfall. J. Hydrol. 2023, 620, 129478. [Google Scholar] [CrossRef]
  42. Yuan, W.; Tu, X.; Su, C.; Liu, M.; Yan, D.; Wu, Z. Research on the Critical Rainfall of Flash Floods in Small Watersheds Based on the Design of Characteristic Rainfall Patterns. Water Resour Manag. 2021, 35, 3297–3319. [Google Scholar] [CrossRef]
  43. Ye, Z.; Ding, L.; Liu, Z.; Chen, F. Research on the joint adjustment model of regional water resource network based on the network flow theory. Aqua 2024, 73, 608–622. [Google Scholar] [CrossRef]
  44. Wang, H.; Hu, Y.; Guo, Y.; Wu, Z.; Yan, D. Urban flood forecasting based on the coupling of numerical weather model and stormwater model: A case study of Zhengzhou city. J. Hydrol. Reg. Stud. 2022, 39, 100985. [Google Scholar] [CrossRef]
  45. Yin, S.Q.; Wang, Y.; Xie, Y.; Liu, A.L. Characteristics of intra-storm temporal pattern over China. Adv. Water Sci. 2014, 25, 617–624. [Google Scholar] [CrossRef]
Figure 1. Overview of the study area.
Hydrology 12 00088 g001
Figure 2. Scatter plot of rainfall event clustering in central Hangzhou.
Hydrology 12 00088 g002
Figure 3. The number of rainfall patterns and the rainfall distribution of each rainfall pattern in each recurrence period.
Hydrology 12 00088 g003aHydrology 12 00088 g003b
Figure 4. Cumulative distribution curve and probability density curve at each peak position.
Hydrology 12 00088 g004
Table 1. Characteristic values of precipitation.
CategoryCharacteristic Value NameFormulaFormula Meaning
Basic rainfall characteristicsRainfall duration ( D ) D = t 0 t n t 0 is the time when the rainfall starts, and t n is the time when the rainfall ends.
Cumulative rainfall ( P ) P = i = 1 T p i p i is the rainfall in the i-th hour, and D is the rainfall duration.
Rainfall distribution characteristicsPrecipitation concentration index (PCI) P C I = i = 1 T p i 2 P 2 p i is the rainfall in the i-th hour, and P is the cumulative rainfall. The larger the PCI value, the more concentrated the rainfall is in time distribution [37].
Coefficient of variation (CV) C V = σ μ Σ is the standard deviation of rainfall, and μ is the mean rainfall.
Rainfall peak characteristicsPeak precipitation ratio ( R p ) R p = p m a x p p m a x is the maximum hourly rainfall, and p is the cumulative rainfall.
Peak position ratio ( R t ) R t = t i T t i represents the time when the peak rainfall occurs, and T is the rainfall duration.
Table 2. Contribution of principal components and cumulative contribution.
Principal ComponentsEigenvalueContribution Rate (%)Cumulative Contribution Rate (%)
PC15.6143.0943.09
PC23.1023.0866.89
PC31.9715.1482.03
PC41.3610.4792.50
Table 3. Percentage of each peak position under different recurrence periods in Type I.
Peak Position + Range   of   R t Recurrence Periods
T = 1T = 2T = 3T = 5
Early peak0 R t < 0.417.6%10.0%9.5%0%
Middle peak0.4 R t < 0.647.1%45%42.9%33.3%
Late peak0. 6 R t 135.3%45%47.6%66.7%
Table 4. Optimal functions fitted to each rain pattern.
Rain PatternRecurrence PeriodBest Fit FunctionFunction Formula
Early-peak rainfallT = 1Logistic5 y = 0.0547 + 1.1544 [ 1 + ( 0.2246 / x ) 1.7594 ] 2.7623
T = 2 y = 0.0727 + 1.0752 [ 1 + ( 0.2519 / x ) 1.9606 ] 2.2495
T = 3 y = 0.0496 + 1.0678 [ 1 + ( 0.3594 / x ) 2.5262 ] 1.5504
Middle-peak rainfallT = 1Logistic5 y = 0.036 + 1.0012 [ 1 + ( 0.6617 / x ) 5.3742 ] 0.3903
T = 2 y = 0.0389 + 0.9981 [ 1 + ( 0.6637 / x ) 5.5693 ] 0.4158
T = 3 y = 0.037 + 0.9936 [ 1 + ( 0.6470 / x ) 5.5007 ] 0.4070
T = 5 y = 0.0267 + 0.9949 [ 1 + ( 0.6311 / x ) 5.8732 ] 0.4178
Late-peak rainfallT = 1Logistic5 y = 0.047 + 0.9549 [ 1 + ( 0.8711 / x ) 19.7801 ] 0.1037
T = 2 y = 0.0452 + 0.9636 [ 1 + ( 0.8754 / x ) 17.7630 ] 0.1203
T = 3 y = 0.0392 + 0.9658 [ 1 + ( 0.8010 / x ) 12.0803 ] 0.1777
T = 5 y = 0.0372 + 0.9639 [ 1 + ( 0.8485 / x ) 17.4794 ] 0.1315
Disclaimer/Publisher’s Note: The statements, opinions and data contained in all publications are solely those of the individual author(s) and contributor(s) and not of MDPI and/or the editor(s). MDPI and/or the editor(s) disclaim responsibility for any injury to people or property resulting from any ideas, methods, instructions or products referred to in the content.

