Article

Quantifying Mercury Use and Modeling Its Fate and Transport in Artisanal and Small-Scale Gold Mining in the Lom Basin

by
Marie Sorella Bella Atangana
1,2,
Pol Magermans
1,
Jules Rémy Ndam Ngoupayou
2 and
Jean-François Deliege
1,*
1
FOCUS Research Unit—Freshwater and OCeanic Sciences Unit of Research, PeGIRE Laboratory, Aquapôle Research Center, Department of Biology Ecology and Evolution, Faculty of Sciences, Campus Sart-Tilman, University of Liège, Allée de la Découverte 11, Building B53, Quartier Polytech 1, 4000 Liège, Belgium
2
Hydrogeology Laboratory, Department of Earth Sciences, University of Yaoundé I, Rte de l’Université, Yaoundé 33088, Cameroon
*
Author to whom correspondence should be addressed.
Hydrology 2025, 12(4), 77; https://doi.org/10.3390/hydrology12040077
Submission received: 27 February 2025 / Revised: 20 March 2025 / Accepted: 20 March 2025 / Published: 28 March 2025

Abstract

:
This research quantifies mercury use and models its transport in artisanal and small-scale gold mining (ASGM) in the Lom River during two key periods of intense mining activities and high water flow. Mercury concentrations from mining surfaces were estimated using a soil input function approach. Industrial mercury releases were assessed with a ratio-based approach using official gold production data and the mercury-to-gold ratio. The PEGASE model was applied to simulate mercury transport and pollution in the Lom River and to analyze the pressure–impact relationships of ASGM activities on surface water. Field measurements of the mercury concentrations in the Lom River during the dry and rainy seasons of 2021 were used to validate modeling results. The results indicate that volatilization has a more significant impact on the predicted mercury concentrations than photodissociation. Three scenarios were modeled for mercury use: whole ore amalgamation (WOA), combined whole and concentrate ore amalgamation (WOA + COA), and concentrate ore amalgamation (COA). Mercury use estimates ranged from 2250–7500 kg during intense activity to 1260–4200 kg during high water for the gold production of 750 and 525 kg, respectively. Industrial discharges dominated mercury pollution during the dry season while leaching from mining surfaces was the primary contributor during the rainy season.

1. Introduction

In Cameroon, artisanal and small-scale gold mining (ASGM) has been practiced in the Lom basin since 1934 [1]. Exploited in an artisanal way and then in both artisanal and semi-mechanized ways since 2000, these mining activities induce a significant pollution load in the watershed. More than a thousand open-pit mining sites are found in the Lom basin. Most use mercury amalgamation in various proportions of mercury (Hg) and gold for the gold recovery process. In total, 5–45% of the used Hg is directly discharged into rivers [2,3]. Some studies have reported the degradation of the basin’s water quality by high heavy metal (lead, cadmium, copper, arsenic, chromium, zinc, iron, and manganese) concentrations [4,5,6,7,8] and specifically by mercury due to mining activities [3,9].
The use of mercury in ASGM activities is a major environmental preoccupation. In fact, 37% (1206 tons/year) of global mercury emissions come from ASGM [2]. Mercury is a toxic trace metal that can be found in different species. Once released into the environment, mercury can be converted into various forms (inorganic and organic) and passed from the air to soil, water, and sediments [10]. The biogeochemical cycle of mercury is characterized by an alternating passage from an inorganic to organic state and from oxidized to reduced forms. In aquatic ecosystems, (i) the aqueous elemental mercury Hg(0) can be photo-oxidized into divalent mercury Hg(II) or volatilized in the atmosphere under certain conditions; (ii) the divalent mercury can be photo-reduced back to Hg(0) and can also be complexed with dissolved organic matter (DOM) to form the methylated species (MeHg), which is its most toxic form; and (iii) the complex formed with DOM can also be photo-reduced to elemental mercury [11,12]. Mercury also tends to bind to suspended solids (TSS) as clayey materials [13], thus increasing its transport and dispersal potential, particularly in turbulent rivers. Solid Hg attaches sediments rapidly in low flows due to its high density [10].
Large quantities of Hg are lost at gold mining sites when mercury–gold amalgam is processed without retorts. A percentage of 50 to 75% of the Hg used is emitted directly into the environment [14]. The Hg can then be transported by air, leaching on soils, and flowing in water up to several dozen kilometers from the emission sites. Metallic Hg(0) released into watercourses during Hg amalgamation operations causes high contamination in the aquatic environments close to the emission points, with levels that can vary from 50 ng/g to 25,000 ng/g in dry weight [10,15].
The Minamata Mercury Convention aims to control mercury emissions from ASGM and regulate its use in this informal sector [16]. Article 7 of the convention requires the determination of baseline mercury use or emission to the environment from the ASGM sector. This baseline must be included in the country’s National Action Plan (NAP), serving as a regulatory metric to assess mercury use in the ASGM sector. Some approaches have been developed for estimating mercury use. They are based on official mercury trade documents, interviews with mercury sellers and users, estimated gold production, and the applied mercury-to-gold ratio (Hg:Au) [17]. The quantification of mercury use is challenging because of the lack of data and observations due to security concerns and the itinerant and seasonal nature of ASGM activities [18].
The use and/or emission of Hg by this sector of activity has undoubtedly had an impact on the environment, especially on water resource quality. Like the European Water Framework Directive (WFD), legislative measures are being implemented worldwide. These measures aim at protecting and improving the quality of water resources with the main objective of achieving a good ecological and chemical status of the water [19]. To meet these objectives, it is essential to employ monitoring tools that can identify pollution sources, quantify the pollutants already present, forecast potential adverse effects, and assess the effectiveness of the measures implemented to improve water quality.
Numerous methodologies have been developed to improve water resource management and protection strategies. Among them, modeling approaches have shown the best results for rapid and reliable estimates of pollution damage to water quality [9]. Several water quality models have been developed to (i) assess the quality of water bodies; (ii) estimate the evolution of quality parameters; and (iii) determine the impact of potential actions taken in management strategies. These models can be classified according to the approach type (physically based, conceptual, statistical), the application area, the nature (deterministic or stochastic), the analyzed state (steady or dynamic), the dimensions (1-D to 3-D), and the pollutant item, such as nutrients or micropollutants [20].
On the subject of mercury, the work of S. Zhu [21] gives a review and synthesis of mercury transport and fate models in aquatic systems (rivers/lakes, water bodies, sediments) from 1991 to 2016. From mass balance to integrated biogeochemical models, several models have been used (i) to simulate the mercury cycle and to assess Hg accumulation in sediments (Estuarine Contaminant Simulator: ECoS model); (ii) to simulate the main transformation processes, sorption, sedimentation, methylation, and demethylation in Hg cycling, such as with the PCFLOW3D model, Mercury Cycling Model (MCM), and CE-QUAL-W2, WASP8; and (iii) to assess ecological risk (SERAFM).
The PEGASE model (Planification Et Gestion de l’ASsainissement des Eaux; in English: Water Sewerage Planning and Management) was chosen for this study because of its robustness, wide applicability, and capacity to represent conditions and processes not covered by previous models. Pegase can be run in both steady and unsteady states and effectively predicts concentrations of classic nutrients and several micropollutants. As a physically based and integrated river/basin model, widely used by European water agencies (Belgium, France), it delivers deterministic and accurate simulations of water quality at local (single river) and watershed (river networks) scales under various hydrological conditions [22]. Such robust models require a considerable amount of accurate input data, which are often unavailable in hard-to-reach areas such as the present study site. PEGASE addresses this limitation by reconstructing missing data using a statistical approach.
So far, few studies have been conducted on the mercury pollution from gold mining activities in the Lom surface water. These studies focus on assessing water quality by calculating different water quality indexes, heavy metal indexes, and health risk assessments. Only one of these previous studies address mercury transport and fate in their study area [9], using a mathematical model that combines analytical and numerical methods. Because of the lack of available data, these authors propose simplifying assumptions that limit the model’s ability to accurately predict the transport of heavy metals in the River Lom. This highlights the need for more complex modeling approaches that consider the variability of pollutant sources and the dynamics of natural conditions.
The current study adopts a modeling approach to quantify mercury usage in artisanal small-scale gold mining (ASGM) in the Lom River. It focuses on gold production during the peak gold production period (January–May) and the high-water period (August–November). Two methods are developed to estimate mercury diffuse loads from artisanal mining and mercury direct discharges by industries (semi-mechanized mining). A pragmatic approach, using soil input functions, is employed to estimate mercury diffuse loads from mining surface leaching, enabling spatial analysis. A ratio-based method is used to estimate mercury use and releases from semi-mechanized mining operations, utilizing official gold production data and mercury-to-gold ratios (Hg:Au) [17]. The PEGASE model is applied to simulate mercury transport and pollution in the Lom River and to assess the pressure–impact relationships of ASGM activities on surface water quality. Different scenarios of mercury-to-gold ratios (Hg:Au) are explored to estimate mercury use during ore processing. A sensitivity analysis assesses the effects of volatilization and photodissociation over the predicted mercury concentrations. Seasonal and spatial variations in mercury are determined to assess the influence of the hydrological dynamic on pollutant input from mining discharges and soil inputs. This research presents the first application of the PEGASE model to simulate mercury transport and pollution in the context of ASGM.

2. Materials and Methods

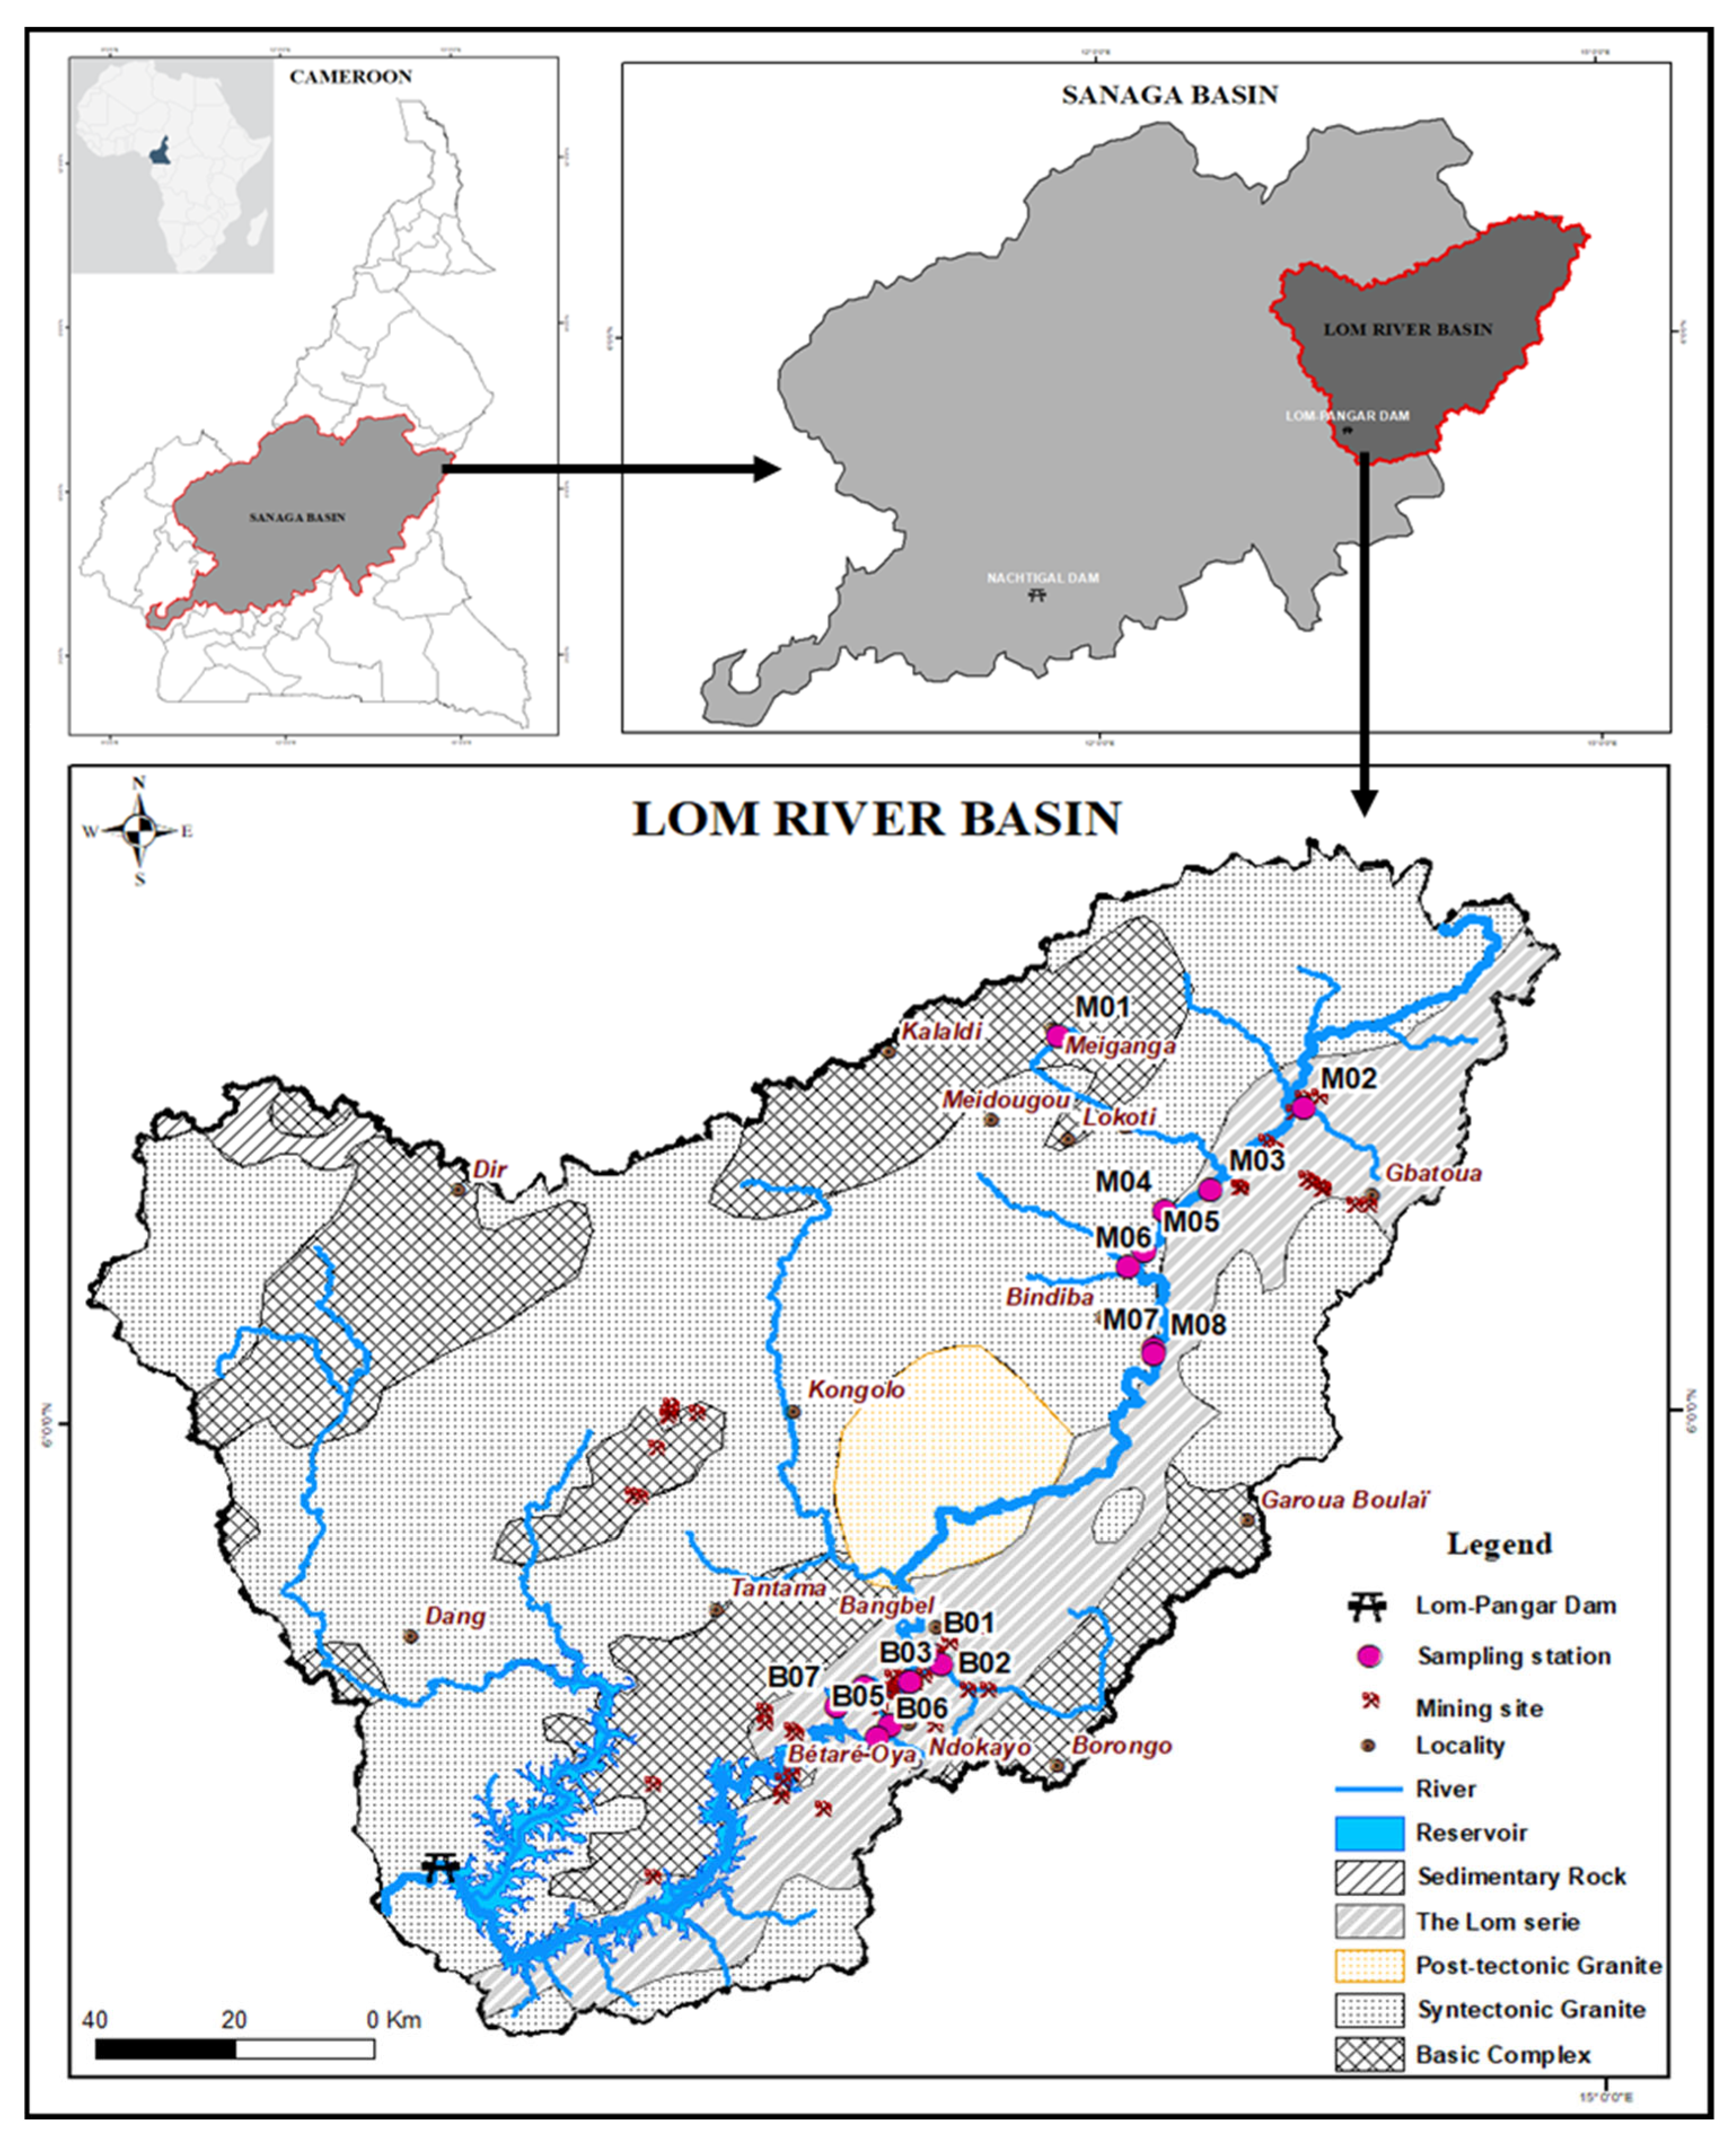
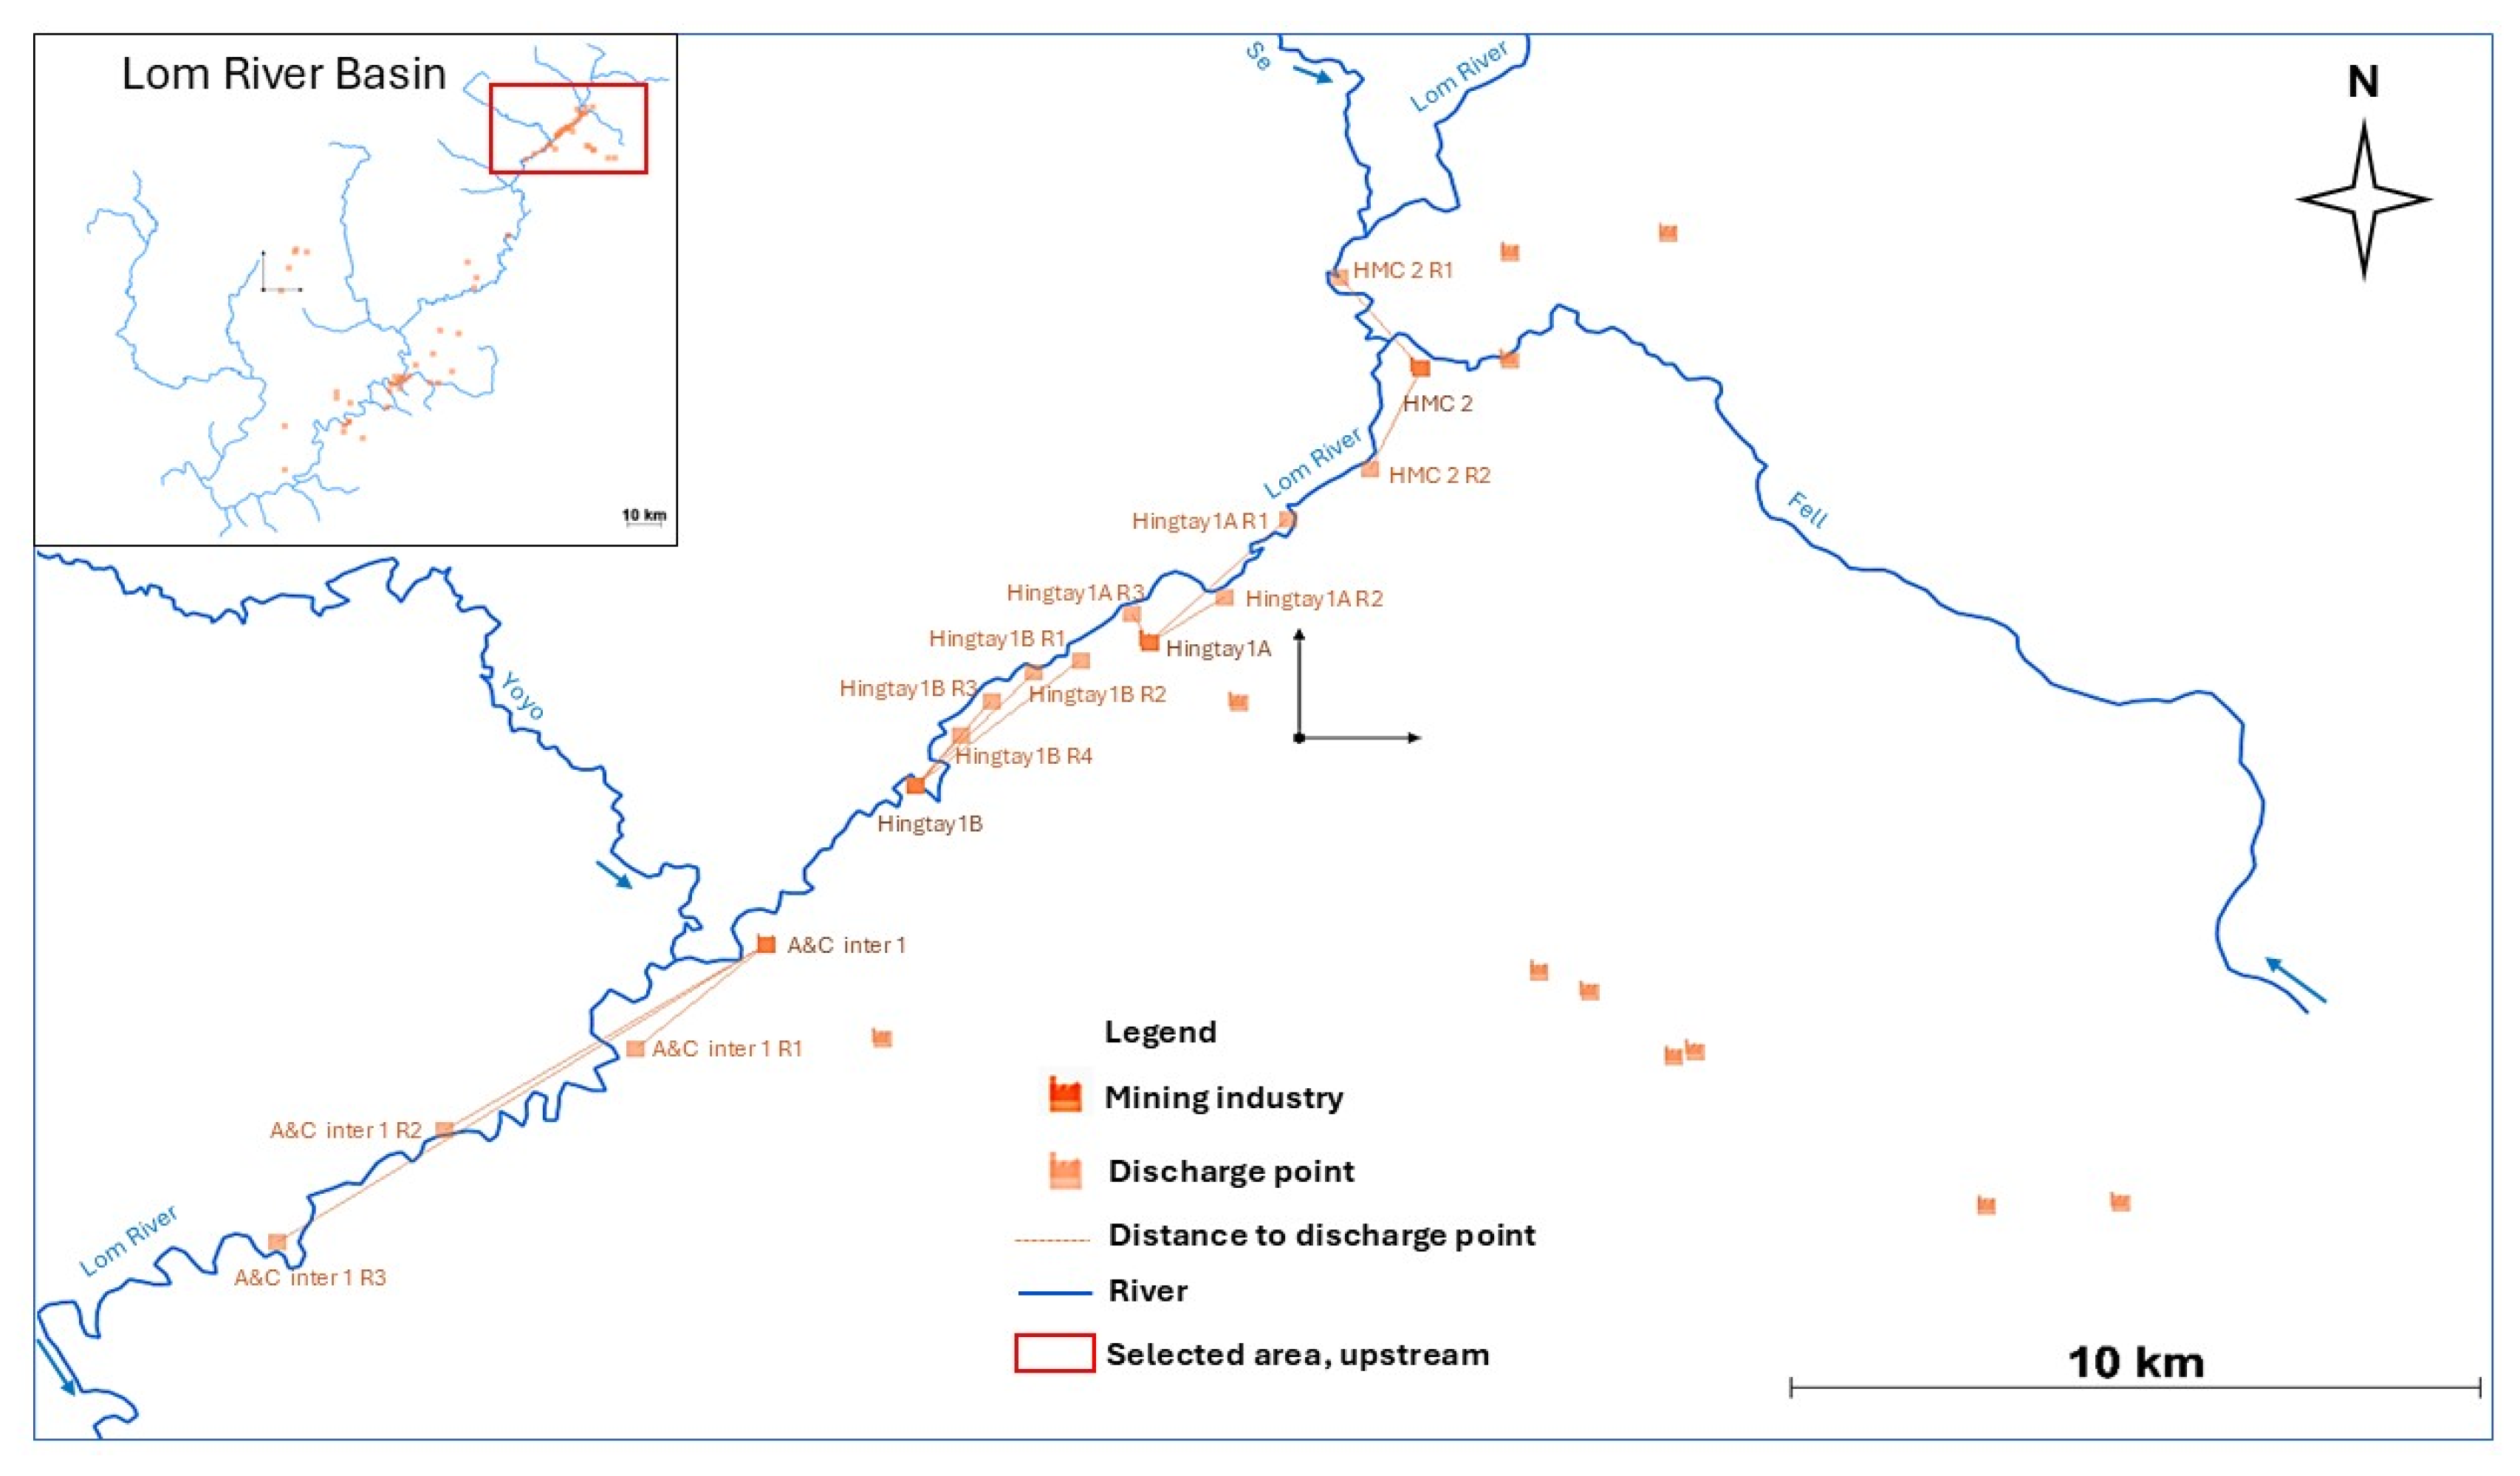
2.1. Study Area Description

The Lom basin in the East Cameroon region covers an area of 11,100 km2 (Figure 1). The climate is transitional equatorial, with 4 seasons: a long dry season from December to April, a short wet season from May to June, a short dry season in July, and an intense wet season from August to November [23]. During the dry season, flows on the Lom vary from around 17 to 120 m3 s−1, with the lowest values recorded in March. During the intense wet season, flows vary from around 150 to over 420 m3 s−1, with the highest values recorded in September and November. Precipitation ranges from 1500 to 2000 mm, with the hottest months being January and February (max 32 °C in 2021) [24]. Rocks are of plutonic and metamorphic types and originate from the Archean craton (Central Africa Pan-African belt). They are mainly composed of quartzites, schists, calcschists, garnet-bearing mica-schists, granites, gneisses, migmatites, and greenschists, known as the Lom series [25]. The bedrock lies at altitudes between 600 and 1200 m. At high altitudes (above 800 m), the area mostly has thick oxisols, which are red and yellow soils, reaching over 20 m in depth. In lower areas (600–650 m), hydromorphic soils cover the depressions [23]. The Lom basin is drained by a dense hydrographic network. Its main watercourse is the River Lom, which has a length of 318 km. The Lom River takes its source 70 km north of Meiganga (Adamoua) and ends in Bétaré-Oya (East) at the confluence with the Djerem (23 km after joining the Pangar River) [23]. Gold reserves in the basin have been estimated at more than 20 tons of 18- to 24-carat gold, and the Lom basin hosts an essential part of the country’s mining activities [26].

2.2. Water Quality Monitoring

Two field campaigns were conducted during the dry and rainy seasons in 2021. Fifteen measurement stations were positioned upstream (M01 to M08) and downstream (B01 to B07) of the Lom River (Figure 1). In situ parameters, notably the potential of hydrogen (pH), temperature (T), electrical conductivity (EC), and dissolved oxygen (DO), were measured on the field using a previously calibrated multiparameter probe analyzer (Hach SL1000, Hach Belgium, https://be.hach.com/). Water samples were collected at each station for mercury analysis at the laboratory in Teflon bottles of 500 mL. The bottles were washed with a 5% aqueous nitric acid solution and rinsed with water in the laboratory before being taken to the field. The bottles were rinsed with river water prior to taking samples. They were filled to the top, stored at 4 °C, following Rodier’s protocol [27], and sent to the laboratory. The samples were filtered using 0.45 µm cellulose membrane filters and conditioned in 100 mL borosilicate glass vials. The total dissolved mercury (Hg) was analyzed by inductively coupled plasma emission spectroscopy (ICPEOS) using an Optima 8000 apparatus at the International Institute of Tropical Agriculture (IITA, Yaoundé, Cameroun) laboratory. Before the analysis, 15 mL of HCl and 6 mL of potassium bromide bromate reagent per 100 mL were added to the water samples and preserved for at least 24 h. Mercury compounds were oxidized to divalent mercury using KBr/KBrO3 (Merck quality, Merck, Hoeilaart, Belgium, https://www.merckmillipore.com/BE) and then reduced to their elemental form using 0.3% NaBH4 (Merck quality) in a 0.5% NaOH (Merck quality) solution. The water samples were digested with 0.5 mL of a 10% hydroxylamine hydrochloride solution until they became colorless, and were then brought to a volume of 50 mL with ultra-pure water. A 1% ascorbic acid solution was added to the digested samples to eliminate free bromine. The prepared samples were vaporized in induced argon plasma for detection and quantification (atomization, ionization, and thermal excitation) using an optical emission spectrometer.

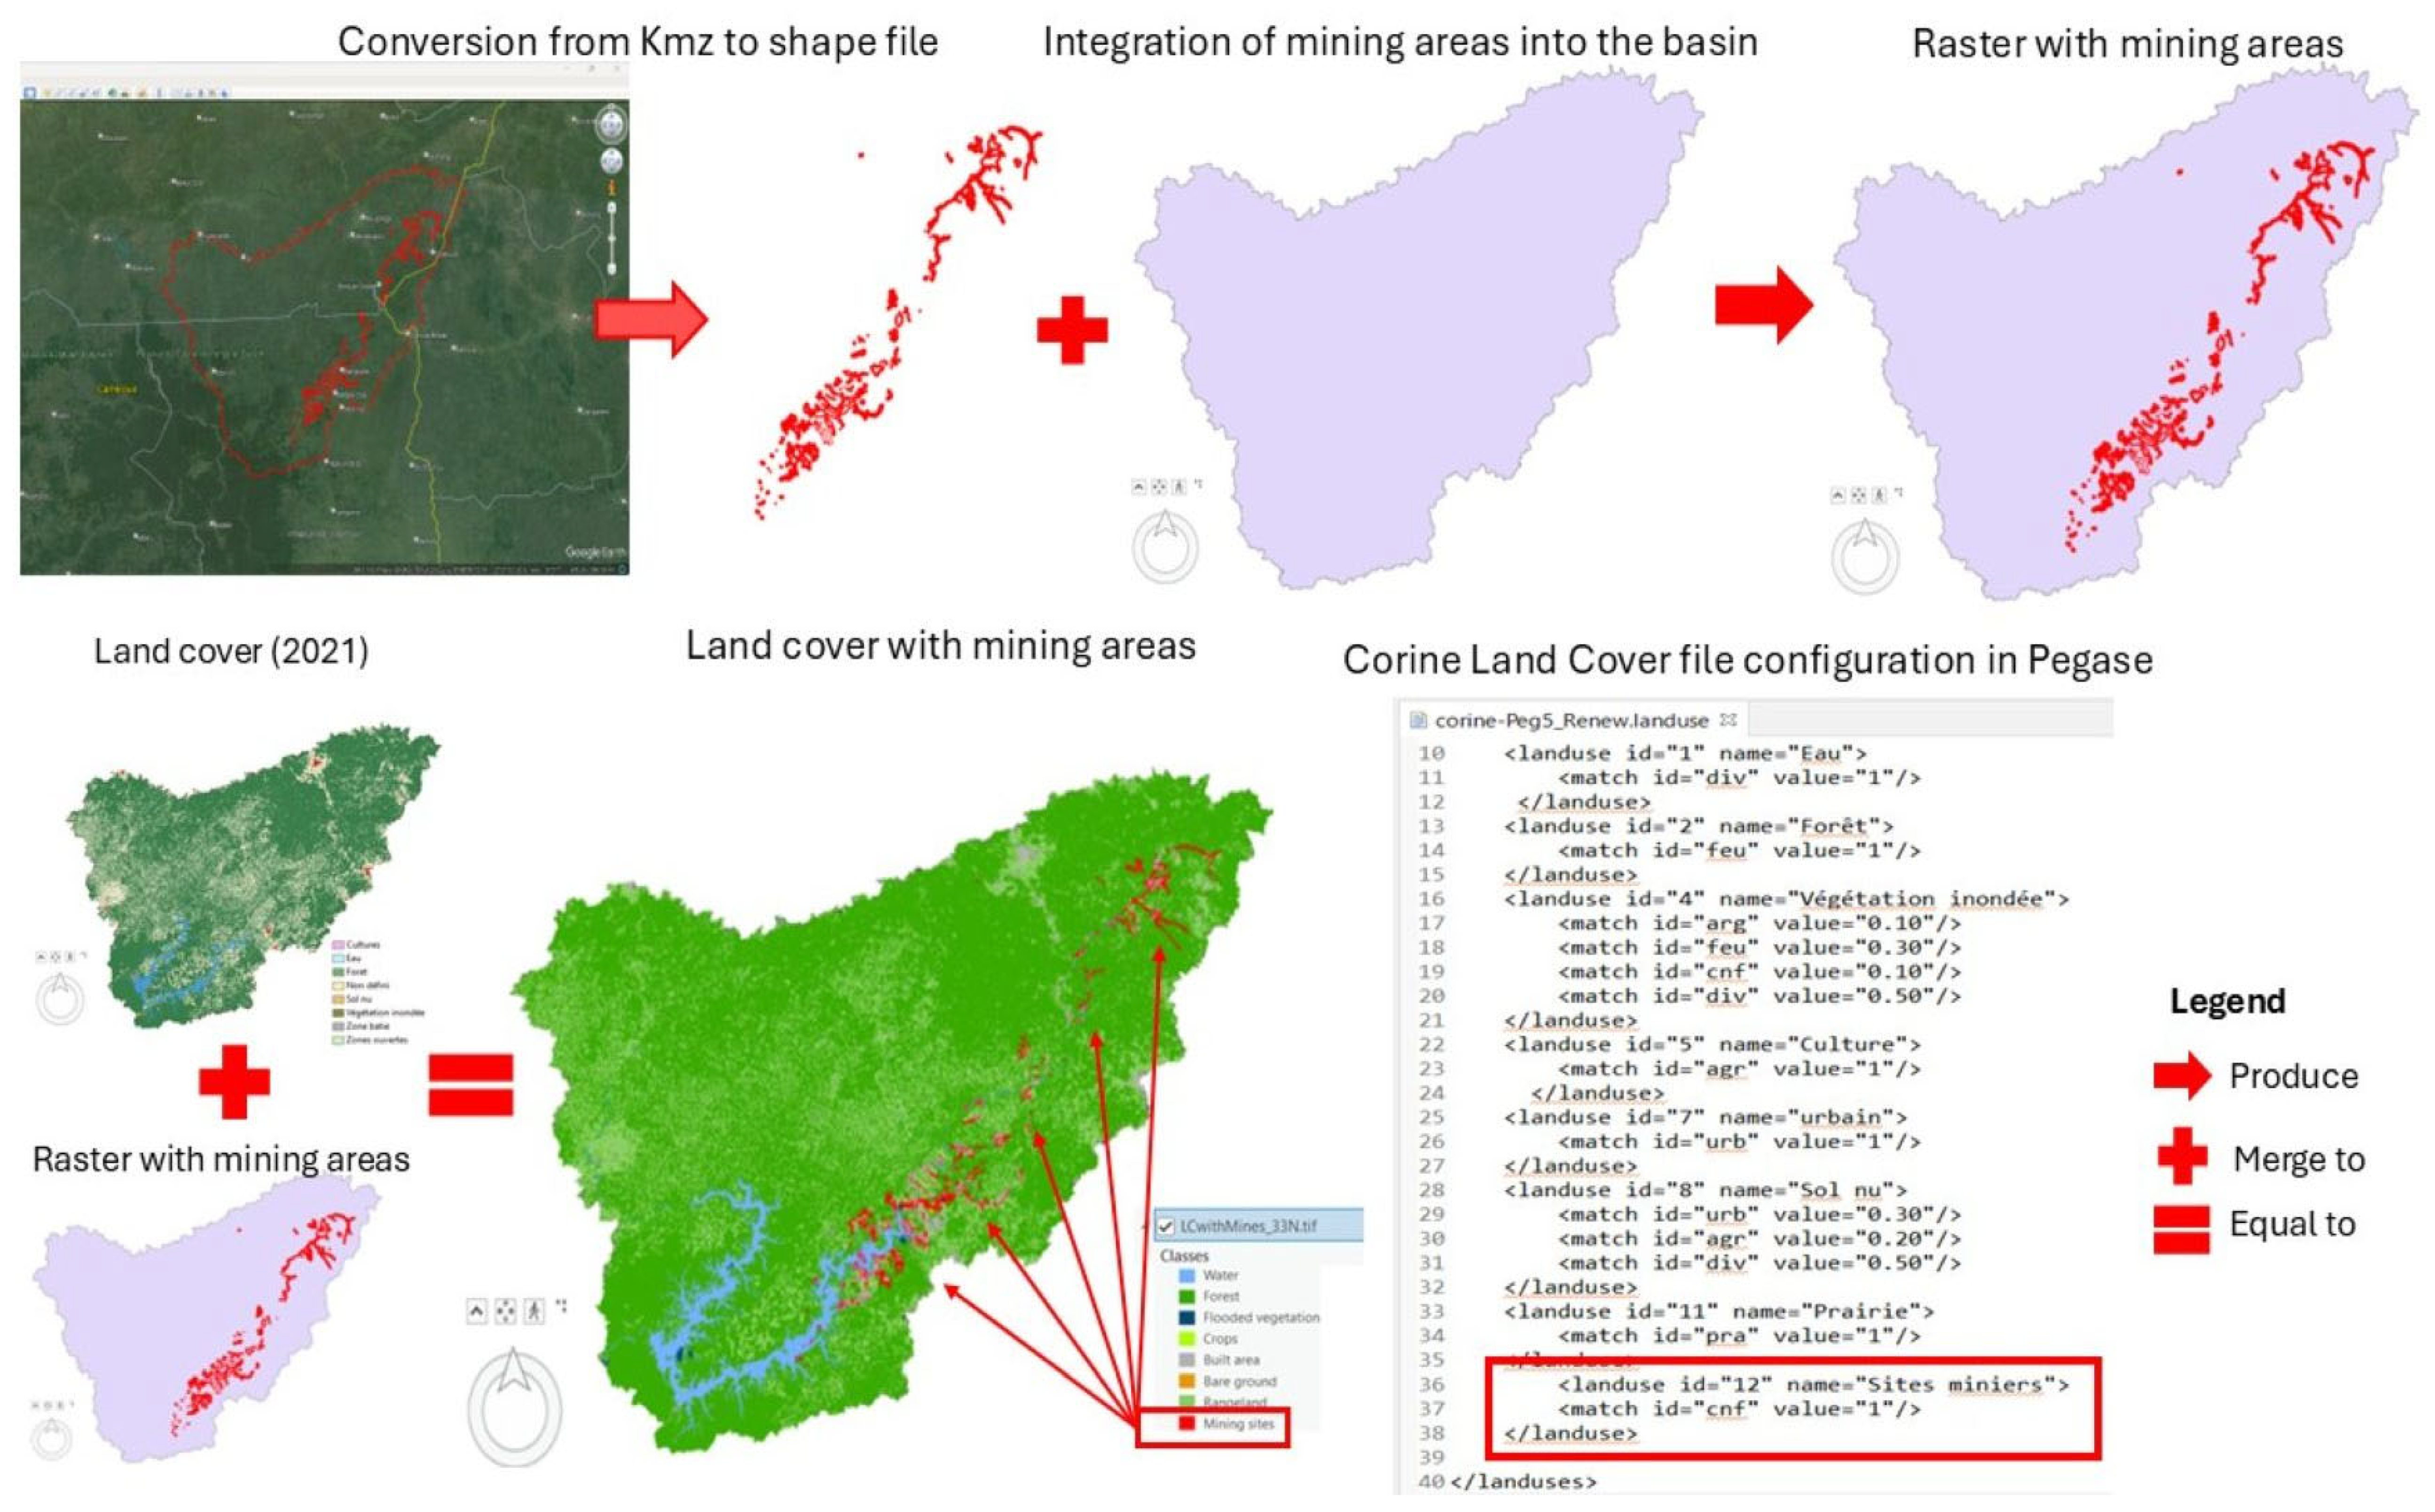
2.3. Description of the PEGASE Model

PEGASE is composed of four integrated sub-models: (i) a hydrologic and hydrodynamic sub-model for the calculation of hydrodynamic parameters (flow rates, velocity, water stage, etc.); (ii) a thermal sub-model for calculating the profile of the temperature of the river water; (iii) a discharge sub-model for assessing point and diffuse inputs and discharges at any point in the river system; (iv) and a water quality and aquatic ecosystem behavior sub-model for the calculation of physicochemical variables including micropollutants such as mercury [28,29]. The model allows the simultaneous treatment of several thousand rivers for watersheds of up to 100,000 km2, giving the possibility to perform simulations on a portion (sub-basin) or the whole basin in stationary or non-stationary mode. The model manages many results. PEGASE output calculations and predictive scenarios result in the form of graphs (time series and longitudinal profile of water bodies); 2D maps, including global quality indicators such as the European Water Quality Evaluation System (SEQ-Eau); and flow balance tables. It makes it possible to understand the ecosystem’s functioning, represent watershed/river relations, and quantify non-linear pressure/impact relations on the ecosystem [29,30]. These specifications will enable the accurate modeling of mercury concentrations in the river.

Model Implementation and Calibration

Data collection
The database required for applying PEGASE to the Lom basin was set up (Table 1). It includes a set of oro-hydrographic data and base maps (digitization of rivers, hydrographic zones, municipality boundaries, the Digital Elevation Model, and land use) collected at Cameroon’s National Institute of Cartography (INC). Discharge data, such as urban and industrial discharges, wastewater treatment plants, and livestock load, were collected from the ministries in charge (mines and energy, livestock and agriculture, Cadre d’APpui aux Artisans Miniers). All hydro-meteorological data (river flows, water temperatures, insolation) were obtained from the Hydrological Research Centre in Yaounde and the Meteorological Department of the Ministry of Transport. Water quality data, notably the concentrations of water quality parameters, were collected during the field measurement campaigns. Some data were supplemented by information available on reliable, freely accessible websites at specific locations and dates.
Mathematical Representation
PEGASE is a one-dimensional model that represents physicochemical processes. The advection/dispersion equation is used to describe the transport and fate of a pollutant at any point in the river [29]. The mean mercury concentration C(x,t) is calculated at time step t (considering non-stationary source terms) according to the following equation [31]:
C t + u C x C x D l   C x = R i A δ x   x i + Q k · C k A k δ x   x k + P L
where x is the position along the stream axis, t is the time, and Dl is the longitudinal dispersion coefficient (m2 s−1). Ai is the river cross-sectional area (m2) and u is the mean stream velocity (m s−1). Ri includes loads and releases arriving at the watercourse and Qk is the flow rate (m3 s−1) of the tributary k supplied at the point xk of cross-section Ak. P and L are the internal production and loss fluxes calculated by the model (g m3 s−1). δ x 1 x 2 is the delta function of Kronecker (1 when x1 = x2, 0 otherwise).
Assuming that longitudinal variations are low, the dispersion term becomes negligible, simplifying Equation (1) to Equation (2) [30].
d C d t = R i A δ x   x i + Q k · C k A k δ x   x k + P L
Mercury concentrations in the water column are calculated by combining transport, input, and possible dilution effects from tributaries, as well as input from soils and total releases. The internal production, disappearance processes, and possible exchanges with the atmosphere are also taken into account [29,30].
Implementation
The first step in implementing the PEGASE model in the Lom basin is to build a simulation domain using the domain handling module. Five specific preprocessing programs are used to preprocess the hydrogeographical data of the study area. These programs generate the input data required by PEGASE (river network, Digital Terrain Model, watershed, land use at each river node). Preprocessing enables one (i) to obtain a topologically correct river network for which a PEGASE hydrological codification was added; (ii) to build the geometric network (river segments) in order to orient the flow in the right direction; (iii) to generate a coherent river altimetry profile and to create PEGASE digitalization nodes; and (iv) to generate watershed–river connectivity by calculating the steepest slope direction from the soil to the selected river network, as well as by calculating runoff parameters on the watershed (distances between rivers, elevation differences, etc.). The result is the construction of a study domain where all discharges and inputs from the watershed are connected to the nodes of the modeled rivers in order to explicitly establish the relationship between the watershed and the rivers.
Model Parametrization
PEGASE is a physically based model, so all parameters have a physical significance (sedimentation rate, degradation rate, etc.). As a result, the parameters are usually the same for each field of application. The model requires no specific calibration when applied to a new domain except for direct and diffuse discharges (soil input functions). In PEGASE, the different types of mercury inputs into the river network are integrated as follows:
-
Urban discharges, based on the concept of equivalent inhabitants for mercury;
-
Industrial discharges, derived from emission inventories;
-
Wastewater treatment plants (WWTPs), accounted for through a removal efficiency rate specific to each facility;
-
Direct inputs from livestock, estimated using a direct emission rate per livestock unit;
-
Diffuse inputs from soils, incorporated using a soil input function to represent land-based contributions.
Direct discharges: estimation of mercury releases from mining effluents
In the context of ASGM, knowing or estimating the mercury loads discharged in mining effluents is difficult. A pragmatic approach is used for estimating mercury use during ore processing based on estimated gold production and the applied mercury-to-gold ratio (Hg:Au) [17].
Mercury use is typically estimated using Equation (3) [18]:
H g   u s e d = P × H g : A u
where P is the gold production, representing the quantity of gold generated over a specific period (e.g., grams of gold per year, semester, or quarter). Hg:Au ratio is the mercury-to-gold ratio, representing the amount of mercury (g) required to produce one gram of gold.
Following the baseline estimates of ASGM mercury use [17], the Hg:Au ratio estimation was performed by considering three main parameters: the type of ore (mineralogy), the method of ore treatment (amalgamation), and the number of washing days.
-
Type of ore: When the ore contains silver (Ag), an average of 3 g of mercury is required to amalgamate 1 g of silver, resulting in a Hg:Ag ratio of 3:1. To this, the Hg:Au ratio is added, depending on the type of amalgamation practiced. The Lom basin gold mineralization effectively contains silver (7.11–20.56% of Ag), as shown in different works [32,33,34].
-
Method of amalgamation: On average, 1 g of mercury is typically needed to amalgamate 1 g of gold (Hg:Au = 1:1). However, this ratio can vary depending on whether the mercury is applied to the entire milled ore [Whole Ore Amalgamation (WOA)] or to the concentrated ore [Concentrated Ore Amalgamation (COA)]. For WOA, a minimum of 5 times more mercury is required, resulting in a Hg:Au ratio of 5:1 or more. In the case of COA, the average ratio is Hg:Au = 1:1 [35].
-
Number of washing days: The number of washing days corresponds to the actual number of days during which mercury is mixed to the ore for its treatment through amalgamation and subsequently discharged.
Three scenarios were established for estimating the mercury-to-gold ratio used in gold ore processing (Table 2). These scenarios are based on the amount of gold produced by various industries in April 2021 and the estimated average production during intense activity (January–May) and high water (August–November). The three scenarios represent the following cases:
-
High mercury use: WOA (Hg:Au = 10:1);
-
Mixed practice with average mercury use: WOA (3/4) and COA (1/4) (Hg:Au = 6:1);
-
Low mercury use: COA (Hg:Au = 3:1).
Table 2. Estimated mercury use based on gold production and Hg:Au ratio.
PeriodEstimated Mean Gold Production per Day (kg Au d−1)Number of Washing Days (d_wsh)Total Gold Production per Period
(kg Au)
Hg:Au Ratio UsedHg:Ag Ratio UsedTotal Hg:Au Ratio UsedMercury Used per Washing Day (kg Hg d−1_wsh)Total Mercury Used per Period
(kg Hg)
Scenario 1Intense activity510/3075008:0102:0110:011507500
High water3.510/30525 1054200
Scenario 2Intense activity510/307505:1 × 3/4
1:1 × 1/4
02:016:01904500
High water3.510/30525 632520
Scenario 3Intense activity510/307501:102:013:1452250
High water3.510/30525 31.51260
The estimated Hg:Au ratio also considers the presence of silver in the ore (Hg:Ag = 2:1). The gold production in April shows the highest value for the period of intense activity. The average production value for this period is estimated based on April production (5 kg Au). Gold production is estimated to be 30% lower during the high-water period than during intense activity. The official report shows an average of 10 washing days per month, i.e., 10 days of mercury use.
The discharge points of industries along the river have been distributed throughout the area to ensure complete coverage. The estimated discharges, calculated based on the ratio of gold production to the Hg:Au ratio, were then divided by the total number of discharge points (Figure 2).
Diffuse discharges: mercury input from mining surfaces
A new land use class was included in the study area land cover using Google Earth Pro and ArcGIS Pro V3.2.2 software. The new class is made of gold mining exploitation surfaces. A ‘kmz’ file of the Lom basin mining area boundaries was created on Google Earth Pro version 7.3.6.9345 (32-bit) based on the Landsat/Copernicus image of April 2021. This feature considers all the mining exploitation areas as well as active and abandoned sites. The mining surfaces were then converted into a layer (shape file), merged with the basin contour (after ensuring consistency of the coordinate systems of the two layers), and transformed into a raster in ArcGIS Pro. A Sentinel-2 10 m Land Use/Land Cover Time Series (Landsat/Copernicus image 2021, UTM, WGS84) produced by Esri was downloaded and clipped to the shape of the Lom basin. The clipped land use area was then merged with the mining surfaces raster to obtain a new raster composed of the original land cover classes and the added mining surfaces. The new land use raster was then converted from a raster to an ASCII Grid file for preprocessing in PEGASE (Figure 3).
Diffuse discharges were used to represent the amount of Hg loads from artisanal gold mining activities (panning, processing, vaporization, reprocessing, tailing) and atmospheric deposition. The soil input functions for the Hg concentrations from mining surfaces were configured based on field measurements (Table 3).
Micropollutant sub-model
The micropollutant sub-model calculates mercury concentrations in dissolved form (water), as suspended sediments (particulate Hg), and as bottom sediments (sedimented Hg). The modeled processes include transport in water and sediments, adsorption/desorption, sedimentation, and optionally, biodegradation, photolysis, and volatilization. This work focusses on dissolved Hg. For the present application of the model to the Lom basin, Hg characteristics were parameterized for urban and livestock releases, transport, and disappearance processes, focusing on volatilization and photodissociation (Table 3). Urban and livestock inputs were considered negligible. A default value of 0.1 mg PE⁻1 d⁻1 was used for the urban input, which falls within the range reported in prior studies on heavy metal emissions from urban wastewater [36]. A total of 1.0 mg lsu⁻1 d⁻1 was used for livestock input as a representative estimate based on official discharge data and considering the dominance of livestock (60%) in the study area, as well as its potential contribution to mercury loads. The rates used for the transport processes are either from the literature or represent default values in the model.
Simulations
Simulations were performed on the intense activity (January–May 2021) and high-water (August–November 2021) period datasets, for which concentration measurements were taken on the Lom River. Adjustments were made progressively until a minimum difference between the model calculations and measurements was reached to obtain satisfactory results. Two standard statistical criteria for evaluating model performance were used: RMSE and R2.

3. Results

3.1. Estimation of Mercury Use During Ore Processing

In order to represent the most common situations of mercury use during ore processing in the Lom basin, three scenarios are established. The first represents an extreme case of Hg use by amalgamation over the whole ore (WOA). The second represents a case of mixed Hg use, combining amalgamation on the whole ore (WOA) for ¾ of the industries and that on the concentrate ore (COA) for the remaining ¼. The third scenario represents an ideal case of Hg use, in which Hg is used rationally and amalgamation is carried out only on the concentrate ore (COA).
The data sources used to calculate the Hg:Au ratios vary considerably from country to country, resulting in a wide range of adopted values (from 1:1 to more than 10:1), as shown in the work of Schwartz et al. [18] and O’Neill et al. [17]. However, the global average Hg:Au ratio values proposed by the 2018 Global Mercury Assessment (GMA) are Hg:Au = 5:1 for whole ore amalgamation and Hg:Au = 1:1 for concentrate ore amalgamation [17,35]. Added to this is the nature of the ore, which, when composed of silver, requires an additional ratio of up to Hg:Ag = 3:1 [17]. In the Lom basin, gold ore is predominantly composed of gold (Au 59.74–93.51 wt%) and silver (Ag 7.12–37.7 wt%) [32,34]. An average ratio of Hg:Ag = 2:1 was considered adequate in this study.
Different Hg:Au ratios were used for each scenario to represent the potential ore processing practices in the Lom basin. For scenario 1 (extreme mercury use), a total ratio of Hg:Au = 10:1 was used based on the ratio Hg:Au = 8:1 plus an average ratio of Hg:Ag = 2:1, considering the process on WOA for all industries. For scenario 2 (average mercury use), a total Hg:Au = 6:1 ratio was used based on an average Hg:Ag = 2:1 ratio plus the mixed processes using WOA and COA using the average GMA ratios Hg:Au = 5:1 and Hg:Au = 1:1, respectively. The WOA being practiced in ¾ of the industries (Hg:Au = 5:1 × ¾), corresponding to a Hg:Au = 3.75:1 ratio, was combined with the COA process practiced in ¼ of the industries (Hg:Au = 1:1 × ¼), corresponding to a Hg:Au = 0.25:1 ratio. For scenario 3, a total ratio of Hg:Au = 3:1 was used based on an average ratio of Hg:Ag = 2:1 and the ratio Hg:Au = 1:1 considering the process on COA for all industries.
Based on the gold production declared by the industries, the calculations show that during the intense activity period, mercury usage per wash day is estimated at 150, 90, and 45 kg Hg for scenarios 1, 2, and 3, respectively. Then, during the high-water period, gold production is estimated to be 30% lower than during the intense activity period. Consequently, the estimated mercury usage per wash day decreases to about 105 kg, 63 kg, and 31.5 kg for scenarios 1, 2, and 3, respectively (Figure 4). This corresponds to an estimated mercury consumption of 7500, 4500, and 2250 kg Hg to produce 750 kg of gold, respectively, in scenarios 1, 2, and 3 during the intense activity period. During the high-water period, Hg use is estimated at 4200, 2520, and 1260 kg Hg, respectively, in scenarios 1, 2, and 3 for an estimated gold production of 525 kg. In 2012, the AMAP 2018 [35] estimation of Hg consumption by ASGM in Cameroon was about 0.2–2.6 (±75%) t Hg (50–4550 kg Hg), with COA as the main processing method. These data have not been updated. The scenarios proposed in this work allow the exploration of different types of amalgamation processing. The estimations of Hg used in the different scenarios are realistic, considering that gold mining has increased between 2012 and 2021.

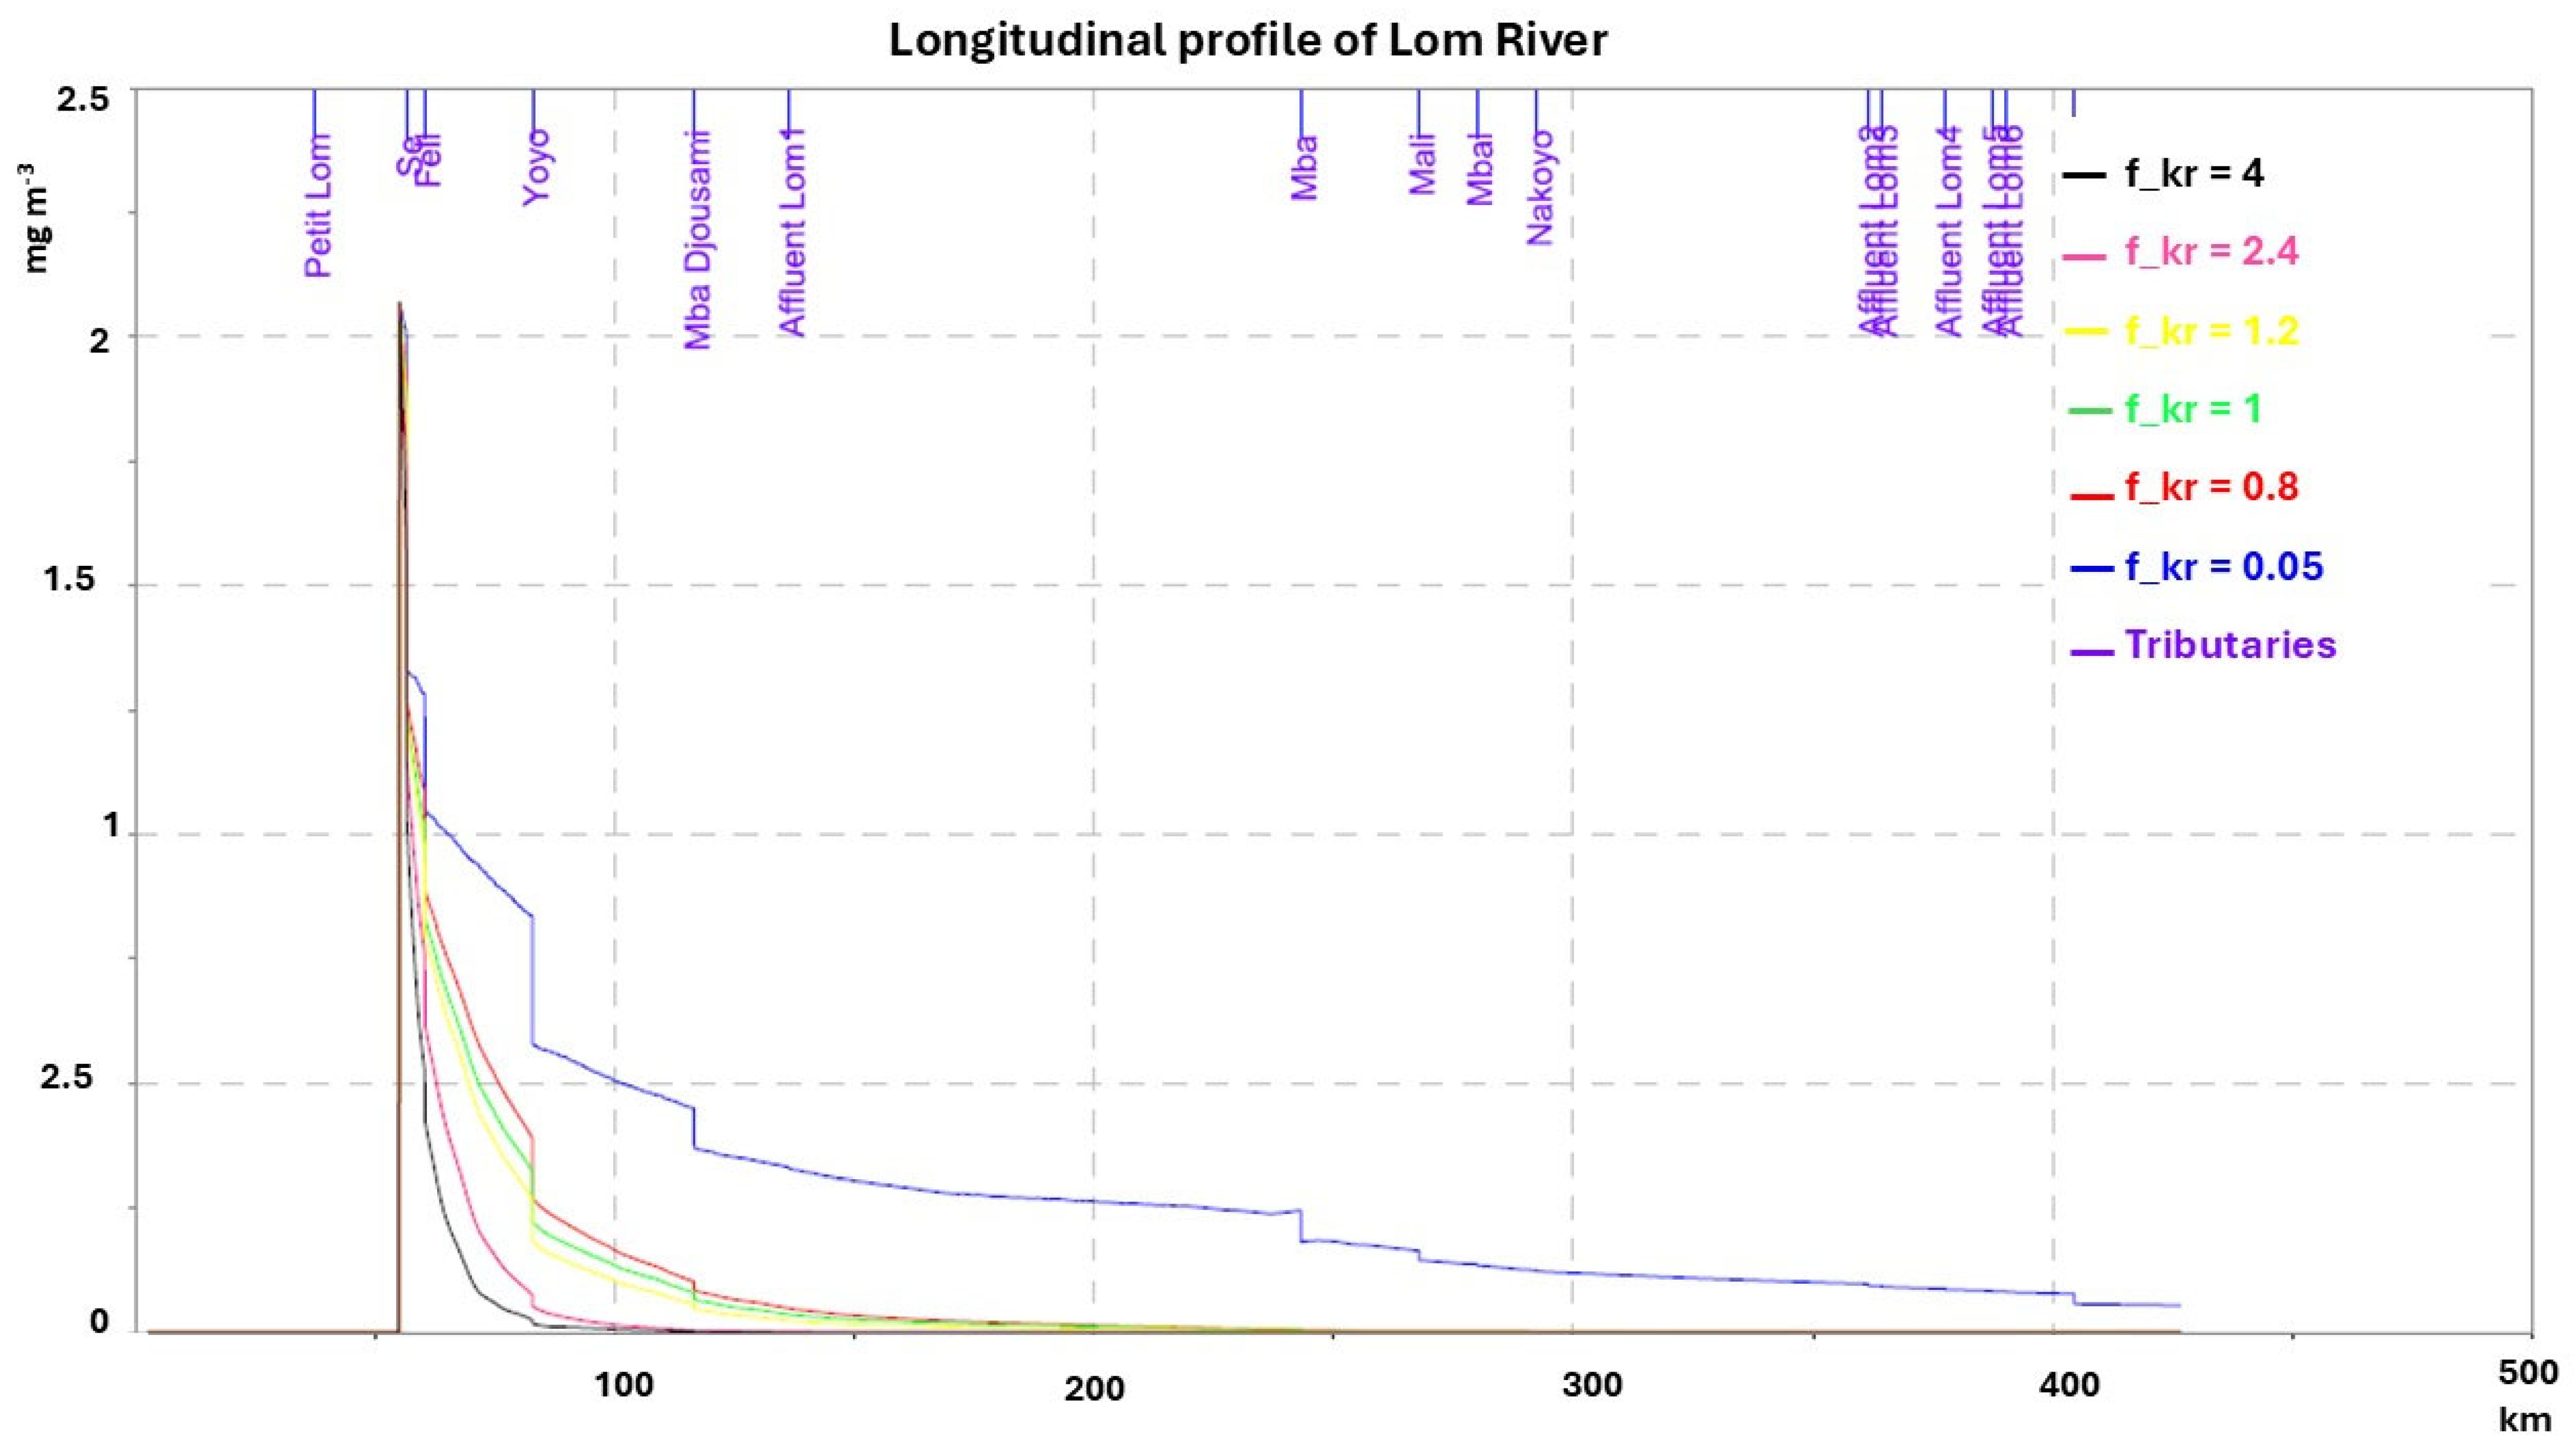
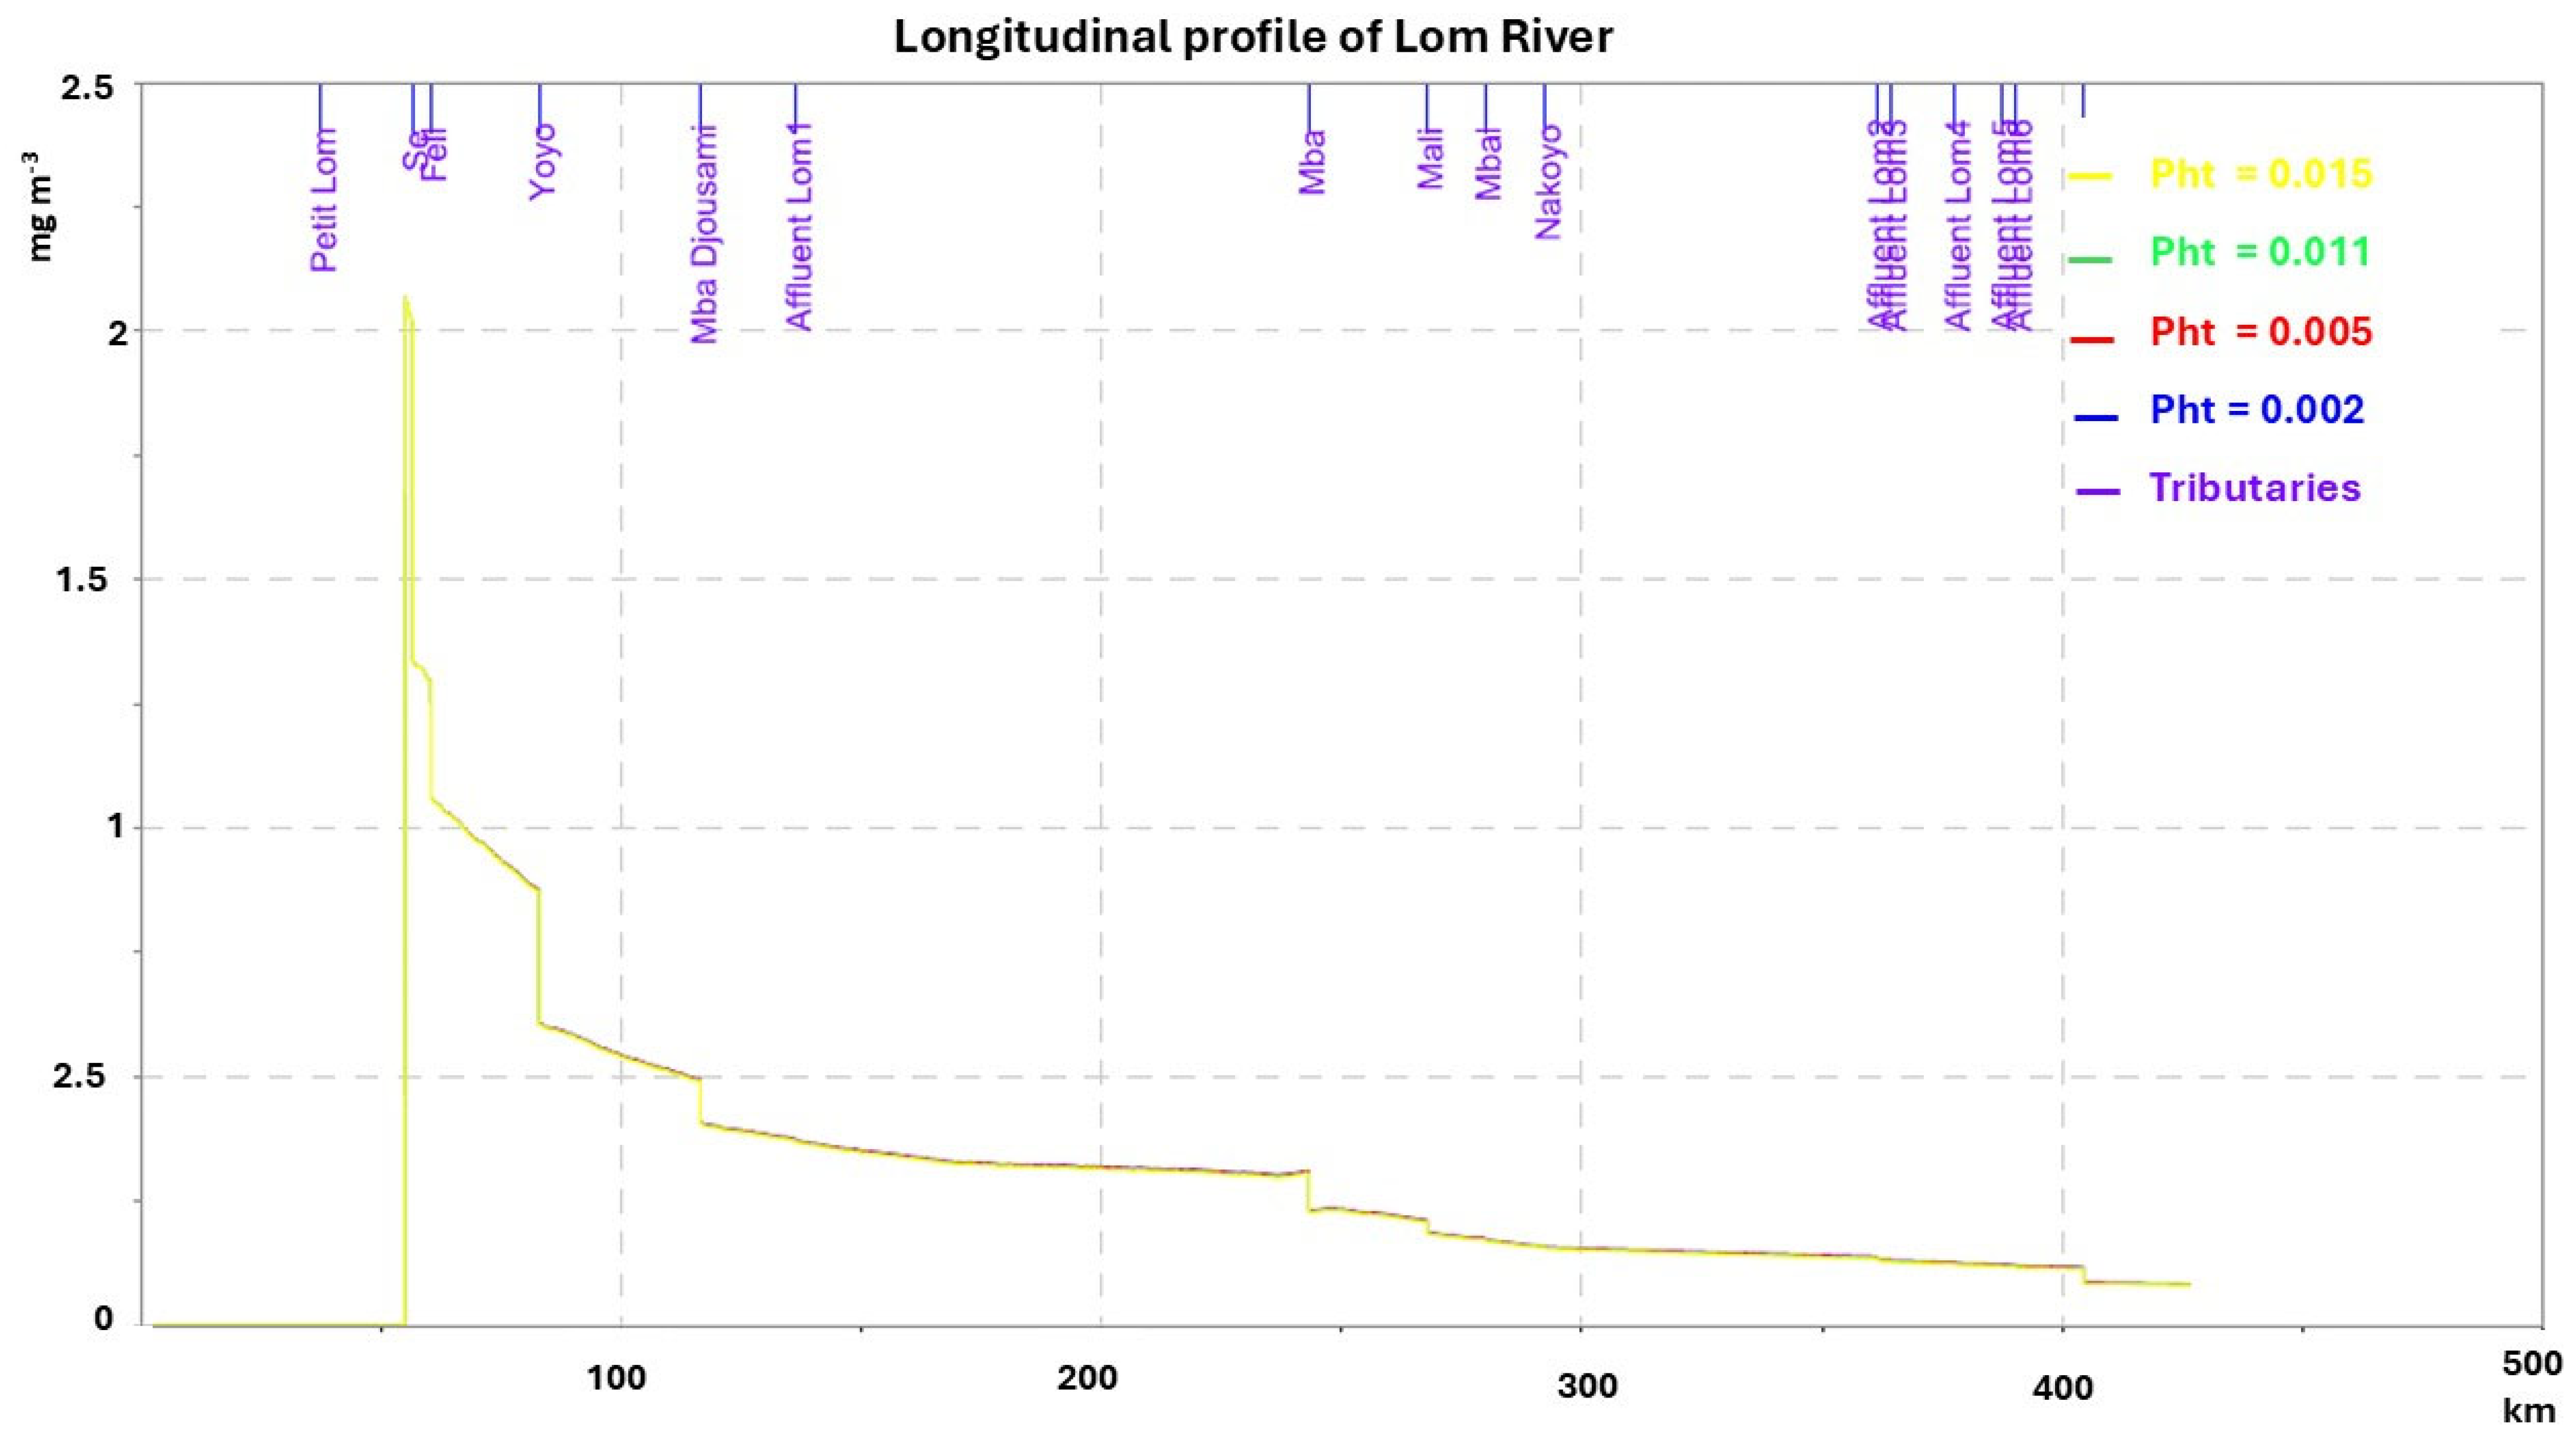
3.2. Sensitivity to Volatilization and Photodissociation Processes

The concentration of mercury predicted by the PEGASE model is influenced by its transformation processes and interactions with environmental parameters. An analysis was conducted to determine the optimal values for volatilization and photodissociation rates in the study area to determine how variations in these rates influence mercury concentrations. This analysis is crucial given the lack of published data related to volatilization and photodissociation processes in the studied region, which contributes to significant uncertainty.
Different volatilization factors (f_kr) ranging from 0.05 to 4 and photodissociation rates (Pht) ranging from 0.002 to 0.015 based on the literature [37,38,39,40,41,42] were applied to a constant industrial discharge of Hg injected into the Lom River at 56 km. The simulations were carried out considering mercury as conservative, and the only disappearance processes analyzed were volatilization and photodissociation.
Firstly, the results (Figure 5 and Figure 6) show a decrease in concentration due to the dilution. In fact, the Hg concentration at the confluences (where tributaries meet the Lom River) decreases proportionally to the tributary inflow. Secondly, the volatilization process is very significant, showing a 52.15–90.43% decrease between f_kr 4 and f_kr 0.05 after 10 km for the combined volatilization and dilution effects. This is due to the variable water heights (0.3–4.5 m) and high current velocities (0.16–1.56 m s−1) from 0 to 230 km, resulting in high reaeration coefficients. A significant difference is observed between the lowest and highest rates applied. The volatilization factor depends on the level of turbulence above and below the water surface (reaeration coefficients) and is inversely proportional to the height of the water column. Finally, the photodissociation process is unsignificant regarding the low rates applied. Photodissociation is a function of insolation, water turbidity, and height (Table 3). Insolation in the Lom basin is very high (2838 W m−2). However, the turbidity and water height in the Lom River is also very high (respectively, 0.22–4758.00 UTN [4,5] and 0.3–57.5 m), blocking radiations from penetrating the water column. This leads to low photodissociation rates. No significant difference was observed between the different rates applied for photodissociation.

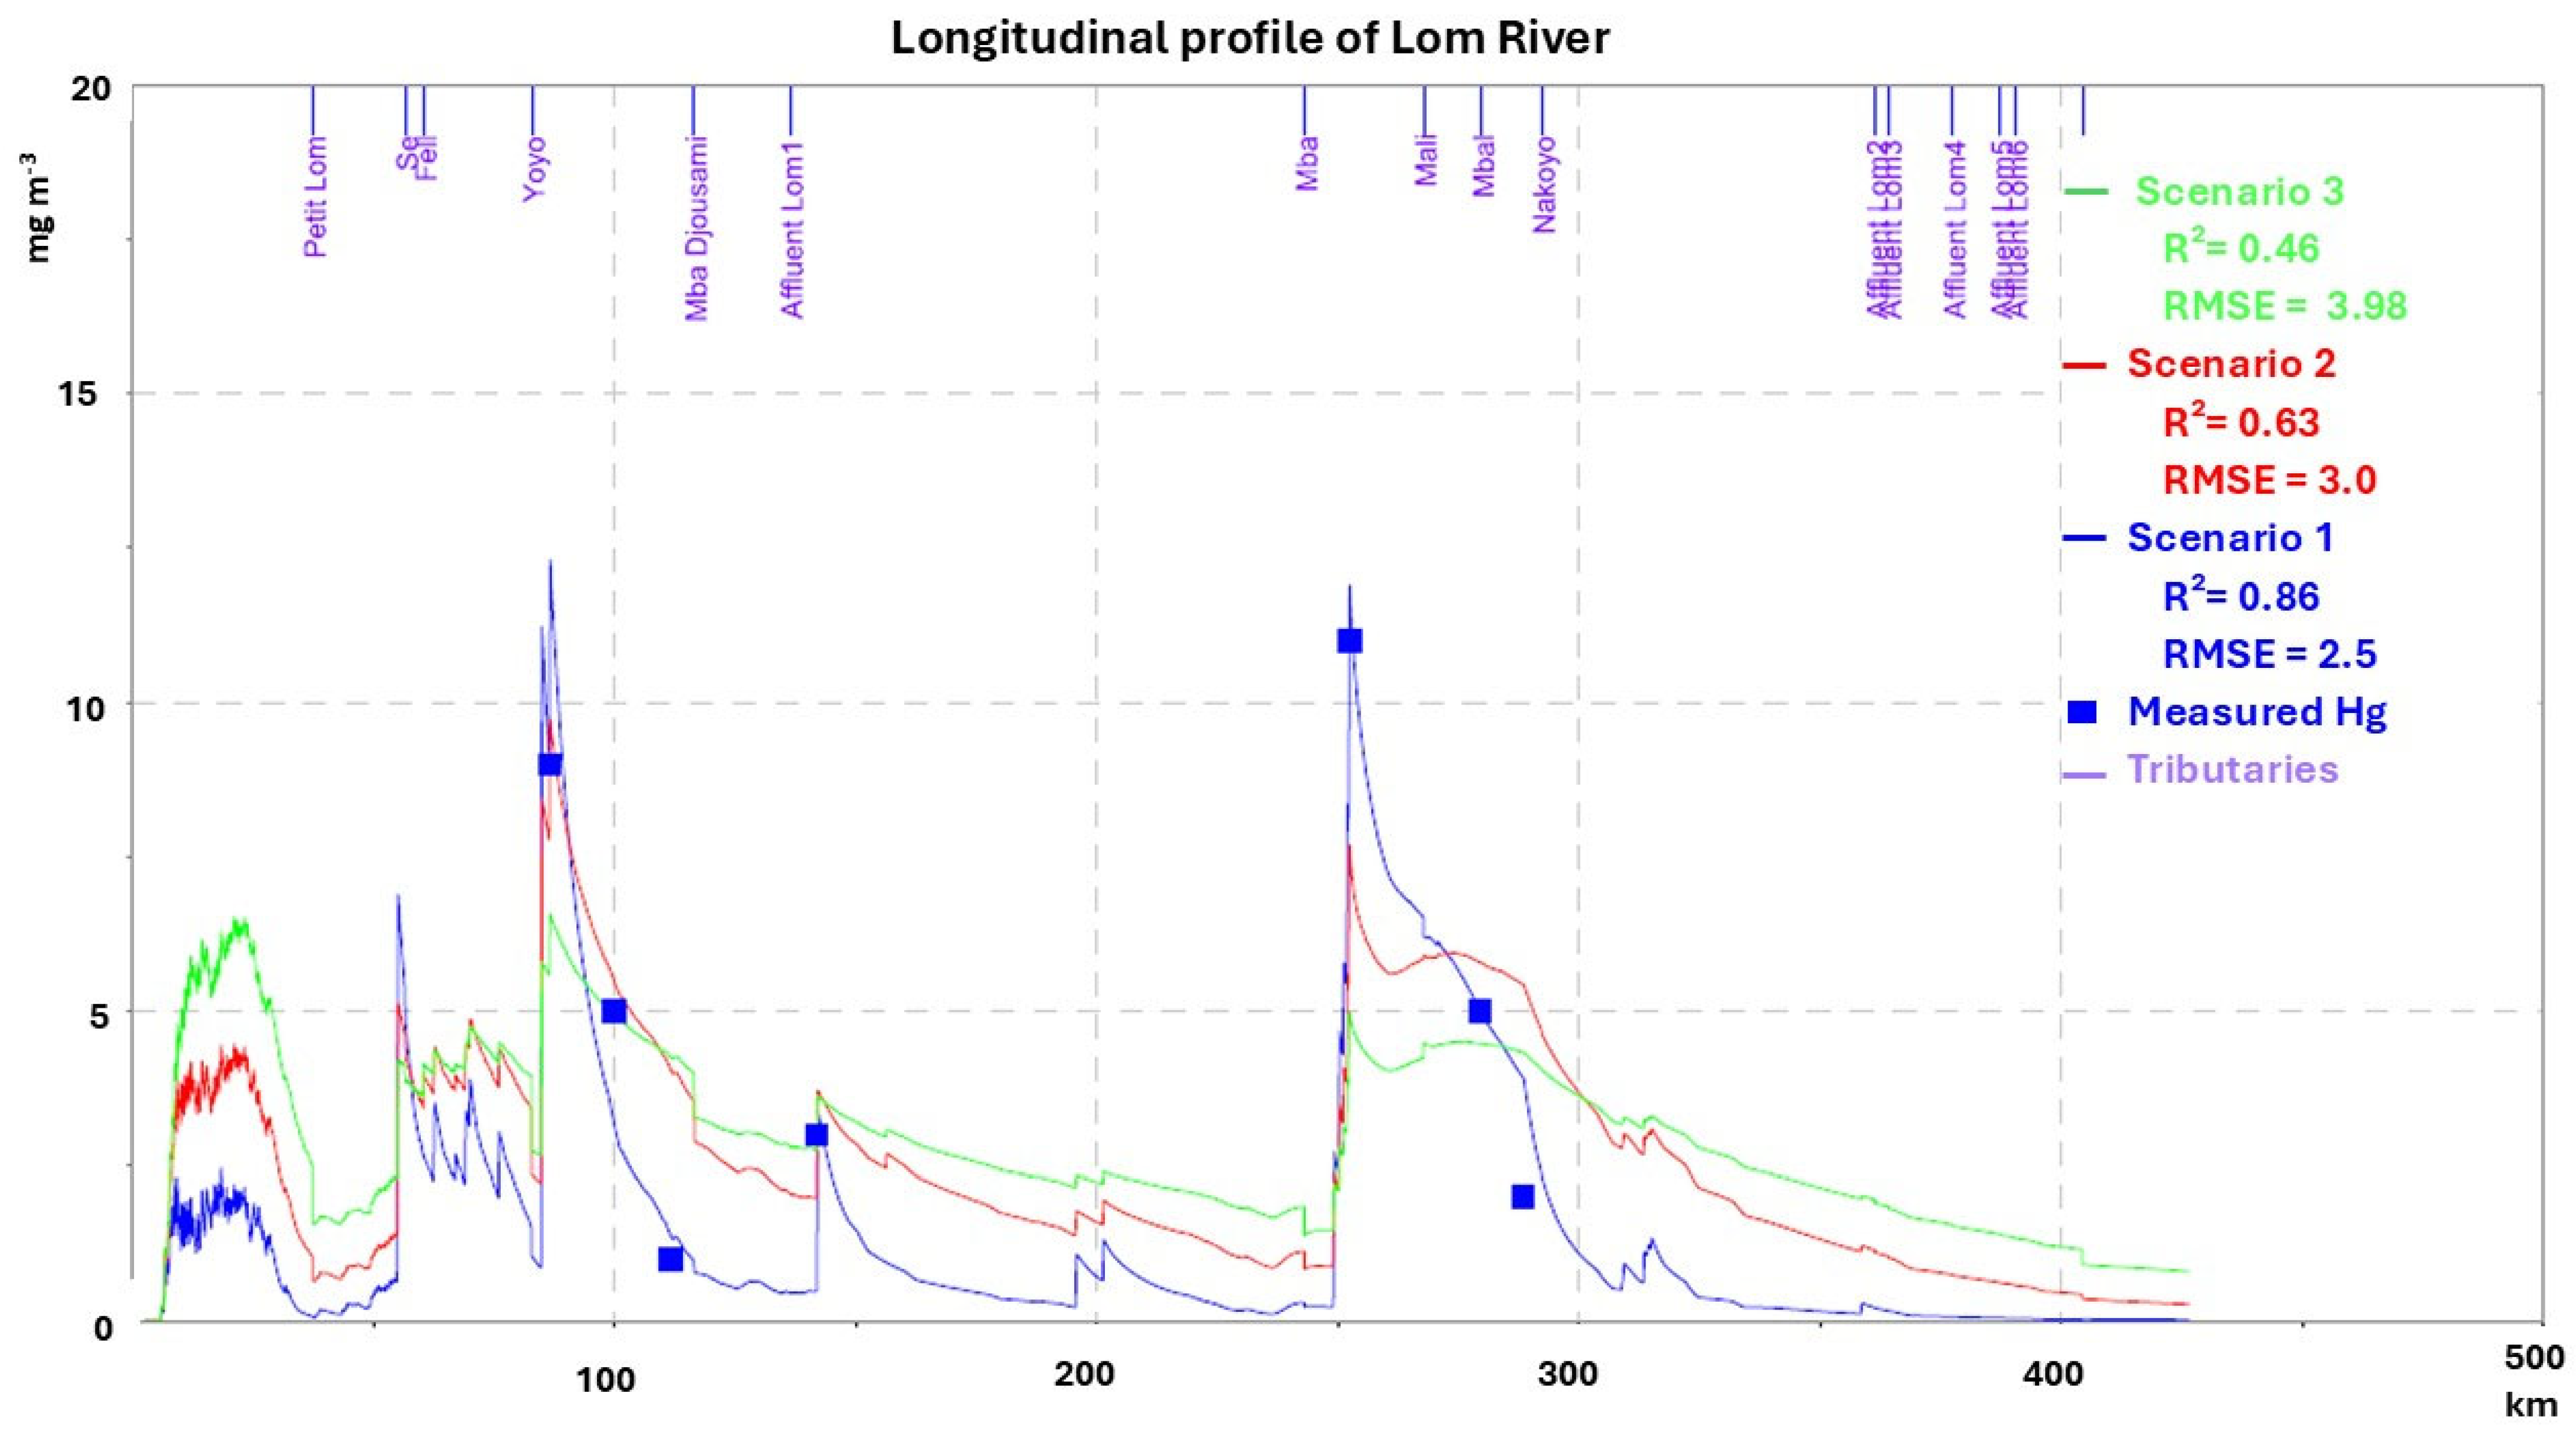
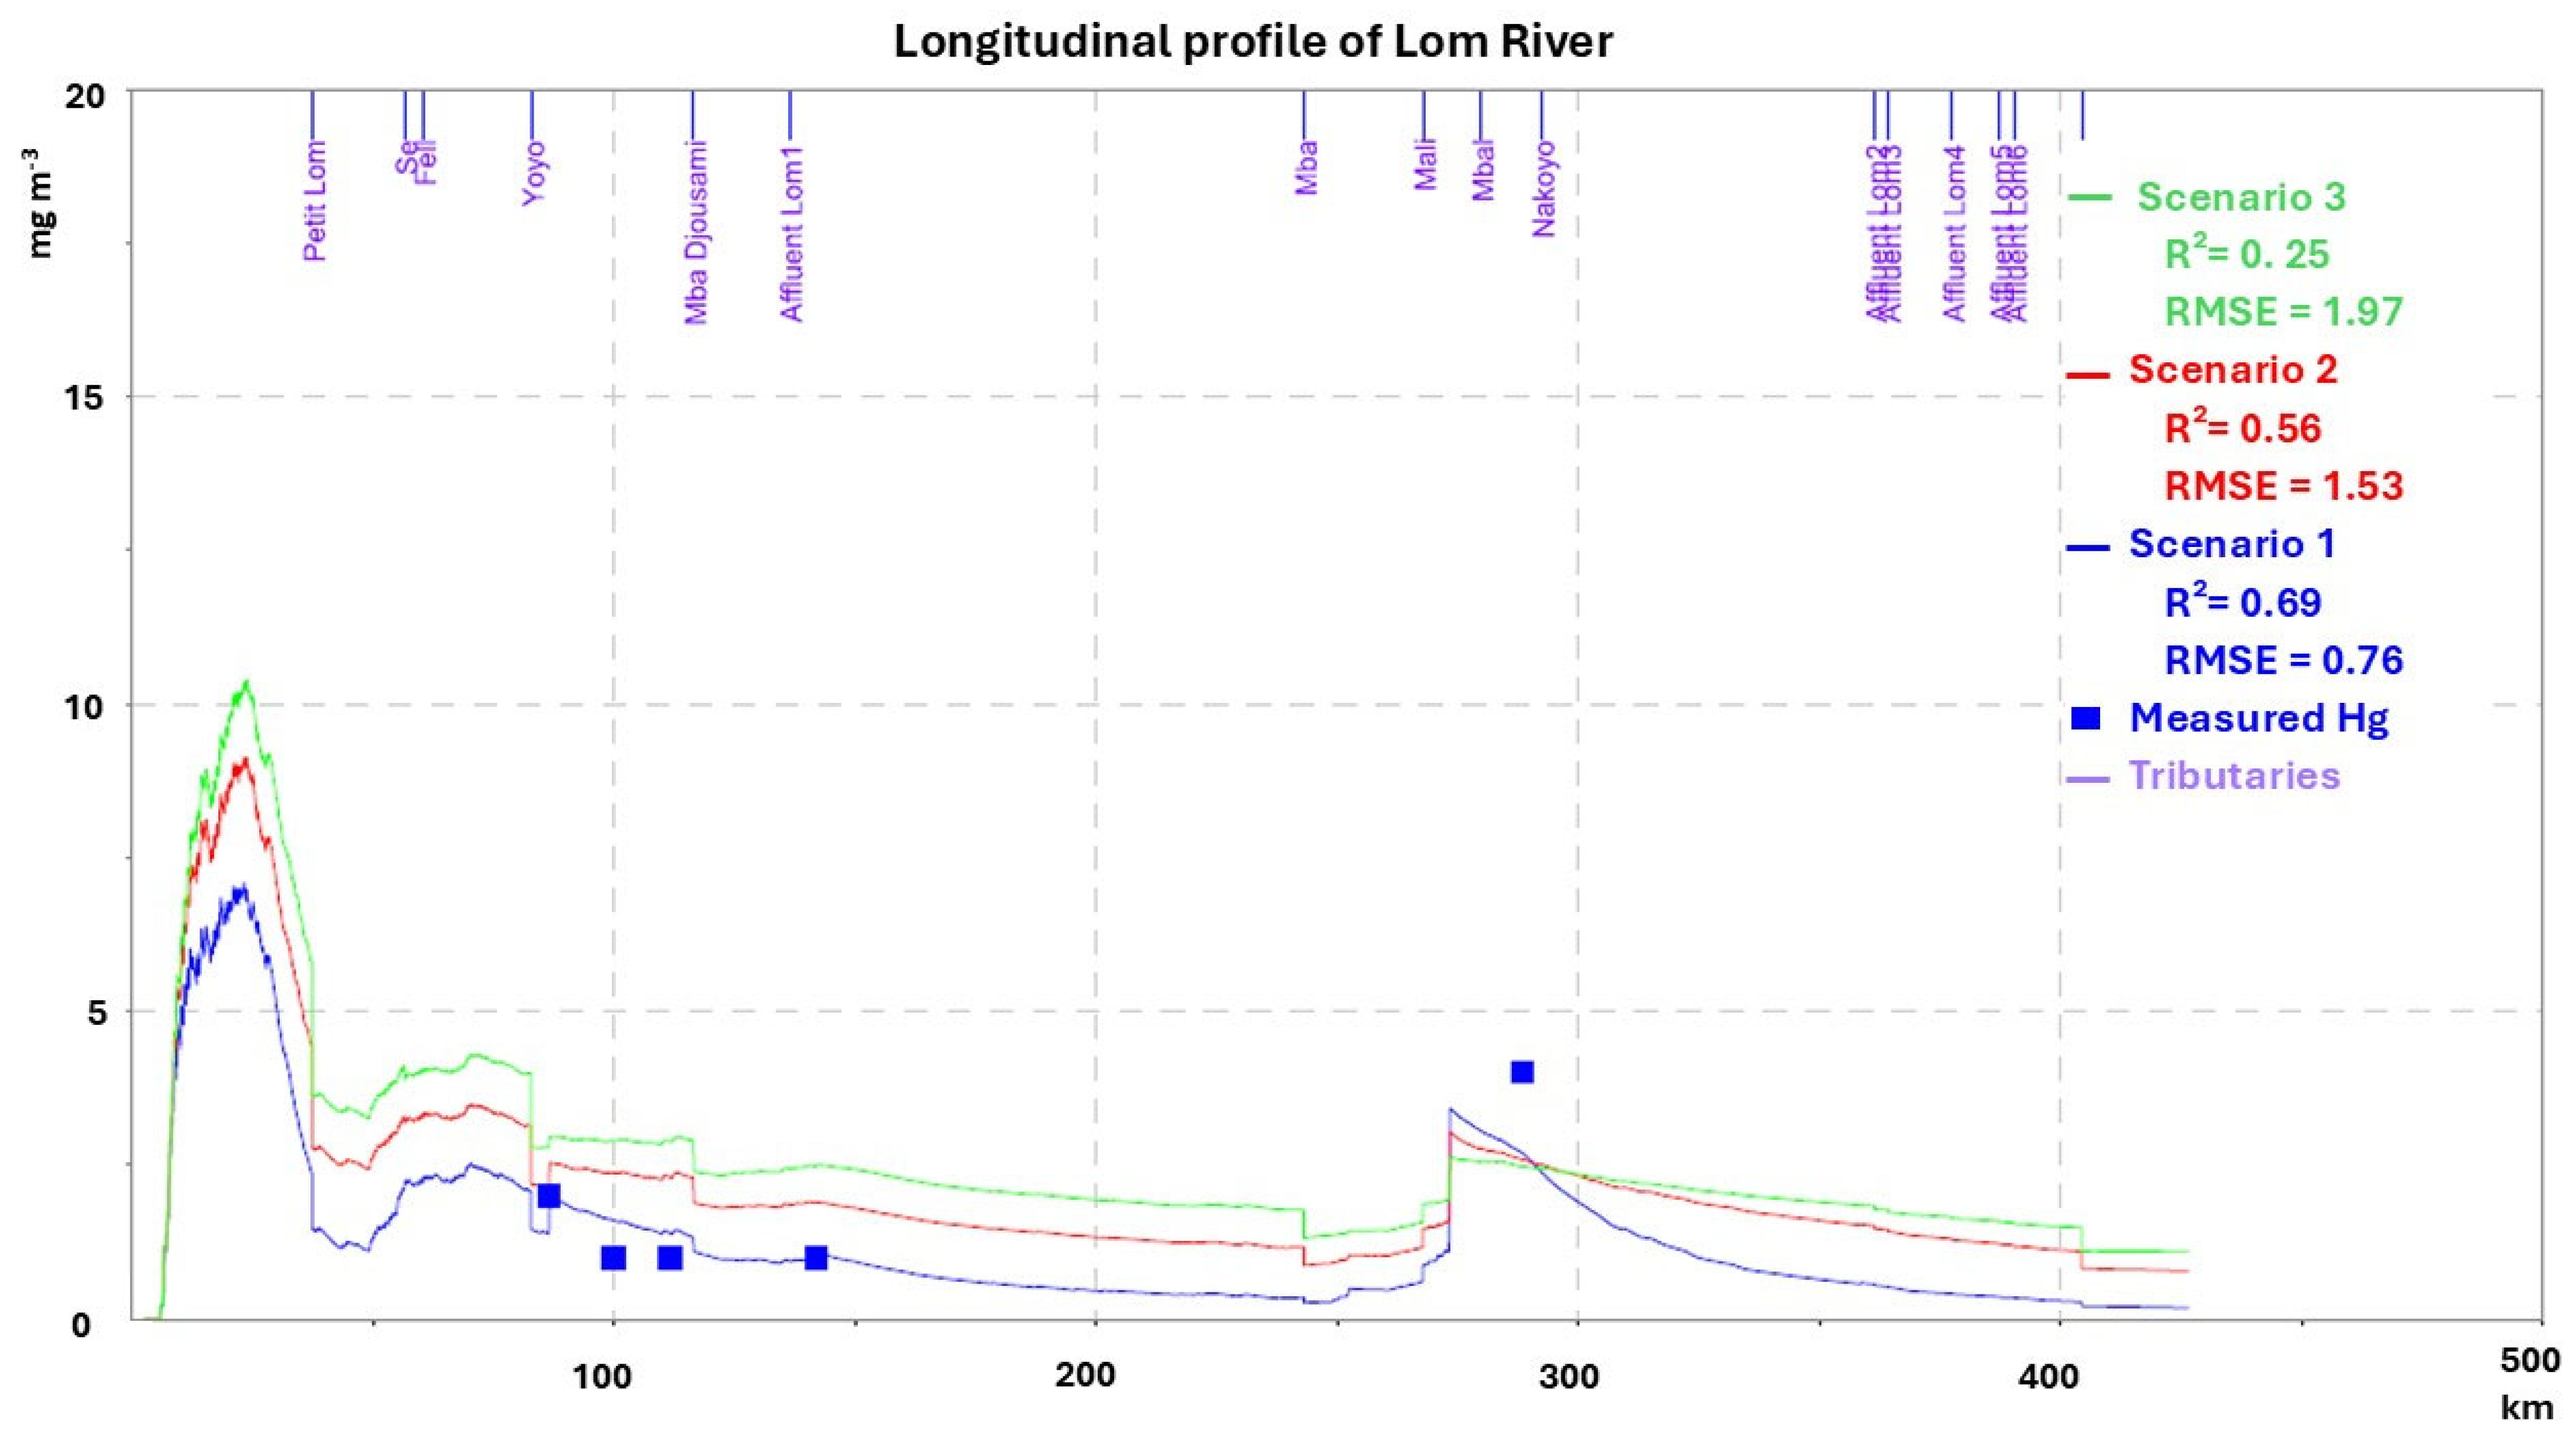
3.3. Assessment of Model Simulation Results

The simulation results were compared with the measured mercury concentrations in the water during the dry season of the year 2021 to assess the model’s validation. Measurements were carried out at seven (M03, M04, M05, M08, B02, B04, and B07) and five (M03, M04, M05, M08, and B07) different sampling sites, respectively, during the dry and rainy seasons. The sampling points were positioned along the Lom River base on the presence of mining sites. Two standard statistical tools were used to assess the fit between the calculations and measurements: the correlation coefficient (R2) and the Root Mean Squared Error (RMSE).

3.3.1. Dry Season

Figure 7 compares the longitudinal profiles of the simulated concentrations with the measurements taken on the 7 March 2021, for the three scenarios. The matches observed between the simulation results and the measured concentrations are good, good, and insufficient, respectively, for scenario 1 (in blue), scenario 2 (in red), and scenario 3 (in green) according to the determination coefficient (R2 = 0.86, 0.63, and 0.46, respectively), where data were available. In scenario 1, concentrations above 2.5 mg m−3 are better represented, while in scenarios 2 and 3, the concentrations between 2.5 and 10 mg m−3 and between 2.5 and 5 mg m−3 are well represented, respectively. The model sometimes slightly underestimates the Hg concentrations at specific points and slightly overestimates the Hg levels at other points, leading to the deviations (RMSE = 2.5, 3.0, and 3.98, respectively, for scenarios 1, 2, and 3) observed between the calculations and measurements. However, the mean error between the calculations and measurements is low for scenarios 1 and 2 (0.7 and 1.6), and the simulated profiles follow the exact trend in field measurements in scenarios 1 and 2.
The results generally indicate good adequation between the calculations and measurements for scenarios 1 and 2, with the best results obtained in scenario 1. The limited number of measurements made it challenging to achieve a better match and the results obtained are therefore considered satisfactory.

3.3.2. Rainy Season

In Figure 8, the calculated Hg concentrations in scenarios 1, 2, and 3 are compared to the measured values of the rainy season on 23 September 2021 for scenarios 1, 2, and 3.
In general, the simulated concentrations are of the same magnitude order as the measured concentrations in the River Lom. The simulation results are good, acceptable, and insufficient, respectively, for scenarios 1 (in blue), 2 (in red), and 3 (in green) according to the determination coefficient (R2 = 0.69, 0.56, and 0.25, respectively), where data were available. The calculated Hg levels at the measured points were slightly overestimated (scenarios 2 and 3) upstream and highly underestimated downstream, but the graph follows the trend in the measurements. Concentrations below 2.5 mg m−3 are better represented than those above for all the scenarios due to a high value measured downstream. This high value was probably measured within the pollution panache, where Hg was not thoroughly mixed with the receiving water. However, the deviations and mean errors between the calculations and measurements are low (RMSE = 0.76, 1.53, and 1.97, and Mean Errors = 0.18, 0.88, and 1.53, respectively, for scenarios 1, 2, and 3) and the simulated profiles follow the shape of the field measurements. Based on the parametrization carried out during the dry season, the model was able to capture the trend in the measured values and to reproduce the river water quality during the rainy season. These results show that the model is effective for calculating this parameter, with the best results obtained for scenario 1. The results are satisfactory, and the model adequately represented the seasonal variability.

3.4. Mercury Transport and Pollution

3.4.1. Spatial Distribution and Seasonal Variation

This section presents the spatial and seasonal dynamics of the measured and simulated Hg concentrations, focusing on the longitudinal evolution during the dry and rainy seasons. The measured parameters were added to the graphs when existing in time and space.
The simulated mercury concentrations vary from 0.00 to 12.30 mg m−3 with a mean value of 1.48 mg m3, from 0.00 to 9.72 mg m−3 with a mean value of 2.58 mg m3, and from 0.00 to 8.79 mg m−3 with a mean value of 5.36 mg m3, respectively, for scenario 1, 2, and 3 during the dry season. During the rainy season, the Hg concentration varies from 0.00 to 7.09 mg m−3 with a mean value of 1.33 mg m3, from 0.00 to 9.14 mg m−3 with a mean value of 2.22 mg m3, and from 0.00 to 10.92 mg m−3 with a mean value of 3.09 mg m3, respectively, for scenario 1, 2, and 3. The measured mercury concentrations vary from 0.00 mg m−3 to 11 mg m−3 with a mean value of 5.14 mg m3 during the dry season and from 0.00 mg m−3 to 4 mg m−3 with a mean value of 1.8 mg m3 during the rainy season. The orders of magnitude of the Hg concentrations found in this study are in concordance with those of Ayiwouo et al. [6,7] upstream of the Lom River in the sector of Ngankombol (1 to 21 mg m−3), of Abende et al. [8] in the sector of Bekao (1 to 50 mg m−3), and of Muresan et al., 4.45 to 8.9 mg m−3 in French Guiana [42]. However, compared to other river systems affected by ASGM [5.6 × 10⁻³ to 0.94 mg m−3 in Senegal [43,44]; 1.2 × 10⁻³ to 3.87 × 10⁻² mg m−3 in China [13], the measured Hg concentrations can be more than a hundred times higher.
In general, Hg concentrations are higher during the dry season than during the rainy season. In fact, during the dry season, the higher simulated peaks of Hg levels are calculated at industrial release points (upstream from 56 km to 150 km and downstream from 250 km to 320 km), while during the rainy season, the highest simulated peak is located at the head of the catchment, between 0 and 37 km. The highest simulated peaks of the dry season are about two times that of the rainy season. This is because during the dry season, the Hg concentration from industrial discharges in the river is very high, and there are low flows (0.25–85.48 m3 s−1 with a mean value of 32.03 m3 s−1) that lead to low dilution. During the rainy season, heavy rainfall increases surface runoff, which enhances the load of pollutants from soil leaching. This leads to peaks in Hg concentration from diffuse input, but the high flow of the season (from 1.55 to 526.39 m3 s−1 with a mean value of 197.26 m3 s−1) dilutes the concentrations of pollutants from mining effluents, balancing the effects of industrial discharge. These calculation results are similar to the observations of Ayiwouo et al. [7,45], where Hg concentrations were generally higher during the dry season due to the intensification of gold mining activities and the reduction in water volume and flow. On the contrary, during the rainy season, the Hg concentration from contaminated mining surfaces increases but the increase in flow and precipitation leads to significant dilution. This reflects the hydrological influence in tropical rivers where significant temporal variations in river discharge between the dry and rainy seasons can result in high fluctuations in pollutant loads [46].
This seasonal dynamic shows that on one side, the influence of industrial discharges is very significant during the dry season. This is due to the intense mining activities that release high Hg concentrations in mining effluents combined with the lower flows and precipitations of the season that do not allow the effectiveness of the dilution process at release points. On the other side, the influence of soil input from contaminated mining surfaces is more significant during the rainy season due to the heavy precipitations that enhance runoff and soil leaching, while the higher flows of the season induce a high dilution of Hg concentrations from both mining effluents and soil leaching.

3.4.2. Assessment of Mercury Pollution: Mineral Micropollutant Index

This section presents an assessment of mercury pollution at the scale of the Lom basin during the dry and rainy seasons for scenario 1. In the absence of Cameroonian standards governing mercury discharges for surface water quality, the mercury concentration threshold of the European Water Quality Evaluation System (SEQ-Eau in French) tool integrated into the PEGASE model is used in this study [47]. The Lom River water quality was assessed according to the mineral micropollutants in its raw water. Five indexes ranging from 0 to 100 and corresponding to aptitude classes in five colors (blue to red) were used. Mineral micropollutants in raw water can affect its biological potential and uses (drinking water production, sports and recreative purposes, irrigation, etc.).
In general, Hg concentrations (Figure 9) are elevated to very high near and downstream from the mining sites (from 0.7 to over 10 mg m−3) in both the dry and rainy seasons. This leads to a suitability index ranging from 0 to 40, corresponding to bad–very bad water quality in these areas. During the dry season, the highest Hg levels are mostly found in the main river, while streams and tributaries sometimes show the highest Hg concentrations during the rainy season. These values are more than 10 times higher than the EQS admissible levels for surface water. The dynamic observed in the Hg levels during the two seasons reflects the increasing dilution process during the rainy season. High flows move the pollution load from upstream to downstream. Furthermore, the lower flow of the dry season facilitates gold mining exploitation over the main river (dragging). In comparison, the higher flow of the rainy season favors mining exploitation in streams and smaller rivers.
However, rivers flowing through urban and agricultural areas generally show low (0.007–0.07 mg/m3) to very low (0.00–0.007 mg/m3) mercury concentrations, corresponding to good (green color) to very good (blue color) water quality indexes. This clearly illustrates that the influence of industrial discharges on Hg concentrations in the surface waters is significant but strictly localized in the surrounding areas of mining sites. These results align with numerous other studies in hydrosystems affected by ASGM [1,7,14,44,48]. In fact, the Hg concentrations (0.01–1.83 mg L−1) found in Wakaso (Adamawa, Cameroon) near mining exploitation areas during the dry season were above EQS limits [45]. The water quality index (QWI = 997.5) and the metal pollution index (107.25–1683.34) obtained in the Lom River at Gankombol indicated unsuitable water for drinking purposes and a critical pollution state [7].

4. Conclusions

The estimation of mercury use and its fate and transport in artisanal small-scale gold mining (ASGM) remains uncertain. The aim of this work was to estimate mercury use in ASGM in the Lom basin during two key periods (intense activity and high water) using a modeling approach. A soil input function approach was used to estimate mercury concentrations from the mining surface. A ratio-based approach was used to estimate mercury releases from industrial effluents using official gold production data and the applied mercury-to-gold ratio. The PEGASE model was used to model mercury transport and pollution in the Lom River and to assess the pressure–impact relationships of ASGM activities on surface water. Field measurements of the Hg concentrations in water samples were carried out during the dry and rainy seasons in 2021 in the Lom River for modeling purposes. For model parametrization, a sensitivity analysis showed that volatilization has a main influence over the predicted mercury concentrations, more so than photodissociation. Three scenarios were executed for estimating mercury use based on different ore processing methods. Scenario 1 (Hg:Ag = 10:1): 7500 and 4200 kg of Hg were used to produce 750 kg and 525 kg of gold during the intense activity and high-water periods, respectively. This scenario showed the best match between its simulated Hg concentration and field measurement (R2 = 0.86 and 0.69, and RMSE = 2.57 and 0.76, respectively). Scenario 2 (Hg:Ag = 6:1): 4500 and 2520 kg of Hg were used, showing a good match (R2 = 0.62 and 0.56, and RMSE = 2.87 and 1.53, respectively). Scenario 3 (Hg:Au = 3:1): 2250 kg and 1260 kg of Hg were used but showed insufficient adequation (R2 = 0.46 and 0.25, and RMSE = 3.98 and 1.97, respectively). The good correspondence between the simulation results and measurements in scenario 1 indicates the extreme Hg use in the Lom basin, with a Hg:Au ratio 1.65 times higher than the average ratio suggested by AMAP in 2012. The seasonal dynamics show that industrial discharges have a significant influence during the dry season due to mining activities that release high mercury concentrations in mining effluents. This is combined with the lower flows and precipitations of the dry season that do not allow the effectiveness of the dilution process at release points. The influence of soil input from contaminated mining surfaces is more significant during the rainy season due to enhanced runoff and soil leaching. The heavy precipitations and higher flows of the season induce a high dilution of Hg concentrations from both mining effluents and soil leaching. According to the best-fitted scenario (scenario 1), Hg concentrations are high (>3 mg m−3) to very high (>10 mg m−3) near and downstream of the mining sites, sometimes exceeding 10 times the permissible EQS levels for surface waters. This results in poor (indexes from 40 to 20) to bad (indexes from 20 to 0) water quality at these locations, which leads to localized mercury pollution. This model has enabled a quantification of the pressure–impact relationships on the Lom basin water resource. If industrial discharges are the main contributors to mercury pollution during the dry season, mining surfaces (geographical areas where gold mines are located) were identified as the main contributors to the total Hg pollution loads during the rainy season. Simulations have allowed the accurate quantification of Hg use in the Lom basin. This study focused on dissolved mercury, but mercury can be present in various forms depending on environmental parameters such as pH and TSS (abundance, type). As a perspective, it would be interesting to extend this study to the modeling of the transport and fate of mercury, including its particulate form.

Author Contributions

Conceptualization, M.S.B.A. and P.M.; methodology, M.S.B.A. and P.M.; software, M.S.B.A. and P.M.; validation, P.M., J.R.N.N. and J.-F.D.; formal analysis, M.S.B.A.; investigation, M.S.B.A.; resources, J.-F.D.; data curation, M.S.B.A. and P.M.; writing—original draft preparation, M.S.B.A.; writing—review and editing, P.M. and J.-F.D.; visualization, P.M., J.R.N.N. and J.-F.D.; supervision, J.-F.D.; project administration, J.-F.D.; funding acquisition, J.-F.D. All authors have read and agreed to the published version of the manuscript.

Funding

This research received no external funding.

Data Availability Statement

Data are available upon request from the corresponding author.

Acknowledgments

We thank the PeGIRE/AQUAPOLE laboratory, Faculty of Science, University of Liege, where this work was conducted, for their supervision and training in the use of the PEGASE model and the analysis of the results. We also thank the Hydrogeology Laboratory of the Department of Earth Sciences, University of Yaoundé, for their documentary and fieldwork support. We also thank the Laboratory of Geochemical Analysis of Water (LAGE) of the Institute of Mining and geological Research (IRGM) of Yaoundé, as well as the laboratory of the International Institute of Tropical Agriculture (IITA), where the samples were analyzed.

Conflicts of Interest

The authors declare no conflicts of interest. The funders had no role in the design of the study; in the collection, analyses, or interpretation of the data; in the writing of the manuscript; or in the decision to publish the results.

References

  1. Ndzana, C.E.; Mvondo, V.Y.E.; Tchouta, K.D.; Ngatcha, B.N. Assessment of the Impact of Small-Scale Mining on Soil Contamination by Mercury and Hydrocarbons in the Kadey Catchment (East Cameroon). Heliyon 2023, 9, e18786. [Google Scholar] [CrossRef] [PubMed]
  2. UNEP. UNEP Global Mercury Assessment 2018; UNEP–UN Environment Programme Chemicals and Health Branch: Geneva, Switzerland, 2018; p. 62. [Google Scholar]
  3. Bella Atangana, M.; Ndam Ngoupayou, J.; Deliege, J.-F. Hydrogeochemistry and Mercury Contamination of Surface Water in the Lom Gold Basin (East Cameroon): Water Quality Index, Multivariate Statistical Analysis and Spatial Interpolation. Water 2023, 15, 2502. [Google Scholar] [CrossRef]
  4. Rakotondrabe, F.; Ngoupayou, J.R.N.; Mfonka, Z.; Rasolomanana, E.H.; Nyangono Abolo, A.J.; Asone, B.L.; Ako Ako, A.; Rakotondrabe, M.H. Assessment of Surface Water Quality of Bétaré-Oya Gold Mining Area (East-Cameroon). JWARP 2017, 9, 960–984. [Google Scholar] [CrossRef]
  5. Rakotondrabe, F.; Ndam Ngoupayou, J.R.; Mfonka, Z.; Rasolomanana, E.H.; Nyangono Abolo, A.J.; Ako Ako, A. Water Quality Assessment in the Bétaré-Oya Gold Mining Area (East-Cameroon): Multivariate Statistical Analysis Approach. Sci. Total Environ. 2018, 610–611, 831–844. [Google Scholar] [CrossRef]
  6. Ngounouno Ayiwouo, M.; Mambou Ngueyep, L.L.; Mache, J.R.; Takougang Kingni, S.; Ngounouno, I. Waters of the Djouzami Gold Mining Site (Adamawa, Cameroon): Physicochemical Characterization and Treatment Test by Bana Smectite (West, Cameroon). Case Stud. Chem. Environ. Eng. 2020, 2, 100016. [Google Scholar] [CrossRef]
  7. Ayiwouo, N.M.; Yamgouot, F.N.; Ngueyep Mambou, L.L.; Kingni, S.T.; Ngounouno, I. Impact of Gold Mining on the Water Quality of the Lom River, Gankombol, Cameroon. Heliyon 2022, 8, e12452. [Google Scholar] [CrossRef]
  8. Abende Sayom, Y.R.; Mefomdjo, B.F.; Tarkwa, J.-B.; Sop, B.T.; Ngueyep, L.L.M.; Tchuikoua, B.L.; Meying, A. Comprehensive Water Quality and Heavy Metal Pollution Assessment of the Lom River in Bekao Gold Mining Sites (Adamawa-Cameroon) Using the Pollution Indices and Multivariate Statistical Approach. Water Air Soil. Pollut. 2023, 234, 653. [Google Scholar] [CrossRef]
  9. Ayiwouo, M.N.; Kingni, S.T.; Mambou, L.L.N.; Ngounouno, I.; Iqtadar, H. Modelling of Heavy Metals Transport along the Lom River in the Mining Site of Gankombol (Adamawa Cameroon). Int. J. Environ. Sci. Technol. 2022, 19, 10793–10808. [Google Scholar] [CrossRef]
  10. Carmouze, J.-P.; Lucotte, M.; Boudou, A. Le Mercure en Amazonie: Rôle de L’homme et de L’environnement, Risques Sanitaires; Expertise collégiale; IRD Éditions: Paris, France, 2001; ISBN 978-2-7099-1467-3. [Google Scholar]
  11. Ullrich, S.M.; Tanton, T.W.; Abdrashitova, S.A. Mercury in the Aquatic Environment: A Review of Factors Affecting Methylation. Crit. Rev. Environ. Sci. Technol. 2001, 31, 241–293. [Google Scholar] [CrossRef]
  12. Clarke, R.G.; Klapstein, S.J.; Keenan, R.; O’Driscoll, N.J. Mercury Photoreduction and Photooxidation Kinetics in Estuarine Water: Effects of Salinity and Dissolved Organic Matter. Chemosphere 2023, 312, 137279. [Google Scholar] [CrossRef]
  13. Cao, S.; Liang, S.; Li, Y. Adsorption and Environmental Behavior of Mercury on Suspended Particulate Matter from the Yellow River and Xiaoqing River Estuaries. Sci. Total Environ. 2023, 893, 164860. [Google Scholar] [CrossRef] [PubMed]
  14. Malm, O.; Castro, M.B.; Bastos, W.R.; Branches, F.J.P.; Guimarães, J.R.D.; Zuffo, C.E.; Pfeiffer, W.C. An Assessment of Hg Pollution in Different Goldmining Areas, Amazon Brazil. Sci. Total Environ. 1995, 175, 127–140. [Google Scholar] [CrossRef]
  15. Diringer, S.E.; Feingold, B.J.; Ortiz, E.J.; Gallis, J.A.; Araújo-Flores, J.M.; Berky, A.; Pan, W.K.Y.; Hsu-Kim, H. River Transport of Mercury from Artisanal and Small-Scale Gold Mining and Risks for Dietary Mercury Exposure in Madre de Dios, Peru. Environ. Sci. Process. Impacts 2015, 17, 478–487. [Google Scholar] [CrossRef] [PubMed]
  16. Moreno-Brush, M.; Vega, C.; Fernandez Luis, E. Monitoring of Mercury and Mercury Compounds in and Around Artisanal and Small-Scale Gold Mining Sites Technical Background Document | Minamata Convention on Mercury; UNEP/MC/COP.5/INF/9; Centro de Innovación Científica Amazónica (CINCIA): Madre de Dios, Peru, 2023; p. 67. [Google Scholar]
  17. O’Neill, J.D.; Telmer, K. Estimating Mercury Use and Documenting Practices in Artisanal and Small-Scale Gold Mining (ASGM); UN Environment: Geneva, Switzerland, 2020; ISBN 978-0-9939459-8-4. [Google Scholar]
  18. Schwartz, M.; Smits, K.; Phelan, T. Quantifying Mercury Use in Artisanal and Small-Scale Gold Mining for the Minamata Convention on Mercury’s National Action Plans: Approaches and Policy Implications. Environ. Sci. Policy 2023, 141, 1–10. [Google Scholar] [CrossRef]
  19. WFD. WFD Directive—2000/60–EN–Water Framework Directive–EUR-Lex; WFD: London, UK, 2000. [Google Scholar]
  20. Tsakiris, G.; Alexakis, D. Water Quality Models: An Overview. Eur. Water 2012, 37, 33–46. [Google Scholar]
  21. Zhu, S.; Zhang, Z.; Žagar, D. Mercury Transport and Fate Models in Aquatic Systems: A Review and Synthesis. Sci. Total Environ. 2018, 639, 538–549. [Google Scholar] [CrossRef]
  22. Deliège, J.-F.; Everbecq, E.; Magermans, P.; Grard, A.; Bourouag, M.; Blockx, C. PEGASE, A Software Dedicated to Surface Water Quality Assessment and to European Database Reporting. In Towarde eEnvironment; Masaryk University: Brno, Czech Republic, 2009; pp. 24–32. [Google Scholar]
  23. Olivry, J.-C. Fleuves et Rivières du Cameroun; Collection “Monographies Hydrologiques ORSTOM”; Ministère de l’enseignement Supérieur et de la Recherche Scientifique au Cameroun; ORSTOM: Paris, France, 1986; ISBN 978-2-7099-0804-7. [Google Scholar]
  24. Mimba, M.E.; Ohba, T.; Nguemhe Fils, S.C.; Wirmvem, M.J.; Tibang, E.E.B.; Nforba, M.T.; Togwa Aka, F. Regional Hydrogeochemical Mapping for Environmental Studies in the Mineralized Lom Basin, East Cameroon: A Pre-Industrial Mining Survey. Hydrology 2017, 5, 15. [Google Scholar] [CrossRef]
  25. Ngako, V.; Affaton, P.; Nnange, J.M.; Njanko, T. Pan-African Tectonic Evolution in Central and Southern Cameroon: Transpression and Transtension during Sinistral Shear Movements. J. Afr. Earth Sci. 2003, 36, 207–214. [Google Scholar] [CrossRef]
  26. Tchindjang, M.; Philippes, M.; Unusa, H.; Eric, V.; Igor, N.; Saha, F. Mines Contre Forêts et Conservation Au Cameroun: Enjeux de l’évaluation Environnementale Du Secteur Minier Pour Le Développement Durable Au Cameroun. In Proceedings of the 20 ème Colloque International en Evaluation Environnementale, Antananarivo, Madagascar, 9 January 2017. [Google Scholar]
  27. Jean, R.; Bernard, L.; Nicole, M.; Bernard, L. L’analyse de L’eau, 9th ed.; Dunod: Paris, France, 2009; ISBN 978-2-10-007246-0. [Google Scholar]
  28. Deliege, J.-F.; Everbecq, E.; Magermans, P.; Grard, A.; Bourouag, T.; Blockx, C.; Smitz, J. Pegase, An Integrated River/Basin Model Dedicated To Surface Water Quality Assessment: Application To Cocaine. Acta Clin. Belg. 2010, 65, 42–48. [Google Scholar] [CrossRef]
  29. Grard, A.; Everbecq, E.; Magermans, P.; Bourouag, M.; Deliège, J.-F. Transnational Modelling of the Meuse District with PegOpera Simulation Software. Int. J. River Basin Manag. 2014, 12, 251–263. [Google Scholar] [CrossRef]
  30. Boukari, A.; Benabdallah, S.; Everbecq, E.; Magermans, P.; Grard, A.; Habaieb, H.; Deliège, J.-F. Assessment of Agriculture Pressures Impact on the Joumine River Water Quality Using the PEGASE Model. Environ. Manag. 2019, 64, 520–535. [Google Scholar] [CrossRef] [PubMed]
  31. Everbecq, E.; Gosselain, V.; Viroux, L.; Descy, J.-P. Potamon: A Dynamic Model for Predicting Phytoplankton Composition and Biomass in Lowland Rivers. Water Res. 2001, 35, 901–912. [Google Scholar] [CrossRef] [PubMed]
  32. Suh, C.E.; Lehmann, B.; Mafany, G.T. Geology and Geochemical Aspects of Lode Gold Mineralization at Dimako–Mboscorro, SE Cameroon. GEEA 2006, 6, 295–309. [Google Scholar] [CrossRef]
  33. Vishiti, A.; Etame, J.; Suh, C.E. Features of Gold-Bearing Quartz Veins in an Artisanal Mining-Dominated Terrain, Batouri Gold District, Eastern Region of Cameroon. Episodes 2019, 42, 199–212. [Google Scholar] [CrossRef]
  34. Azeuda Ndonfack, K.I.; Xie, Y.; Goldfarb, R.; Zhong, R.; Qu, Y. Genesis and Mineralization Style of Gold Occurrences of the Lower Lom Belt, Bétaré Oya District, Eastern Cameroon. Ore Geol. Rev. 2021, 139, 104586. [Google Scholar] [CrossRef]
  35. AMAP/UN Environment Technical Background Report for the Global Mercury Assessment 2018|AMAP. Available online: https://www.amap.no/documents/doc/technical-background-report-for-the-global-mercury-assessment-2018/1815 (accessed on 3 December 2024).
  36. Everbecq, E.; Deliège, J.-F.; Bourouag, M.; Markatos, M. PIRENE: Programme Intégré de Recherche Environnement-Eau: Partims ‘ Elaboration du Module Qualité des Eaux de Surface ‘et ‘Elaboration du Modèle Intégré MOIRA (Modèle Intégré Pour Les Ressources Aquatiques)’—Rapport Final 2001–2005; University of Liège: Liège, Belgium, 2005. [Google Scholar]
  37. Carroll, R.W.H.; Warwick, J.J.; Heim, K.J.; Bonzongo, J.C.; Miller, J.R.; Lyons, W.B. Simulation of Mercury Transport and Fate in the Carson River, Nevada. Ecol. Model. 2000, 125, 255–278. [Google Scholar] [CrossRef]
  38. Carroll, R.W.H.; Warwick, J.J. Uncertainty Analysis of the Carson River Mercury Transport Model. Ecol. Model. 2001, 137, 211–224. [Google Scholar] [CrossRef]
  39. Ambrose, R.B., Jr.; Tsiros, I.X.; Wool, T.A. Modeling Mercury Fluxes and Concentrations in a Georgia Watershed Receiving Atmospheric Deposition Load from Direct and Indirect Sources. J. Air Waste Manag. Assoc. 2005, 55, 547–558. [Google Scholar] [CrossRef]
  40. Knightes, C. Development and Test Application of a Screening-Level Mercury Fate Model and Tool for Evaluating Wildlife Exposure Risk for Surface Waters with Mercury-Contaminated Sediments (SERAFM). Environ. Model. Softw. 2008, 23, 495–510. [Google Scholar] [CrossRef]
  41. Knightes, C.D.; Ambrose, R.B.; Avant, B.; Han, Y.; Acrey, B.; Bouchard, D.C.; Zepp, R.; Wool, T. Modeling Framework for Simulating Concentrations of Solute Chemicals, Nanoparticles, and Solids in Surface Waters and Sediments: WASP8 Advanced Toxicant Module. Env. Model. Softw. 2019, 111, 444–458. [Google Scholar] [CrossRef]
  42. Muresan, B.; Cossa, D.; Richard, S.; Burban, B. Mercury Speciation and Exchanges at the Air–Water Interface of a Tropical Artificial Reservoir, French Guiana. Sci. Total Environ. 2007, 385, 132–145. [Google Scholar] [CrossRef] [PubMed]
  43. Niane, B.; Moritz, R.; Guédron, S.; Ngom, P.M.; Pfeifer, H.R.; Mall, I.; Poté, J. Effect of Recent Artisanal Small-Scale Gold Mining on the Contamination of Surface River Sediment: Case of Gambia River, Kedougou Region, Southeastern Senegal. J. Geochem. Explor. 2014, 144, 517–527. [Google Scholar] [CrossRef]
  44. Niane, B.; Guédron, S.; Feder, F.; Legros, S.; Ngom, P.M.; Moritz, R. Impact of Recent Artisanal Small-Scale Gold Mining in Senegal: Mercury and Methylmercury Contamination of Terrestrial and Aquatic Ecosystems. Sci. Total Environ. 2019, 669, 185–193. [Google Scholar] [CrossRef] [PubMed]
  45. Ngounouno Ayiwouo, M.; Ngueyep, L.L.M.; Kingni, S.T.; Nforsoh, S.N.; Ngounouno, I. Evaluation of the Impact of Gold Mining Activities on the Waters and Sediments of Lom River, Wakaso, Cameroon and the Restorative Effect of Moringa Oleifera Seeds. Appl. Water Sci. 2021, 11, 113. [Google Scholar] [CrossRef]
  46. Moreno-Brush, M.; McLagan, D.S.; Biester, H. Fate of Mercury from Artisanal and Small-Scale Gold Mining in Tropical Rivers: Hydrological and Biogeochemical Controls. A Critical Review. Crit. Rev. Environ. Sci. Technol. 2020, 50, 437–475. [Google Scholar] [CrossRef]
  47. Oudin, L.C.; Maupas, D.; L’eau, A.D. Système d’évaluation de La Qualité de l’eau Des Cours d’eau (Seq-Eau); MEDD Agences de l’eau: Lyon, France, 2003. [Google Scholar]
  48. Mandizha, N.T.; Kugara, J.; Mombeshora, E.T.; Zaranyika, M.F. Elemental Composition and Speciation Trends in Upper Mazowe River, a Typical Sub-Tropical River Ecosystem Impacted by Gold Mining and Agriculture in Zimbabwe. Environ. Adv. 2023, 14, 100443. [Google Scholar] [CrossRef]
Figure 1. Location map of the Lom basin showing sampling stations and river network.
Hydrology 12 00077 g001
Figure 2. Map showing industrial mining discharge point distribution along the Lom River (upstream).
Hydrology 12 00077 g002
Figure 3. Land use change using Google Earth Pro and ArcGIS Pro.
Hydrology 12 00077 g003
Figure 4. Estimated mercury use in ore processing during the washing days of intense mining activity and high-water periods.
Hydrology 12 00077 g004
Figure 5. Sensitivity of simulated mercury concentration to volatilization rates.
Hydrology 12 00077 g005
Figure 6. Sensitivity of simulated mercury concentration to photodissociation rates.
Hydrology 12 00077 g006
Figure 7. Scenarios of estimated mercury used during the dry season.
Hydrology 12 00077 g007
Figure 8. Scenarios of estimated mercury used during the rainy season.
Hydrology 12 00077 g008
Figure 9. Level of mercury concentrations in the Lom River and its tributaries from very low to high based on the European Water Quality Evaluation System (SEQ-Eau) and water quality index from very bad to very good.
Hydrology 12 00077 g009
Table 1. Model input data sources for the Lom basin.
Data TypeResponsible Authorities/ReferencesDate
GeographicAdministrative boundariesEarth Explorer
IRD map library
2015–2016
2021
Digital Elevation Model
Land use
PopulationPopulationNational Institute of Statistics (INS)2010
Industrial
discharges
Mining site locationsArtisan Mining Support and Promotion Framework (CAPAM)/Ministry of Mines, Industry and Technological Development2019
Mercury amalgamation practice
LivestockCattle and pigs by districtCameroon Ministry of Livestock, Fisheries and Animal Industries2021
Hydro-
meteorological
Flow ratesHydrological Research Center1951–2023
Water depths
Daily rainfallNational Meteorological Office/global weather website1979–2023
Daily insolation
Water temperature
Table 3. Parametrization of the micropollutant sub-model.
ParameterValueUnit of Measure
Soil leaching functions for mercury concentration in mining surface 25mg m−3
Number of people equivalent0.1mg PE−1 d−1
Porcine livestock unit in pasture1.0mg lsu−1 d−1
Bovine livestock unit in stable1.0mg lsu−1 d−1
Discharge adsorbed on sediment0.2
Q10 degradation rate variation1
Volatilization factor0.05–4
Photodissociation rate at 100 W0.002–0.015d−1
Sedimentation rate of suspended matter0.8m d−1
Dissolved–bound transfer rate0.5d−1
Bound–dissolved transfer rate0.3d−1
Bottom adsorption rate0.25m d−1
High saturation constant for bottom adsorption0.2mg m−3
Low saturation constant for bottom adsorption5.0mg m−3
Minimum concentration for dissolved calculation1 × 10−6mg m−3
Minimum concentration for particulate calculation1 × 10−6mg m−3
Molar mass200.59g mol−1
Electric charge2.0
Molar ionic conductivity0.01272S·m2 mol−1
Turbidity 0.22–4758NTU
Total dissolved solids (TSS)2.62–452mg L−1
Insolation2838W m−2
Water height0.3–57.5m
Velocity 0.16–1.65m s−1
Temperature 21.26–26.91°C
Disclaimer/Publisher’s Note: The statements, opinions and data contained in all publications are solely those of the individual author(s) and contributor(s) and not of MDPI and/or the editor(s). MDPI and/or the editor(s) disclaim responsibility for any injury to people or property resulting from any ideas, methods, instructions or products referred to in the content.

