Article

Assessment of Satellite-Based Rainfall Products for Flood Modeling in the Ouémé River Basin in Benin (West Africa)

1
Laboratoire de Sciences des Matériaux et Modélisation, Faculté des Sciences et Techniques, Université d’Abomey-Calavi, Abomey-Calavi, Cotonou 01BP526, Benin
2
Department of Civil & Environmental Engineering, College of Engineering, University of Wisconsin–Madison, 1415 Engineering Dr, Madison, WI 53706, USA
3
Institut National de l’Eau, Université d’Abomey-Calavi, Abomey-Calavi, Cotonou 01BP526, Benin
4
Laboratoire d’Ecologie Appliquée, Faculté des Sciences Agronomique, Université d’Abomey-Calavi, Abomey-Calavi, Cotonou 01BP526, Benin
*
Author to whom correspondence should be addressed.
Hydrology 2025, 12(4), 71; https://doi.org/10.3390/hydrology12040071
Submission received: 15 February 2025 / Revised: 8 March 2025 / Accepted: 10 March 2025 / Published: 27 March 2025
(This article belongs to the Section Hydrological and Hydrodynamic Processes and Modelling)

Abstract

:
Reliable rainfall data are critical for managing hydrometeorological hazards in West Africa, yet they are often sparse and temporally inconsistent. The current study assessed the accuracy of four near real-time satellite-based rainfall data, namely IMERGv7 Late, IMERGv6 Early, GSMAP-NRT and PERSIANN-DIR Now, for rainfall estimation and hydrological modeling in the Ouémé basin. These datasets were compared with ground-based rainfall data, bias-corrected and used to calibrate and validate the hydrological model HBV light. While they demonstrated qualitative accuracy, their quantitative estimation shows obvious discrepancies on a daily scale, varying across subdomains. The original IMERGv7 product outperforms others in capturing the rainfall pattern and amount (KGE > 0.6), while GSMAP performs moderately (KGE ≈ 0.51) and IMERGv6 and PERSIANN show lower reliability with KGE < 0.5. Quantile mapping emerges as the most effective bias-correction method, improving the performance of all satellite products, with RMSE reductions ≤ 15%. The results of hydrological simulations demonstrate the potential of satellite-based rainfall, particularly IMERGv7 and corrected IMERGv6 (NSE > 0.75), for near real-time flood monitoring and water management in the study area. This study underscores their suitability as valuable alternatives to ground-based data for flood management decision making in the Ouémé basin.

1. Introduction

The past decade has witnessed significant shifts in natural disaster patterns, driven by natural and anthropogenic factors [1]. This phenomenon is likely to become more severe in future climates. It therefore emphasizes the need for risk management strategies to control the impacts of hydrometeorological disasters [2,3,4]. Intensified rainfall variability and rising temperatures particularly affected West Africa, especially in the Sahel and coastal areas where droughts and floods are consequently increasingly frequent [5,6,7,8].
Rainfall data are a critical input for managing hydrometeorological hazards [9,10,11]. However, ground-based rainfall measurements are often sparse and temporally inconsistent in West Africa [12]. In the same vein, the Ouémé River basin in Benin is characterized by limited gauge coverage and data gaps [13]. To fill those gaps, satellite products have become a valuable data source for hydrological and hydrodynamic applications and risk management; they further ensure the availability of rainfall data in near real-time at high spatial and temporal resolutions [14,15]. However, they vary in accuracy based on time, location, season and resolution [16,17], and therefore, require local validation against ground-based data and, often, bias correction to improve their reliability for applications such as flood simulation [18,19,20].
Previous studies have validated satellite rainfall data across Africa, focusing on both rainfall estimation and flow simulation. They show dependence on the product used, the spatial and temporal scale, the region of interest and the problem studied [17,21,22]. Some authors support the use of satellite data for flow simulation, especially in data-scarce basins [23]. It is been shown that good performance is usually observed in datasets that merge satellite and gauge observations such as GPCP rainfall to simulate river discharge in West Africa [24,25]. However, the application of satellite-based rainfall in hydrological modeling remains challenging due to accuracy limitations [17]. This made studies recommend correction on daily or finer scales to improve the reliability of the satellite-only products and to substitute missing data in ground-based time series for hydrological/hydrodynamic modeling [25,26,27]. On a much more local scale, studies have investigated the accuracy of reanalysis data through a comparison with ground-based data in Benin and a hydrological evaluation in the Ouémé River basin [28,29]. Despite their promising application, reanalysis data are proven to be less reliable than satellite-based rainfall data during the wet season and on fine time scales [21]. In addition, they often underperform satellite-based data in capturing extreme rainfall events [17,20]. Moreover, unlike reanalysis data, only-satellite products (without gauge correction) usually have the advantage of near real-time availability for real-time monitoring and risk forecasting.
As far as our knowledge is concerned, no study focuses on the application of near real-time satellite-based rainfall datasets in hydrology in the Ouémé River basin. Former studies evaluated satellite rainfall on the global scale of Africa and West Africa. But those conducted on the local scale focus on river basins other than the Ouémé and/or on reanalysis data. The current study has the particularity, not only to use near-real-time satellite-based rainfall but also to be focused on the local scale of the Ouémé River basin. It is the first study that validates these datasets for hydrological modeling in this basin. It was carried out as a prelude to using satellite rainfall data in hydrodynamic modeling for flood study in the Ouémé basin in Benin. It aimed to assess their potential for rainfall estimation and for hydrological modeling from 2001 to 2018. It was conducted in three stages: (1) a comparison of the satellite data with ground-measured data; (2) an analysis of the bias correction of satellite data; and (3) a hydrological assessment of corrected and uncorrected satellite data. The following sections present successively the study area, the data used, the methodology adopted, the results obtained and their discussion and the conclusions drawn.

2. Materials and Methods
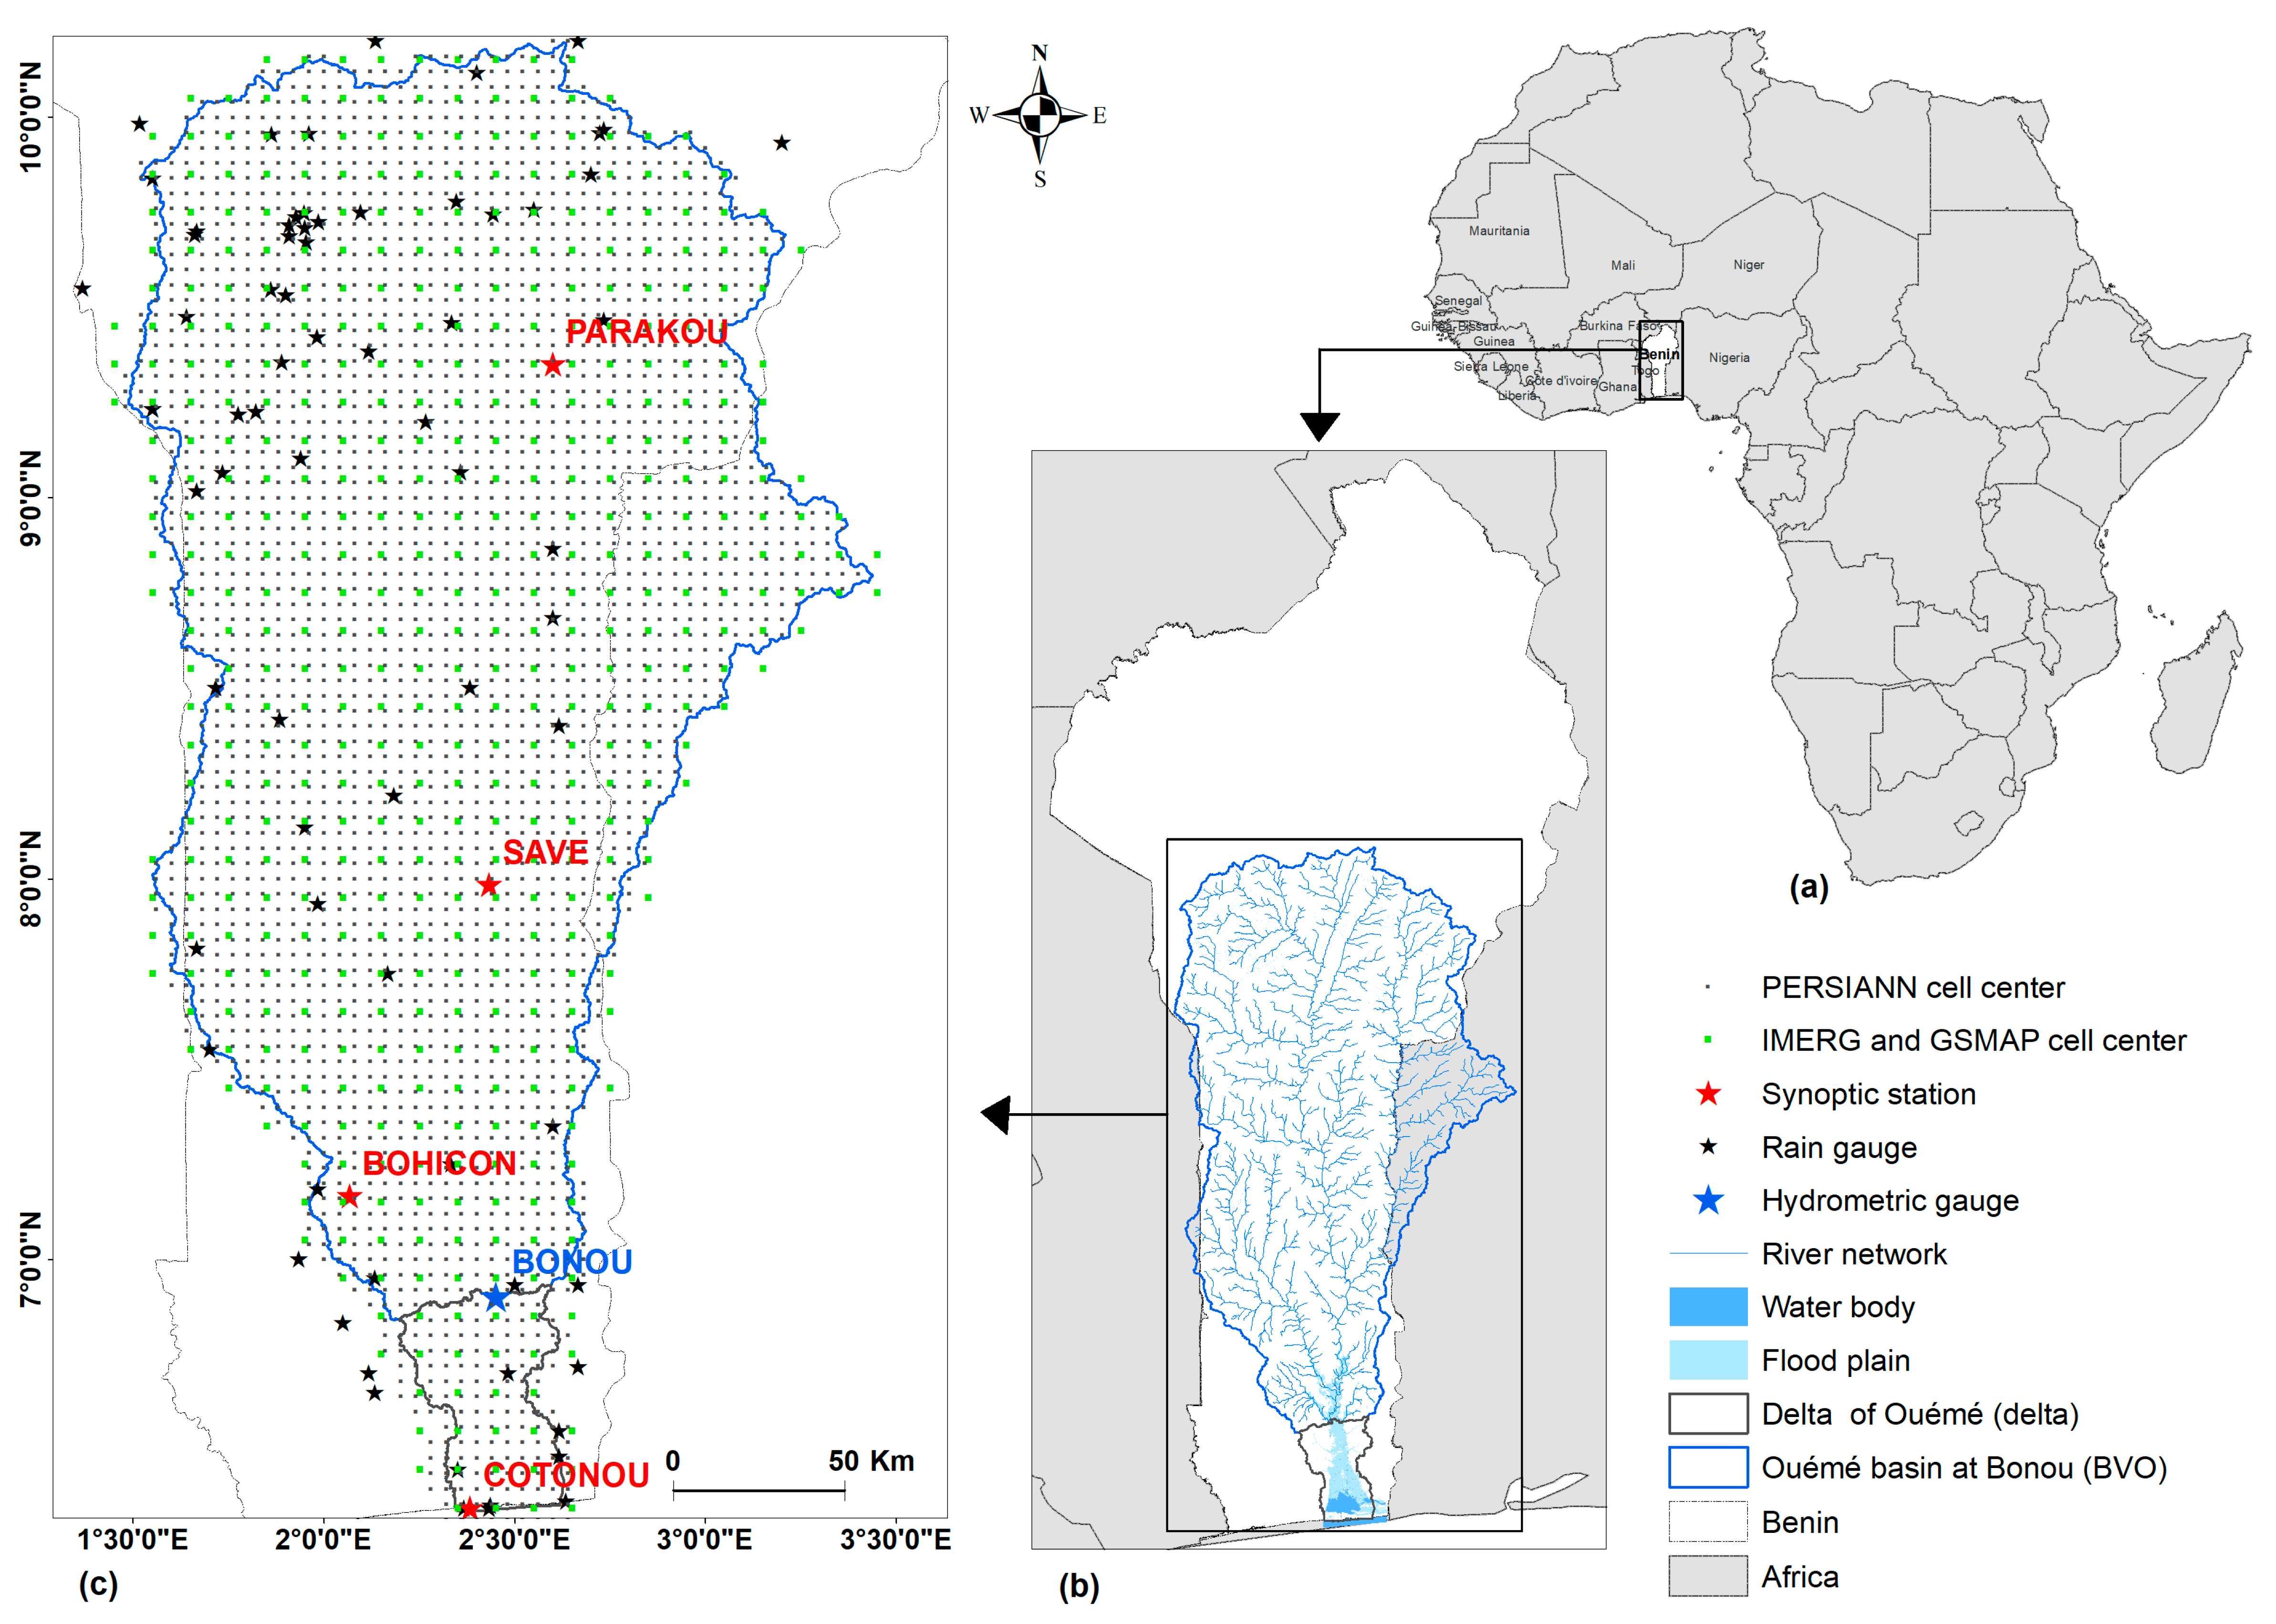
2.1. Study Area

The study area is the Ouémé River basin in Benin, West Africa. It spans from the source of the Ouémé River in the Tanéka mountains in northern Benin to the Nokoué and Porto-Novo lagoons through which the river flows into the Atlantic Ocean [30]. With a drainage area of almost 50,000 km2, it covers 41.14% of Benin’s total area [30]. The climate is equatorial in the south, with a long rainy season from May to July and a short rainy season from September to November, interspersed with dry seasons. Sudanian, in the north, has a rainy season from May to October and a dry season from November to April. The central area is a transition zone [31]. The average annual rainfall in the region is 1000 mm to 1200 mm, the average temperature is around 28 °C and the relative humidity varies between 77% and 93% [31,32,33]. The annual hydrological cycle in the area is unimodal; the high-flow season runs from August to November with maximum flows at Bonou generally around 900 m3/s, sometimes greater than 1000 m3/s [34], which are recorded during September and October [34,35]. From a hydrological point of view, there is the basin at the outlet of Bonou, which gathers the sub-basins of the Ouémé River and its main tributaries, and the Ouémé delta downstream [30]. These two subdomains of the basin are considered in this study (Figure 1). In the following sections, the basin of the Ouémé River at Bonou outlet is referred to as “BVO” and its delta as “delta”.

2.2. Data and Methodology

2.2.1. Data Used

Daily ground-based rainfall data were collected from 2001 to 2018 and used as benchmarks. The meteorological forcing data for hydrologic modeling are daily rainfall from all gauges in the basin at the Bonou outlet and maximal and minimal temperatures observed at the synoptic stations located in Cotonou, Bohicon, Savè and Parakou (red stars, Figure 1). These data are provided by the National Agency of Meteorology (Météo Bénin). Daily discharge data at Bonou (blue star, Figure 1) were collected from the National Office of Water (DGEau).
Four satellite-based products, namely PERSIANN NRT, GSMAP NRT and versions 6 Early and 7 Late of GPM IMERG, were used. They are presented in Table 1. These products are selected due to their fine temporal and spatial resolution (≤1 h and ≤0.1°), easy accessibility and suitability for near real-time flood modeling and forecasting. Previous studies have also identified these datasets as suitable products for extreme event studies [25,26,36,37,38,39,40]. GPM IMERG and GSMAP sub-daily data were aggregated to daily total rainfall to remain in agreement with the temporal resolution of the in situ data.

2.2.2. Satellite-Based Rainfall Assessment

Satellite-based rainfall datasets are evaluated against ground-based data on areal precipitation basis [41,42,43]. The gauge-based spatialized rainfall over each of the two sub-domains in the study area is obtained by kriging interpolation. The statistical performance of satellite products is assessed on the scale of the annual rainfall cycle, monthly, 10-day and 1-day rainfall accumulation. Five easy-to-interpret evaluation metrics are used: coefficient of correlation (R), percentage of bias (PBIAS) and Kling–Gupta efficiency (KGE), probability of detection (POD) and the False Alarms Rate (FAR).
  • The coefficient of correlation (R) is the expression of how well the estimation qualitatively fits the variation in the reference data. It is scale- and unit-independent, and thus allows for cross-comparison among data at different spatial or temporal resolutions and/or different units. The worst value is 0 when predictions are uncorrelated with observations and the best value is 1.
  • The percentage of bias (PBIAS) is another scale- and unit-independent metric to quantify the bias in estimates. The estimation is considered as good as its value is close to zero, which is the optimum score; very good, good, satisfactory and unsatisfactory scores are values smaller than 10, from 10 to 15, from 15 to 25 and above or equal to 25, respectively [44,45].
  • The Kling–Gupta efficiency (KGE) combines the effects of correlation, bias and variability. A good score is a value greater than 0.5 and its optimum value is 1 [46].
  • The probability of detection (POD) and the False Alarms Rate (FAR) indicate the ability of satellites to detect the occurrence of rainfall events. The perfect ability of detection is characterized by the highest POD of 1 and the lowest FAR of 0 [46,47,48].
R = i = 1 n ( P o , i P o ¯ ) ( P s , i P s ¯ ) i = 1 n ( P o , i P o ¯ ) 2 . ( P s , i P s ¯ ) 2
P B I A S = i = 1 n ( P o , i P s , i ) i = 1 n P o , i × 100
K G E = 1 ( R 1 ) 2 + ( P ¯ s P ¯ 0 ¯ 1 ) 2 + ( σ s / P ¯ s σ 0 / P ¯ 0 1 ) 2
P O D = n h n h + n m
F A R = n f n h + n f
n h : Number of both gauge-observed and satellite-detected events;
n f : Number of not gauge-observed events but falsely detected by satellite;
n m : Number of gauge-observed events but missed by satellite;
P o , i : Rainfall amount recorded by gauge on day i;
P s , i : Rainfall amount estimated by satellite on day i;
P ¯ o : Average of gauge-observed rainfall amount;
P ¯ s : Average of satellite-estimated rainfall amount;
σ 0 : Standard deviation of gauge-observed rainfall amount;
σ s : Standard deviation of satellite-estimated rainfall amount.

2.2.3. Bias-Correction Methods

Four simple methods were performed on each satellite-based rainfall time series for bias correction. There are additive and multiplicative error models [49], linear scaling (LS) and quantile mapping (QM) [43,49]. Linear scaling (LS) is a mean bias-correction approach that does not affect higher percentiles (Equation (6)). Quantile mapping (QM) is an approach based on adjusting the distribution of satellite-based data to that of ground-based data. In this study, it is implemented using the qmap package in Rstudio [50]. Additive (Equation (7)) and multiplicative (Equation (8)) error models establish, respectively, a linear and power–law relationship between the satellite-based and ground-based data. In the following paragraphs, corrected data designate satellite-based datasets to which a correction method has been applied. Uncorrected data refers to raw satellite-based datasets with no correction.
P i , m = P s , i , m P ¯ o , m   P ¯ s , m    
P o , i = A + B P s , i , m
P o , i = A P B s , i , m - - >   ln ( P o , i ) = ln ( A ) + B ln ( P s , i , m )
A: Offset estimated using ordinary least squares;
B: The scale parameter estimated using ordinary least squares;
P o , i , m : The rainfall amount recorded by gauges on the day i in month m of the year;
P s , i , m : The rainfall amount estimated by satellite on day i in month m of the year;
P i , m : The gauge-corrected satellite-estimated rainfall amount on day i in month m;
P _ o , m : The average rainfall amount observed by gauge in month m of the year;
P _ s , m : The average rainfall amount estimated by satellite in month m of the year;
P ¯ o , m   P ¯ s , m   :   The bias-correction factor for the month m.

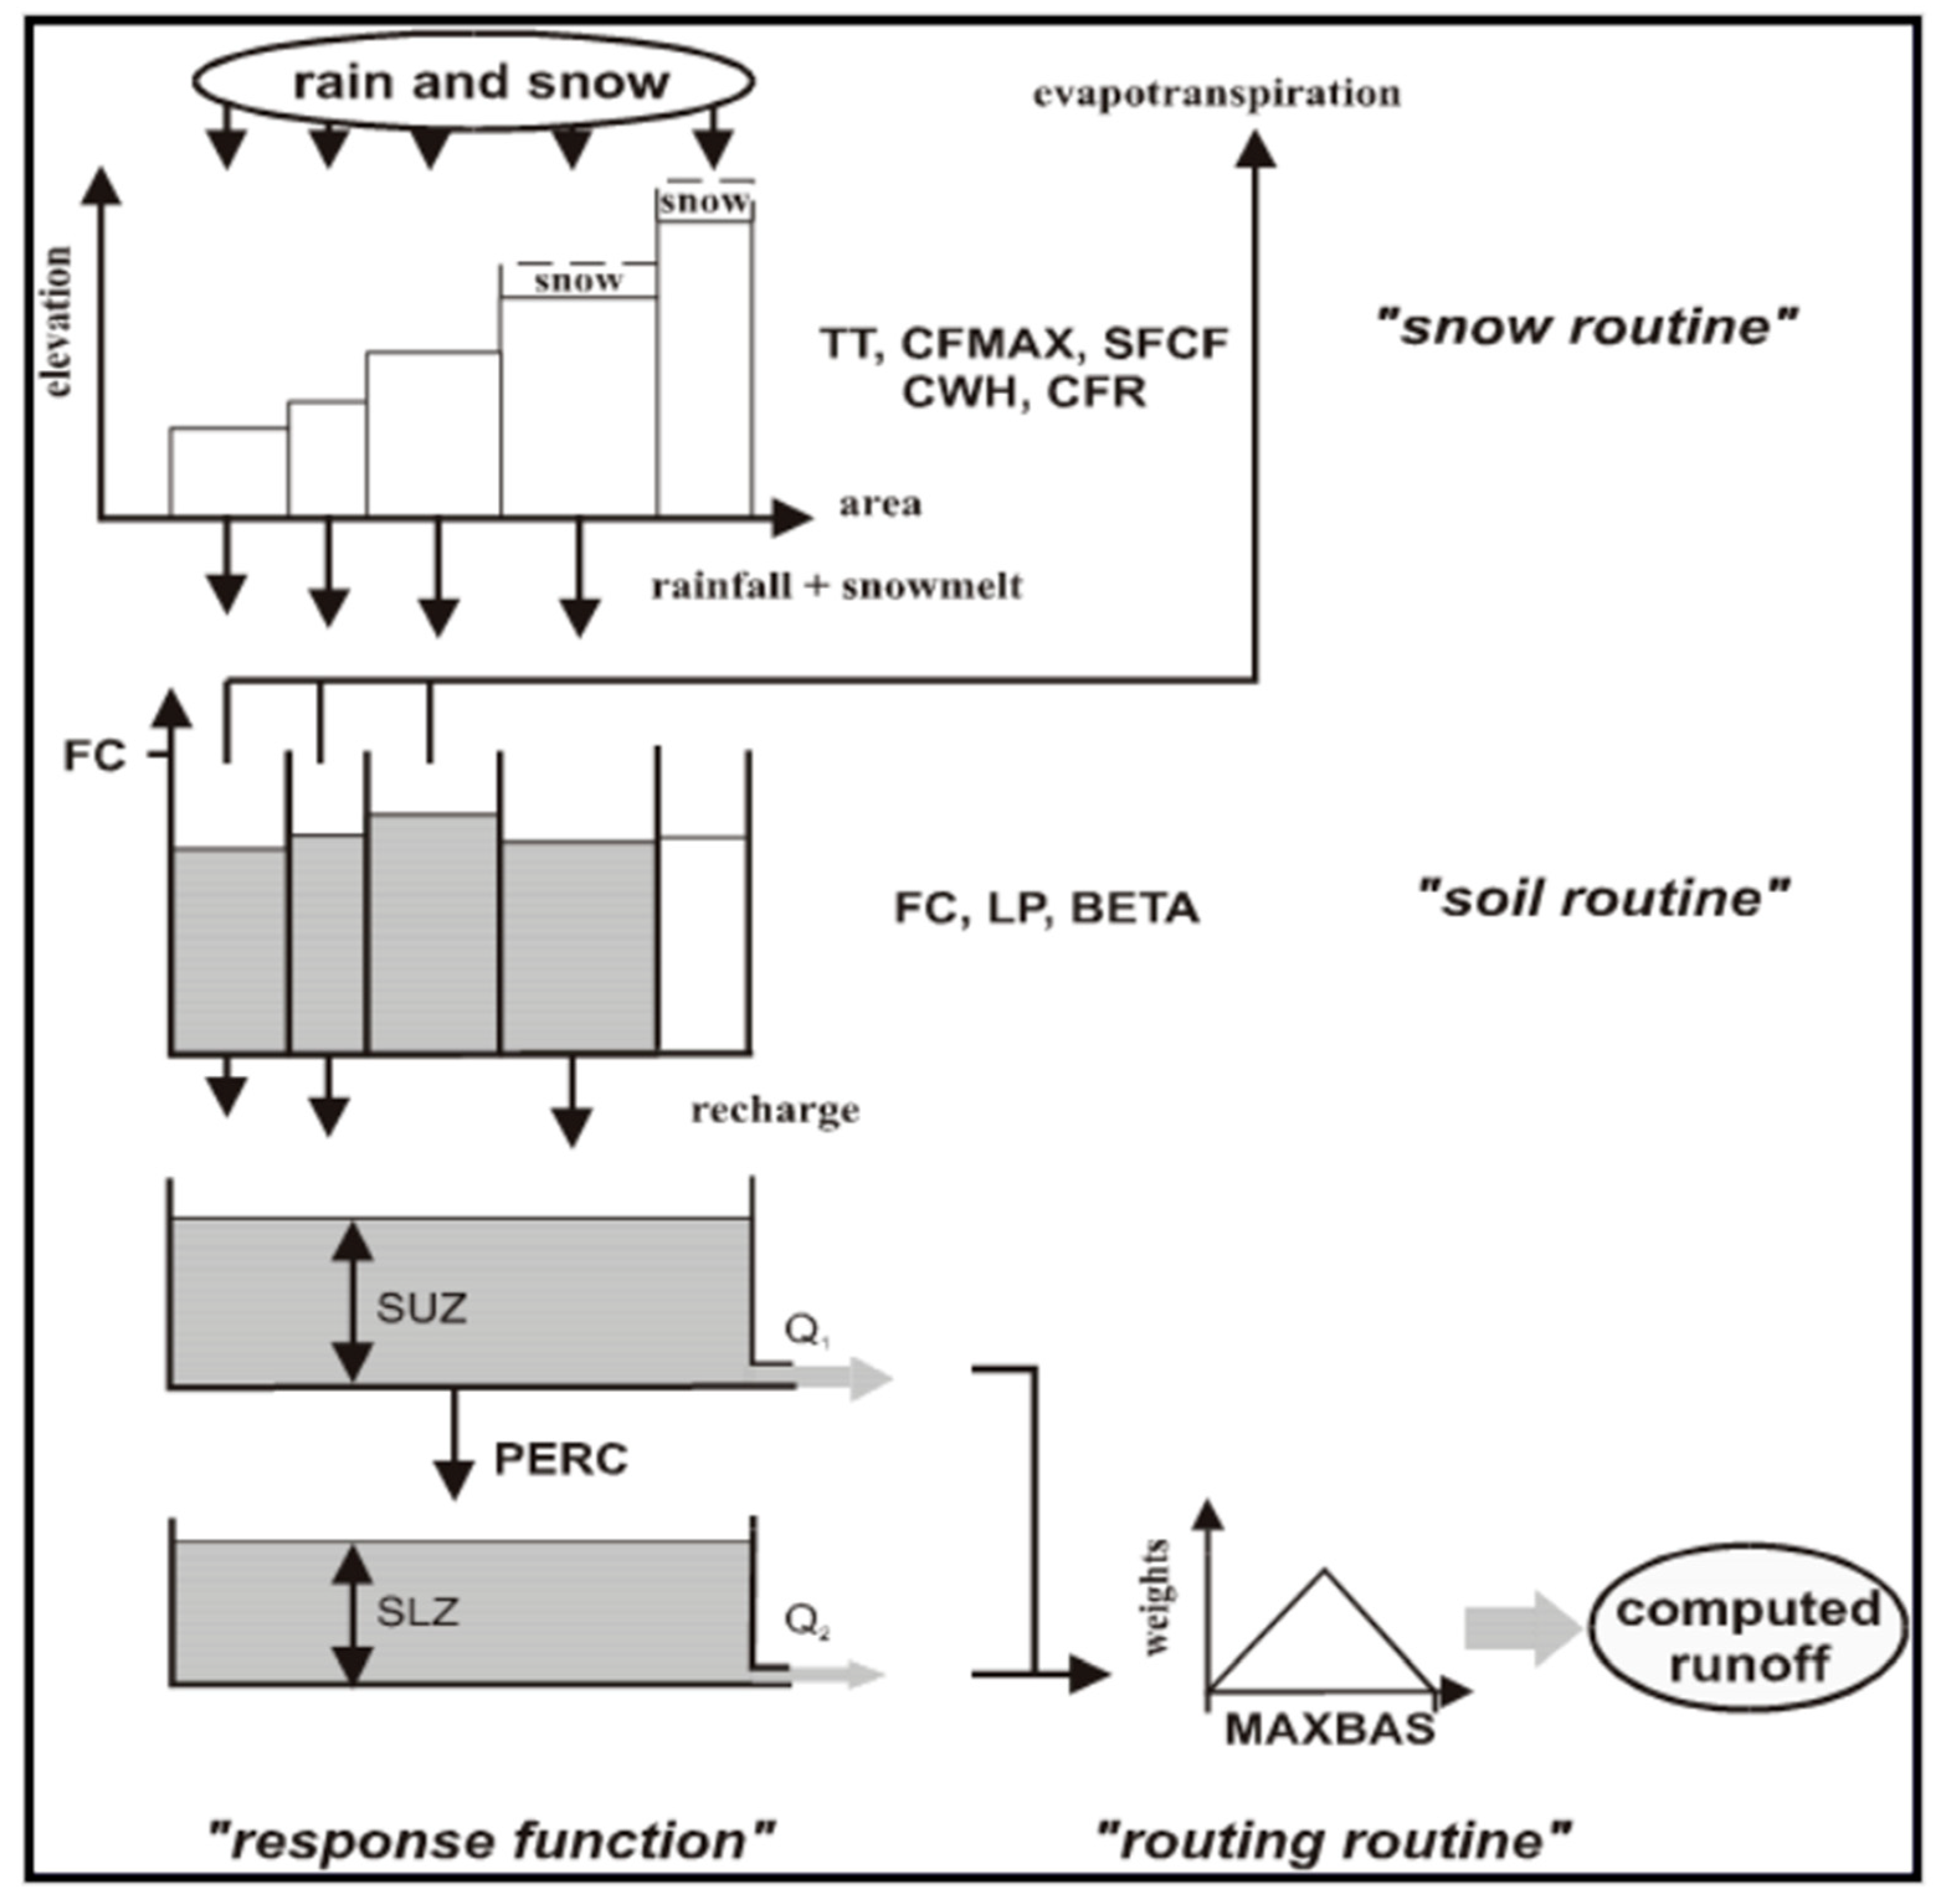
2.2.4. Hydrological Modeling Assessment

The hydrological assessment aims to evaluate (i) the ability of satellite data to reproduce flows using hydrological modeling and (ii) the impact of rainfall bias correction on the simulation results. It went through the analysis of scenarios that consist of forcing the hydrological model with ground-based rainfall data and satellite-based data [15,41,50,51,52,53].
The hydrological modeling was performed over the period 2001 to 2016 using Hydrologiska Byråns Vattenavdelning (HBV) light. This conceptual lumped model requires limited data input and is easy to implement and practical for data-scarce regions while delivering satisfactory results. It has been widely used in West Africa for similar studies (e.g., [25,37,54,55,56]). It models the water cycle according to the four (04) routines which are the snow or precipitation routine, soil moisture routine that controls the formation of runoff (direct and indirect), response routine and routing routine. These routines involve fifteen (15) parameters and processes that take place in the following three stores: the soil moisture reservoir, upper zone store and the lower zone store. Figure 2 shows the structure of the HBV model. Its parameters are summarized in Table 2. Ref. [54] presents a detailed description of the model and equations; they are also reported in the section help of the software with a step-by-step guide for the user, including input description and organization and output overview. In the climatic context of the Ouémé basin, the snow routine is not applicable. The model provides discharge at the basin outlet using as input precipitation, temperature and potential evapotranspiration (ETP). The excess water from the soil moisture zone is transformed into runoff following the relations (refer to Table 2 for the meaning of their terms):
Q 1 = K 1 × S U Z α
Q 2 = K 2 × S L Z
α: Measure of non-linearity of the flow in the upper zone store.
Spatialized rainfall, mean temperature (computed from maximum and minimum daily temperature) and potential evapotranspiration (ETP) calculated using the Hargreaves method by the Evapotranspiration package on Rstudio [57] are used to run the model in the current study. The discharge of the Ouémé River basin at the Bonou outlet is needed as a reference for model calibration. The model calibration was conducted in the first place manually by playing around parameters. The first set of parameters obtained serves as the base for automatic calibration using the GAP (Genetic Algorithm and Powell) optimization tool to define the set of parameters for better model efficiency. The model was calibrated from 2001 to 2010 (no data measured in 2006 and 2009) and validated from 2011 to 2016.
The results are assessed based on a visual comparison of hydrographs and the analysis of the Nash–Sutcliffe efficiency (NSE). The score of NSE is satisfactory when greater than 0.5, good above 0.6 and very good (excellent) above 0.75 (0.8); it indicates an estimation equivalent to the average of observations when close to zero and senseless when smaller than zero (Refs. [14,44,57,58]).
N S E = 1 i = 1 n ( P o , i P s , i ) ² i = 1 n ( P o , i P o ¯ ) 2
Hydrological modeling scenarios are presented in Table 3. The first scenario consists of calibration of the hydrological model using the ground-based rainfall dataset. The calibrated model is validated in the first place using ground-based rainfall data (scenario 1.1). In the second place, it is validated according to two other variants considered as mixed scenarios. The first variant consists of its validation with the corrected satellite-based rainfall dataset (scenario 1.2), and the second consists of its validation with the uncorrected satellite-based rainfall dataset (scenario 1.3). In the second scenario, the model is calibrated and validated using the same satellite-based rainfall dataset either corrected (scenario 2.2) or uncorrected (scenario 3.3).
In summary, three scenarios of calibration (ground-based data, uncorrected and corrected satellite-based data) and five scenarios of validation are used at the scale of each satellite product. Each calibration/validation involving satellite data is implemented at the scale of each satellite product. In the next sections, scenarios 1.2 and 1.3 are called “mixed” and scenarios 1.1, 2.2 and 3.3 are called “uniform” (Table 3).

3. Results

3.1. Evaluation of Satellite-Based Rainfall Data

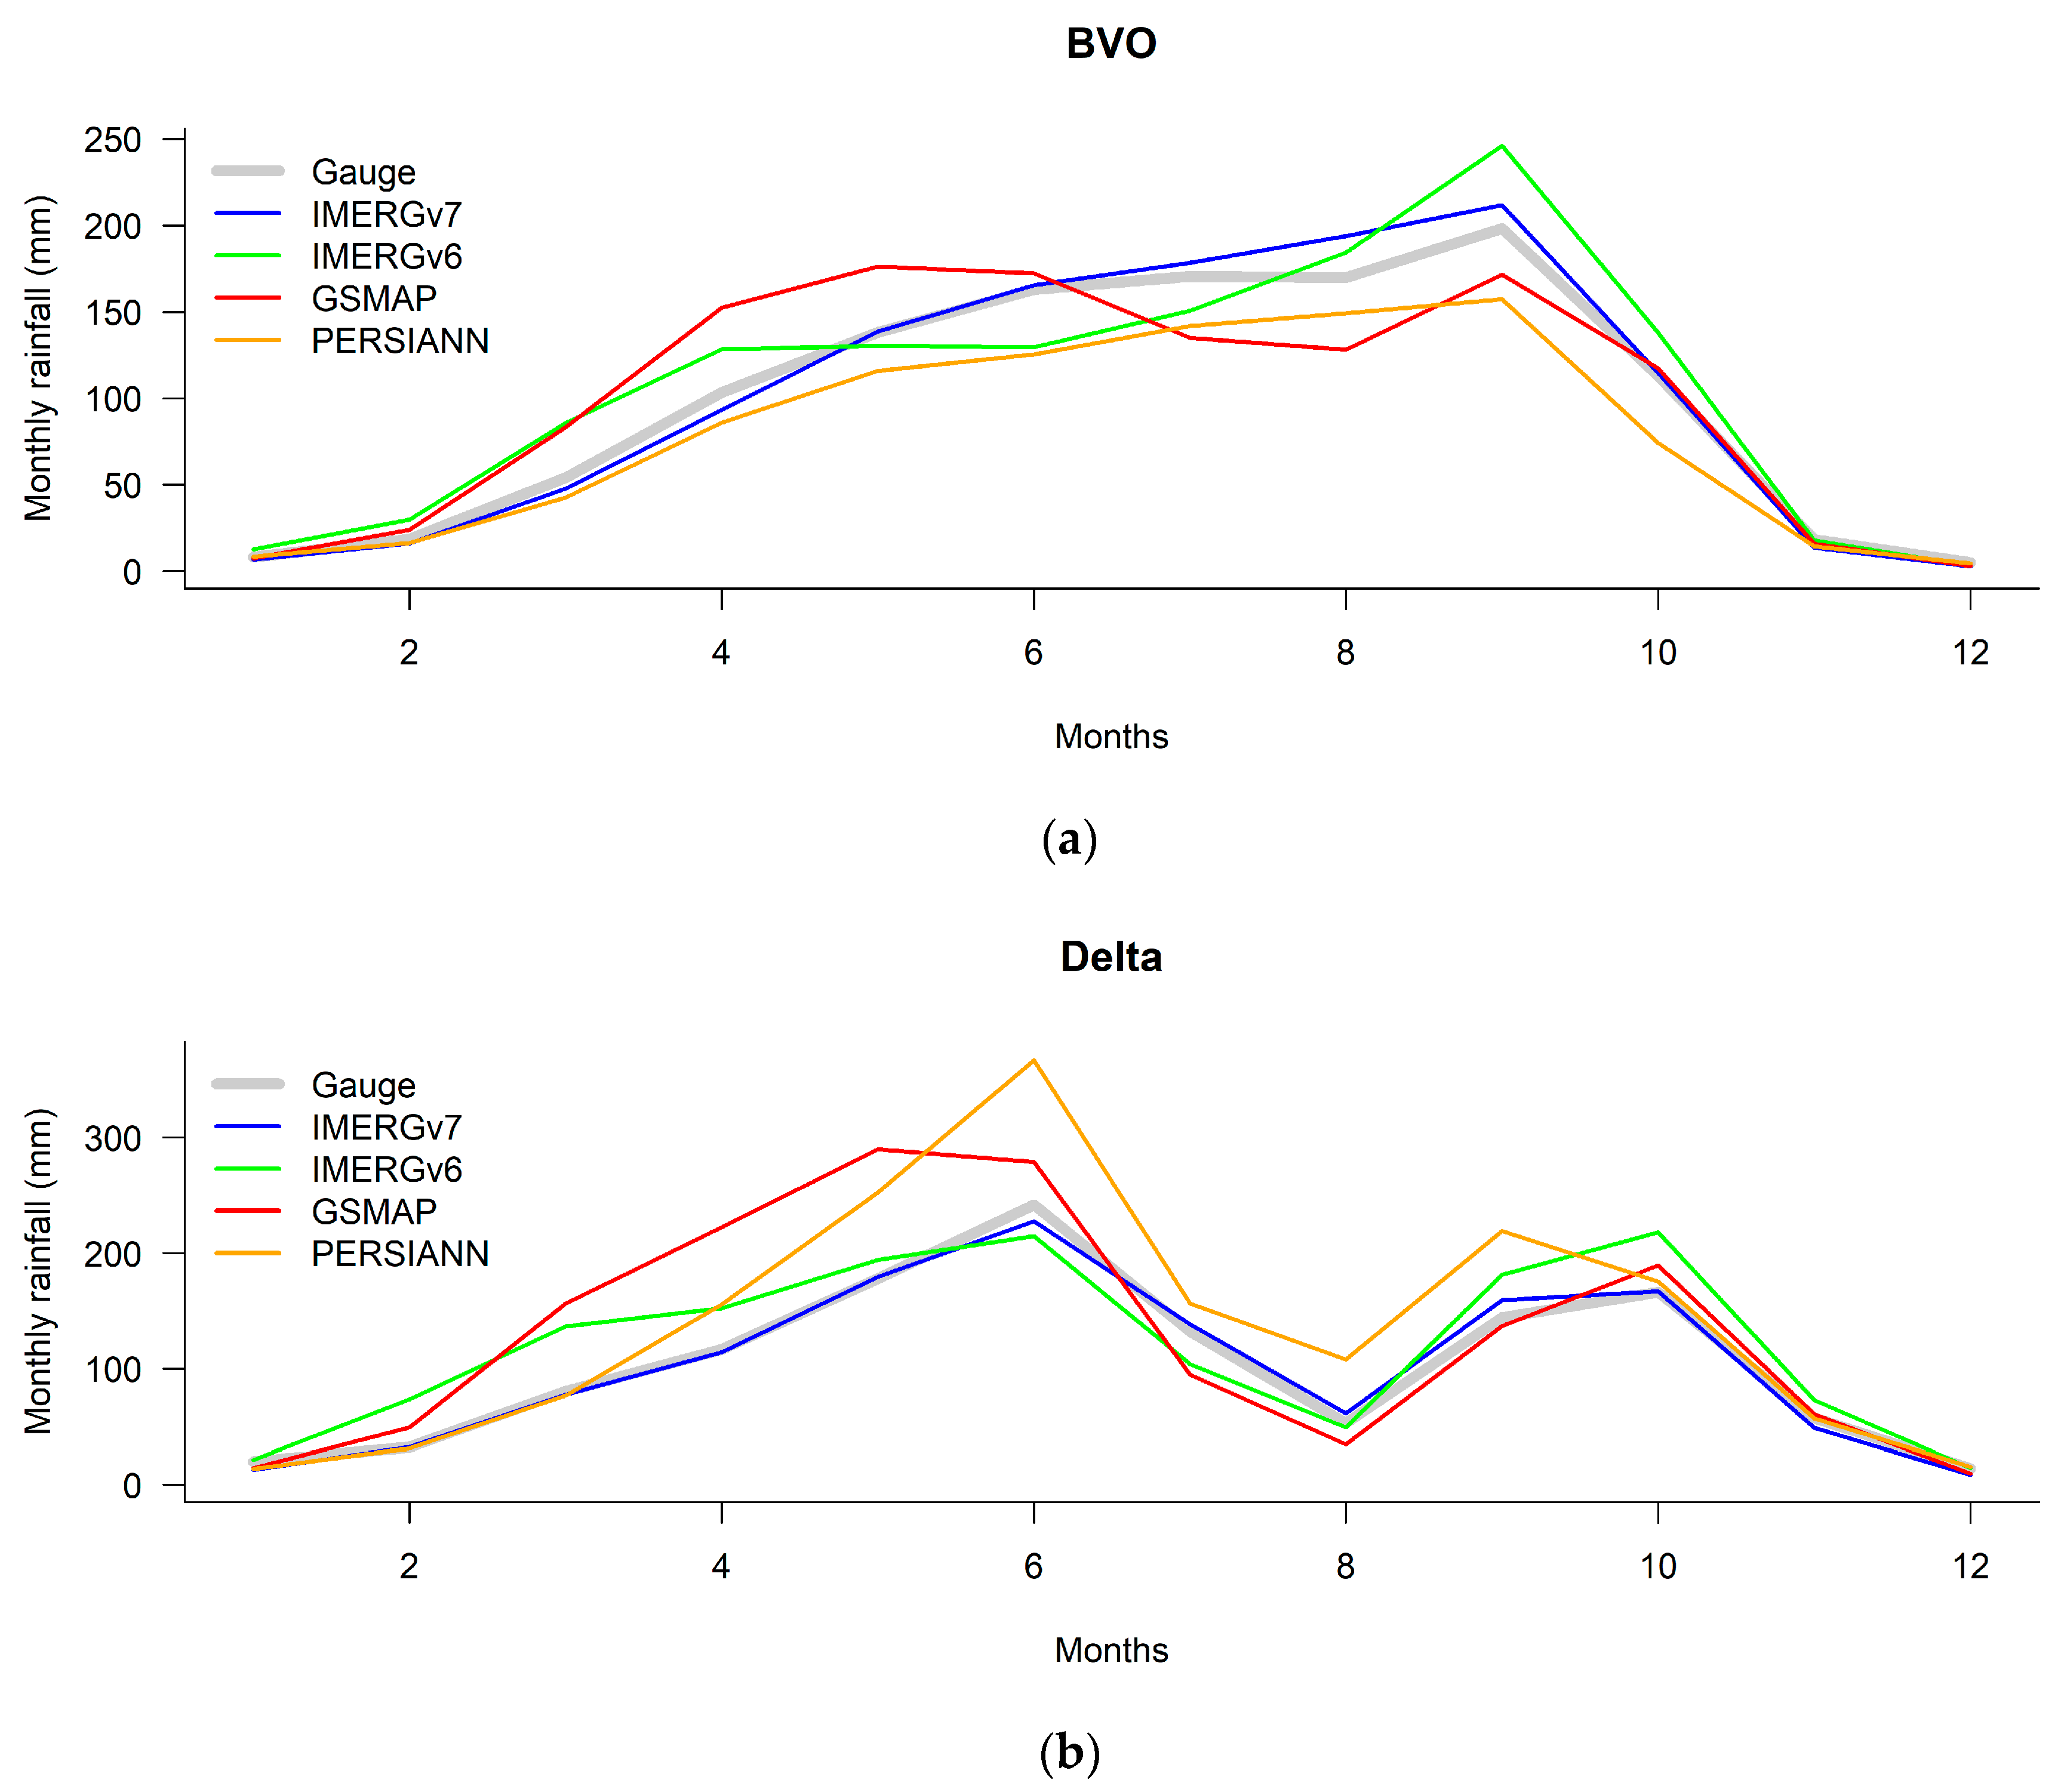
3.1.1. Qualitative Analysis

Figure 3 presents the annual cycles of rainfall from different data sources.
The visual inspection of monthly rainfall plots (Figure 3) demonstrates the capability of satellite-based rainfall datasets to reproduce the seasonal pattern of rainfall in each sub-domain of the study area, except GSMAP which detects a likely bimodal regime in the basin at Bonou. The best temporal patterns are provided by IMERGv7 and PERSSIANN. However, the latter records the peak of the short rainy season (September to October) one month earlier than it is recorded by the ground gauges in the delta. The monthly amount of rainfall recorded by the satellites is different from the in situ records, especially during the wet season. In both of the sub-areas, IMERGv7 matches almost perfectly the amount of rainfall recorded by the ground gauges. It is followed by IMERGv6, which, however, underestimates the rainfall from April–May to July–August and overestimates for the rest of the year. As for GSMAP, it underestimates from May–June to September and overestimates for the rest of the year. The largest discrepancies are reported by PERSIANN which underestimates the basin at Bonou and overestimates the delta. The agreement between satellite-based data and ground-based measurements is notably higher during the dry season, from November to January.

3.1.2. Quantitative Analysis

Table 4 presents the categorial and continuous statistics at a daily scale for each uncorrected satellite-based dataset. They are based on the contingency table. The categorical statistics at daily time steps indicate the good capability of the detection of the satellite products. On the scale of sub-domains, they have better performances in the basin at Bonou. This is evidenced by their mean scores of POD = 0.74 and 0.65 and FAR = 0.16 and 0.3, respectively, in the BVO and the delta. The best scores of POD and FAR are recorded by IMERGv7 (0.77 and 0.15) in the BVO and, respectively, by PERSIANN (0.70) and GSMAP (0.26) in the delta. Considering the entire study area, IMERGv7, whose POD (FAR) mean score is 0.72 (0.21), outperforms other products.
As for continuous statistics at the daily time step, IMERGv7 has the highest mean KGE (0.59) and the lowest mean PBIAS (0.6%) for the whole study area and is better than IMERGv6 (mean KGE = 0.43) which outperforms GSMAP (mean KGE = 0.26) and PERSIANN (mean KGE = 0.15). PERSSIANN exhibits the worst underestimation in the BVO (PBIAS = −19.3%) while IMERGv6 presents the worst overestimation (PBIAS = 8.3%). In addition, it is observed that most of the products overestimate the rainfall amount (PBIAS > 0). They all outperform in the basin at Bonou (mean R = 0.57 vs. 0.53, mean KGE = 0.5 vs. 0.21) where discrepancies are much lower than the delta (mean PBIAS = −1.7% vs. 17.8%). On this scale of each sub-basin, IMERGv7 has the best performance compared to others. In terms of PBIAS and KGE, IMERGv6 outperforms GSMAP in the delta but underperforms in the BVO. The weakest scores of continuous metrics are given by PERSIANN.
The scores of continuous metrics of each dataset on 10-day and monthly scales in each subdomain are listed in Table 5. The correlation becomes greater than 0.7 (R > 0.7) and 0.8 (R ≥ 0.8) for the 10-day and the monthly time steps, respectively. Likewise, the scores of KGE are very good (>0.7) at the 10-day time scale and are better on the monthly scale. This is particularly true for IMERGv7 and IMERGv6, while the best KGE for GSMAP and PERSIANN in the delta at a monthly scale is below 0.5. The best values of these metrics are obtained by IMERGv7 followed by IMERGv6 at both time scales and each sub-domain. The results demonstrate the increase in discrepancy in satellite-based rainfall with finer temporal resolution. This multiple temporal scale evaluation underlines the importance of the correction of satellite products.

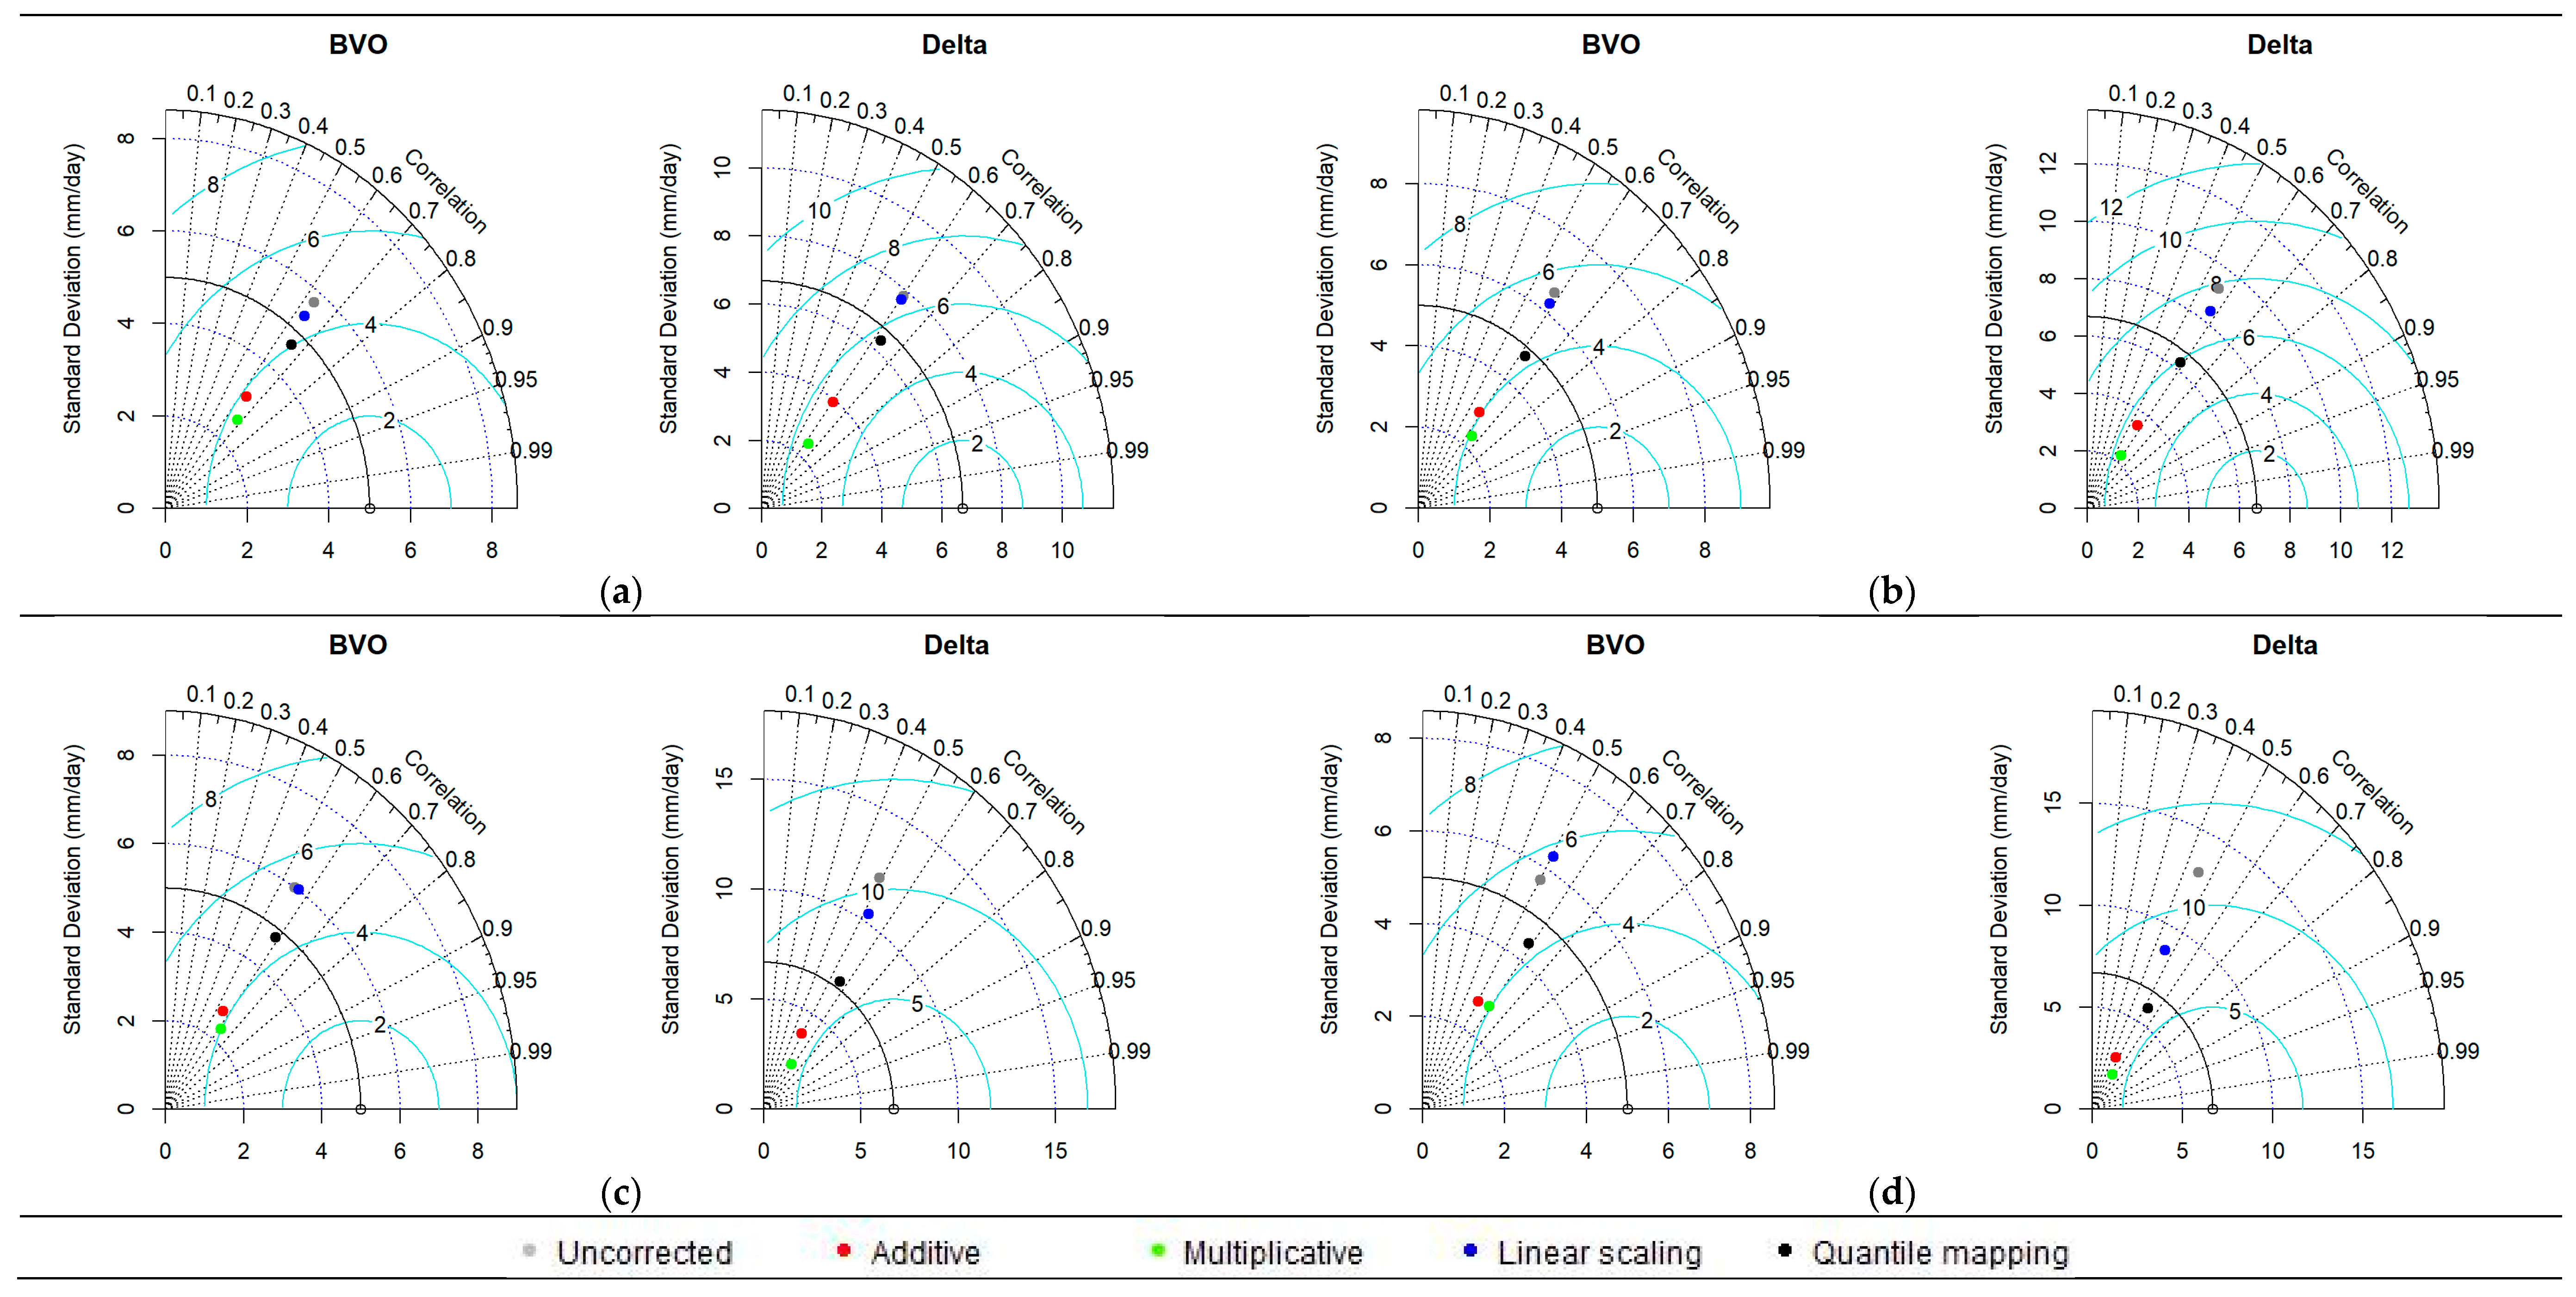
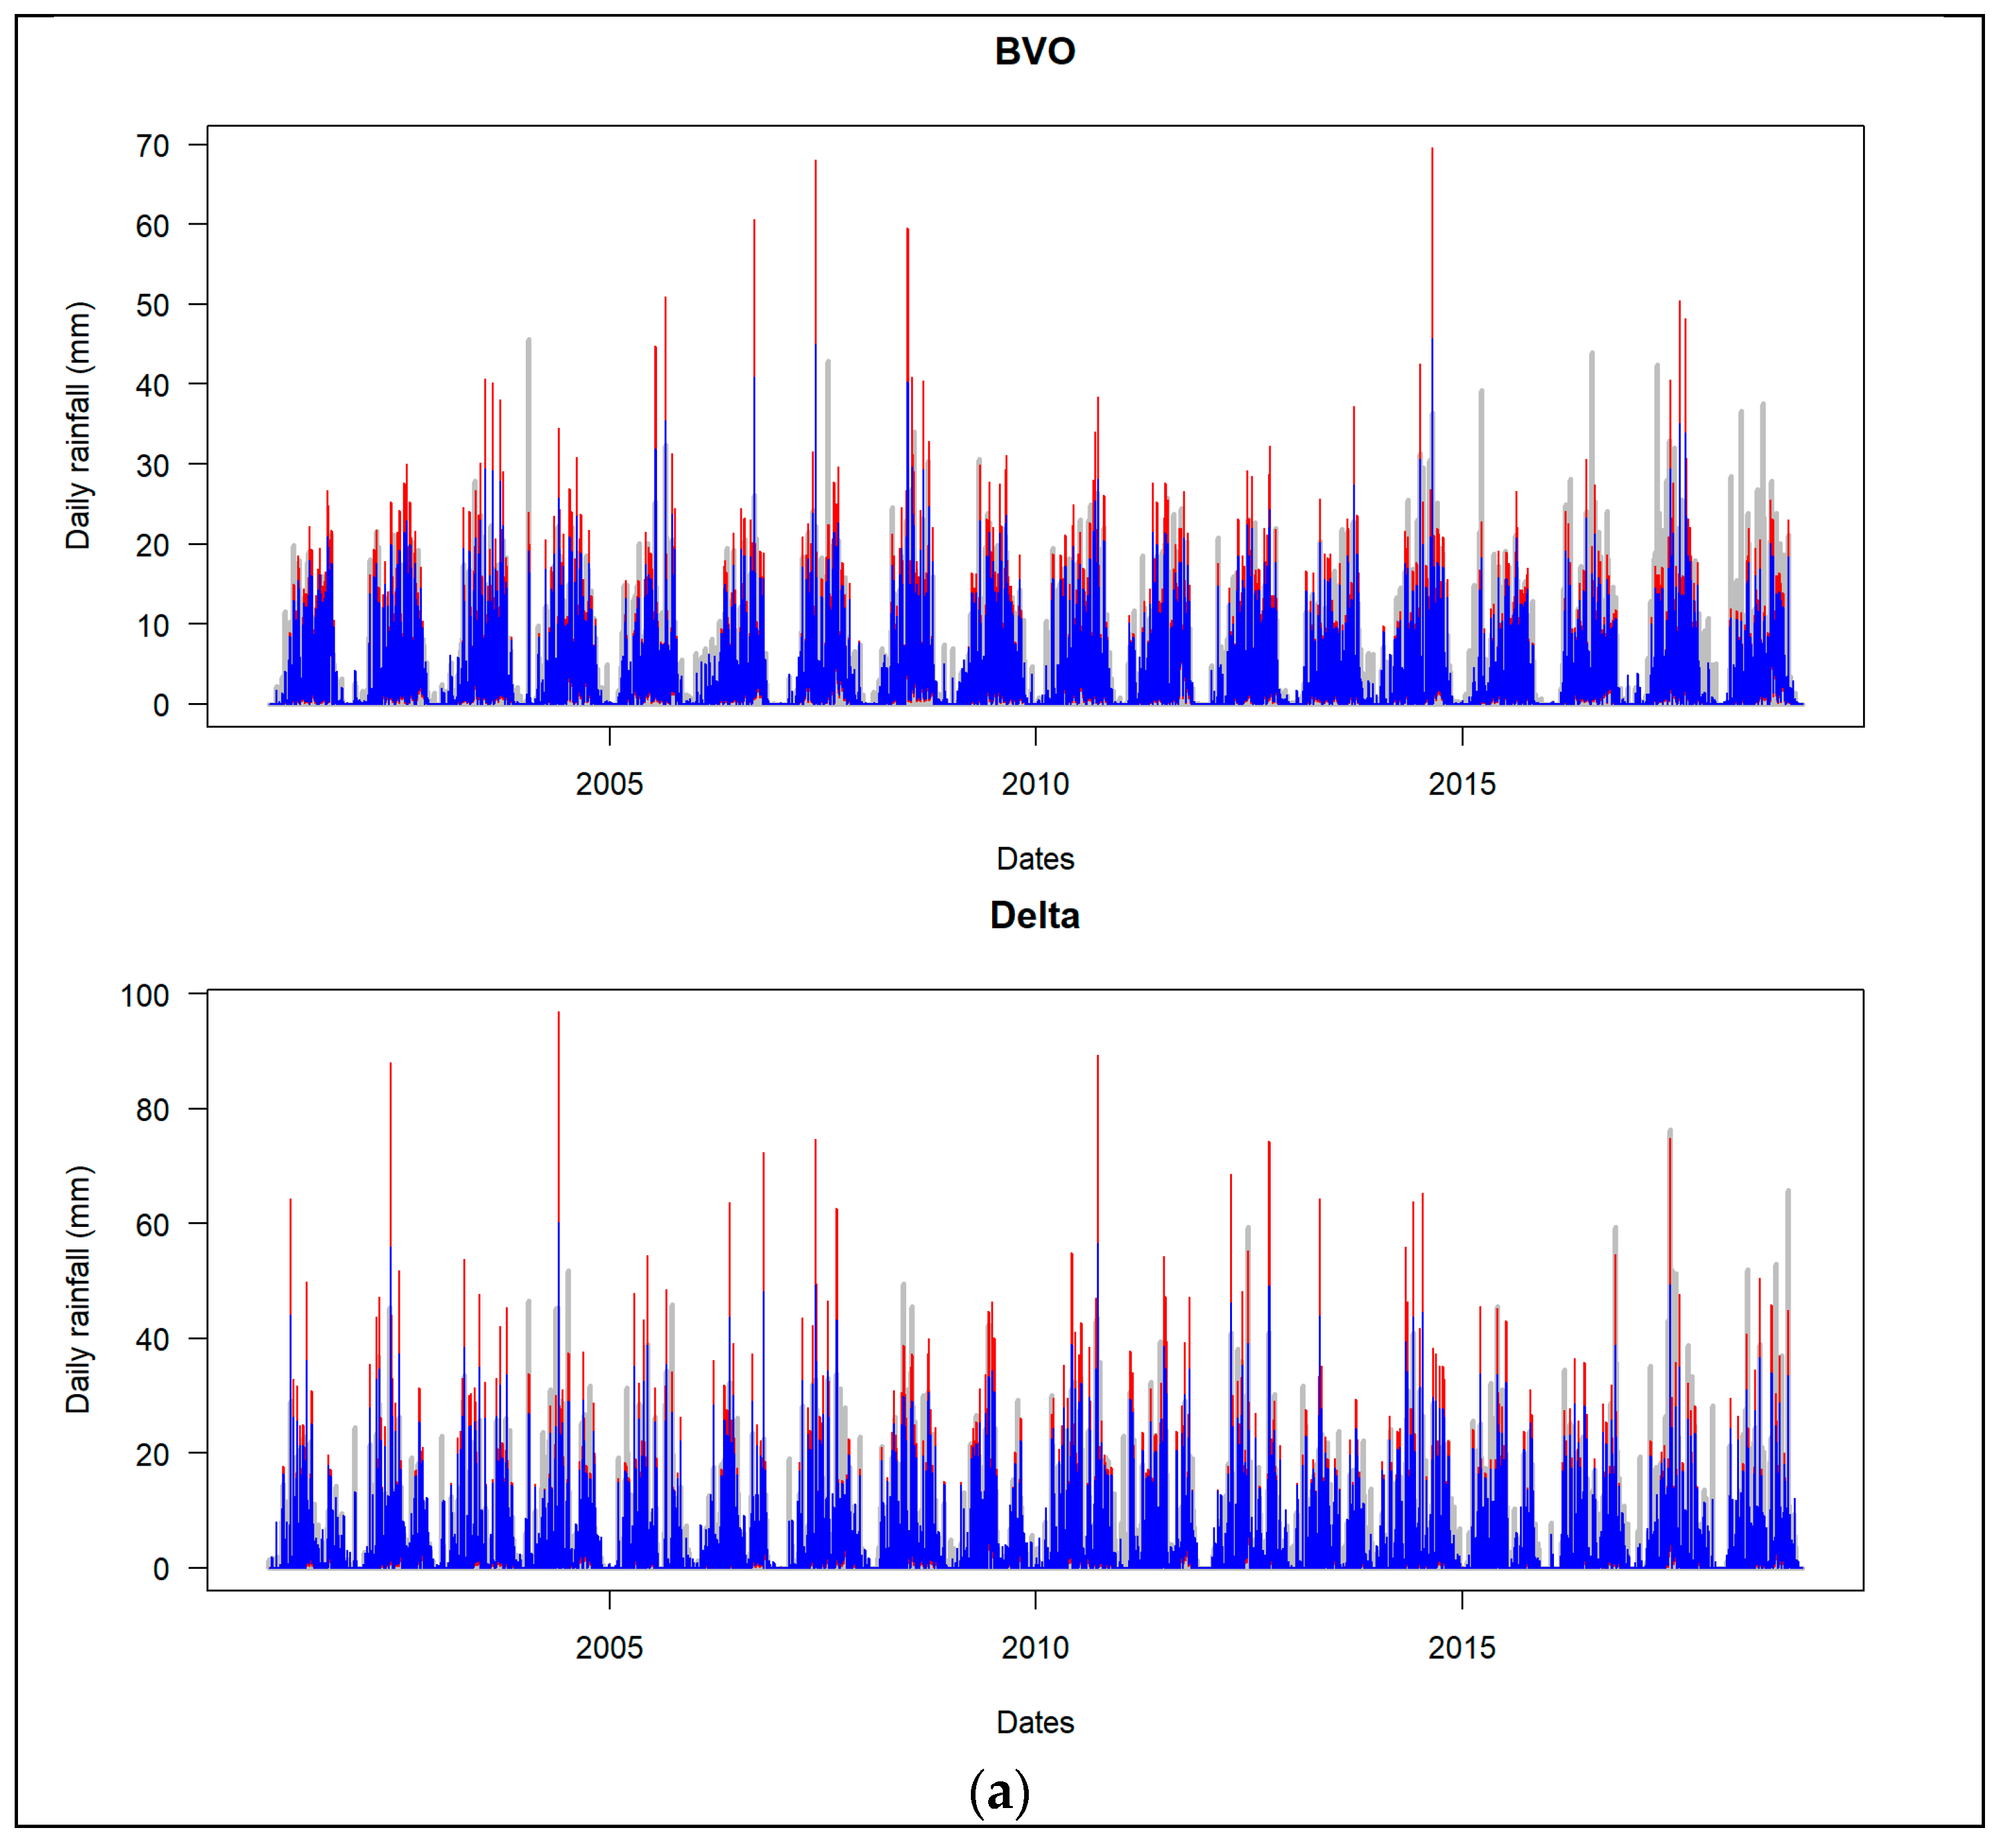
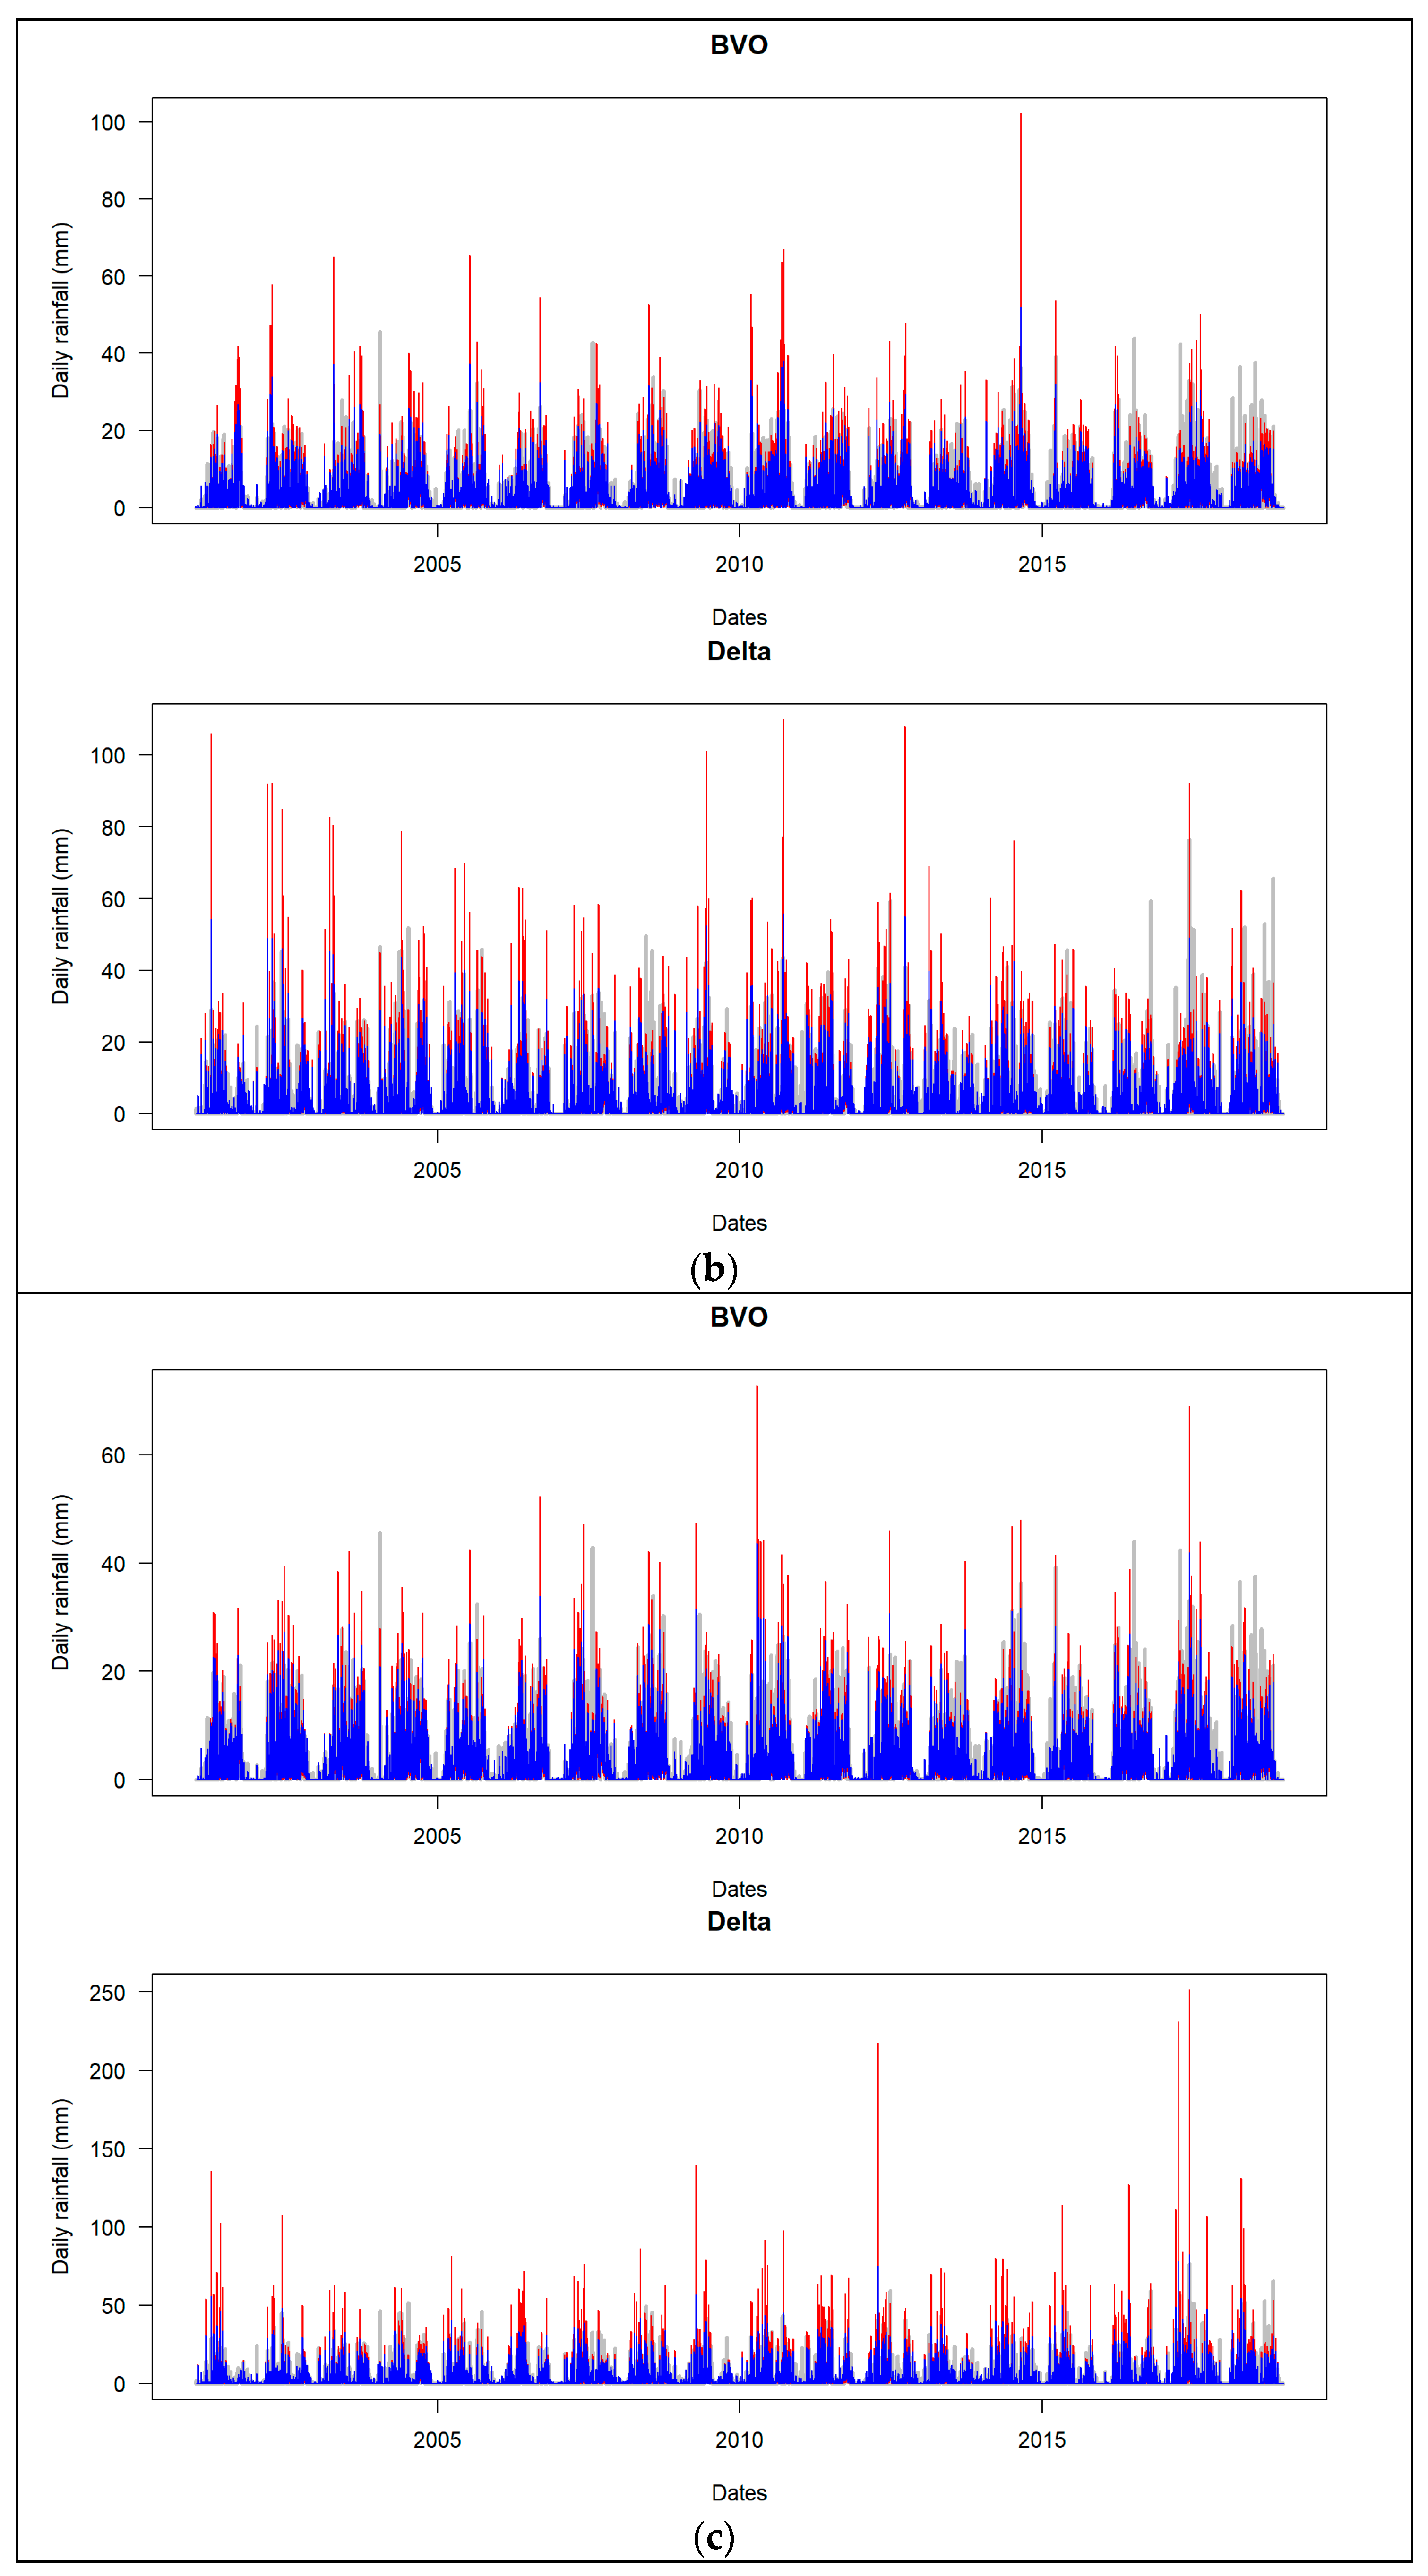
3.2. Bias Correction of Satellite-Based Rainfall Data

Figure 4 presents Taylor diagrams of the corrected satellite-based rainfall dataset in validation compared to uncorrected data. All the methods lead to satisfactory correlations. However, variability in datasets from additive and multiplicative error models is much lower than observed. The corrected datasets from the linear scaling and quantile mapping method have better agreement with ground-based datasets. In most cases, the latter outperforms the former with lower errors in terms of standard deviation closer to the observation and/or higher correlation.
Table 6 contains the continuous metrics for each product and sub-domain after quantile mapping correction over the study period. The corresponding percentage for score improvement is presented in Table 7. It is evident from these tables that the quantile mapping method led to an increase in scores in terms of R and KGE and to a positive impact in terms of bias in most of the cases. Indeed, the values of PBIAS after correction are ≤3% except for GSMAP data in the delta. Moreover, unlike the uncorrected datasets, all the corrected time series reached satisfactory scores of KGE (>0.5) (Table 6). The improvement of KGE induced by the correction is 8% to 30%. The least improved dataset after correction is IMERGv7 data and the most improved is IMERGv6. Nevertheless, corrected IMERGv7 datasets maintain the best performance compared to others. They are closely followed by corrected IMERGv6, better than corrected GSMAP and PERSIANN. Superimposing the ground-based data, corrected and uncorrected satellite-based data in Figure 5 shows an improvement characterized by smoother satellite data and a better approximation of the amplitude of rainfall data after correction.

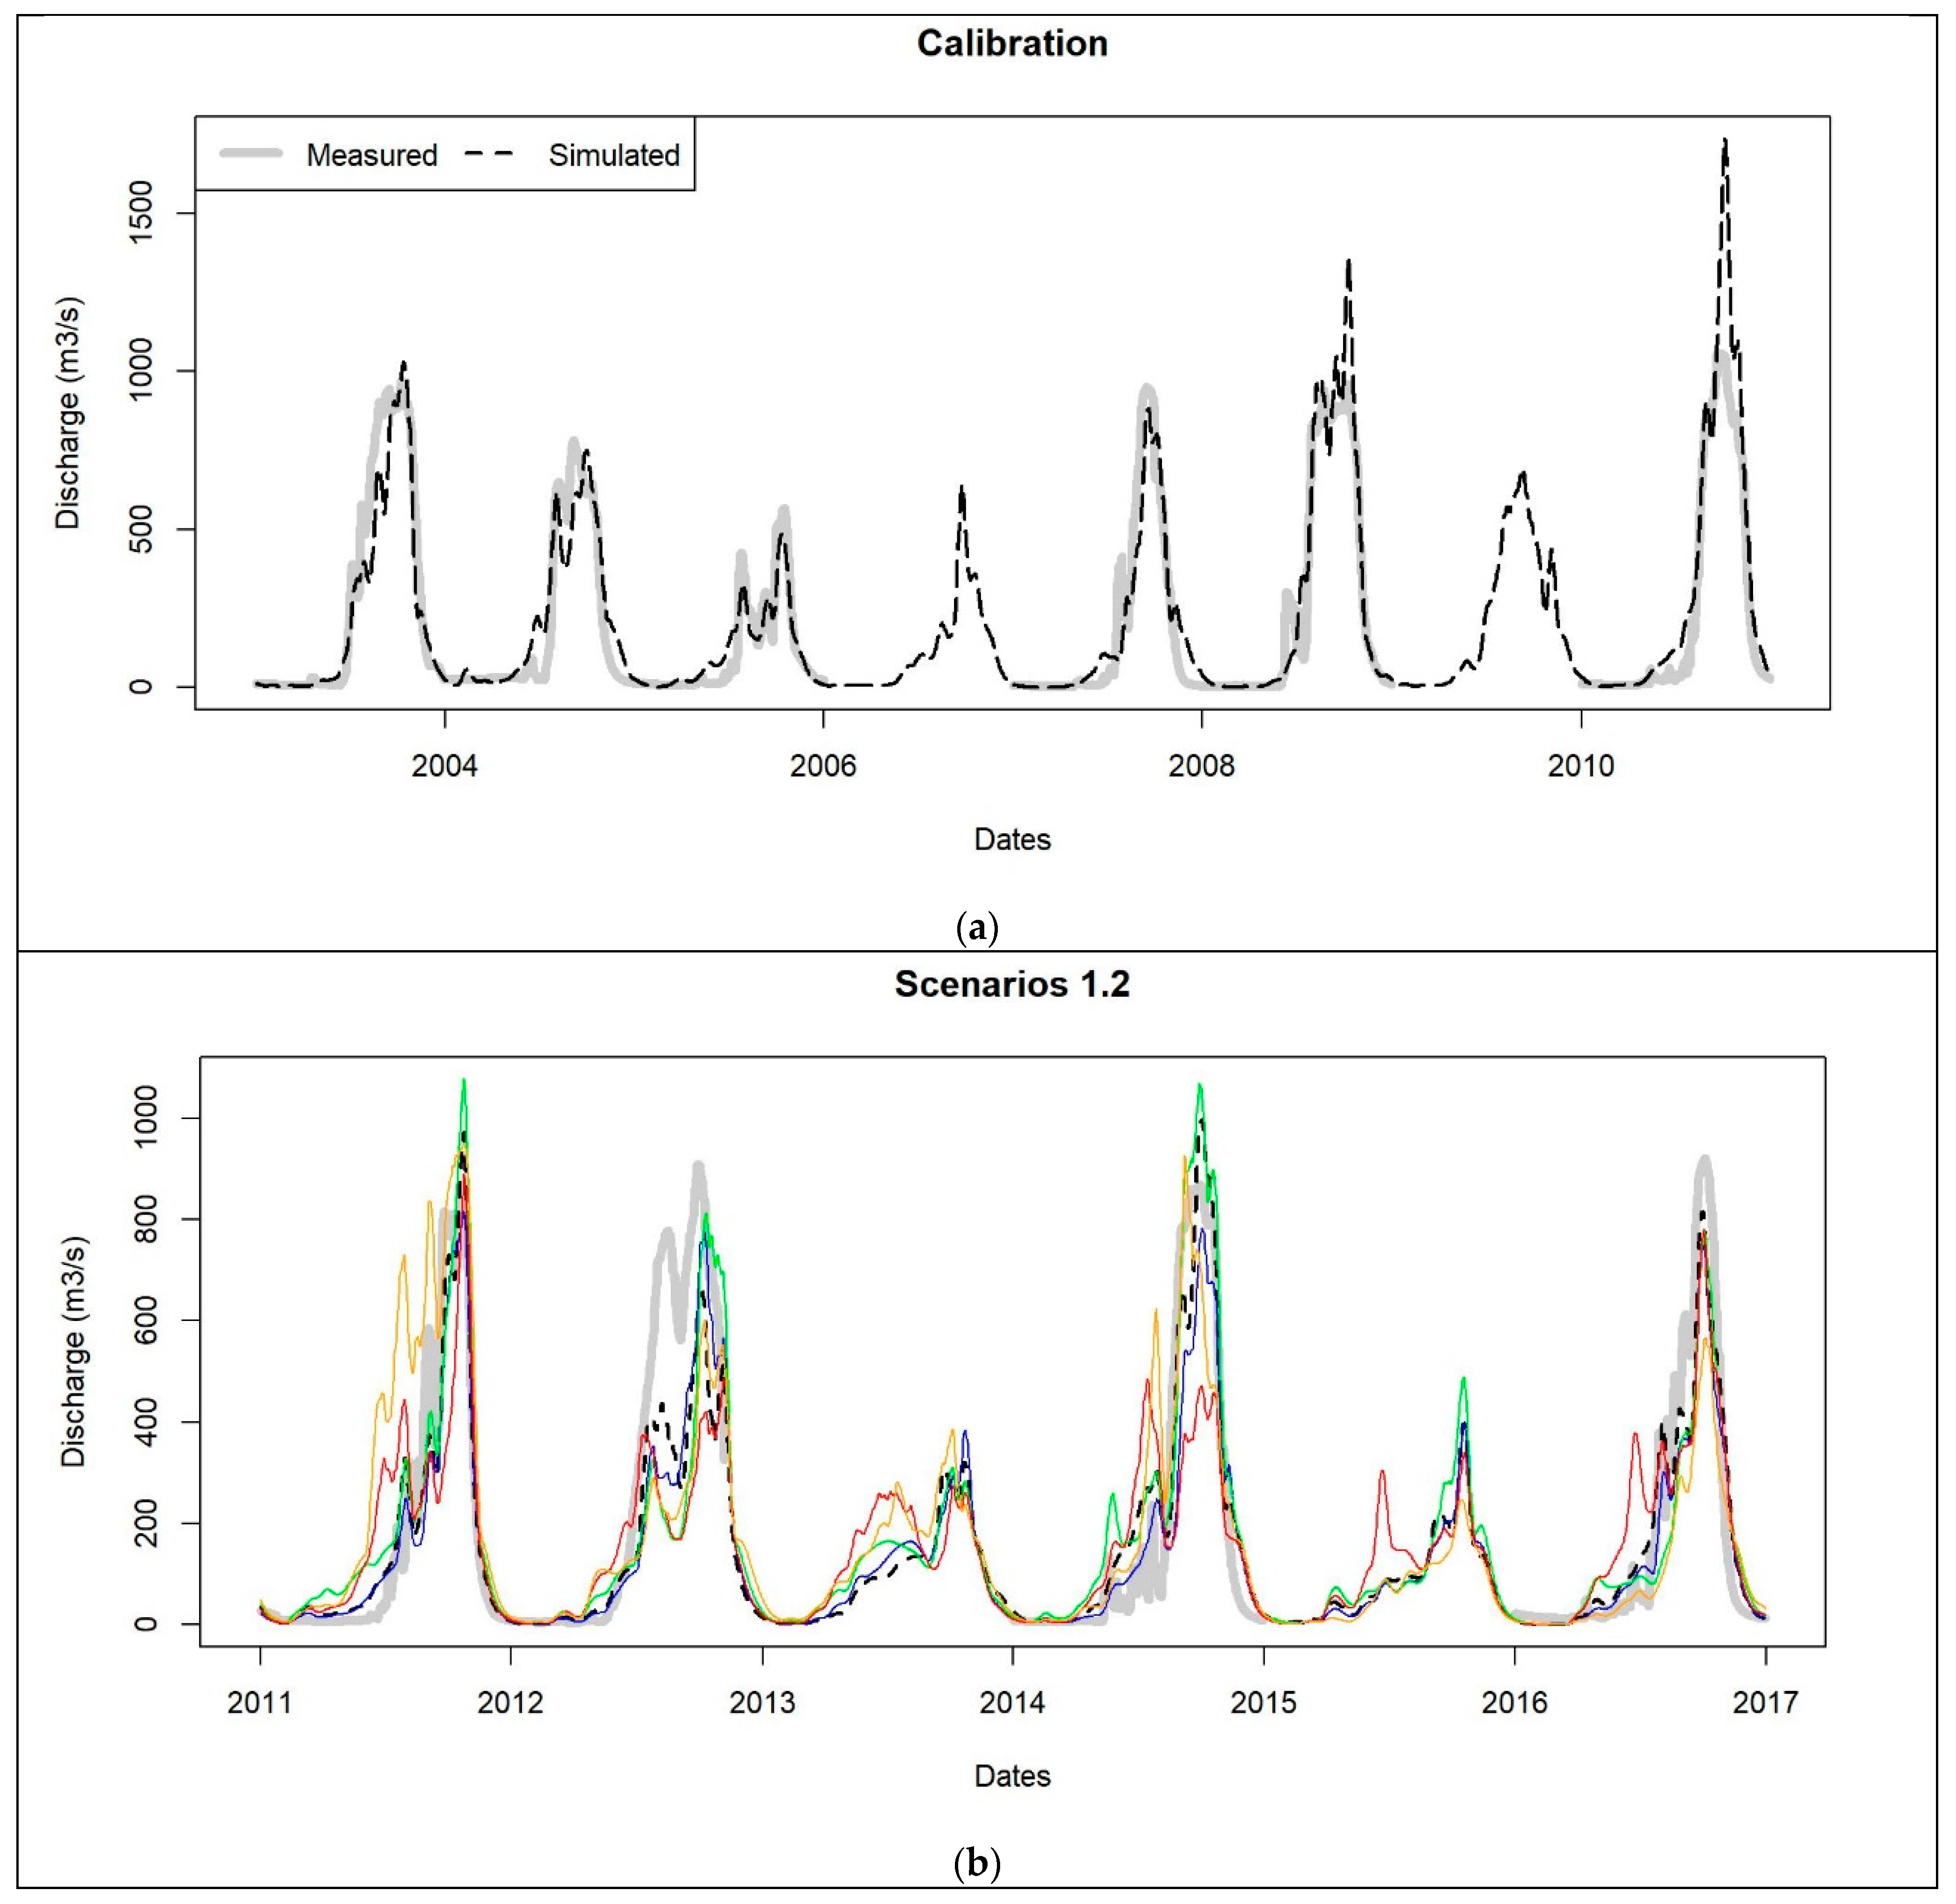
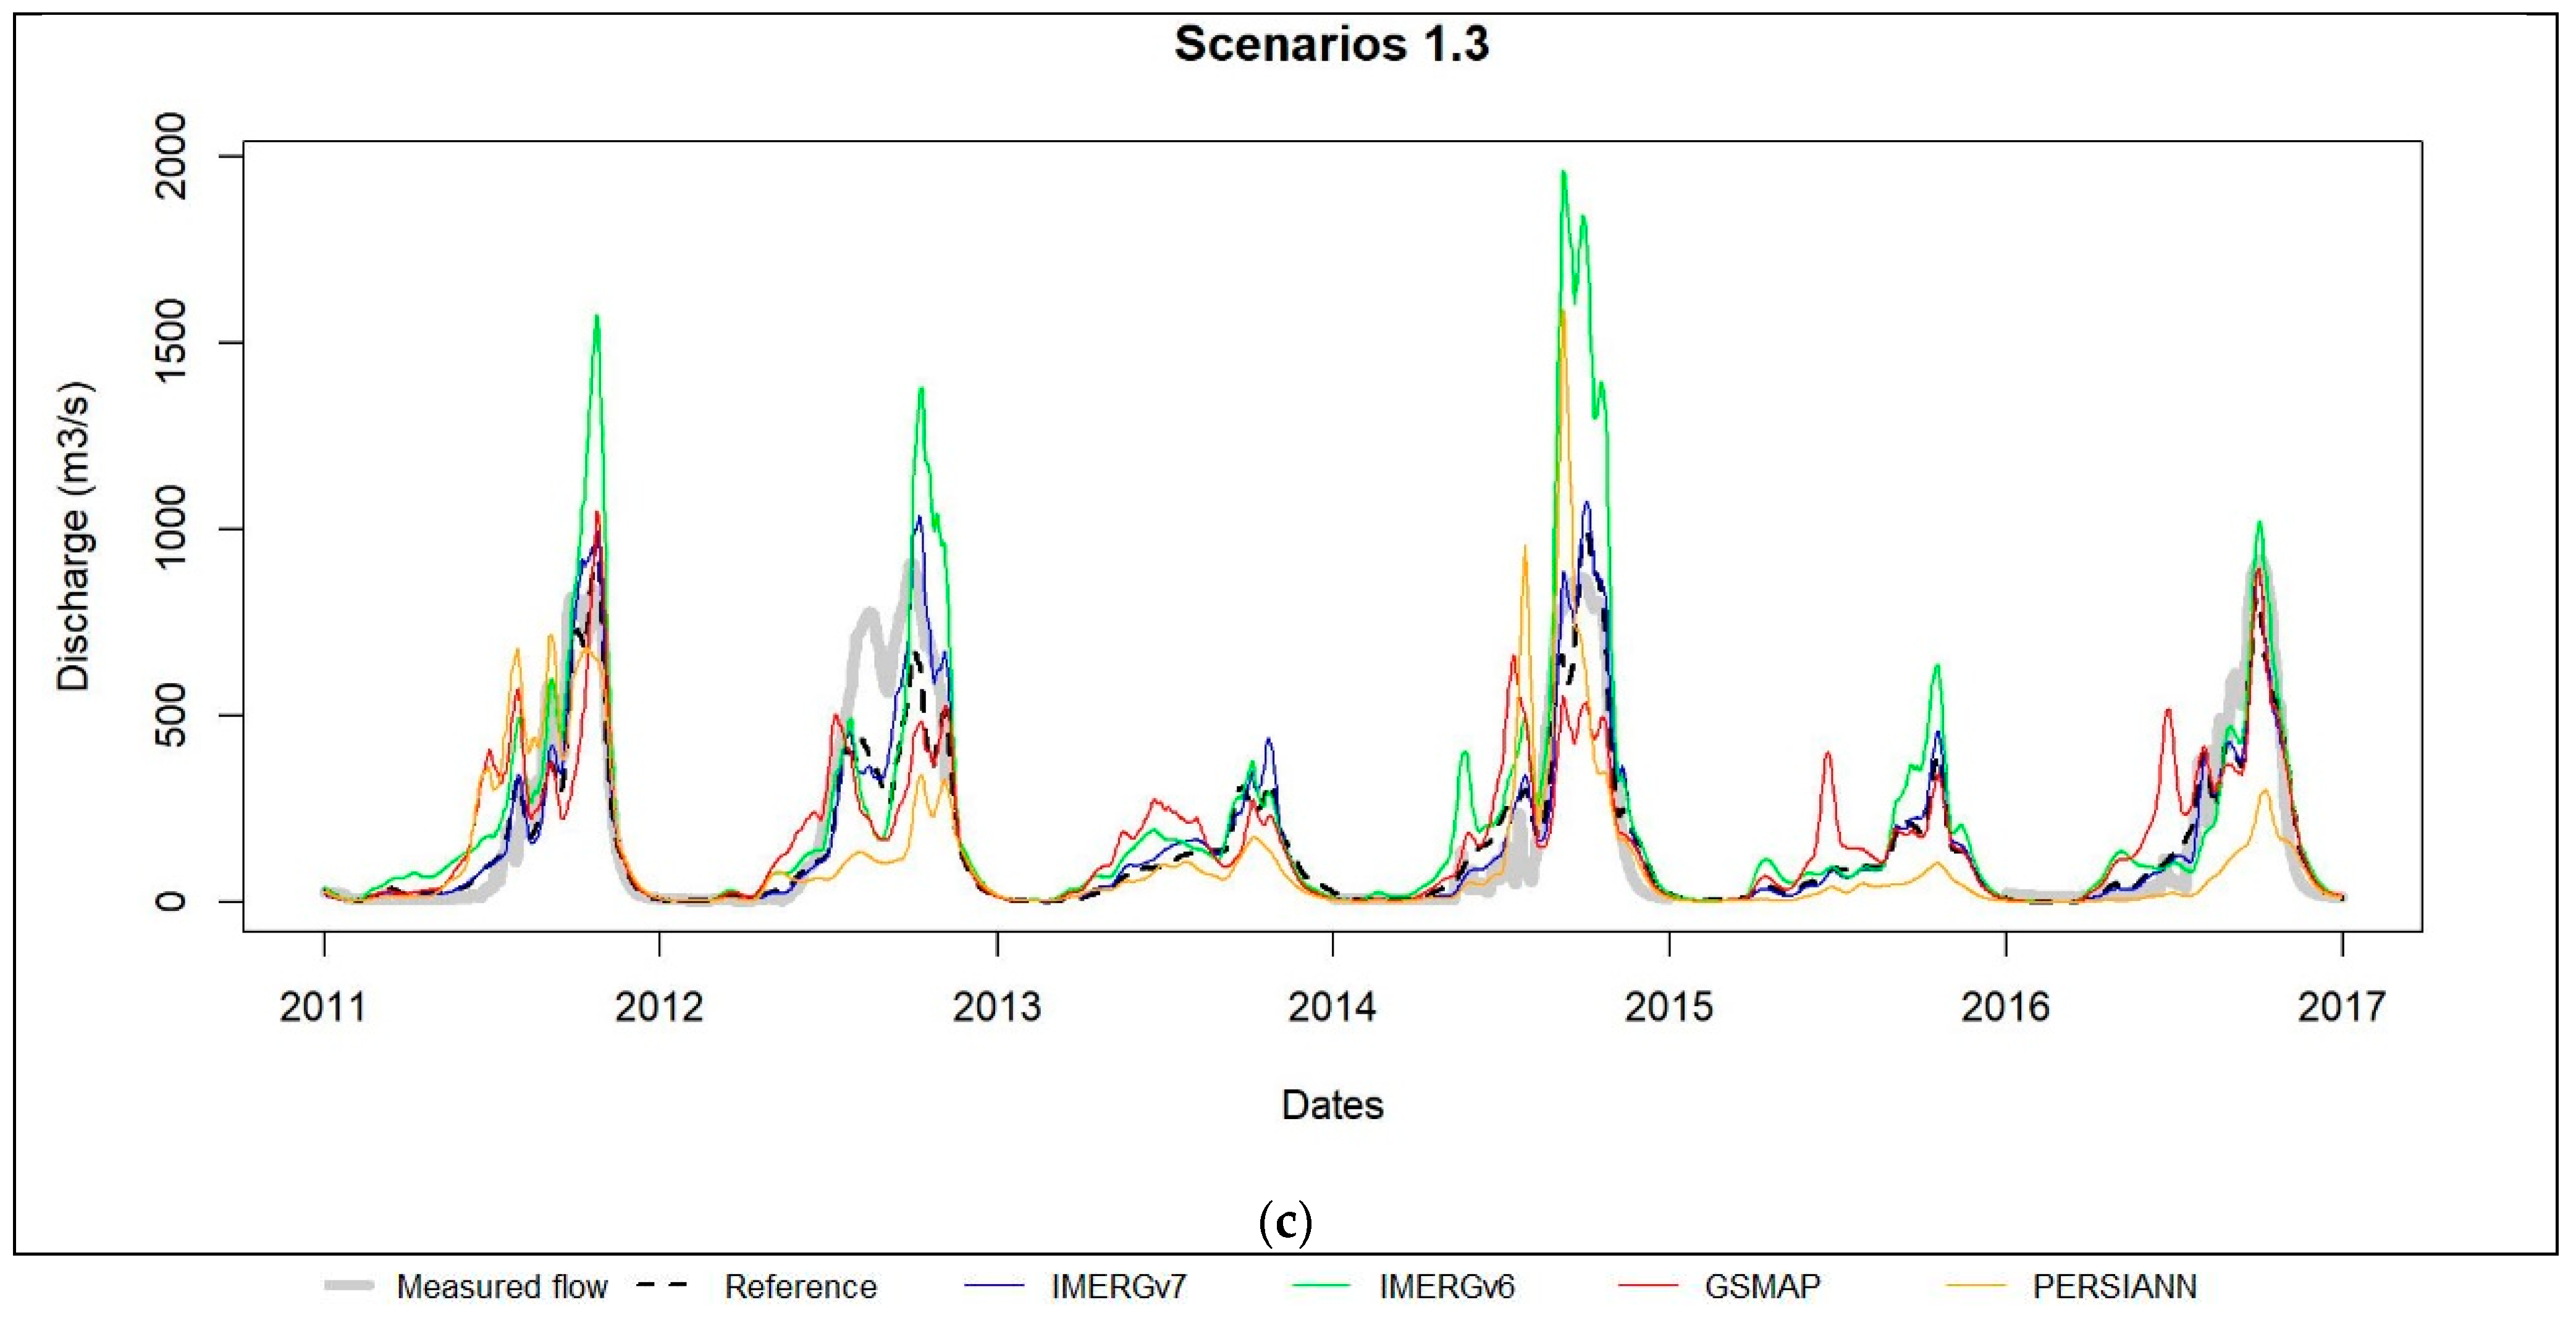
3.3. Hydrological Modeling Assessment of Satellite-Based Rainfall Data

The criteria for the performance of hydrological scenarios are reported in Table 8. Their hydrographs are presented in Figure 6 for scenario 1.1 and its variants 1.2 and 1.3 and in Figure 7 for the satellite data-based simulations.

3.3.1. Reference Scenario

For the reference scenario (scenario 1.1), the model is calibrated and validated with the ground-based rainfall dataset. The calibration ended up with excellent efficiency (NSE = 0.9, PBIAS = −0.7%). The model is validated with comparable performance as indicated in Table 8a. Despite some local overestimation of the peak flow in calibration (Figure 6a), the hydrograph from simulated discharges matches well the measured flow and presents acceptable performance in validation (Figure 6b,c).
The validation of the calibrated model using satellite products IMERGv7 and GSMAP produced very good (NSE > 0.8) and good (0.5 < NSE < 0.7) results, respectively, whether corrected (scenario 1.2) or not (scenario 1.3). The PBIAS in scenario 1.2 is worse compared to scenario 1.3 (−17.1% vs. 0% for IMERGv7 and −12.3% vs. −1.6% for GSMAP). IMERGv7 noticeably leads to better performance with uncorrected data (scenario 1.3) compared to corrected data (scenario 1.2), which is consistent with its slight increase in PBIAS after the quantile mapping correction. As for IMERGv6 and PERSIANN, good results (NSE > 0.6, |PBIAS| ≤ 0.6%) are achieved with a corrected dataset (scenarios 1.2) while the scenarios based on uncorrected data (scenarios 1.3) are not efficient (NSE < 0.4 and PBIAS > 25%).
The hydrograph from IMERGv7 in scenario 1.3 matches better the reference hydrograph. But, similarly to IMERGv6, its hydrograph from scenario 1.2 has better agreement with the hydrograph of measured flow and does not overestimate the peak flows as observed in scenarios 1.1 and 1.3. In both scenarios, the simulated hydrographs from GSMAP and PERSIANN datasets generally underestimate the peak flows and show less agreement with the reference hydrograph or the measured hydrograph, especially in the case of uncorrected data.

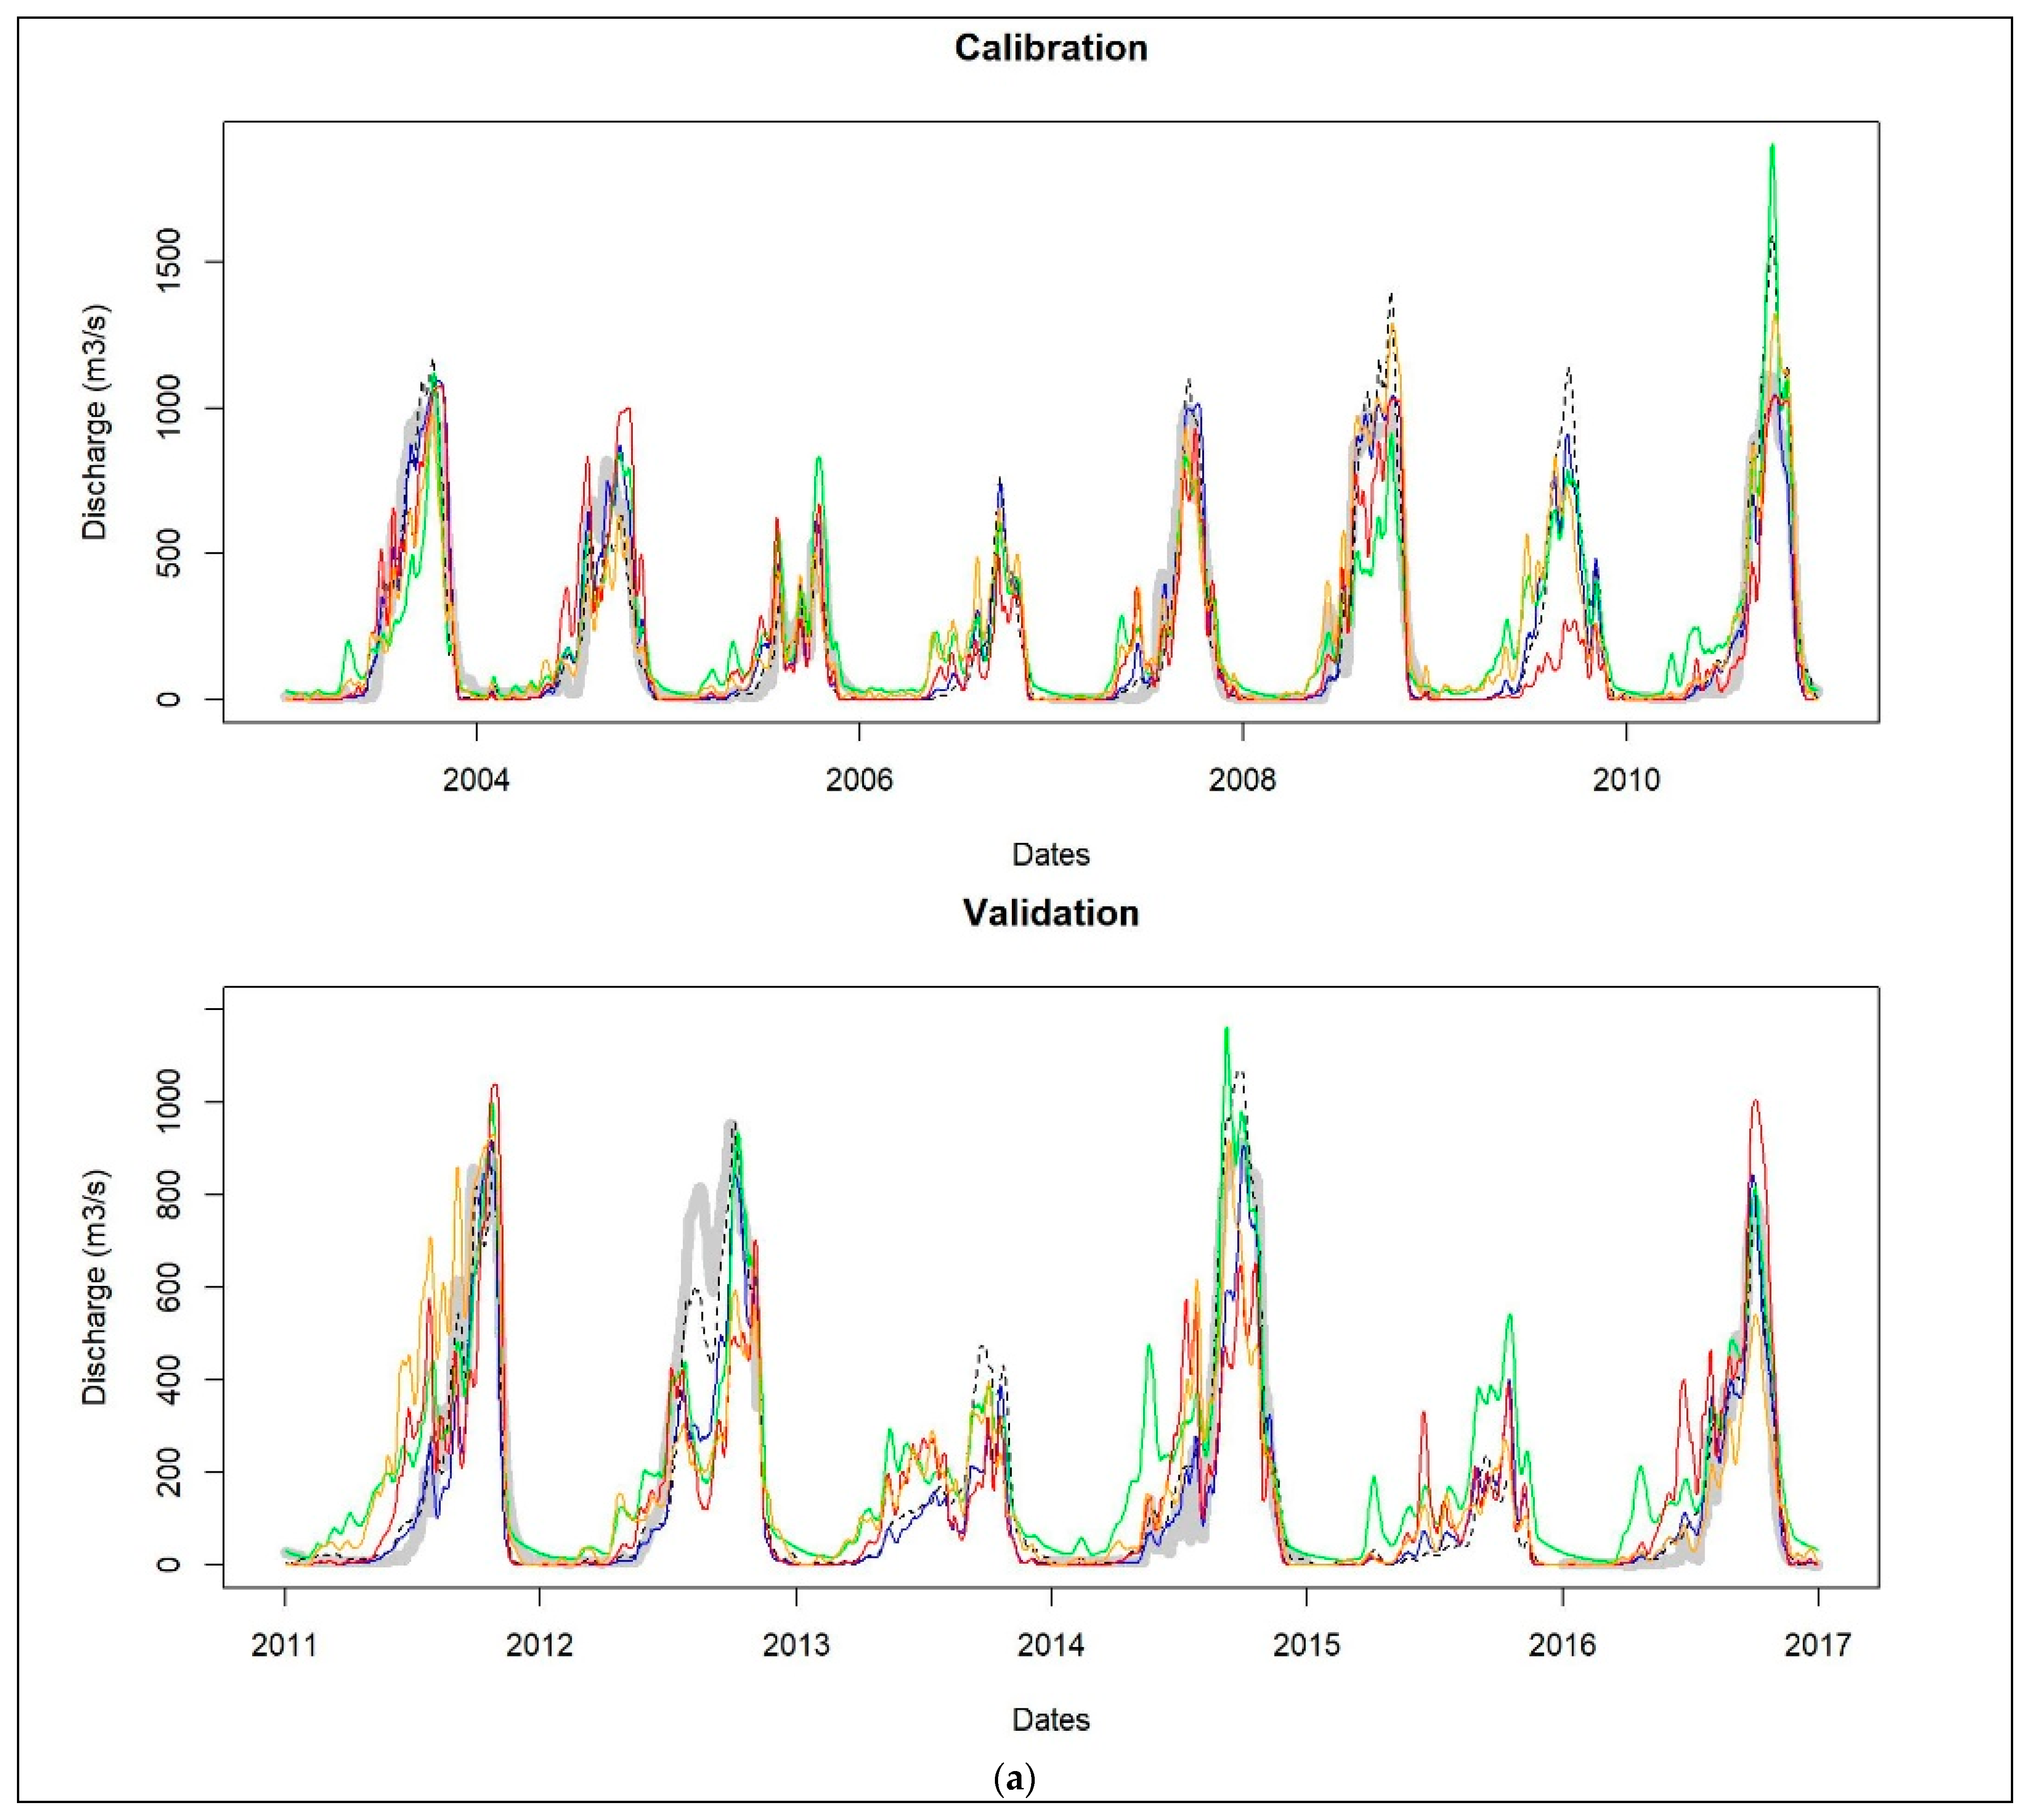
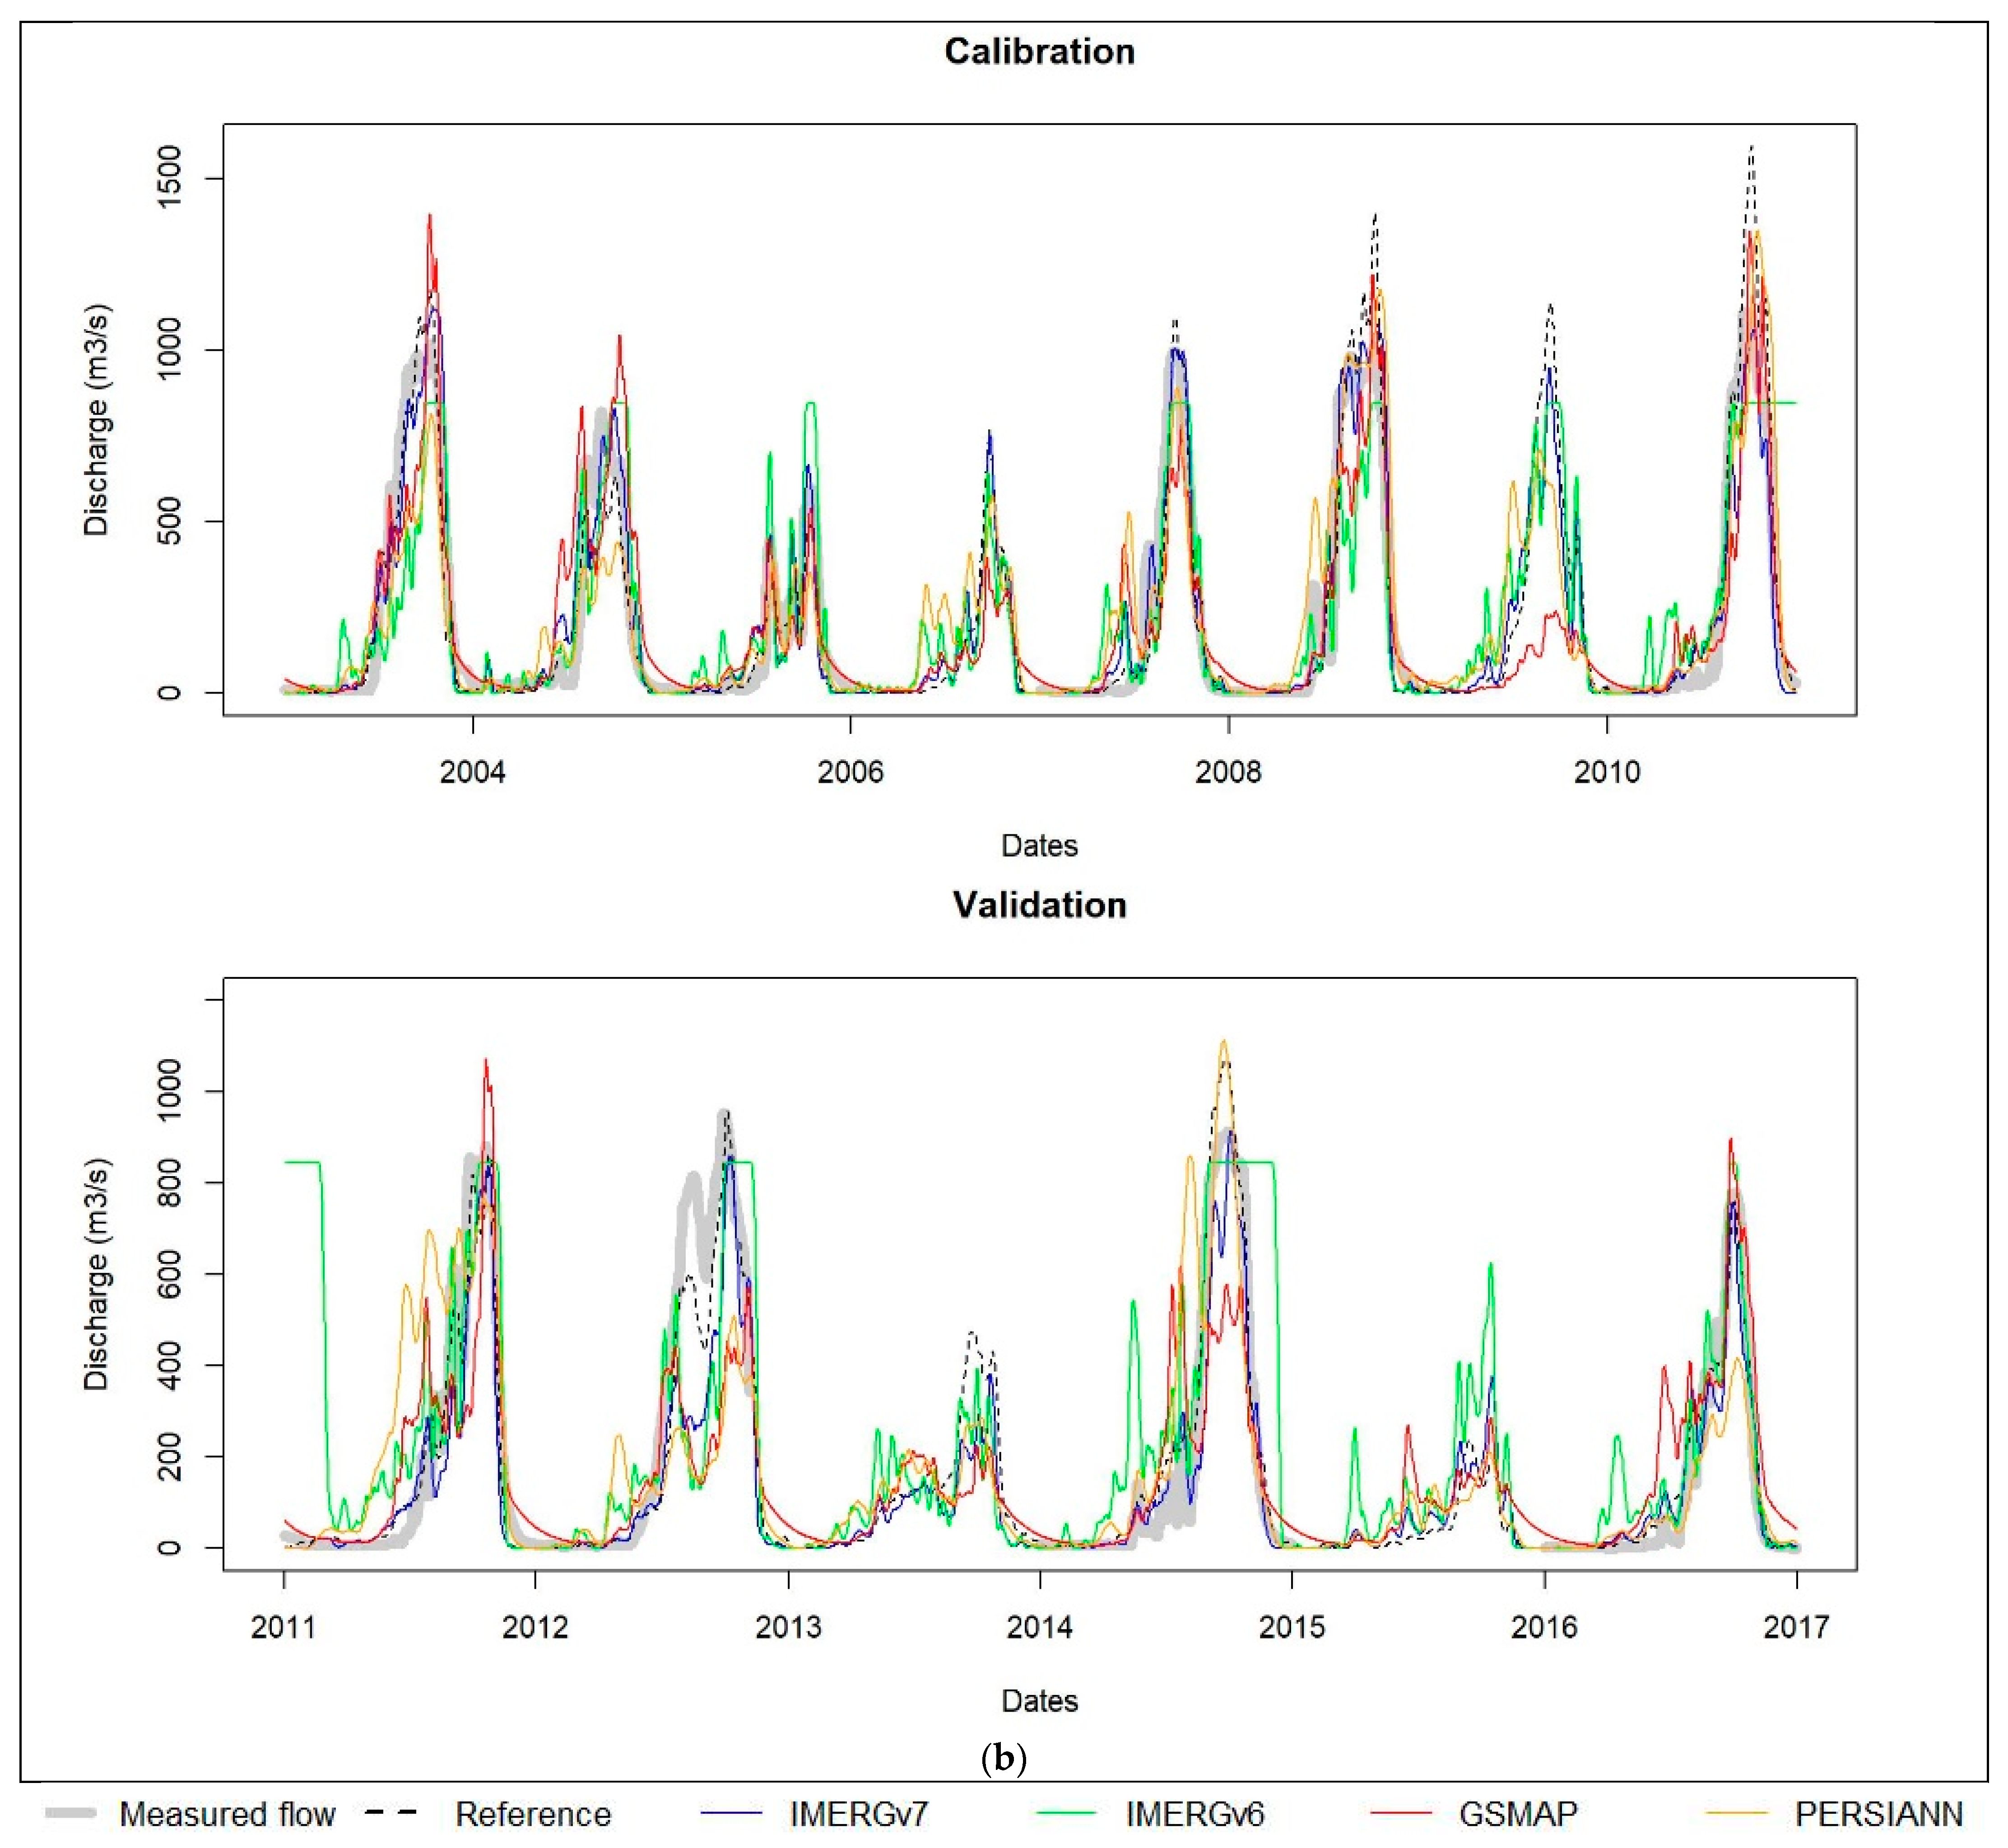
3.3.2. Satellite-Only Scenarios

The results obtained from the model calibration using corrected satellite-based data, scenario 2.2, are at least good (R ≥ 0.87, NSE ≥ 0.75, PBIAS ≤ 5%), including during the high flow period (NSE for rainy season ≥ 0.7). The best calibration results (R = 0.96, NSE = 0.93, PBIAS = −0.6%) are given by IMERGv7 rainfall datasets which almost match the reference scenario; it is successively followed by IMERGv6, GSMAP and PERSIANN. In validation, the model efficiency remains as satisfactory as in calibration with corrected IMERGv7 and IMERGv6 datasets. It becomes lower with corrected GSMAP and PERSIANN datasets but the scores remain satisfactory (NSE = 0.59–0.62) out of the rainy season where NSE ≤ 0.42.
The hydrographs in Figure 7 generally show good agreement with the observed flow in calibration no matter the product. Moreover, it is observed that the overestimations of high flows in the reference scenario do not appear in scenarios using satellite-based data, particularly IMERG datasets and especially IMERGv7. These observations also apply in validation with IMERG products while the hydrographs from GSMAP and PERSIANN are generally worse matches for the reference scenario (scenario 1.1) and the measured flows.
In scenario 3.3, the uncorrected satellite-based rainfall datasets allow an efficient calibration (NSE ≥ 0.68, R > 0.8) of the hydrological model. In validation, IMERGv7 maintains very good efficiency with NSE = 0.83 in general and 0.76 in the rainy season. The following products are IMERGv6, which is satisfactory at the scale of the high flow season with NSE = 0.64, and GSMAP, which is satisfactory in all seasons with NSE = 0.58. In terms of the hydrograph, only IMERGv7 simulates the measured flow hydrograph well.

4. Discussion

4.1. Satellite-Based Rainfall Data Accuracy

The observations on the quantitative and qualitative accuracy of the satellite-based data in the Ouémé River basin are in agreement with the behavior of such products reported by [17,59]. The quantitative mismatches between satellite- and ground-based rainfall data can be explained by sources of error in measure such as (i) the intermittent sampling of the satellite sensors and their lack of precision in estimating intermittent events [60], (ii) the potential underestimation of light rain by ground gauges due to wind- and dirt-filter-related undercatch [61], and (iii) the time lag between detection of an event by satellite and its occurrence on the ground or mismatch between gauge and satellite reporting times [21,45]. The resulting discrepancies tend to compensate each other when the time and/or space scale of accumulation increase(s). Consequently, a common thing to satellite-based rainfall data noticed here and also observed in different contexts [25,26,57,62] is the changes in their performance with time and space scales. Therefore, the larger area of BVO (47,200 km2) compared to the delta (2520 km2) can partially explain the better performance in this region.
The low scores of KGE of most of the uncorrected satellite rainfall, except IMERGv7, are in line with the results of [17,21]. Changes in performance observed from one product to another are dependent on the sensor (type and number), algorithm and source of input data. Thus, the use of both infrared (IR) and multiple passive microwave (PMW) sensors gives IMERG and GSMAP data better coverage and detection capability and, therefore, better quantitative performance than PERSIANN. In addition, additional adjustments in its revised algorithm yield reduced errors in a newer version of IMERG [63]. Furthermore, its Late run enables more processing including gauge correction for higher accuracy. This makes the superiority of IMERG data and the better performance of its v7 Late over v6 Early. With only IR sensors, PERSIANN has limited accuracy for detecting intense precipitation in tropical regions such as the Ouémé basin, where the cloud-top temperature is not always a reliable indicator of rainfall. Its inferiority indicates that its finer spatial resolution does not compensate for its limited accuracy. In the study area, this product is a typical example of how higher spatial resolution does not always result in more accurate estimates [17].

4.2. Bias Correction of Satellite-Based Rainfall Data

The efficacy of bias correction in general and specifically, the superiority of the quantile mapping method is along the same lines as the superiority of the empirical distribution-based approaches compared to parametric methods reported by [64]; it is also in agreement with the better efficacy of the empirical quantile mapping method used by [65] in the Ouémé basin at Bonou Outlet. The degree of changes induced by the bias corrections appears to be dependent on products and locations as observed by [66]. The highest reduction in RMSE (Table 7) induced in the BVO is far weaker than the 91% obtained by [66] by using the Distribution-Based Scaling (DBS) to correct two regional climate models in the same area; this may be explained by the difference in method and products used.

4.3. Hydrological Modeling Accuracy

HBV light (Table 8) has been proven to generate efficient results in the Ouémé basin at Bonou. Its performances in the current case outstrip that of the lumped models GR4J (0.83–0.75) and HMETS (NSE = 0.82–0.94) used by [67,68] and are similar to that of HEC-HMS (KGE = 0.94–0.94) used by [35] in the same basin. The satisfactory results of bias-corrected satellite rainfall in recalibration (uniform scenario) as well as in their use to validate a model initially calibrated by ground-based rainfall data (mixed scenario) enlarge the perspective of their use to the case of ground-based data unavailability. Lastly, the current study shows the propagation of the impact of bias correction and its exacerbation through hydrological modeling, whose efficiency changes by up to 50% due to the bias correction versus 30% in rainfall datasets. This indicates the applicability of the quantile mapping-based corrected data for generating flows in the BVO, especially using IMERGv6 Early.

4.4. Interests and Limitations of the Study

This study has the specificity to be the first to focus on near real-time satellite-based rainfall data reliability on the scale of the Ouémé River basin. It serves as a basis for the use of these data to complete or substitute ground-based data in water resource assessment and management in this basin. By using the near real-time data, it further has the benefits of contributing to real-time applications such as flood forecasting and mapping and warning systems in the study area.
The main limitation of the hydrological modeling is the consideration of the Ouémé basin as a single entity with average characteristics, whereas its climatic conditions, vegetation cover and soil vary widely in space. Further, a proper model sensitivity was not carried out. It is also worth pointing out that the scarcity of ground-based data is a factor that limits the score of efficiency when assessing satellite-based data ability in quantifying rainfall as well as in flow simulations. In addition, since the comparison in this paper is areal rainfall-based, the difference in the area of the two subdomains of interest did not allow us to conclude about the elevation-dependent performance of the products, which is another cause of the spatially varying reliability of satellite products [69]. These limitations provide perspectives for future studies and suggest carrying out ground-based measurement campaigns to increase the reliability of the results. The hydrodynamic modeling-based assessment remains to be considered.
The method presented is practical no matter the region. However, the results of the quantitative assessment are specific to the Ouémé basin and its delta. They could be extended to a neighboring basin with similar characteristics and areas. But in other regions, especially where hydrometeorological and environmental conditions are different, the conclusions of this study may be transposed, at most, as an indication to serve as a basis for the choice of satellite products to be evaluated.

5. Conclusions

This study compared four near real-time satellite-based rainfall datasets (IMERGv7 Late, IMERGv6 Early, GSMaP-NRT and PERSIANN-DIR Now) to ground-based rainfall data. They are further bias-corrected and used in HBV light hydrological modeling in the Ouémé River basin for flow simulation. First of all, the comparison of these satellite-based rainfall data to ground-based data highlights their ability to capture the annual rainfall cycle in the Ouémé basin but presents quantitative discrepancies with ground-based rainfall data at daily temporal resolution. IMERGv7 datasets are the most accurate product, having satisfactory performances (KGE > 0.5, PBIAS ≤ 2%) while the statistics for the other products are characterized by unsatisfactory scores of efficiencies with KGE < 0.5 (even close or inferior to 0) and high values of PBIAS (up to 30%). Second, the analysis of bias-correction outputs shows that the magnitude of the correction is product- and location-dependent and appoints quantile mapping as a more effective model compared to additive, multiplicative and linear scaling models. Finally, hydrological simulations using HBV light in the Ouémé basin at Bonou showed, in the first place, the efficiency of flow modeling using ground-based rainfall (NSE > 0.9) and the recalibration of the model using bias-corrected satellite data (NSE ≥ 0.6). In the second place, the corrected satellite-based rainfall-driven validation of the model initially calibrated with ground-based rainfall produced acceptable results for GSMaP and PERSIANN datasets and better results for IMERGv7 and IMERGv6. The above findings underscore the potential of satellite rainfall products, particularly IMERG v7 Late and IMERGv6 Early, for hydrological simulations in the Ouémé basin. Their enhanced performance, especially after quantile mapping correction, supports their suitability for near-real-time flood modeling, providing a valuable alternative to substitute or complete ground-based data for decision making in flood management.

Author Contributions

Conceptualization: M.B. and K.P.; Data curation: M.B.; Formal analysis: M.B., K.P. and J.H.; Methodology: M.B., K.P., J.H. and A.B.A.; Software: M.B. and J.H.; Supervision: H.E.V.D., J.A. and A.B.A.; Visualization: M.B., K.P., D.J.A., J.H., H.E.V.D. and A.B.A.; Writing: M.B., K.P., D.J.A., J.H., H.E.V.D. and A.B.A. All authors have read and agreed to the published version of the manuscript.

Funding

This study was made in the context of a PhD funded by the BMBF (Bundesministerium für Bildung und Forschung) through the project Current and future risks of urban and rural flooding in West Africa (FURIFLOOD project), Grant n° 01LG2086B. The APC was also covered by the FURIFLOOD project.

Data Availability Statement

The in situ discharge and meteorological data are the properties of, respectively, the national office of water (DGEau) and the office of meteorology (Météo Bénin) and available on written request to their owners. GSMAP rainfall data are available for download from the GSMAP Real-Time Office after registration on their website: https://sharaku.eorc.jaxa.jp/GSMaP/index.htm, accessed on 29 April 2024. PERSIANN-DIR Now rainfall data are openly available in https://chrsdata.eng.uci.edu/, accessed on 1 September 2023. The software HBV light is freely available at the link https://www.geo.uzh.ch/en/units/h2k/Services/HBV-Model/HBV-Download.html (accessed on 29 April 2024).

Acknowledgments

The authors acknowledge the partners of the project Current and future risks of urban and rural flooding in West Africa (FURIFLOOD project) and its funder, the BMBF. They also thank the in situ data providers, namely DGeau, Météo Bénin and their GPM IMERG satellite-based data access facilitator. Their gratitude also goes to M. Quenum for their contribution in programing and review and F. Badou for their contribution in review.

Conflicts of Interest

The authors declare no conflicts of interest.

References

  1. IPCC; Intergovernmental Panel On Climate Change. Climate Change 2021—The Physical Science Basis: Working Group I Contribution to the Sixth Assessment Report of the Intergovernmental Panel on Climate Change, 1st ed.; Cambridge University Press: Cambridge, UK, 2023; ISBN 978-1-009-15789-6. [Google Scholar]
  2. Sylla, M.B.; Nikiema, P.M.; Gibba, P.; Kebe, I.; Klutse, N.A.B. Climate Change over West Africa: Recent Trends and Future Projections. In Adaptation to Climate Change and Variability in Rural West Africa; Yaro, J.A., Hesselberg, J., Eds.; Springer International Publishing: Cham, Switzerland, 2016; pp. 25–40. ISBN 978-3-319-31497-6. [Google Scholar]
  3. Tabari, H.; Hosseinzadehtalaei, P.; Thiery, W.; Willems, P. Amplified Drought and Flood Risk Under Future Socioeconomic and Climatic Change. Earth’s Future 2021, 9, e2021EF002295. [Google Scholar] [CrossRef]
  4. Ekolu, J.; Dieppois, B.; Tramblay, Y.; Villarini, G.; Slater, L.J.; Mahé, G.; Paturel, J.-E.; Eden, J.M.; Moulds, S.; Sidibe, M.; et al. Variability in flood frequency in sub-Saharan Africa: The role of large-scale climate modes of variability and their future impacts. J. Hydrol. 2024, 640, 131679. [Google Scholar] [CrossRef]
  5. Panthou, G.; Lebel, T.; Vischel, T.; Quantin, G.; Sane, Y.; Ba, A.; Ndiaye, O.; Diongue-Niang, A.; Diopkane, M. Rainfall intensification in tropical semi-arid regions: The Sahelian case. Environ. Res. Lett. 2018, 13, 064013. [Google Scholar] [CrossRef]
  6. Tramblay, Y.; Villarini, G.; Zhang, W. Observed changes in flood hazard in Africa. Environ. Res. Lett. 2020, 15, 1040b5. [Google Scholar] [CrossRef]
  7. Quenum, G.M.L.D.; Nkrumah, F.; Klutse, N.A.B.; Sylla, M.B. Spatiotemporal Changes in Temperature and Precipitation in West Africa. Part I: Analysis with the CMIP6 Historical Dataset. Water 2021, 13, 3506. [Google Scholar] [CrossRef]
  8. Dibi-Anoh, P.A.; Koné, M.; Gerdener, H.; Kusche, J.; N’Da, C.K. Hydrometeorological Extreme Events in West Africa: Droughts. Surv. Geophys. 2023, 44, 173–195. [Google Scholar] [CrossRef]
  9. Arnaud, P.; Lavabre, J.; Fouchier, C.; Diss, S.; Javelle, P. Sensitivity of hydrological models to uncertainty in rainfall input. Hydrol. Sci. J. 2011, 56, 397–410. [Google Scholar] [CrossRef]
  10. Bruni, G.; Reinoso, R.; Van De Giesen, N.C.; Clemens, F.H.L.R.; Ten Veldhuis, J.A.E. On the sensitivity of urban hydrodynamic modelling to rainfall spatial and temporal resolution. Hydrol. Earth Syst. Sci. 2015, 19, 691–709. [Google Scholar] [CrossRef]
  11. Huang, Y.; Bárdossy, A.; Zhang, K. Sensitivity of hydrological models to temporal and spatial resolutions of rainfall data. Hydrol. Earth Syst. Sci. 2019, 23, 2647–2663. [Google Scholar] [CrossRef]
  12. Bliefernicht, J.; Salack, S.; Waongo, M.; Annor, T.; Laux, P.; Kunstmann, H. Towards a historical precipitation database for West Africa: Overview, quality control and harmonization. Int. J. Climatol. 2022, 42, 4001–4023. [Google Scholar] [CrossRef]
  13. Hounkpè, J.; Diekkrüger, B.; Badou, D.; Afouda, A. Change in Heavy Rainfall Characteristics over the Ouémé River Basin, Benin Republic, West Africa. Climate 2016, 4, 15. [Google Scholar] [CrossRef]
  14. Belabid, N.; Zhao, F.; Brocca, L.; Huang, Y.; Tan, Y. Near-Real-Time Flood Forecasting Based on Satellite Precipitation Products. Remote Sens. 2019, 11, 252. [Google Scholar] [CrossRef]
  15. Brocca, L.; Massari, C.; Pellarin, T.; Filippucci, P.; Ciabatta, L.; Camici, S.; Kerr, Y.H.; Fernández-Prieto, D. River flow prediction in data scarce regions: Soil moisture integrated satellite rainfall products outperform rain gauge observations in West Africa. Sci. Rep. 2020, 10, 12517. [Google Scholar] [CrossRef] [PubMed]
  16. Maggioni, V.; Massari, C. On the performance of satellite precipitation products in riverine flood modeling: A review. J. Hydrol. 2018, 558, 214–224. [Google Scholar] [CrossRef]
  17. Mekonnen, K.; Velpuri, N.M.; Leh, M.; Akpoti, K.; Owusu, A.; Tinonetsana, P.; Hamouda, T.; Ghansah, B.; Paranamana, T.P.; Munzimi, Y. Accuracy of satellite and reanalysis rainfall estimates over Africa: A multi-scale assessment of eight products for continental applications. J. Hydrol. Reg. Stud. 2023, 49, 101514. [Google Scholar] [CrossRef]
  18. Ngo-Duc, T.; Matsumoto, J.; Kamimera, H.; Bui, H.-H. Monthly adjustment of Global Satellite Mapping of Precipitation (GSMaP) data over the VuGia–ThuBon River Basin in Central Vietnam using an artificial neural network. Hydrol. Res. Lett. 2013, 7, 85–90. [Google Scholar] [CrossRef]
  19. Casse, C.; Gosset, M.; Peugeot, C.; Pedinotti, V.; Boone, A.; Tanimoun, B.A.; Decharme, B. Potential of satellite rainfall products to predict Niger River flood events in Niamey. Atmos. Res. 2015, 163, 162–176. [Google Scholar] [CrossRef]
  20. Yonaba, R.; Belemtougri, A.; Fowé, T.; Mounirou, L.A.; Nkiaka, E.; Dembélé, M.; Komlavi, A.; Coly, S.M.; Koïta, M.; Karambiri, H. Rainfall estimation in the West African Sahel: Comparison and cross-validation of top-down vs. bottom-up precipitation products in Burkina Faso. Geocarto Int. 2024, 39, 2391956. [Google Scholar] [CrossRef]
  21. Satgé, F.; Defrance, D.; Sultan, B.; Bonnet, M.-P.; Seyler, F.; Rouché, N.; Pierron, F.; Paturel, J.-E. Evaluation of 23 gridded precipitation datasets across West Africa. J. Hydrol. 2020, 581, 124412. [Google Scholar] [CrossRef]
  22. Houngnibo, M.C.M.; Minoungou, B.; Traore, S.B.; Maidment, R.I.; Alhassane, A.; Ali, A. Validation of high-resolution satellite precipitation products over West Africa for rainfall monitoring and early warning. Front. Clim. 2023, 5, 1185754. [Google Scholar] [CrossRef]
  23. Badou, D.F.; Diekkrüger, B.; Kapangaziwiri, E.; Mbaye, M.L.; Yira, Y.; Lawin, E.A.; Oyerinde, G.T.; Afouda, A. Modelling blue and green water availability under climate change in the Beninese Basin of the Niger River Basin, West Africa. Hydrol. Process. 2018, 32, 2526–2542. [Google Scholar] [CrossRef]
  24. Oyerinde, G.T.; Fademi, I.O.; Denton, O.A. Modeling runoff with satellite-based rainfall estimates in the Niger basin. Cogent Food Agric. 2017, 3, 1363340. [Google Scholar] [CrossRef]
  25. Hounguè, N.R.; Ogbu, K.N.; Almoradie, A.D.S.; Evers, M. Evaluation of the performance of remotely sensed rainfall datasets for flood simulation in the transboundary Mono River catchment, Togo and Benin. J. Hydrol. Reg. Stud. 2021, 36, 100875. [Google Scholar] [CrossRef]
  26. Dembélé, M.; Zwart, S.J. Evaluation and comparison of satellite-based rainfall products in Burkina Faso, West Africa. Int. J. Remote Sens. 2016, 37, 3995–4014. [Google Scholar] [CrossRef]
  27. Trinh, M.X.; Molkenthin, F. Flood hazard mapping for data-scarce and ungauged coastal river basins using advanced hydrodynamic models, high temporal-spatial resolution remote sensing precipitation data, and satellite imageries. Nat. Hazards 2021, 109, 441–469. [Google Scholar] [CrossRef]
  28. Bodjrenou, R.; Cohard, J.-M.; Hector, B.; Lawin, E.A.; Chagnaud, G.; Danso, D.K.; N’tcha M’po, Y.; Badou, F.; Ahamide, B. Evaluation of Reanalysis Estimates of Precipitation, Radiation, and Temperature over Benin (West Africa). J. Appl. Meteorol. Climatol. 2023, 62, 1005–1022. [Google Scholar] [CrossRef]
  29. Bodjrènou, R.; Sintondji, L.O.; Comandan, F. Hydrological modeling with physics-based models in the oueme basin: Issues and perspectives for simulation optimization. J. Hydrol. Reg. Stud. 2023, 48, 101448. [Google Scholar] [CrossRef]
  30. Le Barbé, L.; Alé, G.; Millet, B.; Texier, H.; Borel, Y.; Gualde, R. Les Ressources en Eaux Superficielles de la RÉPUBLIQUE du Bénin; ORSTOM Edition: Paris, France, 1993; ISBN 2-7099-1168-X. [Google Scholar]
  31. Ague, A.; Afouda, A. Analyse fréquentielle et nouvelle cartographie des maxima annuels de pluies journalières au Bénin. Int. J. Bio. Chem. Sci. 2015, 9, 121. [Google Scholar] [CrossRef]
  32. Akpo, A.B.; Galy-Lacaux, C.; Laouali, D.; Delon, C.; Liousse, C.; Adon, M.; Gardrat, E.; Mariscal, A.; Darakpa, C. Precipitation chemistry and wet deposition in a remote wet savanna site in West Africa: Djougou (Benin). Atmos. Environ. 2015, 115, 110–123. [Google Scholar] [CrossRef]
  33. Djossou, J.; Akpo, A.; Afféwé, J.; Donnou, V.; Liousse, C.; Léon, J.-F.; Nonfodji, F.; Awanou, C. Dynamics of the Inter Tropical Front and Rainy Season Onset in Benin. Curr. J. Appl. Sci. Technol. 2017, 24, 1–15. [Google Scholar] [CrossRef]
  34. Bossa, Y.A.; Djangni, O.; Yira, Y.; Hounkpè, J.; Avossè, A.D.; Sintondji, L.O. Flood Risk Assessment in the Lower Valley of Ouémé, Benin. Open J. Mod. Hydrol. 2024, 14, 130–151. [Google Scholar] [CrossRef]
  35. Lawin, A.E.; Hounguè, R.; N’Tcha M’Po, Y.; Hounguè, N.R.; Attogouinon, A.; Afouda, A.A. Mid-Century Climate Change Impacts on Ouémé River Discharge at Bonou Outlet (Benin). Hydrology 2019, 6, 72. [Google Scholar] [CrossRef]
  36. Chaigneau, A.; Okpeitcha, O.V.; Morel, Y.; Stieglitz, T.; Assogba, A.; Benoist, M.; Allamel, P.; Honfo, J.; Awoulmbang Sakpak, T.D.; Rétif, F.; et al. From seasonal flood pulse to seiche: Multi-frequency water-level fluctuations in a large shallow tropical lagoon (Nokoué Lagoon, Benin). Estuar. Coast. Shelf Sci. 2022, 267, 107767. [Google Scholar] [CrossRef]
  37. Jobard, I.; Chopin, F.; Berges, J.C.; Roca, R. An intercomparison of 10-day satellite precipitation products during West African monsoon. Int. J. Remote Sens. 2011, 32, 2353–2376. [Google Scholar] [CrossRef]
  38. Poméon, T.; Jackisch, D.; Diekkrüger, B. Evaluating the performance of remotely sensed and reanalysed precipitation data over West Africa using HBV light. J. Hydrol. 2017, 547, 222–235. [Google Scholar] [CrossRef]
  39. Nwachukwu, P.N.; Satge, F.; Yacoubi, S.E.; Pinel, S.; Bonnet, M.-P. From TRMM to GPM: How Reliable Are Satellite-Based Precipitation Data across Nigeria? Remote Sens. 2020, 12, 3964. [Google Scholar] [CrossRef]
  40. Yue, H.; Gebremichael, M.; Nourani, V. Performance of the Global Forecast System’s medium-range precipitation forecasts in the Niger river basin using multiple satellite-based products. Hydrol. Earth Syst. Sci. 2022, 26, 167–181. [Google Scholar] [CrossRef]
  41. Kuntoro, A.A.; Hapsari, R.K.; Adityawan, M.B.; Farid, M. Estimation of Extreme Rainfall over Kalimantan Island based on GPM IMERG Daily Data. IOP Conf. Ser. Earth Environ. Sci. 2022, 1065, 012036. [Google Scholar] [CrossRef]
  42. Su, F.; Hong, Y.; Lettenmaier, D.P. Evaluation of TRMM Multisatellite Precipitation Analysis (TMPA) and Its Utility in Hydrologic Prediction in the La Plata Basin. J. Hydrometeorol. 2008, 9, 622–640. [Google Scholar] [CrossRef]
  43. Ran, Q.; Fu, W.; Liu, Y.; Li, T.; Shi, K.; Sivakumar, B. Evaluation of Quantitative Precipitation Predictions by ECMWF, CMA, and UKMO for Flood Forecasting: Application to Two Basins in China. Nat. Hazards Rev. 2018, 19, 05018003. [Google Scholar] [CrossRef]
  44. Wilks, D.S. Statistical Methods in the Atmospheric Sciences, 2nd ed.; International geophysics series; Elsevier: Amsterdam,The Netherlands; Paris, France, 2006; ISBN 978-0-12-751966-1. [Google Scholar]
  45. Moriasi, D.N.; Arnold, J.G.; Van Liew, M.W.; Bingner, R.L.; Harmel, R.D.; Veith, T.L. Model Evaluation Guidelines for Systematic Quantification of Accuracy in Watershed Simulations. Trans. ASABE 2007, 50, 885–900. [Google Scholar] [CrossRef]
  46. Beck, H.E.; Pan, M.; Roy, T.; Weedon, G.P.; Pappenberger, F.; Van Dijk, A.I.J.M.; Huffman, G.J.; Adler, R.F.; Wood, E.F. Daily evaluation of 26 precipitation datasets using Stage-IV gauge-radar data for the CONUS. Hydrol. Earth Syst. Sci. 2019, 23, 207–224. [Google Scholar] [CrossRef]
  47. Devi, U.; Shekhar, M.S.; Singh, G.P. Correction of mesoscale model daily precipitation data over Northwestern Himalaya. Theor. Appl. Climatol. 2021, 143, 51–60. [Google Scholar] [CrossRef]
  48. WMO. Guide D’utilisation de L’indice de Précipitations Normalize; WMO: Geneva, Switzerland, 2012. [Google Scholar]
  49. Tian, Y.; Huffman, G.J.; Adler, R.F.; Tang, L.; Sapiano, M.; Maggioni, V.; Wu, H. Modeling errors in daily precipitation measurements: Additive or multiplicative? Geophys. Res. Lett. 2013, 40, 2060–2065. [Google Scholar] [CrossRef]
  50. Gudmundsson, L.; Bremnes, J.B.; Haugen, J.E.; Engen-Skaugen, T. Technical Note: Downscaling RCM precipitation to the station scale using statistical transformations—A comparison of methods. Hydrol. Earth Syst. Sci. 2012, 16, 3383–3390. [Google Scholar] [CrossRef]
  51. Stisen, S.; Sandholt, I. Evaluation of remote-sensing-based rainfall products through predictive capability in hydrological runoff modelling. Hydrol. Process. 2010, 24, 879–891. [Google Scholar] [CrossRef]
  52. Li, N.; Tang, G.; Zhao, P.; Hong, Y.; Gou, Y.; Yang, K. Statistical assessment and hydrological utility of the latest multi-satellite precipitation analysis IMERG in Ganjiang River basin. Atmos. Res. 2017, 183, 212–223. [Google Scholar] [CrossRef]
  53. Beck, H.E.; Vergopolan, N.; Pan, M.; Levizzani, V.; Van Dijk, A.I.J.M.; Weedon, G.P.; Brocca, L.; Pappenberger, F.; Huffman, G.J.; Wood, E.F. Global-scale evaluation of 22 precipitation datasets using gauge observations and hydrological modeling. Hydrol. Earth Syst. Sci. 2017, 21, 6201–6217. [Google Scholar] [CrossRef]
  54. Seibert, J.; Vis, M.J. Teaching hydrological modeling with a user-friendly catchment-runoff-model software package. Hydrol. Earth Syst. Sci. 2012, 16, 3315–3325. [Google Scholar] [CrossRef]
  55. Habib, E.; Haile, A.; Sazib, N.; Zhang, Y.; Rientjes, T. Effect of Bias Correction of Satellite-Rainfall Estimates on Runoff Simulations at the Source of the Upper Blue Nile. Remote Sens. 2014, 6, 6688–6708. [Google Scholar] [CrossRef]
  56. Goshime, D.W.; Absi, R.; Ledésert, B. Evaluation and Bias Correction of CHIRP Rainfall Estimate for Rainfall-Runoff Simulation over Lake Ziway Watershed, Ethiopia. Hydrology 2019, 6, 68. [Google Scholar] [CrossRef]
  57. McMahon, T.A.; Peel, M.C.; Lowe, L.; Srikanthan, R.; McVicar, T.R. Estimating actual, potential, reference crop and pan evaporation using standard meteorological data: A pragmatic synthesis. Hydrol. Earth Syst. Sci. 2013, 17, 1331–1363. [Google Scholar] [CrossRef]
  58. Masood, M.; Naveed, M.; Iqbal, M.; Nabi, G.; Kashif, H.M.; Jawad, M.; Mujtaba, A. Evaluation of Satellite Precipitation Products for Estimation of Floods in Data-Scarce Environment. Adv. Meteorol. 2023, 2023, 1685720. [Google Scholar] [CrossRef]
  59. Ogbu, K.N.; Hounguè, N.R.; Gbode, I.E.; Tischbein, B. Performance Evaluation of Satellite-Based Rainfall Products over Nigeria. Climate 2020, 8, 103. [Google Scholar] [CrossRef]
  60. Peinó, E.; Bech, J.; Udina, M.; Polls, F. Disentangling Satellite Precipitation Estimate Errors of Heavy Rainfall at the Daily and Sub-Daily Scales in the Western Mediterranean. Remote Sens. 2024, 16, 457. [Google Scholar] [CrossRef]
  61. Maranan, M.; Fink, A.H.; Knippertz, P.; Francis, S.D.; Akpo, A.B.; Jegede, G.; Yorke, C. Interactions between Convection and a Moist Vortex Associated with an Extreme Rainfall Event over Southern West Africa. Mon. Weather. Rev. 2019, 147, 2309–2328. [Google Scholar] [CrossRef]
  62. Maranan, M.; Fink, A.H.; Knippertz, P.; Amekudzi, L.K.; Atiah, W.A.; Stengel, M. A Process-Based Validation of GPM IMERG and Its Sources Using a Mesoscale Rain Gauge Network in the West African Forest Zone. J. Hydrometeorol. 2020, 21, 729–749. [Google Scholar] [CrossRef]
  63. Wang, Y.; Li, Z.; Gao, L.; Zhong, Y.; Peng, X. Comparison of GPM IMERG Version 06 Final Run Products and Its Latest Version 07 Precipitation Products across Scales: Similarities, Differences and Improvements. Remote Sens. 2023, 15, 5622. [Google Scholar] [CrossRef]
  64. Themeßl, M.J.; Gobiet, A.; Heinrich, G. Empirical-statistical downscaling and error correction of regional climate models and its impact on the climate change signal. Climatic Change 2012, 112, 449–468. [Google Scholar] [CrossRef]
  65. M’Po, Y.N.; Lawin, A.E.; Oyerinde, G.T.; Yao, B.K.; Afouda, A.A. Comparison of Daily Precipitation Bias Correction Methods Based on Four Regional Climate Model Outputs in Ouémé Basin, Benin. Hydrology 2016, 4, 58. [Google Scholar] [CrossRef]
  66. Biao, E. Assessing the Impacts of Climate Change on River Discharge Dynamics in Oueme River Basin (Benin, West Africa). Hydrology 2017, 4, 47. [Google Scholar] [CrossRef]
  67. Kodja, D.J.; Akognongbé, A.J.S.; Amoussou, E.; Mahé, G.; Vissin, E.W.; Paturel, J.-E.; Houndénou, C. Calibration of the hydrological model GR4J from potential evapotranspiration estimates by the Penman-Monteith and Oudin methods in the Ouémé watershed (West Africa). Proc. Int. Assoc. Hydrol. Sci. 2020, 383, 163–169. [Google Scholar] [CrossRef]
  68. Essou, G.; Brissette, F. Climate Change Impacts on the Ouémé River, Benin, West Africa. J. Earth Sci. Clim. Change 2013, 4, 1. [Google Scholar] [CrossRef]
  69. Yong, B.; Ren, L.L.; Hong, Y.; Wang, J.H.; Gourley, J.J.; Jiang, S.H.; Chen, X.; Wang, W. Hydrologic evaluation of Multisatellite Precipitation Analysis standard precipitation products in basins beyond its inclined latitude band: A case study in Laohahe basin, China. Water Resour. Res. 2010, 46, 2009WR008965. [Google Scholar] [CrossRef]
Figure 1. Map of the study area showing: (a) Benin in Africa, (b) the study area in Benin with hydrographic network, floodplain and water bodies, (c) the study area with ground-gauges location and center of satellites products grid cells with PERSIANN in gray, and IMERG and GSMAP in green.
Hydrology 12 00071 g001
Figure 2. General structure of HBV model presented in its software.
Hydrology 12 00071 g002
Figure 3. Seasonal rainfall cycle according to data from ground gauges (gray), IMERGv7 (blue), IMERGv6 (green), GSMAP (red) and PERSIANN (orange) during the period of 2001–2018 (a) in the Ouémé basin at Bonou outlet and (b) in the delta.
Hydrology 12 00071 g003
Figure 4. Taylor diagrams showing a statistical comparison of not corrected (gray) and corrected daily satellite rainfall estimates with additive (red), multiplicative (green), linear scaling (blue) and quantile mapping (black) methods. They are plotted in each subdomain (BVO, delta) for each product, namely (a) IMERGv7, (b) IMERGv6, (c) GSMAP and (d) PERSIANN.
Hydrology 12 00071 g004
Figure 5. Line plots showing ground-based daily rainfall (gray), uncorrected (red) and corrected (blue) daily satellite rainfall estimates. They are plotted in each subdomain (BVO, delta) for each product, namely (a) IMERGv7, (b) IMERGv6, (c) GSMAP and (d) PERSIANN.
Hydrology 12 00071 g005aHydrology 12 00071 g005bHydrology 12 00071 g005c
Figure 6. Flow hydrographs of (a) ground data-based calibration, (b) ground data and corrected satellite data-based validations, and (c) ground data and uncorrected satellite data-based validations (c). The graphic windows contain observed flow (gray), flow simulated from ground-based rainfall (green), IMERGv7 rainfall (blue), IMERGv6 rainfall (green), GSMAP rainfall (red), and PERSIANN rainfall (orange).
Hydrology 12 00071 g006aHydrology 12 00071 g006b
Figure 7. Flow hydrographs of simulated flow in (a) scenarios 2.2 and (b) scenarios 3.3. The graphic windows contain observed flow (gray), flow simulated from ground-based rainfall (green), IMERGv7 rainfall (blue), IMERGv6 rainfall (green), GSMAP rainfall (red) and PERSIANN rainfall (orange).
Hydrology 12 00071 g007aHydrology 12 00071 g007b
Table 1. Description of satellite-based rainfall datasets used in the current study.
ProductLatency Spatial ResolutionTemporal ResolutionSensors
Integrated Multi-satellite Retrieval for Global Precipitation Measurement—GPM IMERG—version 7 Late
(IMERGv7)
12 h0.1° × 0.1° (approximately 10 km × 10 km)Half hour Passive microwave, Infrared
Integrated Multi-satellite Retrieval for Global Precipitation Measurement—GPM IMERG—version 6 Early
(IMERGv6)
4 h0.1° × 0.1° (approximately 10 km × 10 km)Half hour Passive microwave, Infrared
Global Satellite Mapping of Precipitation (GSMAP) near real-time 4 h0.1° × 0.1° (approximately 10 km × 10 km)Hourly Passive microwave, Infrared
Precipitation Estimation from Remotely Sensed Information using Artificial Neural Networks—PERSIANN—Dynamic Infrared Rain Rate in near real-time
(PERSIANN)
30–60 min0.04° × 0.04° (approximately 4 km × 4 km)Daily Infrared
Table 2. Model parameters in different routines. Those used in the current study are in bold.
Parameter Explanation Unit
Snow routine:
TT Threshold temperature°C
CFMAXDegree — Δt factor mm °C−1Δt−1
SFCF Snowfall correction factor-
CWH Water-holding capacity of snow-
CFR Refreezing coefficient-
SPSeasonal variability in degree — Δt factor -
Soil moisture routine:
FCField capacity: maximum soil moisture storagemm
LPSoil moisture value above which AET reaches PET-
BETAShape coefficient-
Response routine:
K0Additional recession coefficient of upper groundwater storeΔt−1
K1Recession coefficient of upper groundwater storeΔt−1
K2Recession coefficient of lower groundwater storeΔt−1
UZLThreshold parameter for K0 outflowmm
PERCThreshold parametermm Δt−1
Routing routine:
MAXBASLength of equilateral triangular weighting functionmm Δt−1
Table 3. Hydrological scenarios analyzed.
Calibration Driven DataGround-Based
(1)
Corrected Satellite-Based
(2)
Uncorrected Satellite-Based
(3)
Validation Driven Data
Ground-based
(1)
1.1--
Corrected satellite-based
(2)
1.22.2-
Uncorrected satellite-based
(3)
1.3-3.3
Table 4. Performances of uncorrected satellite-based daily rainfall datasets for rain detection and quantification. These performances are expressed in each subdomain (BVO and delta) through categorial (POD, FAR) and continuous (R, PBIAS, KGE) statistics, respectively. The former is based on the contingency table.
IMERGv7IMERGv6GSMAPPERSIANN
StatisticsBVODeltaBVODeltaBVODeltaBVODelta
POD0.770.670.740.640.720.580.730.70
FAR0.150.280.160.300.160.260.170.35
R0.630.60.580.560.550.490.50.45
PBIAS (%)1.9−0.78.315.82.324.4−19.331.7
KGE0.60.570.470.390.510.010.44−0.14
Table 5. Performances of uncorrected satellite-based rainfall datasets for rain rate quantification on 10-day and monthly scales in each subdomain (BVO and delta). These performances are expressed through continuous statistics (R, PBIAS, KGE).
IMERGv7IMERGv6GSMAPPERSIANN
ScaleStatisticsBVODeltaBVODeltaBVODeltaBVODelta
10-dayR0.930.90.850.810.840.720.730.72
PBIAS (%)1.9−0.78.315.82.324.4−19.331.7
KGE0.890.890.770.710.830.40.670.2
MonthR0.970.950.90.850.880.790.80.8
PBIAS (%)1.9−0.78.315.82.324.4−19.331.7
KGE0.920.940.820.760.880.470.720.27
Table 6. Performance of each corrected satellite rainfall dataset on the daily scale in each subdomain (BVO and delta). Datasets are quantile mapping corrected over the whole period 2001–2018.
IMERGv7 CorrectedIMERGv6 CorrectedGSMAP CorrectedPERSIANN Corrected
StatisticsBVODeltaBVODeltaBVODeltaBVODelta
R0.660.620.620.580.590.560.580.53
PBIAS (%)−2.91.20.41.9−0.58.5−3.11.9
KGE0.650.620.620.580.580.550.570.51
Table 7. Changes in scores of satellite rainfall data after quantile mapping correction. These are expressed in percentage of initial scores and indicate how significantly scores change compared to scores of uncorrected datasets. + is shown in increase, − in decrease and bold values correspond to a declining performance after correction.
IMERGv7
Corrected
IMERGv6
Corrected
GSMAP
Corrected
PERSIANN
Corrected
BVODeltaBVODeltaBVODeltaBVODelta
Change in score of KGE (%)+8.33+8.77+31.91+48.72+13.73+5400.00+29.55+464.29
Change in score of PBIAS (%)+252.63+271.43−95.18−87.97−121.74−65.16−83.94−94.01
Change in score of RMSE (%)−15.63−15.75−27.87−32.04−18.61−64.03−25.69−90.55
Table 8. Efficiency of the hydrological model in scenarios of ground data-driven simulation and its variants of calibration (a), corrected (b) and uncorrected (c) satellite data-driven simulations.
(a)
Scenario1.11.2 (corrected data)1.3 (uncorrected data)
Data sourceGround-basedIMERGv7IMERGv6GSMAPPERSIANNIMERGv7IMERGv6GSMAPPERSIANN
MetricsCalibrationValidation
R0.960.970.930.880.750.790.940.860.720.64
NSE0.90.950.810.770.540.620.880.390.510.36
NSE
rainy season
0.870.920.730.680.310.440.830.110.270.03
KGE0.910.930.670.810.520.730.90.420.590.51
PBIAS (%)−0.7−0.6−17.4−0.1−12.30.6041.1−1.6−25.4
(b)
Scenario1.12.2 Corrected
Data sourceGround-basedIMERGv7IMERGv6GSMAPPERSIANN
MetricsCalibrationValidationCalibrationValidationCalibrationValidationCalibrationValidationCalibrationValidation
R0.960.970.960.930.870.880.90.770.920.79
NSE0.90.950.930.840.750.750.810.590.850.62
NSE
rainy season
0.870.920.910.770.650.650.740.40.790.42
KGE0.910.930.960.720.820.720.890.70.90.71
PBIAS (%)−0.7−0.6−0.6−19.14.9200.6−5.43.3−1.4
(c)
Scenario1.13.3 Uncorrected
Data sourceGround-basedIMERGv7IMERGv6GSMAPPERSIANN
MetricsCalibrationValidationCalibrationValidationCalibrationValidationCalibrationValidationCalibrationValidation
R0.960.970.960.930.830.670.890.770.870.7
NSE0.90.950.920.830.680.240.790.580.750.46
NSE
rainy season
0.870.920.890.760.70.640.70.380.670.19
KGE0.910.930.950.70.80.470.850.620.840.67
PBIAS (%)−0.7−0.60.6−18.73.741.44.4−5.7−0.70.5
Disclaimer/Publisher’s Note: The statements, opinions and data contained in all publications are solely those of the individual author(s) and contributor(s) and not of MDPI and/or the editor(s). MDPI and/or the editor(s) disclaim responsibility for any injury to people or property resulting from any ideas, methods, instructions or products referred to in the content.

