Abstract
Wildfires are frequently observed in watersheds with a Mediterranean climate and seriously affect vegetation, soil, hydrology, and ecosystems as they cause abrupt changes in land cover. Assessing wildfire effects, as well as the recovery process, is critical for mitigating their impacts. This paper presents a geospatial analysis approach that enables the investigation of wildfire effects on vegetation, soil, and hydrology. The prediction of regeneration potential and the period needed for the restoration of hydrological behavior to pre-fire conditions is also presented. To this end, the catastrophic wildfire that occurred in August 2021 in the wider area of Varybobi, north of Athens, Greece, is used as an example. First, an analysis of the extent and severity of the fire and its effect on the vegetation of the area is conducted using satellite imagery. The history of fires in the specific area is then analyzed using remote sensing data and a regrowth model is developed. The effect on the hydrological behavior of the affected area was then systematically analyzed. The analysis is conducted in a spatially distributed form in order to delineate the critical areas in which immediate interventions are required for the rapid restoration of the hydrological behavior of the basin. The period required for the restoration of the hydrological response is then estimated based on the developed vegetation regrowth models. Curve Numbers and post-fire runoff response estimations were found to be quite similar to those derived from measured data. This alignment shows that the SCS-CN method effectively reflects post-fire runoff conditions in this Mediterranean watershed, which supports its use in assessing hydrological changes in wildfire-affected areas. The results of the proposed approach can provide important data for the restoration and protection of wildfire-affected areas.
1. Introduction
Forest fires are an integral part of the Mediterranean ecosystem, where the phenomenon has intensified in recent years, as a result of societal and climate changes [1,2]. Wet and mild winters contribute to the accumulation of fuel load, which becomes flammable in the summer due to high temperatures, little to no rainfall, and overall low humidity [3,4]. At the same time, fires in Mediterranean ecosystems are a key natural process of vegetation renewal and nutrient recycling. However, the consequences provoked when the phenomenon intensifies are the reduction of soil fertility, the destruction of forested land and the degradation of the landscape and the ecosystem [5,6]. Additionally, wildfires pose a significant threat to people and their activities, as their destructive nature leads to loss of human life and property [7,8].
The effect of wildfires on soil properties depends on many factors, such as soil characteristics, vegetation characteristics and fuel availability, geomorphological characteristics, fire characteristics, and meteorological conditions prevailing during and after fires. Wildfires affect soil hydraulic properties in various ways, such as (i) destroying organic matter in the upper soil layer and disrupting its structure, (ii) causing soluble ash to cover soil particles, making them water repellent, and (iii) under the combined influence of rainfall, crust is formed on the soil surface [9,10,11,12,13,14,15]. In addition, extensive wildfires affect the hydrological behavior of natural watersheds. In Greece and, by extension, in the Mediterranean region, the problem of wildfires significantly affects the hydrological behavior of watersheds, as storm events are of short duration and high intensity and the summers are hot and dry. For the investigation of flood risk, separate parameters related to the meteorological and hydrological conditions, the geomorphology of the area, land use conditions, and anthropogenic interventions must be considered. Changes in the hydrologic regime are directly linked to the destruction of soil vegetation, which results in a reduction in rain interception by plants and thus an increase in surface runoff [16,17,18,19,20,21,22]. In addition to the absence of vegetation cover, wildfires also affect hydrologic functioning indirectly by altering the hydraulic properties of the soils, causing a reduction in water penetration capacity and, at the same time, soil erosion is caused [23,24,25,26]. Folador et al. [27] found that a severe storm at a burned watershed leads to increases in flood peak and runoff volume by up to 125% and 75%, respectively. Soulis et al. and Soulis [25,28], on the Lykorrema watershed on Mt. Penteli (Greece) after a catastrophic wildfire in 2009, revealed that, post-fire, the direct runoff depths and the peak flows increased by more than 7.7 and 11.8 times, respectively.
In the same watershed, Soulis [28] investigated the change in Soil Conservation Service Curve Number (SCS-CN) main parameter CN in burned conditions based on measured rainfall–runoff data before and after the fire. The study revealed that, post-fire, the hydrological basin response turned from complacent to standard and the estimated values of the CN parameter for the studied soil–land cover complexes increased by 25 units on average. Further, Soulis et al. [22] observed a profound reduction in the actual evapotranspiration and an increase in water yield and percolation in post-fire conditions. A noticeable increase in sediment yield was also observed. Psomiadis et al. [29] explored the effect of both wildfires and urbanization on direct runoff at a watershed in Attiki, Greece using the SCS-CN method. They concluded that urbanization contributes to a higher increase in runoff than wildfires, but the two variables combined lead to even higher values.
The recovery of hydrological functioning to pre-fire conditions requires a period that depends on the rate of vegetation recovery [30]. According to previous studies, this period is related to the type of vegetation that existed before the fire. Also, it has been established that the amount of plant cover is a key factor in reducing post-fire runoff and soil erosion, as well as accelerating the recovery time for burned soils [31,32,33,34,35,36,37]. Other factors affecting the post-fire recovery process are burn severity, climate, management, water shortage and harsh meteorological and hydrological conditions, steep relief, highly erodible soils, silvicultural treatments, grazing etc., [38,39,40,41]. All these factors contribute to the amplification of the spatial and temporal variability in soil hydraulic properties [42]. The burn severity and the extent of the burned area in the case of forest fires are critical factors in the analysis of their effect on the hydrological response of affected areas yet ascertaining them involves very difficult and laborious field work. Depending on the prevailing conditions, the restoration period can last from 1 or 2 years after the wildfires to up to 5 or even 10 years [31,33,43,44,45]. As an example, Soulis [28] observed increased runoff depths 4–6 years after the fire. Remote sensing is a widely used method for continuously monitoring vegetation and assessing its characteristics, such as its biomass, cover density, vigor, aquatic stress, etc. Using data from satellite and airborne sensors operating at various spatial and spectral resolutions, remote sensing enables large-scale vegetation assessments over time.
Since the 1990s, there has been a steady increase in international publications related to the use of remote sensing for studying wildfires, which has been even more profound during the last 5 years [7,29,46]. With technological development and the large availability of data, their processing through remote sensing techniques and Geographical Information Systems (GIS) software locally requires powerful computing systems. Therefore, cloud systems are starting to significantly outperform local processing. The Google Earth Engine (GEE) platform is currently used quite extensively for the processing and analysis of large amounts of geospatial data in a cloud environment [30,47].
More specifically, GEE, created in 2010, is an online platform of GIS that uses cloud technology (therefore without the need for powerful local hardware to process the data) with two aims; on one hand to make large amounts of satellite remote sensing data available, implementing European open access policies, and on the other hand, the development of a multitude of applications satisfying many research needs through its programming environment. Google’s data files include both satellite imagery and vector datasets, social, demographic, weather, and climate layers, as well as digital terrain models. The main categories of applications addressed are vegetation mapping and monitoring, land cover mapping, agriculture, and disaster management [47,48,49].
Research on post-fire vegetation recovery in Mediterranean climates focuses on understanding the ecological processes and factors that influence post-fire regeneration, including the role of fire severity, climate conditions, plant traits, and landscape characteristics [30,50,51,52,53,54,55]. Previous studies have typically used a combination of field measurements, remote sensing, and modeling approaches to assess post-fire vegetation recovery patterns, identify key drivers, and inform post-fire management strategies [56]. Meneses [53] in his study about wildfires in Portugal, suggests that factors affecting regrowth are vegetation type, soil, climate, and continentality. Aguiar et al. [52] found that burn severity had no impact on the composition of flora or its richness on the stage of post-fire regrowth. Wilson et al. [56] modeled post-fire ecosystem recovery using satellite-derived observations of vegetation as a function of stand age, topography, and climate. Most other studies have assessed vegetation regrowth by using spectral indices and comparing their diachronic evolution with pre-fire conditions [49,57,58].
In view of the above, the present study develops a GIS-based method integrating remote sensing techniques, vegetation recovery modeling, and hydrological modeling to analyze the effect of wildfires on runoff response and to predict the hydrological functioning recovery period. To this end, the 2021 wildfire in Varybobi, northern Attica, Greece, is used as an example. First, the wildfire’s burn scar is delineated, and the subsequent burn severity is calculated and mapped. Then, a regression model is created to estimate vegetation regeneration based on the analysis of historical forest fires in the study area, as well as other topographic and climatic variables. Subsequently, based on this information, the effect on the hydrological behavior of the affected area is systematically analyzed and the period required for the restoration of the hydrological response is then estimated based on the developed vegetation regrowth models. The proposed method leverages a comprehensive set of remotely sensed data coming from various platforms, along with topographic data, land cover and soil spatial datasets, hydrological monitoring data, and field observations.
2. Materials and Methods
2.1. Study Area
The affected area is located in the wider area of Mt. Parnitha’s eastern slopes in the west and Lake Marathonas’ shores in the east in the northeast of the prefecture of Attica, some 20 km from the city center of Athens (23°41′/57′ E, 38°3′/15′ N) (Figure 1). It covers parts of the municipalities of Acharnai, Kifissia, Oropos and Dionissos. Its topography is characterized by steep slopes in the west which gradually become smoother moving east and south. The whole area is part of 3 main watersheds: Kifissos’ river tributaries in the south, Charadros stream in the north, and Malakasa stream in the northwest. The mean elevation is equal to 815 m, ranging from 120 m to 1390 m. The climate of the area is characterized by a typical Mediterranean climate type, with hot dry summers and mild wet winters. Due to its higher altitude and its topography, the area experiences wetter and cooler conditions in comparison with the city of Athens. Before the forest fire, the vast majority of the region was mostly covered by dense pine forests, with scattered residences within and organized settlements around it.
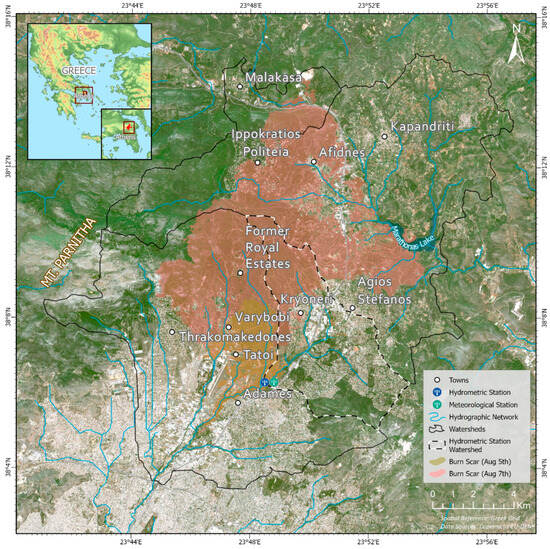
Figure 1.
Geographic location of the burn scars created by the 2021 Varybobi wildfire and the adjacent watersheds. The above layers’ creation is described in the methodology section of the present study.
The destructive wildfire broke out on 3 August 2021, in the Ano Varybobi area of the municipality of Acharnai. At the time, the country was under a severe heatwave, with temperatures in the region of Attica reaching as high as 45 °C and the air’s relative humidity dropping as low as 8%. The hot and dry conditions, as well as the very high concentration of fuel load, led the fire to spread rapidly and uncontrollably to the surrounding areas of the northern suburbs of Athens (Adames, Varybobi, and Tatoi). The fire was extinguished after a few hours but was reignited two days later, on 5 August. This time the fire spread in all directions: Adames (Kifissia) via the Chelidonous stream, Kryoneri, Tatoi and Varybobi to the south, Thrakomakedones and Mt. Parnitha to the west, the former Royal Estates of Parnitha, Ippokratios Politeia, Afidnes, and Malakasa to the north, and Agios Stefanos, Kapandriti, and Marathonas Lake to the east. The fire was eventually extinguished on the next evening, 6 August. The destruction caused was immense, as a huge chunk of forest was destroyed, severely affecting the local ecosystem, damaging houses, businesses, and other human properties, and leaving many people injured or homeless, including one human casualty.
2.2. Outline of the Methodology
This section outlines the proposed GIS-based methodology for analyzing wildfire hydrological impacts and the recovery process. The key steps are summarized as follows:
- Burn scar delineation and burn severity classification for historical wildfires (1986 and 1987) and for the current wildfire (2021) using earth observation data, the Google Earth Engine (GEE), and GIS techniques.
- Analysis of Land Use/Land Cover (LULC) and corresponding changes for 1990, 2000, 2006, 2012, and 2018 and for the 2021 post-fire landscape within a GIS environment.
- Construction of a vegetation regeneration model for the study area using historical data for vegetation development after the two historical fires (1986, 1987).
- Prediction of vegetation regrowth after the 2021 wildfire and analysis of spatial trends and relationships.
- Design of the investigated scenarios for runoff response analysis, construction of rainfall intensity duration frequency (IDF) curves and selection of characteristic storm events for three return periods (5, 50, and 100 years).
- Estimation of Curve Number (CN) values maps for the selected scenarios using GIS-based calculations.
- Validation of estimated CN values with the measured rainfall–runoff data.
- Estimation of pre-fire and post-fire runoff response spatial distribution for the above-mentioned LULC scenarios and for the selected storm events.
- Analysis of the effect of LULC change and of the wildfire on the runoff response.
- A flowchart outlining the main data sources and analysis steps is presented in Figure 2. The data sources and analysis methods are described in the next sections.
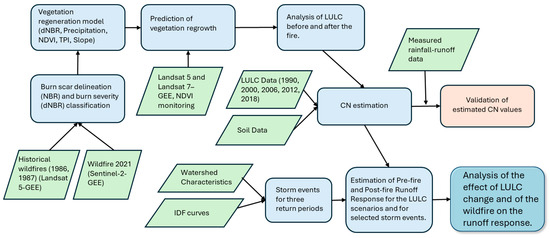 Figure 2. Flowchart outlining the proposed methodology for the analysis of wildfires hydrological impact and recovery process.
2.3. Data Sources
2.3.1. Earth Observation Data
Open-access imagery of the Sentinel-2 and Landsat 5 and 7 multispectral satellite systems were processed and downloaded from the Google Earth Engine (Table 1).

Table 1.
Earth observation datasets.
Specifically, two Level 1 Sentinel-2 images with a spatial resolution of 10 m were used for the assessment of the 2021 Varybobi wildfire. The images were acquired on 7 July 2021 (pre-fire image) and 13 August 2021 (post-fire image). The bands utilized were the B8 and B12, on the Near Infrared (NIR) and Short-Wave Infrared (SWIR) bands of the electromagnetic spectrum, respectively.
Images from the Landsat 5 TM and Landsat 7 ETM satellite sensors with a spatial resolution of 30 m were used to delineate and map the burned areas of the two historical wildfires in the Varybobi area which were taken into consideration for the implementation of the model. A pre-fire and a post-fire image were used for each of the two wildfire incidents of the year 1986 in Varybobi and 1987 in Kryoneri, respectively. In this case, the bands used were Band 4 (NIR) and Band 7 (SWIR-2).
Additionally, 20 NDVI layers were created, one for each year in the summer months to align with the timing of the wildfire events. These layers were derived using the Red and NIR bands (Band 3 and Band 4) for both wildfire incidents, spanning the period up to 2006, 20 years after the events.
2.3.2. Topographic Data
For the needs of the hydrological analysis, a Digital Terrain Model (DTM) was created based on the 20 m contour lines and the elevation points of the 1:50,000 scale topographic map of the Hellenic Military Geographical Service. The spatial resolution of the DTM that was created for the wider area is 30 m. The same maps were used to obtain further background information data layers, such as hydrographic network, roads, infrastructures, etc.
2.3.3. Soil Data
The absence of a unified soil map for the study area necessitated the integration of diverse data sources and field-based soil sampling to adequately characterize soil properties. The basic dataset used was the soil map of Greece (scale 1:30,000) from OPEKEPE (Organization for Payments and Control of Community Guidance and Guarantees), which mainly covers the cultivated lands. Additionally, information on the physical properties of the soil was used based on the data of the LUCAS program [59] of the Joint Research Center of the European Union for the areas not covered by the soil map. Lastly, information on available soil profiles of the forested areas was obtained from the Hellenic Agricultural Organization “DIMITRA” filled in with systematic on-site sampling and measurements, laboratory measurements, and remote sensing methods.
2.3.4. Hydrometeorological Data
A complete understanding of the hydrological behavior of the watershed before and after the fire requires the study of the hydrometeorological conditions of the study area. The spatiotemporal variation in rainfall and the magnitude of storm events for various return periods are key components for the management of water resources and flood hazard in the study area. For this study, the rainfall intensity duration frequency curves (IDFs) for stations in the broader area were obtained from the Ministry of Environment, Energy and Climate Change. Hydrometeorological data for the broader region were also collected from the National Meteorological Service (NMS) and the National Observatory of Athens (NOA).
For this study, measured data were also analyzed to evaluate post-fire hydrologic changes. Specifically, a telemetric weather and a hydrometric station (Figure 1) were installed in a Kifissos stream downstream of the affected area in a sub-watershed that covers 37.08 km2. The installed equipment has been operational since July 2023. The data are recorded in 10 and 15 min intervals, respectively. The telemetric weather station measures weather variables including air temperature, relative humidity, vapor pressure, barometric pressure, wind speed, gust, and direction, solar radiation and precipitation. The telemetric hydrometric station is located at one of the Kifissos’ streams in the area, and includes a piezoelectric water level sensor, an electrical conductivity and water temperature sensor, and a radar water level sensor to monitor water level changes in real-time. The radar and the piezoelectric sensors record water level data, which are then cross checked, and processed to determine the water depth in the channel in each time step. A rating curve was developed using field discharge measurements and hydraulic modeling to estimate streamflow (Q) based on the observed water depth.
The collected rainfall data allow for a detailed analysis of rainfall events in the watershed. For each rainfall event, rainfall totals were extracted from recorded data to assess rainfall-runoff responses. The event-based approach separates light and heavy rainfall events, which have diverse effects on runoff generation, especially in post-fire areas with altered soil and vegetation conditions. For this analysis, all significant rainfall events from July 2023 through December 2024 were examined, focusing on storms that produced identifiable direct runoff response. A six-hour period without rainfall (rainfall of less than or equal to 0.2 mm in each time step for at least 6 h) was used to define the end of an event. The duration, total rainfall depth, direct runoff depth, and peak flow rate were estimated for each event. Baseflow was separated with the constant slope graphical method [60].
2.3.5. Historical Data of Fires
The area around the eastern slopes of Mt. Parnitha and Marathonas Lake has suffered various wildfires since the beginning of Satellite Earth Observation in the 1980s. According to the “Diachronic Inventory of Forest Fires based on LANDSAT” application [61] and the European Forest Fire Information System [62] the area has been affected by a total of 9 wildfires since 1985. Among the most devastating ones were the fires of Varybobi (occurred in 1986), Kryoneri (occurred in 1987), the wider Northeast Attica fire (occurred in 2009), and Drosopigi (occurred in 2012).
2.3.6. Land Cover Data
The main available dataset that depicts land use and land cover and their changes over time for the European continent is the CORINE Land Cover (CLC) dataset of the European Union’s Copernicus Programme. The CLC census started in 1985 (reference year 1990) and is updated at regular intervals of 6 years. Updates were made in 2000, 2006, 2012, and 2018. CLC is implemented in the majority of the European Union member countries as well as in other Central and Eastern European countries. CLC is produced by visual interpretation of high-resolution satellite imagery and consists of a land cover inventory of 44 classes. It uses a minimum mapping unit of 25 ha for spatial effects and a minimum width of 100 m for linear effects. CLC 2018 was used in this study, as it is the most recent dataset before the fire and thus more accurately represents the land use of the study area during the specific period. For comparison and observation of land use changes over time, the data for the years 1990, 2000, 2006, and 2012 were also used to create the corresponding maps of the study area.
In addition, the high-resolution layers of the European Land Monitoring Service were used in the analysis. These provide additional information about specific land cover features and consist of five levels. They concern impervious soils, tree cover density and forest cover type, grasslands, water surfaces, and small woody vegetation [63].
2.4. Analysis Methodology
2.4.1. Burn Severity
Burn scar delineation was performed with the use of the Google Earth Engine (GEE) platform. Landsat 5 imagery was used for the two historical fires of 1986 and 1987 in Varybobi and Kryoneri, respectively. On the other hand, Sentinel-2 satellite system images were utilized for the wildfire of 2021.
Using the GEE platform, the Normalized Burn Ratio (NBR) index was calculated for each of the three images, which is designed to highlight burned areas through the following ratio:
Burned areas have a very low reflectance in Near-Infrared (NIR) and high reflectance in Short-Wave Infrared (SWIR), i.e., the difference between the spectral responses of healthy vegetation and burned areas peaks in the NIR and SWIR regions of the electromagnetic spectrum [64].
Fire severity, i.e., the extent to which fire intensity affects the ecosystem in the affected area, was then calculated with the dNBR index. The calculation of the index was carried out by subtraction between the NBR before and after the fire, therefore the NBR before each of the wildfire incidents had to be calculated as shown in Equation (2) [65]:
The resulting dNBR layer was then used to extract the burned scar, as depicted in Figure 1. The index was also classified in four classes, according to the burn severity scale adopted by the UN and the USGS [66]. The classification of the burn severity scaled values are as follows: (a) Unburned (−0.100 to −0.99), (b) Low Severity (+0.100 to +0.269), (c) Moderate–low Severity (+0.270 to 0.439), (d) Moderate–High Severity (+0.440 to +0.659), (e) High Severity (+0.660 to +1.300).
2.4.2. Vegetation Regrowth Model
Regression analysis can be very useful for modeling complex multivariable phenomena, such as vegetation regeneration after a major wildfire event. Hence, a regression model is used in this study to estimate the diachronic evolution of the NDVI index post-fire at the Varybobi area.
The wildfires of 1986 in Varybobi and 1987 in Kryoneri were two ideal examples for studying the regeneration of vegetation after a wildfire, as there is sufficient remote sensing data to observe its evolution. The examined span of time is 20 years for each case, using Landsat 5 TM and Landsat 7 ETM+ imagery for between 1987 and 2005 and 1988 and 2006, respectively. NDVI’s evolution after the two major wildfire incidents was used as the basis for a multilinear regression model to predict vegetation regrowth after the 2021 wildfire.
The NDVI index is a vegetation index that calculates the difference between the NIR band, strongly reflected by vegetation, and the red band absorbed by vegetation. This relationship is described as follows:
This relationship results in a range of values between −1 and +1. Areas with negative values usually correspond to water surfaces, while those showing positive values concern vegetation, which is denser and healthier the more the values approach +1. Values close to zero represent artificial, rocky surfaces or bare ground where vegetation is absent.
Although the specific spectral definitions of the red and NIR bands vary slightly between Sentinel-2, Landsat 5, and Landsat 7, the NDVI calculation inherently normalizes these differences. Since NDVI is a ratio-based index, its standardized range from −1 to +1 ensures consistency across sensors, allowing for valid comparisons of vegetation conditions despite minor variations in spectral band characteristics.
The regrowth assessment is divided into two different periods in relation to the NDVI values. The first period concerns the fast regrowth that occurred during the first five years after the wildfire, and the second includes the entire first decade. More specifically, a multiple linear regression model was applied 3 times, each time using a different dependent variable related to the change in NDVI values for (a) 5 years post-fire, (b) 10 years post-fire, and (c) 15 years post-fire. These variables represent the difference between the NDVI values recorded 5, 10, and 15 years after the fire and the NDVI value measured immediately following the fire.
The independent variables used for the estimation include the burn severity index (dNBR), the average annual precipitation, the Topographic Position Index (TPI), the first-year post-fire regrowth, and the slope (Table 2). The normality of the data was tested identifying that the data have a normal distribution. A Pearson correlation test was performed on the variables to examine whether there were any that should be dismissed. Τhe topographic position index helps us distinguish topographic features by comparing the elevation of each grid cell to the mean elevation of the neighboring area around it [67]. A multilinear regression was then performed for each of the three time frames, as mentioned above.
Table 2.
Variables used for the implementation of the model.
Finally, an analysis of variance (ANOVA) was performed on the three dependent variables of revegetation for the first 5, 10, and 15 years after the fire in relation to burn severity categories as classified by the USGS [66].
2.4.3. Analysis of Runoff Response
The watersheds and sub-watersheds of the broader affected area from the 2021 wildfire were delineated and the hydrographic network was analyzed based on the DTM model and information from the topographic maps. Then, the analysis of the runoff response in the affected area was made using the SCS-CN method, now also known as the US Natural Resources Conservation Service Curve Number (NRCS-CN) method [68].
The SCS-CN method is routinely used to estimate the effect of forest fires on the runoff response of affected areas and to evaluate the associated hydrological hazards (e.g., [28,29,69,70,71]). It is one of the most simple and well-documented conceptual methods for predicting runoff from natural watersheds and it is very popular in many hydrological applications because it depends on easy to obtain and well-documented environmental inputs to account for most of the factors influencing runoff generation, incorporating them in a single parameter, the Curve Number (CN) [14,60,72,73,74,75,76,77].
In SCS-CN, the direct runoff depth Q (mm) of a storm event is estimated by the total precipitation depth P (mm) with the following relationship:
where the potential maximum retention (mm) is expressed in the form of the dimensionless parameter of the runoff CN through the relationship
In ungauged watersheds, tables can be used to assign CN values to various soil types, land cover, and land management conditions, but real rainfall-runoff data from the same or neighboring similar watersheds are always preferred. To estimate the potential maximum retention S using real data, Equation (4) can be solved using the quadratic formula [14]
Using Equations (5) and (6), the CN value can be determined directly from rainfall and runoff data
The CN parameter ranges from 0 (when S → ∞) to 100 (when S = 0), and depends on soil type, land cover, and land management. The absolute high value of 100 corresponds to being totally impervious and to water surfaces, while the value is lower for natural surfaces. The rate of initial abstraction, according to the method documentation, is set to a specific value (λ = 0.2) so that the potential maximum retention S (or CN) remains the only parameter. If the value of λ is changed then the values of the CN listed in the relevant documentation tables of the method and in the corresponding literature do not apply [78,79].
Due to the lack of measured rainfall-runoff data at the initial phase of the study for the calibration and validation of the SCS-CN model within the study area, measured rainfall-runoff data from a nearby similar watershed in the area of Penteli mountain that has been also recently affected by forest fires were considered. Specifically, the Lykorrema stream small-scale experimental watershed (7.84 km2) which is located on the east side of Penteli Mountain, Attica, Greece (coordinates: UL 23°53′33″ E–38°04′13″ N, LR 23°56′00″ E–38°02′28″ N) and which has been extensively studied and monitored by the Agricultural University of Athens since 2004 was utilized. More details about the experimental watershed and the corresponding data are available in [14,22,25,28,42,60,72].
The CN spatial distribution within the watersheds that emerged from the hydrological analysis was estimated for the corresponding CLC layers, to define the diachronic evolution of hydrological response. Its calculation was based on land cover–soil type complexes, according to the SCS-CN documentation [68].
The post-fire CN values were determined using two methodologies. In the first methodology, the CN was increased by 5, 10, 15, and 20 units according to the burn severity of the fire in each area [80]. For the second methodology, the values of CN for the corresponding land cover–soil type complexes were modified in accordance with the findings of Soulis [28] for Lykorrema experimental watershed.
The next step of the methodology is the construction of rainfall intensity duration frequency curves for the study area to estimate the rainfall depths characteristic of storms in the study area for various return periods and for a duration equal to the concentration time of each sub-watershed which is also the critical duration for the occurrence of floods.
Data from the five available rain gauge stations of the Ministry of Environment and Energy [81] closest to the study area were used together with the equation of Generalized Extreme Values (GEV) of five parameters (Equation (8)) to calculate the rainfall intensity in mm/h for different return periods.
Specifically, return periods T of 5, 50, and 1000 years were selected.
The concentration time Tc was calculated for each hydrological basin in the study area according to the Giandotti formula [82,83,84]. This quantity expresses the time in which a drop of water reaches its outlet from the farthest point of the watershed. Calculation of the concentration time is necessary to estimate the critical duration of the precipitation (storm) events to be studied. The data necessary to calculate the concentration time are those concerning the mean () and the minimum () elevation in meters (m), the area of each watershed in square kilometers (km2) and the maximum hydraulic road in kilometers (km).
Altitude is an important factor that affects the annual amount of precipitation. Rainfall depth is related to altitude by the rainfall gradient equation. For this reason, it was not possible to accurately calculate the spatial distribution of precipitation in the study area with spatial interpolation methods. The determination of the relationship between precipitation and altitude was chosen as the most suitable method to solve this problem. This relationship was determined for different return periods based on the available rain gauge stations and later the estimation of the rain’s spatial distribution, considering the topography of the hydrological basin. A rainfall duration (ti) of 6 h, which is similar to the concentration time of the watershed, and return periods of 5, 50, and 100 years were used in this analysis. For a return period T equal to 5 years, the equation that calculates the relationship between altitude and rainfall is y = 0.0453x + 45.143 (R2 = 0.51). For a return period T equal to 50 years this equation is y = 0.0839x + 76.297 (R2 = 0.56). Finally, for a return period T equal to 1000 years the resulting equation is y = 0.1445x + 131.47 (R2 = 0.59). Based on these equations and the digital relief model of the study area, the digital backgrounds of the spatial distribution of precipitation were created, which were then used to calculate the runoff for the respective events.
The final step of this analysis concerns the calculation of the direct runoff spatial distribution in the studied watersheds and for all scenarios of land cover and return periods. The estimation was made by applying the SCS-CN method in ArcGIS Pro 3.2 software in spatially distributed form for all combinations of CN spatial distribution and precipitation surfaces. This process results in the areas that show increased surface runoff for the various scenarios. The spatially weighed average runoff values for all the scenarios considered were calculated as well.
To investigate the effect of land cover/land use changes on the amount of direct runoff, LULC data from 1990, 2000, 2006, 2012, and 2018 before the fire and the current situation after the fire phenomenon were considered.
2.4.4. Validation of Post-Fire CN Values
As it was described above, due to the lack of hydrometric data in the study area before the forest fire, the estimation of CN values before and after the fire was based on the method’s documentation, the international literature, and the previous studies on a nearby watershed. However, the new hydrometric station described in Section 2.3.4 (Hydrometeorological Data) provided an initial set of rainfall-runoff data for a limited number of events allowing us to evaluate the runoff estimations for the post-fire period.
To this end, the direct runoff values estimated with the post-fire CNs obtained with the two examined methods [28,80] were compared with the observed direct runoff response.
Then, the rainfall-runoff depths for each event were ordered to form P-Q pairs of equal return period following the frequency matching technique [14] and CN values were estimated for these events. Specifically, Equations (6) and (7) were used to estimate the potential maximum retention S and CN values based on the ordered measured rainfall and runoff data. The CN values obtained were plotted against the total rainfall depth (Figure 3) and the best estimates for the CN values corresponding to each soil-–land cover complex category were estimated by fitting the relationship describing the CN-P trend according to the Two-CN method [14]. The composite CN value according to the Asymptotic CN method was also estimated [85]. The CN values obtained were compared to the CN values obtained with the two methods based on watershed characteristics.
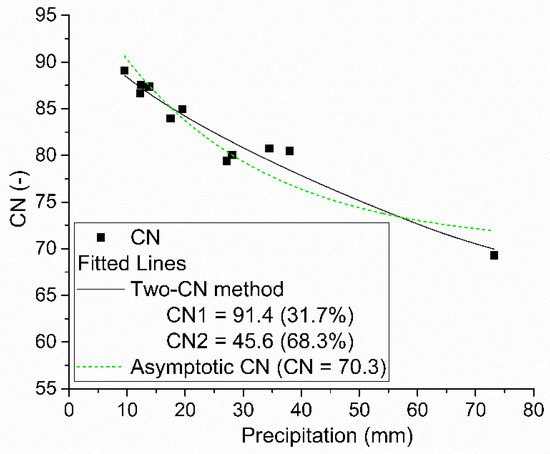
Figure 3.
The CN–Rainfall data of the studied watershed and the fitted lines describing this relationship according to the Two-CN method [14] and the Asymptotic CN [85]. The corresponding CN values and the areas they cover are also shown.
3. Results
3.1. Burn Severity
The total burned area of the August 2021 Varybobi fire, calculated using the dNBR index, is 8090 ha, with the spatial distribution of dNBR index values illustrated in Figure 4e. Low severity burned areas make up 1251 ha of the land, the medium-low, medium-high and high severity classes cover 1373 ha, 2146 ha, 3308 ha, respectively.
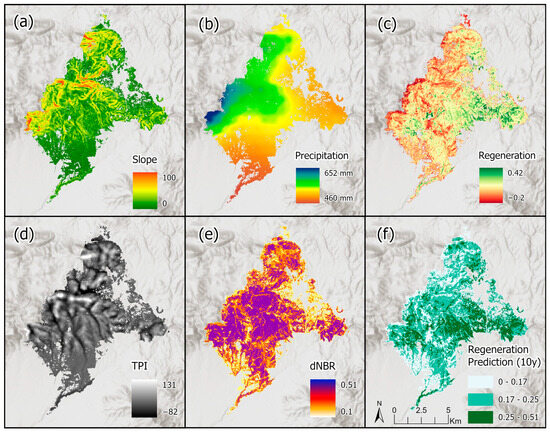
Figure 4.
Variables used for the implementation of the model: (a) slope, (b) precipitation, (c) NDVI-produced 1-year vegetation regeneration, (d) TPI index, (e) dNBR index, and (f) model’s final regeneration prediction for the year 2031.
The main land cover class of the CLC 2018 that is found within the burned area is forest, which covers 5570 ha and includes a. transitional woodland–shrub (1982 ha, 24.5% of the total area), b. mixed forest (1768 ha, 21.9%), c. coniferous forest (1227 ha, 15.2%), and to a lesser extent, d. broad-leaved forest (357 ha, 4.4%) and e. sclerophyllous vegetation (235 ha, 3%). The remaining 2520 ha include artificial surfaces (772.7 ha, 9.5%), agricultural areas (1714.6 ha, 21.2%), and inland marshes (28 ha, 0.4%). Additionally, the high burn severity class covers mostly the forest land cover classes. In these areas, the vegetation was annihilated, leaving the ground bare.
The high dNBR values, indicating severe burn severity, are found throughout the burned area but are more pronounced in its interior. This pattern is largely influenced by land cover, as the most severely affected regions correspond to dense forested areas, where continuous fuel availability allowed for sustained fire spread and intense burning. In contrast, lower severity areas are more scattered and often correspond to agricultural zones or artificial surfaces, where reduced fuel continuity limited fire propagation.
3.2. Vegetation Regrowth
The regeneration of vegetation following the wildfires of 1986 and 1987, is demonstrated through NDVI changes in a 25-year-span (Figure 5). During the first five years the increase in vegetation appears to be rapid, in contrast with the following decades when the increase stabilizes at a much lower rate.
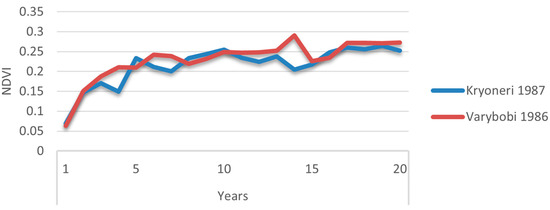
Figure 5.
Diachronic evolution of the NDVI index at the sites of the 1986 (red) and 1987 (blue) wildfires.
The Pearson correlation test performed between the variables shows weak to moderate positive correlations, except for the TPI index, which shows a negative correlation with all the variables (Table 3). The only exception is the relationship between slope and precipitation, which is at the lower values of strong correlation as higher slopes are mostly present at higher elevations (0.545).
Table 3.
Correlation test performed with the Pearson method, as the data has a normal distribution.
Applying the linear multiple regression methodology for three time periods (5, 10, and 15 years after the fire), the R2 coefficient reached marginally acceptable levels for the first 5 and 15 years of regrowth (R5y2 = 0.6, R15y2 = 0.5). On the contrary, the linear regression for the 10-year vegetation regeneration presents a stronger correlation with R10y2 = 0.72. Accordingly, the developed models can be used for the prediction of vegetation regeneration and especially for the period after the first 10 years when vegetation growth has been stabilized.
In addition, a multicollinearity test of the independent variables was carried out for the multi linear model for the 10 years period, using the Tolerance and Variance Inflation Factor (VIF) indices. These indices resulted in values greater than 0.2 for Tolerance and less than 10 for VIF, proving the lack of multicollinearity between the variables (Table 4). In addition, all variables are statistically significant, presenting probability (p-value) values of less than 0.05 (Table 5). Regarding the ANOVA test, the results of the analysis (Table 6) suggest that the means of the severity categories are statistically significant (p-value = 0).
Table 4.
Coefficients of independent variables of the multiple linear regression model and multicollinearity test.
Table 5.
Summary of the multilinear regression model (R2).
Table 6.
Analysis of variance of the independent regeneration variables for the first 15 years after the fire.
The developed vegetation regeneration model was applied to the 2021 Varybobi wildfire area to estimate natural vegetation regeneration over the next 10 years with NDVI values. The spatial distribution of each variable used in the calculation is shown in grid form (Figure 4). The synthesis of the equation represents the estimate of the increase in the NDVI index of the burned area for 2031.
According to the assessment model, there are areas where natural regeneration will be reduced in the next decade and will not reach the level of their pre-fire state. The difference between the pre-fire NDVI index (2021) and the predicted index 10 years after the fire (2031) is illustrated in Figure 6. The areas with limited vegetation regrowth are located mainly in the western parts, while full development and/or increase is in the cultivated and the plain areas in the east. Significant reduction in the regeneration potential seems to be located at higher elevations and increased slopes. Specifically, 70.6% of the affected area is predicted to have similar NDVI values to the pre-fire period, 23.8% will have lower NDVI values by as much as −0.2, and 0.4% will have much lower NDVI values by as much as −0.44. On the other hand, 5.2% of the affected area is predicted to have increased NDVI values by as much as +0.25.
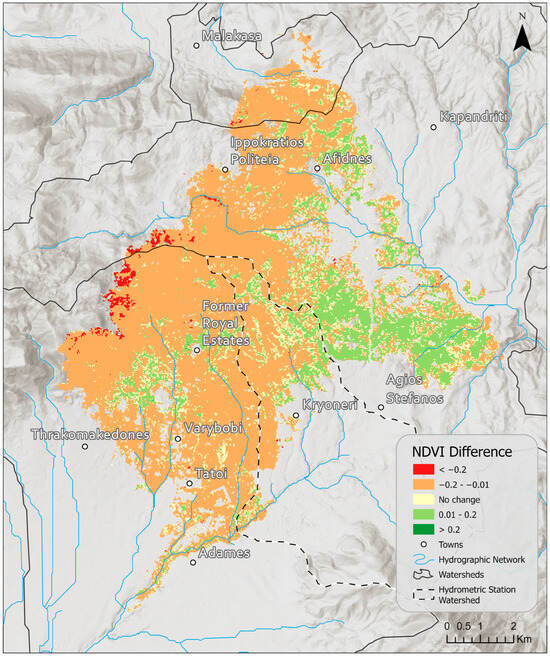
Figure 6.
NDVI difference between the pre-fire values (2021) and the 10-year regeneration prediction (2031).
3.3. Hydrological Analysis
The area affected by the 2021 wildfire (Figure 1) belongs to three main watersheds. The watershed of the Kifissos in the south, the watershed that ends up in Marathonas Lake in the east and, finally, a small watershed upstream of Oropos in the north. The water streams of the respective watersheds start from the Parnitha massif. The watersheds of the Oropos region, the Kifissos river and the Marathonas Lake, which also constitute the study area, cover a total area of 14.30 km2, 146.69 km2, and 130.64 km2, respectively. These watersheds are mainly mountainous with significant slopes and have average elevations of 393.53 m, 442.91 m, and 437.28 m, respectively.
The hydrological soil groups prevalent in the study area are the B and C, namely, and most of the area is covered by relatively permeable soils with medium basic permeability and medium-to-light texture. A smaller part of the area is covered by soil with low basic infiltration and permeability, which is medium-to-heavy in texture. The soil–land cover complexes emerged for the different CLC years of reference (Figure 7).
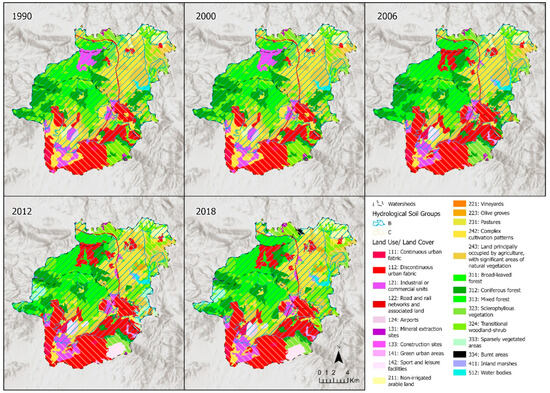
Figure 7.
Diachronic evolution of soil–land use complexes, based on CLC data.
CN values range from 48 for highly permeable areas to 98 for nearly impervious surfaces. The higher values between 98 and 100 represent impermeable areas and water bodies (i.e., Marathonas Lake). The greater part of the basin is characterized by relatively small to moderate CNs, as can be seen in the detailed CN value ranges (Figure 8). It is also found that the highest CN values appear in mainly urbanized areas, while the areas characterized by higher CN increase over the years due to urbanization.
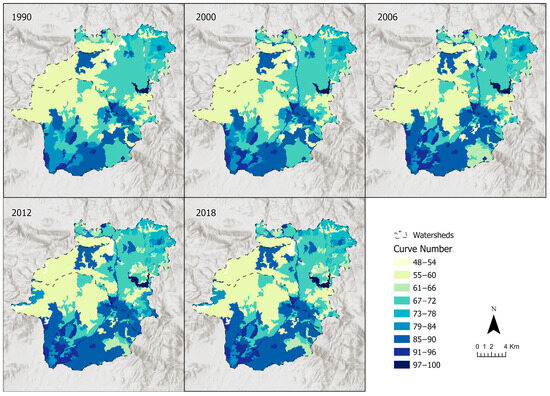
Figure 8.
Pre-fire CN ranges in the watersheds studied in the CLC reference years.
Figure 9 depicts the post-fire CN ranges after applying the two methodologies described in the methodology section, using as a base the most recent CLC of 2018. The Curve Number values for the unburned areas remain unchanged as the LULC and hydrological properties of the soil remained unaffected. On the contrary, the CN values in the affected areas have increased significantly, with a larger increase appearing with the second methodology. Additionally, it can be observed that the CN values in the burned areas are like those of the built-up areas. Comparing the CN values in Figure 8 and Figure 9, it can be observed that the abrupt land cover change caused by the wildfire is much more profound than the gradual change due to urbanization.
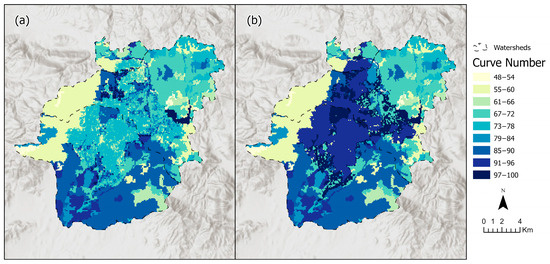
Figure 9.
Post-fire CN ranges in the study area after the implementation of the two methods on the 2018 CLC reference year; (a) 5, 10, 15, and 20 unit increases in the runoff CN value according to the burn severity classes [80], and (b) post-fire CN values according to [28].
The direct runoff (Q) was estimated for the three return-period scenarios using the two methodologies and the 2018 CLC as a reference year (Figure 10). As a general note, what can be observed is an increase in the Q values post-fire in both methodologies suggests reduction in permeability in the burned areas. Similarly for the CN, the second method implies a much higher increase in the Q values in comparison with the first method.
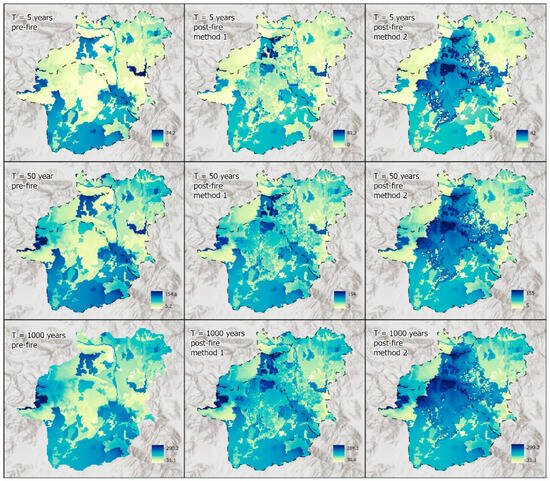
Figure 10.
Direct runoff (mm) for the three return periods (5, 50, and 1000 years) estimated for the 2018 CLC reference year pre-fire and post-fire using two methods.
A gradual increase is observed in the runoff volume from 1990 to 2018 due to the urbanization of the area and especially at lower elevations (Figure 10). The effect of the fire, however, causes a sharp and noticeable increase in the volume of runoff which can lead to an increase in the flood hazard. The increase is evident from both methods of estimating the effect of the fire, with the larger one estimated by the method of Soulis [28]. Specifically, this increase is presented in detail in Table 3, Table 4 and Table 5. As an example, for the Kifissos River watershed and for a recovery period T = 50 years, the rate of increase in runoff volume compared to that before the fire is 16.6% by applying the methodology of Higginson and Jarnecke [80], while with the methodology of Soulis [28], it reaches 40.5% (Figure 11, Table 7).
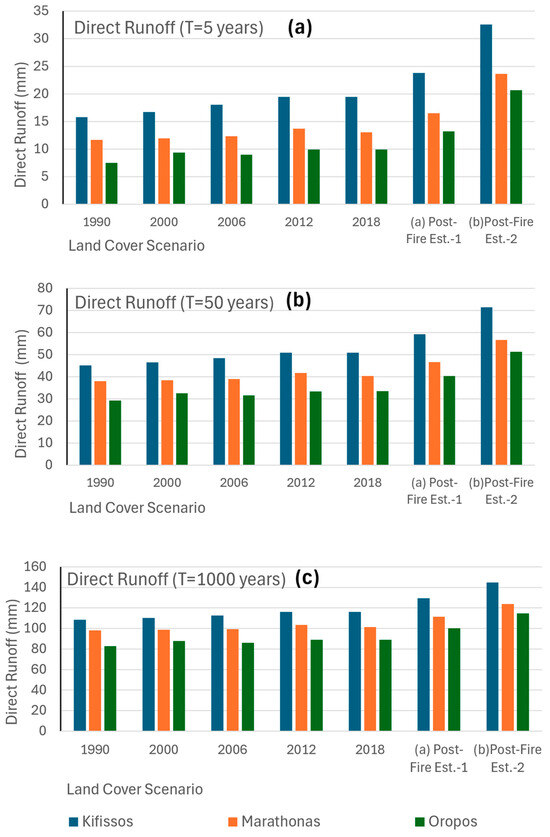
Figure 11.
Graphical illustration of runoff volume (mm) of the three study sub-areas for return periods of 5, 50, and 1000 years, respectively (a–c).
Table 7.
Percentage of direct runoff volume increment due to urbanization and due to the wildfire for the three affected sub-watersheds.
3.4. Comparison with Actual Measured Data
As described in the hydrological analysis methodology section, the SCS-CN direct runoff estimations were based on CN values approximated using tables based on the watershed characteristics, while the post-fire CN values were calculated according to Higginson and Jarnecke [80] (method 1) and according to Soulis [28] (method 2). The post-fire direct runoff values estimated with the CNs obtained by the two examined methods are plotted in comparison with the observed direct runoff response in Figure 12. As can be seen, both methods predict the post-fire direct runoff with reasonable accuracy considering the limited number of recorded events and the high scatter in the runoff response observed. The first method seems to be more conservative in runoff estimation providing better predictions for most events with lower runoff response, while method 2 estimates higher runoff estimations for the same rainfall depths and its predictions fall near to the most extreme events in terms of runoff response.
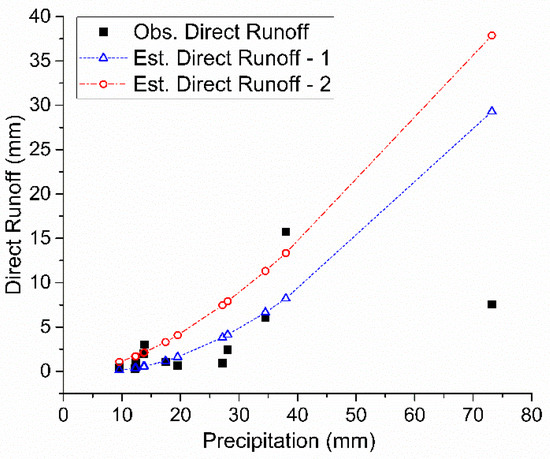
Figure 12.
Direct runoff values estimated with the post-fire CNs obtained by the two examined methods (Est. Direct Runoff—1 and 2 are the direct runoff estimations with method 1 and 2, correspondingly) plotted in comparison with the observed direct runoff.
Regarding the CN values estimated from observed rainfall-runoff data with corresponding CN values with the Two-CN method [14] were CN1 = 91.4, covering 31.7% of the watershed, and CN2 = 45.6, covering 68.3% of the watershed (Figure 3). The corresponding values obtained by spatially averaging the post-fire CN maps obtained by the two methods for the same percentages of the watershed area (Figure 8) were CN1 = 88.4 and CN2 = 73.55 for method 1 and CN1 = 93.8 and CN2 = 80.7 for method 2. As can be seen, method 2 slightly overestimates CN1 and method 1 slightly underestimates it. Both methods largely overestimate CN2. Here, it should be noted that CN1 dominates runoff estimation for smaller rainfall depths and CN2 becomes more important as rainfall depth increases. Interestingly, the corresponding post-fire CN values estimated using measured rainfall-runoff data for a nearby similar watershed by Soulis [28] were CN1 = 92.8 and CN2 = 56 indicating that utilizing information from nearby gauged watersheds can be an effective solution for studying post-fire runoff response in ungauged watersheds.
The composite CN value estimated by the Asymptotic CN method [85] was equal to 70.3 (Figure 3). The corresponding spatially averaged CN values for the two literature-based methods were 78.2 for method 1 and 83.8 for method 2.
At this point, it should be noted that the small number of observed events is an important limitation in the performance of the methods used. For the same reason, we avoided using statistical measures to quantify the performance of the various methods. However, the findings demonstrated that the SCS-CN model can be effectively used for hydrological impact evaluation in the post-fire period.
4. Discussion
The recovery of forest ecosystems after wildfires is a very complex process. For instance, while some forest ecosystems are adapted to fire and can recover relatively quickly, others may take decades or even centuries to return to their former state [86]. The impact of climate change on forest recovery after wildfires complicates even further the recovery process [87]. The robustness and type of the preexisting vegetation, the burn severity, the meteorological and hydrological conditions, the post-fire management, the slope and elevation, and the soil conditions are among the factors mentioned in the scientific literature as influencing the recovery of vegetation [31,32,33,34,35,36,37]. In the study area, 10 years after the wildfire, the NDVI values are predicted to reach pre-fire values in most cases, with the differences from the pre-fire conditions ranging from −0.2 to 0.2. Lower post-fire values are observed in higher elevations and in areas with larger slopes, which confirms the findings of previous studies.
Even if the full restoration of forest ecosystems may require several decades, the restoration of hydrological functioning can be much faster, taking from 1 or 2 years up to 5 or 10 years [22,28,31,33,43,44,45] as vegetation growth and surface soil properties recovery have a dominant role. The NDVI is in essence a way to measure the health and density of vegetation using satellite imagery [88]. The recovery of NDVI, and therefore vegetation density, in pre-fire conditions provides a good indicator of hydrological response recovery as well. Previous studies have indicated that remotely sensed NDVI can be used to describe the effect of vegetation dynamics in the SCS-CN method [89,90]. In the current study, there are areas where NDVI values remain noticeably lower than in the pre-fire period. The delineation of these areas can provide a tool for targeted restoration actions like soil erosion protection measures or artificial reforestation actions. At the same time there are areas that have much higher natural revegetation potential, in some cases overpassing the pre-fire values. These areas are mostly located in plains with good soil conditions and in some cases in agricultural areas. Identifying such areas allows better post-fire management and prioritization of limited resources.
However, accurate forecasting of vegetation recovery trajectories is challenging due to the multivariate, non-linear, and interactive effects of biotic and abiotic factors across scales [91]. Satellite-derived time-series images of vegetation cover have been previously used to assist natural regeneration forecasting, combining population models and non-parametric spatial matching [92]. Wilson et al. [56], in their study that modeled post-fire ecosystem recovery using satellite derived observations of vegetation as a function of stand age, topography, and climate, achieved adequate performance. Specifically, their model predicted approximately half (R2 = 0.47) of the variation in NDVI between 2 and 10 years following fire. The multilinear model that was developed in this study provided adequate performance in the prediction of NDVI spatial variability, with the best performance achieved for the period 10 years after the forest fire.
Prediction of vegetation recovery temporal and spatial patterns may also be important for the management of hydrological hazards after wildfires or even the evaluation and management of hydrological risks in forest fire-prone areas. However, the NDVI is not directly related to runoff response even if there are previous studies linking NDVI with vegetation dynamics and the SCS-CN method [89,90]. In this study, NDVI is used as an indicator of vegetation recovery to pre-fire conditions, indicating that after this period the initial CN values should be applied. Further research on the relationships between NDVI and CN values for different soil types can further facilitate the estimation of runoff response during the post-fire period. Psomiadis et al. [29] reported for a nearby watershed that runoff increments due to urbanization were generally higher than increments due to forest fires. However, they noted that the effect of urbanization is lasting and, therefore, the possibility of an intense storm taking place is higher than in the case of forest fires that have an abrupt but temporal impact. Further, the combined effect of urbanization and forest fires results in even higher runoff responses. A similar pattern is observed in this study as well. However, urbanization is less intense in the studied watershed, as a big part of it belongs to a natural reserve. Accordingly, wildfire has a more profound impact on the runoff response of the studied watershed. Still, the combined effect is even more intense, with almost double runoff volume for events with lower return periods. For more extreme events, while the runoff volume increment as a percentage is much lower (≅25%), as a total volume it is even higher, worsening the flood hazards.
The SCS-CN method allowed the determination of the direct runoff response for the various land cover change scenarios, including urbanization and forest fire impact assessment, in a simple but efficient manner. Additionally, SCS-CN is applied in a GIS providing information about the spatial distribution of runoff response, enabling better flood hazard mitigation planning. Many previous studies have been based on the SCS-CN method for LULC hydrological impact assessment (e.g., [29,69,70,71]). However, the results obtained greatly depended on the CN values assigned to the various soil–LULC complexes as well as the CN value adjustments for the post-fire conditions. In this study, two different approaches were used for the post-fire CN value assignment [28,80]. The comparison with the CN values obtained based on the measured post-fire data indicated that CN values based on real rainfall-runoff measurements in a nearby watershed [28] can provide the most adequate results. An important limitation in this regard is the lack of pre-fire measured data and the limited number of post-fire measured events. However, this is a common problem in the assessment of wildfire impact in hydrological response. The main problem is that, as argued in many studies, CN values are not well known for burned conditions as there are very limited datasets describing both pre-fire and post-fire conditions [28,29,93,94].
5. Conclusions
This study demonstrates that wildfires significantly increase runoff risk in Mediterranean climates, which are already characterized by intense rainfall and long dry periods. From 1990 to 2018, runoff volume progressively increased due to urbanization in the study area, particularly at lower elevations. Wildfires exacerbate this trend, generating a sudden and considerable increase in runoff and further elevating the risk of flooding.
The proposed GIS-based approach, which combines (i) the SCS-CN method for hydrological analysis, (ii) remote sensing techniques to map burn scars and the burn severity and monitor vegetation development, and (iii) a regression model for vegetation regeneration, can provide valuable information for the management of hydrological risks in wildfire-prone areas.
Accurate forecasting of vegetation recovery trajectories is challenging due to the multivariate, non-linear, and interactive effects of biotic and abiotic factors across scales. Examining vegetation regrowth in the study area using historical wildfires has shown rapid initial regrowth that stabilizes over time. The multilinear model that was developed in this study provided adequate performance for the prediction of NDVI spatial variability, with the best performance achieved for the period 10 years after the forest fire. The obtained results indicated that 10 years after the wildfire the NDVI values are predicted to reach pre-fire values in most cases. Lower post-fire values are observed at higher elevations and in areas with larger slopes, indicating that these areas should be the main targets of management activities.
The SCS-CN method allowed the determination of direct runoff response for the various land cover change scenarios, including urbanization and forest fire impact assessment, in a simple but efficient manner. Both examined methods predicted the post-fire direct runoff with reasonable accuracy considering the limited number of recorded events and the high scatter in the observed runoff response. The comparison with the CN values obtained with the various methodologies indicated that the use of CN values coming from measured rainfall-runoff data in a nearby similar watershed may be the best alternative.
Further research is needed to refine our understanding of post-fire hydrological functioning. This includes (1) expanding the multilinear model to predict vegetation recovery across a wider range of environments and to operate on an annual basis considering more meteorological variables; (2) investigating the relationship between NDVI and CN values for different conditions; (3) incorporating more extensive datasets of pre-fire and post-fire hydrological data, although such datasets can be challenging to obtain; and (4) considering machine learning and other current regression models. Despite these limitations, both the SCS-CN method and the regression model provided promising results.
Author Contributions
Conceptualization, K.S.; data curation, K.S., S.P.G., R.G. and E.D.; formal analysis, K.S., S.P.G., R.G., E.D. and D.K.; funding acquisition, K.S. and D.K.; investigation, K.S., S.P.G., R.G., E.D. and D.K.; methodology, K.S., R.G. and D.K.; project administration, K.S.; resources, K.S. and D.K.; software, K.S., S.P.G., R.G. and E.D.; supervision, K.S. and D.K.; validation, K.S., S.P.G. and R.G.; visualization, K.S. and S.P.G.; writing—original draft, K.S., S.P.G. and E.D.; writing—review and editing, K.S., S.P.G. and D.K. All authors have read and agreed to the published version of the manuscript.
Funding
This work was supported under the action “Studies for the rehabilitation of areas affected by the fires in the wider area of Varybobi” that was funded through a donation by the companies VIANEX S.A., GlaxoSmithKline S.A., Groupama S.A., and Rossi S.A. to support the affected area.
Data Availability Statement
All data are available from the authors upon reasonable request.
Conflicts of Interest
The authors declare no conflicts of interest.
References
- Adeyeri, O.E.; Zhou, W.; Ndehedehe, C.E.; Wang, X. Global vegetation, moisture, thermal and climate interactions intensify compound extreme events. Sci. Total Environ. 2024, 912, 169261. [Google Scholar] [CrossRef] [PubMed]
- Kirschner, J.A.; Ascoli, D.; Moore, P.; Clark, J.; Calvani, S.; Boustras, G. Governance drivers hinder and support a paradigm shift in wildfire risk management in Italy. Reg. Environ. Chang. 2024, 24, 13. [Google Scholar] [CrossRef]
- Fernández-García, V.; Beltrán-Marcos, D.; Fernández-Guisuraga, J.M.; Marcos, E.; Calvo, L. Predicting potential wildfire severity across Southern Europe with global data sources. Sci. Total Environ. 2022, 829, 154729. [Google Scholar] [CrossRef]
- Rundel, P.W.; Arroyo, M.T.K.; Cowling, R.M.; Keeley, J.E.; Lamont, B.B.; Pausas, J.G.; Vargas, P. Fire and Plant Diversification in Mediterranean-Climate Regions. Front Plant Sci. 2018, 9, 851. [Google Scholar] [CrossRef]
- Costa-Saura, J.M.; Balaguer-Beser, Á.; Ruiz, L.A.; Pardo-Pascual, J.E.; Soriano-Sancho, J.L. Empirical Models for Spatio-Temporal Live Fuel Moisture Content Estimation in Mixed Mediterranean Vegetation Areas Using Sentinel-2 Indices and Meteorological Data. Remote Sens. 2021, 13, 3726. [Google Scholar] [CrossRef]
- Papadaki, C.; Theodoropoulos, C.; Soulis, K.X.; Generali, K.A.; Psomiadis, E.; Dimitriou, E. Effects of forest fires on headwater streamflow and the habitat suitability for benthic macroinvertebrates. Hydrol. Sci. J. 2022, 67, 1356–1371. [Google Scholar] [CrossRef]
- Santos, S.M.B.D.; Bento-Gonçalves, A.; Vieira, A. Research on Wildfires and Remote Sensing in the Last Three Decades: A Bibliometric Analysis. Forests 2021, 12, 604. [Google Scholar] [CrossRef]
- Tavakkoli Piralilou, S.; Einali, G.; Ghorbanzadeh, O.; Nachappa, T.G.; Gholamnia, K.; Blaschke, T.; Ghamisi, P. A Google Earth Engine Approach for Wildfire Susceptibility Prediction Fusion with Remote Sensing Data of Different Spatial Resolutions. Remote Sens. 2022, 14, 672. [Google Scholar] [CrossRef]
- Imeson, A.C.; Verstraten, J.M.; van Mulligen, E.J.; Sevink, J. The effects of fire and water repellency on infiltration and runoff under Mediterranean type forest. Catena 1992, 19, 345–361. [Google Scholar] [CrossRef]
- Neary, D.G.; Klopatek, C.C.; DeBano, L.F.; Ffolliott, P.F. Fire effects on belowground sustainability: A review and synthesis. For. Ecol. Manag. 1999, 122, 51–71. [Google Scholar] [CrossRef]
- DeBano, L.F. The role of fire and soil heating on water repellency in wildland environments: A review. J. Hydrol. 2000, 231, 195–206. [Google Scholar] [CrossRef]
- Ebel, B.A. Temporal evolution of measured and simulated infiltration following wildfire in the Colorado Front Range, USA: Shifting thresholds of runoff generation and hydrologic hazards. J. Hydrol. 2020, 585, 124765. [Google Scholar] [CrossRef]
- Ebel, B.A.; Moody, J.A.; Martin, D.A. Post-fire temporal trends in soil-physical and -hydraulic properties and simulated runoff generation: Insights from different burn severities in the 2013 Black Forest Fire, CO, USA. Sci. Total Environ. 2022, 802, 149847. [Google Scholar] [CrossRef]
- Soulis, K.X.; Valiantzas, J.D. SCS-CN parameter determination using rainfall-runoff data in heterogeneous watersheds–The two-CN system approach. Hydrol. Earth Syst. Sci. 2012, 16, 1001–1015. [Google Scholar] [CrossRef]
- Ramirez, R.A.; Jang, W.; Kwon, T.-H. Wildfire burn severity and post-wildfire time impact mechanical and hydraulic properties of forest soils. Geoderma Regional. 2024, 39, e00856. [Google Scholar] [CrossRef]
- Morris, S.E.; Moses, T.A. Forest Fire and the Natural Soil Erosion Regime in the Colorado Front Range. Ann. Assoc. Am. Geogr. 1987, 77, 245–254. [Google Scholar] [CrossRef]
- Prosser, I.P.; Williams, L. The effect of wildfire on runoff and erosion in native Eucalyptus forest. Hydrol. Process 1998, 12, 251–265. [Google Scholar] [CrossRef]
- Johansen, M.P.; Hakonson, T.E.; Breshears, D.D. Post-fire runoff and erosion from rainfall simulation: Contrasting forests with shrublands and grasslands. Hydrol. Process 2001, 15, 2953–2965. [Google Scholar] [CrossRef]
- Wohlgemuth, P.M.; Hubbert, K.R.; Robichaud, P.R. The effects of log erosion barriers on post-fire hydrologic response and sediment yield in small forested watersheds, southern California. Hydrol. Process 2001, 15, 3053–3066. [Google Scholar] [CrossRef]
- Moffet, C.A.; Pierson, F.B.; Robichaud, P.R.; Spaeth, K.E.; Hardegree, S.P. Modeling soil erosion on steep sagebrush rangeland before and after prescribed fire. Catena 2007, 71, 218–228. [Google Scholar] [CrossRef]
- Pierson, F.B.; Robichaud, P.R.; Moffet, C.A.; Spaeth, K.E.; Hardegree, S.P.; Clark, P.E.; Williams, C.J. Fire effects on rangeland hydrology and erosion in a steep sagebrush-dominated landscape. Hydrol. Process 2008, 22, 2916–2929. [Google Scholar] [CrossRef]
- Soulis, K.X.; Generali, K.A.; Papadaki, C.; Theodoropoulos, C.; Psomiadis, E. Hydrological Response of Natural Mediterranean Watersheds to Forest Fires. Hydrology 2021, 8, 15. [Google Scholar] [CrossRef]
- Giovannini, G.; Lucchesi, S.; Giachetti, M. Effect of heating on some physical and chemical parameters related to soil aggregation and erodibility. Soil Sci. 1988, 146, 255–261. [Google Scholar] [CrossRef]
- Lavabre, J.; Torres, D.S.; Cernesson, F. Changes in the hydrological response of a small Mediterranean basin a year after a wildfire. J. Hydrol. 1993, 142, 273–299. [Google Scholar] [CrossRef]
- Soulis, K.; Dercas, N.; Valiantzas, J. Wildfires impact on hydrological response-The case of Lykorrema experimental watershed. Glob. NEST J. 2012, 14, 303–310. [Google Scholar]
- Zhou, Y.; Zhang, Y.; Vaze, J.; Lane, P.; Xu, S. Impact of bushfire and climate variability on streamflow from forested catchments in southeast Australia. Hydrol. Sci. J. 2015, 60, 1340–1360. [Google Scholar] [CrossRef]
- Folador, L.; Cislaghi, A.; Vacchiano, G.; Masseroni, D. Integrating Remote and In-Situ Data to Assess the Hydrological Response of a Post-Fire Watershed. Hydrology 2021, 8, 169. [Google Scholar] [CrossRef]
- Soulis, K.X. Estimation of SCS Curve Number variation following forest fires. Hydrol. Sci. J. 2018, 63, 1332–1346. [Google Scholar] [CrossRef]
- Psomiadis, E.; Soulis, K.X.; Efthimiou, N. Using SCS-CN and Earth Observation for the Comparative Assessment of the Hydrological Effect of Gradual and Abrupt Spatiotemporal Land Cover Changes. Water 2020, 12, 1386. [Google Scholar] [CrossRef]
- Soulis, K.; Kalivas, D.; Palli Gravani, S.; Polykretis, C.; Dosiadis, E.; Giovos, R. Geospatial Analysis of the Varybobi Wildfire (2021) Effects on Hydrology, Soil and the Environment. In Proceedings of the XXVIII General Assembly of the International Union of Geodesy and Geophysics (IUGG), Belin, Germany, 11–20 July 2023. [Google Scholar]
- Inbar, M.; Tamir, M.; Wittenberg, L. Runoff and erosion processes after a forest fire in Mount Carmel, a Mediterranean area. Geomorphology 1998, 24, 17–33. [Google Scholar] [CrossRef]
- Vega, J.A.; Fernández, C.; Fonturbel, T. Throughfall, runoff and soil erosion after prescribed burning in gorse shrubland in Galicia (NW Spain). Land Degrad. Dev. 2005, 16, 37–51. [Google Scholar] [CrossRef]
- Cerdà, A. Changes in overland flow and infiltration after a rangeland fire in a Mediterranean scrubland. Hydrol. Process 1998, 12, 1031–1042. [Google Scholar] [CrossRef]
- Marcos, E.; Tarrega, R.; Luis-Calabuig, E. Comparative Analysis of Runo and Sediment Yield with a Rainfall Simulator After Experimental Fire. Arid. Soil Res. Rehabil. 2000, 14, 293–307. [Google Scholar] [CrossRef]
- De Luis, M.; González-Hidalgo, J.C.; Raventós, J. Effects of fire and torrential rainfall on erosion in a Mediterranean gorse community. Land Degrad. Amp. Dev. 2003, 14, 203–213. [Google Scholar] [CrossRef]
- Wagenbrenner, J.W.; Ebel, B.A.; Bladon, K.D.; Kinoshita, A.M. Post-wildfire hydrologic recovery in Mediterranean climates: A systematic review and case study to identify current knowledge and opportunities. J. Hydrol. 2021, 602, 126772. [Google Scholar] [CrossRef]
- Yang, Y.; Hu, X.; Han, M.; He, K.; Liu, B.; Jin, T.; Cao, X.; Wang, Y.; Huang, J. Post-fire temporal trends in soil properties and revegetation: Insights from different wildfire severities in the Hengduan Mountains, Southwestern China. Catena 2022, 213, 106160. [Google Scholar] [CrossRef]
- Li, X.; Xie, F.; Wang, X.; Kong, F. Human intervened post-fire forest restoration in the Northern Great Hing’an Mountains: A review. Landsc. Ecol. Eng. 2006, 2, 129–137. [Google Scholar] [CrossRef]
- Spanos, I.A.; Daskalakou, E.N.; Thanos, C.A. Postfire, natural regeneration of Pinus brutia forests in Thasos Island, Greece. Acta Oecologica 2000, 21, 13–20. [Google Scholar] [CrossRef]
- José Martı́nez-Sánchez, J.; Ferrandis, P.; de las Heras, J.; Marı́a Herranz, J. Effect of burnt wood removal on the natural regeneration of Pinus halepensis after fire in a pine forest in Tus valley (SE Spain). For. Ecol. Manag. 1999, 123, 1–10. [Google Scholar] [CrossRef]
- De Las Heras, J.; González-Ochoa, A.; López-Serrano, F.; Simarro, M.E. Effects of silviculture treatments on vegetation after fire in Pinus halepensis Mill. woodlands (SE Spain). Ann. For. Sci. 2004, 61, 661–667. [Google Scholar] [CrossRef][Green Version]
- Soulis, K.X.; Londra, P.A.; Kargas, G. Characterizing surface soil layer saturated hydraulic conductivity in a Mediterranean natural watershed. Hydrol. Sci. J. 2020, 65, 2616–2629. [Google Scholar] [CrossRef]
- Marques, M.A.; Mora, E. The influence of aspect on runoff and soil loss in a Mediterranean burnt forest (Spain). Catena 1992, 19, 333–344. [Google Scholar] [CrossRef]
- Robichaud, P.R. Fire effects on infiltration rates after prescribed fire in Northern Rocky Mountain forests, USA. J. Hydrol. 2000, 232, 220–229. [Google Scholar] [CrossRef]
- Mayor, A.G.; Bautista, S.; Llovet, J.; Bellot, J. Post-fire hydrological and erosional responses of a Mediterranean landscpe: Seven years of catchment-scale dynamics. Catena 2007, 71, 68–75. [Google Scholar] [CrossRef]
- Fallon, K.; Wheelock, S.J.; Sadegh, M.; Pierce, J.L.; McNamara, J.P.; Cattau, M.; Baker, V.R. Post-fire hydrologic analysis: A tale of two severities. Hydrol. Sci. J. 2023, 69, 139–148. [Google Scholar] [CrossRef]
- Mutanga, O.; Kumar, L. Google Earth Engine Applications. Remote Sens. 2019, 11, 591. [Google Scholar] [CrossRef]
- Sharma, S.K.; Aryal, J.; Rajabifard, A. Leveraging Google Earth Engine (GEE) and Landsat Images to Assess Bushfire Severity and Postfire Short-Term Vegetation Recovery: A Case Study of Victoria, Australia; Wiley: Hoboken, NJ, USA, 2022. [Google Scholar] [CrossRef]
- Yilmaz, O.S.; Acar, U.; Sanli, F.B.; Gulgen, F.; Ates, A.M. Mapping burn severity and monitoring CO content in Türkiye’s 2021 Wildfires, using Sentinel-2 and Sentinel-5P satellite data on the GEE platform. Earth Sci. Inform. 2023, 16, 221–240. [Google Scholar] [CrossRef] [PubMed]
- Au Yeung, C.; Li, R. Comparison of vegetation regeneration after wildfire between Mediterranean and tundra ecosystems by using Landsat images. Ann. GIS 2018, 24, 99–112. [Google Scholar] [CrossRef]
- Bright, B.C.; Hudak, A.T.; Kennedy, R.E.; Braaten, J.D.; Henareh Khalyani, A. Examining post-fire vegetation recovery with Landsat time series analysis in three western North American forest types. Fire Ecol. 2019, 15, 8. [Google Scholar] [CrossRef]
- Aguiar, F.C.; Rodrigues, C.; Pina, J.P.; Soares, P. Regeneration of Riparian and Maritime Pine Forests after a Large Wildfire on the Largest Public Forest of Portugal. Forests 2021, 12, 477. [Google Scholar] [CrossRef]
- Meneses, B.M. Vegetation Recovery Patterns in Burned Areas Assessed with Landsat 8 OLI Imagery and Environmental Biophysical Data. Fire 2021, 4, 76. [Google Scholar] [CrossRef]
- Hao, B.; Xu, X.; Wu, F.; Tan, L. Long-Term Effects of Fire Severity and Climatic Factors on Post-Forest-Fire Vegetation Recovery. Forests 2022, 13, 883. [Google Scholar] [CrossRef]
- Barton, A.M.; Poulos, H.M.; Koch, G.W.; Kolb, T.E.; Thode, A.E. Detecting patterns of post-fire pine regeneration in a Madrean Sky Island with field surveys and remote sensing. Sci. Total Environ. 2023, 867, 161517. [Google Scholar] [CrossRef] [PubMed]
- Wilson, A.M.; Latimer, A.M.; Silander, J.A. Climatic controls on ecosystem resilience: Postfire regeneration in the Cape Floristic Region of South Africa. Proc. Natl. Acad. Sci. USA 2015, 112, 9058–9063. [Google Scholar] [CrossRef]
- Viana-Soto, A.; Aguado, I.; Martínez, S. Assessment of Post-Fire Vegetation Recovery Using Fire Severity and Geographical Data in the Mediterranean Region (Spain). Environments 2017, 4, 90. [Google Scholar] [CrossRef]
- Paci, L.; Gelfand, A.E.; Beamonte, M.A.; Rodrigues, M.; Pérez-Cabello, F. Space-time modeling for post-fire vegetation recovery. Stoch. Environ. Res. Risk Assess. 2015, 31, 171–183. [Google Scholar] [CrossRef]
- Orgiazzi, A.; Ballabio, C.; Panagos, P.; Jones, A.; Fernández-Ugalde, O. LUCAS Soil, the largest expandable soil dataset for Europe: A review. Eur. J. Soil Sci. 2017, 69, 140–153. [Google Scholar] [CrossRef]
- Soulis, K.X.; Valiantzas, J.D.; Dercas, N.; Londra, P.A. Investigation of the direct runoff generation mechanism for the analysis of the SCS-CN method applicability to a partial area experimental watershed. Hydrol. Earth Syst. Sci. 2009, 13, 605–615. [Google Scholar] [CrossRef]
- National Observatory of Athens. Diachronic Inventory of Forest Fires Based on LANDSAT. Available online: http://ocean.space.noa.gr/diachronic_bsm/indexargs.php?lat=38.14&lon=23.78 (accessed on 17 October 2022).
- European Commission. Copernicus Emergency Management Service: European Forest Fire Information System (EFFIS). Available online: https://forest-fire.emergency.copernicus.eu/ (accessed on 12 June 2024).
- European Environment Agency (EEA). Copernicus Land Monitoring Service: Pan-European High-Resolution Layers. Available online: https://land.copernicus.eu/pan-european/high-resolution-layers (accessed on 12 July 2022).
- Falaras, T.; Tselka, I.; Papadopoulos, I.; Nikolidaki, M.; Karavias, A.; Bafi, D.; Petani, A.; Krassakis, P.; Parcharidis, I. Operational Mapping and Post-Disaster Hazard Assessment by the Development of a Multiparametric Web App Using Geospatial Technologies and Data: Attica Region 2021 Wildfires (Greece). Appl. Sci. 2022, 12, 7256. [Google Scholar] [CrossRef]
- Keeley, J. Fire severity and plant age in postfire resprouting of woody plants in sage scrub and chaparral. Madroño 2009, 53, 373–379. [Google Scholar] [CrossRef]
- United Nations: Normalized Burned Ration (NBR). UN–SPIDER Knowledge Portal. Available online: https://un-spider.org/advisory-support/recommended-practices/recommended-practice-burn-severity/in-detail/normalized-burn-ratio (accessed on 17 October 2022).
- Salekin, S.; Lad, P.; Morgenroth, J.; Dickinson, Y.; Meason, D.F. Uncertainty in primary and secondary topographic attributes caused by digital elevation model spatial resolution. Catena 2023, 231, 107320. [Google Scholar] [CrossRef]
- NRCS (Natural Resources Conservation Service). National Engineering Handbook, Section 4: Hydrology, Natural Resources Conservation Service; US Department of Agriculture: Washington, DC, USA, 2004. [Google Scholar]
- Batelis, S.-C.; Nalbantis, I. Potential Effects of Forest Fires on Streamflow in the Enipeas River Basin, Thessaly, Greece. Environ. Process. 2014, 1, 73–85. [Google Scholar] [CrossRef]
- Leopardi, M.; Scorzini, A.R. Effects of wildfires on peak discharges in watersheds. IForest 2015, 8, 302–307. [Google Scholar] [CrossRef]
- Kochilakis, G.; Poursanidis, D.; Chrysoulakis, N.; Varella, V.; Kotroni, V.; Eftychidis, G.; Lagouvardos, K.; Papathanasiou, C.; Karavokyros, G.; Aivazoglou, M.; et al. A web based DSS for the management of floods and wildfires (FLIRE) in urban and periurban areas. Environ. Model. Softw. 2016, 86, 111–115. [Google Scholar] [CrossRef]
- Soulis, K.X.; Valiantzas, J.D. Identification of the SCS-CN Parameter Spatial Distribution Using Rain-fall-Runoff Data in Heterogeneous Watersheds. Water Resour. Manag. 2013, 27, 1737–1749. [Google Scholar] [CrossRef]
- van Dijk, A.I.J.M. Selection of an appropriately simple storm runoff model. Hydrol. Earth Syst. Sci. 2010, 14, 447–458. [Google Scholar] [CrossRef]
- Rezaei-Sadr, H. Influence of coarse soils with high hydraulic conductivity on the applicability of the SCS-CN method. Hydrol. Sci. J. 2016, 62, 843–848. [Google Scholar] [CrossRef]
- Verma, S.; Verma, R.K.; Mishra, S.K.; Singh, A.; Jayaraj, G.K. A revisit of NRCS-CN inspired models coupled with RS and GIS for runoff estimation. Hydrol. Sci. J. 2017, 62, 1891–1930. [Google Scholar] [CrossRef]
- Verma, S.; Mishra, S.K.; Verma, R.K. Improved runoff curve numbers for a large number of watersheds of the USA. Hydrol. Sci. J. 2020, 65, 2658–2668. [Google Scholar] [CrossRef]
- Farran, M.M.; Al-Amri, N.S.; Ewea, H.A.; Elfeki, A.M. The significance of basin slope for curve number estimation and the impact on flood prediction in arid basins. Hydrol. Sci. J. 2024, 69, 939–950. [Google Scholar] [CrossRef]
- Mishra, S.K.; Singh, V.P. A relook at NEH-4 curve number data and antecedent moisture condition criteria. Hydrol. Process 2006, 20, 2755–2768. [Google Scholar] [CrossRef]
- Elhakeem, M.; Papanicolaou, A.N. Estimation of the Runoff Curve Number via Direct Rainfall Simulator Measurements in the State of Iowa, USA. Water Resour. Manag. 2009, 23, 2455–2473. [Google Scholar] [CrossRef]
- Higginson, B.; Jarnecke, J. Salt Creek BAER-2007 Burned Area Emergency Response; Hydrology Specialist Report; Uinta National Forest: Provo, UT, USA, 2007. [Google Scholar]
- Ministry of Environment and Energy. National Floods Risk Management Plan: Greece. Available online: https://floods.ypeka.gr/ (accessed on 24 August 2023).
- Giandotti, M. Previsione Delle Piene e Delle Magre dei Corsi d’Acqua; Istituto Poligrafico dello Stato: Rome, Italy, 1934; pp. 107–117. [Google Scholar]
- Michailidi, E.M.; Antoniadi, S.; Koukouvinos, A.; Bacchi, B.; Efstratiadis, A. Timing the time of concentration: Shedding light on a paradox. Hydrol. Sci. J. 2018, 63, 721–740. [Google Scholar] [CrossRef]
- Bolduc, S.; Mailhot, A.; Talbot, G. Estimation of the time of concentration of small watersheds located in Northeastern North America. Hydrol. Sci. J. 2024, 69, 1765–1776. [Google Scholar] [CrossRef]
- Hawkins, R.H. Asymptotic Determination of Runoff Curve Numbers from Data. J. Irrig. Drain. Eng. 1993, 119, 334–345. [Google Scholar] [CrossRef]
- Laughlin, M.M.; Rangel-Parra, L.K.; Morris, J.E.; Donato, D.C.; Halofsky, J.S.; Harvey, B.J. Patterns and drivers of early conifer regeneration following stand-replacing wildfire in Pacific Northwest (USA) temperate maritime forests. For. Ecol. Manag. 2023, 549, 121491. [Google Scholar] [CrossRef]
- Sorenson, Q.M.; Young, D.J.N.; Latimer, A.M. Tree planting outcomes after severe wildfire depend on climate, competition, and priority. For. Ecol. Manag. 2025, 575, 122346. [Google Scholar] [CrossRef]
- Liang, E.Y.; Shao, X.M.; He, J.C. Relationships between tree growth and NDVI of grassland in the semi-arid grassland of north China. Int. J. Remote Sens. 2005, 26, 2901–2908. [Google Scholar] [CrossRef]
- Muche, M.E.; Hutchinson, S.L.; Hutchinson, J.M.S.; Johnston, J.M. Phenology-adjusted dynamic curve number for improved hydrologic modeling. J. Environ. Manag. 2019, 235, 403–413. [Google Scholar] [CrossRef]
- Yan, X.; Nunes, J.P.; Sun, J.; Tang, D.W.S.; Wen, Y.; Li, Z. Restored vegetation dominates the decrease in surface and subsurface runoff on the Loess Plateau. J. Hydrol. 2024, 640, 131730. [Google Scholar] [CrossRef]
- Rollinson, C.R.; Finley, A.O.; Alexander, M.R.; Banerjee, S.; Dixon Hamil, K.-A.; Koenig, L.E.; Locke, D.H.; DeMarche, M.L.; Tingley, M.W.; Wheeler, K.; et al. Working across space and time: Nonstationarity in ecological research and application. Front. Ecol. Environ. 2021, 19, 66–72. [Google Scholar] [CrossRef]
- Zaiats, A.; Cattau, M.E.; Pilliod, D.S.; Liu, R.; Requena-Mullor, J.M.; Caughlin, T.T. Forecasting natural regeneration of sagebrush after wildfires using population models and spatial matching. Landsc. Ecol. 2023, 38, 1291–1306. [Google Scholar] [CrossRef]
- Springer, E.P.; Hawkins, R.H. Curve Number and Peakflow Responses Following the Cerro Grande Fire on a Small Watershed. In Managing Watersheds for Human and Natural Impacts; American Society of Civil Engineers: Reston, VA, USA, 2005; pp. 1–12. [Google Scholar]
- Canfield, H.E.; Goodrich, D.C.; Burns, I.S. Selection of Parameters Values to Model Post-Fire Runoff and Sediment Transport at the Watershed Scale in Southwestern Forests. In Managing Watersheds for Human and Natural Impacts; American Society of Civil Engineers: Reston, VA, USA, 2005; pp. 1–12. [Google Scholar]
Disclaimer/Publisher’s Note: The statements, opinions and data contained in all publications are solely those of the individual author(s) and contributor(s) and not of MDPI and/or the editor(s). MDPI and/or the editor(s) disclaim responsibility for any injury to people or property resulting from any ideas, methods, instructions or products referred to in the content. |
© 2025 by the authors. Licensee MDPI, Basel, Switzerland. This article is an open access article distributed under the terms and conditions of the Creative Commons Attribution (CC BY) license (https://creativecommons.org/licenses/by/4.0/).