Article

Epikarst Flow Dynamics and Contaminant Attenuation: Field and Laboratory Insights from the Suva Planina Karst System

Faculty of Mining and Geology, University of Belgrade, Djusina 7, 11000 Belgrade, Serbia
*
Author to whom correspondence should be addressed.
Hydrology 2025, 12(11), 276; https://doi.org/10.3390/hydrology12110276
Submission received: 7 September 2025 / Revised: 16 October 2025 / Accepted: 20 October 2025 / Published: 23 October 2025
(This article belongs to the Section Hydrological and Hydrodynamic Processes and Modelling)

Abstract

The present research moves the focus from merely describing epikarst flow to quantifying its natural filtration performance and contaminant retention mechanisms through integrating in situ tracer experiments with controlled laboratory modelling—an approach seldom applied in previous studies. Two field experiments at Peč Cave demonstrated that the epikarst exhibits rapid hydraulic connectivity—evidenced by fast tracer breakthrough with virtual flow speeds between 0.0041 and 0.006 m/s—yet simultaneously provides strong attenuation, as shown by the low tracer recovery and near-complete removal of microbial contaminants as well as nitrogen compounds through retention, degradation, and dilution under natural infiltration conditions, including rainfall and snowmelt. Complementary laboratory simulations further confirmed this duality, with nitrate concentrations reduced by 30–50%. Field data and lab results consistently indicated that the epikarst does not merely transmit water but actively adsorbs and transforms pollutants. Overall, the epikarst on Suva Planina functions as an effective natural filtration layer that substantially improves groundwater quality before it reaches major karst springs, acting as a protective yet vulnerable “skin” of the aquifer. These findings highlight the epikarst’s critical role in Suva planina Mt. karst aquifer protection and results support consideration of epikarst in groundwater management strategies, particularly in regions where springs are used for public water supply.

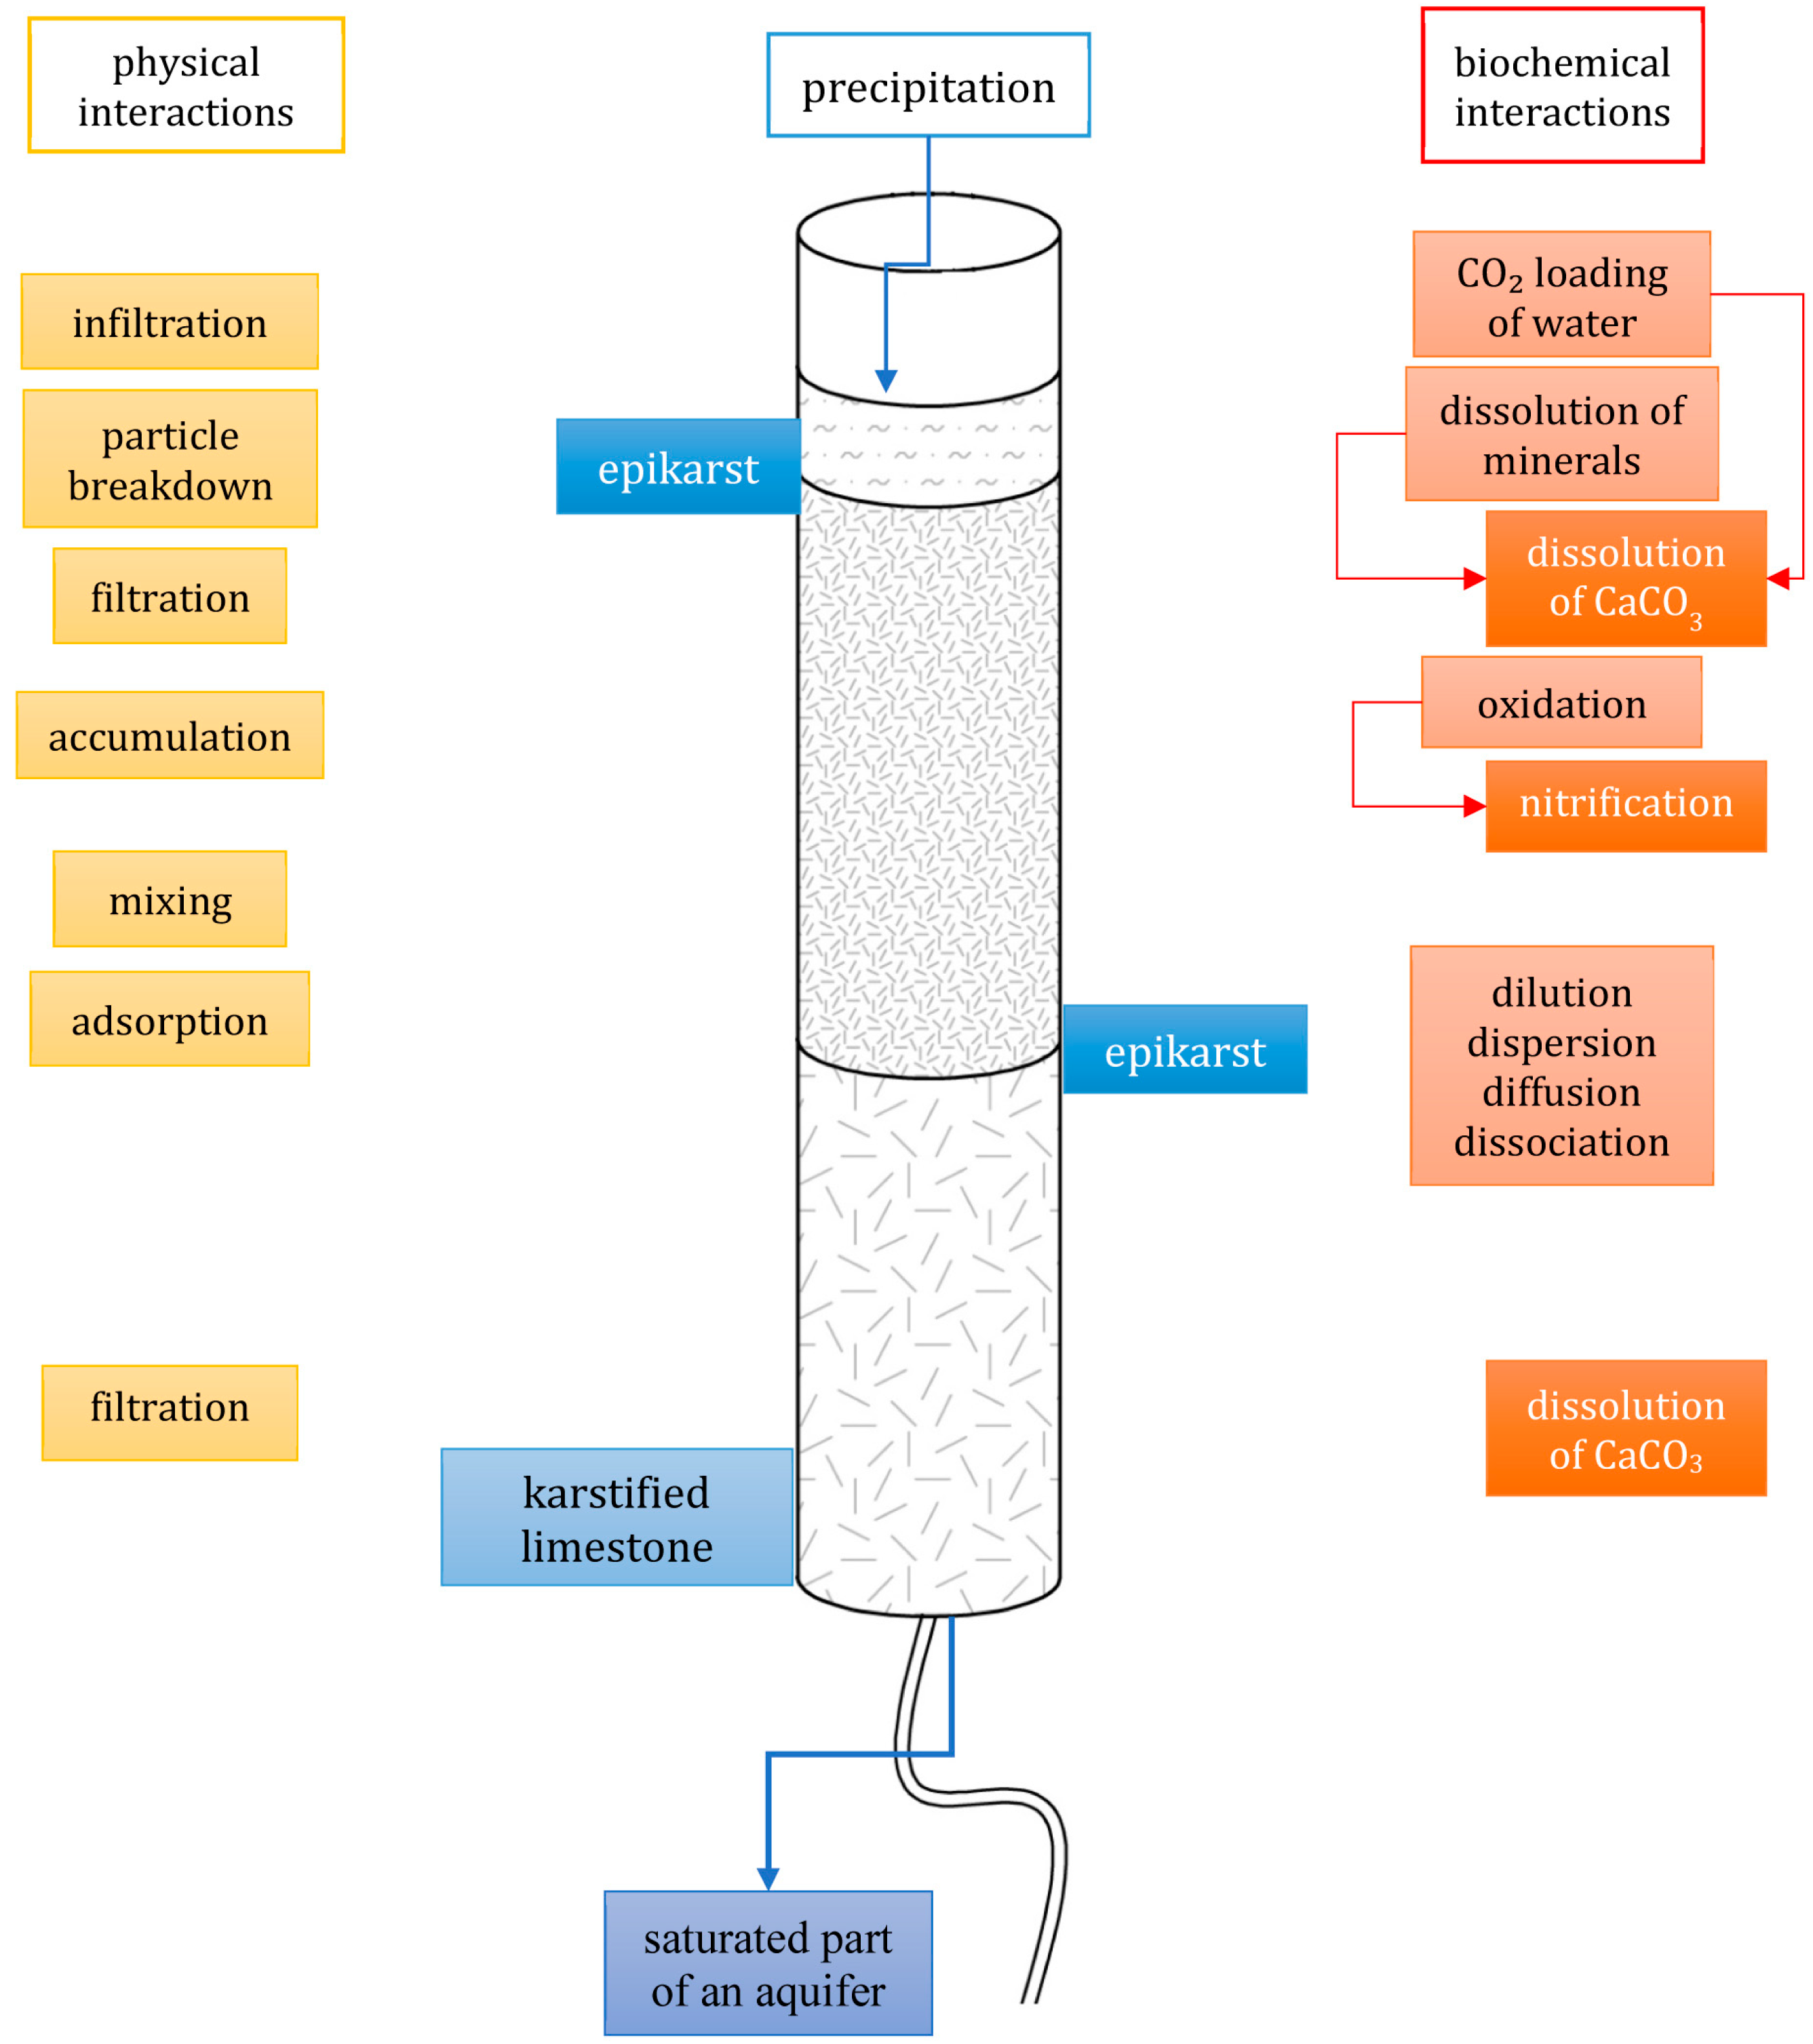
Graphical Abstract

1. Introduction

The epikarst represents the uppermost section of the karst outcrop within the unsaturated (vadose) zone of the aquifer and functions as a complex transitional interface in which surface-derived unconsolidated materials, chemically altered carbonate bedrock affected by corrosive waters, and endemic biological components coexist and interact. Characterized by partial groundwater saturation, high fissure-related permeability, and diffuse circulation that is more uniform both vertically and horizontally than in the deeper karstified rock mass [1], this zone has long been the subject of debate, with researchers disagreeing over its definition, extent, and hydrological significance [1]. Originally conceptualized by Mangin [2,3] as a storage layer positioned above the karst water table, the epikarst has since been shown through hydrochemical and isotopic investigations to facilitate the mixing of infiltrated surface waters with groundwater [4], with tracers such as δ18O proposed for tracking its processes [5], while cave drip monitoring [6,7,8,9,10] has provided further insight into infiltration dynamics, water quality, and preferential pathways.
Conceptual and numerical models [1,11,12,13,14,15,16,17,18] subsequently reinforced the epikarst and dual role that it poses as both a storage and redistribution system, capable of lateral flow regulation and karstification control, with later work distinguishing between concentrated and diffuse recharge forms [19], identifying its importance in seepage beneath dams [20], and emphasizing its semi-permeable character between the surface and deeper aquifer zones [21,22]. The recognition of rapid pressure-pulse responses during storm events by Williams & Fowler [23], later described by numerous authors as the “piston effect” [24,25,26,27,28,29], further underscored its dynamic behaviour.
From a hydrogeochemical perspective, the epikarst is enriched in CO2 due to oxidation–reduction reactions, enabling the use of carbon species as natural tracers [30], while dissolved organic carbon (DOC) has been identified as a critical energy source sustaining cave ecosystems [31,32,33,34], and trace elements and isotopes have increasingly been employed to further elucidate its processes [35,36].
Hydrogeologically, the epikarst differs from the deeper aquifer through its intense fracturing and diffuse dissolution, enabling it to simultaneously enhance groundwater protection via storage while also increasing vulnerability due to preferential flow [37]. Although some researchers regard the epikarst as a universal component of karst systems, others contend that it is absent in highly karstified terrains [38,39], while Šušteršič [40] proposed a contrasting interpretation, viewing it solely as a degradation zone termed the “speleotanitic space.” More recent studies [41] have nevertheless established its essential hydrogeological and ecological roles, showing that it operates as a heterogeneous system capable of storing and filtering precipitation, thereby contributing significantly to groundwater quality regulation.
Epikarst thickness varies extensively—ranging from a few centimetres to as much as 30 metres, though commonly estimated at 10–15 metres [1,17]—and its investigation relies on a suite of specialized methods including speleology, karst hydrology and hydrogeology, speleobiology, and speleodiving [37,42,43,44,45]. Its self-purification potential depends on the size and connectivity of fractures, cavities, and conduits, the nature of their fillings, and the dominant flow regime within the aquifer segment; however, water inflow may induce desorption and contaminant flushing, allowing pollutants to migrate downward, with storm-driven dispersion further expanding their reach and delaying their breakthrough, thereby affecting biodegradation rates. During rainfall or snowmelt, discharge often originates from epikarst storage that can be mobilized by pressure pulses, although prolonged inputs promote deep percolation transporting sediments and contaminants into conduits; tracer tests [46] have demonstrated that particles and bacteria may travel faster than solutes due to exclusion effects similar to those observed in porous media, while case studies from Swiss karst aquifers [47] have shown that attenuation processes can be highly effective, challenging assumptions of uniformly high karst vulnerability. In contrast to porous media, karst systems feature large conduits with limited filtration capacity, concentrated pathways, and rapid contaminant transport, whereby storm events intensify flow velocities and hydraulic heads, mobilizing stored sediments and pollutants [48]; under such conditions, hydraulic gradients may reverse, driving contaminants into fractures and forcing polluted surface water deeper into the aquifer. Given this complexity, the soil and epikarst—often indistinguishable—can be regarded as an initial medium in which infiltrating precipitation undergoes partial quality alteration [41,49]. Against this backdrop, the present study aimed to (1) assess the potential for groundwater purification within the vadose zone in the unsaturated zone of a karst aquifer of which the epikarst represents a critical component; (2) conduct two field experiments under natural conditions at the selected site (the eastern slope of mountain) to investigate water flow and contaminant transport in the epikarst, with the main focus on the mobilization of tracer and the microbial (chemical) contaminants; (3) to identify the processes governing particle dynamics and transport; and (4) to build and calibrate a lab model simulating natural filtration in epikarst.

2. Characteristics of the Study Area

Suva Planina Mountain is an asymmetrical normal anticline, oriented in a NW-SE direction, located approximately 230–250 km southeast of Belgrade (Figure 1). Covering an area of about 630 km2, it is a part of the vast Carpatho-Balkanides orogenic belt. The mountain’s name, meaning “Dry Mountain,” stems from the scarcity of surface springs, with only two on higher slopes—Bojanine vode and Rakoš česma—discharging almost all year.
The mountain’s complex geological structure is a result of multiple thrusting and faulting events during the Caledonian, Hercynian, and Alpine orogenies [50,51,52,53,54] that created a NW-SE trending anticline. Those tectonic movements led to the uplift of the NW part and the formation of a plunging anticline. The core of the anticline is composed of older Silurian–Devonian and Carboniferous rocks, including shales, phyllites, quartzites, and sandstones. These are overlain by Permian sandstones, Liassic clastic rocks, and Middle Jurassic flysch. Erosion in the elevated section has exposed the Paleozoic core, while the limbs of the anticline consist of heavily fractured limestone and dolomite from the Middle and Upper Jurassic, as well as the Lower Cretaceous, which dip to the northeast and southwest.
The mountain’s surface morphology differs from that of the Dinarides, lacking large karst poljes and featuring only a few small caves. However, the mountain features impressive rocky cliffs on its northeastern side, while central part resembles a plateau, dotted with numerous dolines and small uvalas. Karstification of the landscape has produced a range of small to medium-sized surface and subsurface features across the mountain. These depressions are chaotically scattered but sometimes occur along faults. Surface features include solution flutes, runnels, limestone pavements (clints and grikes), and kamenitzas. Medium-scale landforms include sinkholes and dolines, while several caves and vertical shafts (jamas) are found mostly on the steeper western and northern slopes [53]. The mountain is unevenly vegetated—forested in the east and south, and dominated by pastures and meadows in the central and western parts.
On the eastern slopes of Suva Planina, highly productive karst aquifers have been identified (Figure 1) within the Tithonian and Lower Cretaceous limestones (the dominant lithological unit in the area). Fissured aquifers occur in parts of the terrain situated outside the central research zone, within clastic and magmatic rocks. Intergranular aquifers are developed in Quaternary (s, al, i) and Neogene (Pl) clastic sediments, generally possess only local significance. Permian sandstones, Jurassic–Cretaceous flysch, and Oligocene sediments (siltstones, marls, claystones, sandstones) are characterized as impervious rocks (aquitards).
The recharge of the karst aquifers is precipitation-based, with an effective infiltration rate of approximately 55%. Local faults, transversal to the regional NW-SE dislocations, are believed to have enhanced the karstification process [50,53]. Further and finer division of the groundwater flow resulted from additional karstification provided quite a few orifices of the aquifers in the foothill of Suva Planina Mt [50,53,55]. As a result, several large karst springs, including Mokra, Divljana, Gornjekoritničko, and Ljuberađa, emerge from the carbonate rocks. Groundwater flow follows a radial pattern from the anticline’s axis towards its limbs, with local faults redirecting flow and causing further groundwater division. With dynamic groundwater reserves estimated at up to 2.06 m3/s, it is the second-largest system in the region [50,51]. Recognizing its value, water authorities captured aforementioned four karst springs, in the late 1980s to supply drinking water to Niš, Serbia’s third-largest city.
The research area has a moderate-continental climate with characteristically long and cold winters and relatively warm summers. The average annual precipitation for the period 1991–2018 is 593.8 mm [41,53]. The average multi-year air temperature for the same period is +12.6 °C.
In the context of epikarst studies of the Suva planina Mt., research [41] has shown that integrating indirect survey techniques (e.g., remote sensing) with direct field investigations—including geomorphological analysis, hydrogeological and epikarst mapping, geophysical surveys, petrological and sedimentological studies, and pedological assessments—produces robust and comprehensive results. To evaluate the degree of karstification, i.e., the stage of epikarst evolution within the study area, four categories of this subsurface zone were distinguished [41]. The most detailed investigations were undertaken at selected sites along the eastern slopes of the mountain (Figure 1): Rakoš Spring, Bukovica (between Peč Cave and Bežište), Bežište village, Mokra village, and Divljana village. Classification of the epikarst was based on reference profiles; however, complete spatial mapping was constrained by the inaccessibility of several slopes, particularly between Bežište and Divljana village.
In total, 68 sites were surveyed to determine the presence and developmental stage of the epikarst. Future mapping, aimed at defining both the spatial extent and the key characteristics of the epikarst, should be preceded by Unmanned Aerial Vehicle (UAV)—based terrain surveying. Such aerial imaging will allow for the identification of reference profiles in areas that are not readily accessible for direct field investigations and were not previously covered by field surveys [56,57]. Notably, the results identified Peč Cave as a highly suitable location for the implementation of several experiments.
It is a nearly horizontal cave formed in Upper Jurassic (Tithonian) limestone, situated in a complex faulting area, beneath a soil-covered convex hillslope with beech and hornbeam vegetation. The entrance to Peč Cave (Figure 1) lies at an elevation of 885 m above sea level. The passage has a simple, tunnel-like shape and is approximately 20 m long. The entrance is elliptical, 7.5 m wide and 2–2.5 m high, while the chamber reaches a maximum height of 10.43 m. Above the entrance, a limestone outcrop extends up to 10.5 m in height. Overlying the cave are 0.1–0.3 m of soil and 3.5–12 m of karstified limestone, including the epikarst zone. At its far end, the cave terminates in a smaller, inaccessible sub-horizontal passage approximately 4.5 m in length.

3. Materials and Methods

Combination of remote sensing techniques with comprehensive field surveys yielded highly reliable results and demonstrated the effectiveness of combining indirect and direct survey methods [41] within selected areas of Suva Planina Mt. The soil along with the epikarst (since the boundary is sometimes indistinct) can be considered as a medium for the initial alteration of the quality of infiltrating surface water (typically in the form of rain and melted snow). These alterations are fragmentary, and changes begin in the soil or occur within the epikarst layer [41,49]. This study sought to evaluate the self-purification capacity of the epikarst within the vadose zone of a karst aquifer by combining field and laboratory approaches. It involved tracer and contaminant transport experiments under natural conditions to identify flow and particle dynamics, alongside the development of a lab-scale filtration model to replicate epikarst behavior. These objectives were pursued within the Suva Planina Mt., previously examined through multidisciplinary research [41,49,50,51,52,53], where Peč Cave, located on the eastern slope offered straightforward access and a simple geological setting, become an ideal site for such investigations.
To assess the potential for groundwater purification within the vadose zone two field experiments were conducted under natural conditions.
The first experiment employed sodium fluorescein as an artificial tracer [37,42,44,58,59] to determine the velocity of epikarst water flow at the Peč Cave site. This tracer experiment had a dual objective: to characterize flow conditions in the epikarst and to study solute transport.
Thereafter, a second experiment was conducted at the same location using a low-intensity contaminant, with the aim of quantifying pollutant transport velocity and examining its transformation over time—or more precisely, along the length of its subsurface flow path. The experiment also aimed to assess percolation, particle transport, contaminant attenuation and the efficiency of natural self-purification processes in general, similarly to recent research [46,47,48,60,61]. Primary assumption was that the epikarst functions as a semi-permeable barrier, which enables the retention and transformation of pollutants under natural conditions and that epikarst acts as a transient reservoir, moderating the flow response and hydrograph peaks—implying delay and partial dilution of contaminant pulses.
These experiments provided empirical data to estimate the time scale and extent of water quality transformation processes within the epikarst zone. After the experiments, both quantitative and qualitative analyses were conducted. The results were used to develop and calibrate a laboratory model simulating epikarst behaviour under controlled conditions, replicating natural filtration in the presence of a chemical contaminant.

4. Results and Discussion

4.1. The Artificial Tracer Experiment

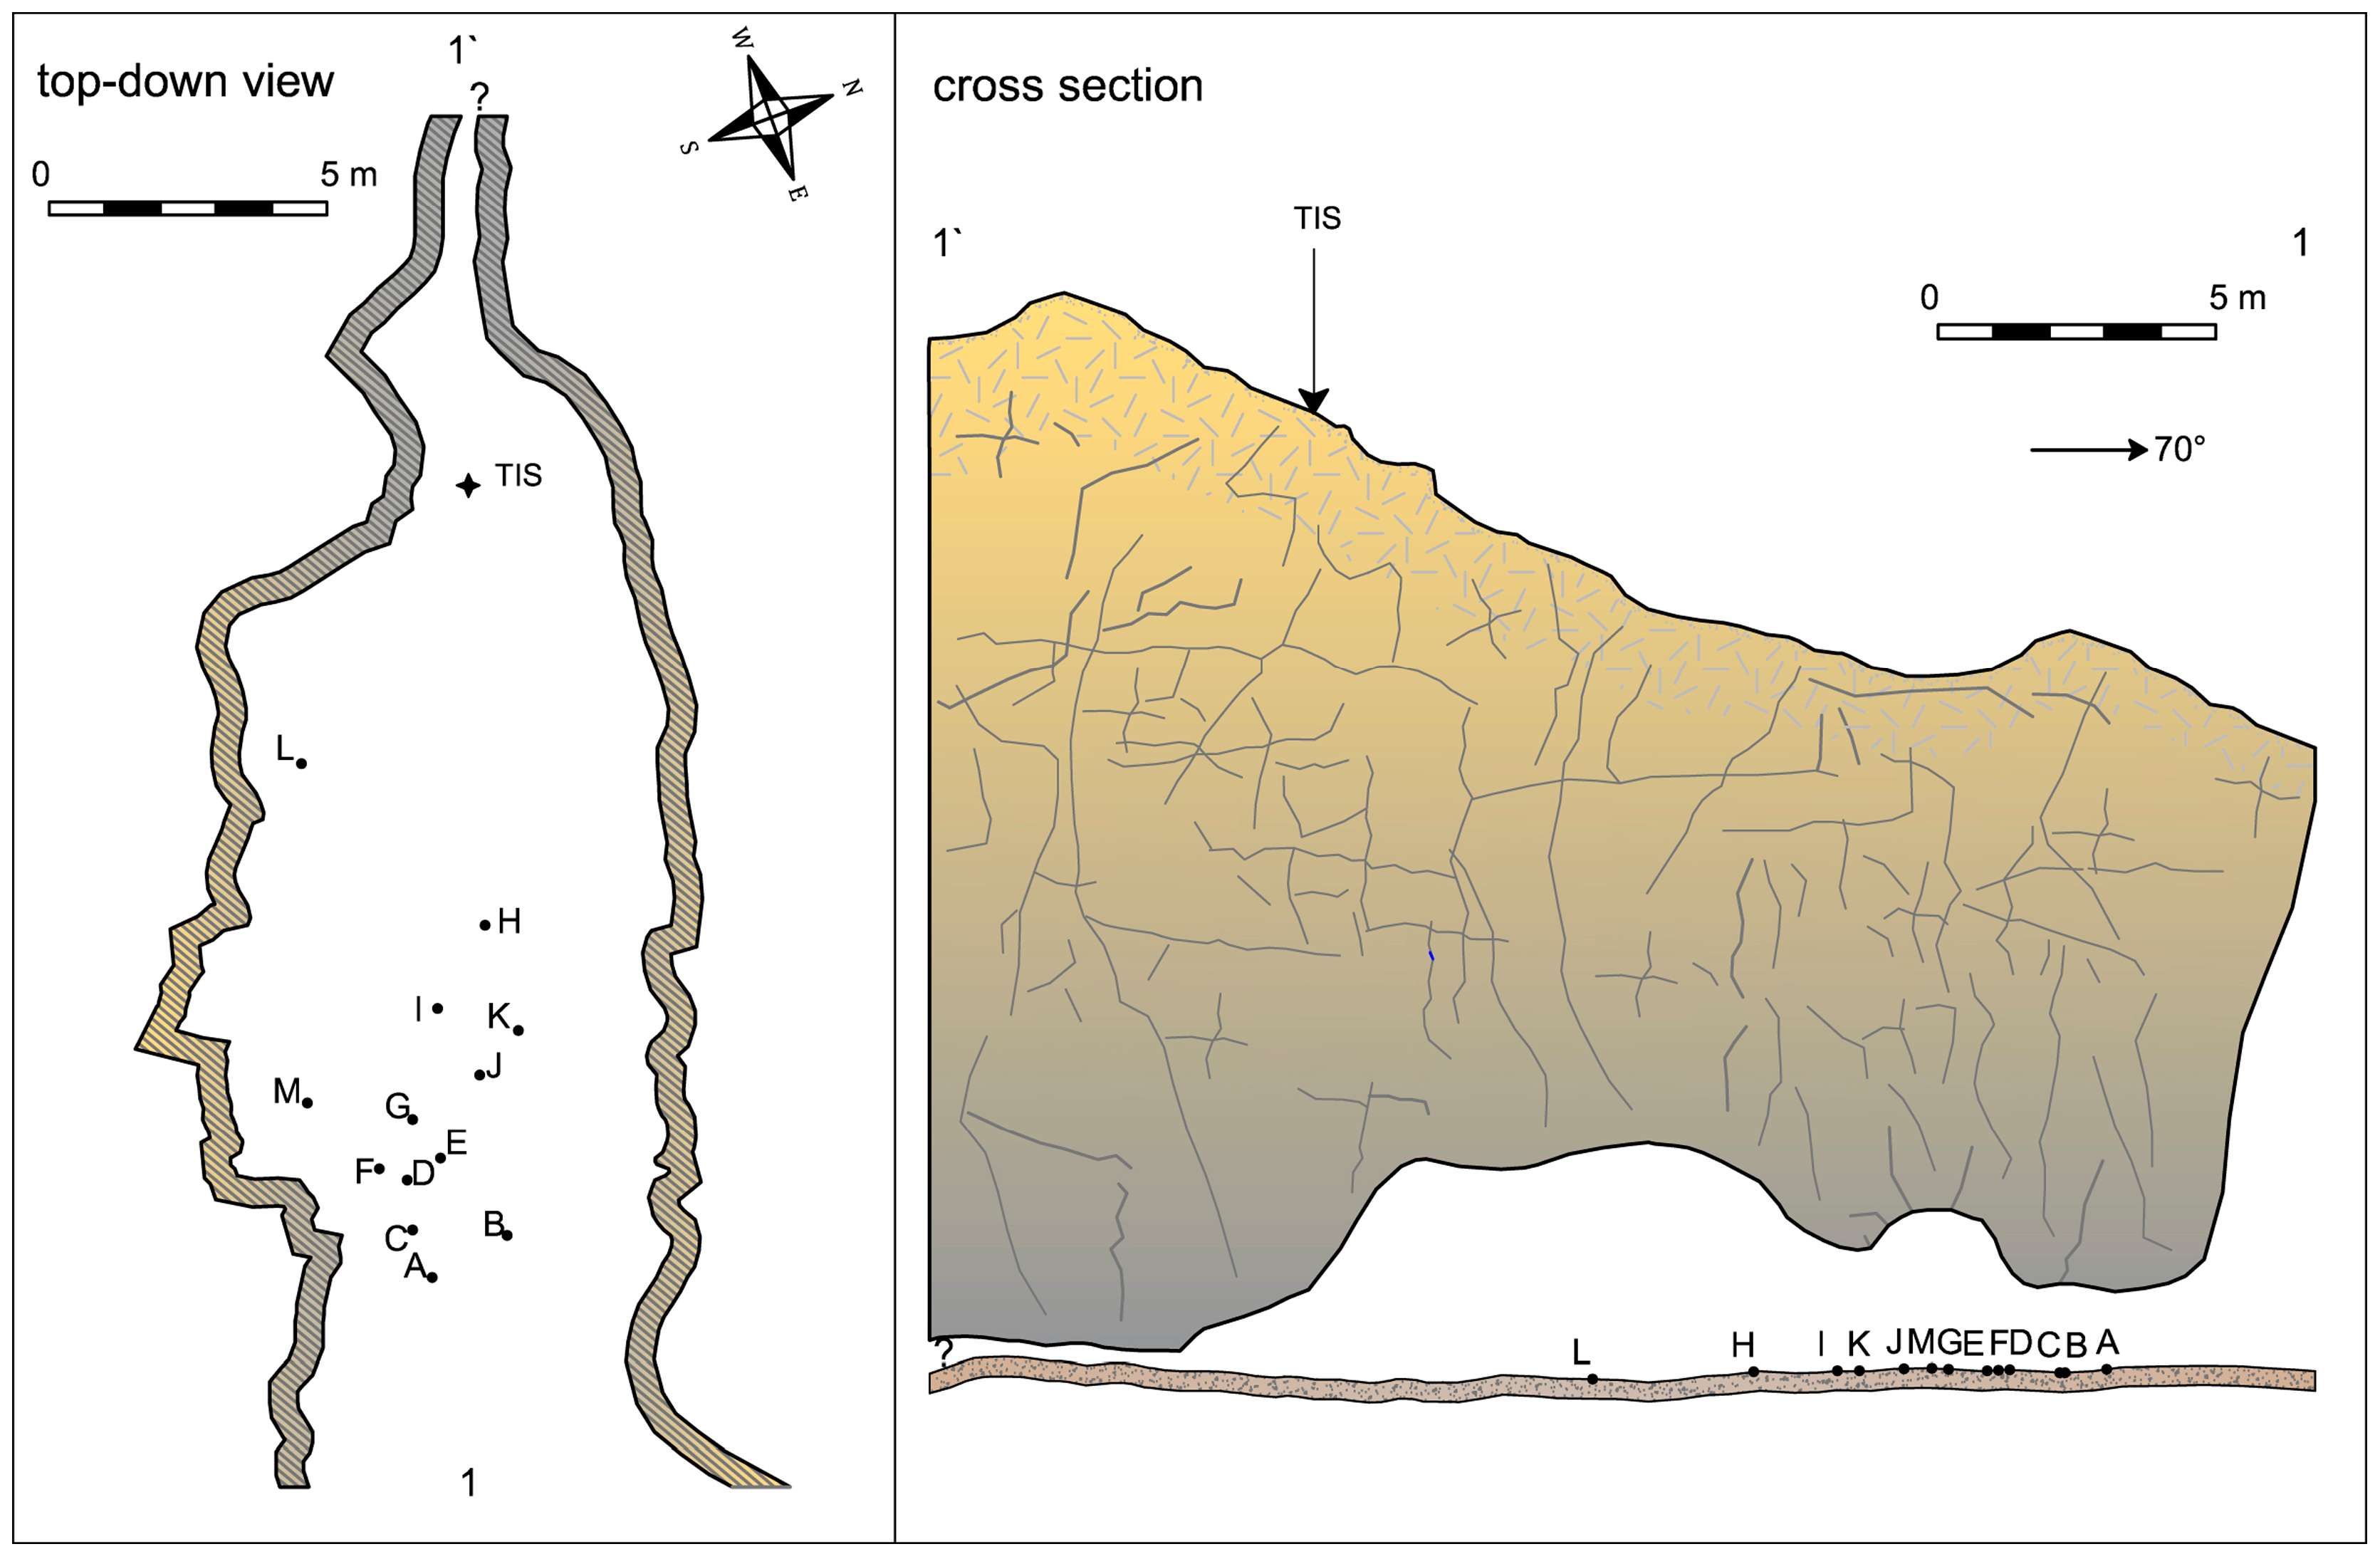
The artificial tracer (Uranine) experiment in the epikarst was conducted at Peč Cave from 16 to 23 February 2019 [49]. This site was selected due to its compact area and minimal equipment needs, allowing for effective monitoring of infiltrated water as it moves through soil, epikarst, and karstified limestone layers, with collection at 13 drip points inside the cave (Figure 2). Based on field assessments and previous studies [8,9,59], a specific micro-location for tracer injection (TIS) was chosen on the surface above the cave, about 20 m from the vertical projection of the cave entrance, enabling the entire cave ceiling to serve as a sampling transect.
In addition to precise sodium fluorescein concentration sampling, measurements of specific electrical conductivity (EC) and water temperature were performed as well, considering significance of those two parameters. Several ceiling drip locations in the cave were monitored. To evaluate the unsaturated zone’s response to natural recharge (rain and snowmelt), discharge, temperature, and EC were measured [58,62,63]. Discharge was determined by collecting water in plastic containers over fixed intervals, and EC and temperature were recorded using a WTW Cond 340i probe (WTW Wissenschaftlich-Technische Werkstätten GmbH, Weilheim in Oberbayern, Germany).
Sampling containers were placed on February 16 at visible drip sites, labelled A–M, from the cave entrance (A) to the deepest active drip point (L). Sampling began several hours before tracer injection and continued at 10 locations (few of them dried out) over six days. A 10 L solution with 50 g of Uranine was poured at the tracer injection site (TIS), followed by 80 L of water [49]. The tracer was initially confirmed using UV light and later quantified in the lab with a 10AU Turner Designs fluorometer (Turner Designs, Sunnyvale, CA, USA).
During a tracer test (16–23 February 2019) winter condition prevailed, air temperatures just began to rise, initiating the melting of snow cover present in the study area. Consequently, the volume of water infiltrating through the cave ceiling was higher at the start of the test than during the subsequent monitoring period. After an initial warming, a temperature drop followed. This resulted in a decline in percolation water quantity at most sampling points inside the cave. By 22/23 February, freezing conditions caused complete water stagnation due to a sharp temperature drop.
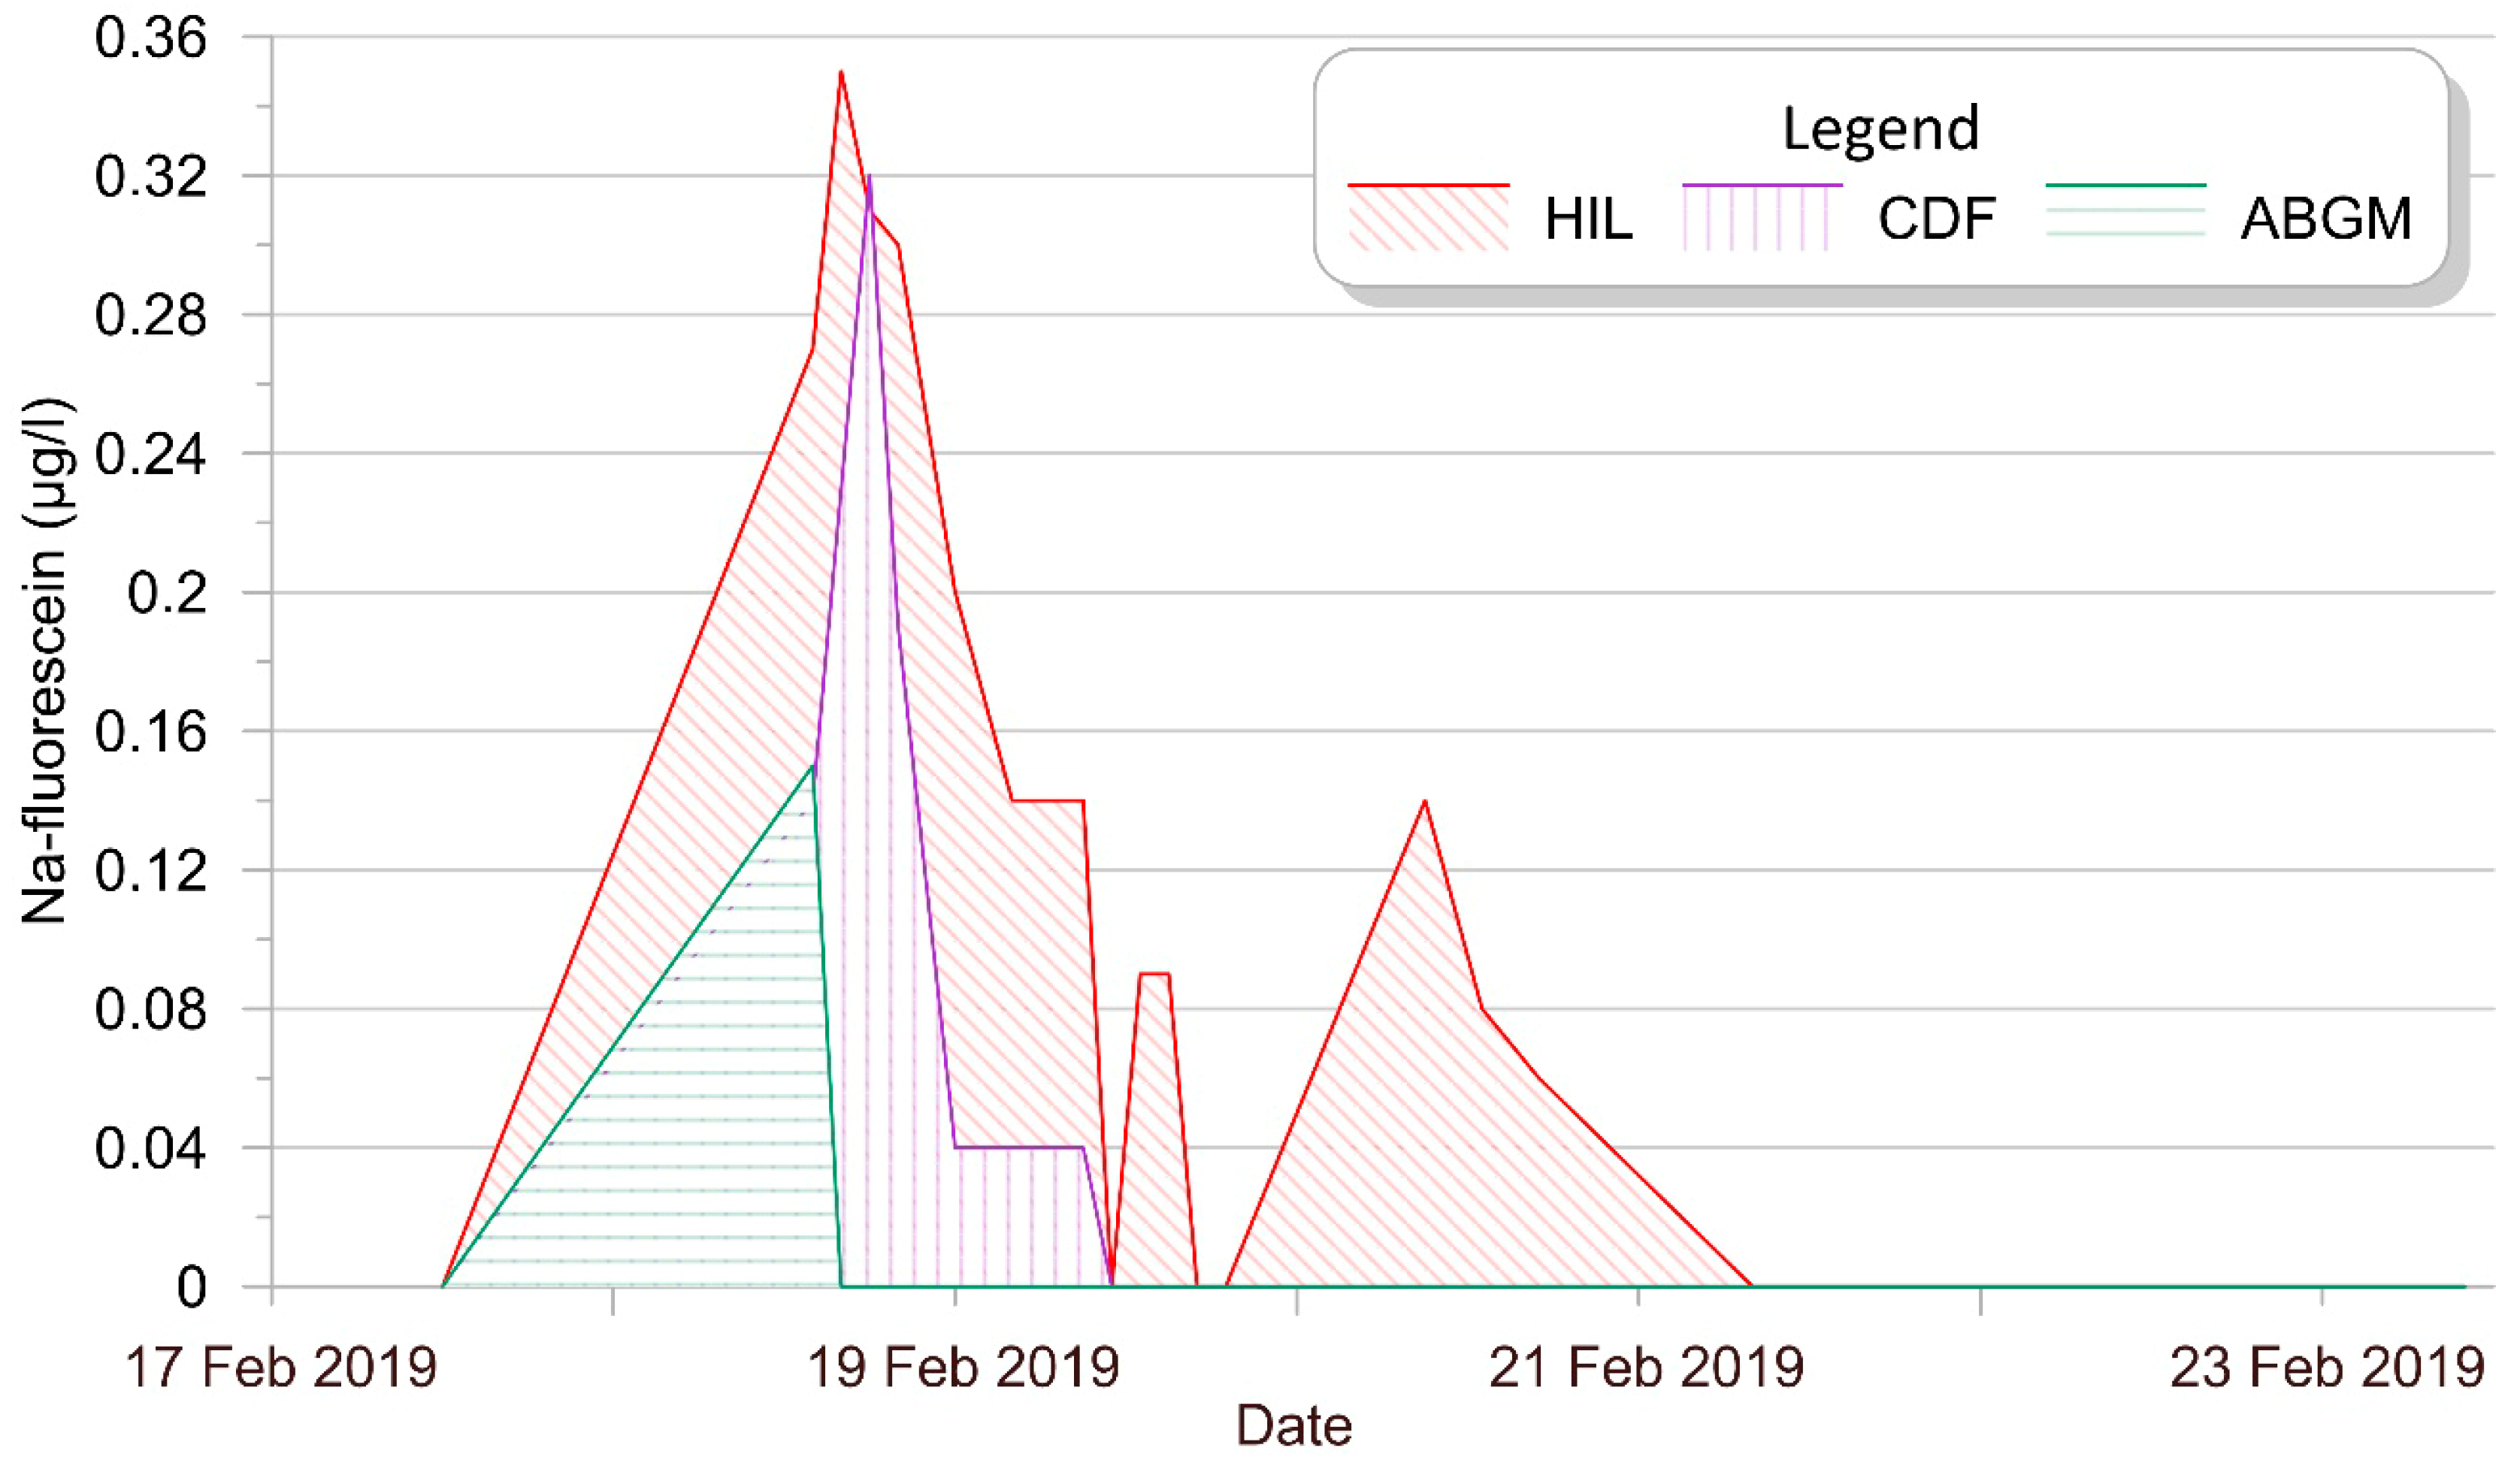
The tracer reached nearly all parts of the cave within an hour (Figure 2 and Figure 3). It was applied at 1:00 PM on 18 February, and by 2:00 PM, significant Uranine concentrations were already detected. The tracer was present at several sites but absent at B, G, and M.
Sampling sites were grouped by location and drip water volume:
  • Group 1 (H, I, L): Tracer appeared in initial samples. The highest concentration (0.17 μg/L) was recorded at H at 4:00 PM. At H, levels declined steadily and vanished by 9:00 AM the next day. At I, three pulses were observed, with concentrations increasing from 0.08 to 0.14 μg/L. At all tracer-positive sites, detection ceased within 21 h.
  • Group 2 (C, D, F): Near the cave entrance, tracer was detected immediately. The highest concentration occurred at D. Tracer was undetectable at C and F after 8:00 PM, and at D after 9:00 AM the next day.
  • Group 3 (A, B, G, M): Characterized by minimal inflow and fewer samples. The tracer was detected only at A (0.15 μg/L) in the first sample.
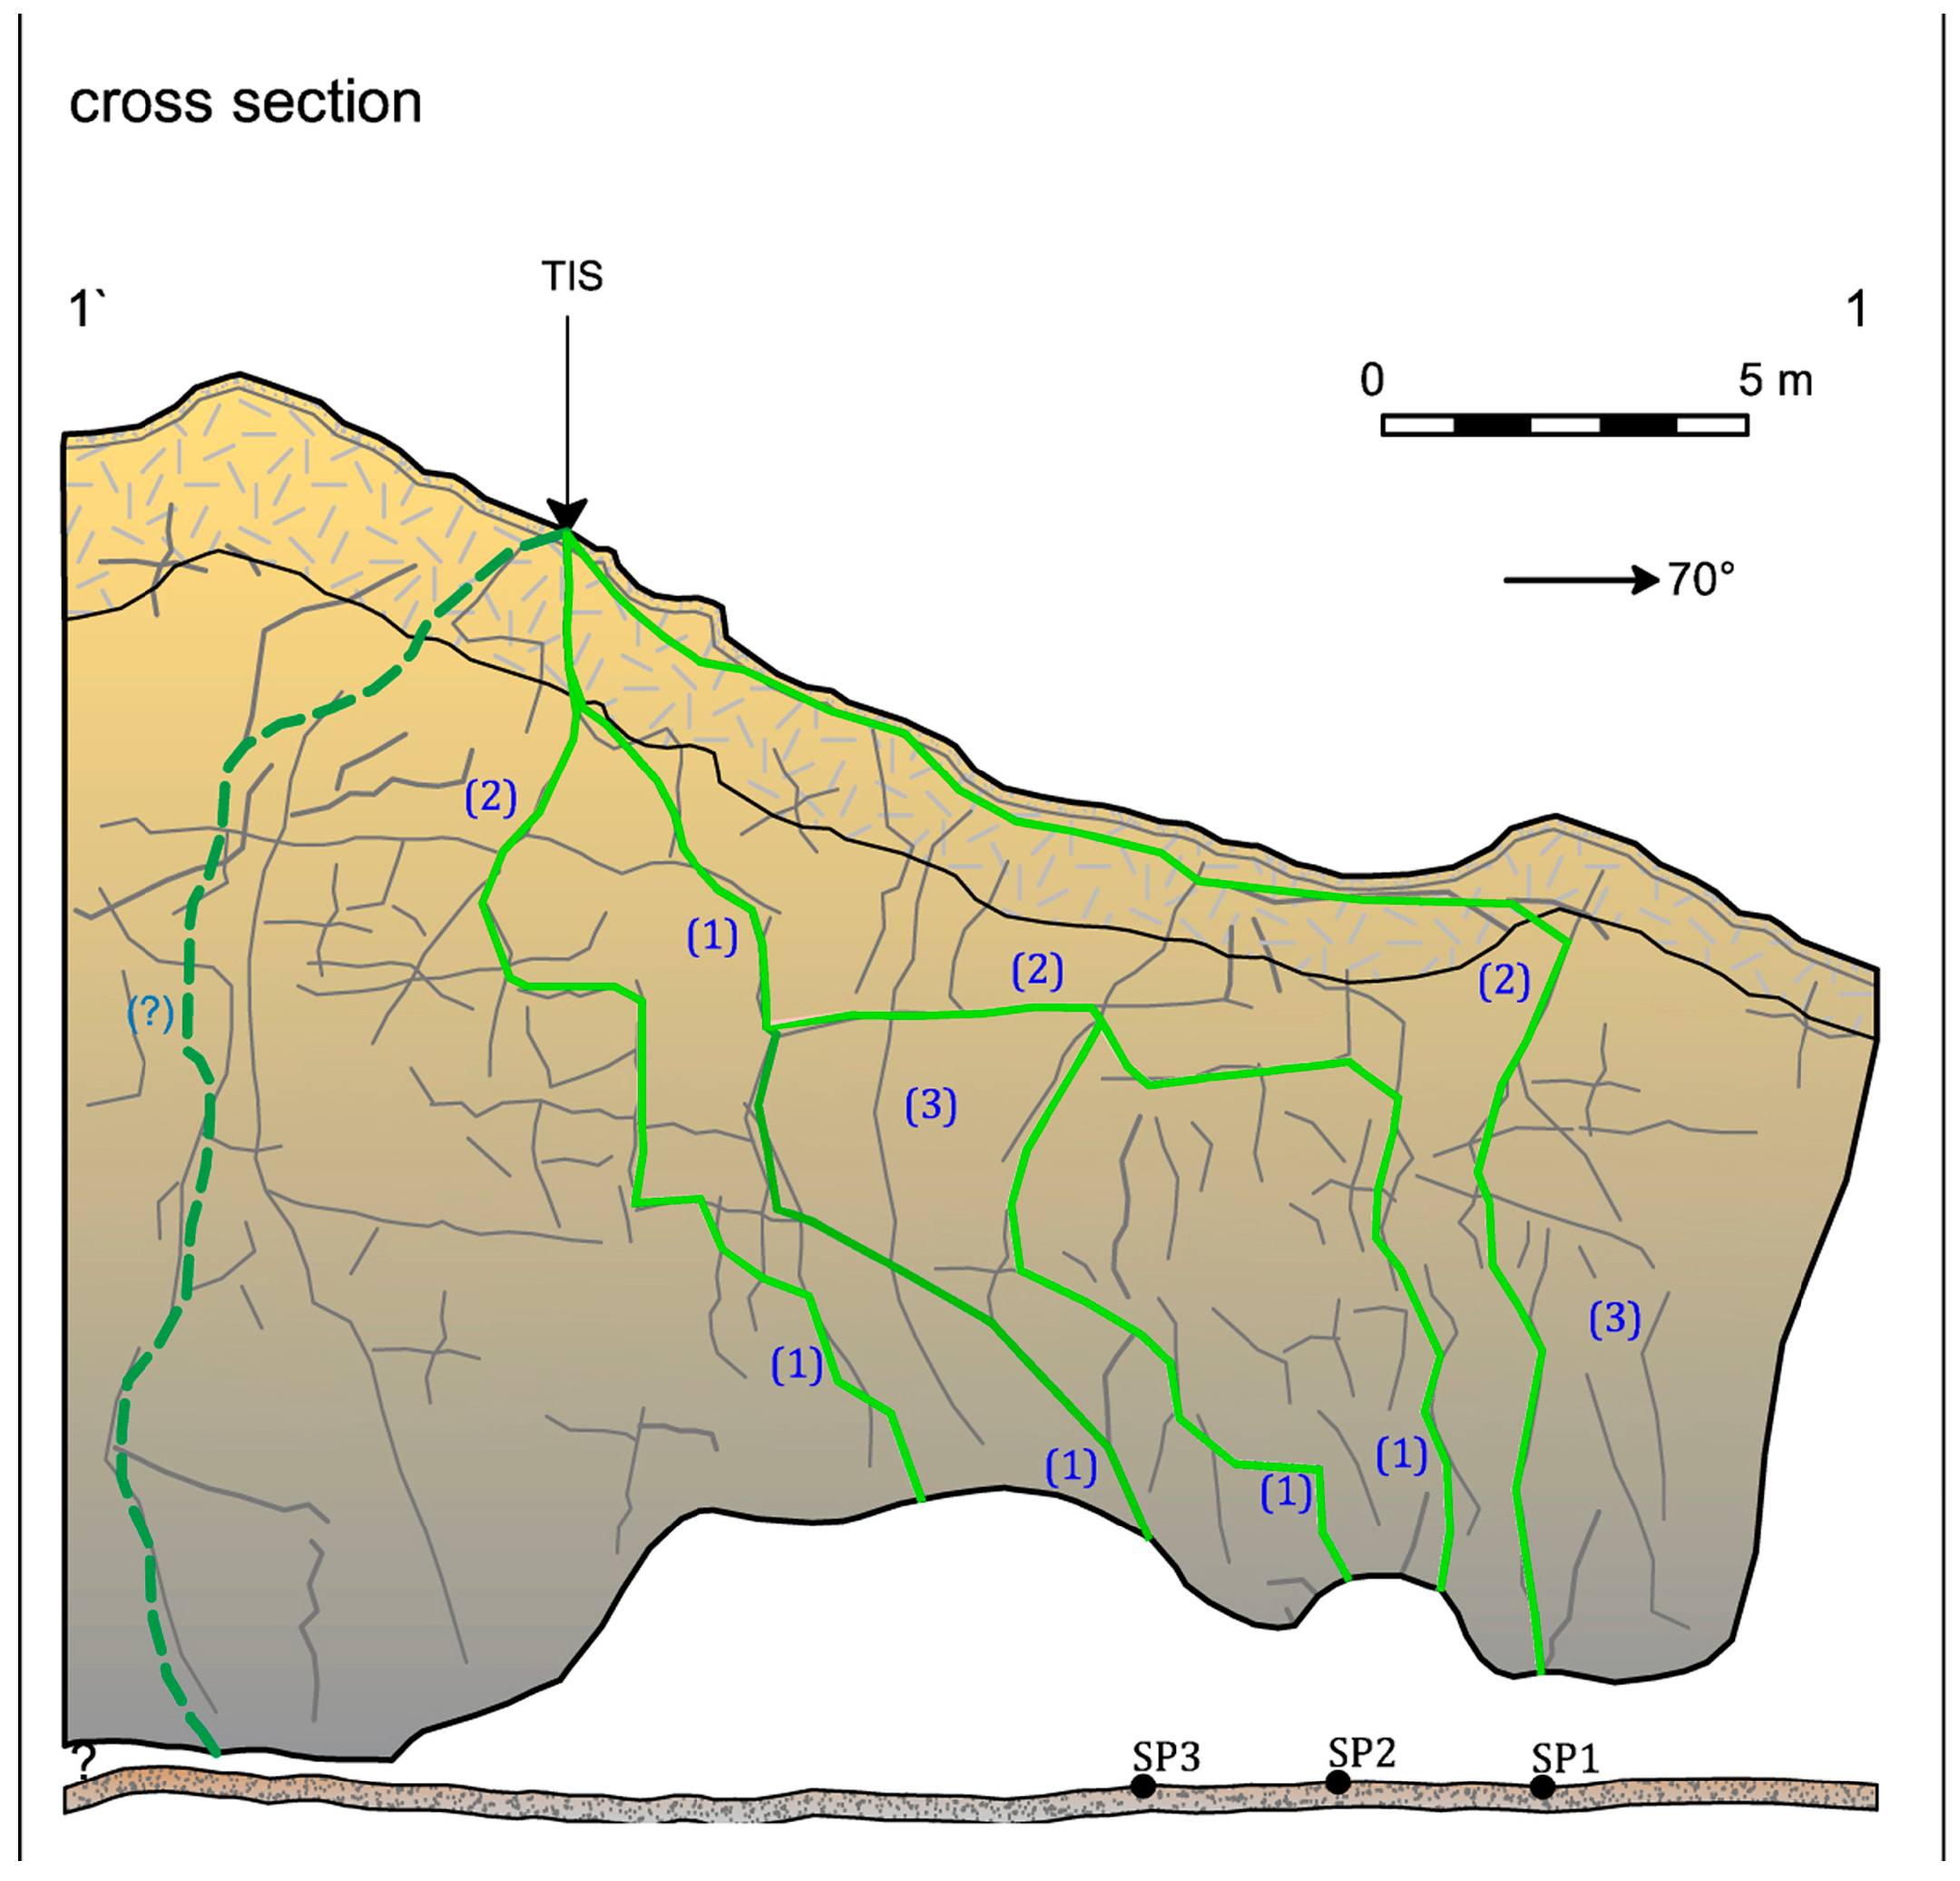
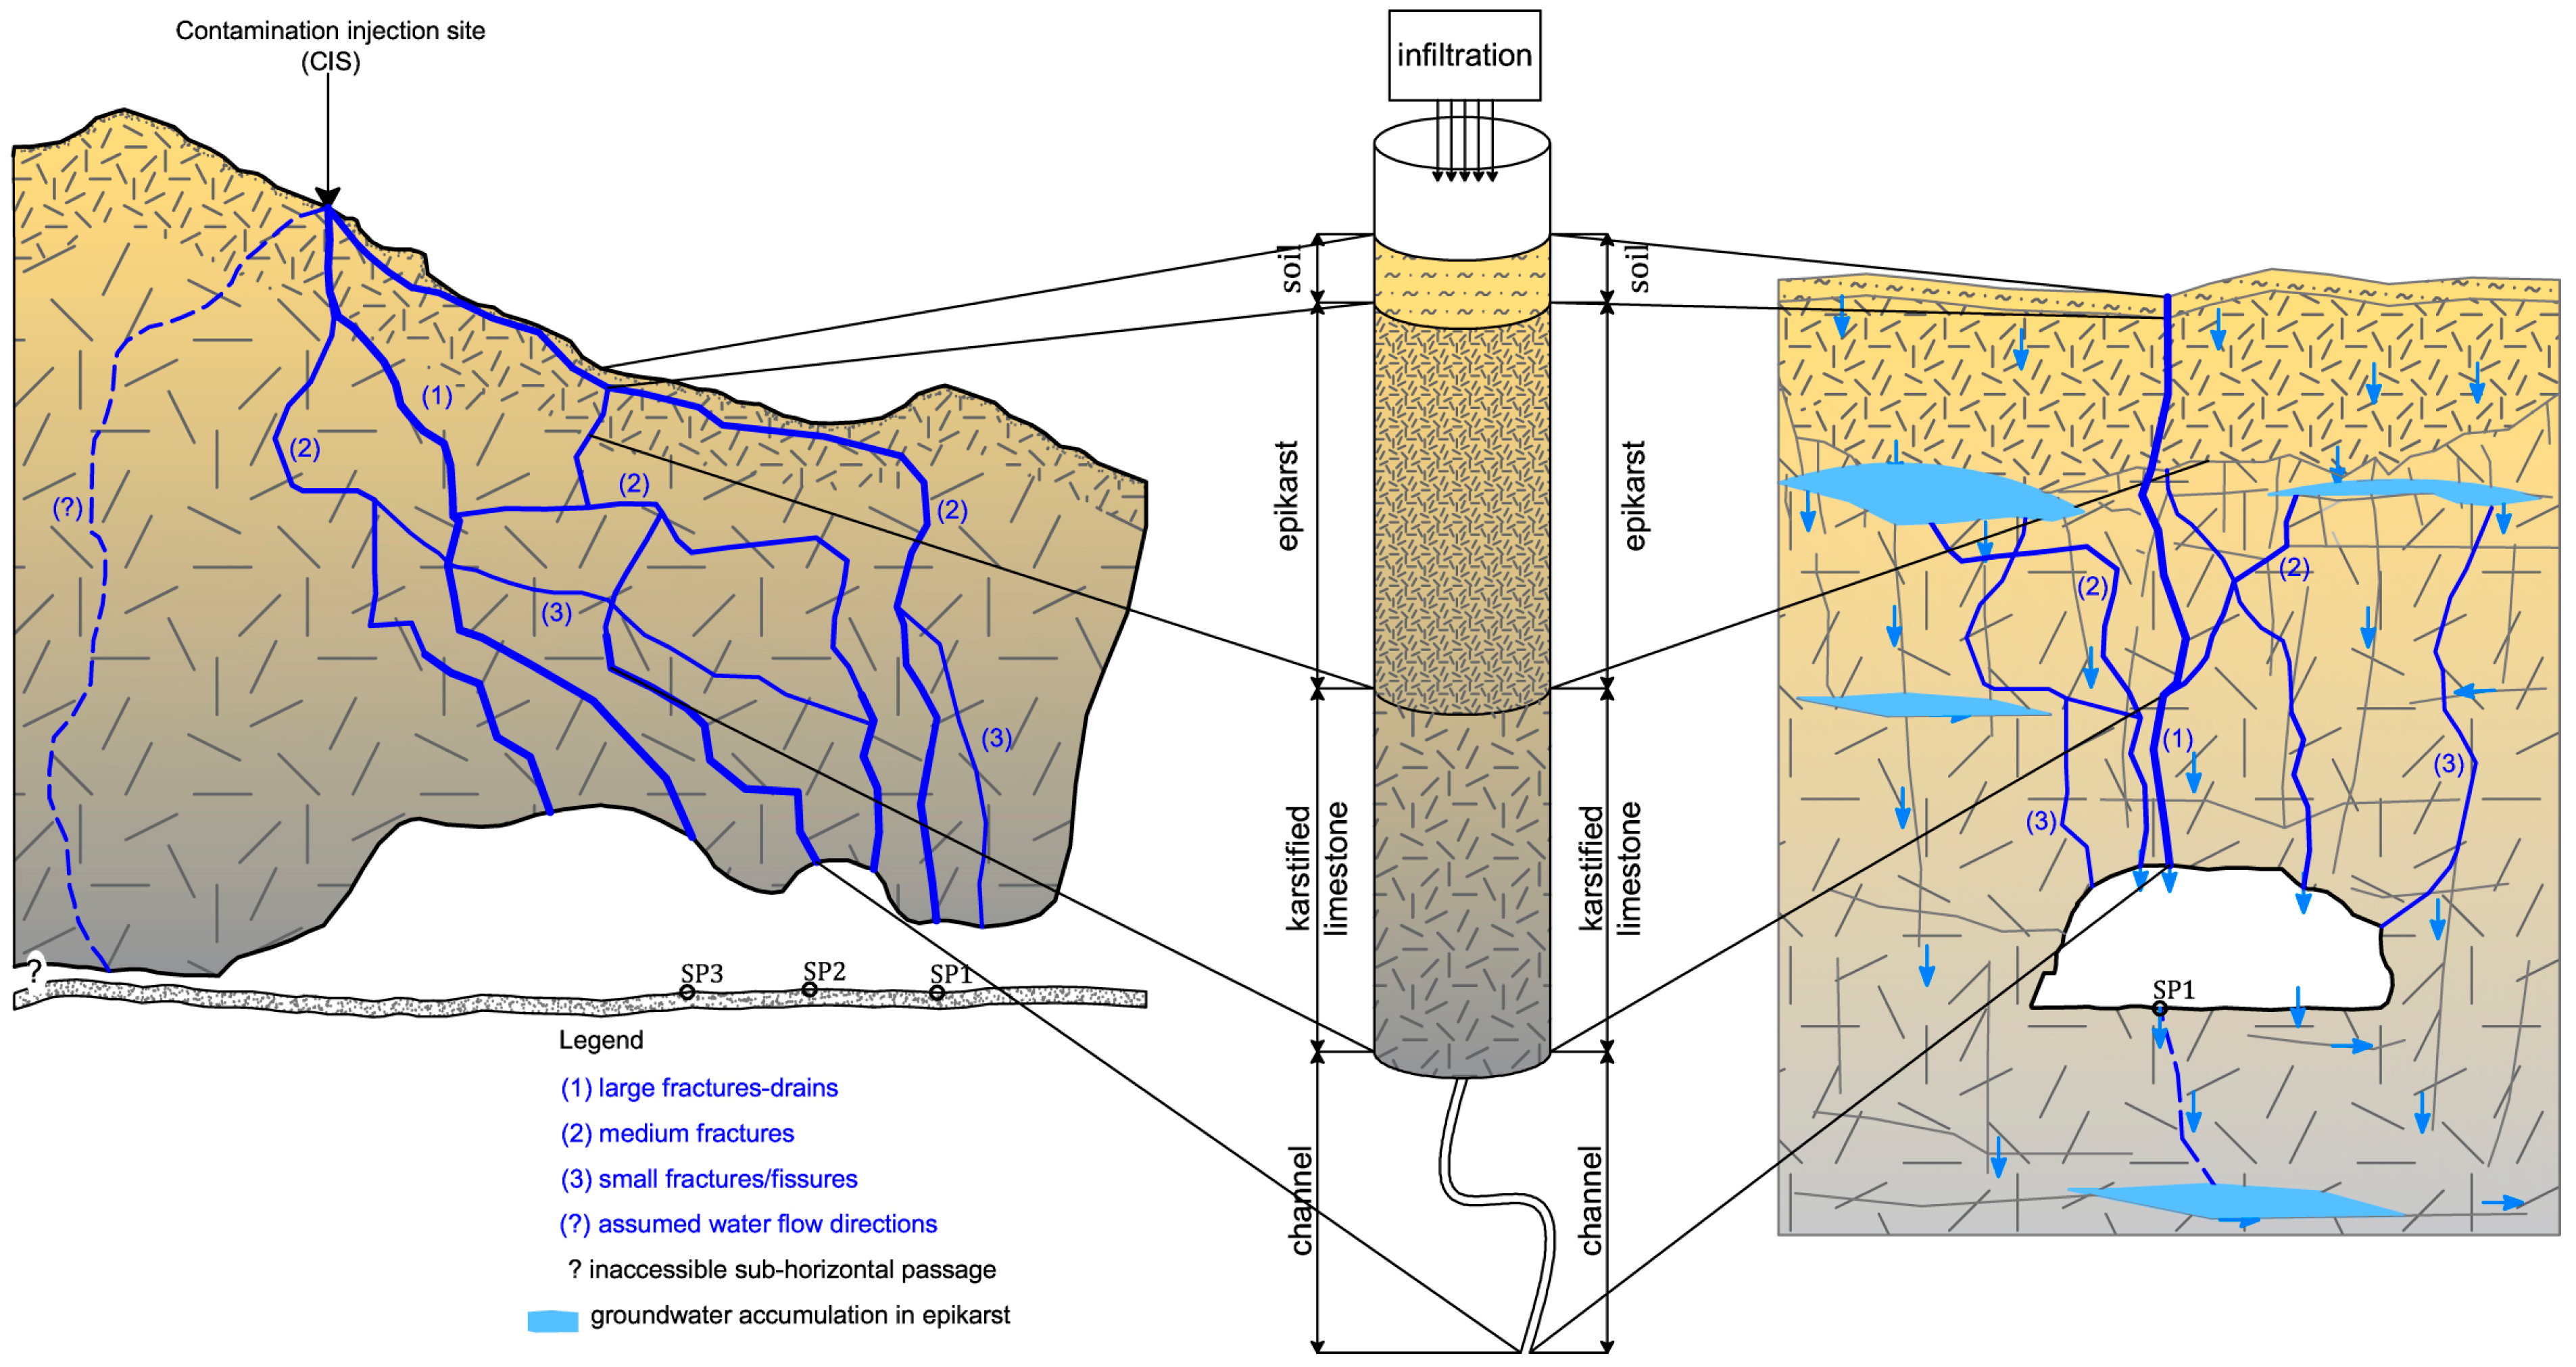
The tracer travelled up to 22 m within an hour, with detections at H (17 m), A (22 m), and L (15 m). Based on these distances, the calculated virtual flow velocity through the epikarst and karstified limestone ranged from 0.0041 to 0.006 m/s [7]. Breakthrough curves (Figure 3) revealed three fracture types based on hydrogeological function, influenced primarily by aperture width: (1) large fractures—drains, (2) medium fractures, and (3) small fractures/fissures (Figure 4).
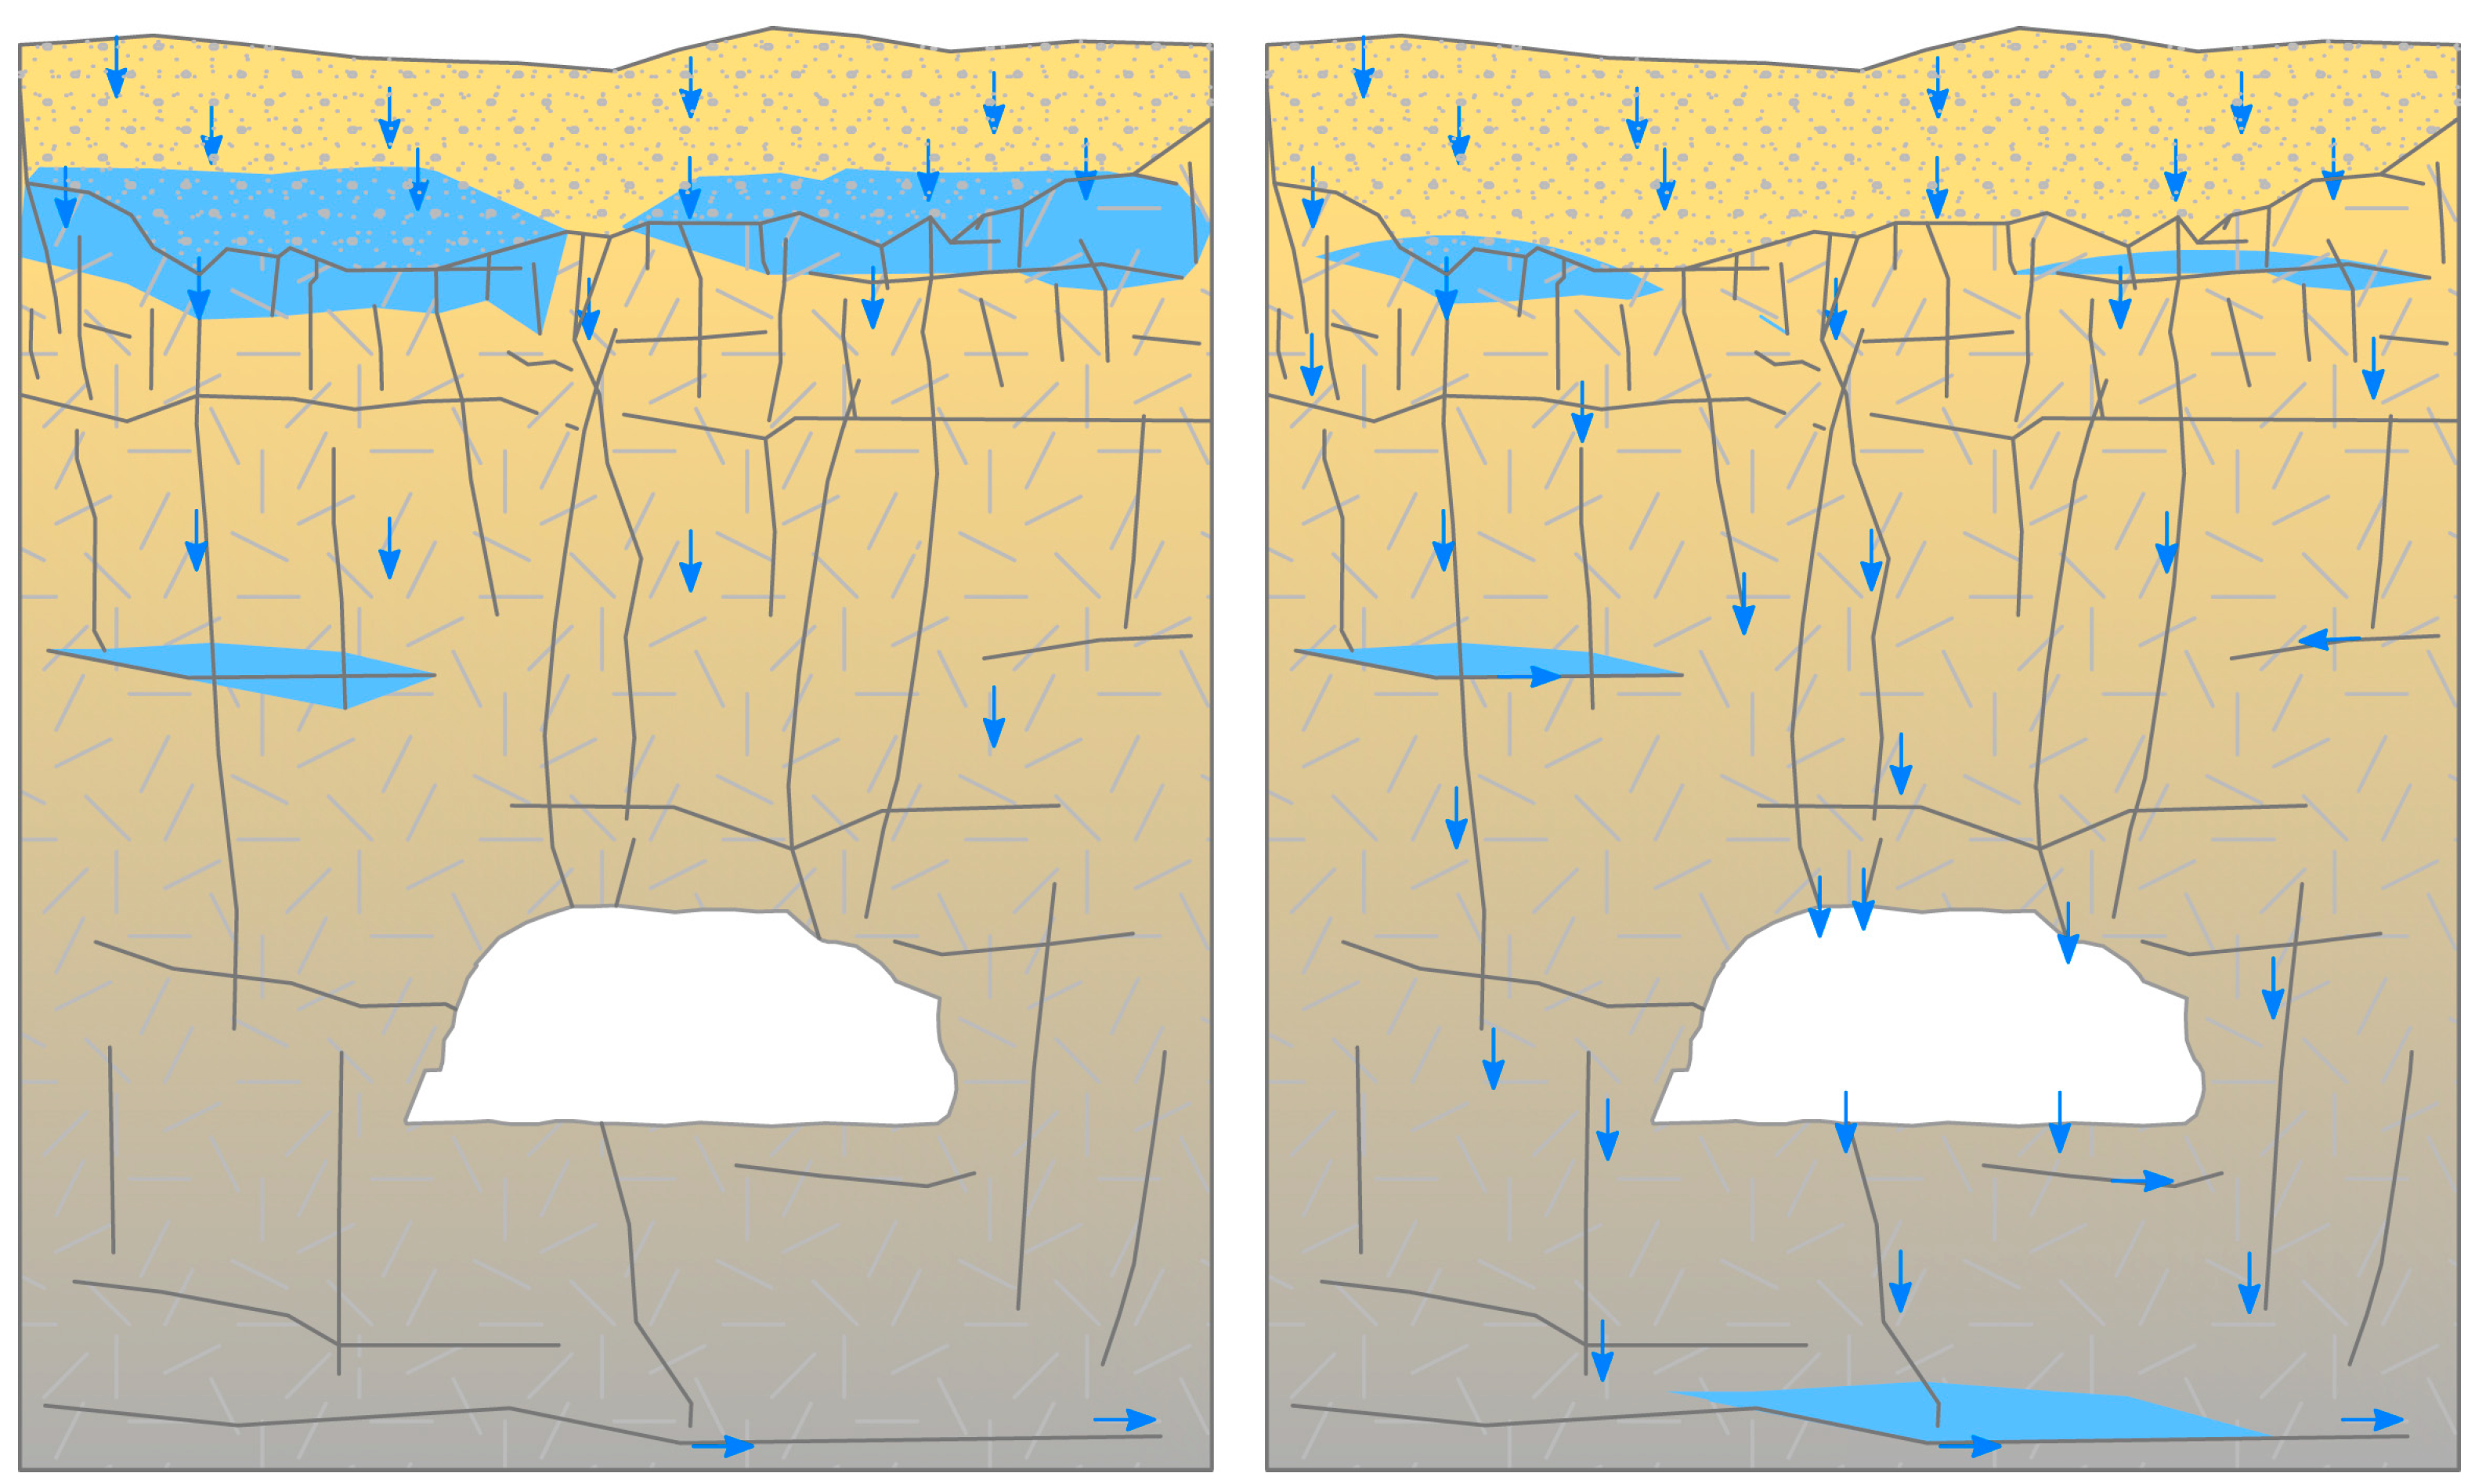
A quantitative analysis [42,43] indicated a tracer recovery rate of only ~3.5%, likely due to adsorption onto soil particles (e.g., Terra Rossa, clay minerals) and the complex channel network—some siphonal—where flow halts until reactivated by further infiltration. Additionally, reduced percolation during the test and bypassing fissures likely diverted water from the cave. These results suggest that the epikarst acts as a semi-permeable membrane, temporarily retaining water and solutes and releasing them with delay—termed the “moment of detachment”—in response to subsequent recharge.
Experiment demonstrated that the epikarst acts as a semi-permeable membrane, retaining part of the infiltrated water and solutes, which are then released later in one or more waves (Figure 5). The figure illustrates the conceptual model of water movement through the karst system. Blue areas represent accumulated water in surface depressions, epikarst voids, and subsurface cavities, while blue arrows indicate the direction of percolating water and groundwater flow. The yellow layer corresponds to soil or unconsolidated material, and the beige layers depict fractured carbonate bedrock forming the epikarst and vadose zone. White areas denote larger karst conduits or cave voids through which concentrated groundwater flow occurs.
Retention and delayed release of the tracer were observed at locations within the cave as we could observe at Figure 3. It was last detected 53 h after initial application (locations HIL), compared to 21 h at other sites.
At site L, peak tracer concentration (0.12 μg/L) reached 5 h post-application, followed by a gradual decrease, a stable period at 0.09 μg/L, and a second peak (0.10 μg/L) before disappearance.
At site D, the tracer peaked on February 18 at 18:00 h and then dropped to 0.04 μg/L, remaining stable until it ceased flowing at 9:00 h the next day—likely due to slower water movement through smaller conduits with partial tracer retention.
The retention and delayed release mechanisms [6,7,8], show that with a decline in the water volume within the porous/conduit system, the vertical pressure decreases, reducing both the quantity and intensity of drip water. Two main mechanisms explain tracer appearance:
  • A branched conduit network, possibly including siphon segments, where water with tracer is temporarily retained until displaced by subsequent flow.
  • Partial adsorption of the tracer to soil particles (Terra Rossa) or clay minerals, followed by desorption when clean water flushes the system [43].
In contrast to the findings of [7], where tracer retention lasted for several days, in this experiment the tracer was eliminated within 21 h, which indicates better connected waterways in this type of epikarst.

4.2. The Experiment with Contaminants

The contaminant experiment was conducted during the transition from winter to spring, coinciding with snowmelt and increased rainfall from 6 to13 March 2020. Precipitation was substantial, with 35–40 mm of rain on the second testing day, followed by snowfall on the third, which later melted and further enhanced infiltration into the epikarst. The low-intensity contaminant—a dilute manure slurry—contained elevated concentrations of nitrate, nitrite, ammonia, and several microbial indicators: aerobic bacteria, coliforms, faecal coliforms, faecal streptococci, and sulphite-reducing clostridia (per hygiene regulations from [64]). Manure was selected as a contaminant known to occur on the slopes of Suva Planina Mt., as the local population is actively engaged in livestock farming. Although in recent years the number of animals grazing on the meadows and pastures of Suva Planina Mt. has declined considerably, the presence of nearly 1000 head of large livestock (cattle and horses) and several hundred small ruminants (mainly sheep) remain significant.
The experiment was carried out at the Peč Cave, the same site used for the 2019 Na-fluorescein tracer test, due to prior data on groundwater velocities and accessible percolation points. The contaminant (Table 1) was a mix of manure slurry (SP K), groundwater from a well near a livestock shed (SP D), and Bežište spring water (SP B).
During the experiment with contaminants similar winter conditions prevailed (6 to 13 March 2020) and a similar pattern of water dripping from a cave ceiling was observed. Air temperatures were higher than during the 2019 test. Within 24 h (on the second day), 35–40 mm of rainfall occurred, followed by snowfall on the third day, which then rapidly melted. This consistent infiltration kept the epikarst under sustained vertical hydraulic pressure, resulting in continuous dripping from the cave ceiling, though with fluctuating volumes.
Maximum observed dripping rates (Table 2), determined through repeated measurements, ranged between 23.5–33.25 litters per hour (i.e., 0.0065–0.0092 L/s).
The contaminant injection site (CIS) matched the tracer injection point (CIS = TIS) from 2019 (Figure 2 and Figure 4). Sampling for microbiological and chemical analysis was conducted at three cave dripping points:
  • SP1—near the entrance (location C during tracer test);
  • SP2—mid-cave (location H during tracer test);
  • SP3—furthest from the entrance (location L during tracer test).
These sites reflected the main flow paths identified in the previous tracer study. Additional locations were not sampled due to technical constraints.
Chemical pollution was assessed by monitoring nitrate, nitrite, and ammonia, alongside physico-chemical parameters (conductivity, pH, Eh, TDS, etc.) using WTW field instruments. Microbiological analysis included: total/faecal coliforms (100 mL), aerobic mesophilic bacteria (1 mL at 37 °C), faecal streptococci, Proteus spp., sulphite-reducing clostridia, and Pseudomonas aeruginosa (100 mL each).
A zero sample was collected on 6 March at 4:00 p.m. at all three sites. Subsequent samples were taken twice on 7 March (6:00 a.m. and noon), before injecting the contaminant at 12:10 p.m. Sampling continued regularly through 13 March, 6:00 a.m.
Contaminant application involved three phases (Figure 5):
  • 10 L of manure-well water slurry—SP K;
  • 10 kg of solid manure (rinsed with well water);
  • Additional 20 L of contaminated well water to aid infiltration—SP D.
Microbiological samples were collected in sterile plastic bags, kept refrigerated, and delivered daily to the Centre for Hygiene and Human Ecology, IPH Niš. Sample containers were rinsed with distilled water between uses. Physico-chemical parameters were measured throughout.
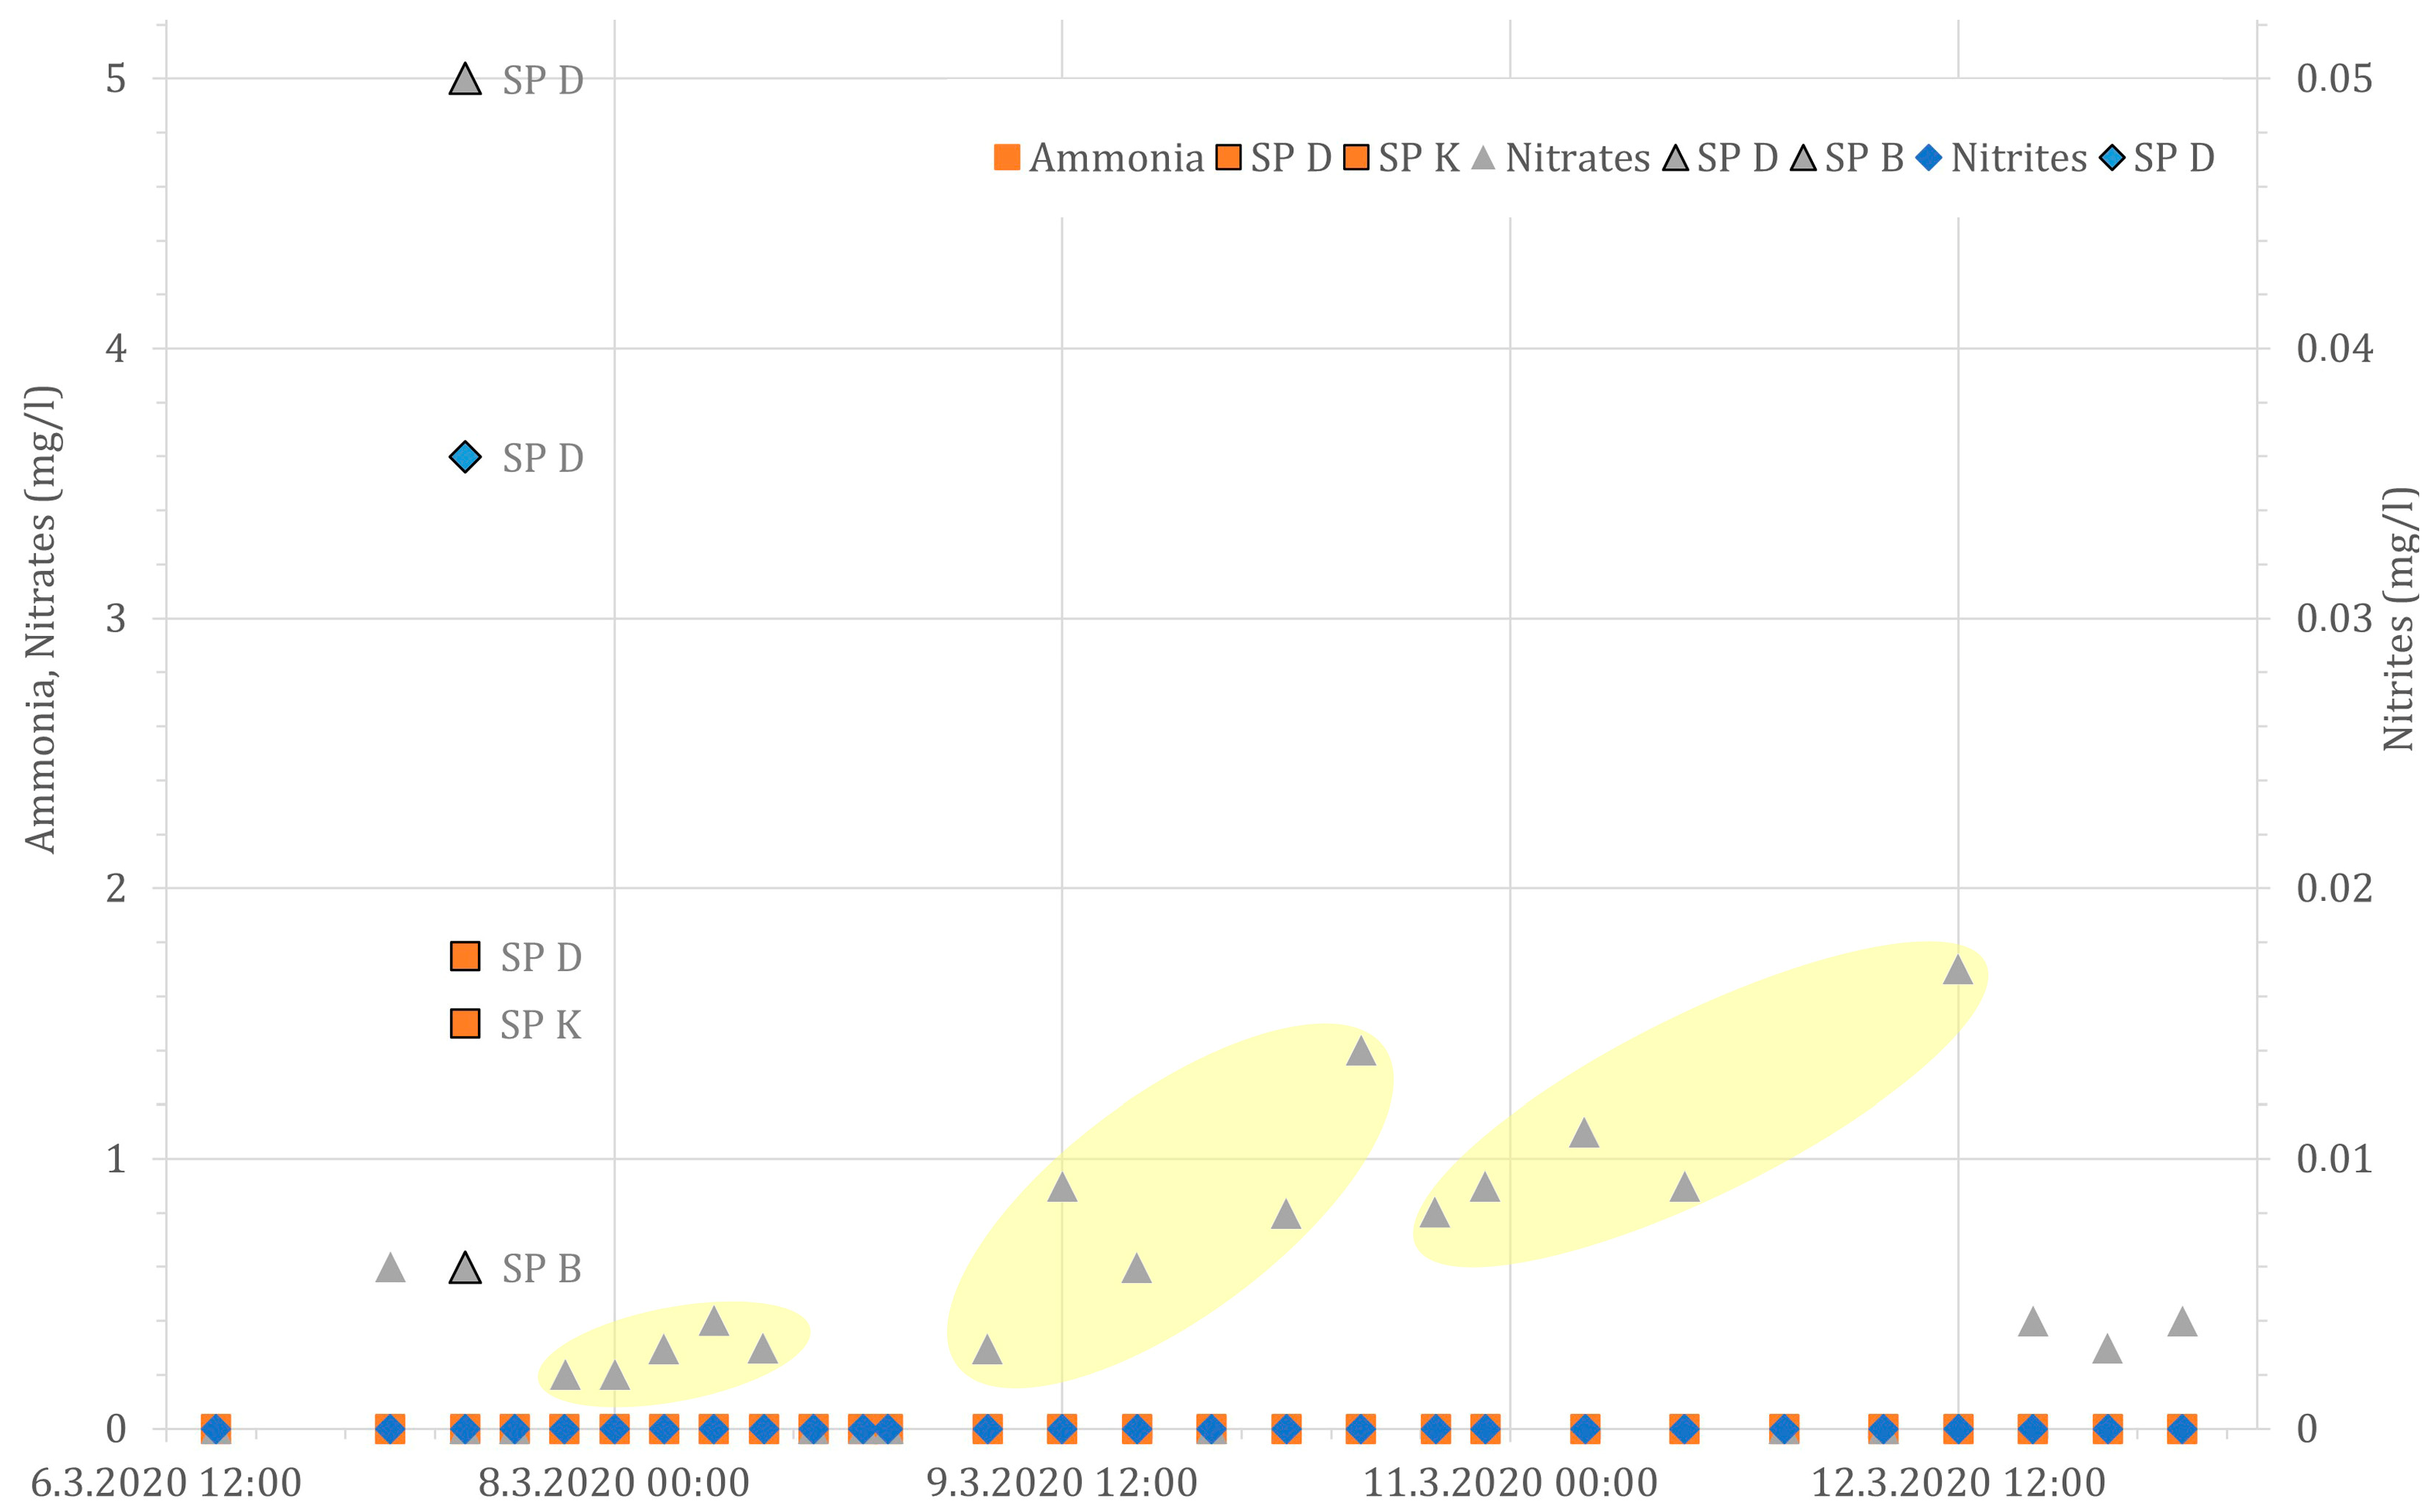
In the contaminant experiment, nitrate concentrations and bacterial counts in drip water also showed wave-like dynamics (Figure 6).
  • First wave due to initial snowmelt and rain,
  • Second due to rainfall intensification,
Third (and highest at 1.7 mg/L) due to earlier rainfall combined with snowmelt from later snowfall.
Nitrites were undetected in all 27 samples of percolated water, suggesting nitrification during passage through soil and epikarst (Figure 6 and Figure 7). Although ammonia was present in the contaminant at 3.25 mg/L, it never exceeded 0.05 mg/L in percolated water—again indicating effective nitrification. Nitrates were absent in 9 of 28 samples (NO3 < 0.17 mg/L), while others ranged from 0.2–1.7 mg/L, showing three distinct peaks that corresponded to precipitation events. The maximum value (1.7 mg/L) on last day.
Nitrate concentrations in percolated water were significantly lower than in the contaminant (5.6 mg/L), with over a threefold reduction, while ammonia and nitrite were entirely removed during infiltration (Figure 7).
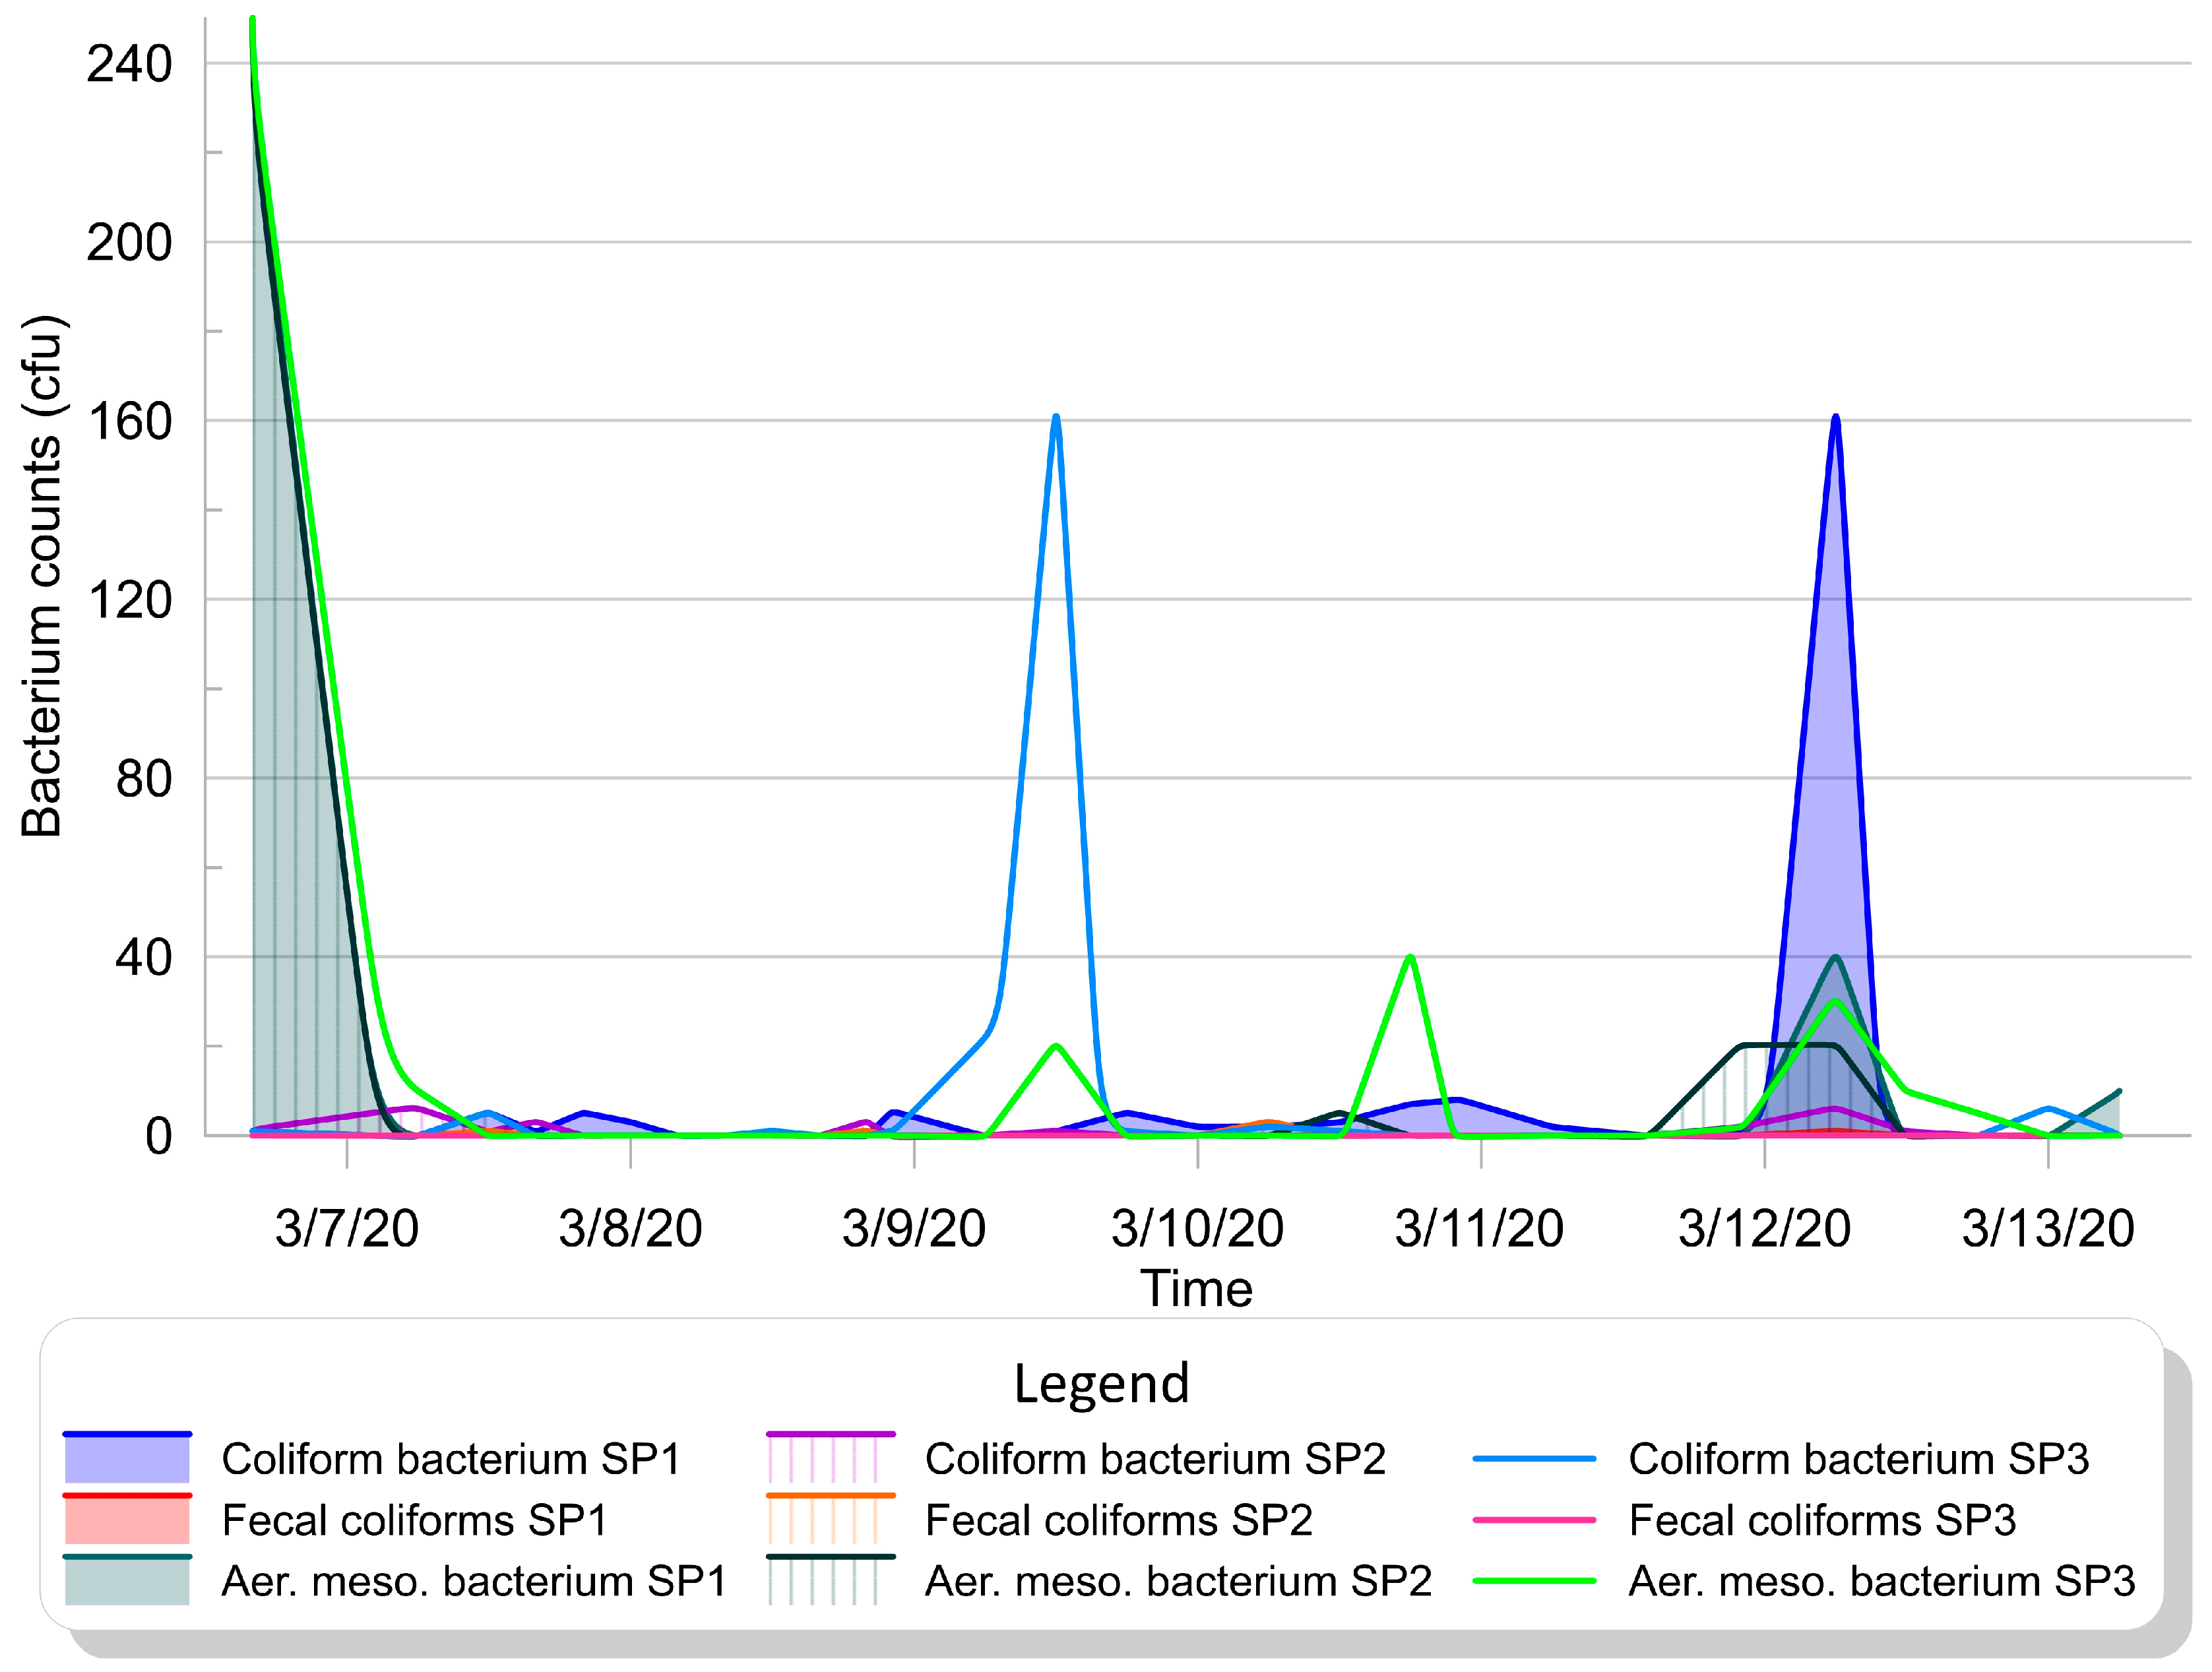
Coliform bacterium counts peaked as shown in Figure 8.
  • SP1 and SP3, at different times. At SP1 (farthest from the contamination site), bacteria appeared only after prolonged rainfall and snowmelt, indicating delayed transport due to system saturation and flushing.
  • SP2 had a smaller peak (6 cfu), with three bacterial waves (1 < 3 < 4 cfu), corresponding to water pulses.
  • SP3 (closest to the contamination point) showed the fastest bacterial response, followed by lower but persistent bacterial presence even in later samples.
Faecal coliform bacteria were not detected at site SP3 in any sample (Figure 7). At site SP1, they were present in only one sample, collected on 12 March at 6 a.m., which also had the highest total coliform count—after significant water infiltration. At site SP2, faecal coliforms were found in three samples: one prior to the introduction of the “light” contaminant (7 March, 12 p.m.), one on 8 March at 8 p.m. (1 cfu), and the highest concentration (3 cfu) on 10 March at 6 a.m.
Aerobic mesophilic bacteria, observed at all three sites, showed a similar three-wave pattern, indicating their use as a potential indicator of water movement. The highest counts were at SP3 (second wave), and later waves peaked at SP1 and SP2.
Total coliform levels in the contaminant were high (>161 cfu/100 mL) but largely absent in cave samples (Figure 9). SP1 showed coliforms in 12 of 28 samples; SP2 and SP3 in 18 of 28. Maximum counts of 161 cfu were recorded once at SP1 and SP3 each, SP2 peaked at only 6 cfu. The SP3 peak likely followed intense rainfall (7–8 March), enhancing preferential flow. SP1’s peak on 12 March likely resulted from conduit saturation during snowmelt and sustained rain. SP2 coliforms appeared only after five negative samples, linked to the 11–12 March intensified infiltration.
Faecal coliforms were also high in the contaminant but largely absent in cave samples: none at SP3, only one at SP1 (12 March), and three (3) at SP2 (including one pre-contamination sample and two post-infiltration samples at low concentrations).
Aerobic mesophilic bacteria were detected in the water from well (300 cfu/mL) but not in the slurry. Prior to contamination, low counts were already present at cave sites, suggesting presence of a natural microbial life. Post-contamination, they reappeared at SP3 on 9 March (20 cfu), with subsequent detections at SP2 and SP3. From 11–12 March, all three sites showed counts between 2–40 cfu. SP3 had the longest detection span (four consecutive samples).
Faecal streptococci were detected in the contaminant but not in the cave samples, except once at SP2 before the experiment started—indicating it was unrelated to contamination. Sulphite-reducing clostridia were found only in the well water (15 cfu) but not in cave samples. Proteus spp. and P. aeruginosa were absent from both contaminant and percolated samples.
Microbiological markers proved useful for tracking contaminant transport, but the Most Probable Number (MPN) method lacked precision for high concentrations. It capped reported values at 161 cfu/100 mL for coliforms and 300 cfu/mL for aerobic bacteria, limiting the resolution of peak concentration estimates.
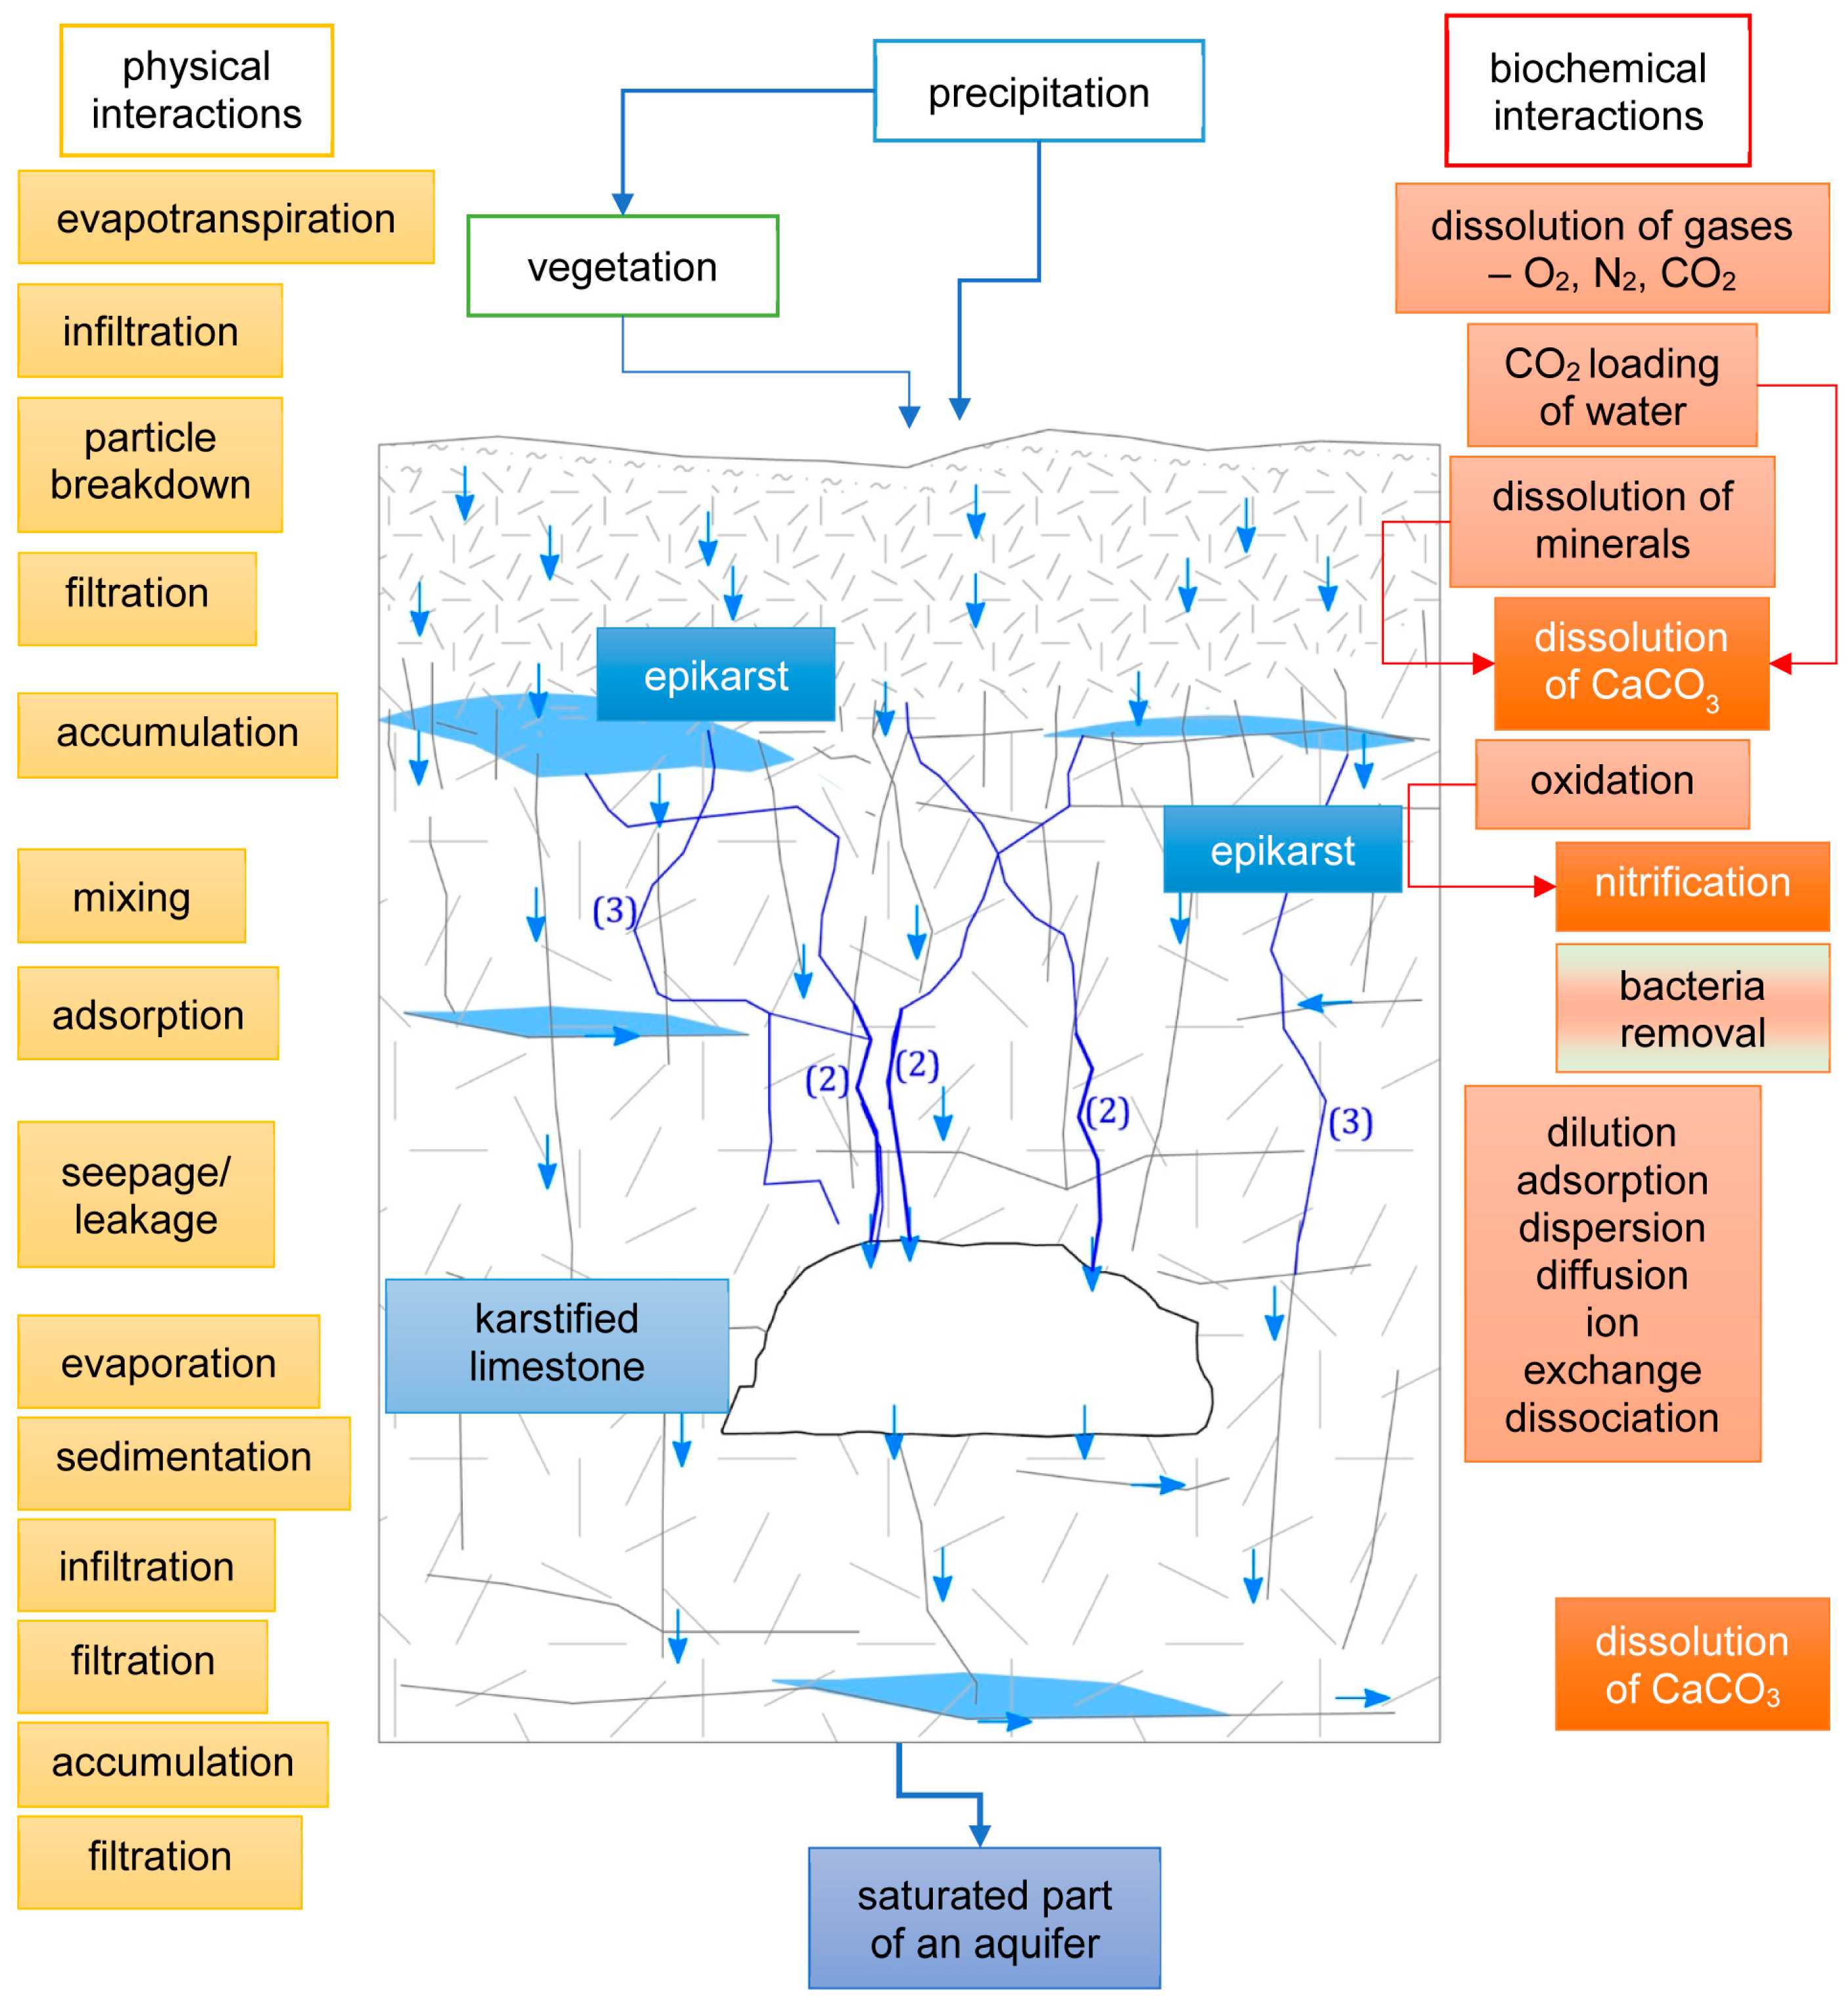
The contaminant tracer experiment conducted at the Peč Cave site confirms that the epikarst plays a significant role in the self-purification of infiltrated groundwater (Figure 10). For clarity, different lines, arrows, and colours are used in the diagram—orange corresponds to physical processes, red to biochemical interactions, and blue to water pathways and accumulation within the natural karst system. This purification depends on epikarst thickness, vegetation cover, and biological activity in the subsurface zone. Water is naturally filtered between the point of infiltration and discharge (dripping points in the cave), as confirmed by contaminant movement (Figure 6, Figure 7, Figure 8 and Figure 9).
The experiment demonstrated that physical, chemical, and microbial processes in the epikarst and overlying soil can reduce organic pollutants to harmless compounds or bring their concentrations below permissible levels for drinking water.
Regarding nitrogen compounds (NH3, NO2, NO3), results showed
  • Ammonia (initially 1.5–1.75 mg/L) was never detected above 0.05 mg/L in seepage water, likely due to rapid oxidation upon contact with oxygen-rich soil.
  • Nitrites were undetectable in both seepage water and manure mixture samples, likely oxidized to nitrates in the soil and epikarst.
  • Nitrate concentrations rose in waves, reaching a maximum of 1.7 mg/L—still well below hazardous levels—following snowmelt and rainfall (Figure 6).
Microbiological results showed
  • Total coliform bacteria (initially >161 cfu) were not detected in most water samples from all three locations (SP1, SP2, SP3), except in 1–2 peak events at SP1 and SP3.
  • Faecal coliforms were drastically reduced. For example, SP2 showed only 3 cfu at peak; none were detected at SP3.
  • Faecal streptococci were absent in all seepage samples.
  • Aerobic mesophilic bacteria, although present, dropped by over 75%, and were found mostly during heavy infiltration events.
  • Sulphite-reducing clostridia were entirely removed.
Different precipitation intensities exert varying influences on the transport of specific contaminants, as demonstrated in the results (Figure 10). This is particularly important because the epikarst responds differently to continuous precipitation compared to short, high-intensity events (piston effect), and the effects also vary depending on the type of pollutant considered.
The proposed interactions are not linear but spatially distributed, and their characteristics vary depending on assumptions about flow velocity within the medium, as well as the degree of karstification in the epikarst zone.
The selected contaminant—manure—is relevant to the Suva Planina area due to local livestock activities. Despite the number of cattle and sheep, organic nitrogen contaminants were not detected in groundwater, indicating efficient nitrification. Overall bacterial levels significantly decreased or disappeared in most cases. While the Na-fluorescein experiment indicated the existence of different flows within the epikarst, the contamination test further illuminates the effectiveness of those flows in removing microbial contaminants.

4.3. The Laboratory Experiment

Field data from the tracer test and light contaminant experiment were used to design and construct a physical epikarst model for laboratory simulations. This data informed the definition of several key model parameters:
(a) Stratigraphic Layer Thickness (Soil, Epikarst, Karstified Limestone)
Field investigations above Peč Cave defined the vertical profile:
  • Overburden thickness: 4–12 m.
  • Layer composition:
    • Karstified limestone: 3–9 m (75–82% of overburden).
    • Epikarst: 0.5–3 m (14–25%).
    • Soil: up to 0.3 m (≤4%).
Average values used in modelling:
  • Karstified limestone: 6 m.
  • Epikarst: 1.8 m.
  • Soil: 0.2 m.
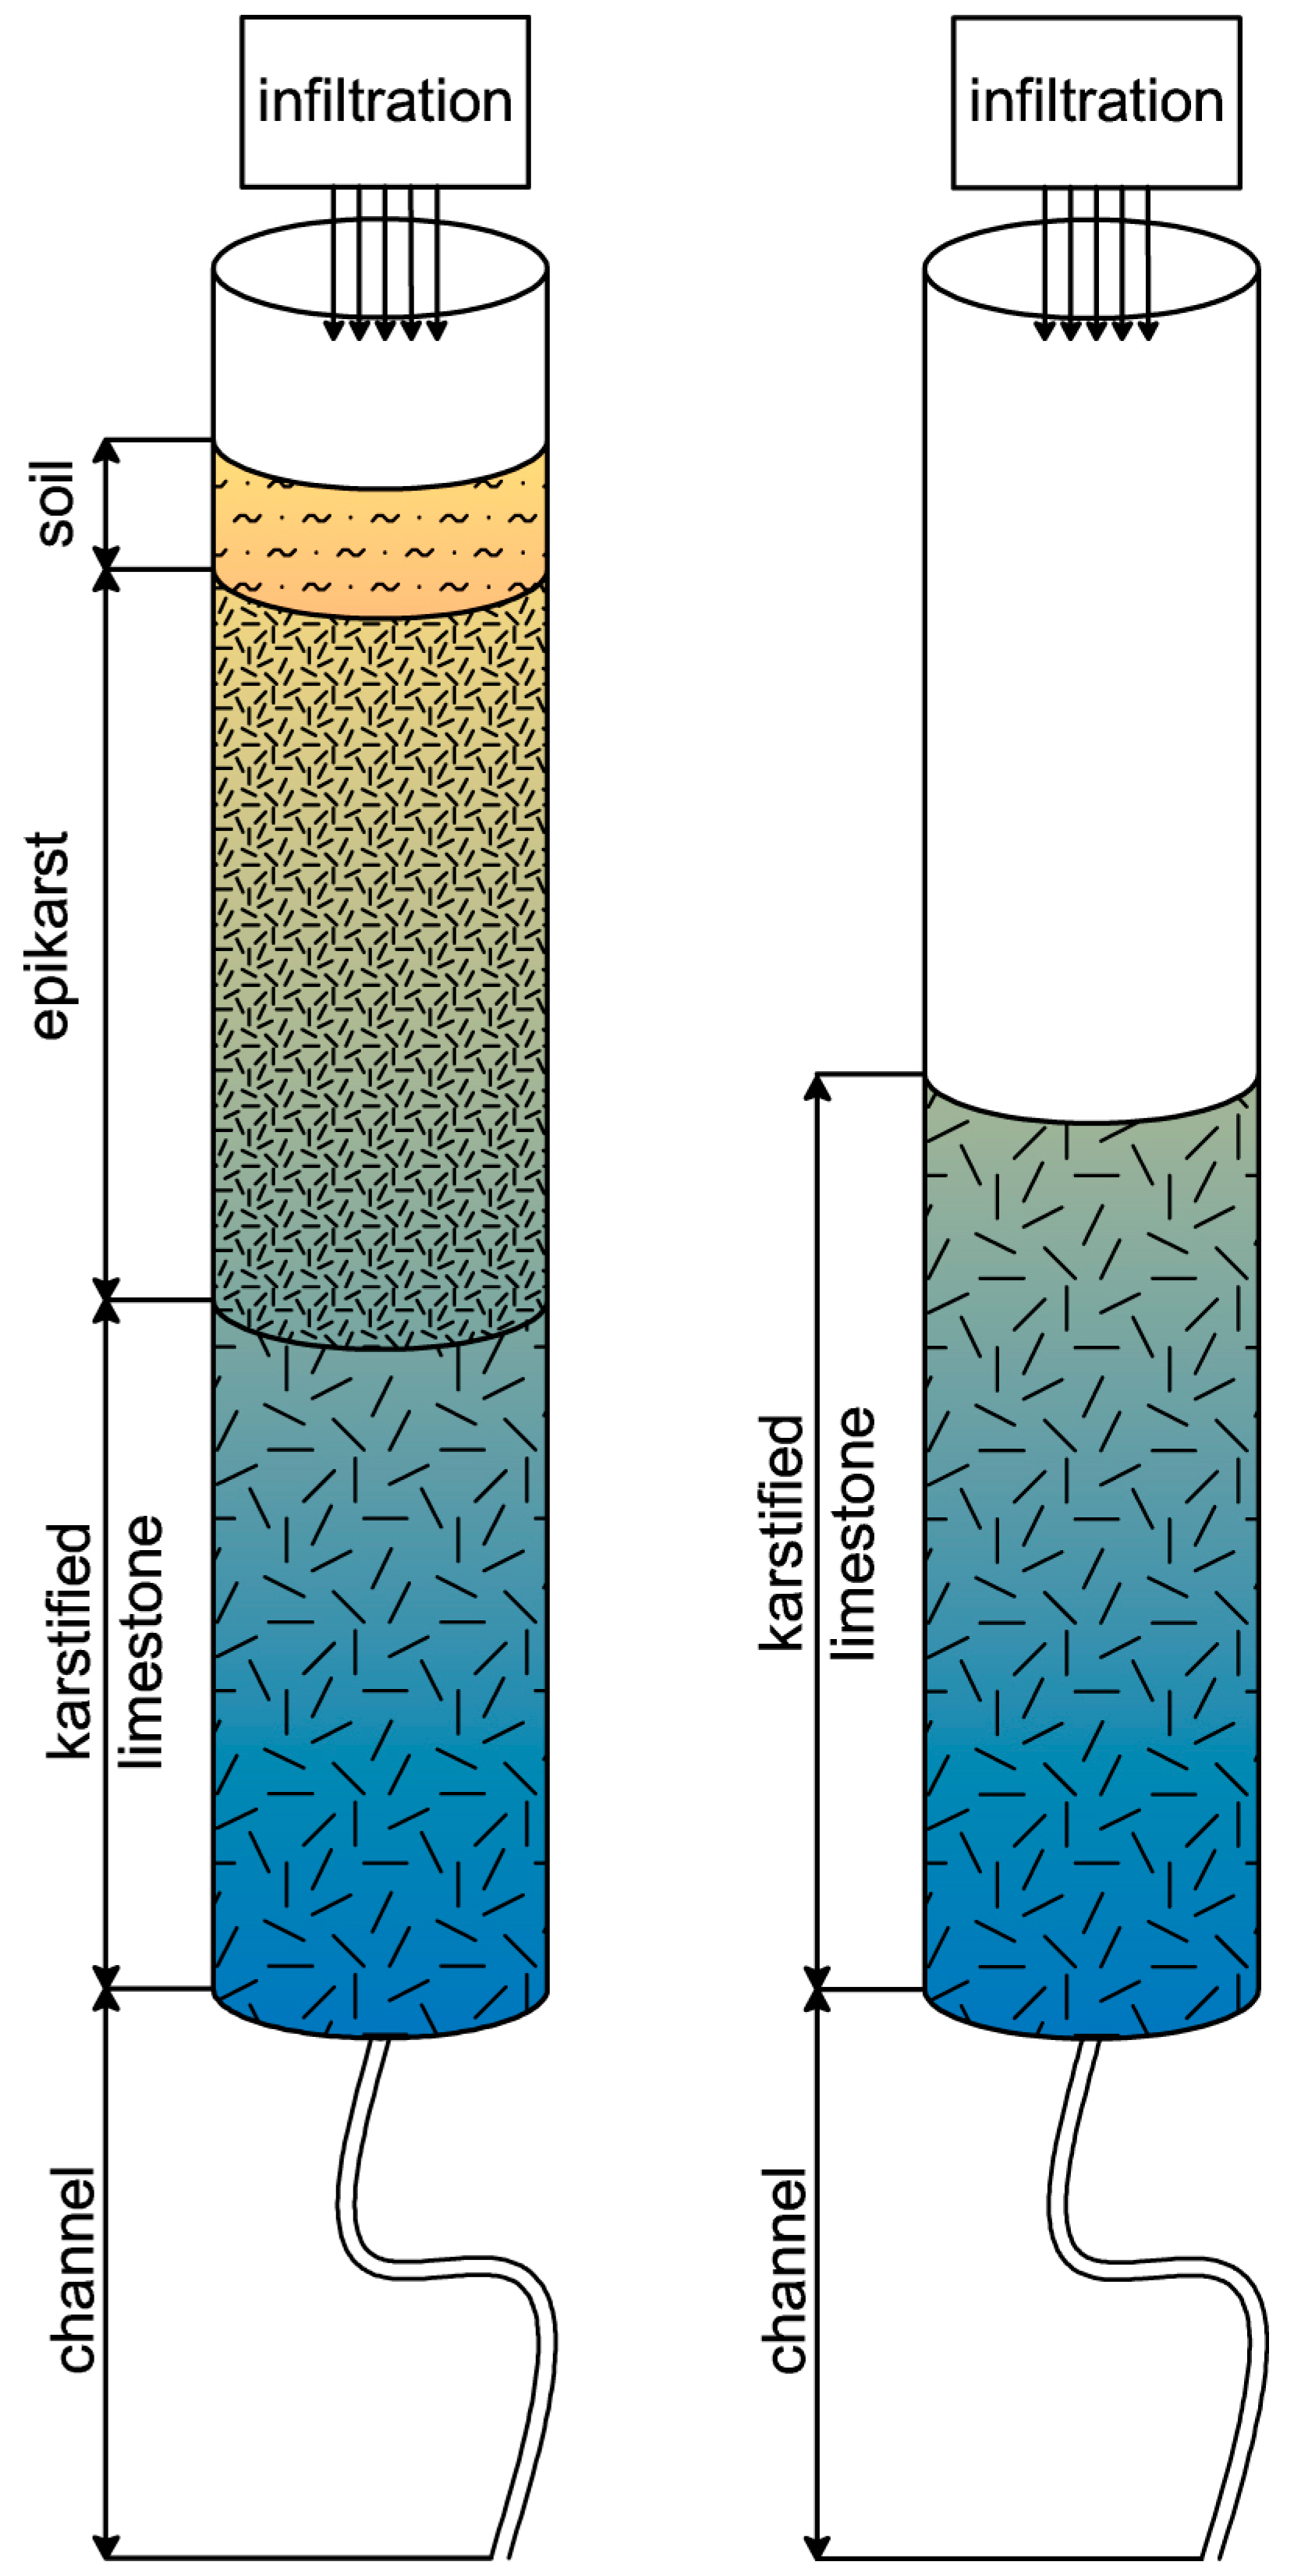
For laboratory feasibility, thicknesses were scaled down by a factor of 2.5 to fit into 2-m-long columns (Figure 11).
(b) Surface Area and Volume of the Experimental Zone
While direct measurement was difficult, geomorphological and speleological data estimated the main cave passage surface at 135 m2. With an average overburden of 8 m, the infiltration zone volume was approximated at 1080 m3.
(c) Tracer and Contaminant Migration Velocities
  • Water (tracer test): 0.0041–0.006 m/s.
  • Nitrate-based (contaminant test): 0.00011–0.0003 m/s.
  • Bacteriological transport: 0.00005–0.00008 m/s (slower due to adsorption and larger particle size).
(d) Contaminant Concentration and Volume (Inlet and Outlet)
Introduced: 10 L of contaminant (SP K), 20 L of groundwater (SP D), and 10 kg of solid manure (Table 3).
(e) Water Percolation Through Epikarst and Karstified Rock
Tracer test:
  • Initial: ~25 L/h.
  • Final: ~6 L/h.
Contaminant test:
  • Initial: 15–20 L/h.
  • Peak: 35–40 L/h.
  • Average: 25–30 L/h.
(f) Physical Model Construction (Figure 11)
Two physical models were built:
  • Tube 1: Simulates natural conditions—soil over epikarst and karstified limestone (Figure 12 left).
  • Tube 2: Simulates direct contact between epikarst and bedrock, without a soil layer (Figure 12 right).
Two transparent acrylic (Plexiglas) tubes, each with an internal/external diameter of Ø194/200 mm and a length of 2 m, were used to simulate vertical water infiltration through karst media. The tubes were sealed at the bottom and equipped with 1.5-m-long flexible metal hoses fitted with faucets, enabling both water drainage and sample collection. Above each tube, containers of known volume were installed to supply water to the system, simulating natural recharge conditions.
Tube 1 represents a conceptual model where a karstified limestone layer is overlain by an epikarst zone and a surface soil layer:
  • The karst conduit and karstified limestone (2.4 m in total hydraulic length) were simulated using a 1.5-m metal shower hose with a faucet and fragmented limestone rock placed within the bottom portion of the tube (total thickness: 0.9 m).
  • The epikarst zone was modelled using a mixture of fractured limestone and coarse- to medium-grained soil material dominated by Terra Rossa (total thickness: 0.9 m).
  • A surface soil layer (top layer) was added, with a thickness of 0.15 m.
Tube 2 was designed to simulate a system composed solely of epikarst and karstified limestone, without an overlying soil layer:
  • The karst conduit and karstified limestone were simulated similarly, using a 1.5-m metal hose and embedded limestone rock fragments.
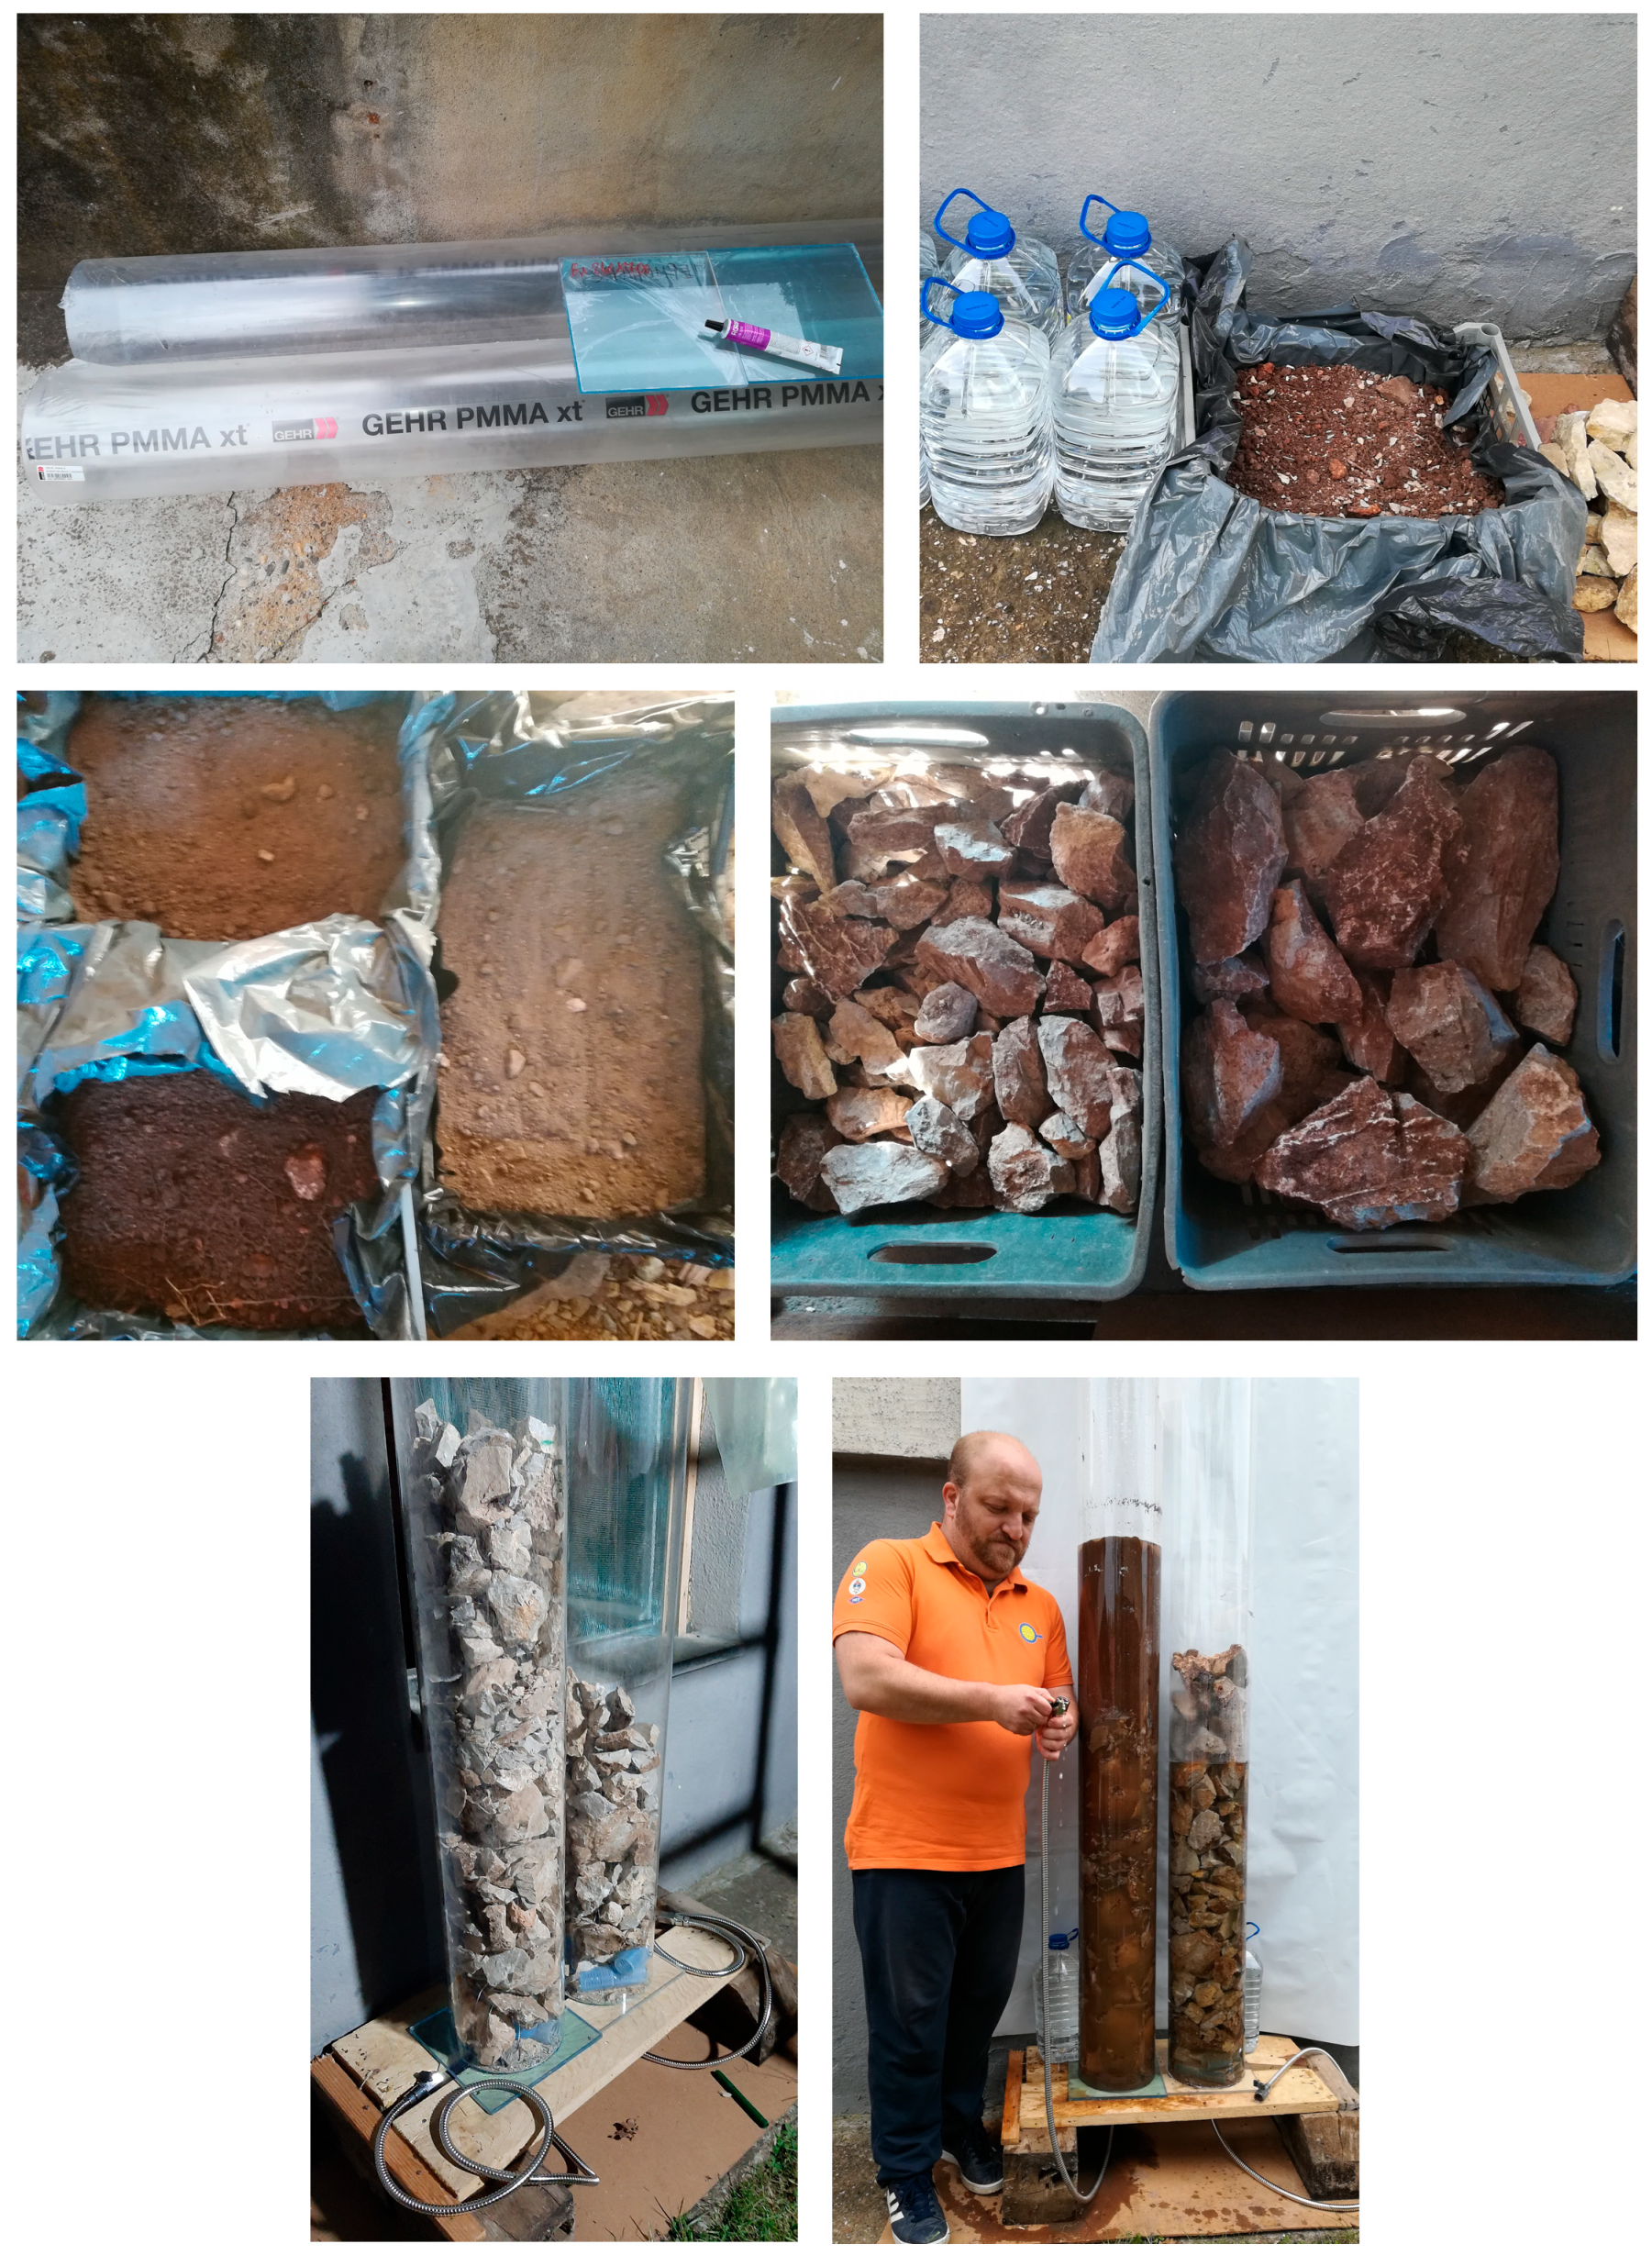
After preparing both tubes with geological and soil material collected from the Peč Cave site, the models were assembled by sequentially filling them from top to bottom according to the defined stratigraphy (Figure 13).
Once solid materials (rock and soil) were placed in TUBE 1, 15 L of distilled water was added to saturate the system and initiate filtration. To compensate for water loss during drip system adjustment, an additional 5 L of rainwater was introduced. This resulted in an epikarst porosity of 23%. In TUBE 2, 18 L of rainwater was added, yielding a significantly higher porosity of 60%, indicating high permeability.
A controlled infiltration rate of 0.0006 L/s was established in both tubes using faucet valves (Figure 13), allowing water to percolate through the epikarst into the karst system.
After 150 min of monitoring infiltration in TUBE 2, karst spring water from Bežište was introduced via a perforated grid to simulate natural recharge and study dispersion between two solutions with different physicochemical properties.
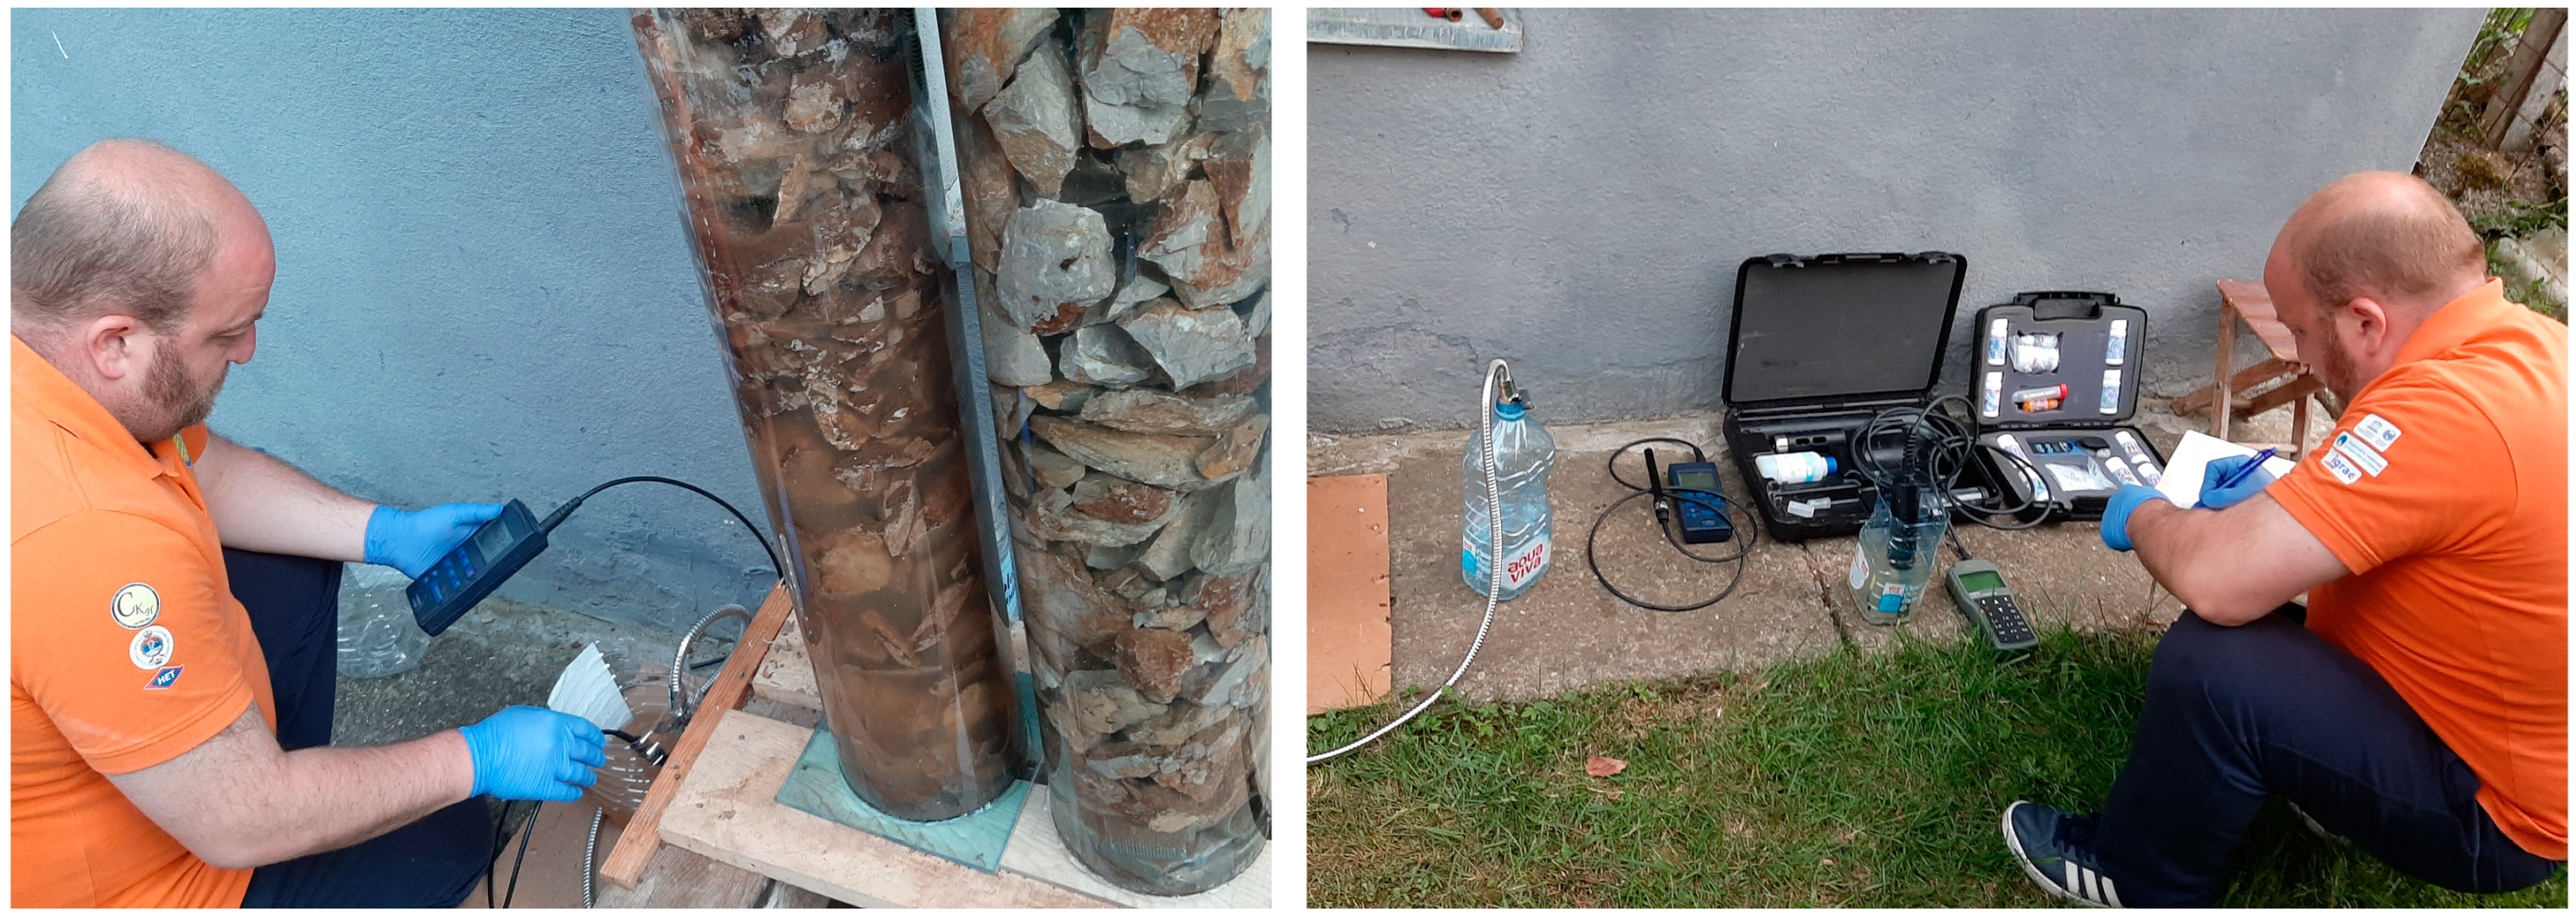
Electrical conductivity (Ec) of rainwater (initially 98–101 μS/cm) was monitored (Figure 14 left). Once 6 L of effluent had exited the system, an equal volume of Bežište spring water (Ec = 538–542 μS/cm) was added. Ec was recorded after every liter of outflow, and 6 L of spring water was reintroduced after each 6 L of outflow. After 450 min, equilibrium was reached with stable values of 399–400 μS/cm, which remained consistent over the next hour (Figure 11). Measurements taken over the following 12 h confirmed this stability.
Nitrate concentrations were also monitored using a field photometer (Figure 14 right). Initial nitrate in rainwater was 5.5 mg/L; Bežište water contained 2.1 mg/L. After 480 min, the final nitrate concentration in percolated water was 1.73 mg/L (Figure 15). Nitrate concentration decreased gradually, with minor fluctuations caused by adsorption/desorption dynamics between nitrate ions and soil particles [65,66].
These findings confirmed rapid mixing and the establishment of stable physicochemical equilibrium unless disturbed by external changes.
To simulate conditions similar to the field contaminant experiment, both tubes were kept water saturated. TUBE 1 contained distilled water gradually mixed with rainwater; TUBE 2 contained the pre-mixed rain–spring water solution.
A reduced infiltration rate of 0.0003 L/s—matching field conditions—was set. In the third hour, after stable infiltration was established, 1.5 L of synthetic nitrogen fertilizer solution (nitrate = 1160 mg/L, Ec = 3070 μS/cm) was introduced into each tube via a perforated “shower” grid over 30 min (Figure 12).
After application, Ec and nitrate concentrations in percolated water were measured every two hours until the systems were drained.
Both models responded similarly at first. One hour after contaminant addition, Ec rose to 423 μS/cm in TUBE 1 and 426 μS/cm in TUBE 2. The 10% increase in TUBE 1 before contaminant application was due to leaching from soil.
Three hours later, Ec increased by ~200 μS/cm in TUBE 1 and ~100 μS/cm in TUBE 2. The difference is attributed to TUBE 1’s 33% lower dilution capacity, due to reduced porosity and water volume. Thus, contaminant attenuation was less efficient, and more contaminant exited unaltered.
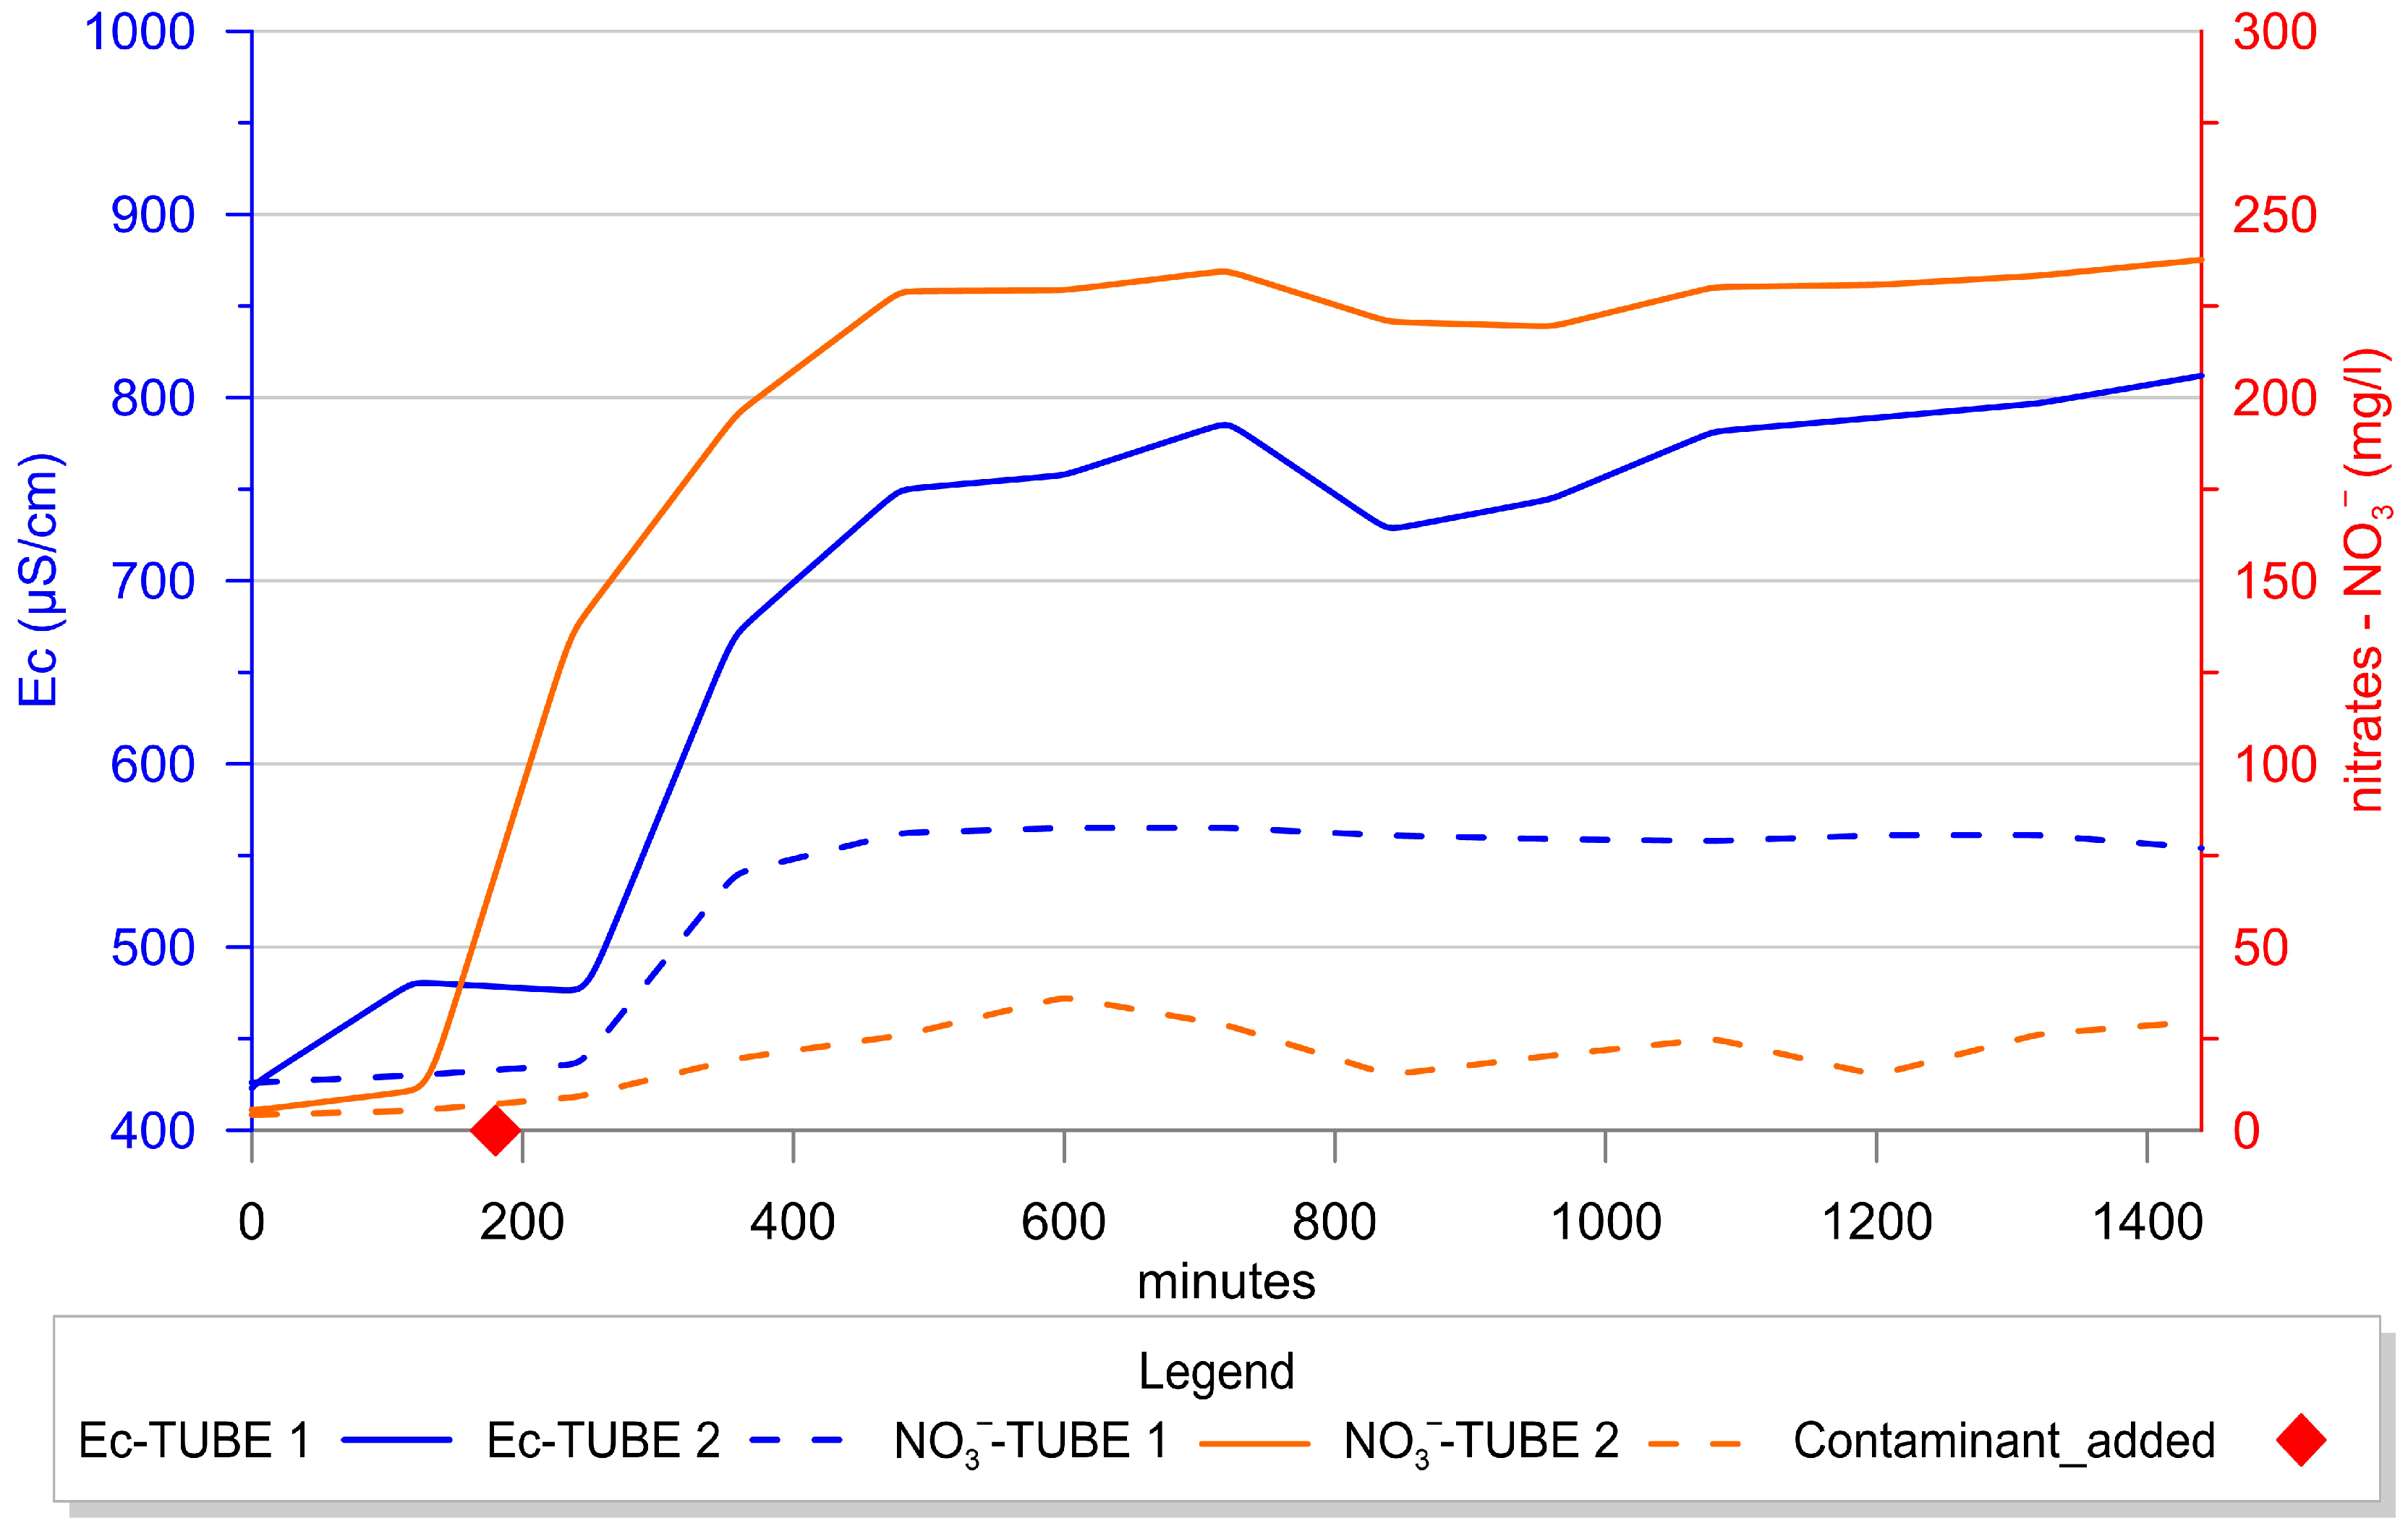
As observed previously, mixing was rapid, and equilibrium quickly reached (Figure 16). Final Ec values:
  • TUBE 1: ~790 μS/cm.
  • TUBE 2: ~560 μS/cm.
This represents a ~40% lower Ec in TUBE 2, with an average 30% difference between models.
Nitrate concentrations followed a similar trend. TUBE 1 showed concentrations 2.5 times higher than TUBE 2, again due to reduced dilution capacity. The first nitrate peak in TUBE 1 (234.3 mg/L) occurred five hours after application, rising slightly to 237.6 mg/L by hour 21. This closely followed the Ec trend. Theoretical equilibrium was nearly reached, with small deviations attributed to nitrate adsorption or remobilization from soil.
In TUBE 2, the first nitrate peak (85 mg/L) appeared at five hours, followed by a second (94.3 mg/L) and a gradual decline, consistent with falling Ec. Although theory predicted nitrate concentrations 30% higher, the discrepancy was likely due to nitrate retention by the limestone matrix.
The physical models effectively simulated epikarst percolation under field-like conditions. The infiltration rate of 0.0003 L/s matched field values. Significant nitrate attenuation occurred:
  • TUBE 1: ~5× reduction.
  • TUBE 2: >12× reduction.
Similarly, Ec dropped:
  • TUBE 1: ~4× reduction.
  • TUBE 2: ~5.5× reduction.
These findings highlight the role of porosity and dilution capacity in contaminant transport. The setup provides a robust platform for future laboratory simulations of diverse contaminant scenarios under controlled conditions.
The experiment confirmed that partial purification of the contaminant occurred within the epikarst model. Nitrate concentrations were reduced by approximately 30% in TUBE 1 and over 50% in TUBE 2 (Figure 17). The effectiveness of purification was influenced primarily by the available water volume, the composition of the substrate and processes that occurred in the model. The proposed interactions are not linear but spatial, and they can be distinguished based on different assumptions regarding flow velocity within the medium and, of course, the degree of karstification in the epikarst zone.
These results indicate that even under simplified laboratory conditions, the epikarst exhibits significant potential for the attenuation of nitrate-based pollutants. In natural systems, this potential would likely be enhanced by microbial activity and biogeochemical processes characteristic of the epikarst zone.
In natural settings, microbial and biochemical interactions, along with physical filtration, help break down or immobilize contaminants. The presence of native bacteria before the experiment suggests ongoing biological activity. Although coliforms persisted in some locations, faecal and aerobic bacteria showed significant reductions.

5. Conclusions

The selection of Peč Cave turned out to be a good polygon for monitoring of water infiltration through the vadose zone, ceiling flow, and seepage discharge. Na-fluorescein tracing revealed a well-connected fracture–conduit network, with tracer breakthrough within one hour and complete elimination in 21 h, faster than reported [7]. Virtual water velocities ranged from 14.76–21.6 m/h, with only 3.5% tracer recovery, implying substantial retention or dilution. Ceiling drip rates declined from ~25 to 6 L/h, influenced by conduit connectivity and injection–sampling distances.
A second field experiment, using an organic contaminant, with rapid snowmelt triggered a piston effect in the saturated epikarst, accelerating transport, in contrast to slower filtration reported [1,42]. The epikarst demonstrated good self-purification capacity [33,34,67,68]: nitrates and organic matter were attenuated by retention, microbial degradation, and dilution; faecal streptococci and sulphite-reducing clostridia were fully removed, while coliforms and aerobic mesophiles passed through with delay.
A laboratory epikarst model, simulating natural filtration, further confirmed partial nitrate removal. A nitrogen fertilizer solution (1160 mg/L NO3, EC ~3070 μS/cm) reached equilibrium rapidly; reduced dilution in TUBE 1 produced ~30% higher nitrate and EC than TUBE 2. Concentrations aligned with theoretical mixing, with minor deviations from nitrate adsorption and mobilization within the soil matrix. Nitrate reductions reached ~30% in TUBE 1 and >50% in TUBE 2.
Finally, it can be concluded that the epikarst zone on the eastern slopes of Suva Planina has high self-purification capacity. Contaminants were notably reduced both chemically and microbiologically. This filtering capacity improves groundwater quality before reaching major karst springs like Mokra and Divljana, both of which are used for public water supply and show excellent water quality. The epikarst functions as a “skin” of the karst aquifer—partially regenerable, but vulnerable to environmental changes—and plays a crucial role in the protection of karst groundwater systems.
The epikarst exerts strong control over flow regime, water balance, and quality at Bežište Spring, but plays a lesser role at Gornja Koritnica, Divljana, and Mokra springs, likely due to conduit connectivity and catchment configuration. Shared drainage between Mokra and Divljana reduces buffering capacity, masking the pulsating discharge typical of epikarst influence.
The findings of this study may contribute to improved planning in cases where karst areas are already urbanized or are being considered for potential urbanization or the construction of industrial facilities.
For more detailed future research, it is necessary to carry out epikarst mapping using UAV-based terrain surveying, in order to identify reference profiles in areas inaccessible to direct investigation and previously unsurveyed. Analysis of individual tracer could give an ambiguous interpretation, but employment of diverse tracers in the next phase of the research of the epikarst of Suva Planina Mt. can greatly increase reliability of experiments [37,42,43,44,45,58,59]. Tracer experiments should be conducted during the spring period (April–May), on several different newly detected objects. Laboratory models need refinement, particularly in tube design, to more accurately replicate natural conditions. Furthermore, analytical methods for bacterial quantification should advance beyond the Most Probable Number (MPN) technique, incorporating turbidimetric and molecular approaches to capture the total bacterial load, including inactive cells.

Author Contributions

Conceptualization, B.P., L.V. and S.M.; methodology, B.P. and S.M.; investigation, B.P.; data curation, B.P. and V.M.; writing—original draft preparation, B.P. and L.V.; writing—review and editing, L.V. and S.M.; visualization, B.P. and V.M.; supervision, S.M.; funding acquisition, B.P. and S.M. All authors have read and agreed to the published version of the manuscript.

Funding

This research was funded by the Ministry of Science, Technological Development and Innovation of Republic of Serbia, Contract no. 451-03-136/2025-03/200126.

Data Availability Statement

Data supporting reported results can be found: https://phaidrabg.bg.ac.rs/detail/o:23464 (accessed on 4th August 2025).

Acknowledgments

The authors would like to thank to the Hydroenergy system of Trebišnjica Laboratories, Trebinje, Bosnia & Herzegovina for Na-fluorescein analyses and Center for Hygiene and Human Ecology, IPH Niš, Serbia for microbiological analyses.

Conflicts of Interest

The authors declare no conflicts of interest. The funders had no role in the design of the study; in the collection, analyses, or interpretation of data; in the writing of the manuscript; or in the decision to publish the results.

Abbreviations

The following abbreviations are used in this manuscript:
UAVUnmanned Aerial Vehicle
TISTracer injection site
EcElectrical conductivity
CISContaminant injection site
TDSTotal dissolved solids
IPHInstitute for public health

References

  1. Klimchouk, A.B. The Formation of Epikarst and Its Role in Vadose Speleogenesis. In Speleogenesis: Evolution of Karst Aquifers; Klimchouk, A.B., Ford, D.C., Palmer, A.N., Dreybrodt, W., Eds.; National Speleological Society: Huntsville, AL, USA, 2000; pp. 261–273. [Google Scholar]
  2. Mangin, A. Sur la dynamiques des transferts en aquifere karstique. In Proceedings of the 6th International Congress of Speleology, Olomouc, Czech Republic, 31 August–18 September 1973; Volume 6, pp. 157–162. [Google Scholar]
  3. Mangin, A. Contribution a l’étude hydrodynamique des aquifères karstiques, 3eme partie, Constitution et functionnement des aquifères karstiques. Ann. Spéléol. 1975, 30, 21–124. [Google Scholar]
  4. Bakalowicz, M.; Blavoux, B.; Mangin, A. Apports du traçage isotopique naturel à la connaissance du fonctionnement d’un système karstique—Teneurs en oxygène 18 de trois systèmes des Pyrénées, France (Natural isotope tracing as an informer of karst system functioning. Oxygen-18 content of three karst systems in the Pyrenees, France). J. Hydrol. 1974, 23, 141–158. [Google Scholar]
  5. Bakalowicz, M.J.; Jusserand, C. Etude de l’infiltration en milieu karstique par les methodes geochemiques et isotopiques, Cas de la Grotte de Niaux (Ariege, France). Bull. Cent. d’Hydrogeol. Univ. Neuchatel 1987, 7, 265–283. [Google Scholar]
  6. Friederich, H.; Smart, P.L. Dye Tracer Studies of the Unsaturated-Zone Recharge of the Carboniferous Limestone Aquifer of the Mendip Hills, England. In Proceedings of the 8th International Congress of Speleology, Bowling Green, KY, USA, 18–24 July 1981; Volume 1, pp. 283–286. [Google Scholar]
  7. Bottrell, S.H.; Atkinson, T.C. Tracer Study and Storage in the Unsaturated Zone of a Karstic Limestone Aquifer. In Tracer Hydrology; Hotzl, H., Werner, A., Eds.; Balkema: Rotterdam, The Netherlands, 1992; pp. 207–211. [Google Scholar]
  8. Kogovšek, J. Pollution transport in the vadose zone. In Karst Waters and Environmental Impacts; Günay, G., Johnson, A.I., Eds.; Balkema: Rotterdam, The Netherlands, 1997; pp. 161–165. [Google Scholar]
  9. Kogovšek, J.; Šebela, S. Water Tracing through the Vadose Zone above Postojnska Jama, Slovenia. Environ. Geol. 2004, 45, 992–1001. [Google Scholar] [CrossRef]
  10. Kogovšek, J. Characteristics of Percolation Through the Karst Vadose Zone; ZRC Publishing: Ljubljana, Slovenia, 2010; 168p. [Google Scholar]
  11. Williams, P.W. The role of the subcutaneous zone in karst hydrology. J. Hydrol. 1983, 61, 45–67. [Google Scholar] [CrossRef]
  12. Williams, P.W. Subcutaneous hydrology and the development of doline and cockpit karst. Z. Geomorphol. 1985, 29, 463–482. [Google Scholar] [CrossRef]
  13. Ford, D.C.; Williams, P.W. Karst Hydrogeology and Geomorphology; Unwin Hyman: London, UK, 1989; 601p. [Google Scholar]
  14. Ford, D.C.; Williams, P.W. Karst Hydrogeology and Geomorphology; John Wiley & Sons Ltd.: Chichester, UK, 2007; 562p. [Google Scholar]
  15. Klimchouk, A.B. Conditions and peculiarities of karstification in the shallow subsurface zone of carbonaceous massifs. Caves Ga. 1987, 11, 54–65. (In Russian) [Google Scholar]
  16. Klimchouk, A.B. Karst Morphogenesis in the epikarstic zone. Cave Karst Sci. 1995, 21, 45–50. [Google Scholar]
  17. Klimchouk, A.B. Towards defining, delimiting and classifying epikarst: Its origin, processes and variants of geomorphic evolution, Speleogenesis and evolution of karst aquifers. Virtual Sci. J. 2004, 9, 23–35. [Google Scholar]
  18. Kiraly, L. Karstification and Groundwater Flow. In Speleogenesis and Evolution of Karst Aquifers; 2003; Volume 1, (Republished from Gabrovšek, F. (Ed.). 2002. Evolution of karst: From prekarst to cessation. Postojna-Ljubljana, Zalozba ZRC, 155-190). [Google Scholar]
  19. Bakalowicz, M. La zone d’infiltration des aquifères karstiques. Méthodes d’étude. Structure et fonctionnement (The infiltration zone of karst aquifers. Study methods. Structure and functioning). Hydrogéologie 1995, 4, 3–21. [Google Scholar]
  20. Huntoon, P.W. The Case for Upland Recharge Area Protection in the Rocky Mountain Karst of the Western United States. In Karst Waters and Environmental Impacts; Günay, G., Johnson, A.I., Eds.; Balkema: Rotterdam, The Netherlands, 1997; pp. 95–102. [Google Scholar]
  21. Bakalowicz, M. The epikarst, the skin of karst. In Epikarst, Proceedings of the Symposium, Shepherdstown, WV, USA, 1–4 October 2003; Jones, W.K., Culver, D.C., Herman, J.S., Eds.; Karst Waters Institute: Charles Town, WV, USA, 2003; pp. 16–22. [Google Scholar]
  22. Bakalowicz, M. Karst groundwater: A challenge for new resources. Hydrogeol. J. 2005, 13, 148–160. [Google Scholar] [CrossRef]
  23. Williams, P.W.; Fowler, A. Relationship between oxygen isotopes in rainfall, cave percolation waters and speleothem calcite at Waitomo, New Zealand. J. Hydrol. N. Z. Hydrol. Soc. 2002, 41, 53–70. [Google Scholar]
  24. Kirchner, J.W. A double paradox in catchment hydrology and geochemistry. Hydrol. Process 2003, 17, 871–874. [Google Scholar] [CrossRef]
  25. Trček, B. Epikarst Zone and Karst Aquifer Behaviour—A Case Study of the Hubelj Catchment, Slovenia; Geološki zavod Slovenije: Ljubljana, Slovenia, 2003; 100p. [Google Scholar]
  26. Trček, B.; Krothe, N. Oxygen isotope studies of major karst springs on the Mitchell plain (USA) and the Trnovski Gozd karst plateau (Slovenia). In Epikarst Karst Waters Institute Special Publication 9; Jones, W., Culver, D., Herman, J., Eds.; Karst Waters Institute: Charles Town, WV, USA, 2004; pp. 92–98. [Google Scholar]
  27. Fernandez-Cortes, A.; Calaforra, J.M.; Sánchez-Martos, F. Hydrogeochemical processes as environmental indicators in drip water: Study of the Cueva del Agua (Southern Spain). Int. J. Speleol. 2008, 37, 41–52. [Google Scholar] [CrossRef]
  28. Hunkeler, D.; Mudry, J. Hydrochemical methods. In Methods in Karst Hydrogeology; Goldscheider, N., Drew, D., Eds.; Taylor & Francis/Balkema: London, UK, 2007; Volume 26, pp. 93–122. [Google Scholar]
  29. Charlier, J.B.; Mudry, J.; Bertrand, C. Use of dissolved organic carbon to characterize infiltration in a small karst system in the French Jura mountains (Fertans, France). In Advances in Research in Karst Media; Andreo, B., Carrasco, F., Durán, J.J., LaMoreaux, J.W., Eds.; Environmental Earth Sciences Series; Springer: Berlin/Heidelberg, Germany, 2010; pp. 151–156. [Google Scholar]
  30. Batiot, C.; Emblanch, C.; Blavoux, B.; Simler, R.; Daniel, M. Organic matter in karstic aquifers: A potential tracer in the carbon cycle, A small-scale laboratory model approach. In Proceedings of the Tracers and Modelling in Hydrogeology (TraM’2000 Conference), Liege, Belgium, 23–26 May 2000; pp. 459–463. [Google Scholar]
  31. Simon, K.S.; Benfield, E.F. Ammonium retention and whole-stream metabolism in cave streams. Hydrobiologia 2002, 482, 31–39. [Google Scholar] [CrossRef]
  32. Simon, K.S.; Pipan, T.; Culver, D.C. A conceptual model of the flow and distribution of organic carbon in caves. J. Cave Karst Stud. 2007, 69, 279–284. [Google Scholar]
  33. Simon, K.S.; Pipan, T.; Ohno, T.; Culver, D.C. Spatial and temporal patterns in abundance and character of dissolved organic matter in two karst aquifers. Fundam. Appl. Limnol. 2010, 177, 81–92. [Google Scholar] [CrossRef]
  34. Pipan, T.; Culver, D.C. Forty years of epikarst: What biology have we learned? Int. J. Speleol. 2013, 42, 215–223. [Google Scholar] [CrossRef]
  35. Tooth, A.F.; Fairchild, I.J. Soil and karst aquifer hydrologic controls on the geochemical evolution of speleothem-forming drip waters, Crag Cave, southwest Ireland. J. Hydrol. 2003, 273, 51–68. [Google Scholar] [CrossRef]
  36. Williams, P.W. The role of the epikarst in karst and cave hydrogeology: A review. Int. J. Speleol. 2008, 37, 1–10. [Google Scholar] [CrossRef]
  37. Stevanović, Z. Characterization of Karst Aquifer. In Karst Aquifers—Characterization and Engineering; Stevanović, Z., Ed.; Professional Practice in Earth Sciences; Springer: Cham, Switzerland, 2015; pp. 47–125. [Google Scholar] [CrossRef]
  38. Krešić, N. Water in Karst; McGraw-Hill: New York, NY, USA, 2013; 736p. [Google Scholar]
  39. Krešić, N.; Mikszewski, A. Hydrogeological Conceptual Site Models: Data Analysis and Visualization; CRC/Taylor & Francis Group: Boca Raton, FL, USA, 2013; 600p. [Google Scholar]
  40. Šušterčič, F. Vertical Zonation of the Speleogenetic Space; Acta Carsologica: Ljubljana, Slovenia, 1999; pp. 187–201. [Google Scholar]
  41. Petrović, B.; Ignjatović, S.; Smiljković, Ž.; Marinović, V.; Gajić, V. Epikarst of the Eastern part of Suva planina Mt.: A new perspective defined from an integrated survey. Geol. Croat. 2025, 78, 31–44. [Google Scholar] [CrossRef]
  42. Milanović, P. Hidrogeologija Karsta i Metode Istraživanja; Institut za korišćenje i zaštitu voda na kršu: Trebinje, Yugoslavia, 1979; 302p. [Google Scholar]
  43. Milanović, P. Karst Hydrogeology; Water Resources Publications: Littleton, CO, USA, 1981; 434p. [Google Scholar]
  44. Goldsheider, N.; Drew, D. (Eds.) Methods in Karst Hydrogeology, International Contribution to Hydrogeology, IAH; Taylor & Francis/Balkema: London, UK, 2007; Volume 26, 264p. [Google Scholar]
  45. Çallı, K.Ö.; Chiogna, G.; Bittner, D.; Sivelle, V.; Labat, D.; Richieri, B.; Çallı, S.S.; Hartmann, A. Karst Water Resources in a Changing World: Review of Solute Transport Modeling Approaches. Rev. Geophys. 2025, 63, e2023RG000811. [Google Scholar] [CrossRef]
  46. Pronk, M.; Goldscheider, N.; Zopfi, J.; Zwahlen, F. Percolation and particle transport in the unsaturated zone of a karst aquifer. Ground Water 2009, 47, 361–369. [Google Scholar] [CrossRef] [PubMed]
  47. Sinreich, M. Contaminant Attenuation in Karst Aquifers: A Paradigm Shift. In H2Karst Research in Limestone Hydrogeology; Mudry, J., Zwahlen, F., Bertrand, C., LaMoreaux, J., Eds.; Environmental Earth Sciences; Springer: Cham, Switzerland, 2014. [Google Scholar] [CrossRef]
  48. White, W.B. Contaminant Transport in Karst Aquifers: Systematics and Mechanisms. In Karst Groundwater Contamination and Public Health; White, W., Herman, J., Herman, E., Rutigliano, M., Eds.; Advances in Karst Science; Springer: Cham, Switzerland, 2018. [Google Scholar] [CrossRef]
  49. Petrović, B. The Flow Conditions in the Epikarst Zone of a Karst Aquifer. Case Study: Suva Planina Mt., East Serbia. Speleol. Iblea 2023, XVII, 123–129. [Google Scholar]
  50. Vujisić, T.; Navala, M.; Kalenić, M.; Hadži-Vuković, B.; Maslarević, L.; Marković, B.; Buković, J. Basic Geological Map of SFRY 1:100,000, Geology of the Bela Palanka Sheet; OGK SFR Jugoslavije, Sheet K 34–33; SGZ: Belgrade, Serbia, 1971; p. 69. (In Serbian) [Google Scholar]
  51. Stevanović, Z. Hidrogeologija Karsta Karpato-Balkanida Istočne Srbije i Mogućnosti Vodosnabdevanja; Univerzitet u Beogradu, Rudarsko-Geološki Fakultet: Beograd, Serbia, 1991; 245p, (In Serbian Abstract in English). [Google Scholar]
  52. Stevanović, Z. Karst groundwaters of Carpatho-Balkanides in Eastern Serbia. In Groundwtaers in Carbonate Rocks of the Carpatho-Balkan Mountain Range; Stevanović, Z., Filipović, B., Eds.; Carpathian-Balkan Geological Association: Belgrade, Serbia, 1994; pp. 203–237. [Google Scholar]
  53. Petrović, B. Intrinsic groundwater vulnerability assessment by multiparameter methods, a case study of Suva Planina Mountain (SE Serbia). Environ. Earth Sci. 2020, 79, 85. [Google Scholar] [CrossRef]
  54. Petrović, B.; Marinović, V.; Stevanović, Z. Characterization of the Eastern Suva Planina Mt. Karst Aquifer (SE Serbia) by Time Series Analysis and Stochastic Modelling. Environ. Earth Sci. 2023, 82, 222. [Google Scholar] [CrossRef]
  55. Petrović, B.; Marinović, V. Application of the Discrete Autoregressive–Cross-Regressive Moving Average Model for Predicting the Daily Discharge Values of Mokra and Divljana Springs. Rep. Serb. Geol. Soc. 2021, 2020, 1–15. (In Serbian) [Google Scholar]
  56. Silva, O.L.; Bezerra, F.H.R.; Maia, R.P.; Cazarin, C.L. Karst landforms revealed at various scales using LiDAR and UAV in semi-arid Brazil: Consideration on karstification processes and methodological constraints. Geomorphology 2017, 295, 611–630. [Google Scholar] [CrossRef]
  57. Xu, A.; Wang, F.; Li, L. Vegetation information extraction in karst area based on UAV remote sensing in visible light band. Optik 2023, 272, 170355. [Google Scholar] [CrossRef]
  58. Stroj, A.; Briški, M.; Oštrić, M. Study of Groundwater Flow Properties in a Karst System by Coupled Analysis of Diverse Environmental Tracers and Discharge Dynamics. Water 2020, 12, 2442. [Google Scholar] [CrossRef]
  59. Benischke, R. Review: Advances in the methodology and application of tracing in karst aquifers. Hydrogeol. J. 2021, 29, 67–88. [Google Scholar] [CrossRef]
  60. Zhao, Y.; Wang, X.; Yang, J.; Liu, C.; Wang, S. A Modified Slow Sand Filtration System of Epikarst Spring Water in Karst Mountainous Areas, China. J. Water Health 2021, 19, 229–241. [Google Scholar] [CrossRef] [PubMed]
  61. Nannoni, A.; Piccini, L. Mixed Recharge and Epikarst Role in a Complex Metamorphic Karst Aquifer: The Pollaccia System, Apuan Alps (Tuscany, Italy). Hydrology 2022, 9, 83. [Google Scholar] [CrossRef]
  62. Chang, Y.; Hartmann, A.; Liu, L.; Jiang, G.; Wu, J. Identifying more realistic model structures by electrical conductivity observations of the karst spring. Water Resour. Res. 2021, 57, e2020WR028587. [Google Scholar] [CrossRef]
  63. Richieri, B.; Bittner, D.; Hartmann, A.; Benettin, P.; van Breukelen, B.M.; Labat, D.; Chiogna, G. Using continuous electrical conductivity measurements to derive major solute concentrations in karst systems. Hydrol. Process. 2023, 37, e14929. [Google Scholar] [CrossRef]
  64. Official Gazette of SFRY No. 42/1998-4, 44/1999-19 and Official Gazette of Republic of Serbia No. 28/2019-114. Available online: https://pravno-informacioni-sistem.rs/eli/rep/sgrs/ministarstva/pravilnik/2019/28/3 (accessed on 5 September 2025).
  65. Filipović, V.; Lipanović, S. Hemija u Poljoprivredi; Sveučilišna Naklada Liber: Zagreb, Croatia, 1995. [Google Scholar]
  66. Brown, T.E.; LeMay, H.E.; Bursten, B.E.; Murphy, C.; Woodward, P.; Stoltzfus, M.E. Chemistry: The Central Science, 14th ed.; Pearson: Boston, MA, USA, 2018; 1240p. [Google Scholar]
  67. Brad, T.; Bizic, M.; Ionescu, D.; Chiriac, C.M.; Kenesz, M.; Roba, C.; Ionescu, A.; Fekete, A.; Mirea, I.C.; Moldovan, O.T. Potential for Natural Attenuation of Domestic and Agricultural Pollution in Karst Groundwater Environments. Water 2022, 14, 1597. [Google Scholar] [CrossRef]
  68. Trček, B. Epikarst Zone of a Karst Aquifer—Its Characteristics and Importance in Karst Hydrogeology. Geologija 2002, 45, 2. [Google Scholar] [CrossRef]
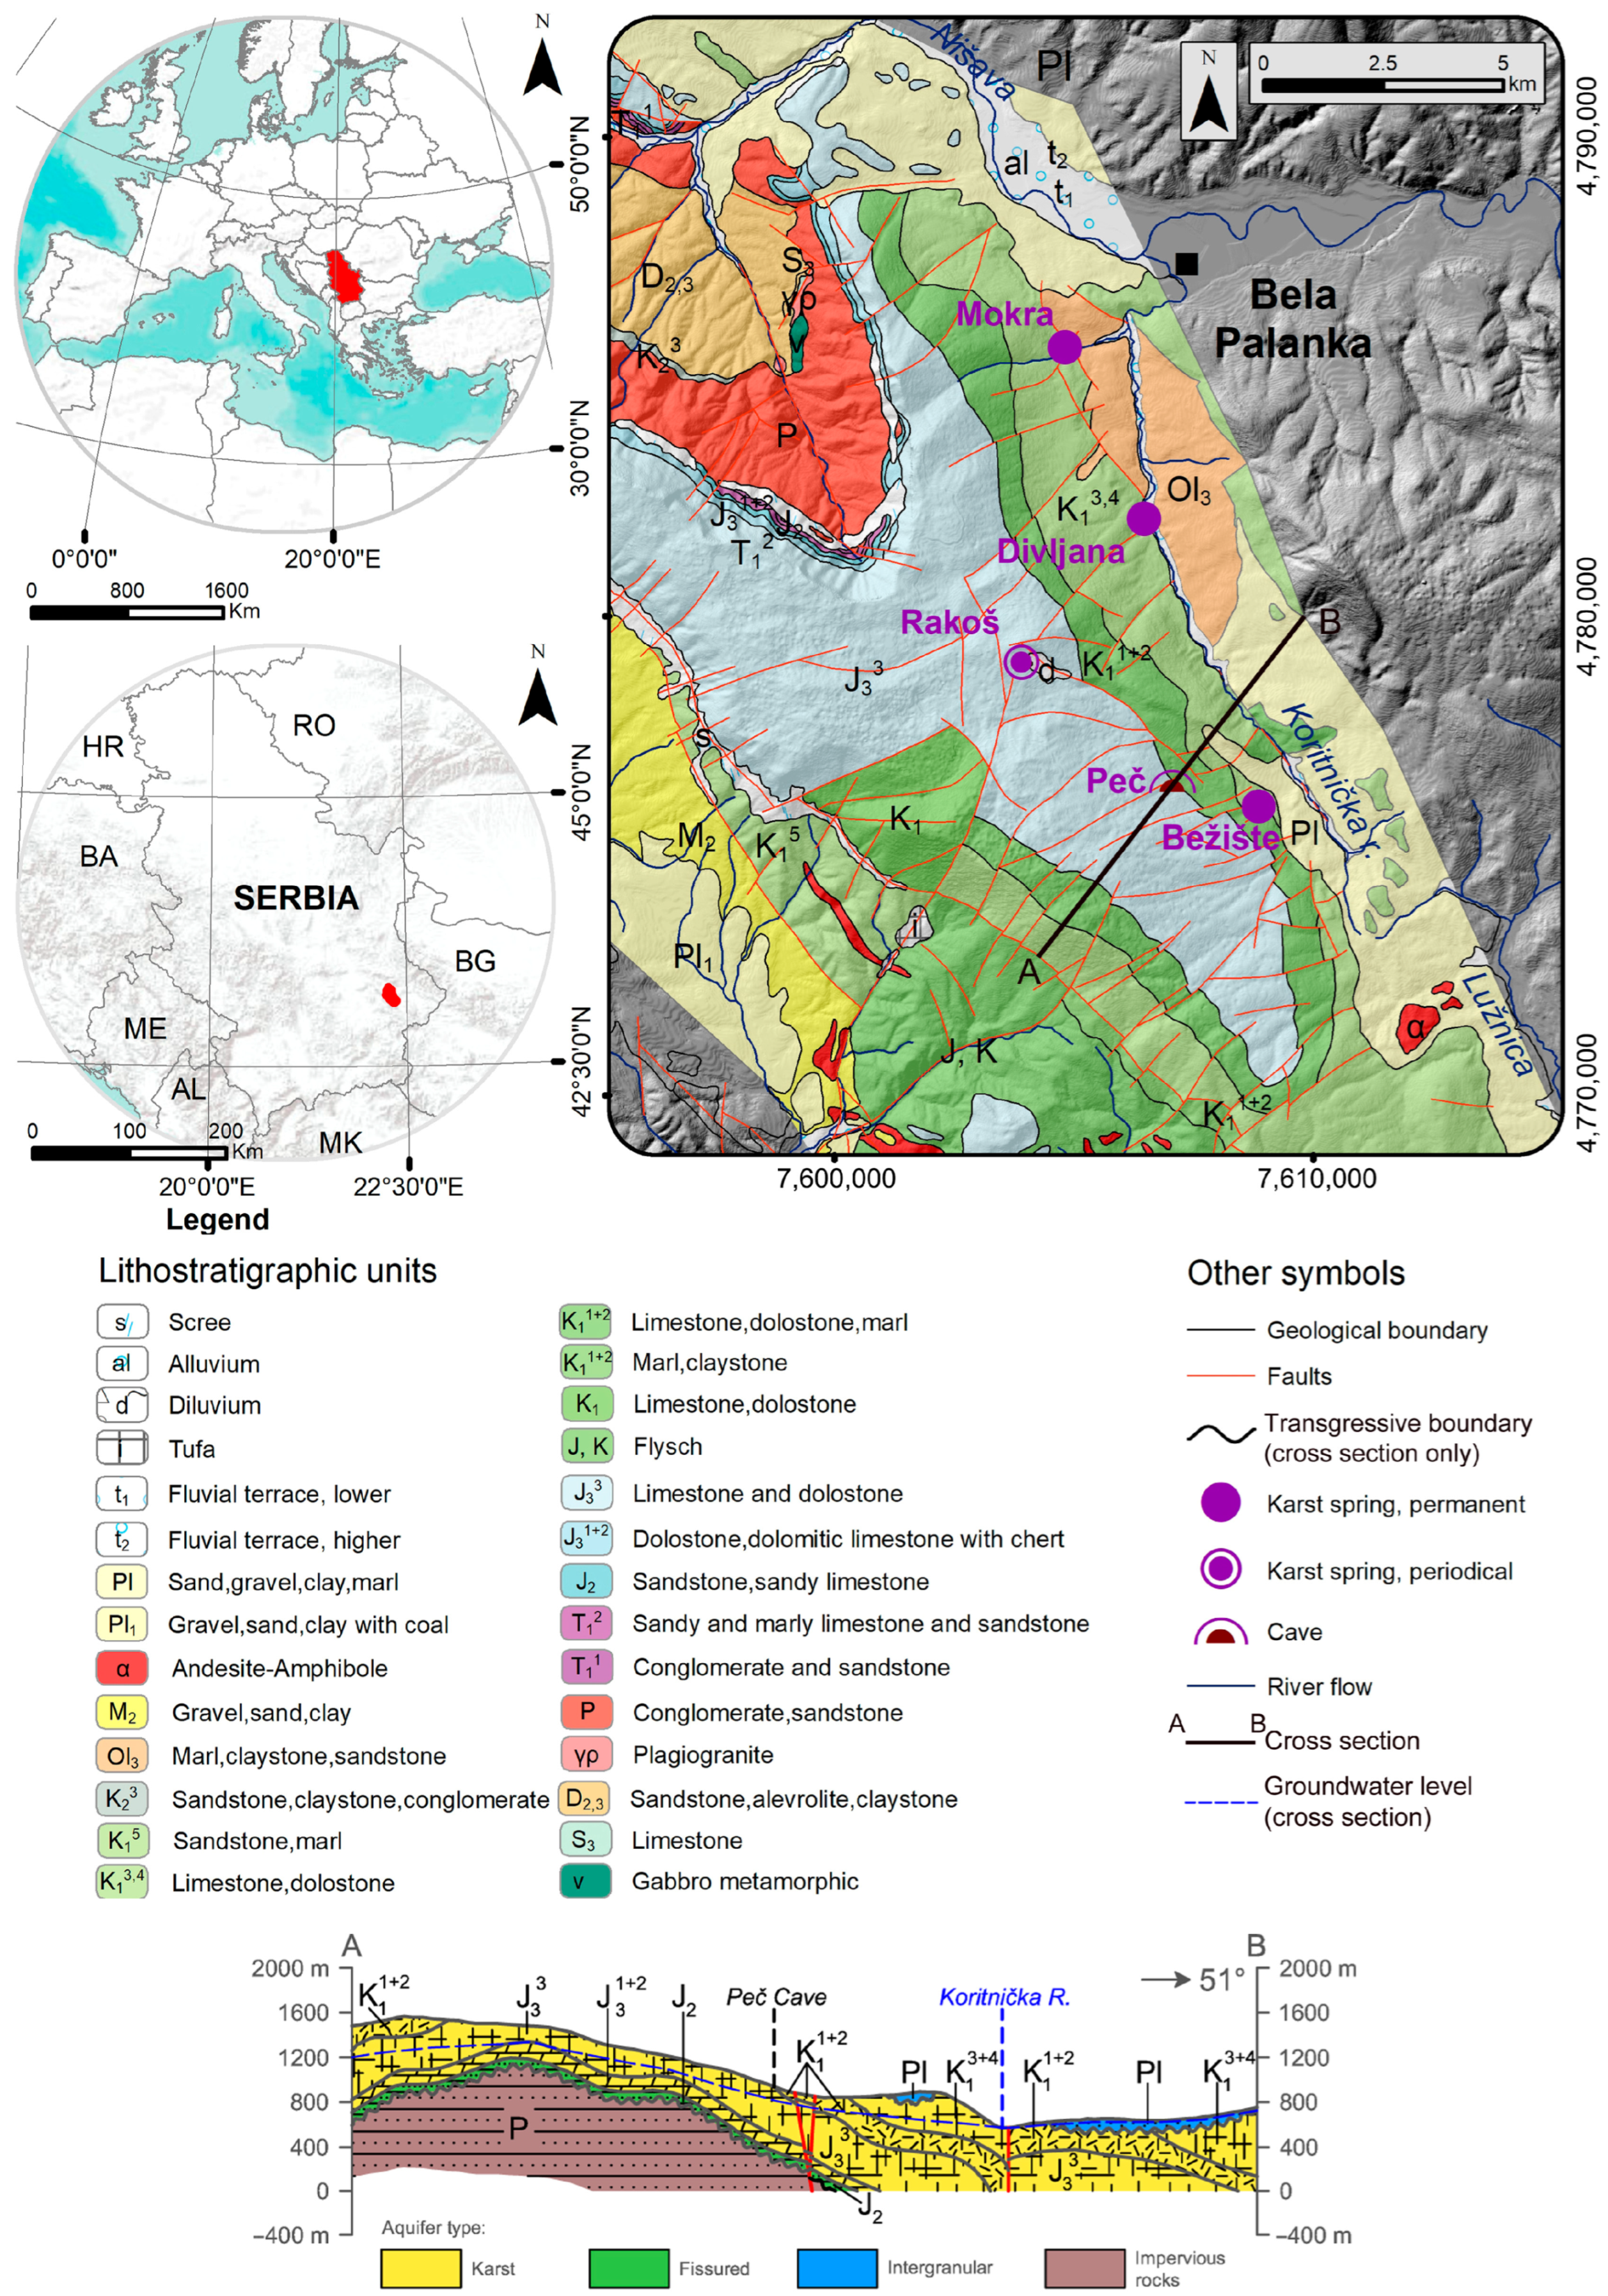
Figure 1. Position of the study area, geological settings and hydrogeological profile.
Hydrology 12 00276 g001
Figure 2. Peč cave, top-down and cross-section view with locations of tracer injection and drip points.
Hydrology 12 00276 g002
Figure 3. Breakthrough curve of the tracer by locations inside Peč cave.
Hydrology 12 00276 g003
Figure 4. Three fracture types revealed by tracer experiment: (1) large fractures—drains, (2) medium fractures, (3) small fractures/fissures and (?) assumed percolation.
Hydrology 12 00276 g004
Figure 5. Epikarst acts as a semi-permeable membrane. Retaining of the infiltrated water and solutes (left) and later releasing in one or more waves (right). Blue areas represent accumulated water; blue arrows indicate directions of percolating water and groundwater flow.
Hydrology 12 00276 g005
Figure 6. Ammonia, Nitrites and Nitrates concentrations during experiment. Nitrate levels peaked in three distinct waves (yellow ellipse).
Hydrology 12 00276 g006
Figure 7. Nitrate concentrations decline in percolated water: (1) large fractures—drains, (2) medium fractures, (3) small fractures/fissures and (?) assumed percolation.
Hydrology 12 00276 g007
Figure 8. Bacterial appearance at SP1, SP2, and SP3, respectively.
Hydrology 12 00276 g008
Figure 9. Microbiological “percolation” during experiment: (1) large fractures—drains, (2) medium fractures, (3) small fractures/fissures and (?) assumed percolation.
Hydrology 12 00276 g009
Figure 10. Model of the self-purification process of groundwater in the epikarst zone, Peč Cave location, (2) medium fractures and (3) small fractures/fissures.
Hydrology 12 00276 g010
Figure 11. Sketch of the laboratory physical model of epikarst made based on the Peč Cave. All markings and colour codes correspond to those used in Figure 4 and Figure 5.
Hydrology 12 00276 g011
Figure 12. Physical model of epikarst: TUBE 1 (left) and TUBE 2 (right).
Hydrology 12 00276 g012
Figure 13. Materials for creating an epikarst model and model construction.
Hydrology 12 00276 g013
Figure 14. Electrical conductivity (left) and Nitrate concentrations (right) monitoring.
Hydrology 12 00276 g014
Figure 15. The variation in specific electrical conductivity and nitrate concentration.
Hydrology 12 00276 g015
Figure 16. The variation in specific electrical conductivity and nitrate concentration in epikarst models TUBE 1 and TUBE 2.
Hydrology 12 00276 g016
Figure 17. Model of the self-purification process of groundwater in the model of epikarst. All markings and colour codes correspond to those used in Figure 10.
Hydrology 12 00276 g017
Table 1. Concentrations of harmful substances and bacteria in the low-intensity contaminant composed of SP K, SP D and SP B.
Low-Intensity ContaminantNH3 (mg/L)NO2 (mg/L)NO3 (mg/L)Total Coliforms in 100 mLFaecal Coliforms in 100 mLTotal Aerobic Mesophilic Bacteria at
37 °C/48 h, 1 mL
Faecal Streptococci in 100 mL MFProteus SpeciesSulphite-Reducing Clostridia in 100 mLPseudomonas Aeruginosa in 100 mL
SP K1.5<0.005<0.17>161>1610detected000
SP D1.750.0365161161>300detected0150
SP B<0.05<0.0050.6505detected000
Table 2. Cumulative flows through the cave system towards the karst aquifer, measured in Peč Cave.
PeriodCumulative Flow (L/h)
6–7 March 15–20
7–8 March 25–30
8–9 March 28–32
10 March 30–34
11–12 March 35–40
13 March 15–20
Table 3. Contaminant concentration in samples.
Ammonia
(mg/L)
Nitrite
(mg/L)
Nitrate
(mg/L)
Coliforms and Faecal Coliforms
(CFU/100 mL)
Faecal Streptococci
(Yes/No)
Aerobic Mesophilic Bacteria
(CFU/100 mL)
SP K (slurry)1.5//>161YES/
SP D
(groundwater)
1.750.0365161YES>300
Disclaimer/Publisher’s Note: The statements, opinions and data contained in all publications are solely those of the individual author(s) and contributor(s) and not of MDPI and/or the editor(s). MDPI and/or the editor(s) disclaim responsibility for any injury to people or property resulting from any ideas, methods, instructions or products referred to in the content.