Article

Assessing Impacts of Anthropogenic Modification on Surface Soil Moisture Dynamics: A Case Study over Southwest China

1
Faculty of Electric Power Engineering, Kunming University of Science and Technology, Kunming 650500, China
2
School of Geography, Faculty of Geographical Science, Beijing Normal University, Beijing 100875, China
*
Authors to whom correspondence should be addressed.
Hydrology 2025, 12(11), 275; https://doi.org/10.3390/hydrology12110275
Submission received: 25 September 2025 / Revised: 21 October 2025 / Accepted: 21 October 2025 / Published: 22 October 2025
(This article belongs to the Section Soil and Hydrology)

Abstract

Anthropogenic activities are profoundly altering the terrestrial water cycle, yet a comprehensive understanding of their impact on surface soil moisture (SSM) at regional scales remains limited. This study investigates the spatiotemporal dynamics of SSM and its relationship with anthropogenic modification (OAM) across Southwest China from 2000 to 2017. We employed multi-year geospatial and statistical analyses, including kernel density estimation and boxplots, to examine the impacts of human activities on regional soil moisture patterns. The results revealed that SSM exhibited a slight long-term declining trend (Sen’s slope = −0.0009 m3/m3/year) but showed a notable recovery after 2011, while overall anthropogenic modification (OAM) intensified until 2010 before declining sharply by 2015. A statistically significant and systematic relationship was observed, with increasing OAM intensity corresponding to higher median SSM and reduced spatial variability, indicating a homogenizing effect of human activities. Critically, the impacts of detailed anthropogenic stressors were highly divergent: agricultural modification correlated with elevated SSM, whereas transportation infrastructure and energy-related activities exhibited a suppressive effect. These findings highlight the necessity of integrating high-resolution SSM and anthropogenic data into land-use planning and implementing stressor-specific management strategies, such as improving irrigation efficiency and developing infrastructure designs that minimize SSM suppression, to achieve sustainable water resource management in rapidly developing regions.

1. Introduction

Surface soil moisture (SSM) is a key component of the terrestrial hydrological cycle, influencing water availability, vegetation growth and land–atmosphere interactions [1,2,3]. It plays a crucial role in both the ecological balance and the hydrological processes that support agriculture, forestry and water resources management [4,5,6]. However, human activities, such as urbanization, agriculture and infrastructure development, have significantly altered the natural distribution and dynamics of SSM, raising concerns about the long-term sustainability of water resources [7,8,9]. While there is growing interest in understanding these impacts, the comprehensive spatiotemporal patterns of SSM and the role of anthropogenic modifications at regional scales remain underexplored [10,11,12].
Anthropogenic modification has profound implications for SSM dynamics, particularly through activities that alter land cover, water use and surface permeability [13,14,15]. Modifications such as irrigation, urban expansion and industrial infrastructure can influence soil moisture through changes in evapotranspiration, runoff and infiltration [16,17,18]. These activities are associated with both local and broad-scale impacts on the hydrological cycle. In particular, areas with higher levels of anthropogenic modification tend to exhibit more uniform and elevated SSM levels, while regions with low or no anthropogenic modification often show greater spatial variability in moisture conditions [19,20,21]. Therefore, this interaction between human modification and soil moisture needs detailed investigation to inform sustainable land and water resource management.
Numerous studies have investigated the impact of anthropogenic modification on SSM through various approaches. First, many studies have focused on land-use change, particularly agricultural and urban modifications, investigating their effects on SSM patterns [16,19,21]. These studies often examine correlations between irrigation, deforestation, and urbanization with increased soil moisture in modified landscapes [22,23]. Moreover, research has explored the role of impervious surfaces, such as roads and buildings, which tend to reduce natural infiltration and alter local hydrological cycles [24,25,26,27]. Furthermore, a growing body of work has explored policy-driven changes, such as reforestation programs and land restoration efforts, which may help mitigate the negative effects of intensive anthropogenic modification [28,29,30]. However, despite these efforts, the complexities of how specific anthropogenic factors interact with soil moisture remain poorly understood. Disentangling these interactions is challenging due to the diversity of human activities and the necessity for a systematic framework that integrates and analyzes high-resolution datasets in a spatiotemporally explicit manner to quantitatively assess the effects of distinct anthropogenic stressors.
In recent years, significant advances in remote sensing technologies and open-access datasets have enabled more detailed and high-resolution studies of surface soil moisture and anthropogenic modification. Satellite-based soil moisture products, combined with geospatial datasets on land use and human activities, provide a wealth of information for investigating spatiotemporal dynamics at regional and global scales [10,31,32,33]. These technological advancements have made it feasible to track changes in both soil moisture and anthropogenic modifications over time, facilitating more accurate modeling and prediction of their interactions.
Capitalizing on these new data resources, the primary objective of this study is to investigate the spatiotemporal dynamics of SSM and its relationship with anthropogenic modification over Southwest China from 2000 to 2017. Specifically, the study aims to: (1) characterize the long-term trends and spatial distribution patterns of SSM; (2) analyze the temporal and spatial evolution of overall anthropogenic modification (OAM) based on bivariate statistical analyses; and (3) explore the relationship between SSM and OAM, with a specific objective to delineate the distinct and divergent impacts of key anthropogenic stressors (Agriculture, Built-up, Energy, Intrusion and Transportation) on regional SSM patterns. With all these, we seek to provide actionable insights to inform the development of targeted land and water management strategies.

2. Materials and Methodology

2.1. Study Area

The study area is located in Southwest China, a vast and geographically complex region spanning from 97° E to 112.5° E and 20.5° N to 34.5° N (Figure 1a). It includes the provinces of Sichuan, Yunnan and Guizhou, which together form the core of the mountainous hinterland; the municipality of Chongqing, a major urban and economic hub with direct provincial-level status; and the Guangxi Zhuang Autonomous Region, which contributes additional ethnic and cultural diversity while extending the geographic reach toward the south. The region has dramatic elevational gradients, extending from the eastern margin of the Tibetan Plateau in the northwest, which features high altitude mountains and deeply incised valleys, through the Yunnan–Guizhou Plateau and Sichuan Basin, to the hilly and low mountainous terrain in the southeast. This physiographic complexity is further enhanced by several major river systems, including the upper reaches of the Yangtze River (Jinsha Jiang), Pearl River (Zhu Jiang) and Lancang River (Mekong), which dissect the landscape and create diverse microclimates and hydrological regimes.
The climate system of Southwest China is predominantly influenced by the South Asian and East Asian monsoons, resulting in distinct seasonal patterns of precipitation with abundant rainfall concentrated in the summer months [34,35,36]. Spatial variability in climate is substantial due to significant altitudinal range and complex topography, yielding heterogeneous precipitation distribution and temperature regimes [37,38,39]. The region constitutes a critical water source for numerous major rivers in Asia, with its mountainous terrain contributing significantly to water retention, runoff generation and groundwater recharge processes. The combination of monsoonal climate and fragmented topography creates a highly heterogeneous environment for soil moisture distribution. As shown in Figure 1b,c, both surface soil moisture and anthropogenic modification exhibit significant spatial variation across the region, reflecting the interplay of natural environmental gradients and human land-use patterns [40,41,42,43,44,45].

2.2. Data and Preprocessing Process

The primary dataset utilized in this study is the “Global Daily Surface Soil Moisture (SSM) dataset at 1 km resolution (2000–2020)” [46]. This dataset was developed to address the limitations of existing passive microwave-based soil moisture products, which typically suffer from coarse spatial resolution (≥0.25°) and temporal gaps due to multi-day revisit cycles. By integrating the ESA Climate Change Initiative (ESA-CCI) soil moisture product with European Centre for Medium-Range Weather Forecasts (ECMWF) Reanalysis v5 (ERA5) data, a gap-free daily SSM dataset was first generated at 0.25° resolution. Subsequently, a machine learning-based downscaling approach, employing Random Forest algorithms and leveraging optical remote sensing data alongside in situ observations from the International Soil Moisture Network (ISMN), was applied to achieve a spatial resolution of 30 arc-second. The resulting product provides spatiotemporally continuous daily surface soil moisture estimates at a global scale, validated against measurements from 2346 ground stations worldwide, demonstrating high accuracy. This represents the first long-term, seamless, high-resolution global soil moisture dataset, with data provided in daily and monthly aggregates [46]. In this study, the monthly version of the dataset was cropped to the extent of Southwest China and further aggregated to annual averages. This processed annual soil moisture data then served as the spatial template to which all anthropogenic modification and auxiliary data were resampled and reprojected.
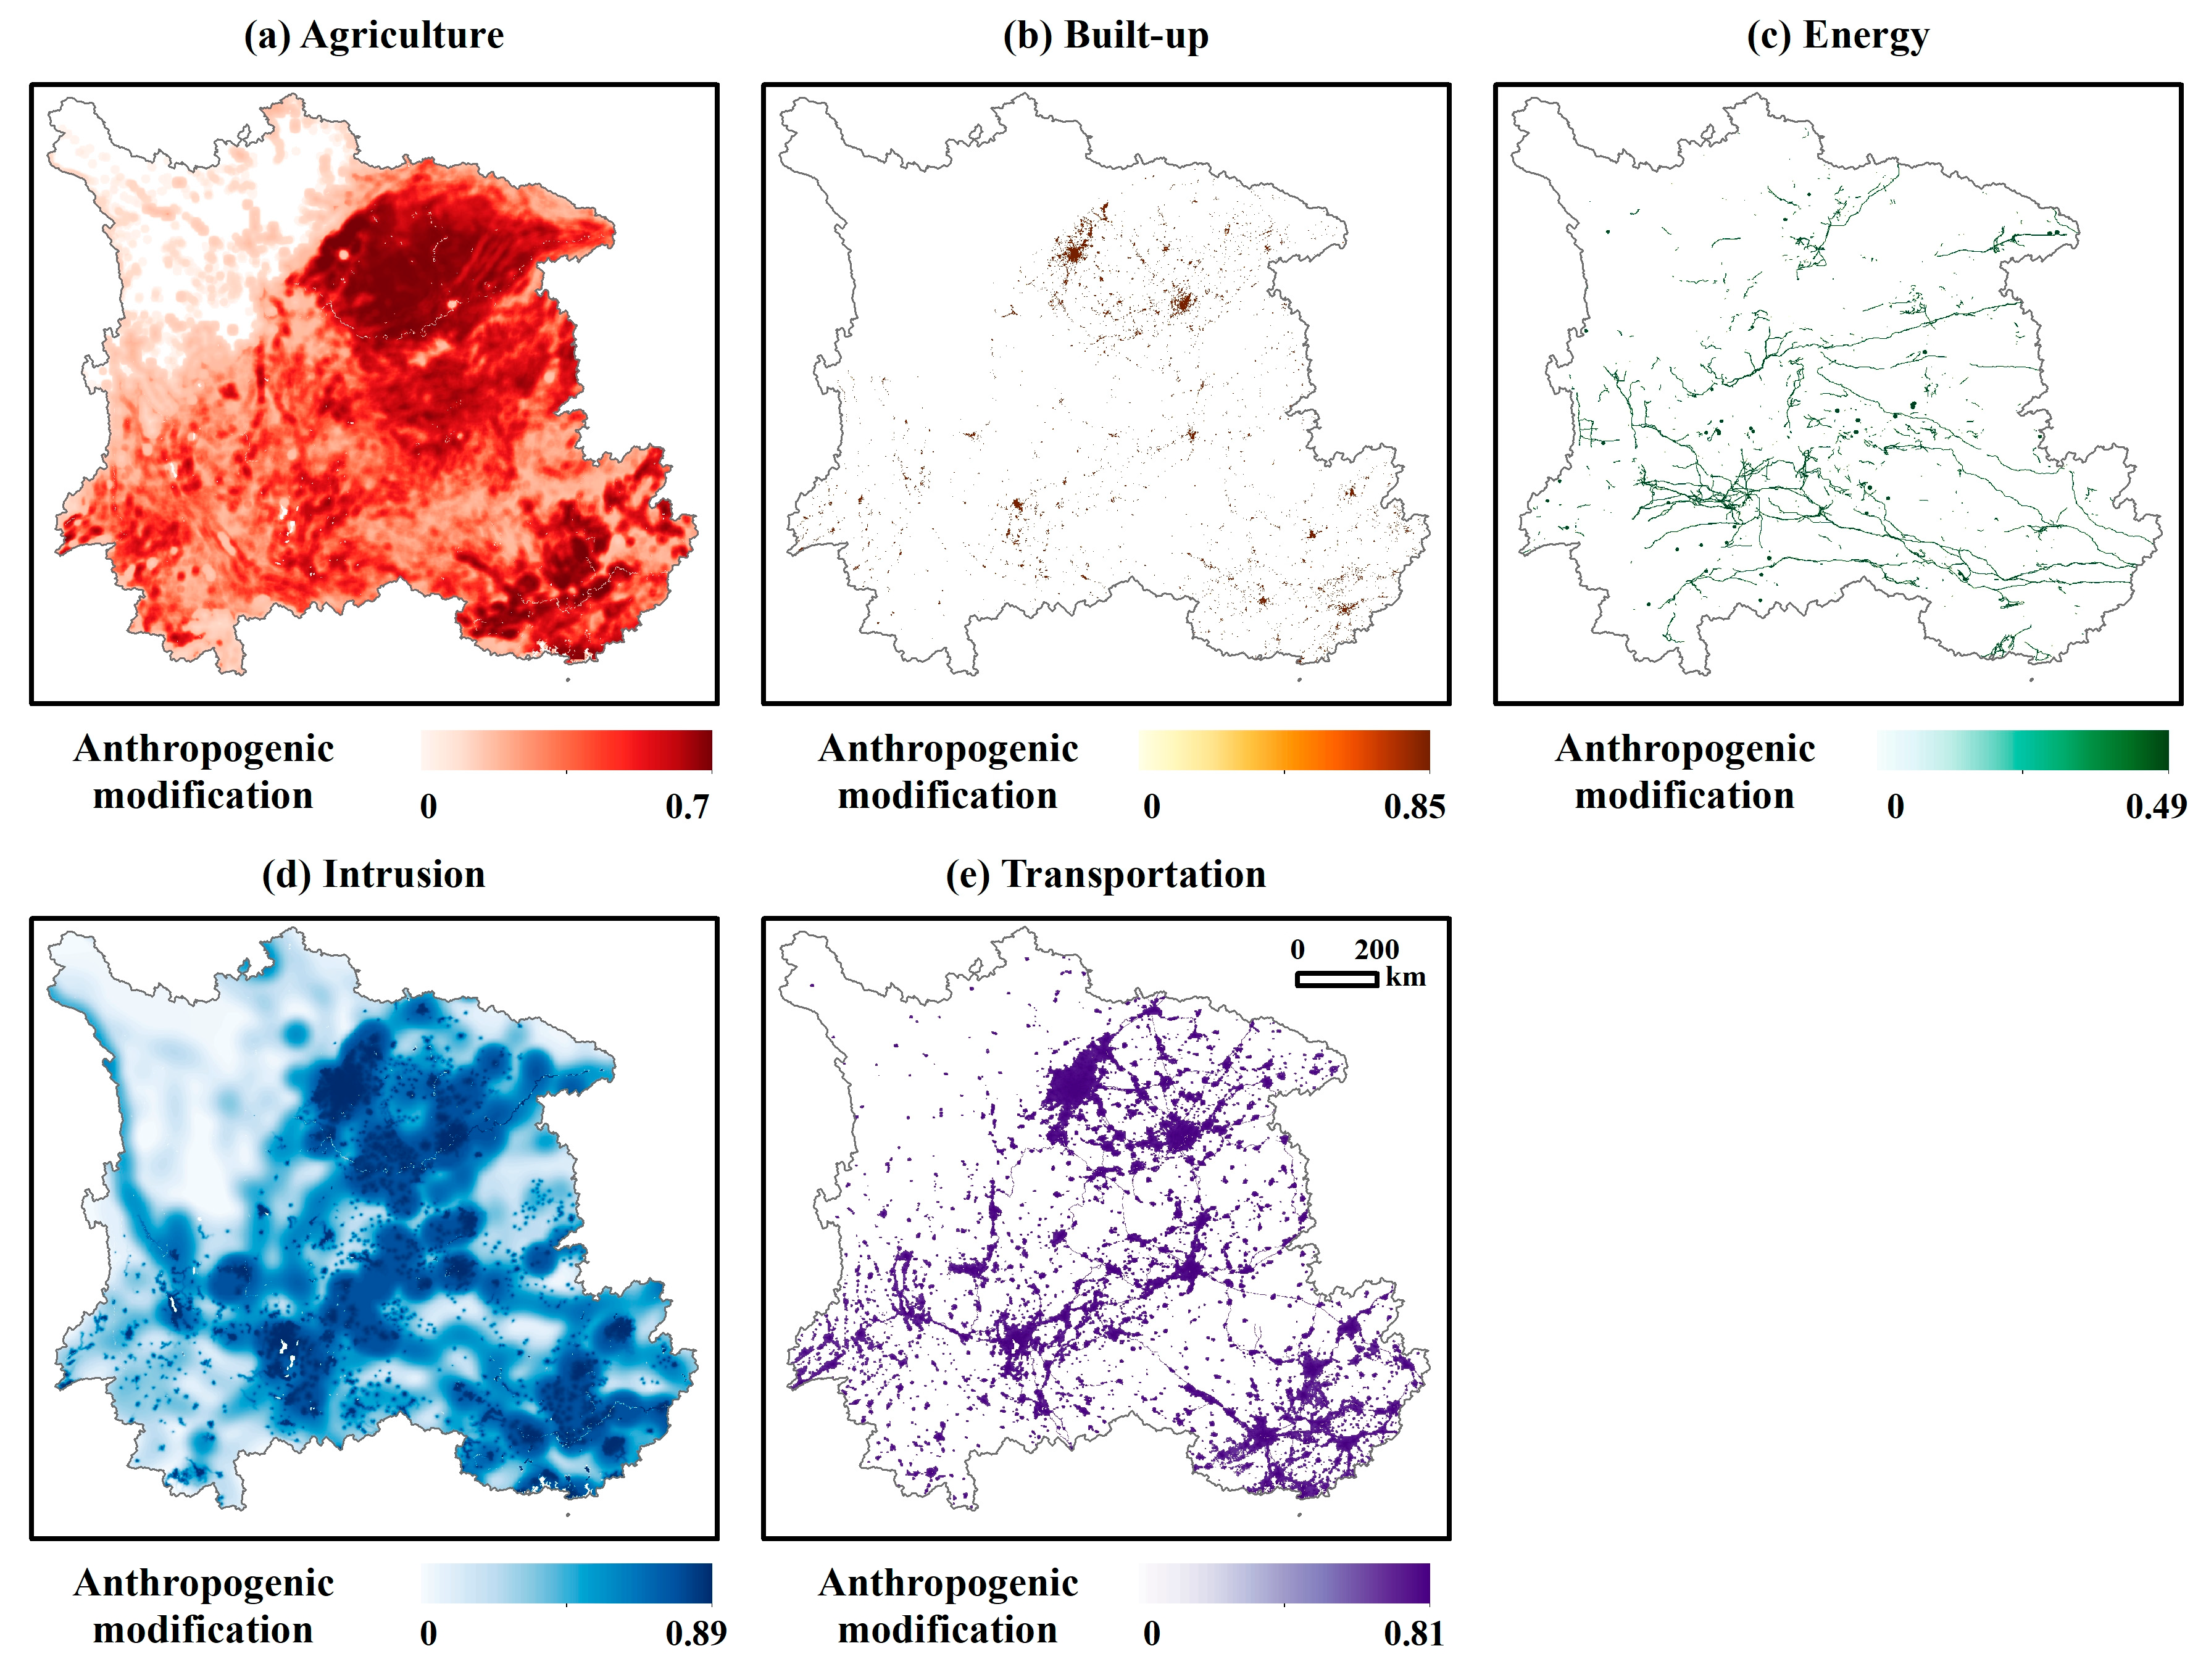
To quantify anthropogenic impacts, the “detailed mapping of global human modification from 1990 to 2017” dataset was employed [47]. This dataset provides a spatially explicit representation of the extent and degree of human modification of terrestrial lands, excluding Antarctica. It integrates multiple stressors of landscape change, including urban expansion, agricultural activities, transportation infrastructure, energy production and human intrusion, into a continuous index ranging from 0 (no modification) to 1 (complete modification). The dataset offers global coverage at a high spatial resolution of 300 m (~0.09 km2) and includes snapshots for the years 1990, 2000, 2010, 2015 and 2017, enabling the analysis of temporal trends in human footprint over nearly three decades. The 2017 static stressor version was employed, which disaggregates the overall human modification into five major stressor categories. In the original data, these are provided as separate GeoTIFF layers titled: “static_ag” (agriculture and biological harvesting of forests), “static_builtup” (urban and built-up areas), “static_energy” (energy production and mining), “static_intrusion” (human intrusions, natural system modifications and pollution) and “static_trans” (transportation and service corridors). In this study, these layers are referred to as Agriculture, Built-up, Energy, Intrusion and Transportation, respectively, for clarity and consistency in analysis (Figure 2). Each stressor layer retains the original continuous scaling from 0 to 1.0, representing the intensity of human impact specific to that category. To align with the spatiotemporal resolution of the soil moisture data, all anthropogenic modification layers were reprojected and resampled to a unified 30 arc-second geographic grid using a nearest neighbor aggregation method. This preprocessing ensured spatial consistency and enabled direct grid-to-grid comparison between soil moisture values and anthropogenic stressor intensities across the study period.
An overview of the datasets is presented in Table 1, while more detailed information is elaborated in Supplementary Table S1.

2.3. Method

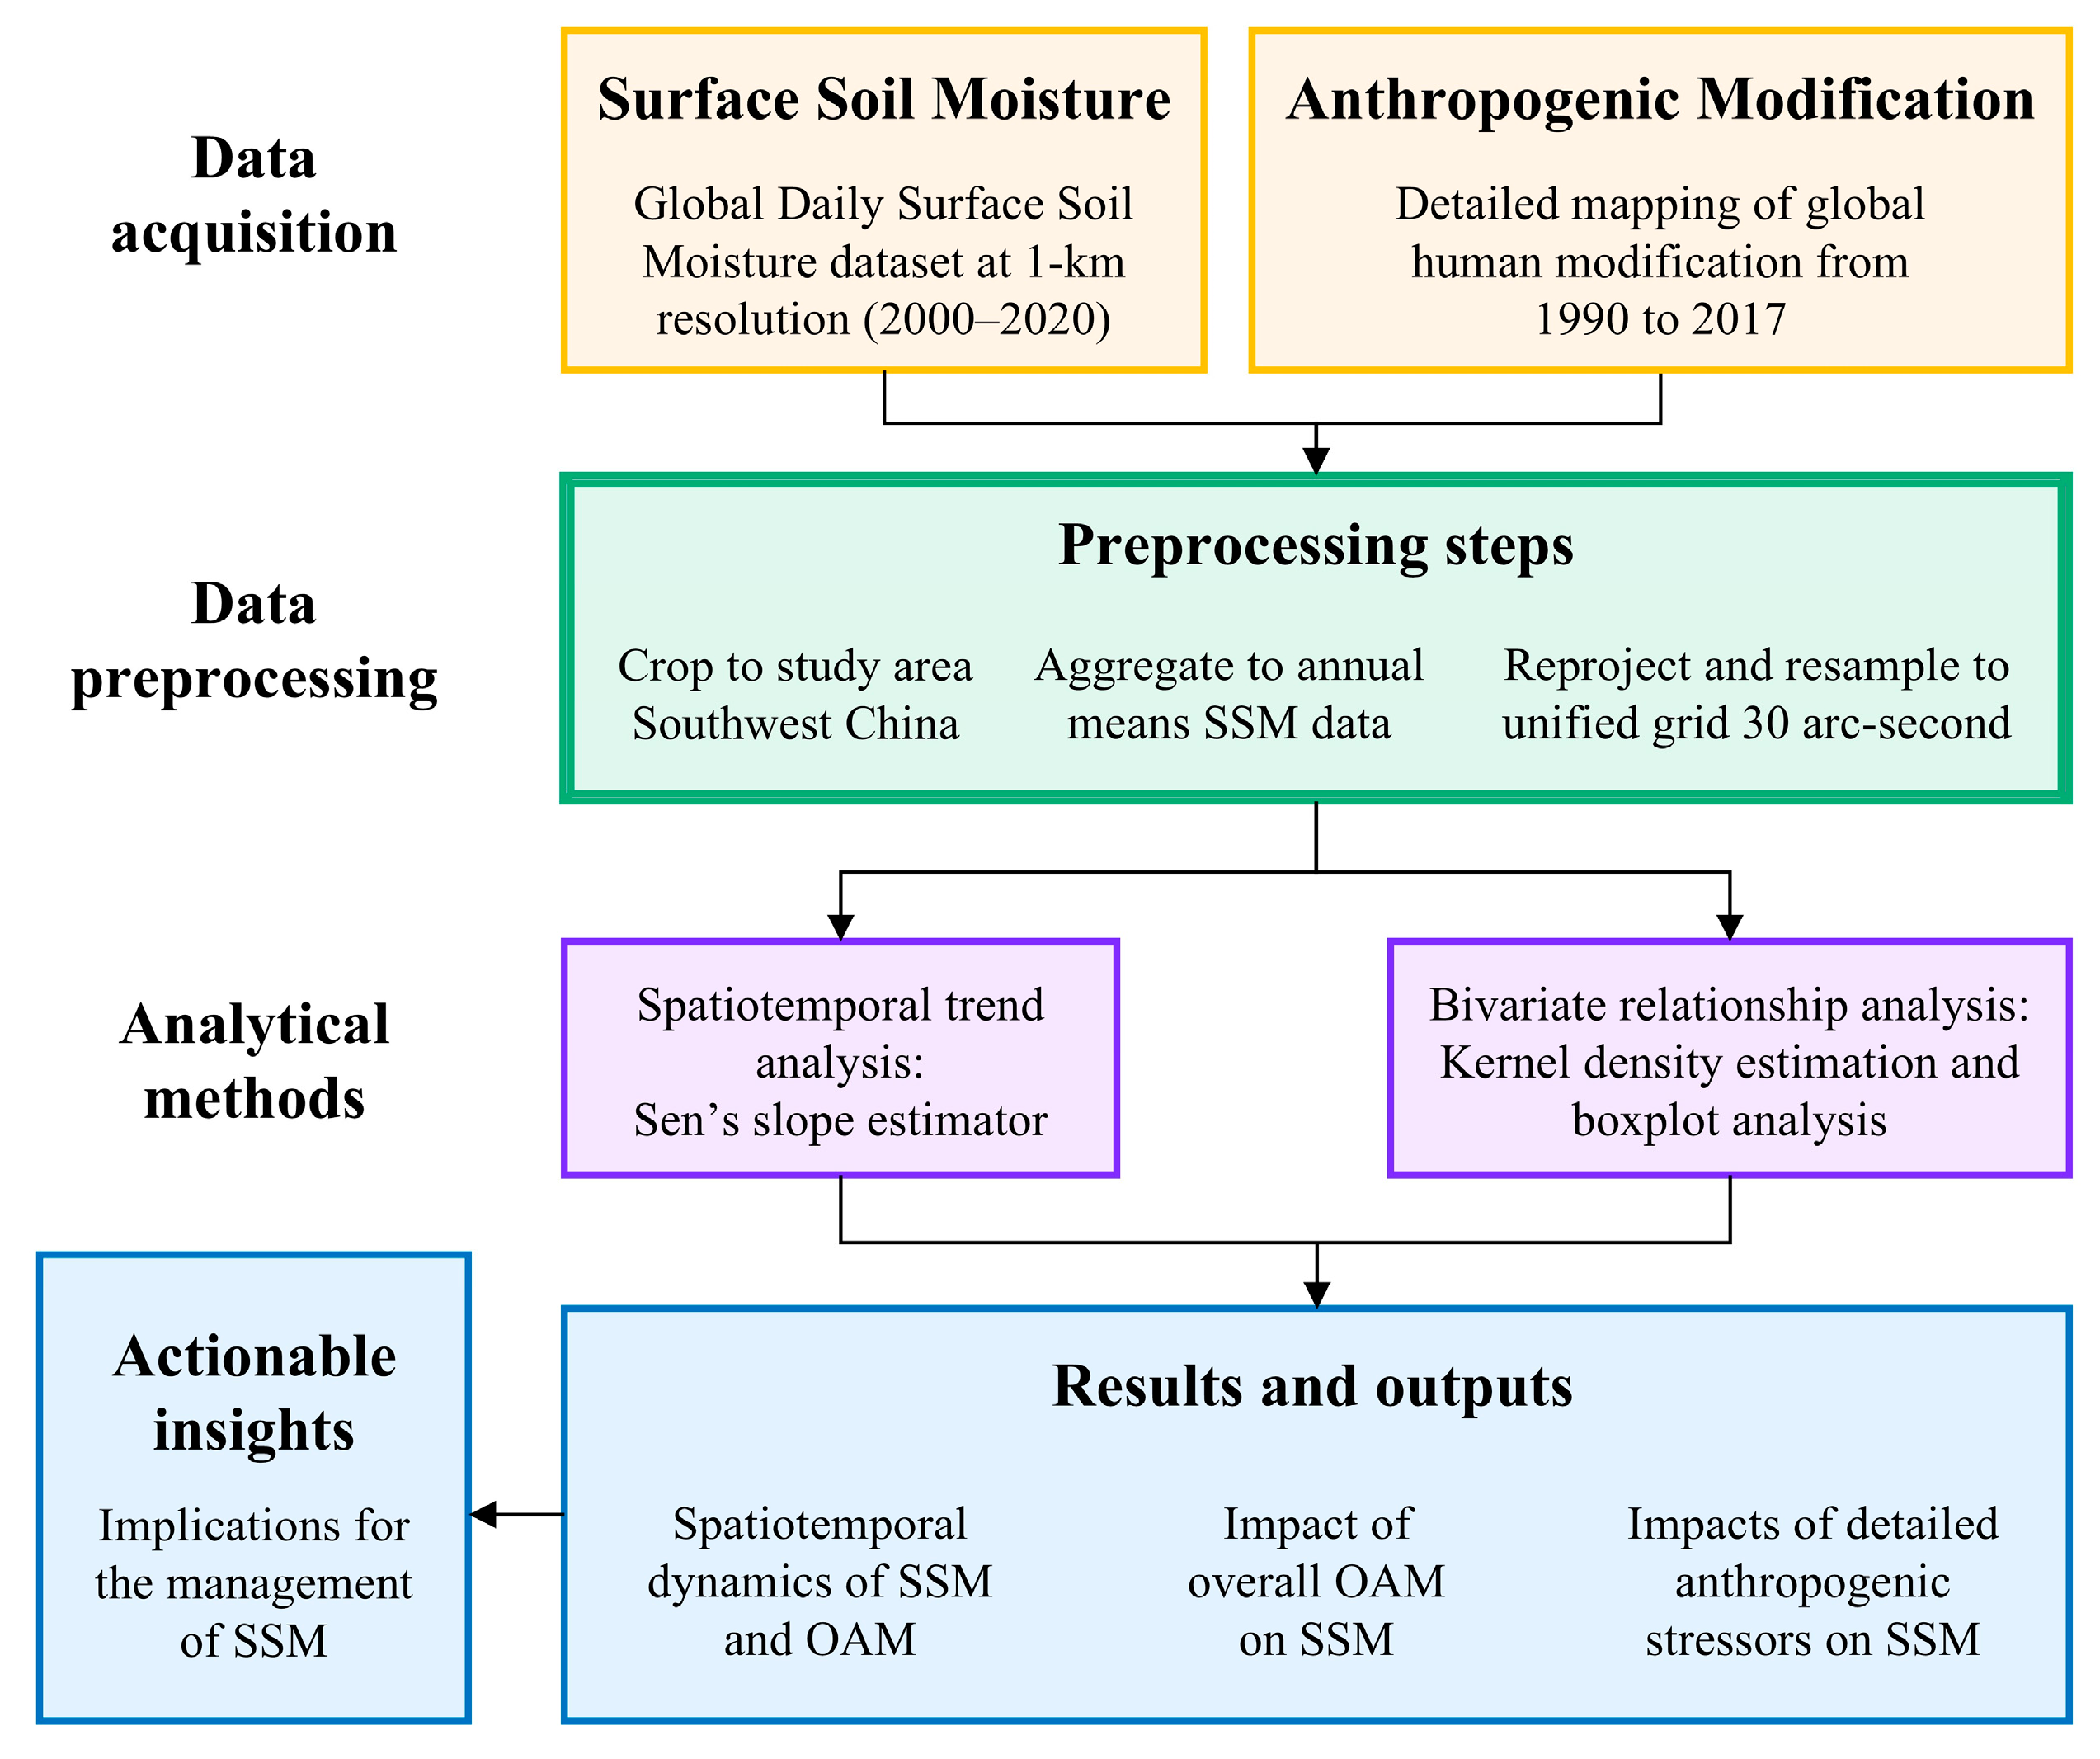
The methodological framework, comprising data acquisition, preprocessing, spatiotemporal trend analysis using Sen’s slope estimator and bivariate relationship analysis via kernel density estimation and boxplots, is schematically outlined in Figure 3.

2.3.1. Sen’s Slope

The non-parametric Sen’s slope method was employed to quantify the temporal trend in SSM dynamics over the study period. This method calculates the median slope between all possible pairs of points in the time series, providing a robust estimate of the magnitude of change that is resistant to outliers and non-normally distributed data [48,49].
For a time series with n data points, where each data point consists of a time value x i (i.e., year) and an data value y i (i.e., SSM data value), the slope between each data pair ( x i , y i ) and ( x j , y j ) (where i < j) is computed as [48,50]:
Q = y j y i x j x i
where Q represents the slope between two data points, indicating the rate of change per unit time between those points. The Sen’s slope estimator β is then defined as the median of all slope values [48,50]:
β = m e d i a n Q 1 , Q 2 , , Q n
where n is the total number of possible pairs.
The sign of the Sen’s slope estimator provides crucial information about the direction of the trend: a positive β value indicates an increasing trend in the time series, while a negative β value indicates a decreasing trend [6,51,52,53]. The magnitude of β quantifies the rate of change per unit time, providing a measure of the trend strength [53,54]. This method is particularly valuable for environmental time series analysis as it does not assume normal distribution of residuals and is less sensitive to extreme values or missing data compared to parametric regression methods [10,17,41,55]. In this study, the method was applied to annual mean SSM values from 2000 to 2017.

2.3.2. Bivariate Kernel Density and Statistical Analysis

To quantitatively examine the relationship between SSM and OAM, we employed a bivariate kernel density estimation (KDE) approach complemented by boxplot analysis. This dual methodology allows for a comprehensive visualization of the joint probability distribution of the two variables across different years (2000, 2010 and 2015).
The kernel density estimate for the paired datasets (SSM, OAM) was calculated using a Gaussian kernel function. For a set of n paired observations {(x1, y1), (x2, y2),..., (xₙ, yₙ)}, the joint density f(x, y) at a point (x, y) is estimated by:
f x , y = 1 n × i = 1 n K h x x x i × K h y y y i
where K h x and K h y are the Gaussian kernel functions in the x (OAM) and y (SSM) directions, respectively. The bandwidth parameters h x and h y , which critically control the smoothness of the resulting density estimate, were determined using Silverman’s rule of thumb [1]:
h = 1.06 × σ × n 1 5
where σ is the standard deviation of the corresponding variable. This rule provides an optimal balance between bias and variance for Gaussian-like distributions [2]. The estimation was performed on a 100 × 100 grid spanning the data range in both dimensions (OAM: [0, 1]; SSM: [0.1, 0.4] m3/m3) to ensure consistent resolution for inter-annual comparison.
All computations and visualizations were performed in MATLAB R2023b, utilizing custom scripts adapted from established statistical practices in geospatial analysis [3,4]. To handle the computational intensity of processing the full spatial dataset (often exceeding 10,000 points per year) without resorting to subsampling (thus preserving the integrity of the spatial representation), a dedicated progress bar was implemented during the KDE calculation to provide real-time feedback on processing status. Subsequently, the resulting density distributions were visualized using contour plots with a custom color gradient to enhance the interpretability of density gradients. Finally, the bivariate KDEs show the probability density distribution of data points across the variable space, where color intensity represents the relative concentration of observations, with warmer colors indicating higher density.
To complement the continuous density representation and to statistically quantify the central tendency and spread of SSM across different human modification intensities, we further conducted a boxplot analysis. The OAM values were classified into five discrete levels of human modification intensity: Low (0–0.2), Med–Low (0.2–0.4), Medium (0.4–0.6), Med–High (0.6–0.8) and High (0.8–1.0), representing a complete spectrum from minimal to extreme human modification. This classification scheme, based on equal-interval bins, provides a consistent framework for comparing SSM characteristics across the full range of human impact levels. For each intensity level and temporal period (2000, 2010, 2015), the distribution characteristics of SSM values were systematically characterized. Boxplots were subsequently generated to visually represent key statistical metrics including the median, interquartile range (25th–75th percentiles), and outliers beyond 1.5 times the interquartile range, thereby enabling a comprehensive assessment of how soil moisture distribution varies with increasing human modification pressure.

3. Results

In this section, we present a comprehensive analysis of the spatiotemporal dynamics of SSM and anthropogenic modification, along with their interrelationships, over Southwest China from 2000 to 2017. Key findings include the spatial distribution and temporal trends of SSM (Section 3.1), the evolution of OAM (Section 3.2), the impacts of OAM on SSM patterns through bivariate kernel density estimation and boxplot analysis (Section 3.3), and the distinct effects of five detailed anthropogenic factors (five constituent stressors, namely, Agriculture, Built-up, Energy, Intrusion and Transportation) on SSM (Section 3.4). Results are derived from multi-year geospatial and statistical comparisons, providing new insights into how human activities influence regional soil hydrology.

3.1. Spatiotemporal Dynamics of Surface Soil Moisture

3.1.1. Characteristics of Spatial Distribution

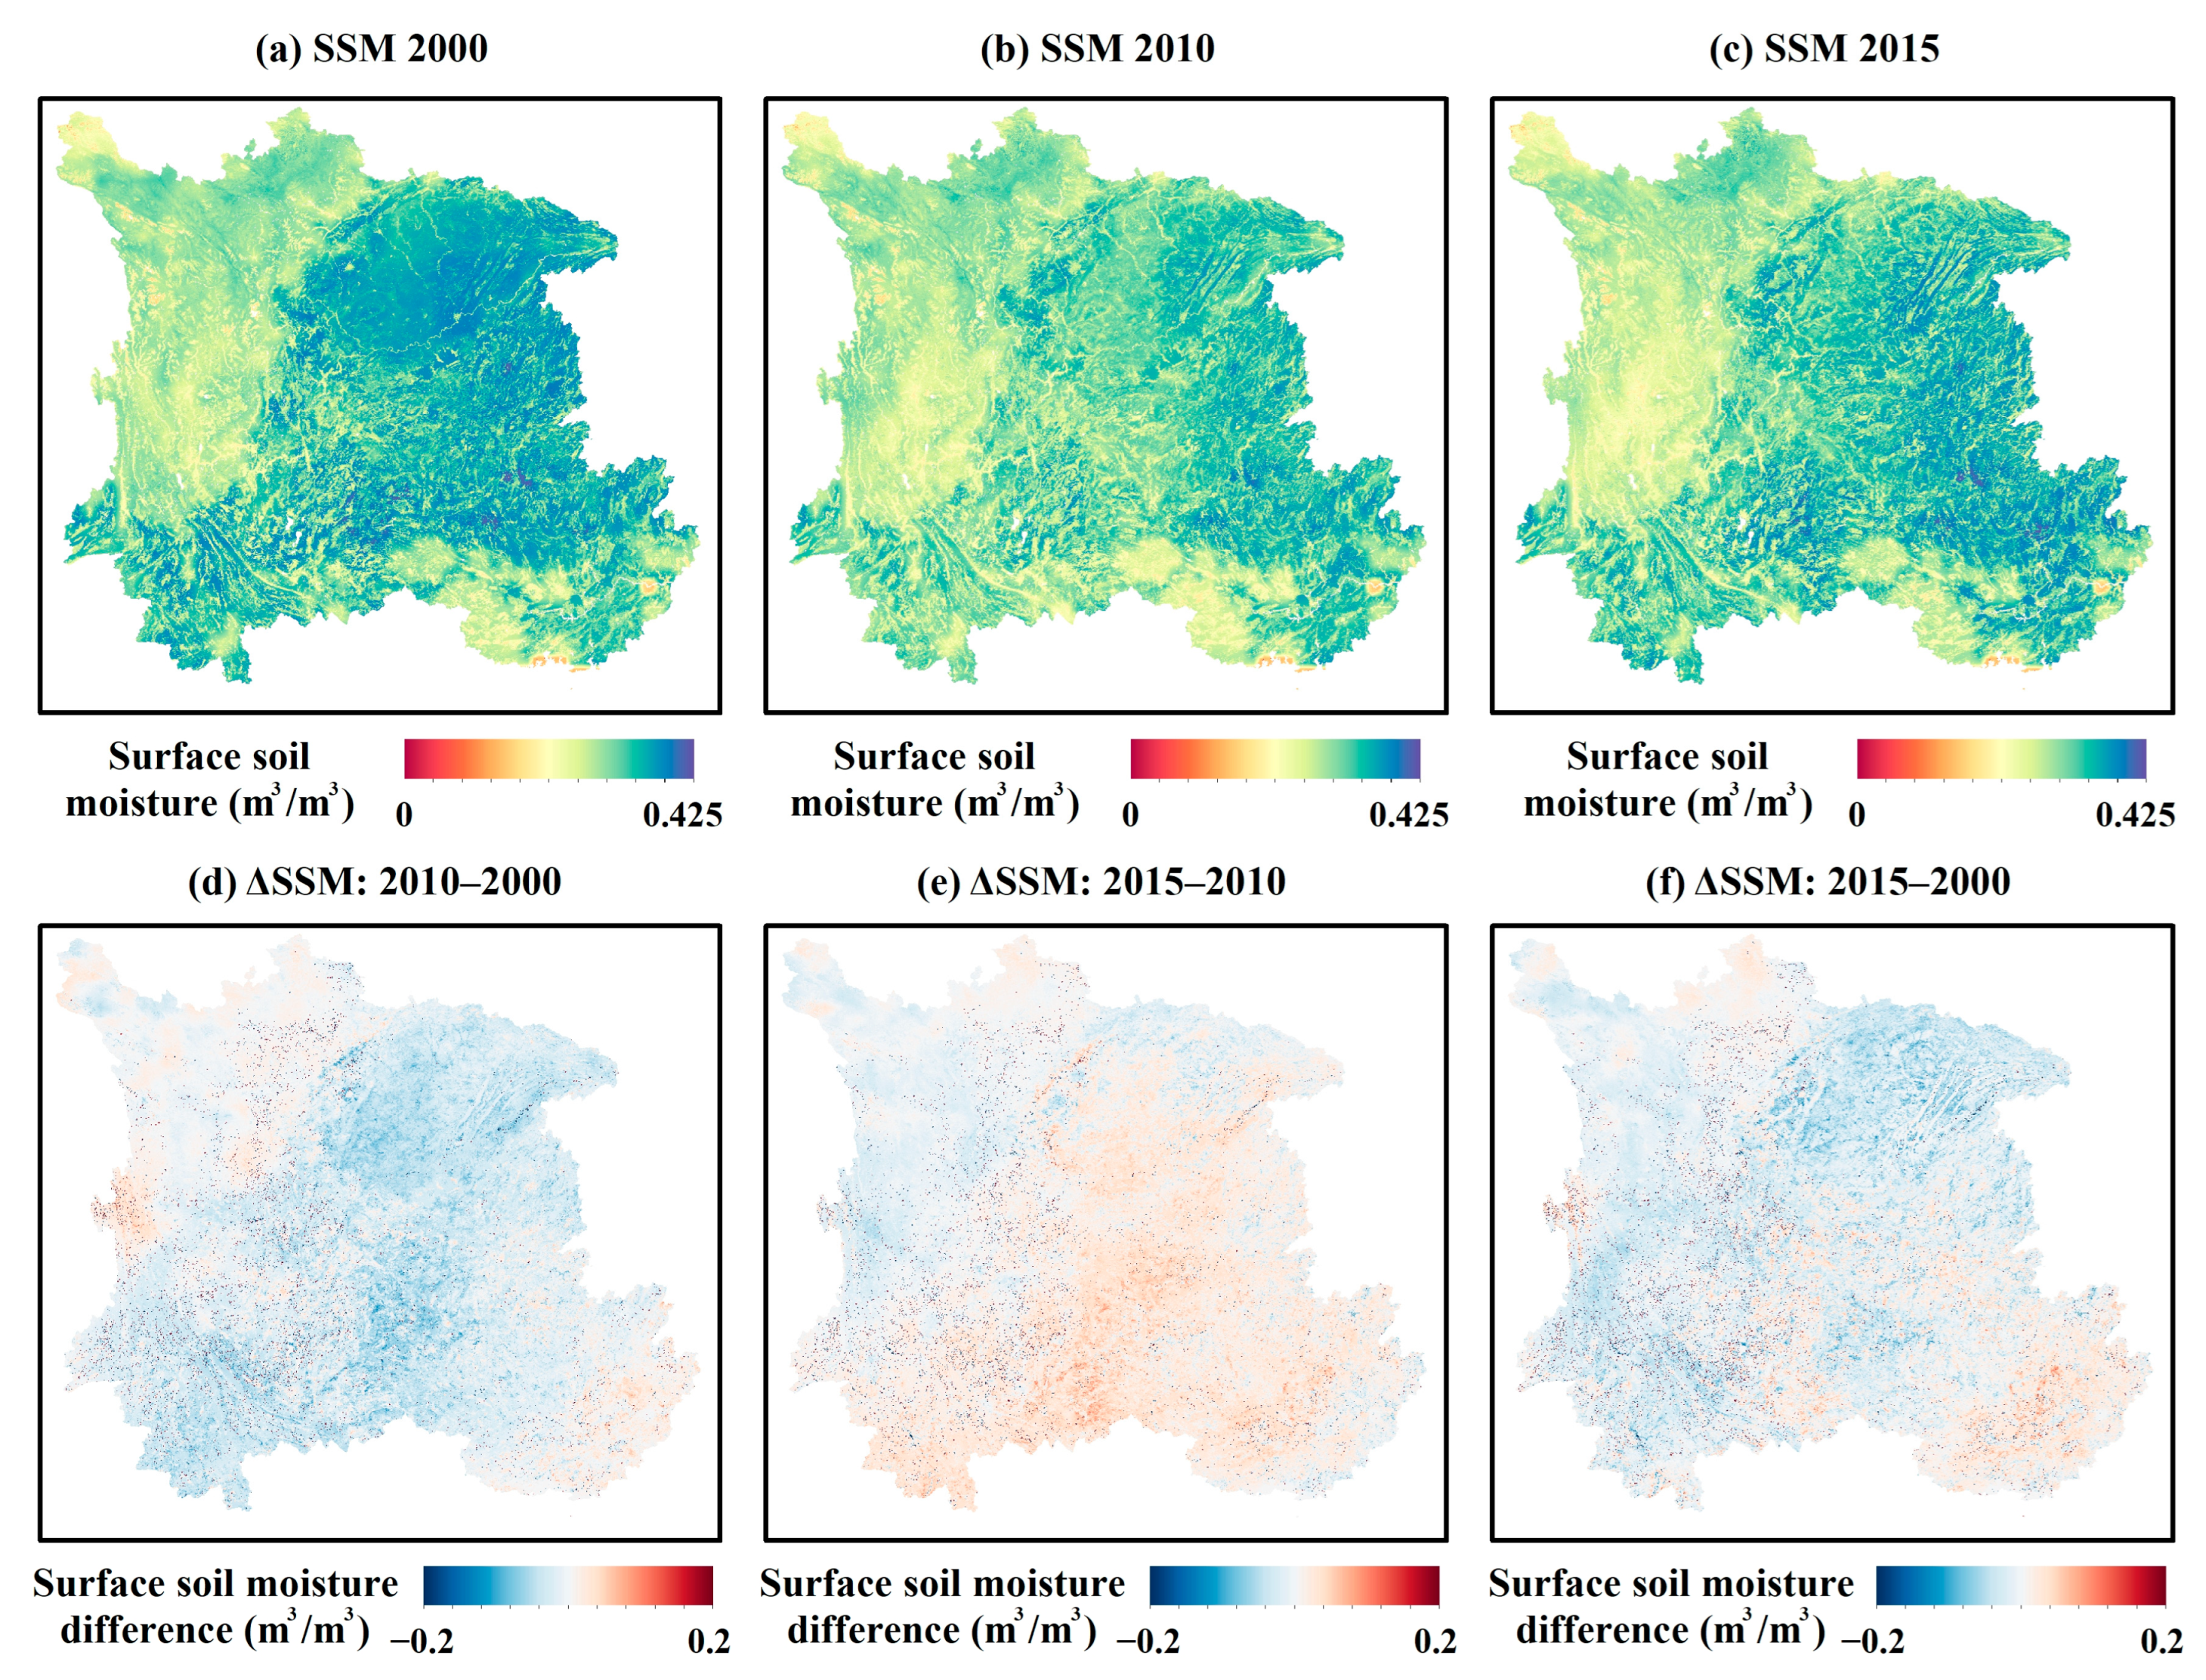
Figure 4 presents the spatial distribution of SSM for the three benchmark years, as well as differences in moisture distribution and intensity between the early, middle and late study periods. In 2000 (Figure 4a), SSM ranges from near 0 to 0.425 m3/m3, with relatively higher values concentrated in the northern and northwestern areas and lower values in the southeastern parts. By 2010 (Figure 4b), the spatial pattern is broadly similar but with some localized shifts in SSM intensity. In 2015 (Figure 4c), the distribution maintains the overall gradient, yet areas of elevated SSM appear more extensive compared with 2010, indicating a general increase in SSM in parts of the region. Across all three maps, the color gradient clearly delineates wetter and drier zones, highlighting persistent spatial heterogeneity.
Figure 4d–f illustrates the spatial differences in SSM between the respective periods. Figure 4d (ΔSSM 2010–2000) shows widespread blue shades over much of the region, indicating that SSM in 2010 was generally lower than in 2000, particularly in the central and western zones. In Figure 4e (ΔSSM 2015–2010), orange and red tones dominate, signifying that SSM increased across large areas between 2010 and 2015, especially in the northern and central parts of the study area. Figure 4f (ΔSSM 2015–2000) summarizes the net difference over the entire 15-year interval. It presents a mixed pattern of blue and red hues: regions where SSM decreased from 2000 to 2015 appear in blue, while areas of increase are in red, providing a comprehensive view of long-term changes.

3.1.2. Temporal Patterns Dynamics

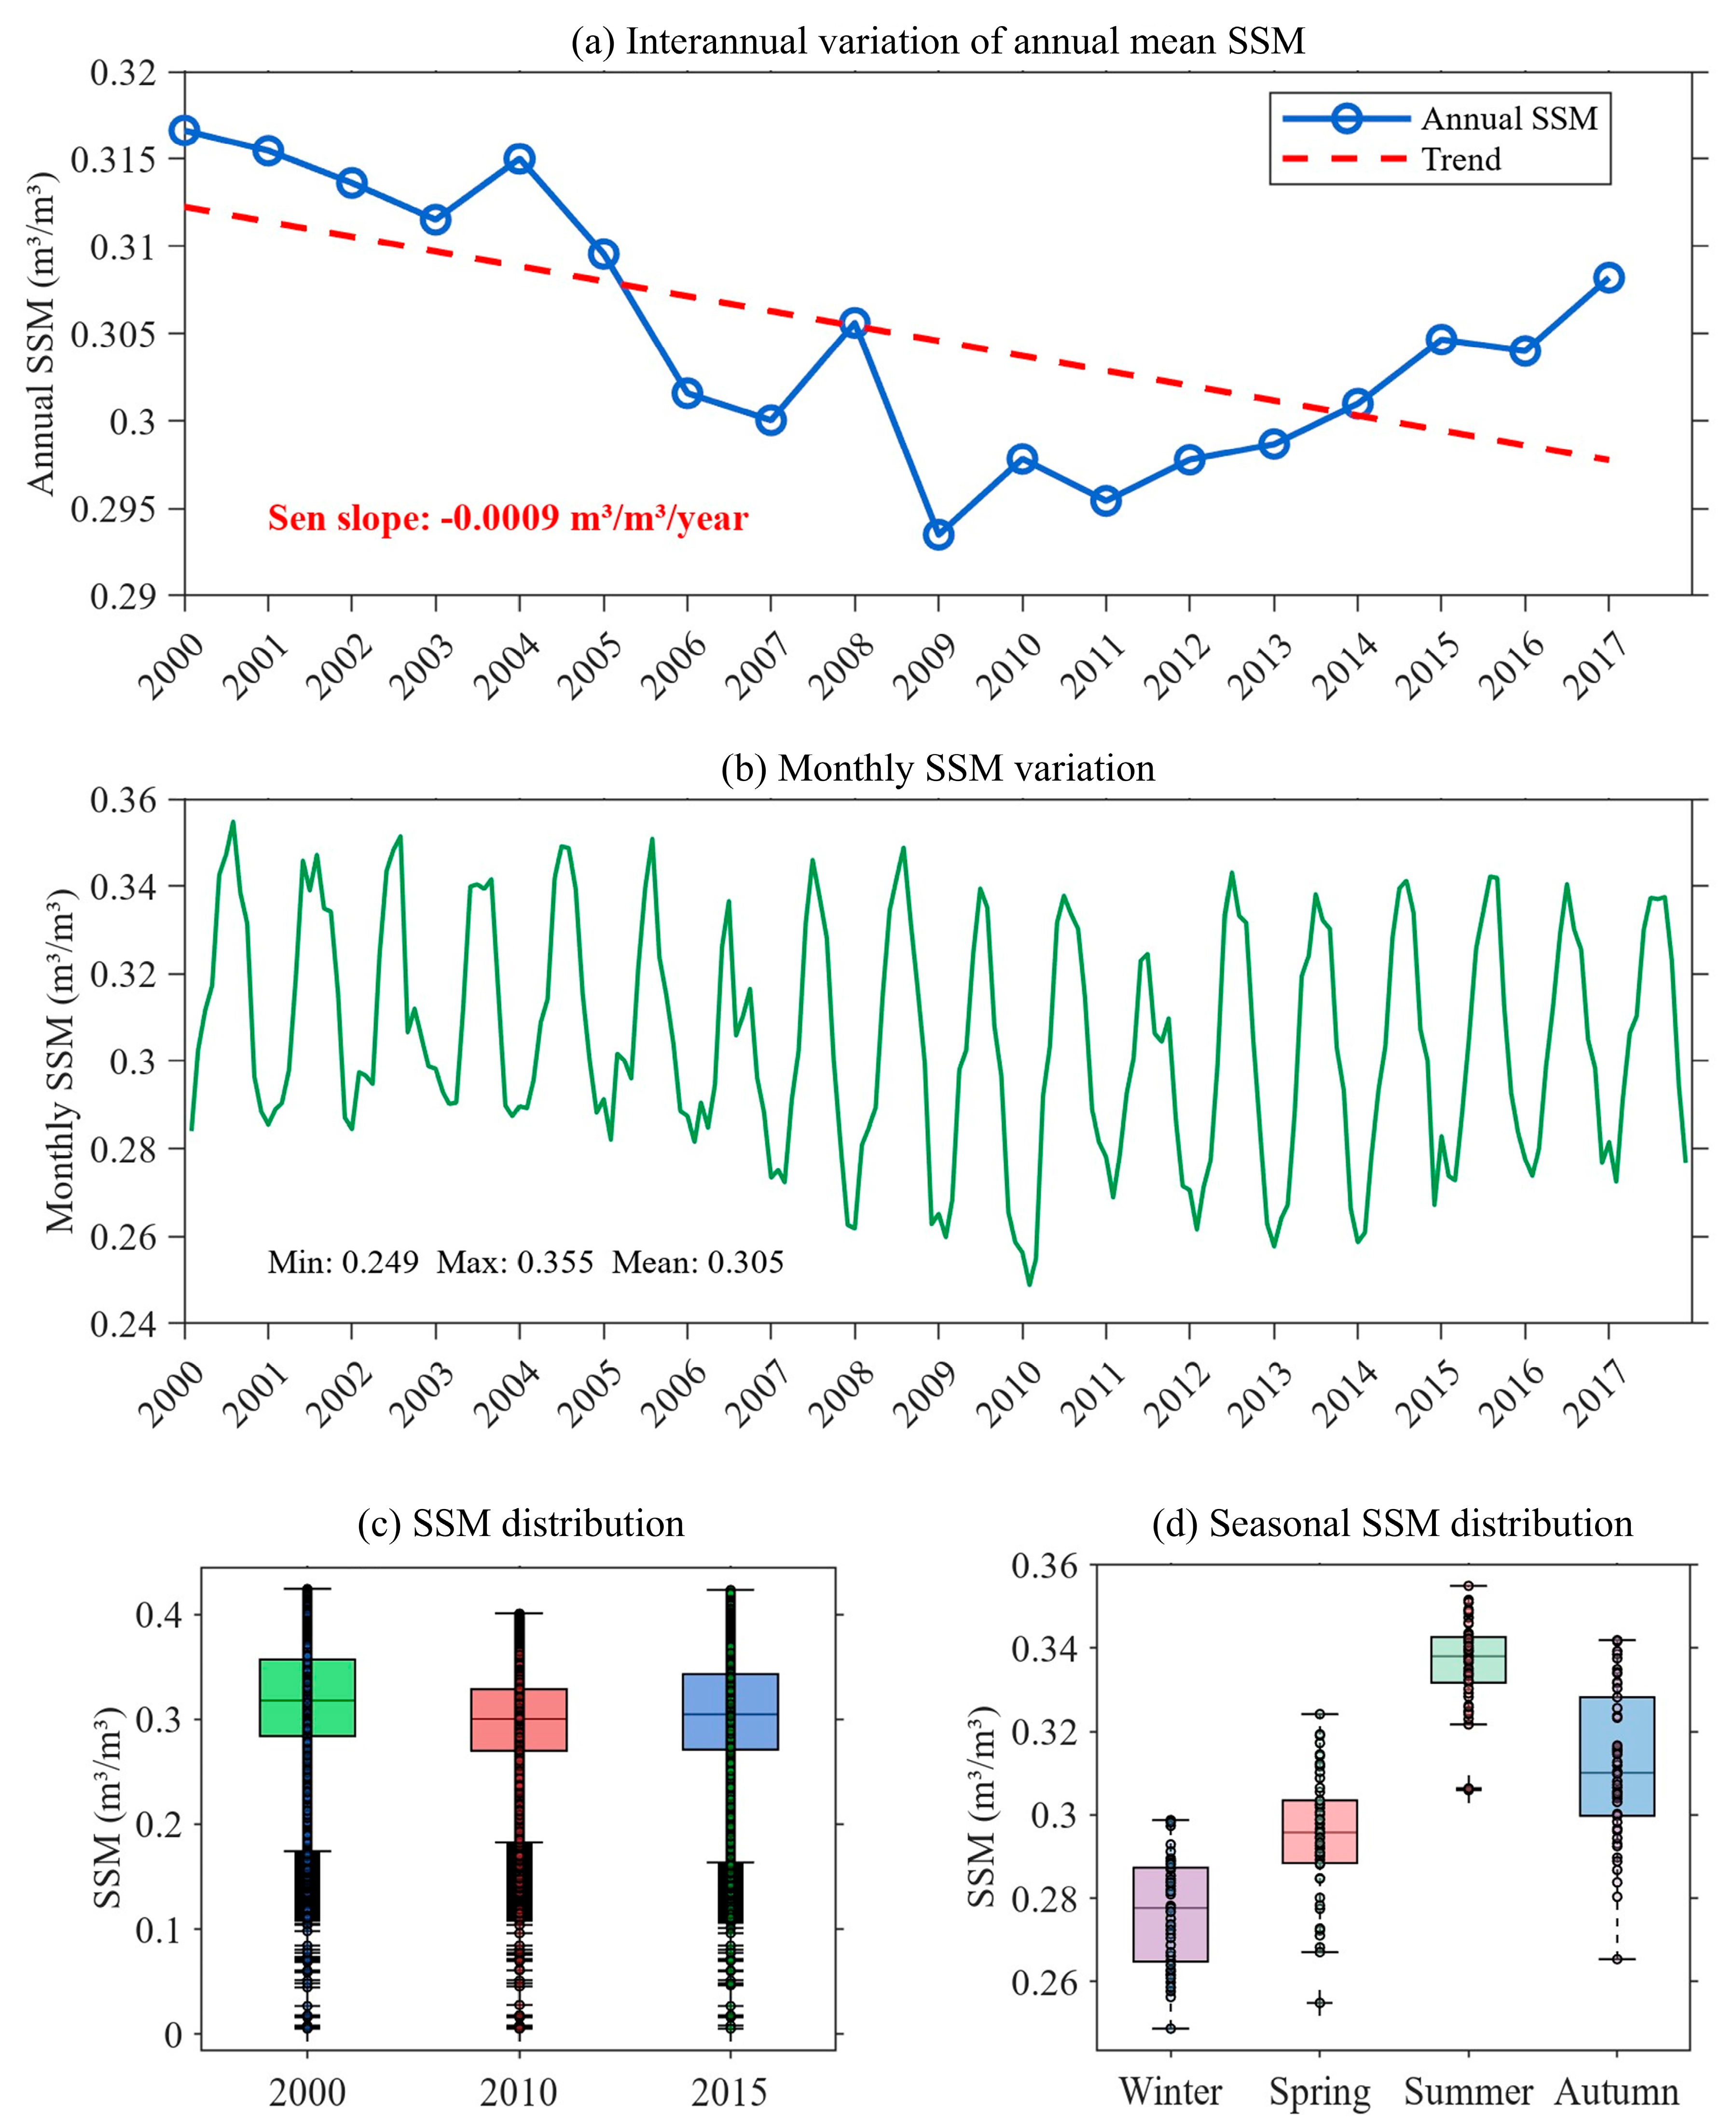
Figure 5a shows the interannual variation in SSM from 2000 to 2017, accompanied by a linear trend line and Sen’s slope value. Annual mean SSM fluctuates between approximately 0.29 and 0.32 m3/m3. The Sen’s slope of −0.0009 m3/m3/year indicates a slight declining trend across the entire study period. Nevertheless, the annual series shows marked variability: SSM decreases from 2000 to around 2009, stabilizes at lower values through 2011, and then increases gradually until 2017. This indicates that despite the long-term downward tendency, post-2011 conditions display a gradual recovery of SSM. Figure 5b presents monthly SSM variation over the same period. A clear intra-annual cycle is evident, with regular peaks and troughs corresponding to seasonal SSM fluctuations. Across the record, the monthly SSM spans from a minimum of 0.249 m3/m3 to a maximum of 0.355 m3/m3, with a mean of 0.305 m3/m3.
Figure 5c depicts boxplots of SSM distributions for the years 2000, 2010 and 2015, providing a snapshot of inter-decadal changes. In 2000, the SSM distribution centers slightly above 0.30 m3/m3 with a moderate spread. By 2010, both the median and quartiles shift slightly downward, indicating a general decrease in central SSM values. In 2015, the distribution shows partial recovery, with the median returning close to early-period levels, though variability persists. The whiskers and numerous outliers in all three boxplots highlight significant spatial heterogeneity and episodic extremes in SSM across the region.
Figure 5d summarizes the seasonal SSM distribution aggregated over the study period. In Winter, it shows the lowest median SSM and a relatively narrow interquartile range. Spring presents slightly higher values but still moderate variability. Summer exhibits the highest median and widest interquartile range, indicating wetter conditions. Autumn falls between summer and spring, with relatively high upper whiskers and outliers reflecting occasional wet extremes. These seasonal boxplots reveal clear intra-annual contrasts in SSM conditions across the region.
Overall, this analysis provides a comprehensive overview of the spatiotemporal and seasonal variability of SSM over Southwest China during 2000–2017. While the long-term Sen’s slope indicates a slight decline, significant interannual variability and a post-2011 increase is also evident. Meanwhile, it captures decadal-scale changes in distribution, and illustrates the seasonal cycle, with the lowest SSM in winter and the highest in summer.

3.2. Spatiotemporal Dynamics of Anthropogenic Modification

3.2.1. Characteristics of Spatial Distribution

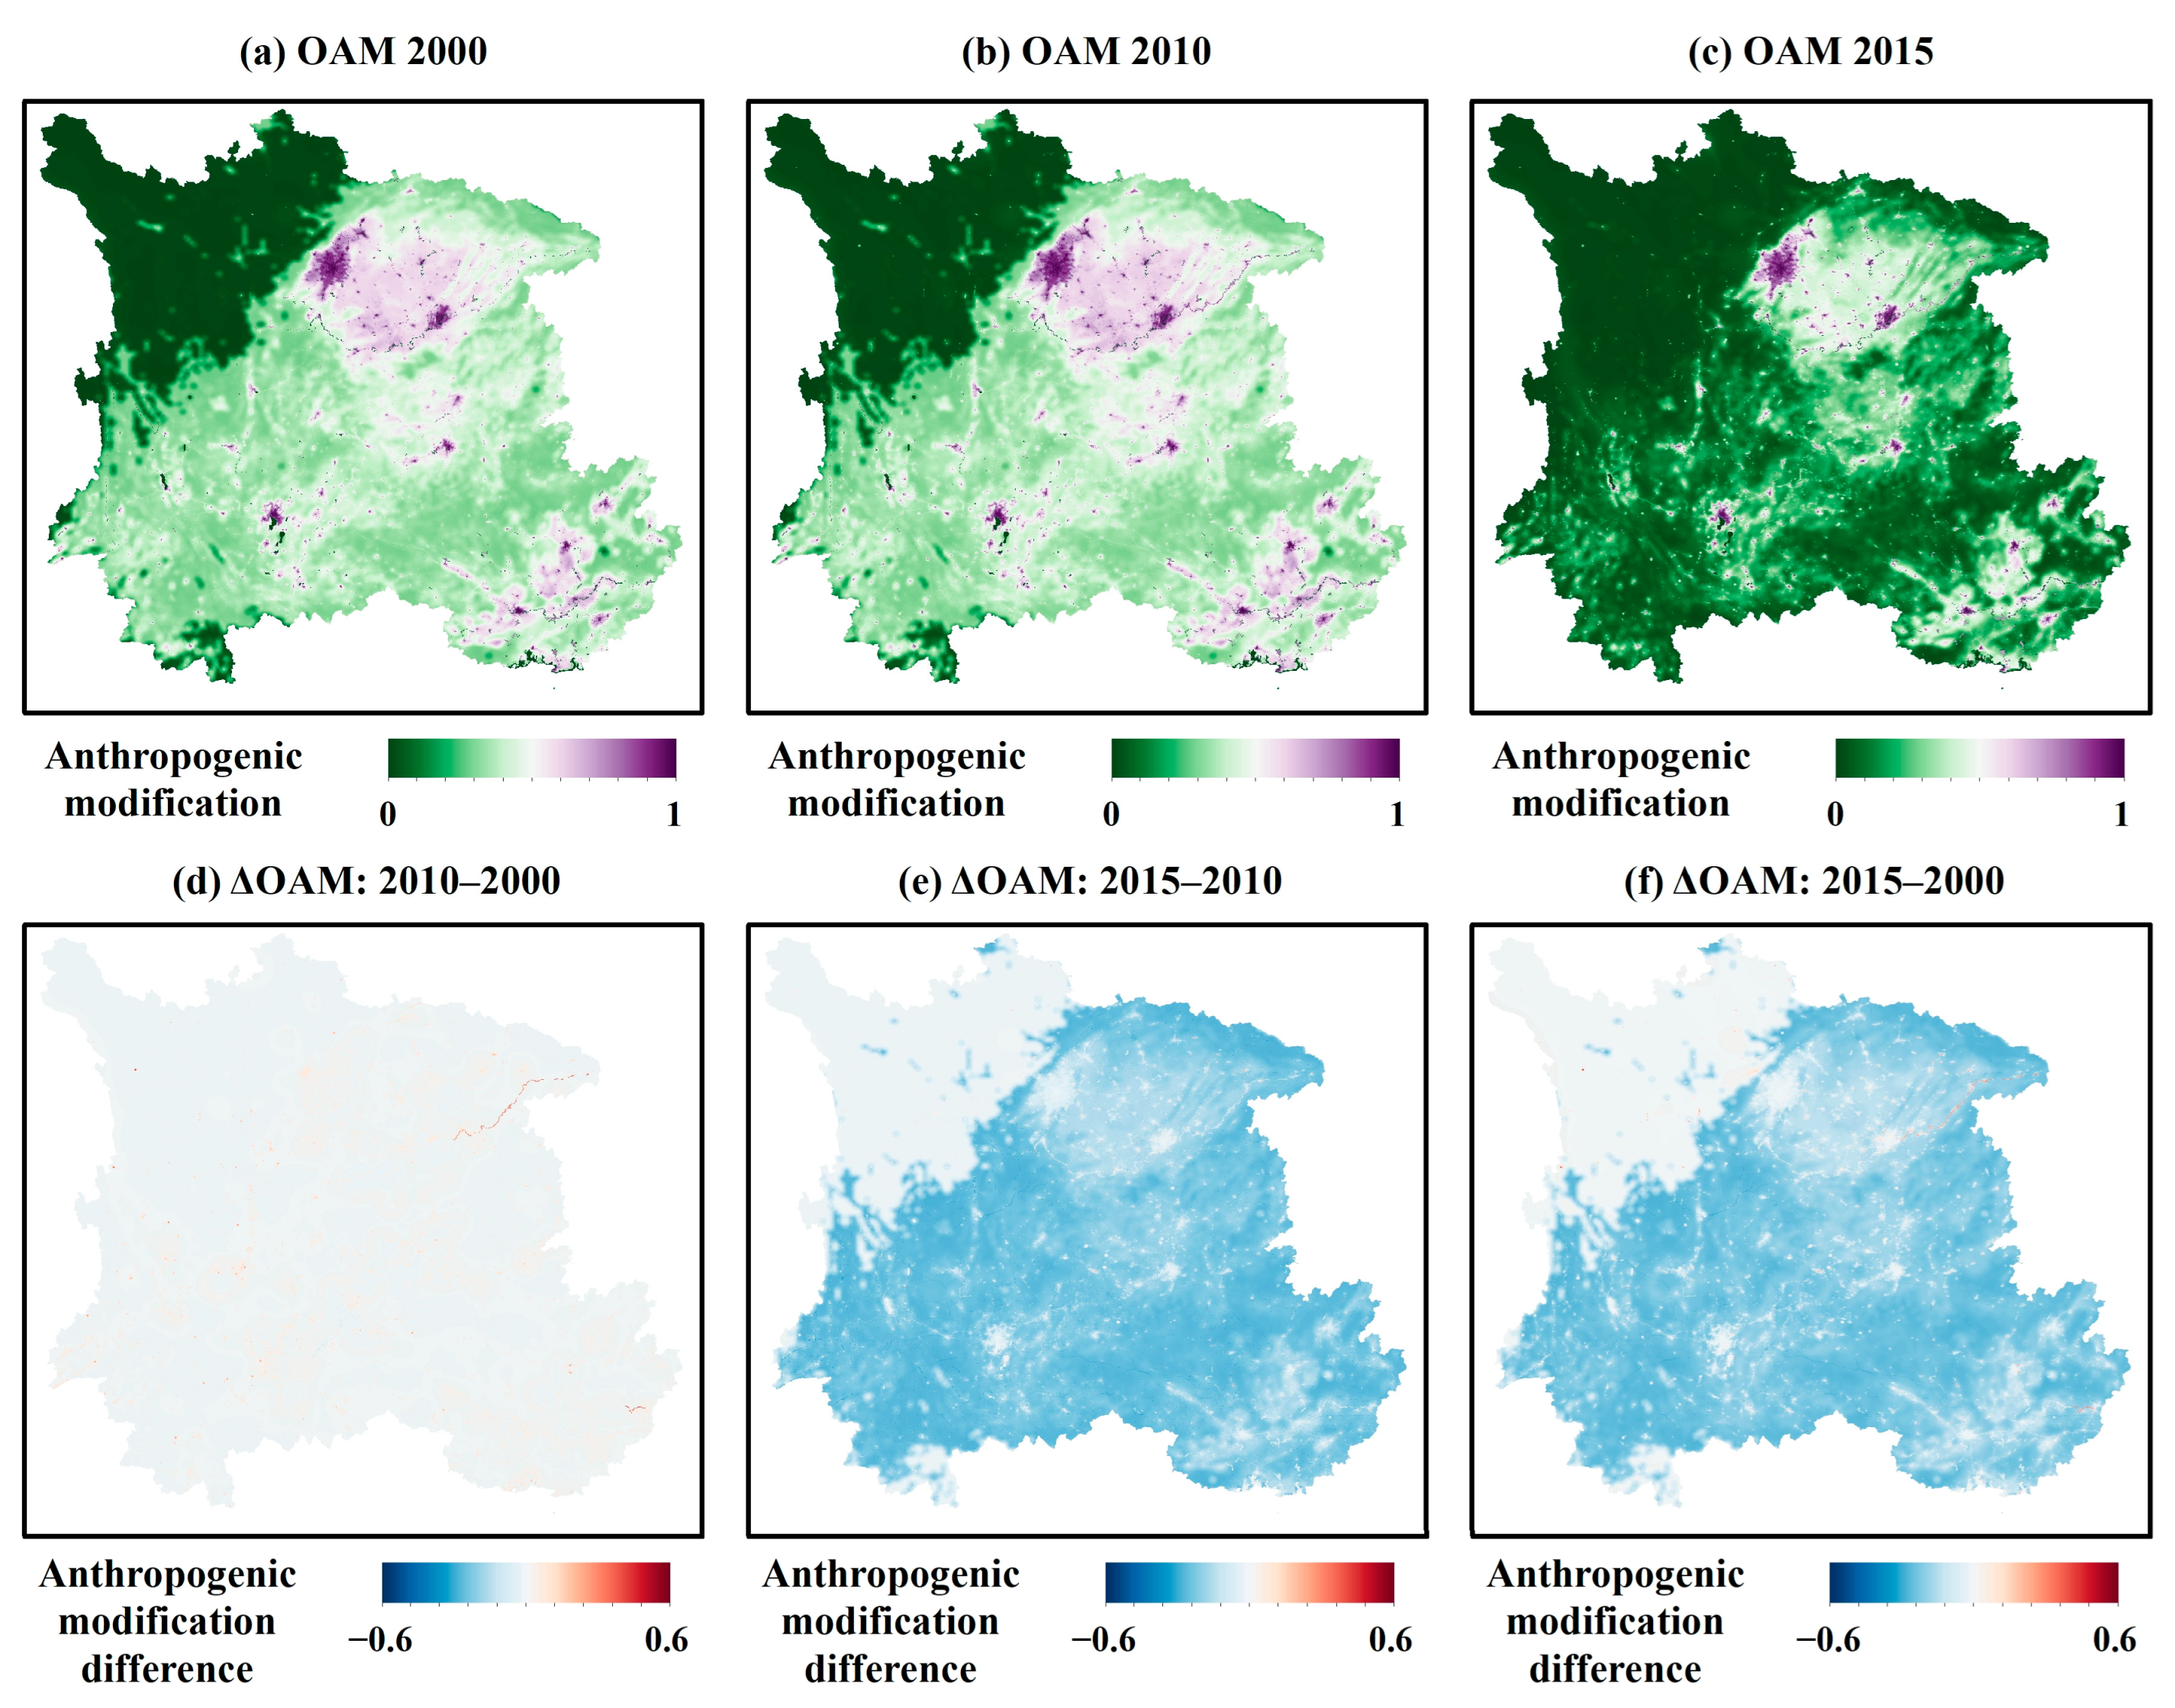
Figure 6a–c displays the spatial distribution of OAM across three benchmark years. In 2000 (Figure 6a), anthropogenic modification values range from 0 to 1, with high-intensity zones (dark green to purple) concentrated in the northern and northeastern areas, while lower values predominate in the south and west. By 2010 (Figure 6b), the general pattern persists, although regions of moderate to high modification have expanded, particularly in the central belt. In 2015 (Figure 6c), the map shows a more continuous spread of high OAM values, indicating further intensification and expansion of anthropogenic modification across large parts of the region. The color gradient from green to purple clearly reflects spatial heterogeneity, highlighting localized high-modification areas surrounded by lower values.
Figure 6d–f depicts the differences in OAM between time intervals. In Figure 6d (ΔOAM 2010–2000), the map is mostly light-toned, suggesting only minor net changes in anthropogenic modification over the first decade, with sparse areas of red showing localized increases and very limited blue zones indicating decreases. In Figure 6e (ΔOAM 2015–2010), blue shades dominate across much of the region, signifying widespread decreases in anthropogenic modification between 2010 and 2015, although pockets of red indicate localized intensification. Figure 6f (ΔOAM 2015–2000) integrates the full 15-year interval, revealing a more mixed pattern with extended blue areas interspersed with red zones, indicating cumulative decreases and increases, respectively, relative to the year 2000 baseline.
It should be noted that the decline in OAM between 2010 and 2015 partly reflects the internal rescaling logic of the global human modification dataset rather than a pure reduction in human occupation. Consequently, areas previously classified under moderate disturbance were reassigned to lower-intensity states, resulting in an apparent decrease in OAM. Therefore, while the spatial pattern is similar to regions targeted by programs such as environmental protection projects and Grain-for-Green Program of China [56], the decline should be interpreted as a reduction in human modification intensity rather than a literal withdrawal of anthropogenic presence.
Overall, the spatiotemporal analysis reveals a complex evolution of anthropogenic modification across Southwest China, characterized by generally increasing trends with notable interannual variations. The eastern lowland regions maintained the highest modification intensities throughout the study period, while the western high-altitude areas remained relatively undisturbed. The analysis particularly highlights that years 2010 mainly showed a slight growth in human modification, consistent with regional development patterns. A critical consideration in interpreting the observed decline in OAM between 2010 and 2015 is the inherent structure and methodology of the global human modification dataset. This apparent decrease likely reflects a combination of factors. Primarily, it is attributed to the internal rescaling logic of the dataset between the 2010 and 2015 versions. This rescaling may result in areas previously classified under moderate disturbance being reassigned to lower-intensity states, which manifests as a reduction in the overall OAM value without necessarily indicating a literal, large-scale withdrawal of anthropogenic presence. While the spatial pattern of decrease shares a broad correspondence with regions historically targeted by conservation programs, attributing the change solely to such policies is not feasible without more granular, region-specific implementation data. Therefore, the decline is more cautiously interpreted as a measurable shift in the classified intensity of human modification within the framework of this specific dataset, the precise drivers of which require further validation with ancillary local data.

3.2.2. Temporal Patterns Dynamics

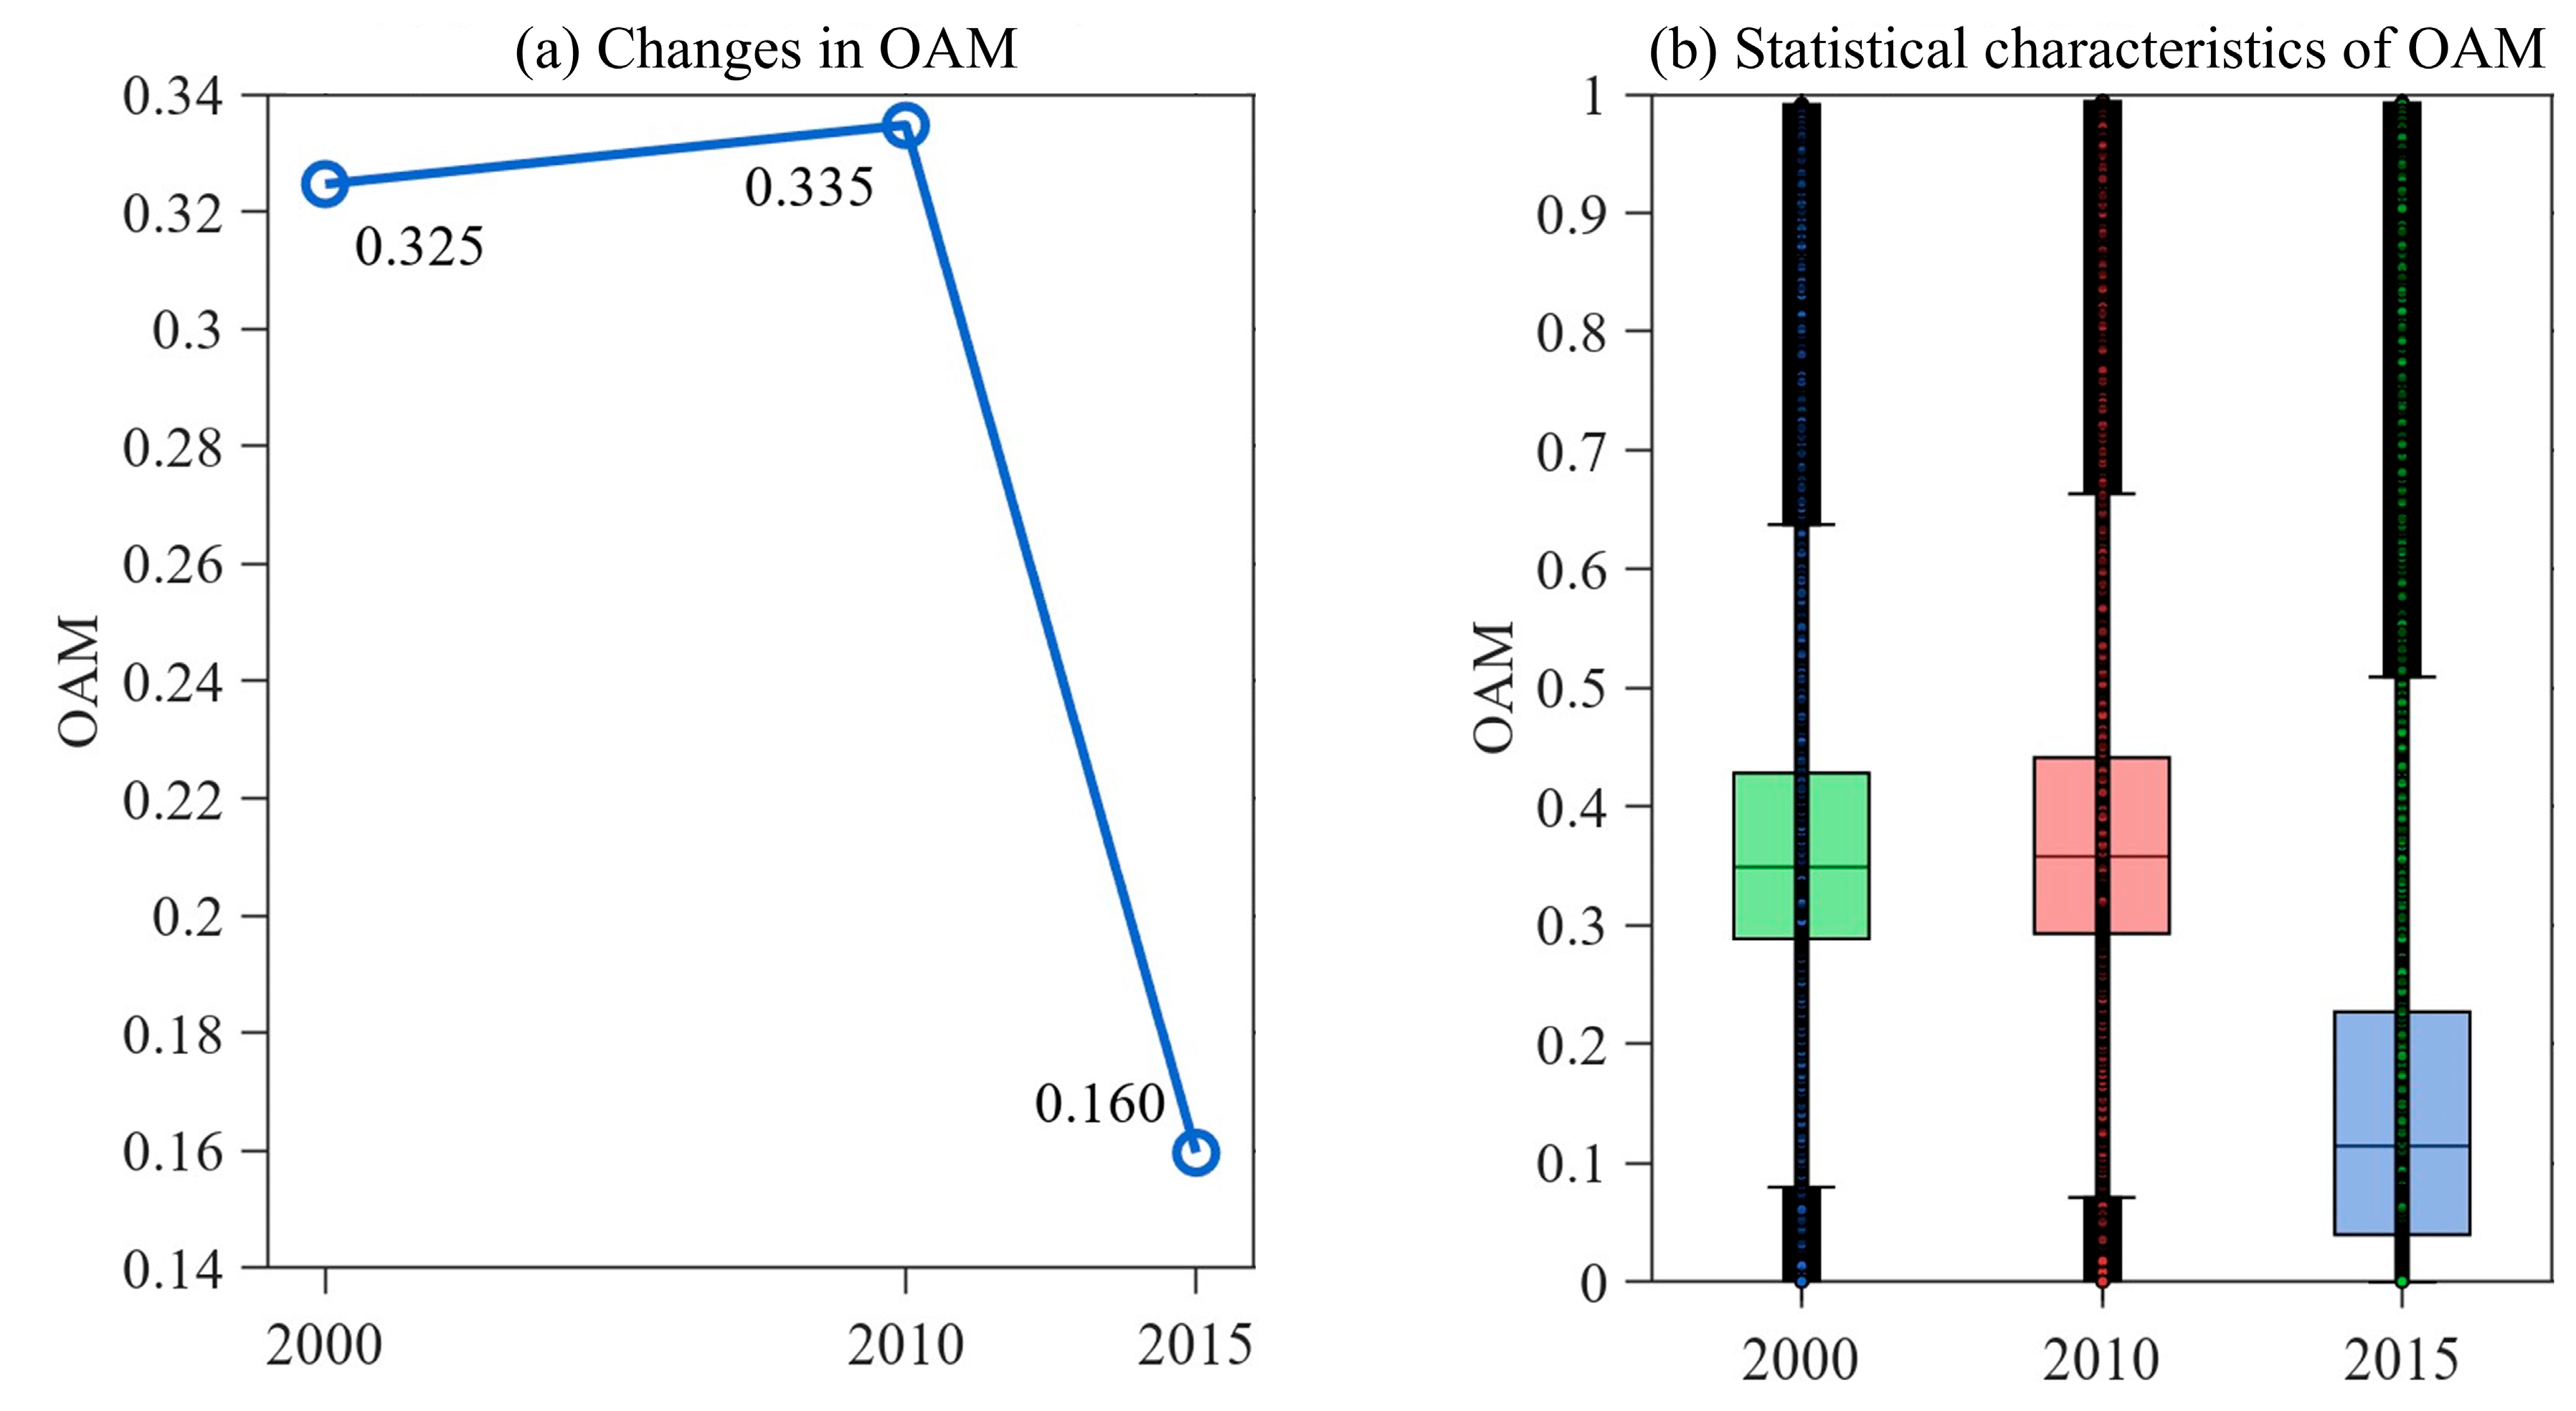
Figure 7a illustrates the interannual variation in OAM from 2000 to 2015, showing a distinct non-monotonic trend. The OAM value began at approximately 0.325 in the year 2000 and experienced a slight increase to about 0.335 by 2010. This was followed by a pronounced and sharp decline, with the value dropping to roughly 0.160 in 2015. This trajectory indicates a phase of relative stability and incremental growth in the first decade, which was subsequently overtaken by a significant and rapid decrease in the latter half of the study period.
The distribution of OAM values for the selected benchmark years (2000, 2010, 2015) is further detailed using box plots in Figure 7b. The box for the year 2000 (green) shows the highest central tendency and data spread. A decade later, the 2010 box (pink) indicates a similar median but a potentially different distribution shape compared to 2000. In stark contrast, the 2015 box (blue) is positioned markedly lower on the axis, reflecting a substantial decrease in both the median OAM value and the overall data range, confirming the drastic decline captured in the time series.

3.3. Impacts of Overall Anthropogenic Modification on Surface Soil Moisture

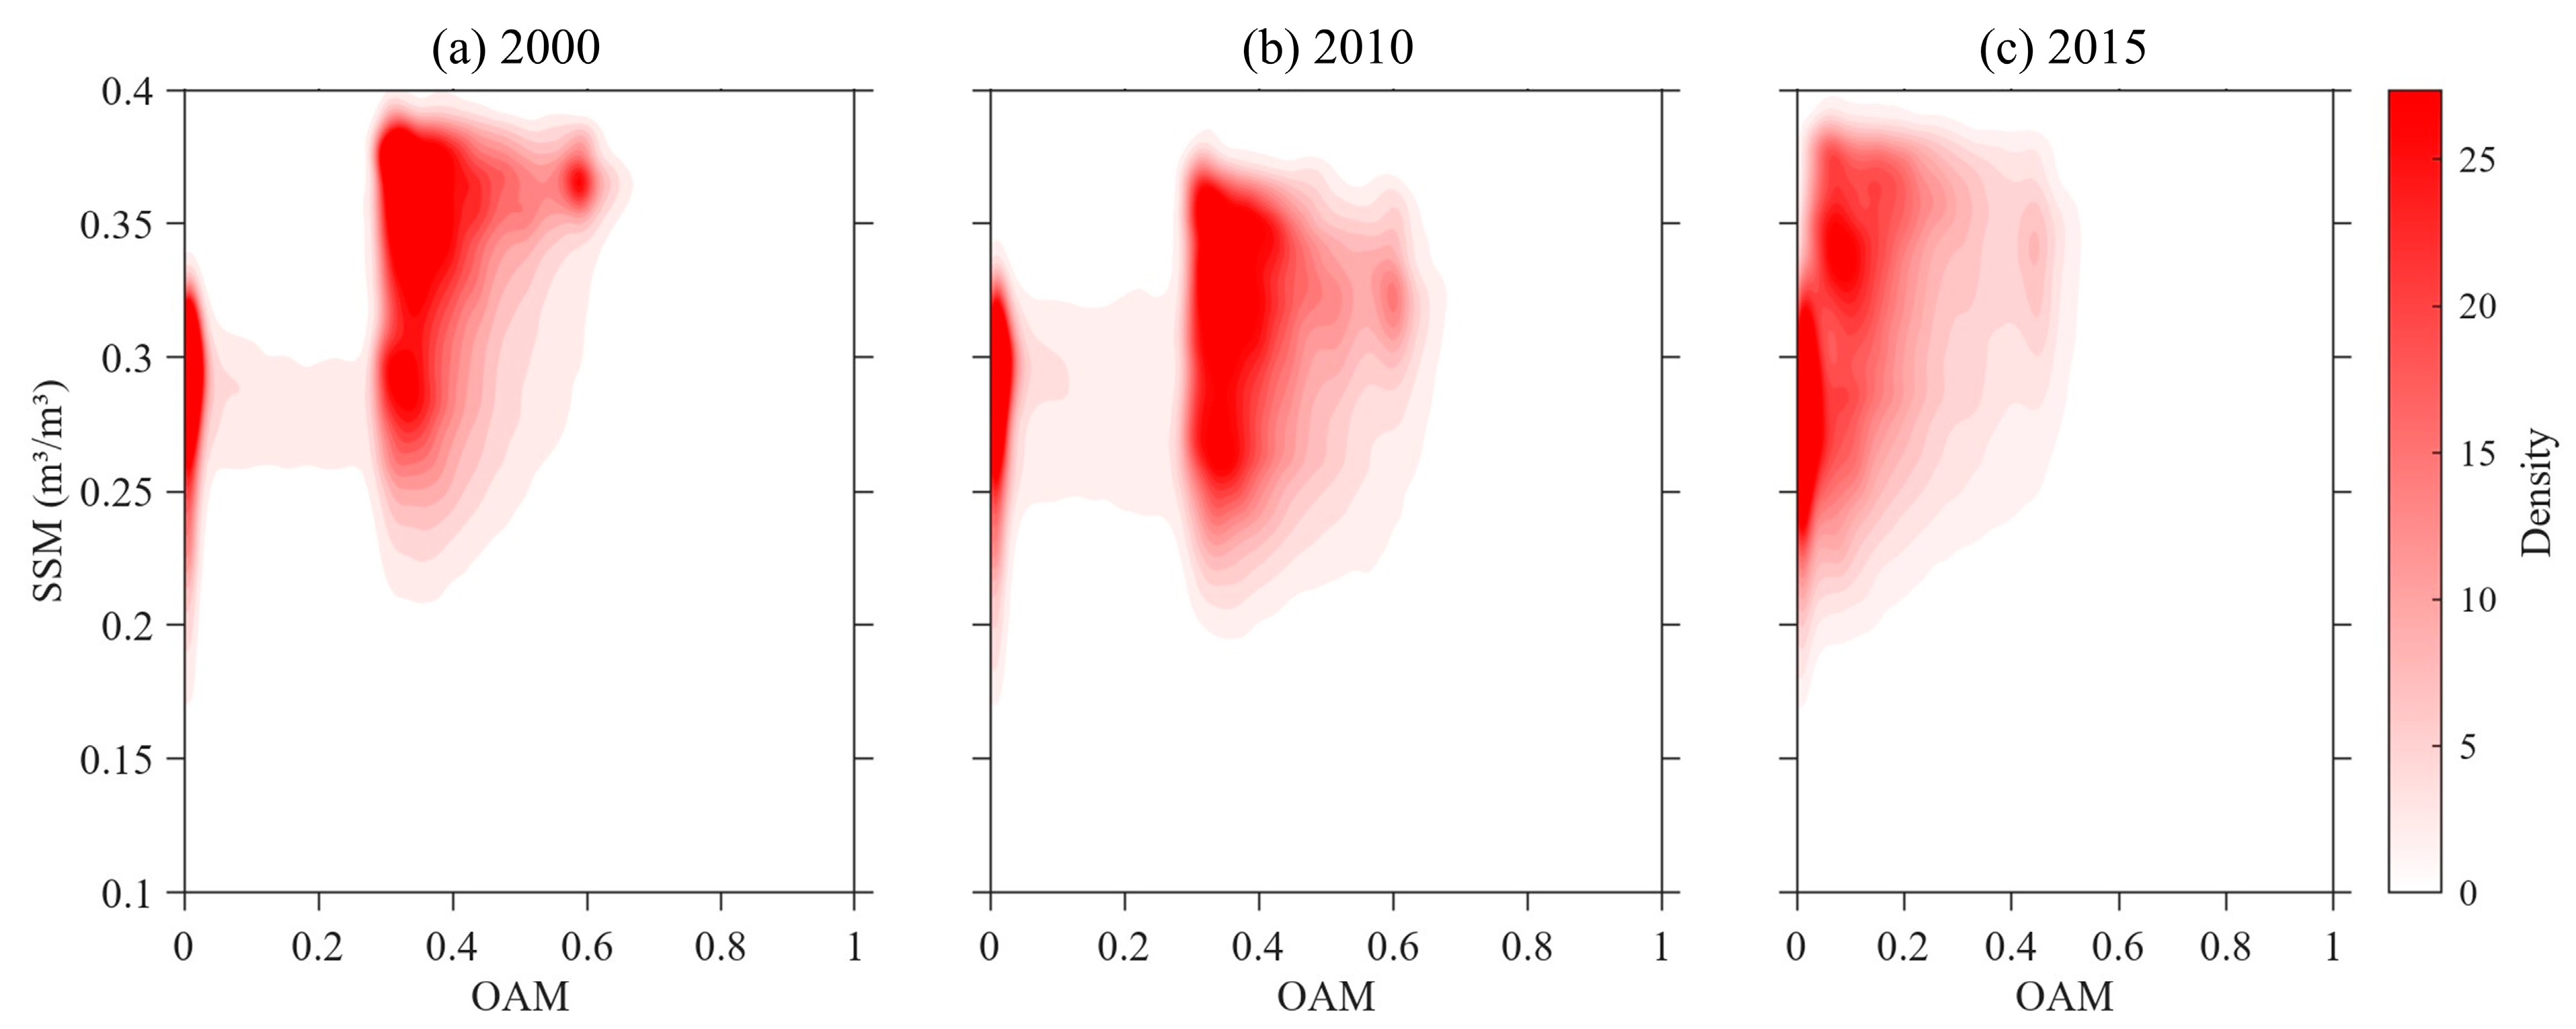
In Figure 8, the bivariate KDE plots for 2000, 2010 and 2015 provide the relationship between SSM and OAM. The KDE for 2000 (Figure 8a) shows a high-density core in the mid-range of both OAM (0.3–0.6) and SSM (0.25–0.40 m3/m3). By 2010 (Figure 8b), the high-density region shifts slightly toward higher OAM values and lower SSM values, indicating intensified human modification with smaller soil moisture. In contrast, Figure 8c shows the KDE for 2015, where the density of SSM and OAM values is concentrated along lower OAM (from 0 to 0.2) and a wider range of SSM values (ranging from 0.2 to 0.37 m3/m3), suggesting that anthropogenic modification has become more prevalent in areas with lower soil moisture. Meanwhile, this indicates that, during 2015, regions with lower anthropogenic modification were associated with different levels of SSM.
Figure 9 complements the kernel density analysis by summarizing the statistical distribution of SSM across five discrete OAM levels: Low (0–0.2), Med–Low (0.2–0.4), Medium (0.4–0.6), Med–High (0.6–0.8) and High (0.8–1.0). For three benchmark years, the median SSM increases consistently from Low to Medium OAM levels. Meanwhile, it shows not only a rise in central tendency but also a reduction in variance under higher human modification, suggesting a homogenizing effect (i.e., a reduction in spatial variability leading to more uniform conditions) of intense anthropogenic activities on SSM conditions. This pattern is persistent through all three benchmark years, though the increase in median SSM from Low to High OAM groups becomes less pronounced by 2015. Such a trend is consistent with previous studies attributing elevated soil moisture in highly modified areas to irrigation practices, impervious surface effects on runoff infiltration, and modified evapotranspiration regimes due to vegetation changes (e.g., [17,57,58,59,60,61,62]).
In summary, these results provide consistent and multi-faceted evidence that increasing anthropogenic modification is associated with elevated SSM levels and altered moisture distribution patterns. The kernel density plots show the temporal evolution and spatial concentration of OAM–SSM interactions, while the boxplots statistically validate the monotonic increase in SSM across OAM intensity categories. These findings also underscore the profound role of human activities in reshaping soil hydrological properties, supporting the need for sustainable land and water management strategies that account for anthropogenic impacts on the terrestrial water cycle.

3.4. Impacts of Detailed Anthropogenic Modification on Surface Soil Moisture

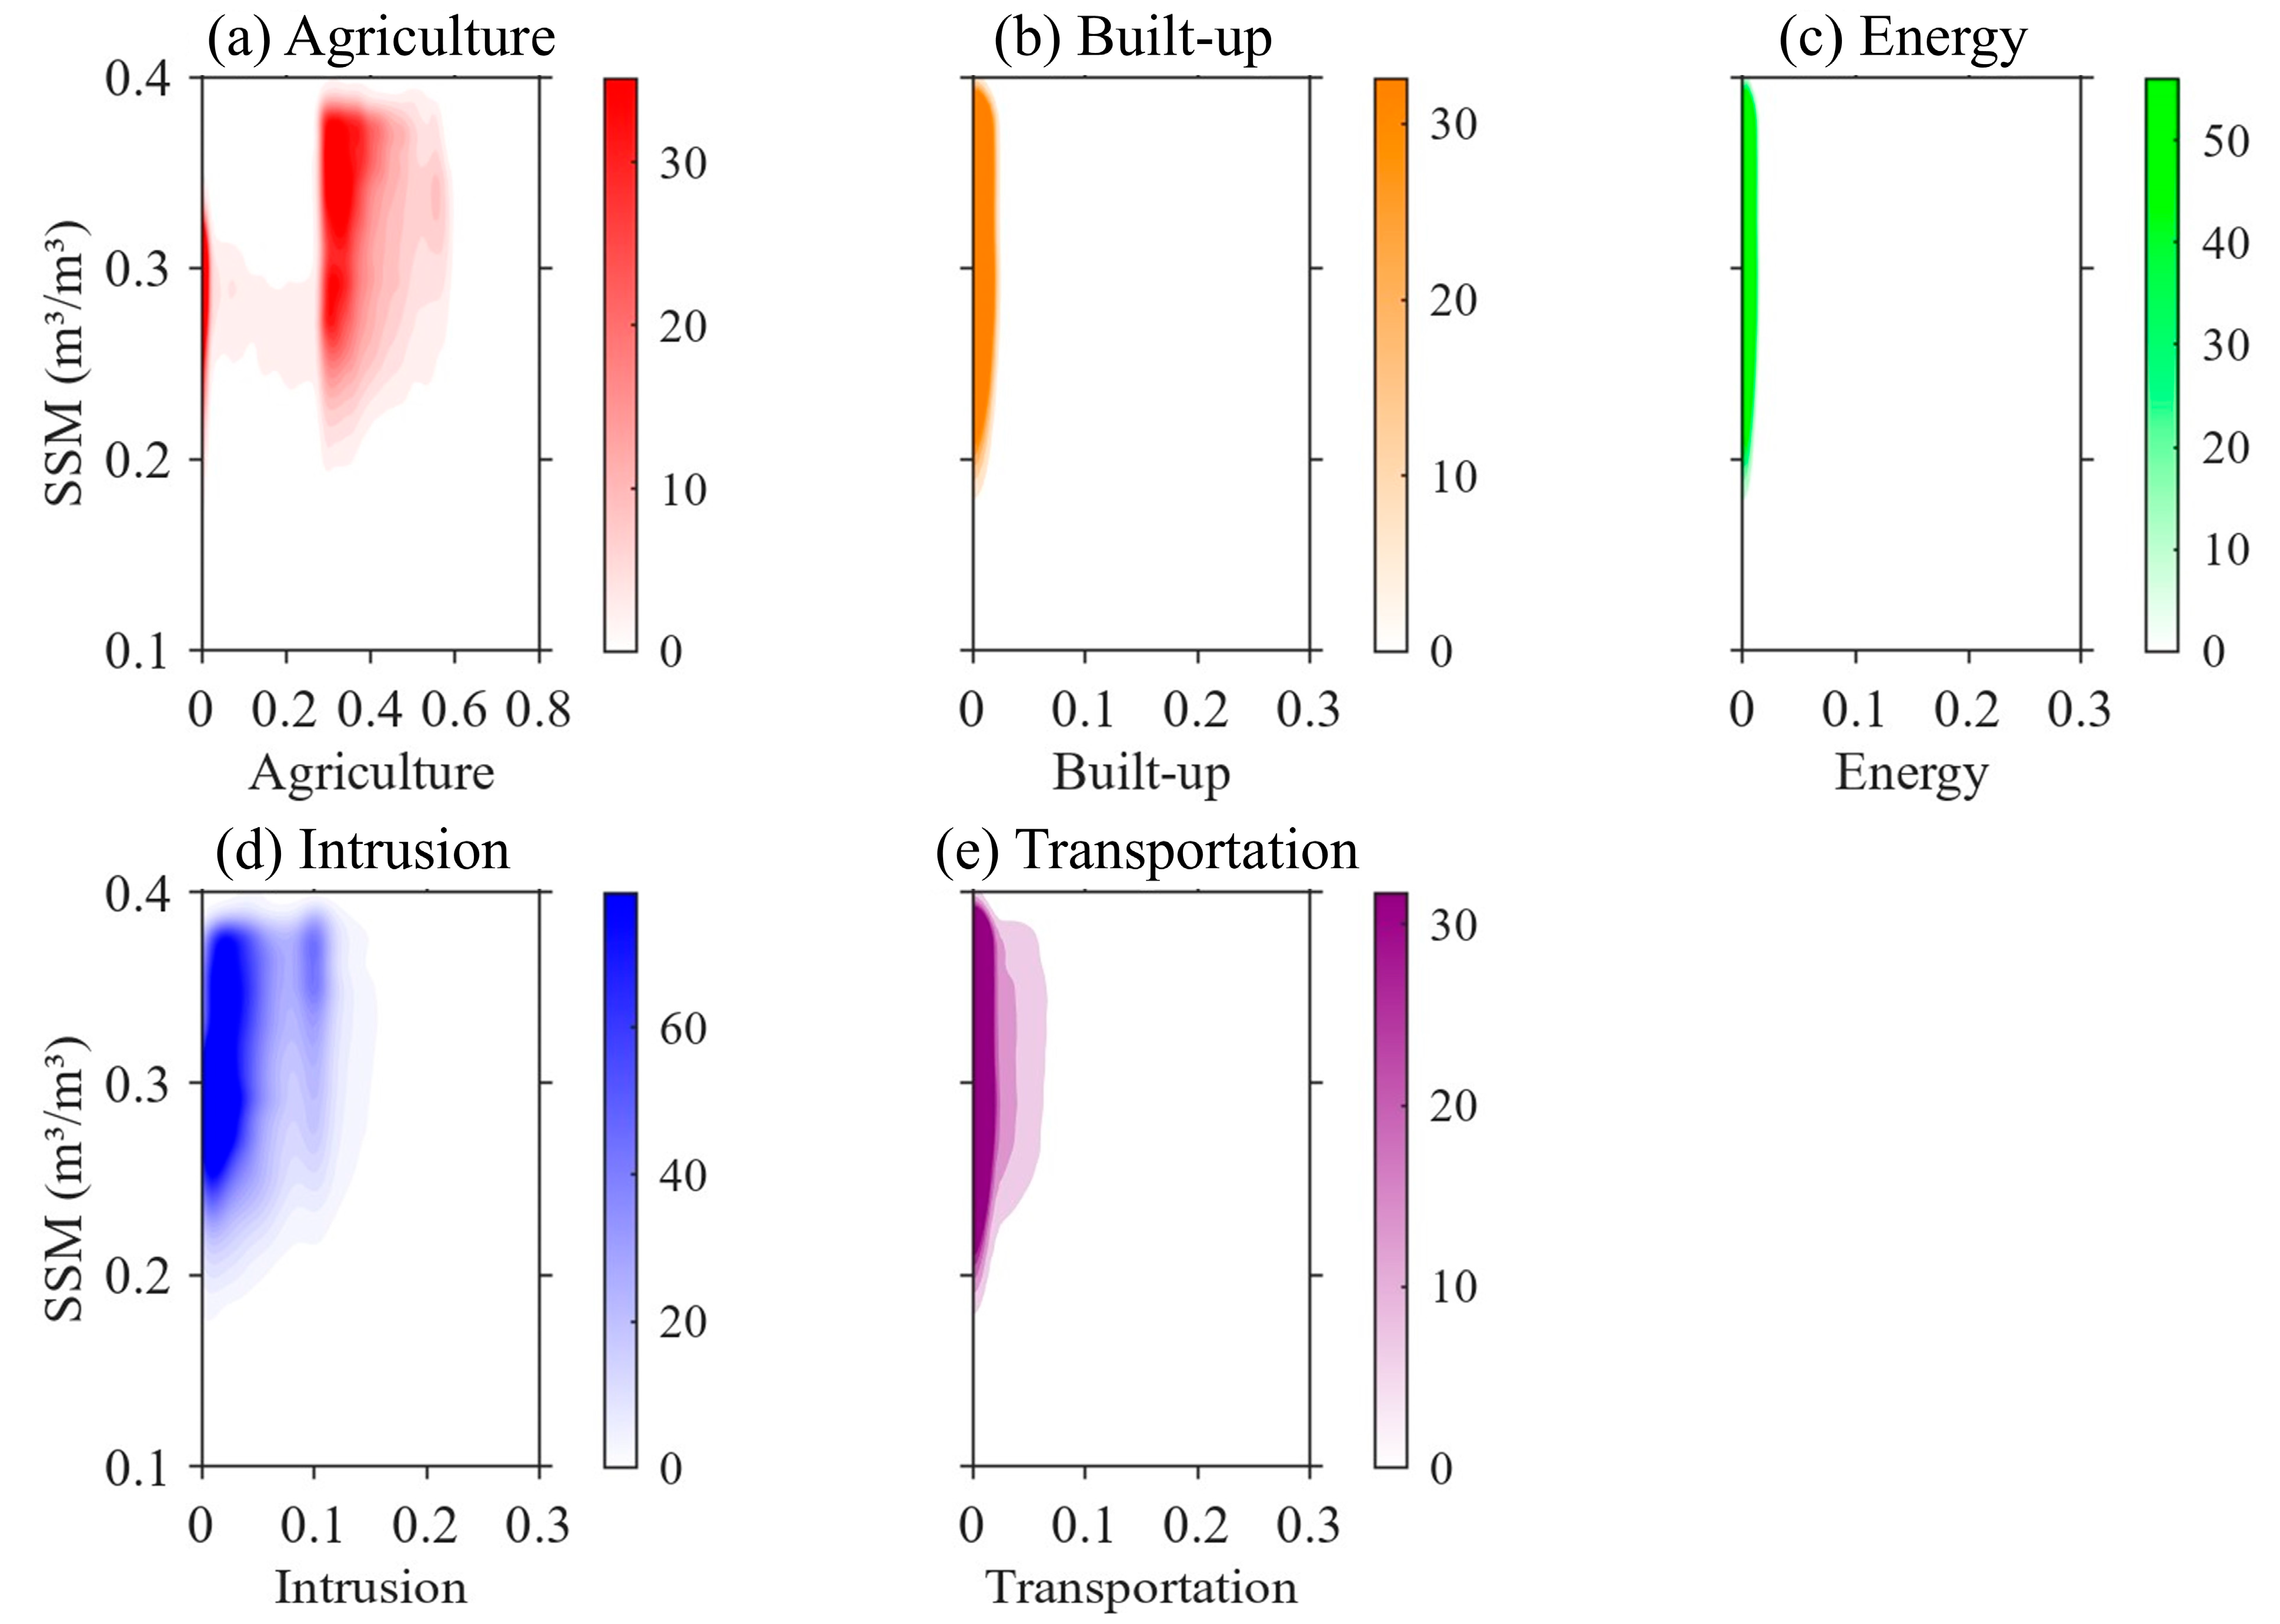
Figure 10 presents the kernel density estimates illustrating the bivariate relationship between SSM and five distinct anthropogenic modification factors across Southwest China in 2017. The kernel density plots reveal different patterns of interaction between SSM and each anthropogenic modification type. For agriculture, the density distribution shows a moderate positive correlation, with higher SSM values (0.25–0.35 m3/m3) concentrated in areas of medium anthropogenic influence (0.4–0.6) [57,63,64]. The observed peak in SSM at medium intensity levels likely reflects a threshold where supplemental irrigation and soil moisture retention practices begin to offset natural precipitation deficits, while soil structure and permeability remain relatively intact. Built-up areas exhibit a markedly different, highly concentrated and narrow pattern, indicative of the homogenizing effect of impervious surfaces [65,66]. Energy production areas also demonstrate a weak negative association, with higher density at lower anthropogenic modification intensities across most SSM values. Human intrusions exhibit a density peak at high SSM values (0.2–0.4 m3/m3) under low anthropogenic modification levels (0–0.1), suggesting a statistical association between minimal intrusion and soil moisture patterns, though this does not imply direct causation. The impact of Transportation is comparable to Built-up areas but exhibits its own unique concentration profile.
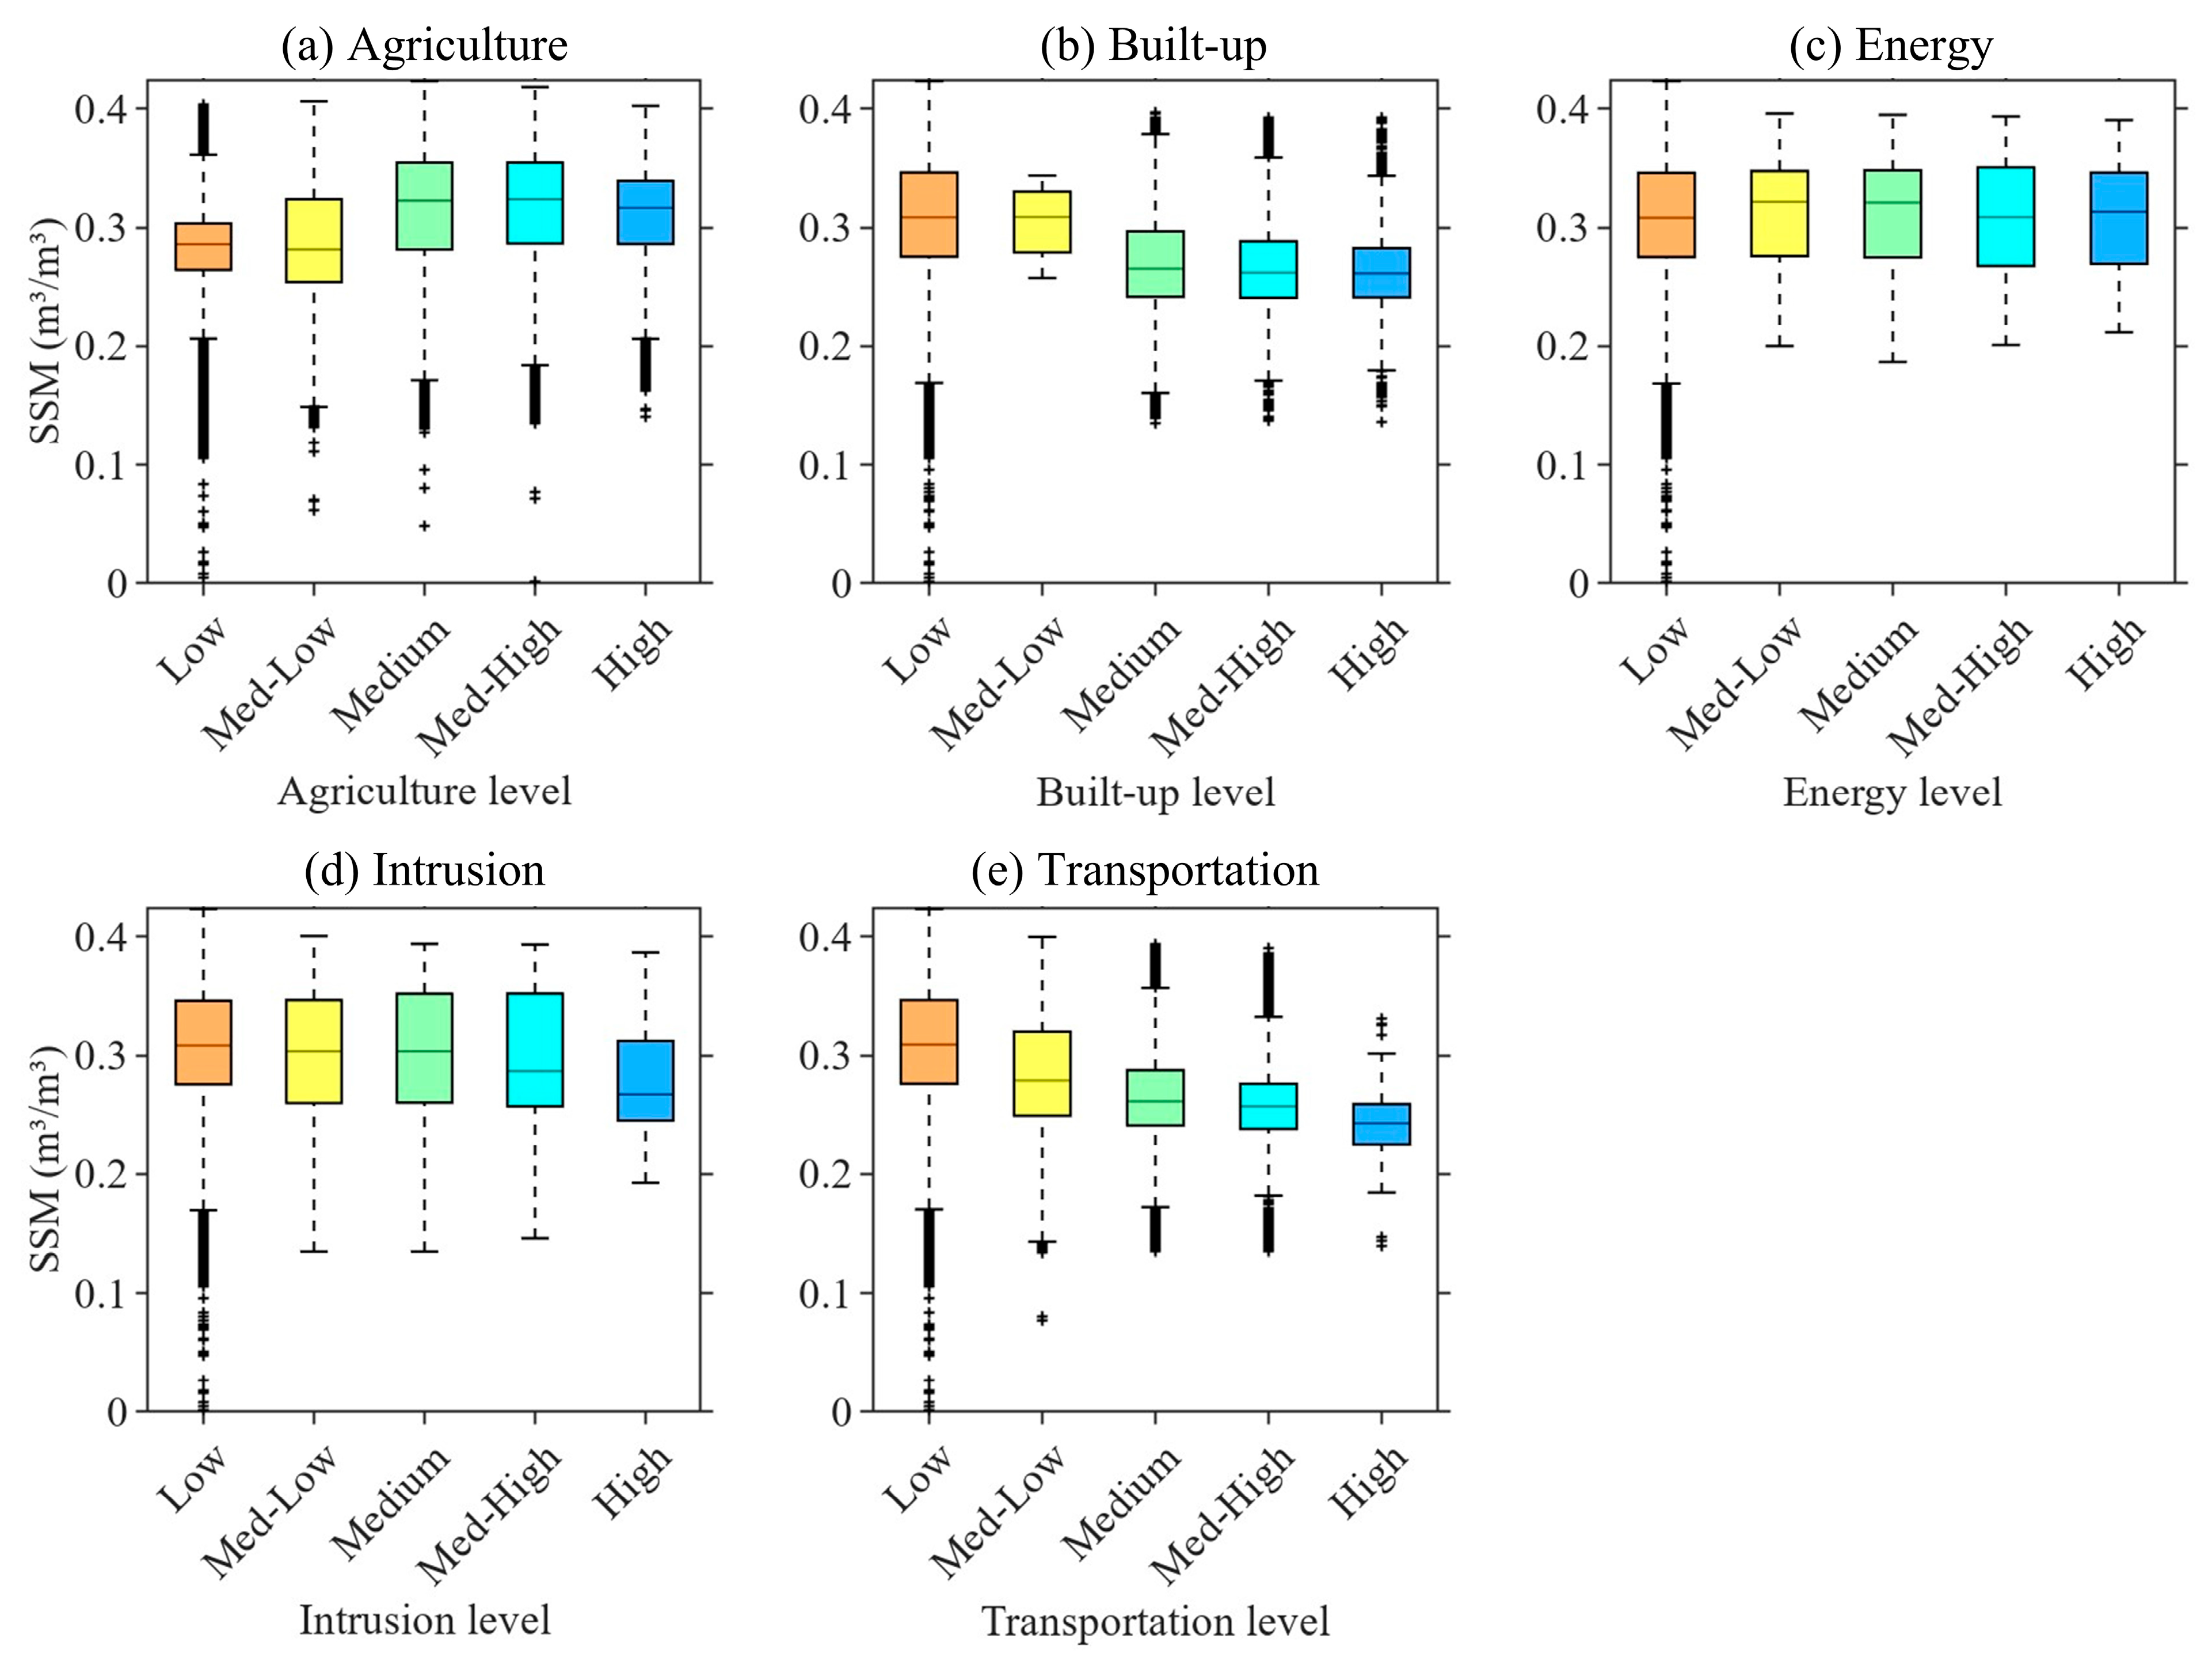
Meanwhile, Figure 11 complements this analysis through boxplot representations of SSM distribution across quantized anthropogenic modification levels for each stressor type. The boxplots validate and quantify the patterns observed in Figure 10, showing how SSM medians and variances shift across anthropogenic intensity gradients. Agriculture demonstrates a distinct pattern, with SSM peaking at medium to med–high anthropogenic modification levels, where the median reaches approximately 0.32 m3/m3. At higher modification levels, intensive tillage and repeated compaction may reduce infiltration capacity and increase evaporation through canopy-atmosphere coupling, leading to a decline or stabilization of SSM despite additional water input. Built-up areas show a pronounced reduction in SSM variability (Figure 11b). This homogenization effect is consistent with the hydrological behavior of urban surfaces, where impervious cover limits infiltration and engineered drainage systems rapidly redistribute water into channelized networks. In transitional urban landscapes, residual vegetation patches (such as urban green spaces and roadside belts) create mixed-pixel conditions, but as built-up intensity approaches saturation, land surface hydrological responses converge, suppressing spatial heterogeneity in soil moisture [26,66,67]. Energy-related modification shows limited influence on SSM variability, which may reflect the localized and spatially sparse nature of energy extraction and infrastructure footprints (Figure 11c). These sites typically occupy small fractions of surrounding grids, producing weak aggregate hydrological signals relative to dominant land surface processes. Intrusion activities (pollution, small-scale land system modification) generate modest but detectable SSM declines, suggesting that even low-level disturbances may alter surface permeability and soil characteristics, subtly influencing moisture retention without producing sharp structural discontinuities like those seen in transportation and urban categories (Figure 11d). Finally, transportation infrastructure exhibits a suppressive effect on SSM, with median values declining consistently across intensity levels (Figure 11e). This pattern may be associated with surface hydrological fragmentation. Transportation corridors could create linear barriers that disrupt shallow water movement, promote overland runoff concentration and reduce soil moisture replenishment in adjacent strips. Additionally, roadside compaction and drainage ditches further facilitate water export rather than infiltration, resulting in consistently lower SSM near transport networks even at moderate disturbance levels.
In summary, these results show that agricultural activities lead to a peak in median SSM (approximately 0.32 m3/m3) at medium-to-high intensity levels (0.4–0.8). Meanwhile, transportation infrastructure has a strong suppressive effect, with median SSM decreasing from 0.31 m3/m3 to 0.25 m3/m3 as modification intensity increases. Built-up areas are characterized by a significant reduction in SSM variability, while energy-related modifications show minimal influence. Intrusion activities are associated with a gradual decline in median SSM. These findings are similar previous studies on anthropogenic impacts on hydrologic cycles (e.g., [7,8,68,69]) and highlight the necessity of considering stressor-specific approaches in water resource management.

4. Discussion

4.1. Limitations

This study relies on two key global datasets, each with inherent limitations that should be considered when interpreting the results. The analysis based on the SSM data is subject to constraints stemming from the methodologies of gap-filling and spatial downscaling. The gap-filling procedure utilized ERA5 reanalysis data to address missing values in the original ESA-CCI product. While effective for creating a continuous dataset, this approach assumes that the temporal dynamics of ERA5 SSM are consistent with and can be accurately rescaled to match the satellite-based observations, which may not fully hold in regions with complex land–atmosphere interactions or significant biases in the reanalysis model. Furthermore, the spatial downscaling to a 1 km resolution was achieved using a Random Forest model driven by auxiliary variables such as NDVI, albedo and topography. The accuracy of the resulting high-resolution product is therefore contingent upon the precision and representativeness of these predictors, as well as the spatial and temporal density of the in situ observations from the International Soil Moisture Network (ISMN) used for model training and validation. The distribution of ISMN sites is uneven globally, potentially leading to varying performance of the downscaling algorithm across different biomes and geographic regions [46].
A further source of uncertainty is from the intrinsic retrieval errors and radiometric sensitivity limits in remote sensing derived SSM products. Although the SSM dataset shows good agreement with in situ observations globally, reported uncertainties with higher deviations in vegetated, topographically complex or anthropogenically altered landscapes [46]. This implies that the magnitude of some observed SSM variations, particularly in low-intensity modification zones, may fall within the uncertainty envelope of the product rather than representing true hydrological shifts. Therefore, while the spatial patterns are robust, the absolute magnitude of change should be interpreted cautiously, and future work should incorporate uncertainty quantification frameworks or ensemble satellite products to improve confidence in detected hydrological responses.
The anthropogenic modification dataset also presents certain limitations for temporal analysis. The dataset integrates multiple stressors, but the underlying source data for some components are not available annually, requiring interpolation or assumptions for the interannual layers (1990, 2000, 2010, 2015). For instance, the agricultural intensity is partially derived from the Global Land Systems dataset representing conditions circa 2005, which was weighted using time-varying land cover data to estimate change. This may not fully capture nonlinear shifts in agricultural practices within the intervals. It is important to note that the identified relationships between anthropogenic modification and surface soil moisture are based on correlative analysis. While these patterns suggest strong linkages, they do not imply direct causation, as the distribution of human activities is itself influenced by underlying environmental gradients. The mapping of certain stressors, such as mining and energy infrastructure, involves modeling their spatial influence using buffer zones or decay functions based on estimated average footprints. While methodologically robust, this approach inevitably simplifies the actual, highly variable on-the-ground extent of modification associated with each point or linear feature. Additionally, the assignment of intensity values to different stressor classes, though based on established literature, incorporates a degree of expert judgment that introduces subjectivity [47].
It should also be noted that the resampling of the OAM data from its native 300 m resolution to the 30 arc-second grid using nearest neighbor aggregation, while necessary for consistency with the SSM data, may reduce representativeness of very fine-scale linear stressors (e.g., narrow roads, power lines). This conservative approach was selected to preserve the original values as much as possible, though some loss of fine-scale fragmentation detail is inherent to the aggregation process. However, as the same aggregation method was applied uniformly across all years, the comparative analysis of temporal trends remains valid for the scale of investigation presented here.
A further limitation is the temporal mismatch in data variability. The SSM data provides continuous annual coverage from 2000 to 2020, while the anthropogenic modification data are available only as snapshots for specific years. The use of the 2017 static stressor data to represent conditions across the entire study period (2000–2017) may introduce uncertainty, as it may not fully capture the dynamic evolution of certain stressors, such as transportation networks or urban expansion, which likely changed significantly over time. Thus, the anthropogenic modification data are available as decadal integrations representing relatively stable, long-term human pressure. Meanwhile, SSM is high interannual variability driven primarily by climatic fluctuations. This could lead to an underestimation or misrepresentation of the true anthropogenic impacts in earlier years, particularly for linear infrastructures and rapidly developing areas. While our analysis focuses on broad, persistent patterns, the results should be interpreted with caution regarding the precise timing and magnitude of changes. Our correlation analysis between these datasets used single-year snapshots. A more statistically robust approach would be to correlate a static OAM snapshot against a long-term multi-year average of SSM, which would better represent the baseline hydrological condition and more effectively isolate the signal of human influence from climatic noise.
Lastly, a limitation of the bivariate kernel density employed in this study should be acknowledged. Spatial autocorrelation, where values at nearby locations are more similar than those farther apart, violates the assumption of independence underlying traditional statistical inference [70]. This can lead to an overestimation of the statistical significance and the apparent strength of the observed relationship between SSM and OAM. While our analysis effectively describes the overall covariation pattern, the potential influence of spatial non-independence suggests that the correlations should be interpreted primarily as descriptive rather than inferential [71,72]. Future research would benefit significantly from applying statistical methods designed to handle spatially dependent data. Techniques such as Geographically Weighted Regression or significance testing based on spatial bootstrapping, as rightly suggested by the reviewer, would provide a more robust framework for quantifying the relationship between soil moisture and human modification while controlling for spatial effects.

4.2. Implications for the Management of Surface Soil Moisture

The findings of this study provide spatially explicit insights for guiding the management of soil moisture resources in Southwest China. The persistent spatial heterogeneity of SSM, coupled with its significant correlation with OAM, shows the necessity for management strategies that are tailored to specific local conditions. The results indicate that areas with medium-to-high OAM levels consistently exhibit elevated and less variable SSM (Figure 9). While human activities such as irrigation and surface sealing contribute to this pattern in cultivated and urbanized zones [4,57,73], it should also be noted that regions with low OAM are predominantly located in high-elevation, low-fertility terrains that are unsuitable for agricultural use [74,75,76,77]. These topographic and edaphic constraints inherently limit anthropogenic modification and contribute to the lower and more variable SSM, consistent with findings reported in previous studies on elevation-controlled soil water and nutrient dynamics [74,75,76,77]. Therefore, water resources managers should explicitly consider these anthropogenic impacts, designating areas of intense human activity as critical zones for monitoring potential issues like waterlogging, secondary soil salinization due to excessive irrigation, and the impacts of impervious surfaces on natural infiltration [25,78,79].
Secondly, the distinct impacts of different anthropogenic stressors (revealed in Section 3.3 and Section 3.4) need targeted management measures. The strong positive relationship between agricultural modification and SSM highlights irrigation as a dominant control on soil moisture regimes in rural areas. This implies that water conservation efforts must focus on improving irrigation efficiency in agricultural planning to mitigate non-productive water loss and reduce pressure on regional water resources [17,57,80]. In contrast, the suppressive effect of transportation infrastructure and certain intrusion activities on median SSM (Figure 11d,e) suggests that soil and water conservation projects, such as the construction of infiltration basins or the restoration of vegetative cover along transportation corridors, are essential to counteract their drying effects and enhance groundwater recharge [81,82,83,84]. However, while transportation-related disturbance shows a suppressive effect on SSM (Figure 11e), deriving specific ecological engineering solutions such as corridor vegetation recovery requires further process-based validation.
Furthermore, the notable temporal dynamics shown in both SSM and OAM are highly relevant for adaptive management. The decline in OAM after 2010 (Figure 7a), partly linked to policy interventions like the environmental protection projects and Grain-for-Green Program of China [56], coincided with a gradual recovery of SSM post-2011 (Figure 5a). This suggests that large-scale ecological restoration policies may be effective in moderating human pressures and facilitating the recovery of soil hydrological conditions [29,85]. Moreover, the clear seasonal cycle of SSM, with peaks in summer and troughs in winter (Figure 5d), provides a natural template for management.
Finally, the integration of high-resolution SSM and OAM datasets, as demonstrated in this study, provides a powerful tool for proactive management. The ability to map and monitor the relationship between specific human activities and soil moisture conditions allows for predictive modeling and risk assessment. Planners can use such frameworks to simulate the hydrological impacts of proposed land-use changes, such as urban expansion or new infrastructure projects, before they are implemented. This evidence-based approach is crucial for achieving sustainable water resource management in a rapidly developing region like Southwest China, ensuring that economic development goals are balanced with the preservation of vital soil and water ecosystems.

5. Conclusions

This study presented a comprehensive geospatial analysis investigating the spatiotemporal dynamics of surface soil moisture (SSM) and its intricate relationships with various dimensions of anthropogenic modification (OAM) in Southwest China from 2000 to 2017. By integrating high-resolution SSM product with a detailed anthropogenic modification dataset, we employed multi-year statistical comparisons, bivariate kernel density estimation and boxplot analyses to quantify the impacts of human activities on regional soil hydrology. The main conclusions are as follows:
  • Our analysis revealed distinct spatiotemporal patterns for both variables. The SSM exhibited persistent spatial heterogeneity, with wetter conditions in the north and northwest and drier conditions in the southeast. Temporally, a slight long-term declining trend (Sen’s slope = −0.0009 m3/m3/year) was observed, characterized by a decrease until ~2011 followed by a gradual recovery. Concurrently, OAM showed a complex non-monotonic trend, intensifying and expanding until 2010 before undergoing a significant decline by 2015. This inverse trajectory post-2010 suggests that large-scale environmental policies, such as the environmental protection projects and Grain-for-Green Program, may have effectively mitigated human pressure, subsequently facilitating a recovery in regional soil moisture conditions.
  • More importantly, beyond mere co-variation, our findings uncover a systematic homogenizing effect whereby higher anthropogenic modification intensity corresponds to both elevated median SSM and a reduction in spatial moisture variability. Based on these correlations, we hypothesize that human modification may act as a structural forcing factor that reorganizes soil moisture distribution at the regional scale, though further research is needed to confirm this mechanistic link.
  • The differentiated response patterns across stressor types demonstrate that aggregated human footprint indices are insufficient to interpret hydrological impacts. Agricultural modification enhances SSM, while transportation and energy-related disturbances suppress soil moisture, and built-up land reduces spatial variance without a linear effect on median moisture levels.
Conceptually, in this study, we provide a transferable framework showing how high-resolution anthropogenic data, when paired with soil moisture data, can be used not only to detect correlations but to reveal structural hydrological signatures of human modification. This approach is applicable to other rapidly transforming landscapes worldwide and contributes to the development of generalized diagnostics for human–hydrology interactions.
Future work should focus on (1) integrating higher-resolution, more frequently updated ancillary data to improve the accuracy of both SSM and OAM products, reducing current dependency on interpolation and assumptions; (2) disentangling the individual and interactive effects of different anthropogenic pressures to better predict their compound impact on the water cycle; (3) incorporating spatial statistics, such as Geographically Weighted Regression, to better disentangle the relationship between soil moisture and human activities from the effects of spatial autocorrelation; (4) employing advanced integrated hydrological models, such as ParFlow/ParFlow-CLM [61,86,87], is essential to move beyond statistical correlations towards a mechanistic understanding. Coupling these process-based models with the patterns of human activity identified here would allow for more precise simulation of SSM dynamics under various land-use and climate change scenarios, ultimately enabling more robust and predictive water resource management strategies. Moreover, future studies should also refine the temporal alignment of analyses to better isolate anthropogenic effects. Specifically, comparing static snapshots of anthropogenic modification against long-term averages of SSM would help to mitigate the confounding influence of annual climatic variability and provide a clearer understanding of the persistent hydrological impacts of human pressure on the landscape.

Supplementary Materials

The following supporting information can be downloaded at: https://www.mdpi.com/article/10.3390/hydrology12110275/s1, Table S1: Data sources, descriptions, justifications for inclusion and preprocessing steps.

Author Contributions

Conceptualization, C.S. and Z.L.; methodology, C.S. and Z.L.; software, F.P.; validation, D.N.; formal analysis, C.S., C.Q., Z.Z. and Z.L.; investigation, C.Q., D.N. and Z.L.; resources, Z.L.; data curation, F.P., G.C. and J.H.; writing—original draft preparation, C.S.; writing—review and editing, Z.L., H.T. and S.M.; visualization, C.Q. and Z.L.; supervision, C.S. and Z.L.; project administration, Z.L. and S.M.; funding acquisition, C.S. and Z.L. All authors have read and agreed to the published version of the manuscript.

Funding

This research was funded by the National Natural Science Foundation of China (52069009), and Science and Technology Innovation Team for Integrated Management of Highland Rivers and Lakes in Intra-basin Water Diversion and Transfer Project of Yunnan Provincial Department of Education (202304003).

Data Availability Statement

All datasets utilized in this study are publicly available through the following repositories. Soil moisture data were sourced from the National Tibetan Plateau Data Center (https://doi.org/10.11888/RemoteSen.tpdc.272760). Human modification indices were derived from the dataset published on Zenodo (https://doi.org/10.5281/zenodo.3963013). Additional spatial data for mapping were obtained from the National Tibetan Plateau Science Data Center (https://data.tpdc.ac.cn/, accessed on 23 January 2025).

Acknowledgments

The authors would like to extend their gratitude to Jin Liu for his valuable assistance. Meanwhile, the authors would like to acknowledge the use of AI-assisted tools in the language preparation of this manuscript. Several sections in the initial draft were written by the authors in their native language (Chinese) and translated into English using DeepL (https://www.deepl.com/translator, accessed on 1 August 2025) and Youdao Translate (https://fanyi.youdao.com/, accessed on 1 August 2025). Subsequently, several English texts were polished for grammar, clarity and fluency using ChatGPT (OpenAI, https://openai.com/chatgpt, accessed on 1 August 2025) and Grammarly (https://www.grammarly.com/, accessed on 1 August 2025). The authors carefully reviewed and edited the results from all tools.

Conflicts of Interest

The authors declare no conflicts of interest.

References

  1. Van Niel, T.G.; McVicar, T.R.; Callow, J.N.; Moore, C.E.; Beringer, J.; Cai, D. Water or Energy Supply Driven Change in Moisture Availability Switches the Slope Direction between Shallow Soil Moisture and Actual Evapotranspiration: Interpretation within the Context of the Complementary Relationship. Water Resour. Res. 2025, 61, e2024WR039632. [Google Scholar] [CrossRef]
  2. McColl, K.A.; Alemohammad, S.H.; Akbar, R.; Konings, A.G.; Yueh, S.; Entekhabi, D. The Global Distribution and Dynamics of Surface Soil Moisture. Nat. Geosci. 2017, 10, 100–104. [Google Scholar] [CrossRef]
  3. Fu, Z.; Ciais, P.; Wigneron, J.-P.; Gentine, P.; Feldman, A.F.; Makowski, D.; Viovy, N.; Kemanian, A.R.; Goll, D.S.; Stoy, P.C.; et al. Global Critical Soil Moisture Thresholds of Plant Water Stress. Nat. Commun. 2024, 15, 4826. [Google Scholar] [CrossRef]
  4. Li, P.; Wang, Z.-H.; Wang, C. The Potential of Urban Irrigation for Counteracting Carbon-Climate Feedback. Nat. Commun. 2024, 15, 2437. [Google Scholar] [CrossRef]
  5. Vereecken, H.; Amelung, W.; Bauke, S.L.; Bogena, H.; Brüggemann, N.; Montzka, C.; Vanderborght, J.; Bechtold, M.; Blöschl, G.; Carminati, A.; et al. Soil Hydrology in the Earth System. Nat. Rev. Earth Environ. 2022, 3, 573–587. [Google Scholar] [CrossRef]
  6. Pataki, A.; Bertalan, L.; Pásztor, L.; Nagy, L.A.; Abriha, D.; Liang, S.; Singh, S.K.; Szabó, S. Soil Moisture Satellite Data under Scrutiny: Assessing Accuracy through Environmental Proxies and Extended Triple Collocation Analysis. Earth Syst. Environ. 2025, 9, 801–824. [Google Scholar] [CrossRef]
  7. Abbott, B.W.; Bishop, K.; Zarnetske, J.P.; Minaudo, C.; Chapin, F.S.; Krause, S.; Hannah, D.M.; Conner, L.; Ellison, D.; Godsey, S.E.; et al. Human Domination of the Global Water Cycle Absent from Depictions and Perceptions. Nat. Geosci. 2019, 12, 533–540. [Google Scholar] [CrossRef]
  8. Zhao, G.; Gao, H.; Li, Y.; Tang, Q.; Woolway, R.I.; Merder, J.; Rosa, L.; Michalak, A.M. Decoupling of Surface Water Storage from Precipitation in Global Drylands Due to Anthropogenic Activity. Nat. Water 2025, 3, 80–88. [Google Scholar] [CrossRef]
  9. Cheng, T.F.; Chen, D.; Wang, B.; Ou, T.; Lu, M. Human-Induced Warming Accelerates Local Evapotranspiration and Precipitation Recycling over the Tibetan Plateau. Commun. Earth Environ. 2024, 5, 388. [Google Scholar] [CrossRef]
  10. Wang, A.; Chen, Y.; Li, M.; Gao, Y.; Ma, X. A Review of Soil Moisture Data in China: Definitions, Sources, and Applications in Hydrometeorology Research. Bull. Am. Meteorol. Soc. 2025, 106, E1108–E1129. [Google Scholar] [CrossRef]
  11. Li, X.; Liu, F.; Ma, C.; Hou, J.; Zheng, D.; Ma, H.; Bai, Y.; Han, X.; Vereecken, H.; Yang, K.; et al. Land Data Assimilation: Harmonizing Theory and Data in Land Surface Process Studies. Rev. Geophys. 2024, 62, e2022RG000801. [Google Scholar] [CrossRef]
  12. Galelli, S.; Turner, S.W.D.; Pokhrel, Y.; Ng, J.Y.; Castelletti, A.; Bierkens, M.F.P.; Pianosi, F.; Biemans, H. Advancing the Representation of Human Actions in Large-Scale Hydrological Models: Challenges and Future Research Directions. Water Resour. Res. 2025, 61, e2024WR039486. [Google Scholar] [CrossRef]
  13. He, Y.; Mao, H.; Wang, C.; Hu, J.; Ninsawat, S.; Song, X.; Jing, G.; Li, R.; Wang, M.; Duan, Z. Advancing Hydrological Modeling through Multivariate Calibration of Multi-Layer Soil Moisture Dynamics. J. Hydrol. Reg. Stud. 2025, 57, 102125. [Google Scholar] [CrossRef]
  14. Beckage, B.; Moore, F.C.; Lacasse, K. Incorporating Human Behaviour into Earth System Modelling. Nat. Hum. Behav. 2022, 6, 1493–1502. [Google Scholar] [CrossRef]
  15. Wang, S.; Huang, S.; Wang, C.; Zhang, X.; Wu, J.; Gulakhmadov, A.; Niyogi, D.; Chen, N. Global Anthropogenic Effects on Meteorological—Hydrological—Soil Moisture Drought Propagation: Historical Analysis and Future Projection. J. Hydrol. 2025, 653, 132755. [Google Scholar] [CrossRef]
  16. Shah, D.; Shah, H.L.; Dave, H.M.; Mishra, V. Contrasting Influence of Human Activities on Agricultural and Hydrological Droughts in India. Sci. Total Environ. 2021, 774, 144959. [Google Scholar] [CrossRef]
  17. Lu, Z.; He, Y.; Peng, S.; Yang, X. Comprehensive Evaluation of Multisource Soil Moisture Products in a Managed Agricultural Region: An Integrated Hydrologic Modeling Approach. IEEE J. Sel. Top. Appl. Earth Obs. Remote Sens. 2023, 16, 1–17. [Google Scholar] [CrossRef]
  18. Sehgal, V.; Mohanty, B.P.; Reichle, R.H. Rootzone Soil Moisture Dynamics Using Terrestrial Water–energy Coupling. Geophys. Res. Lett. 2024, 51, e2024GL110342. [Google Scholar] [CrossRef]
  19. Liu, Y.; Yang, Y.; Song, J. Variations in Global Soil Moisture during the Past Decades: Climate or Human Causes? Water Resour. Res. 2023, 59, e2023WR034915. [Google Scholar] [CrossRef]
  20. Zhang, E.; Liu, Y.; Pan, T.; Tan, Q.; Ma, Z. Evaluating the Effects of Climate Change and Human Activities on the Seasonal Trends and Spatial Heterogeneity of Soil Moisture. Remote Sens. 2022, 14, 4862. [Google Scholar] [CrossRef]
  21. Gu, X.; Zhang, Q.; Li, J.; Singh, V.P.; Liu, J.; Sun, P.; Cheng, C. Attribution of Global Soil Moisture Drying to Human Activities: A Quantitative Viewpoint. Geophys. Res. Lett. 2019, 46, 2573–2582. [Google Scholar] [CrossRef]
  22. Zhang, K.; Li, X.; Zheng, D.; Zhang, L.; Zhu, G. Estimation of Global Irrigation Water Use by the Integration of Multiple Satellite Observations. Water Resour. Res. 2022, 58, e2021WR030031. [Google Scholar] [CrossRef]
  23. Rahmani, J.; Danesh-Yazdi, M. Quantifying the Impacts of Agricultural Alteration and Climate Change on the Water Cycle Dynamics in a Headwater Catchment of Lake Urmia Basin. Agric. Water Manag. 2022, 270, 107749. [Google Scholar] [CrossRef]
  24. Liu, Z.; He, Y.; Liu, W.; Luo, H.; Gao, H. Groundwater Infiltration Inverse Estimation in Urban Sewers Network: A Two-Stage Simulation-Optimization Model. Sustain. Cities Soc. 2025, 121, 106205. [Google Scholar] [CrossRef]
  25. Zeydalinejad, N.; Javadi, A.A.; Baldock, D.; Webber, J.L. An Integrated Hydrological-Hydrogeological Model for Analysing Spatio-Temporal Probability of Groundwater Infiltration in Urban Infrastructure. Sustain. Cities Soc. 2024, 116, 105891. [Google Scholar] [CrossRef]
  26. Dutta, J.; Choudhury, R.; Nath, B. Quantification of Urban Groundwater Recharge: A Case Study of Rapidly Urbanizing Guwahati City, India. Urban Sci. 2024, 8, 187. [Google Scholar] [CrossRef]
  27. LaBianca, A.; Mortensen, M.H.; Sandersen, P.; Sonnenborg, T.O.; Jensen, K.H.; Kidmose, J. Impact of Urban Geology on Model Simulations of Shallow Groundwater Levels and Flow Paths. Hydrol. Earth Syst. Sci. 2023, 27, 1645–1666. [Google Scholar] [CrossRef]
  28. Shen, X.; Niu, L.; Jia, X.; Yang, T.; Hu, W.; Wu, C.; Chu, J.; Biswas, A.; Shao, M. Disentangling Ecological Restoration’s Impact on Terrestrial Water Storage. Geophys. Res. Lett. 2025, 52, e2024GL111669. [Google Scholar] [CrossRef]
  29. Fu, F.; Wang, S.; Wu, X.; Wei, F.; Chen, P.; Grünzweig, J.M. Locating Hydrologically Unsustainable Areas for Supporting Ecological Restoration in China’s Drylands. Earth’s Future 2024, 12, e2023EF004216. [Google Scholar] [CrossRef]
  30. Zhou, Y.; Dong, J.; Cui, Y.; Zhao, M.; Wang, X.; Tang, Q.; Zhang, Y.; Zhou, S.; Metternicht, G.; Zou, Z.; et al. Ecological Restoration Exacerbates the Agriculture-Induced Water Crisis in North China Region. Agric. For. Meteorol. 2023, 331, 109341. [Google Scholar] [CrossRef]
  31. Rouzegari, N.; Bolboli Zadeh, M.; Jimenez Arellano, C.; Afzali Gorooh, V.; Nguyen, P.; Meng, H.; Ferraro, R.R.; Kalluri, S.; Sorooshian, S.; Hsu, K. Passive Microwave Imagers, Their Applications, and Benefits: A Review. Remote Sens. 2025, 17, 1654. [Google Scholar] [CrossRef]
  32. Kennedy, C.M.; Oakleaf, J.R.; Theobald, D.M.; Baruch-Mordo, S.; Kiesecker, J. Managing the Middle: A Shift in Conservation Priorities Based on the Global Human Modification Gradient. Glob. Change Biol. 2019, 25, 811–826. [Google Scholar] [CrossRef] [PubMed]
  33. Mu, H.; Li, X.; Wen, Y.; Huang, J.; Du, P.; Su, W.; Miao, S.; Geng, M. A Global Record of Annual Terrestrial Human Footprint Dataset from 2000 to 2018. Sci. Data 2022, 9, 176. [Google Scholar] [CrossRef] [PubMed]
  34. Shi, P.; Sun, S.; Wang, M.; Li, N.; Wang, J.; Jin, Y.; Gu, X.; Yin, W. Climate Change Regionalization in China (1961–2010). Sci. China Earth Sci. 2014, 57, 2676–2689. [Google Scholar] [CrossRef]
  35. Ma, Z.-F.; Liu, J.; Zhang, S.-Q.; Chen, W.-X.; Yang, S.-Q. Observed Climate Changes in Southwest China during 1961–2010. Adv. Clim. Change Res. 2013, 4, 30–40. [Google Scholar] [CrossRef]
  36. Cai, D.; Tao, L.; Yang, X.-Q.; Sang, X.; Fang, J.; Sun, X.; Wang, W.; Yan, H. A Climate Perspective of the Quasi-Stationary Front in Southwestern China: Structure, Variation and Impact. Clim. Dyn. 2022, 59, 547–560. [Google Scholar] [CrossRef]
  37. Ma, Z.-F.; Liu, J.; Yang, S.-Q. Climate Change in Southwest China during 1961–2010: Impacts and Adaptation. Adv. Clim. Change Res. 2013, 4, 223–229. [Google Scholar] [CrossRef]
  38. Liu, H.; Zhang, M.; Lin, Z.; Xu, X. Spatial Heterogeneity of the Relationship between Vegetation Dynamics and Climate Change and Their Driving Forces at Multiple Time Scales in Southwest China. Agric. For. Meteorol. 2018, 256–257, 10–21. [Google Scholar] [CrossRef]
  39. Wang, Z.; Chen, W.; Piao, J.; Cai, Q.; Chen, S.; Xue, X.; Ma, T. Synergistic Effects of High Atmospheric and Soil Dryness on Record-Breaking Decreases in Vegetation Productivity over Southwest China in 2023. npj Clim. Atmos. Sci. 2025, 8, 6. [Google Scholar] [CrossRef]
  40. Liu, K.; Li, X.; Long, X. Trends in Groundwater Changes Driven by Precipitation and Anthropogenic Activities on the Southeast Side of the Hu Line. Environ. Res. Lett. 2021, 16, 94032. [Google Scholar] [CrossRef]
  41. Lu, Z.; Chai, L.; Liu, S.; Cui, H.; Zhang, Y.; Jiang, L.; Jin, R.; Xu, Z. Estimating Time Series Soil Moisture by Applying Recurrent Nonlinear Autoregressive Neural Networks to Passive Microwave Data over the Heihe River Basin, China. Remote Sens. 2017, 9, 574. [Google Scholar] [CrossRef]
  42. Munguía, M.; Trejo, I.; González-Salazar, C.; Pérez-Maqueo, O. Human Impact Gradient on Mammalian Biodiversity. Glob. Ecol. Conserv. 2016, 6, 79–92. [Google Scholar] [CrossRef]
  43. Tukiainen, H.; Alahuhta, J.; Field, R.; Ala-Hulkko, T.; Lampinen, R.; Hjort, J. Spatial Relationship between Biodiversity and Geodiversity across a Gradient of Land-Use Intensity in High-Latitude Landscapes. Landsc. Ecol. 2017, 32, 1049–1063. [Google Scholar] [CrossRef]
  44. Wang, X.; Liu, G.; Xiang, A.; Xiao, S.; Lin, D.; Lin, Y.; Lu, Y. Terrain Gradient Response of Landscape Ecological Environment to Land Use and Land Cover Change in the Hilly Watershed in South China. Ecol. Indic. 2023, 146, 109797. [Google Scholar] [CrossRef]
  45. Zhang, X.; Yu, J.; Feng, H.; Yao, L.; Li, X.; Du, H.; Liu, Y. Landscape Ecological Risk and Drivers of Land-Use Transition under the Perspective of Differences in Topographic Gradient. Land 2024, 13, 876. [Google Scholar] [CrossRef]
  46. Zheng, C.; Jia, L.; Zhao, T. A 21-Year Dataset (2000–2020) of Gap-Free Global Daily Surface Soil Moisture at 1-Km Grid Resolution. Sci. Data 2023, 10, 139. [Google Scholar] [CrossRef]
  47. Theobald, D.M.; Kennedy, C.; Chen, B.; Oakleaf, J.; Baruch-Mordo, S.; Kiesecker, J. Earth Transformed: Detailed Mapping of Global Human Modification from 1990 to 2017. Earth Syst. Sci. Data 2020, 12, 1953–1972. [Google Scholar] [CrossRef]
  48. Sen, P.K. Estimates of the Regression Coefficient Based on Kendall’s Tau. J. Am. Stat. Assoc. 1968, 63, 1379–1389. [Google Scholar] [CrossRef]
  49. Akritas, M.G.; Murphy, S.A.; Lavalley, M.P. The Theil-Sen Estimator with Doubly Censored Data and Applications to Astronomy. J. Am. Stat. Assoc. 1995, 90, 170–177. [Google Scholar] [CrossRef]
  50. Fernandes, R.; Leblanc, S.G. Parametric (Modified Least Squares) and Non-Parametric (Theil–Sen) Linear Regressions for Predicting Biophysical Parameters in the Presence of Measurement Errors. Remote Sens. Environ. 2005, 95, 303–316. [Google Scholar] [CrossRef]
  51. Zheng, J.; Zhao, T.; Lü, H.; Shi, J.; Cosh, M.H.; Ji, D.; Jiang, L.; Cui, Q.; Lu, H.; Yang, K.; et al. Assessment of 24 Soil Moisture Datasets Using a New in Situ Network in the Shandian River Basin of China. Remote Sens. Environ. 2022, 271, 112891. [Google Scholar] [CrossRef]
  52. Hu, Z.; Chai, L.; Crow, W.T.; Liu, S.; Zhu, Z.; Zhou, J.; Qu, Y.; Liu, J.; Yang, S.; Lu, Z. Applying a Wavelet Transform Technique to Optimize General Fitting Models for SM Analysis: A Case Study in Downscaling over the Qinghai–Tibet Plateau. Remote Sens. 2022, 14, 3063. [Google Scholar] [CrossRef]
  53. Lavagnini, I.; Badocco, D.; Pastore, P.; Magno, F. Theil–Sen Nonparametric Regression Technique on Univariate Calibration, Inverse Regression and Detection Limits. Talanta 2011, 87, 180–188. [Google Scholar] [CrossRef]
  54. Mehboob, M.S.; Kim, Y. Impact of Climate Change on the Hydrological Projections over a Western Himalayan River Basin and the Associated Uncertainties. J. Hydrol. 2024, 628, 130460. [Google Scholar] [CrossRef]
  55. Lu, Z.; Chai, L.; Ye, Q.; Zhang, T. Reconstruction of Time-Series Soil Moisture from AMSR2 and SMOS Data by Using Recurrent Nonlinear Autoregressive Neural Networks. In Proceedings of the 2015 IEEE International Geoscience and Remote Sensing Symposium (IGARSS), Milan, Italy, 26–31 July 2015; IEEE: Piscataway, NJ, USA, 2015; pp. 980–983. [Google Scholar]
  56. Ma, L.; Ma, J.; Yan, P.; Tian, F.; Peñuelas, J.; Rao, M.P.; Fu, Y.; Hu, Z. Planted Forests in China Have Higher Drought Risk than Natural Forests. Glob. Change Biol. 2025, 31, e70055. [Google Scholar] [CrossRef]
  57. Lu, Z.; Peng, S.; Wu, T.; Lei, J.; Wei, J.; Yang, X. Effects of Irrigation and Canal Networks on Groundwater–Land Surface Interactions in the Middle Heihe River Basin, China. J. Hydrol. Reg. Stud. 2025, 60, 102532. [Google Scholar] [CrossRef]
  58. Ferguson, I.M.; Maxwell, R.M. Hydrologic and Land–Energy Feedbacks of Agricultural Water Management Practices. Environ. Res. Lett. 2011, 6, 014006. [Google Scholar] [CrossRef]
  59. Ferguson, I.M.; Maxwell, R.M. Human Impacts on Terrestrial Hydrology: Climate Change versus Pumping and Irrigation. Environ. Res. Lett. 2012, 7, 044022. [Google Scholar] [CrossRef]
  60. Condon, L.E.; Maxwell, R.M. Groundwater-Fed Irrigation Impacts Spatially Distributed Temporal Scaling Behavior of the Natural System: A Spatio-Temporal Framework for Understanding Water Management Impacts. Environ. Res. Lett. 2014, 9, 034009. [Google Scholar] [CrossRef]
  61. Maxwell, R.M.; Condon, L.E. Connections between Groundwater Flow and Transpiration Partitioning. Science 2016, 353, 377–380. [Google Scholar] [CrossRef]
  62. O’Neill, M.M.F.; Tijerina, D.T.; Condon, L.E.; Maxwell, R.M. Assessment of the ParFlow–CLM CONUS 1.0 Integrated Hydrologic Model: Evaluation of Hyper-Resolution Water Balance Components across the Contiguous United States. Geosci. Model Dev. 2021, 14, 7223–7254. [Google Scholar] [CrossRef]
  63. Zhang, F.; Cui, N.; Guo, S.; Yue, Q.; Jiang, S.; Zhu, B.; Yu, X. Irrigation Strategy Optimization in Irrigation Districts with Seasonal Agricultural Drought in Southwest China: A Copula-Based Stochastic Multiobjective Approach. Agric. Water Manag. 2023, 282, 108293. [Google Scholar] [CrossRef]
  64. Shu, X.; Xu, L.; Yang, M.; Qin, Z.; Zhang, Q.; Zhang, L. Spatial Distribution Characteristics and Migration of Microplastics in Surface Water, Groundwater and Sediment in Karst Areas: The Case of Yulong River in Guilin, Southwest China. Sci. Total Environ. 2023, 868, 161578. [Google Scholar] [CrossRef] [PubMed]
  65. Xu, G.; Jiao, L.; Liu, J.; Shi, Z.; Zeng, C.; Liu, Y. Understanding Urban Expansion Combining Macro Patterns and Micro Dynamics in Three Southeast Asian Megacities. Sci. Total Environ. 2019, 660, 375–383. [Google Scholar] [CrossRef]
  66. Li, C.; Su, X.; Fan, C.; Han, H. Quantifying Residential Cooling Poverty and Its Drivers in China (2001–2020): Insights from Multiple Restrictive Behaviors of Accessing Air Conditioning. Cities 2025, 166, 106262. [Google Scholar] [CrossRef]
  67. Guo, C.; Qiao, R.; Wu, Z.; Jiang, Y.; Yang, Y.; Yu, Z.; Wan, W.; Sun, X. Heterogeneous Residential Location Effects: Variations in How Suburban Communities Shape Older Adults’ Active Travel—A Case Study from Xiamen. Cities 2025, 160, 105789. [Google Scholar] [CrossRef]
  68. Boulton, C.A.; Lenton, T.M.; Boers, N. Reply to: Little Evidence That Amazonian Rainforests Are Approaching a Tipping Point. Nat. Clim. Change 2023, 13, 1321–1323. [Google Scholar] [CrossRef]
  69. Fang, P.; Wang, T.; Yang, D.; Tang, L.; Yang, Y. Substantial Increases in Compound Climate Extremes and Associated Socio-Economic Exposure across China under Future Climate Change. npj Clim. Atmos. Sci. 2025, 8, 17. [Google Scholar] [CrossRef]
  70. Ord, J.K.; Getis, A. Local Spatial Autocorrelation Statistics: Distributional Issues and an Application. Geogr. Anal. 1995, 27, 286–306. [Google Scholar] [CrossRef]
  71. Jalili, S.; Hamidi, S.A.; Ghanbari, R.N. Climate Variability and Anthropogenic Effects on Lake Urmia Water Level Fluctuations, Northwestern Iran. Hydrol. Sci. J. 2016, 61, 1759–1769. [Google Scholar] [CrossRef]
  72. Blaschke, L.L.; Nian, D.; Bathiany, S.; Ben-Yami, M.; Smith, T.; Boulton, C.A.; Boers, N. Spatial Correlation Increase in Single–sensor Satellite Data Reveals Loss of Amazon Rainforest Resilience. Earth’s Future 2024, 12, e2023EF004040. [Google Scholar] [CrossRef]
  73. Liu, S.; Tong, Z.; Liu, Y.; Chen, H.; Liu, Y. What Is the Quality of Urban Expansion under Different Expansion Patterns? A Study of Chinese Cities. Cities 2026, 168, 106409. [Google Scholar] [CrossRef]
  74. Zhang, S.; Zhang, X.; Huffman, T.; Liu, X.; Yang, J. Influence of Topography and Land Management on Soil Nutrients Variability in Northeast China. Nutr. Cycl. Agroecosyst. 2011, 89, 427–438. [Google Scholar] [CrossRef]
  75. Duan, X.; Rong, L.; Zhang, G.; Hu, J.; Fang, H. Soil Productivity in the Yunnan Province: Spatial Distribution and Sustainable Utilization. Soil Tillage Res. 2015, 147, 10–19. [Google Scholar] [CrossRef]
  76. Zhang, J.; Chen, H.; Fu, Z.; Wang, K. Effects of Vegetation Restoration on Soil Properties along an Elevation Gradient in the Karst Region of Southwest China. Agric. Ecosyst. Environ. 2021, 320, 107572. [Google Scholar] [CrossRef]
  77. Zhu, G.; Zhou, L.; He, X.; Wei, P.; Lin, D.; Qian, S.; Zhao, L.; Luo, M.; Yin, X.; Zeng, L.; et al. Effects of Elevation Gradient on Soil Carbon and Nitrogen in a Typical Karst Region of Chongqing, Southwest China. J. Geophys. Res. Biogeosci. 2022, 127, e2021JG006742. [Google Scholar] [CrossRef]
  78. Chen, S.; Lin, J.; Wu, T.; Yuan, Z.; Cao, W. Assessing Flood and Waterlogging Vulnerability and Community Governance in Urban Villages in the Context of Climate Change: A Case Study of 89 Urban Villages in Shanghai. Sustain. Cities Soc. 2025, 126, 106377. [Google Scholar] [CrossRef]
  79. Huang, J.; Sehgal, V.; Alvarez, L.V.; Brocca, L.; Cai, S.; Cheng, R.; Cheng, X.; Du, J.; El Masri, B.; Endsley, K.A.; et al. Remotely Sensed High–resolution Soil Moisture and Evapotranspiration: Bridging the Gap between Science and Society. Water Resour. Res. 2025, 61, e2024WR037929. [Google Scholar] [CrossRef]
  80. Lu, Z.; Yang, X. Effects of Microtopography on Patterns and Dynamics of Groundwater–Surface Water Interactions. Adv. Water Resour. 2024, 188, 104704. [Google Scholar] [CrossRef]
  81. Huang, S.; Wang, S.; Gan, Y.; Wang, C.; Horton, D.E.; Li, C.; Zhang, X.; Niyogi, D.; Xia, J.; Chen, N. Widespread Global Exacerbation of Extreme Drought Induced by Urbanization. Nat. Cities 2024, 1, 597–609. [Google Scholar] [CrossRef]
  82. Salvi, K.A.; Kumar, M. Imprint of Urbanization on Snow Precipitation over the Continental USA. Nat. Commun. 2024, 15, 2348. [Google Scholar] [CrossRef]
  83. Lu, Z.; Wu, D.; Meng, S.; Kou, X.; Jiao, L. Exploration of Spatiotemporal Covariation in Vegetation–Groundwater Relationships: A Case Study in an Endorheic Inland River Basin. Land 2025, 14, 715. [Google Scholar] [CrossRef]
  84. Lu, Z.; Shen, C.; Zhan, C.; Tang, H.; Luo, C.; Meng, S.; An, Y.; Wang, H.; Kou, X. Quantifying Multifactorial Drivers of Groundwater–Climate Interactions in an Arid Basin Based on Remote Sensing Data. Remote Sens. 2025, 17, 2472. [Google Scholar] [CrossRef]
  85. Godwin, P.; Tian, S.; Duvert, C.; Wurm, P.; Riwu Kaho, N.; Edwards, A. Detecting Groundwater Dependence and Woody Vegetation Restoration with NDVI and Moisture Trend Analyses in an Indonesian Karst Savanna. Front. Remote Sens. 2024, 5, 1280712. [Google Scholar] [CrossRef]
  86. Lu, Z.; Wei, J.; Yang, X. Effects of Hydraulic Conductivity on Simulating Groundwater–Land Surface Interactions over a Typical Endorheic River Basin. J. Hydrol. 2024, 638, 131542. [Google Scholar] [CrossRef]
  87. Lu, Z.; Wu, T.; Lei, J.; Yang, X. Assessing a High-Resolution Integrated Hydrologic Model (ParFlow-CLM-HRB) in an Endorheic Basin of China. J. Hydrol. 2025, 661, 133579. [Google Scholar] [CrossRef]
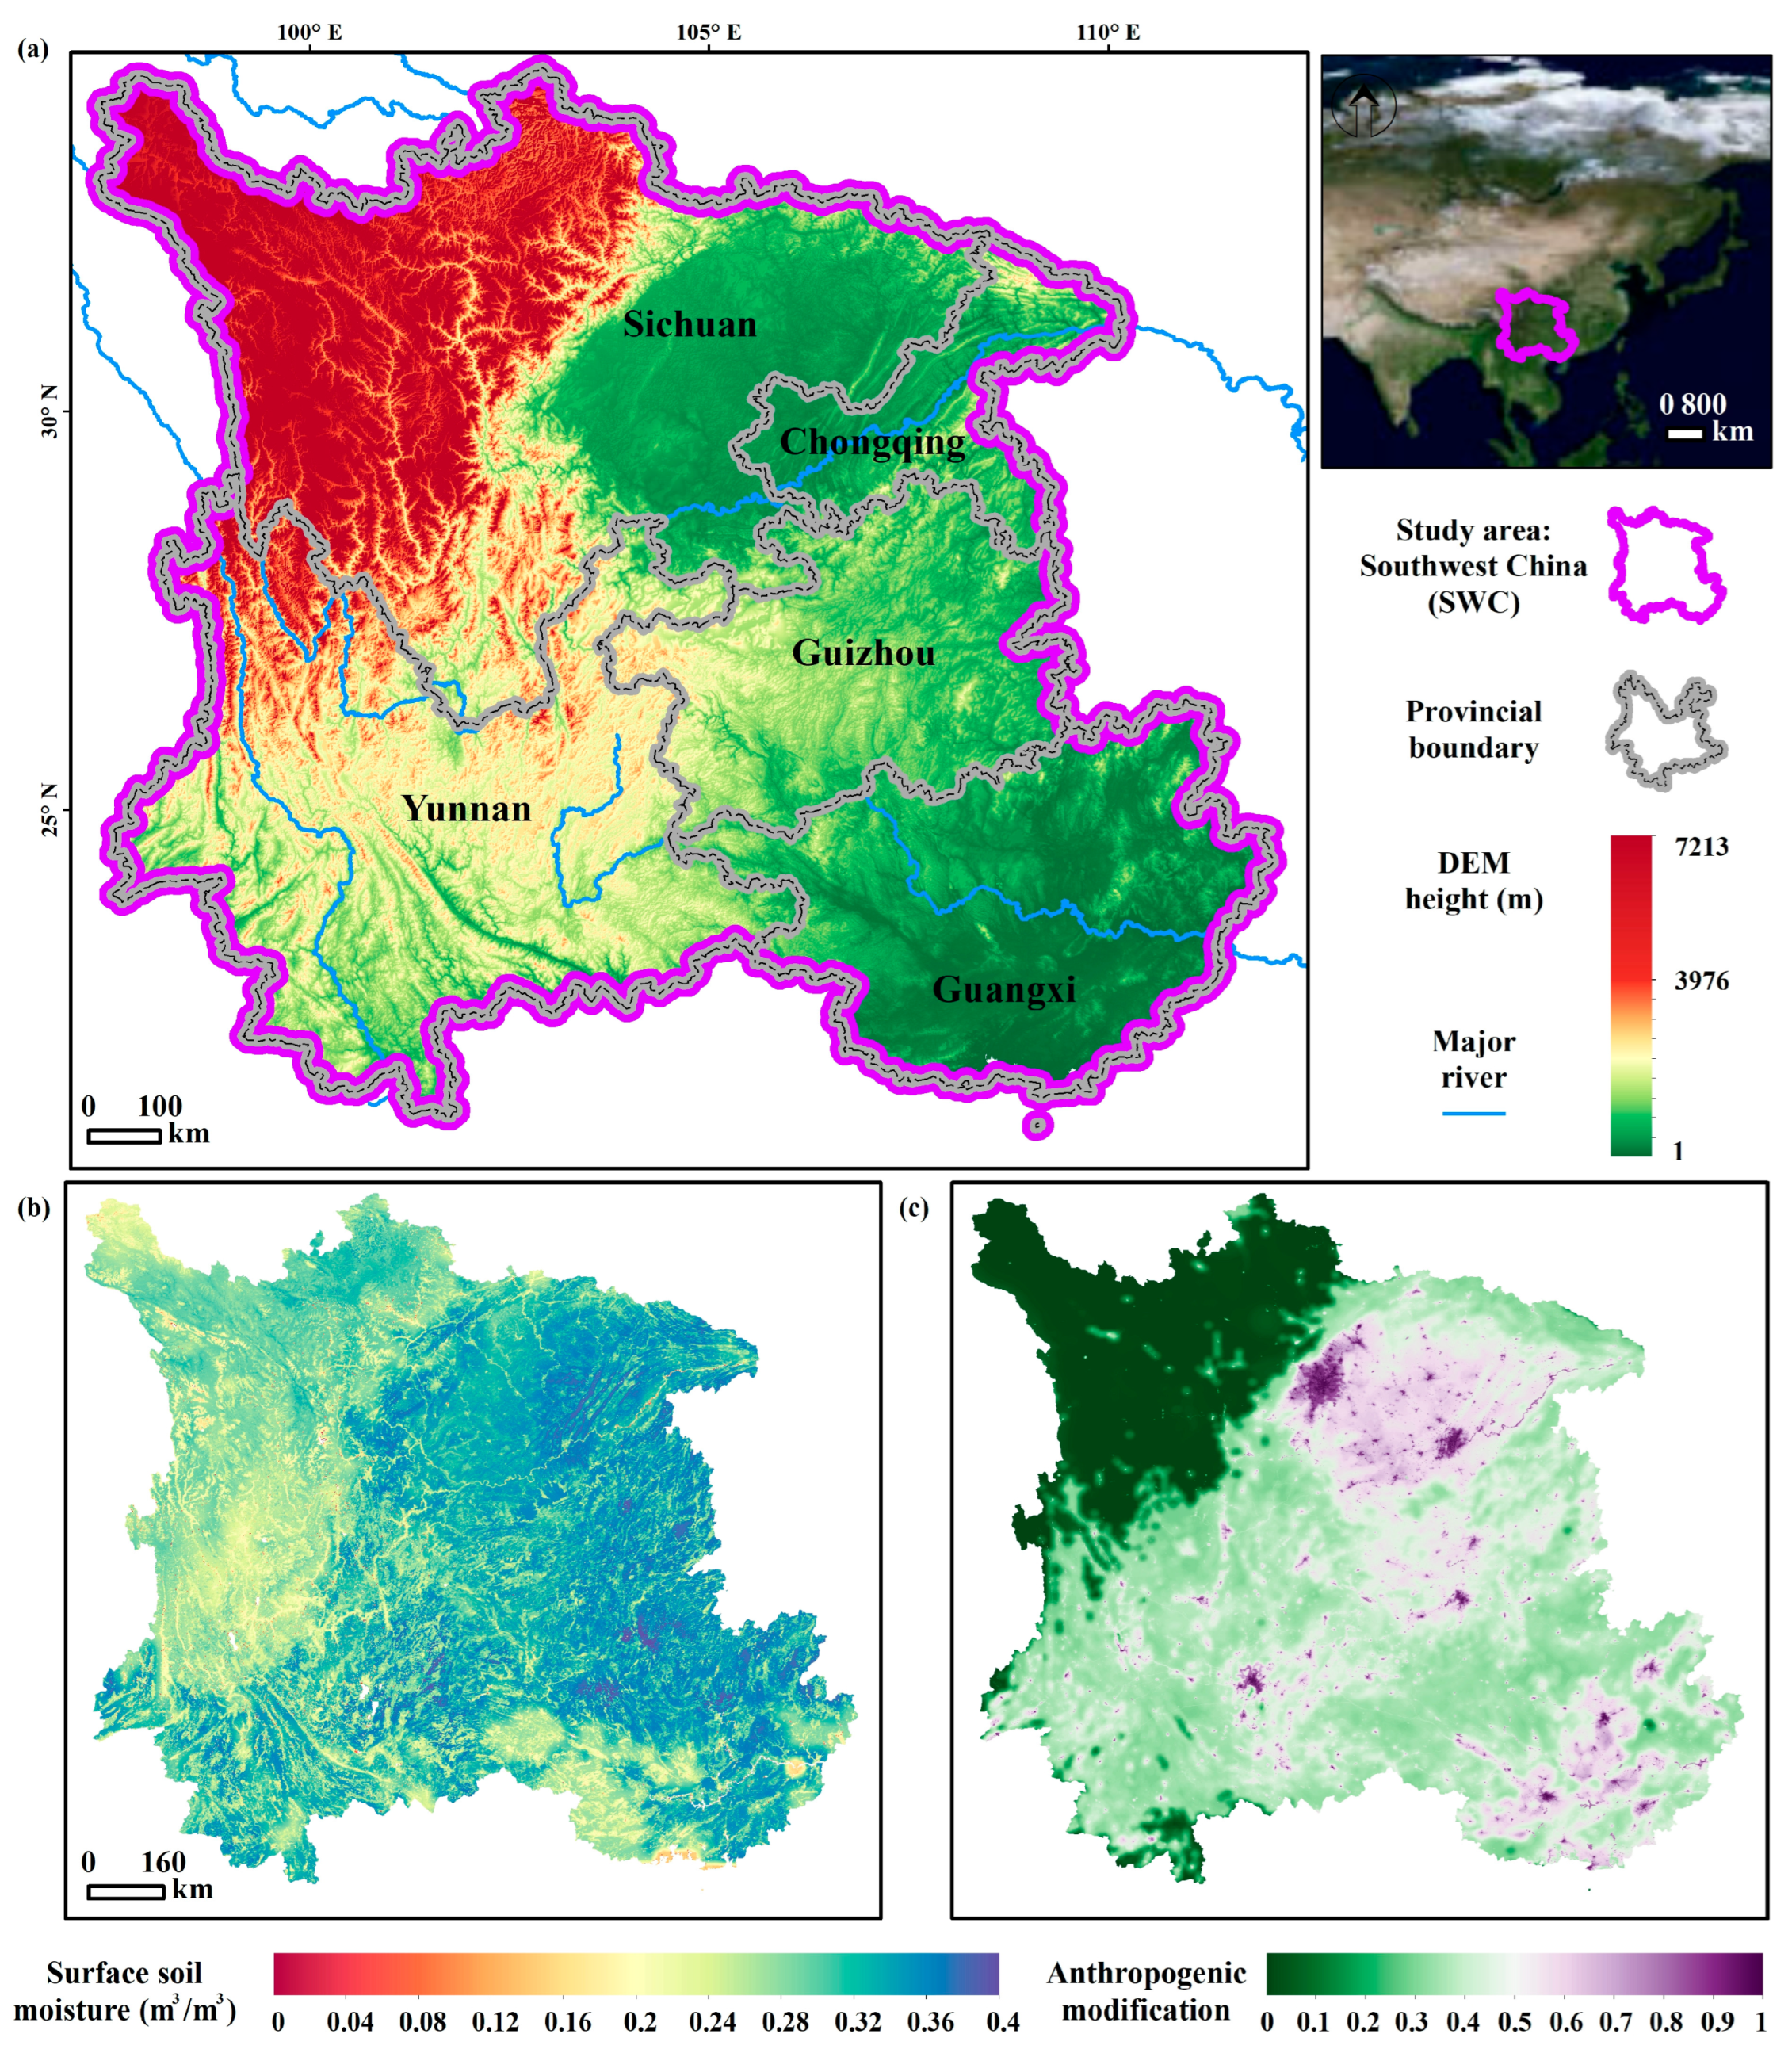
Figure 1. Spatial characteristics of Southwest China: (a) topographic map with location, provincial boundaries and major river systems; (b) multi-year average (2000–2017) surface soil moisture (SSM) distribution; (c) spatial pattern of anthropogenic modification index based on circa 2017 data.
Hydrology 12 00275 g001
Figure 2. Spatial distribution of the five major anthropogenic stressor categories across the study region, based on the 2017 static stressor data. The layers depict the intensity of modification (ranging from 0 to 1) for: (a) Agriculture; (b) Built-up; (c) Energy; (d) Intrusion; (e) Transportation.
Hydrology 12 00275 g002
Figure 3. Workflow for analyzing the spatiotemporal dynamics of surface soil moisture (SSM) and its relationship with anthropogenic modification in Southwest China (2000–2017). Note: OAM, Overall Anthropogenic Modification.
Hydrology 12 00275 g003
Figure 4. Spatial patterns of surface soil moisture (SSM) over Southwest China during 2000–2015: (ac) spatial distribution of SSM for the years 2000, 2010 and 2015, respectively; (df) differences in SSM between 2010 and 2000 (ΔSSM 2010–2000), 2015 and 2010 (ΔSSM 2015–2010), as well as 2015 and 2000 (ΔSSM 2015–2000), respectively. In the difference maps, blue areas represent decreases in soil moisture, while red areas represent increases relative to the earlier period.
Hydrology 12 00275 g004
Figure 5. Temporal and Statistical Characteristics of surface soil moisture (SSM) over Southwest China (2000–2017): (a) interannual variation in annual mean SSM with linear trend line and Sen’s slope annotation; (b) monthly SSM time series with statistical summary (min, max, mean values); (c) distribution of SSM values for selected years (2000, 2010, 2015) shown through box plots with data points; (d) seasonal SSM distribution across winter, spring, summer and autumn.
Hydrology 12 00275 g005
Figure 6. Spatial patterns of overall anthropogenic modification (OAM) over Southwest China during 2000–2015: (ac) spatial distribution of OAM for the years 2000, 2010 and 2015, respectively; (df) differences in OAM between 2010 and 2000 (ΔOAM 2010–2000), 2015 and 2010 (ΔOAM 2015–2010), as well as 2015 and 2000 (ΔOAM 2015–2000), respectively. In the difference maps, blue areas represent decreases in anthropogenic modification, while red areas represent increases relative to the earlier period.
Hydrology 12 00275 g006
Figure 7. Temporal and statistical characteristics of overall anthropogenic modification (OAM) over Southwest China for the years 2000, 2010 and 2015: (a) changes in the annual mean OAM value of the three time points; (b) distribution of OAM values for 2000, 2010 and 2015 shown through box plots with data points.
Hydrology 12 00275 g007
Figure 8. Bivariate kernel density estimates between overall anthropogenic modification (OAM) and surface soil moisture (SSM) for the years (a) 2000, (b) 2010 and (c) 2015. The OAM is represented on the x-axis (0–1), while SSM (m3/m3) is on the y-axis (0.1–0.4). The density is conveyed using a white-red color gradient and the color gradient represents the density of data points, with warmer colors indicating higher concentration.
Hydrology 12 00275 g008
Figure 9. Boxplots showing the distribution of surface soil moisture (SSM) across five levels of overall anthropogenic modification (OAM) intensity: Low (0–0.2), Med–Low (0.2–0.4), Medium (0.4–0.6), Med–High (0.6–0.8) and High (0.8–1.0) for (a) 2000, (b) 2010 and (c) 2015. The boxes represent the interquartile range, horizontal lines within boxes indicate medians, whiskers show the data range, and plus signs denote outliers.
Hydrology 12 00275 g009
Figure 10. Bivariate kernel density estimates between detailed anthropogenic modification factors and surface soil moisture (SSM) for 2017: (a) Agriculture; (b) Built-up; (c) Energy; (d) Intrusion; (e) Transportation. The anthropogenic modification intensity is represented on the x-axis, while SSM (m3/m3) is on the y-axis. The color gradient represents the density of data points, with warmer colors indicating higher concentration.
Hydrology 12 00275 g010
Figure 11. Boxplots showing the distribution of surface soil moisture (SSM) across five levels of anthropogenic modification intensity: Low (0–0.2), Med–Low (0.2–0.4), Medium (0.4–0.6), Med–High (0.6–0.8) and High (0.8–1.0) for each factor: (a) Agriculture; (b) Built-up; (c) Energy; (d) Intrusion; (e) Transportation. The boxes represent the interquartile range, horizontal lines within boxes indicate medians, whiskers show the data range, and plus signs denote outliers.
Hydrology 12 00275 g011
Table 1. Catalog of key datasets used in this study. A complete catalog with detailed technical specifications is provided in Supplementary Information (Table S1).
Original Spatial
Coverage
Original
Spatial
Resolution
Original
Temporal
Coverage
Original
Temporal
Resolution
Literature
Surface soil moistureGlobal30 arc-second2000–2020Daily/monthly[46]
Anthropogenic modificationGlobal300 m1990, 2000, 2010, 2015, 2017-[47]
Disclaimer/Publisher’s Note: The statements, opinions and data contained in all publications are solely those of the individual author(s) and contributor(s) and not of MDPI and/or the editor(s). MDPI and/or the editor(s) disclaim responsibility for any injury to people or property resulting from any ideas, methods, instructions or products referred to in the content.