Article

Long-Term Hydrodynamic Modeling of Low-Flow Conditions with Groundwater–River Interaction: Case Study of the Rur River

1
Institute of Hydraulic Engineering and Water Resources Management, RWTH Aachen University, 52070 Aachen, Germany
2
Department of Water, Environment, Construction and Safety, Magdeburg-Stendal University of Applied Sciences, 39114 Magdeburg, Germany
*
Author to whom correspondence should be addressed.
Hydrology 2025, 12(10), 270; https://doi.org/10.3390/hydrology12100270
Submission received: 2 September 2025 / Revised: 30 September 2025 / Accepted: 9 October 2025 / Published: 11 October 2025

Abstract

Groundwater plays a critical role in maintaining streamflow during low-flow periods. However, accurately quantifying groundwater flow still remains a modeling challenge. Prolonged low-flow or drought conditions necessitate long-term simulations, further increasing the complexity of achieving reliable results. To address these issues, a novel modeling framework (HYD module in LoFloDes) that integrates a one-dimensional (1D) river module with two-dimensional (2D) groundwater module via bidirectional coupling, enabling robust and accurate simulations of both groundwater and river dynamics throughout their interactions, especially over extended periods, was developed. The HYD module was applied to the Rur River, calibrated using gridded groundwater data, groundwater and river gauge data from 2002 to 2005 and validated from 1991 to 2020. During validation periods, the simulated river and groundwater levels generally reproduced observed trends, although suboptimal performance at certain gauges is attributed to unmodeled local anthropogenic influences. Comparative simulations demonstrated that the incorporation of groundwater–river interactions markedly enhanced model performance, especially at the downstream Stah gauge, where the coefficient of determination (R2) increased from 0.83 without interaction to 0.9 with interaction. Consistent with spatio-temporal patterns of this interaction, simulated groundwater contributions increased from upstream to downstream and were elevated during low-flow months. These findings underscore the important role of groundwater contributions in local river dynamics along the Rur River reach. The successful application of the HYD module demonstrates its capacity for long-term simulations of coupled groundwater–surface water systems and underscores its potential as a valuable tool for integrated river and groundwater resources management.

1. Introduction

Low flows are characterized by annual minimum streamflow values [1]. They typically recur each year during dry seasons [2] and can persist for several months [3]. Notably, the term “low flow” is frequently conflated with “hydrological drought” in both scientific and practical contexts. Drought is typically defined as a prolonged period of below-normal water availability, characterized by its severity, spatial extent, and duration [4,5]. In contrast, low flow denotes the seasonally recurring periods of reduced streamflow in the context of the natural river regime. While hydrological droughts are commonly associated with low-flow conditions, not all low-flow events qualify as hydrological droughts. In practice, low discharges in surface waters can significantly alter habitats within watercourses and restrict the navigability of inland waterways [6]. Moreover, in certain regions, river water plays a crucial role in meeting demands for drinking water, household use, irrigation, energy production, and industrial applications. In this context, low-flow periods may substantially affect these essential demands [2]. With ongoing climate change, both the economic and ecological impacts associated with low flows are expected to intensify. This underscores the importance of conducting comprehensive low-flow risk analyses at the river catchment scale.
Being the slowest-moving element of the terrestrial hydrologic cycle, groundwater often mitigates fluctuations in both the water and energy cycles [7]. During low-flow periods, the rapid components of river discharge (e.g., direct runoff or interflow) gradually diminish until streamflow is sustained by the slower flow component (e.g., baseflow), which was primarily contributed by groundwater storage [8,9,10,11,12,13]. Furthermore, prolonged periods of low precipitation combined with high evapotranspiration can cause groundwater levels to decline [14], which can further influence the local river dynamics. In contrast, river discharge is highly sensitive to meteorological variability [15]. Different catchment characteristics can further influence this sensitivity [1,16,17,18]. For instance, hard rock aquifers are typically characterized by low permeability, resulting in a substantial portion of precipitation flowing directly into rivers as surface runoff [19,20,21]. Conversely, in catchments dominated by porous aquifer systems, river discharge exhibits higher baseflow contributions and a delayed response to precipitation events [5]. For such groundwater-dominated catchments, the interaction between groundwater and surface water represents a vital natural factor governing watershed dynamics during dry periods.
In recent years, numerous researchers have developed coupled groundwater–river models to address large-scale water resources challenges [7,20,22,23,24,25,26,27,28]. For instance, Guzman et al. [29] developed a new modeling framework, SWAT-MODFLOW, to simulate the interaction between surface water and groundwater systems. Their results indicated that the model inadequately represented low-flow conditions due to unaccounted feedback fluxes from deep aquifers. Bailey et al. [28] conducted a 43-year simulation also using the SWAT-MODFLOW model to investigate spatial and temporal patterns of groundwater–surface water interactions in the Sprague River watershed. The study demonstrated improved streamflow simulation performance when coupled with groundwater compared to simulations considering only surface water. Rodriguez et al. [30] successfully applied an iterative coupling of HEC-RAS and MODFLOW in Choel Island, Argentina. However, this approach primarily addressed scenarios involving unidirectional exchange processes. Additionally, stochastic models have been widely used regarding groundwater–river interactions [31,32,33]. Chen et al. [32] compared machine learning algorithms, e.g., multi-layer perceptron (MLP) with the numerical model MODFLOW at the Heihe River Basin. Although MLP achieved faster computation times and superior calibration metrics, it showed limitations in generalization ability compared to numerical models and is not suitable for a long-term simulation study.
Various modeling frameworks have been employed to simulate groundwater and river dynamics, explicitly accounting for the exchange processes between these domains. MODFLOW incorporates such interactions with the Streamflow Routing (SFR) package [34]. However, MODFLOW primarily simulates groundwater flow, assuming piecewise steady-state, uniform, and constant-density streamflow conditions [34], thereby simplifying the representation of surface water dynamics. In MIKE SHE, the exchange between surface water and groundwater is modeled as a one-way process, where only groundwater exfiltration into the river is considered [35]. In contrast, models such as HydroGeoSphere [36] and ParFlow [37] offer fully integrated 3D simulation of surface and subsurface flow, enabling more realistic representation of bidirectional water exchange and transport processes, especially for complex flow dynamics. Low-flow periods typically require simulations over several months, and potentially over multiple decades when hydrological droughts are also considered. In this context, high-resolution, fully integrated models are computationally demanding and generally necessitate extended simulation durations, posing additional computational challenges like model calibration and data availability.
In conclusion, there remains a lack of integrated modeling approaches that explicitly simulate both groundwater and river systems while incorporating their bidirectional interactions over long-term periods. This gap limits the ability to accurately quantify low-flow conditions within river regimes and constrains the assessment of associated low-flow risks. To address this issue, this study introduces a new hydrodynamic module, the HYD module, developed as part of the LoFloDes software package, which integrates a one-dimensional river module with a two-dimensional groundwater module via an effective bidirectional coupling strategy. The HYD module is specifically designed for long-term simulations and aims to fulfill the following requirements:
  • Improve the representation of groundwater–river dynamics by explicitly incorporating bidirectional exchange processes.
  • Enable the assessment of the spatio-temporal patterns of groundwater–river interactions.
  • Ensure consistent accuracy, stability, and computational efficiency over extended simulation periods.
The module’s performance was evaluated in a case study conducted in the Rur River basin, where the target river section is regulated by a dam system and flows through flat terrain underlain by porous aquifers. Model calibration was carried out using observations from 2002 to 2005, followed by validation against data spanning 1991 to 2020. Statistical measures and graphical comparisons were applied to evaluate both river and groundwater dynamics in terms of spatial and temporal variability. Subsequently, a comprehensive spatio-temporal analysis of groundwater–river exchanges was performed to enhance the understanding of low-flow conditions within the study area. Additionally, computation times were systematically recorded to evaluate the efficiency of the module during long-term scenario simulations.

2. Materials and Methods

2.1. Software LoFloDes

The software LoFloDes (Low Flow Decision Support), which is open source and was developed as an important part of the BMBF-Project DryRivers, serves as a practical tool for low-flow risk management. The comprehensive management workflow of LoFloDes includes the following four analyses: meteorological–hydrological analysis, hydrodynamic analysis, consequence analysis, and threshold value approaches for quantifying economic and ecological impacts of low flow [38]. This study focuses on the hydrodynamic analysis, which is performed by the HYD module within LoFloDes. Figure 1 shows the modelling framework of the HYD module, including the individual 2D groundwater module, 1D river module, and their coupling strategy, while Table 1 describes the corresponding relevant module parameters.
The river module of LoFloDes was structured based on the river modeling framework of ProMaiDes (Protection Measures against Inundation Decision support) [39], which was developed to simulate flood conditions including interactions with adjacent floodplains. Spatially, a river is discretized into a 1D module using consecutive cross-profiles along the main flow direction (Figure 1). Each cross-section (river profile) is characterized by a series of elevation points representing the right foreland, left foreland, and main channel (Figure 1). Key river features, such as river width, station-km, and manning-value n are incorporated into each profile. The hydrodynamic calculations are performed by applying the continuity equation (Equation (1): the variables are described in Table 1). Here, the discharges for each profile, including the inflow and discharge of the preceding river profile Qin/outflow [m3/s], the exchange discharge from other systems Qcoupling [m3/s], e.g., from groundwater, and the boundary discharge Qboundary [m3/s] e.g., from the tributaries, were summed. This allows for analysis of the flow area Aarea [m2]. With both the total discharge Q [m3/s] and the flow area Aarea [m2], hydraulic results such as water level hrv [m] can be iteratively resolved using the diffusive wave equation (Equation (2): the variables are described in Table 1). Additionally, parameters including leakage factor kfrv [1/s] and riverbed thickness Mrv [m] are assigned to each profile, enabling the exchange process between groundwater and river systems.
A r v t = Q i n / o u t f l o w + Q c o u p l i n g + Q b o u n d a r y x
0 = g Z b e d x + h r v x + n Q A r v r h y d 2 3 2
Regarding the groundwater module, only the uppermost groundwater layer (subsurface) is simulated, as it directly interacts with the river. This layer is spatially represented as a 2D regular raster consisting of several rectangular elements (Figure 1). Each element represents a homogeneous groundwater area, where hydrogeological features, including layer thickness Mgw [m], hydraulic conductivity kfgw [m/s], and effective porosity eP [−] remain uniform. Internal exchanges occur between each element and their neighboring elements in both the x and y directions, calculated depending on Darcy’s Law (Equation (3): the variables are described in Table 1). Under confined groundwater conditions, transmissivity T [m2/s] is computed as the product of hydraulic conductivity kfgw [m/s] and aquifer thickness Mgw [m] (Equation (4)). In contrast, for unconfined (water table) conditions, transmissivity T [m2/s] is determined by the product of hydraulic conductivity kfgw [m/s] and saturated thickness h g w z g w [m] (Equation (5): the variables are described in Table 1). This approach is also used in other traditional groundwater modelling softwares, such as MODFLOW [40]. During the simulation process, the groundwater head hgw [m] is updated at the beginning of each iteration, followed by a recalculation of transmissivity T [m2/s] and derivation along with the internal exchange discharge Qin/outflow (Qgw2gw) [m3/s], boundary discharge Qboundary [m3/s], and coupling discharge Qcoupling [m3/s]. Notably, groundwater functions as a discontinuous medium comprised of solid bodies (rock material) and voids. Consequently, head-based discharge is computed by volume-based relative to the porous area of each element (Equation (6): the variables are described in Table 1).
Q g w 2 g w = 2 T 1 T 2 T 1 + T 2 y h g w , 1 h g w , 2 x
T = k f M g w
T = k f ( h g w z g w )
h g w t = Q i n / o u t f l o w + Q c o u p l i n g + Q b o u n d a r y x y e P
The spatial resolution of the groundwater model typically spans several hundred meters to thousand meters [22], whereas smaller rivers often have widths of only a few meters. Due to this spatial disparity, the river is simplified into a 1D line, which traverses through the riverbed points of consecutive cross-profiles. The groundwater element is represented by a 2D polygon. Spatial couplings occur when the riverbed’s paths intersect these groundwater polygons. These intersection points, along with the riverbed points within the polygons, are identified as coupling points (Figure 1). During the model synchronization, the hydraulic exchange rate Qgw2rv [m3/s] is calculated with constant hydraulic conductivity of the streambed (leakage factor kfrv [m/s]) and time-variant hydraulic gradient h [m] and wetted perimeter r w e t t e d [m]. (Equation (7): the variables are described in Table 1) Subsequently, the calculated rate Qgw2rv [m3/s] is introduced at the coupling point, linking the spatially affected groundwater element and river profile, where the positive exchange flux presents the exfiltration from the river to the groundwater and the negative flux presents the infiltration.
Q g w 2 r v = k f r v L r w e t t e d M r v h
Additionally, the bidirectional exchange approach is also implemented in 1D–1D river–river and 2D–2D groundwater–groundwater couplings. When the sub-modules exhibit spatial overlap, the corresponding coupling types are automatically applied. At the coupling boundaries of the respective sub-modules, hydraulic exchange is determined for each synchronization time step based on the relevant govern functions [39]. For instance, an automatic coupling mechanism is established between neighboring groundwater rasters, whereby hydraulic exchange occurs across their interfaces in accordance with Darcy’s Law (Equation (3): the variables are described in Table 1).
A finite volume scheme is employed for spatial discretization to numerically solve the equations governing the 1D river module and the 2D groundwater module. For temporal discretization, the backward differentiation formula (BDF), a multistep method specifically designed for solving initial value problems, is utilized. The resulting nonlinear system of equations for each sub-module is addressed using the CVODE v2.1.0 software suite [41].

2.2. Study Area: The Rur River Basin

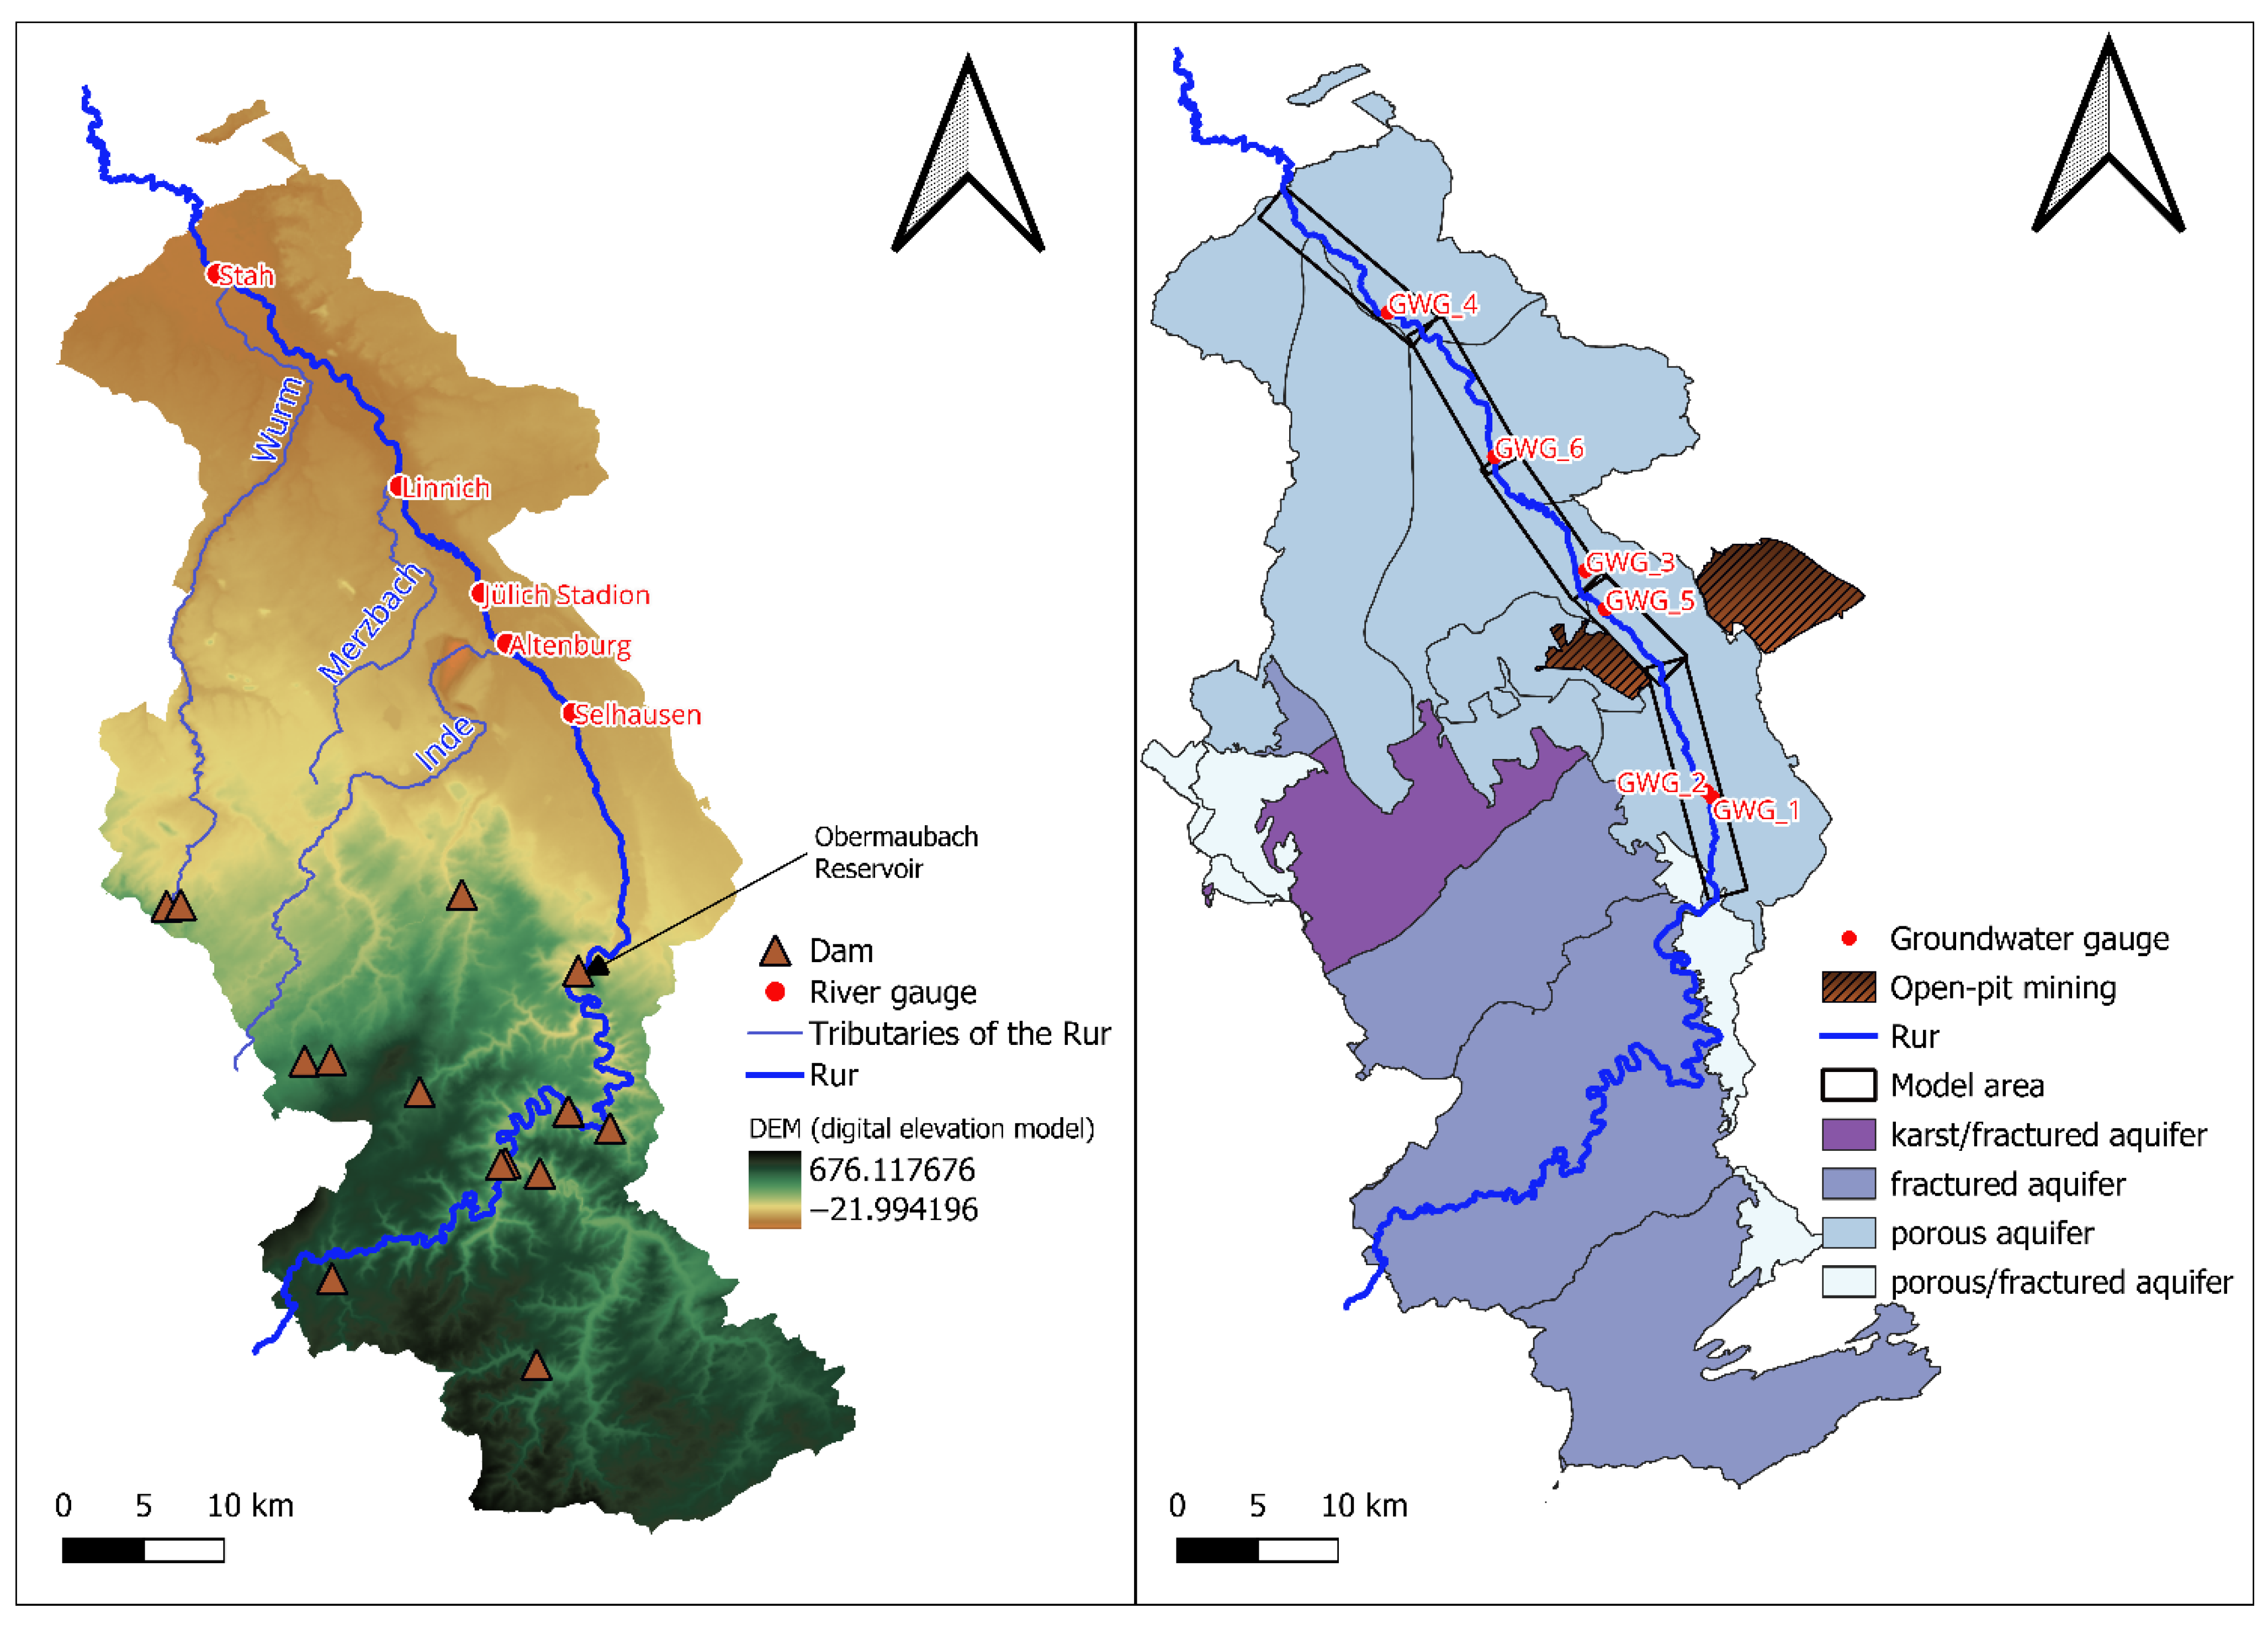
The Rur River in North Rhine-Westphalia NRW, western Germany (Figure 2), is a typical European upland-to-lowland river [42]. The left panel in Figure 3 illustrates the digital elevation model of the Rur River catchment with the Rur River as the main streamflow. Originating in the uplands, its sources are located in the swamp “High Fens” in Belgium at 600 m.a.s.l. [43]. It then flows through the lowlands of the Lower Rhine Embayment, eventually merging with the Meuse River in the Netherlands at 30 m.a.s.l. [43]. With a length of 165 km, the Rur River has a large river catchment of 2361 km2 [43], of which 90% is situated in Germany [44].
Due to the influence of the Atlantic Ocean, NRW has a relatively humid but cool climate. Precipitation in the south Eifel is significantly higher than that in the northern lowlands. Thus, the Rur exhibits a rain- and snow-influenced river regime with the highest discharge in winter and long periods of low discharge in summer [42]. Historically, flooding and water scarcity from the Rur River have significantly affected the industries, agriculture, and settlements along its course [46]. The water-demanding paper industry, which has a long history at the Rur River, especially relies strongly on the available natural water resources. To address these issues, large dams were constructed in the north Eifel Mountains [47], enabling effective discharge regulation to the lower Rur via a dam system [48]. Notably, a minimum releasing discharge of 5 m3/s from the Obermaubach reservoir was determined to ensure both reliable water supply and the maintenance of ecological status along the lower Rur [48]. Analysis of Selhausen gauge data (1991–2020) shows that discharge fell below 5 m3/s for about 5% of the period (542 days), indicating inconsistent compliance with the prescribed flow.
In the Rur River catchment, the main three aquifer types, including the pore aquifer, pore/karst aquifer, and karst aquifer, have been identified [48], as illustrated in the right panel in Figure 3. The hard rock catchment in the northern Eifel Mountains is comprised of impermeable rocks with limited groundwater storage, where karst and pore/karst aquifers are located. In contrast, the mid and lower areas contain multilayer unconsolidated sediments, forming a large groundwater system, where pore aquifers are located [48]. In this area, the groundwater system is characterized by high permeability and substantial storage capacity, resulting in intensive groundwater abstraction, such as the open-pit lignite mining activities near the Inde River.
Figure 3. The digital elevation model of the Rur River catchment with the Rur River and its main tributaries [49] (left); The main aquifers in the Rur River catchment [49], with the developed model boundary along the Rur (right).
Hydrology 12 00270 g003

2.3. Coupled Model in the Rur River Basin

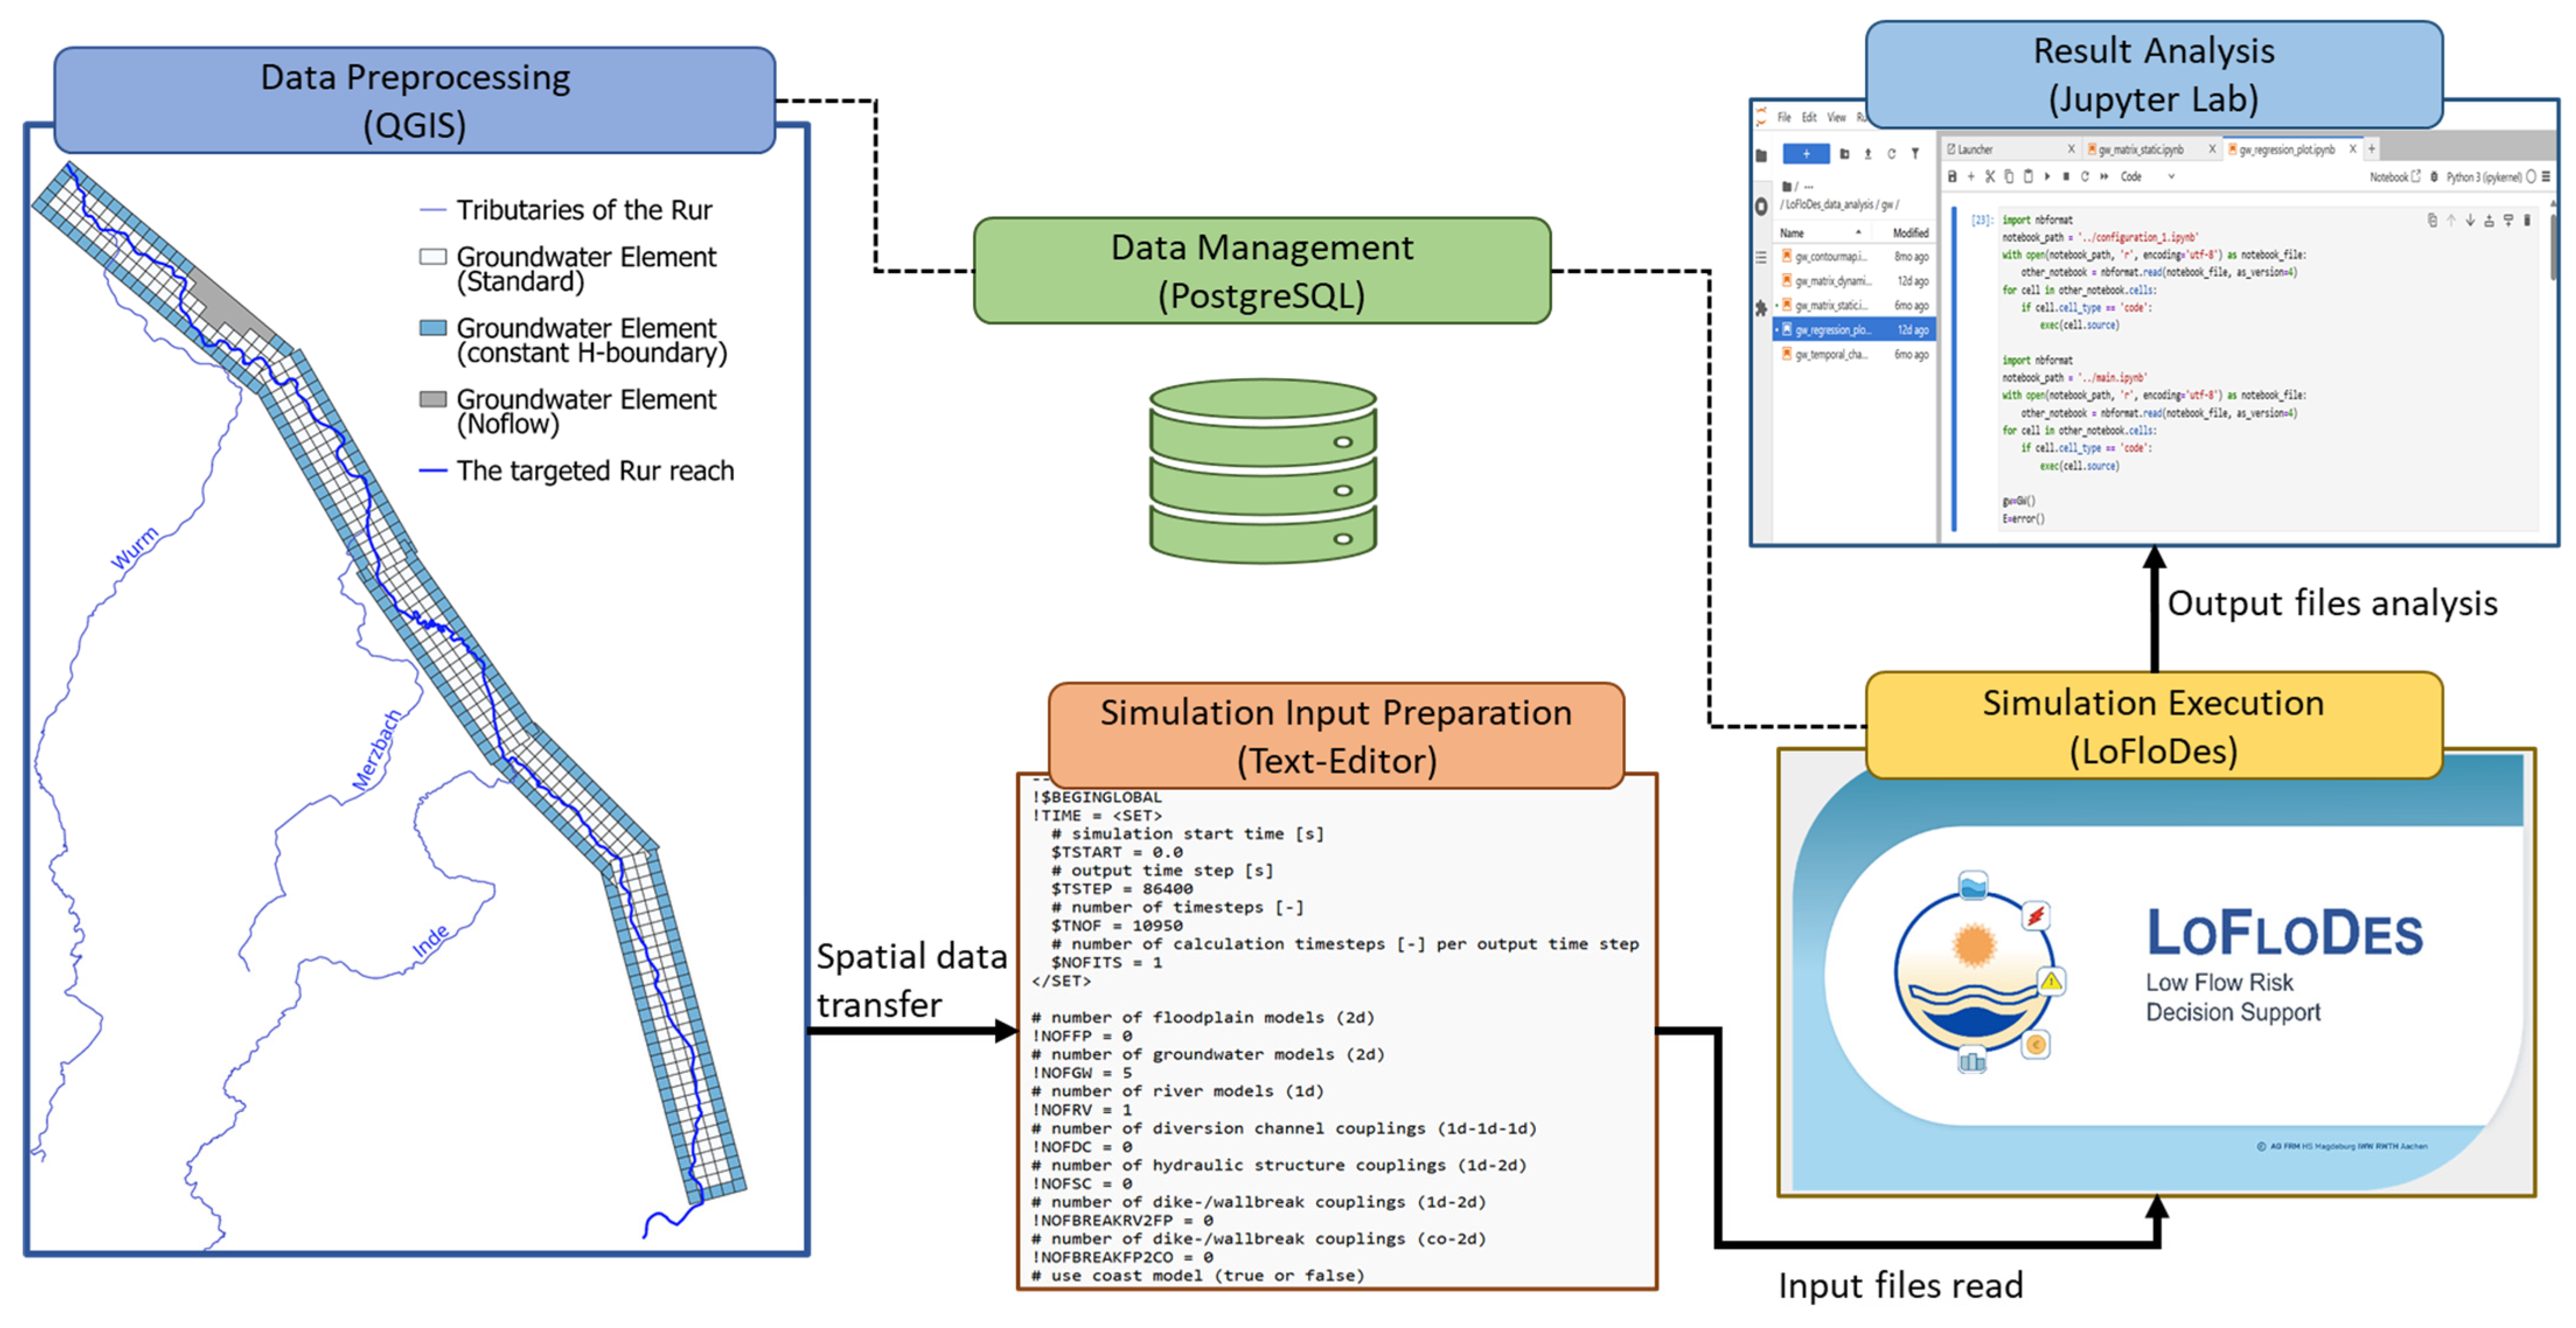
In this study, a coupled groundwater–river model was constructed along the Rur River reach. Figure 4 illustrates the workflow established for developing such a model using the LoFloDes software packages. First, spatial datasets were processed within the QGIS environment and exported to text files via the dedicated QGIS plugin. Model parameters can be adjusted in these text files using a standard text editor. The resulting files were then read by LoFloDes to conduct hydrodynamic simulations. Simulation outputs were subsequently post-processed and analyzed in JupyterLab using Python 3.12.2 scripts. In parallel, both LoFloDes and QGIS were connected to a PostgreSQL database to enable centralized data storage, management, and visualization within the QGIS interface. All computations were carried out on a workstation equipped with an AMD Ryzen 5 PRO 6650U processor, integrated Radeon graphics, and 16 GB of RAM.
The river model was structured along the lower Rur River, expanding 66.68 km from the outlet of the Obermaubach reservoir to the outflow at the German–Netherlands border. The right panel of Figure 3 illustrates the modelling boundaries along the Rur River, while the block “Data Preprocessing (QGIS)” in Figure 4 provides a detailed representation of the model structure. A river model composed of 524 cross profiles was developed, with the geological feature of the river section (in terms of riverbed information) provided by the survey data in 2019 from the Cologne municipal government [50]. The cross-profiles were evenly distributed along the river course, resulting in an average distance between adjacent profiles of approximately 100 m. The daily outflow discharge in m3/s from the Obermaubach reservoir served as the unsteady inflow for the targeted Rur River. The gauge data of the tributaries including Inde, Wurm, and Merzbach from [49] were used as unsteady boundary discharges, setting at the corresponding profiles. The anthropogenic flows including outflow from sewage treatment plants and the industries were not simulated, due to low data quality. Each profile incorporates specific river characteristics including the riverbed thickness Mrv [m], the Manning value n [s/m1/3], and the leakage factor kfrv [1/s]. To reduce the calibration effort, the riverbed thickness Mrv was uniformly set at 1 m. Thus, only the Manning value n and the leakage factor kfrv require determination.
Five groundwater rasters, covering a total area of 137.5 km2, were generated along the river course. The rasters consist of 550 groundwater elements with a unit size ( x = 500   m   a n d   y = 500   m ). Each element incorporated specific groundwater characteristics, with effective porosity eP [-] and conductivity kfgw [m/s]. Initial groundwater levels were derived from an interpolated contour map of average perennial levels from 2006 to 2015 [51]. A constant hydraulic head is applied along the raster boundaries, while a no-flow boundary is established along the northeastern side of the raster 5. This no-flow boundary was based on HK250 data, which indicate significant lithological variations that impede permeability and constrain flow direction. As the groundwater model domain is situated within a flatted catchment composed of loose rock formations (e.g., pore aquifer zone), groundwater recharge rates were assumed to be the difference between the monthly precipitation rate [52] and the monthly actual evaporation rate [53]. The coupled model operated on a daily time step. To reconcile the input recharge interval with the model time step, the monthly recharge value was uniformly disaggregated over a 30-day period and applied to each groundwater element as an unsteady areal boundary condition.

2.4. Initial Simulation, Calibration, and Validation

In the initial simulation, the calibration parameters, including hydraulic conductivity of aquifers kfgw [m/s], effective porosity of aquifer eP [-], leakage factor kfrv [1/s], and Manning’s roughness coefficient n [s/m1/3] were first assigned based on the localized hydrogeological feature and empirical values. According to the hydrological map HK 250 [54], the target aquifers consist of medium-permeable sediments with a suggested hydraulic conductivity kfgw ranging from 10−3 m/s to 1·10−4 m/s. Consequently, a uniform hydraulic conductivity kfgw of 10−3 m/s and a uniform effective porosity eP of 0.25 were assigned to the groundwater model. For the river model, the leakage factor kfrv was set at 10−6 1/s, based on recommendations from [55], who conducted infiltration experiments in the middle Rur and estimated the leakage factor kfrv ranging from 10−5 1/s to 5 × 10⁻⁶ 1/s. A standardized Manning’s roughness coefficient n value of 0.04 s/m1/3 was applied to the foreland, while a value of 0.0333 s/m1/3 was used in the main channel, according to the empirical values by [56]. As the simulation focused on dry periods, the calibration primarily targeted parameters within the river channel. Specifically, the n-value at the bed point (the lowest point in the main channel) was adjusted, while the n-value at the foreland remained unchanged. After the initial simulation, calibration was carried out using a trial-and-error approach to minimize the discrepancy between simulated and observed data. Groundwater parameters for the elements within same raster were uniformly adjusted. River parameters were adjusted uniformly for all profiles within a river segment, based on the performance at the segment’s down-stream gauge. Through careful adjustment of the calibration parameters, the final model was developed, achieving the best fit with the observed values.
The model was calibrated using time series data from 2002 to 2005 and validated with data from 1991 to 2020. As suggested by [57], the initial year, e.g., 1991 for the validation phase, was generally treated as a warm-up phase to refine the initial conditions and achieve an appropriate starting state for the later simulation. The hydrodynamic outputs include daily time series of river water levels in m for each profile as well as groundwater levels in m for each element. For the evaluation of river model performance, simulated water levels were compared to daily observed data at the gauges Stahl, Jülich Stadion, Altenburg, and Selhausen from [49]. The locations of these river gauges are shown in the left panel of Figure 3. In terms of groundwater models, simulated groundwater data for the elements within the same raster were aggregated to form a groundwater matrix. This was compared against a set of gridded monthly groundwater level data (250 m × 250 m resolution) covering the period 1991–2020, to evaluate the spatial distribution of groundwater levels. Additionally, the observed groundwater level time series from six different groundwater gauges (groundwater gauge GWG_1-6) sourced from [49] were used to assess temporal variations in groundwater levels at specific locations. The spatial location of the groundwater gauges is illustrated in the right panel of Figure 3.
Model performance was evaluated using error statistics such as the root mean square error (RMSE) and the coefficient of determination ( R 2 ),
R M S E = 1 N 0 N X s X o 2
R 2 = 1 0 N X o X s 2 0 N X o X o ¯ 2
where the N is the total number of the data, X s represents simulated values, and X o represents observed values. Besides, the elapsed time in data preparation and computation should be recorded as a criterion to assess the simulation.

3. Results

3.1. Calibration 2002–2005

The coupled Rur model was calibrated for the period from 2002 to 2005, with 2002 designated as a warm-up period. Due to comprehensive hydrogeological data and reliable initial parameter estimates, only minimal adjustments were needed during calibration (Table 2).
In Table 3, statistical evaluation demonstrates a good agreement between simulated and observed values for both groundwater and river models. The RMSE values for river gauges ranged from 0.03 m to 0.08 m, while the corresponding R2 values constantly exceeded 0.85, with an R2 ≥ 0.5 considered as acceptable [58]. It indicates that the simulated data can reproduce the systematical temporal trend. For groundwater, comparison with gridded observation data yielded R2 values between 0.75 and 0.98 and RMSE values from 0.90 m to 1.77 m, confirming satisfactory model performance. Based on these results, the calibrated model was considered reliable and was used for subsequent long-term simulations.

3.2. Long-Term Simulation for 1991–2020

To evaluate the long-term simulation capabilities of LoFloDes, a 30-year simulation was performed, covering the period from 1991 to 2021, with 1991 as warm-up period. During this phase, no parameters were further adjusted. The entire computation required 193 min, with 23 min allocated to reading input data, 5 min to output data, and 165 min to the calculation process.

3.2.1. Groundwater Results

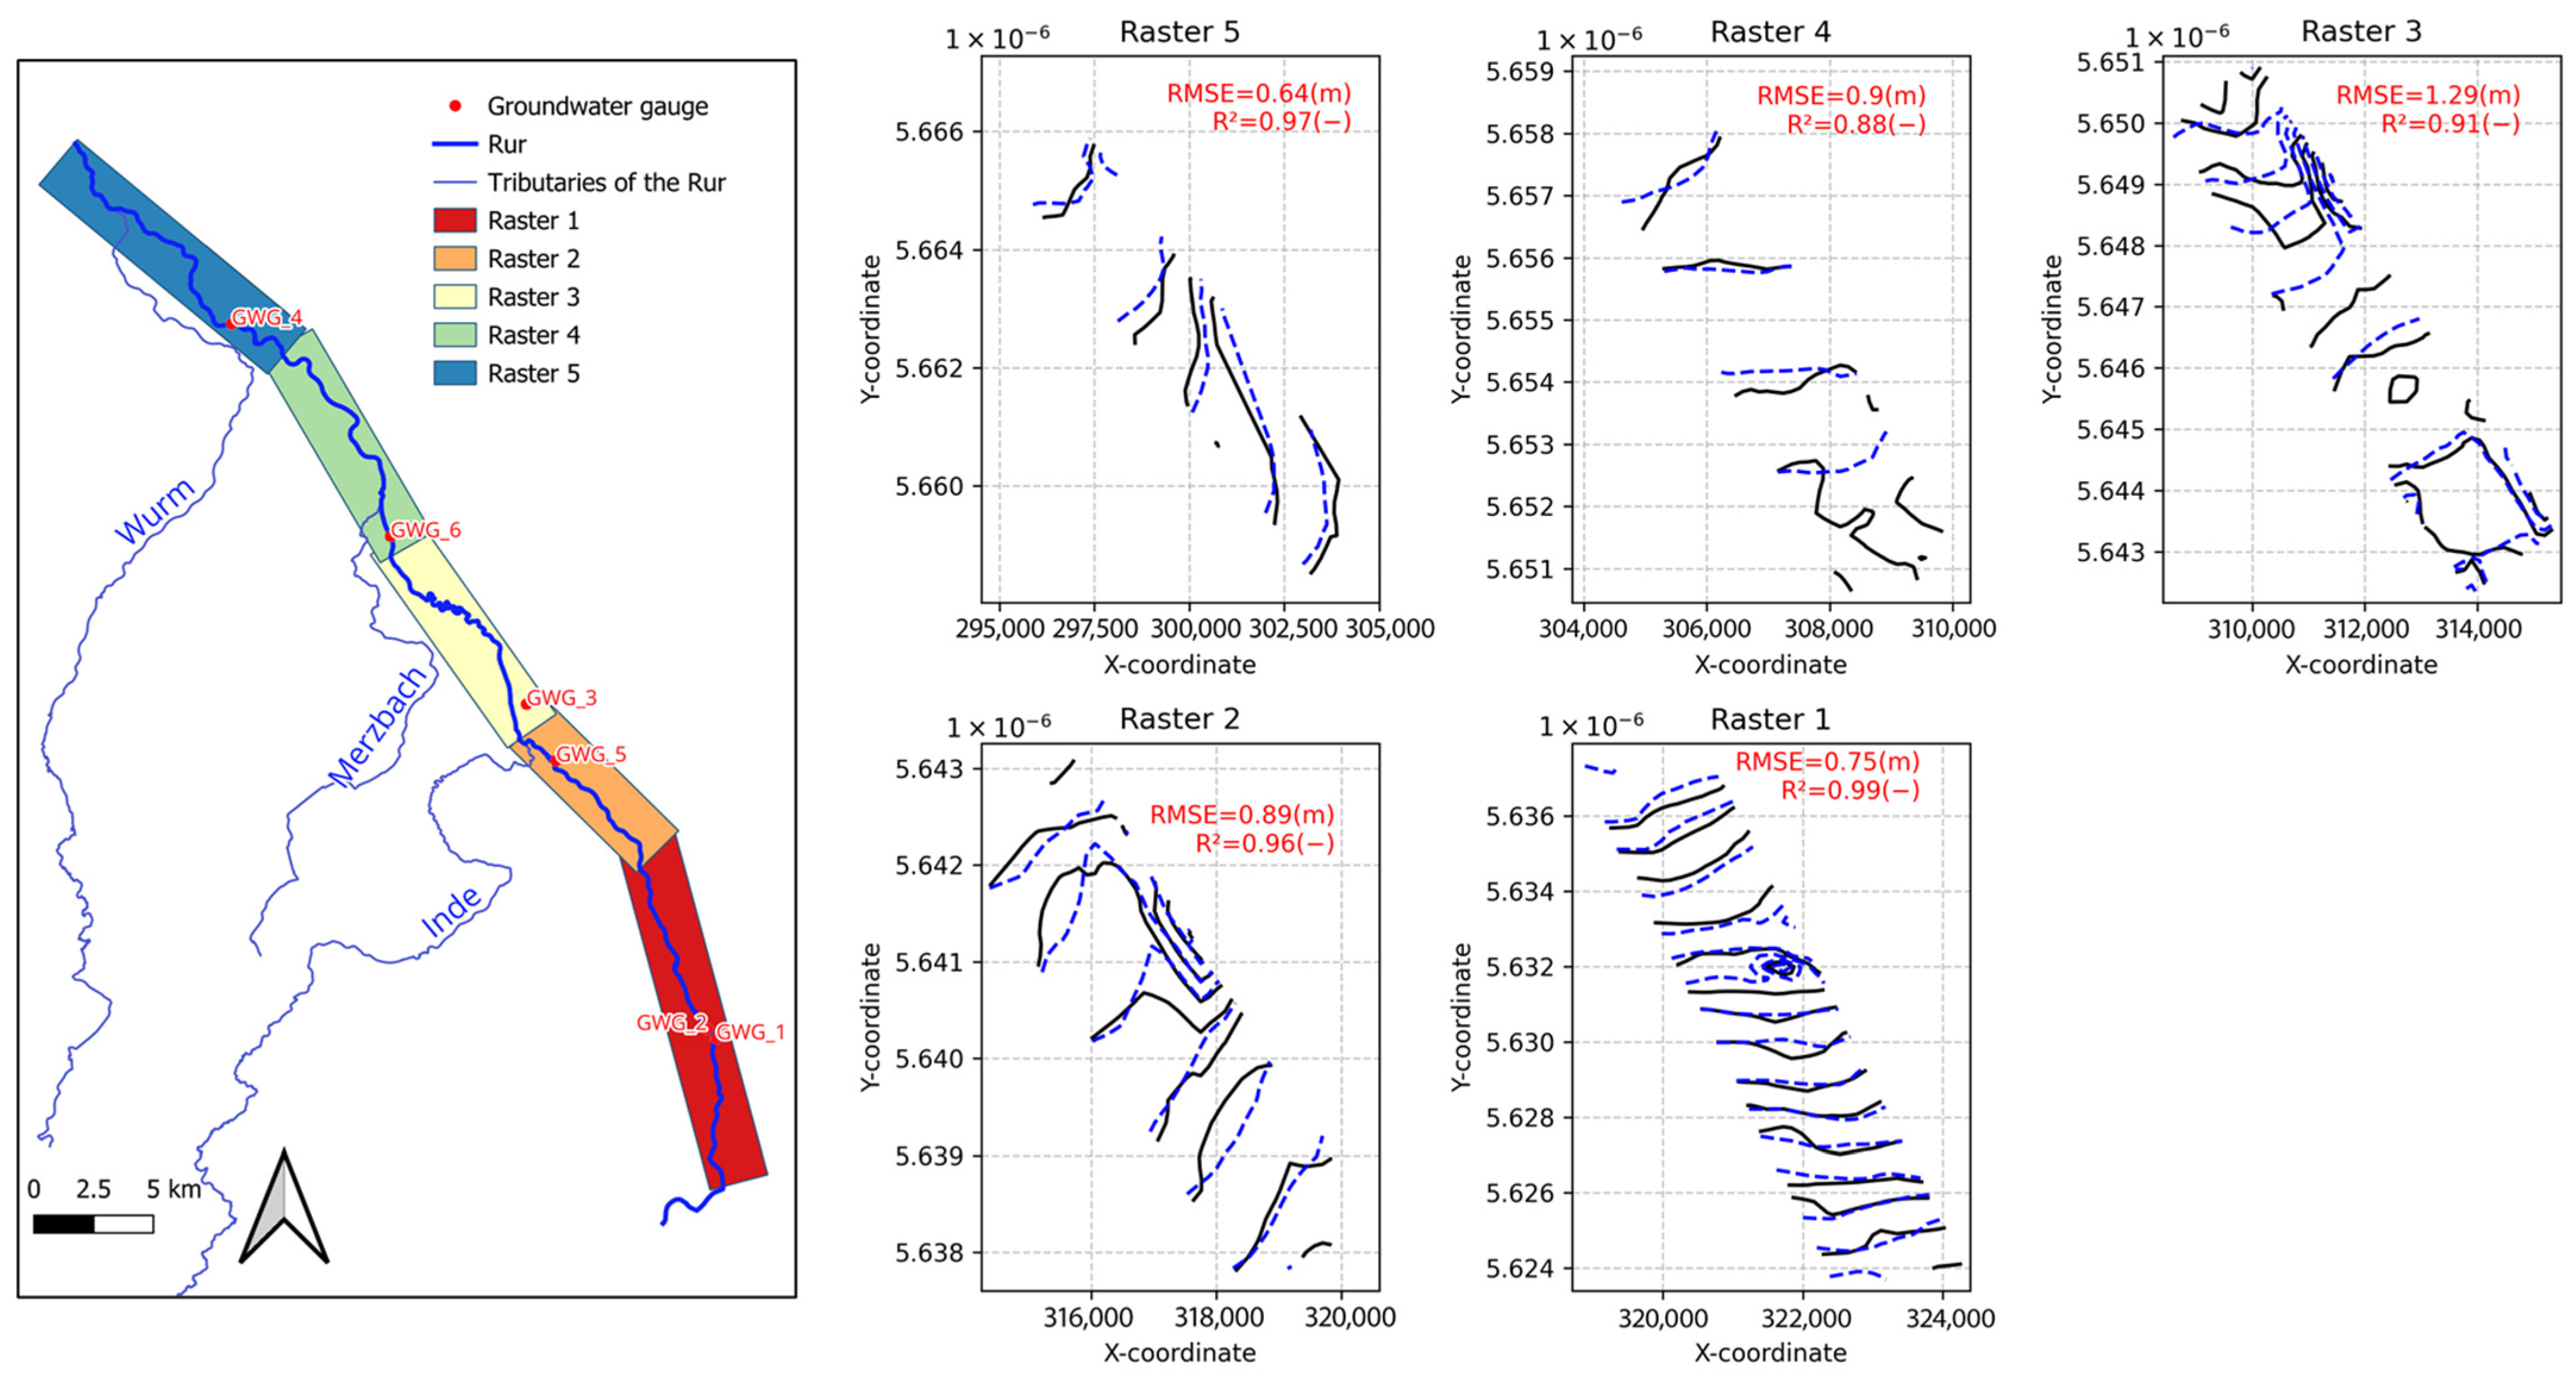
Figure 5 presents the 3 m contour lines of average groundwater levels for the period 1992–2020, derived from both the simulated and gridded datasets. The calculated R2 values for Rasters 1–5 were 0.99, 0.96, 0.91, 0.88, and 0.97, while the corresponding RMSE values were 0.75 m, 0.89 m, 1.29 m, 0.9 m, and 0.64 m. All R2 values exceed 0.5, indicating that the model reasonably reproduces observed spatial distribution among all rasters. Here, a gradual decline in groundwater levels from Raster 1 to Raster 5 in both contour lines is evident. In Rasters 1 and 2, closely spaced 3 m contour lines indicated a steep gradient in these regions, while from Raster 3 to Raster 5, the interval between these contour lines increased progressively, suggesting a more gradual change in elevation. Despite the general agreement between observed and simulated groundwater contours, certain contour lines in Rasters 2, 3, and 4 are not accurately reproduced by the simulation. These mismatches are consistent with the suboptimal model performance reflected in the respective statistical metrics. In contrast, simulated contours within Rasters 1 and 5 closely align with the observed data, resulting in a superior statistical performance.
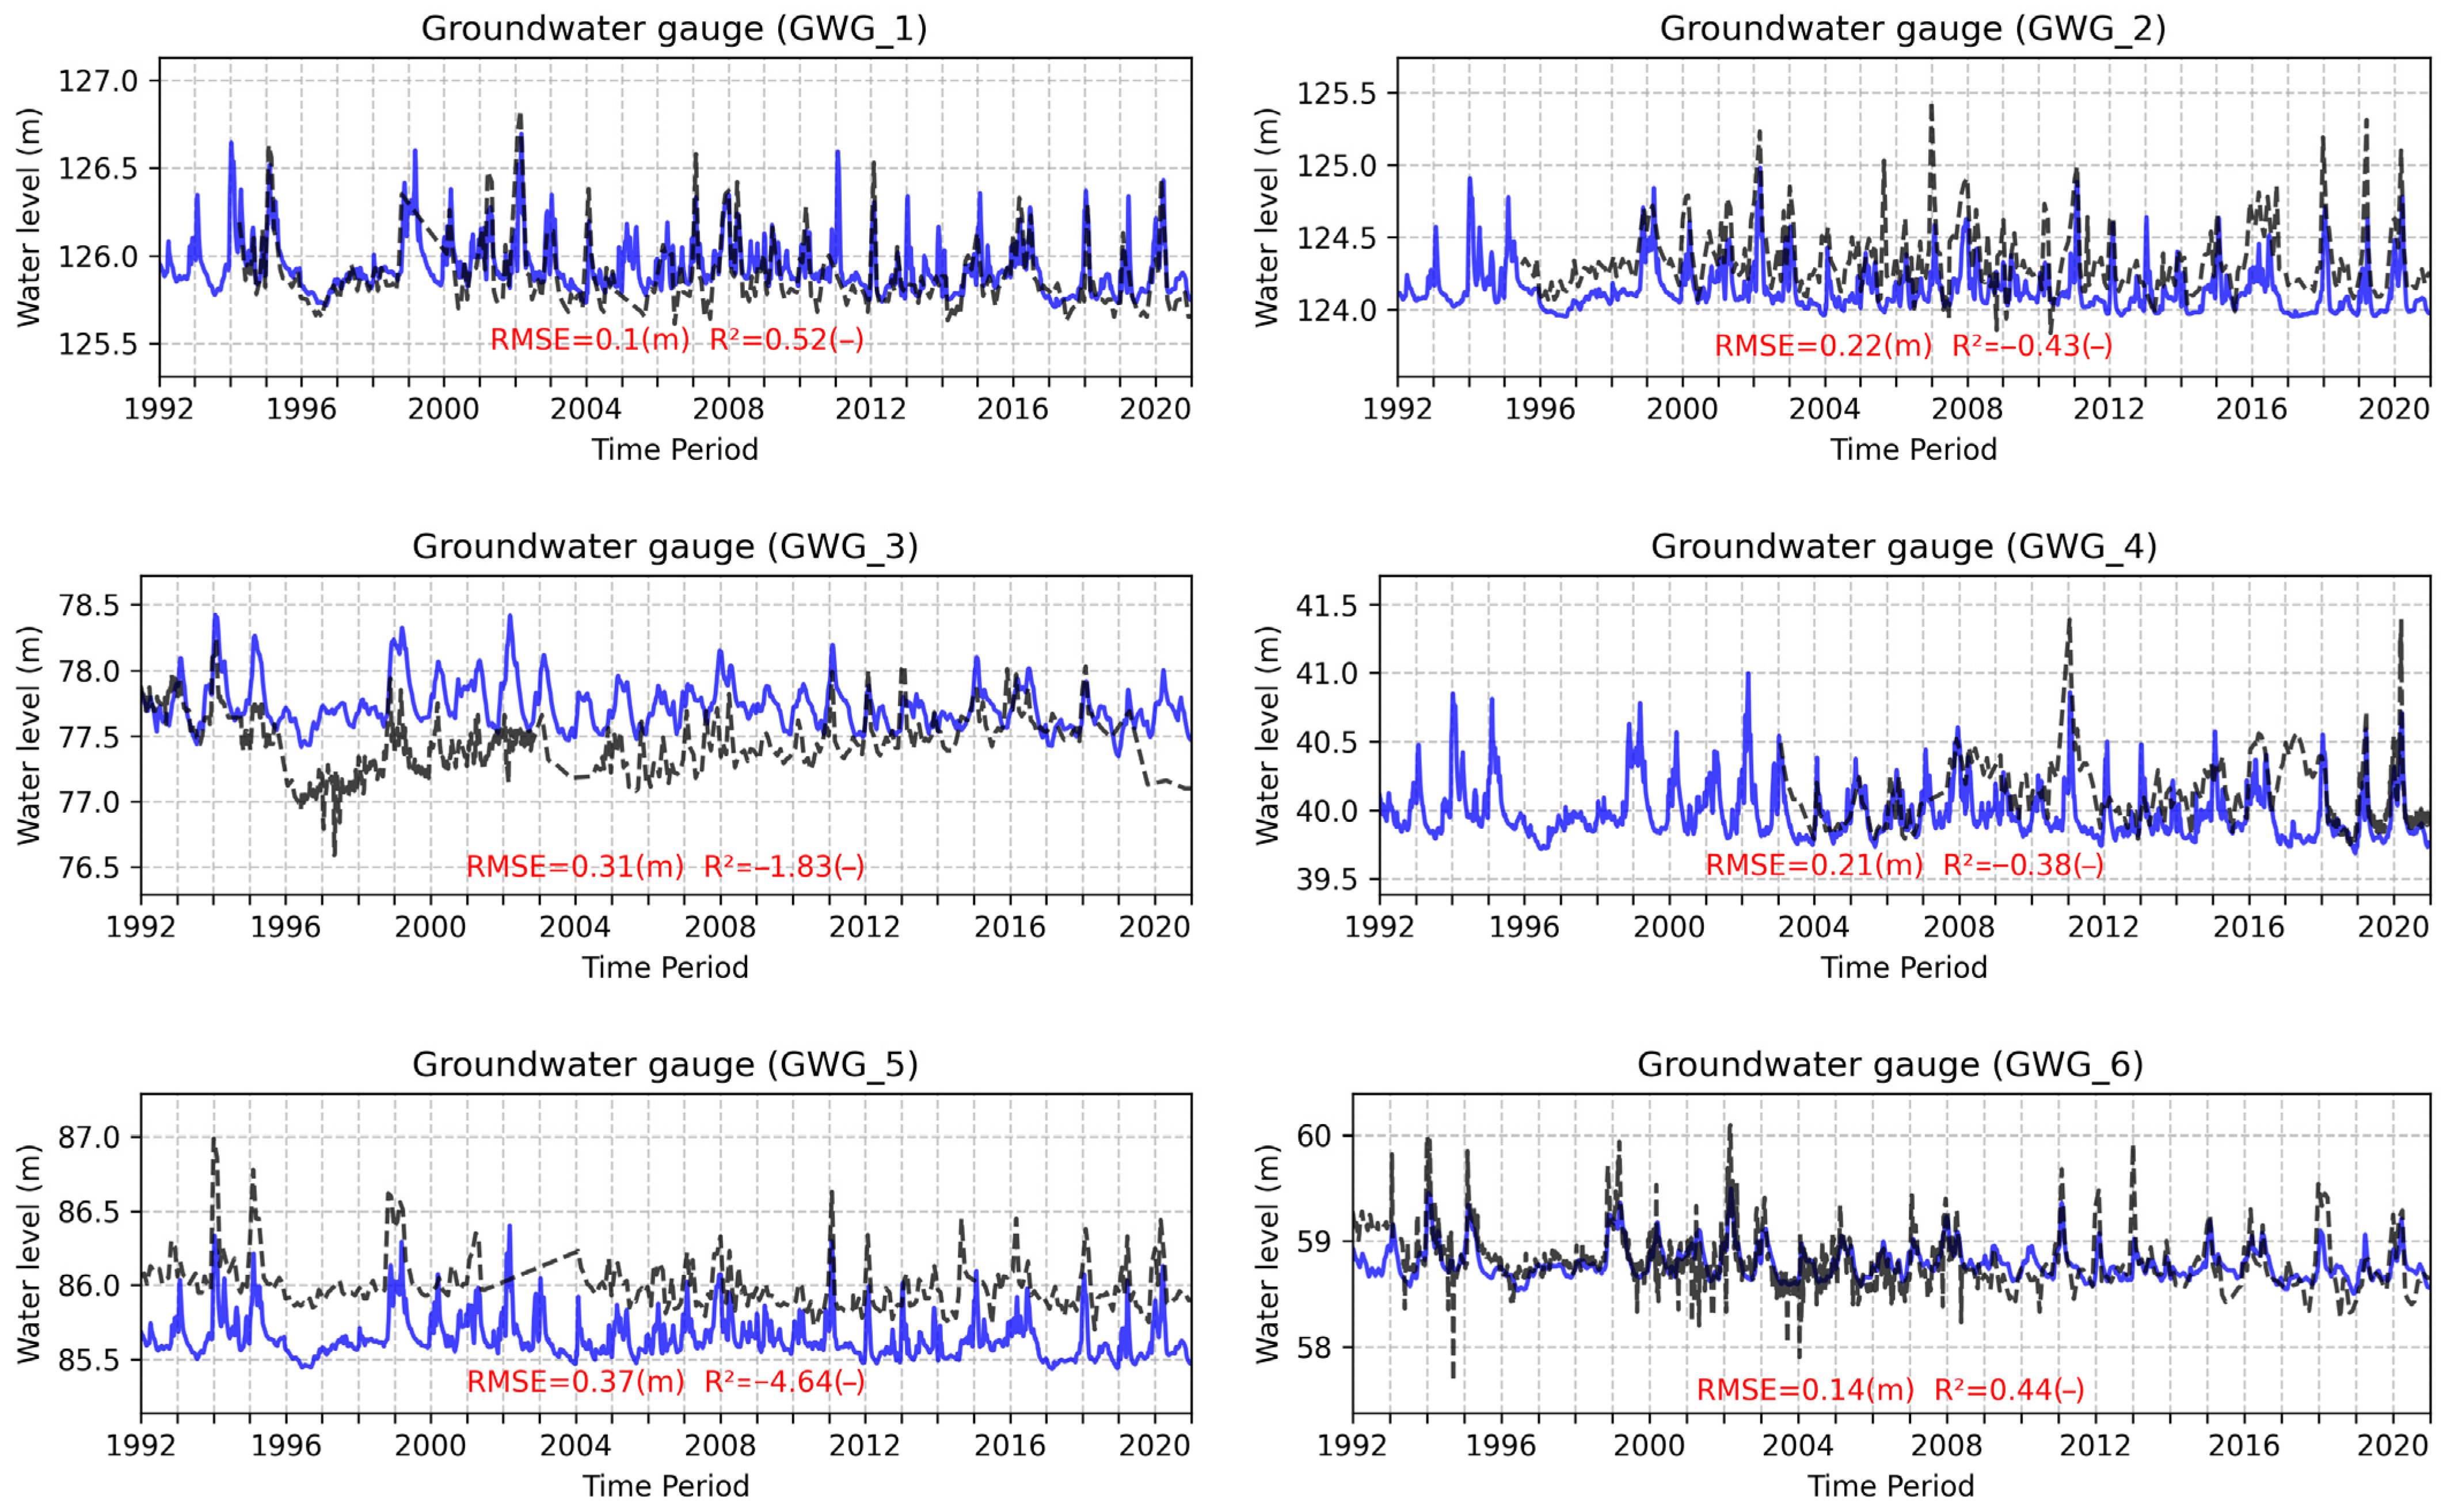
To evaluate the groundwater dynamics, simulated groundwater levels were compared with observed data at six different monitoring gauges (Figure 6). The spatial locations of these gauges are shown in Figure 5. In Figure 6, the simulations at gauges GWG_1 and GWG_6 closely replicate the temporal dynamics of the observed groundwater levels, indicating a good model performance at these locations.
At gauges GWG_2 and GWG_5, the groundwater model is also able to capture the respective observed trends (Figure 6). However, a consistent offset between the simulated and observed groundwater levels is evident at both GWG_2 and GWG_5, which can be quantified by their RMSE values of 0.22 m and 0.37 m, respectively. Such discrepancies can be attributed to the modeling approach employed in the HYD module. Here, the groundwater zones were simply presented using simplified, homogeneous elements. In contrast, gauge measurements reflect site-specific and time-varying water levels. As a result, this spatial generalization within the model may lead to discrepancies in the magnitude of groundwater levels when compared to point-scale observations, even though the broader temporal dynamics in the surrounding area are reasonably well represented.
In contrast, gauges GWG_3 and GWG_4 exhibit different patterns between observed and simulated data (Figure 6). At gauge GWG_3, the simulated data correspond closely with observations during the period from 1992 to 1994. However, following 1995, the observed water levels abruptly declined to approximately 77 m and subsequently recovered to 77.8 m by 2015, at which point alignment with the simulated data was observed. For gauge GWG_4, no observed data are available before 2004. Similar to the pattern at gauge GWG_3, certain periods show good agreement between observed and simulated values, e.g., for periods of 2004–2008 and 2018–2021. At other periods, e.g., from 2008 to 2018, the model tended to underestimate the observed groundwater levels. For both gauges, irregular fluctuations in the observed groundwater levels are evident, in contrast to the smoother temporal dynamics produced by the simulation. These discrepancies are potentially due to the anthropogenic activities in the respective areas, which were not represented in the model and therefore not reflected in the simulated results.

3.2.2. River Results

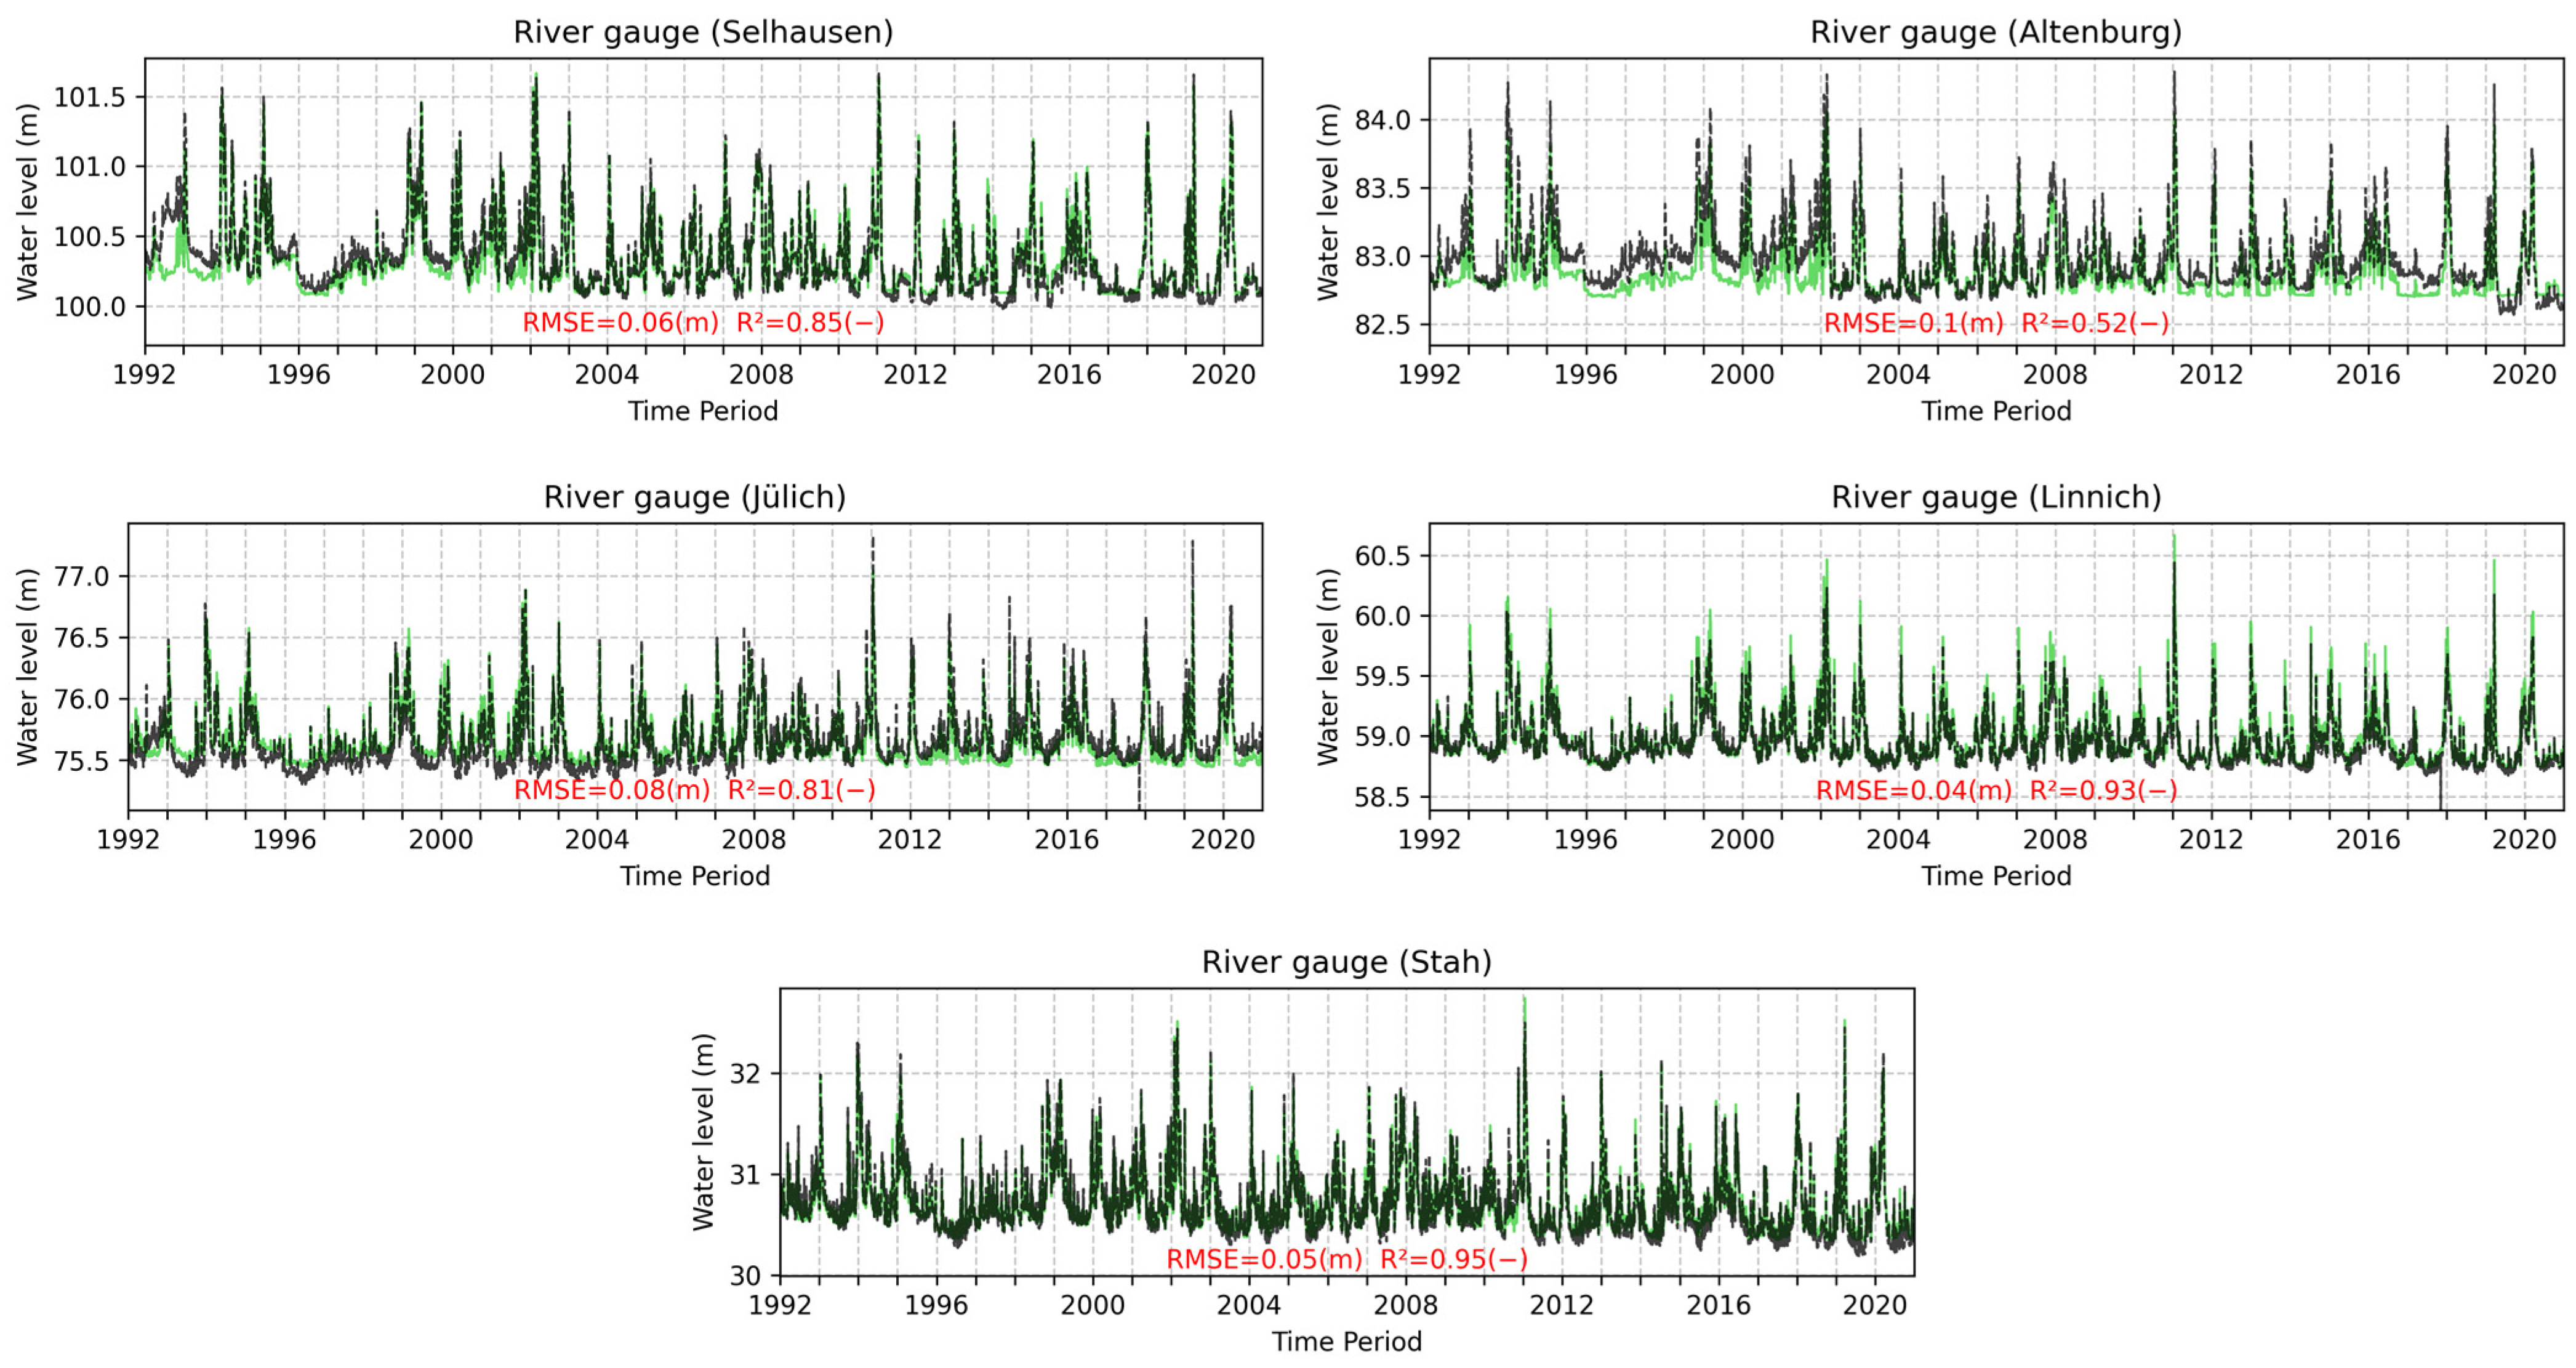
During the long-term simulation, the RMSE values for simulated river water levels at gauges Selhausen, Altenburg, Jülich, Linnich, and Stah were 0.06 m, 0.10 m, 0.08 m, 0.04 m, and 0.05 m, and the corresponding R2 values were 0.85, 0.52, 0.81, 0.93, and 0.95, respectively. Among all gauges, Stah and Linnich exhibited the best model performance, as evidenced by their high R2 values and low RMSEs. Selhausen and Jülich followed, with Jülich showing only moderate performance, as reflected by a relatively lower R2 value of 0.52.
Figure 7 illustrates the comparisons between simulated and observed data at different gauges. Here, simulated water levels at gauge Stah align closely with observed values throughout the entire study period. At Linnich, the overall trends in water level dynamics are also well captured. However, the model systematically overestimates flood peaks. In contrast, at gauges Selhausen and Altenburg, although occasional alignment with observations was noted during specific periods, a consistent long-term agreement was not achieved. Notably, simulations at Selhausen and Altenburg underestimated observed water levels from 1992 to 1997, while at Jülich, the model tended to overestimate. However, during other intervals such as 2004–2008, simulated temporal trends at these gauges displayed strong correlation with observed data. Furthermore, a rapid decline in observed water levels was evident at Altenburg between 2002 and 2003. Such structural change suggests that the observed data were likely affected by anthropogenic interventions, e.g., relocation of measurement points or local water abstraction and discharge activities. The applied model reproduces natural river dynamics but does not account for anthropogenic influences, naturally leading to periodic discrepancies between simulated and observed data.
To further assess the model’s capability to simulate low-flow conditions with groundwater contributions, an additional river simulation excluding the groundwater model was performed over the same period. Table 4 presents a comparison of statistical metrics (RMSE and R2) for both simulated data over the low-flow months from April to September. At gauges Selhausen, Altenburg, and Stah, incorporation of groundwater generally improves model performance, as indicated by reduced RMSE values and increased R2 values. Notably, at Altenburg and Stah, there is a significant improvement from incorporation of groundwater to no incorporation. Accordingly, their R2 values increase from 0.37 to 0.50 and from 0.83 to 0.90, while RMSE values decrease by 0.01 m and 0.02 m, respectively. Conversely, at Jülich Stadion and Linich gauges, the simulation without groundwater contribution yielded slightly better results. However, these improvements were generally minimal. For example, the RMSE values decreased by only 0.001 m at gauge Jülich and 0.002 m at gauge Linnich, while the corresponding R2 values remained nearly unchanged. This suggests that the incorporation of groundwater has no impact on simulation results at these locations (gauges Jülich Stadion and Linnich).

3.2.3. Exchange Between Groundwater and River Systems

During the long-term simulation, groundwater–river exchange fluxes were also calculated, which enables an assessment of their spatio-temporal patterns along the Rur reach from 1991 to 2020.
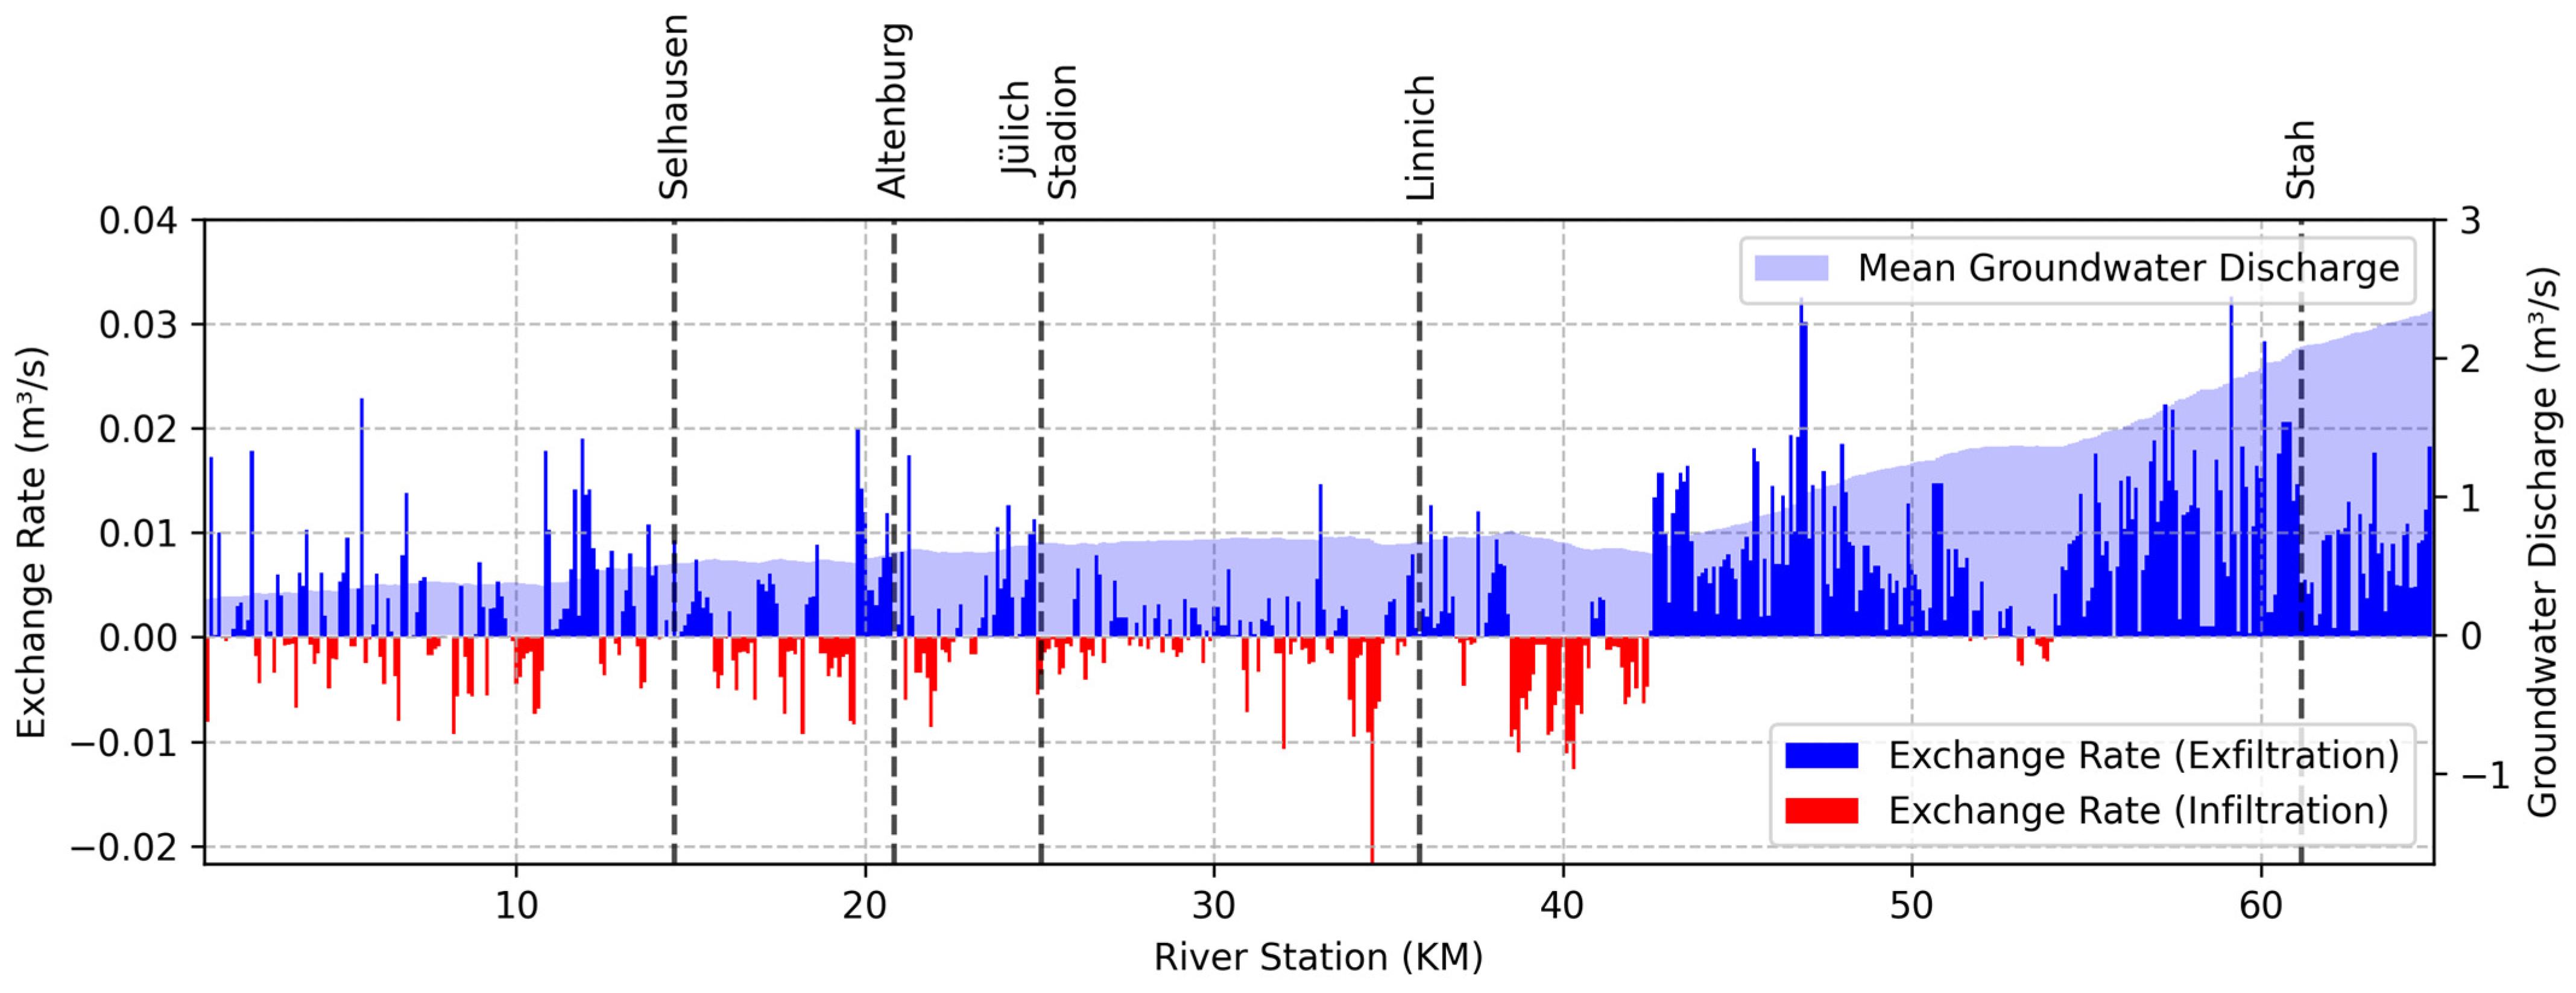
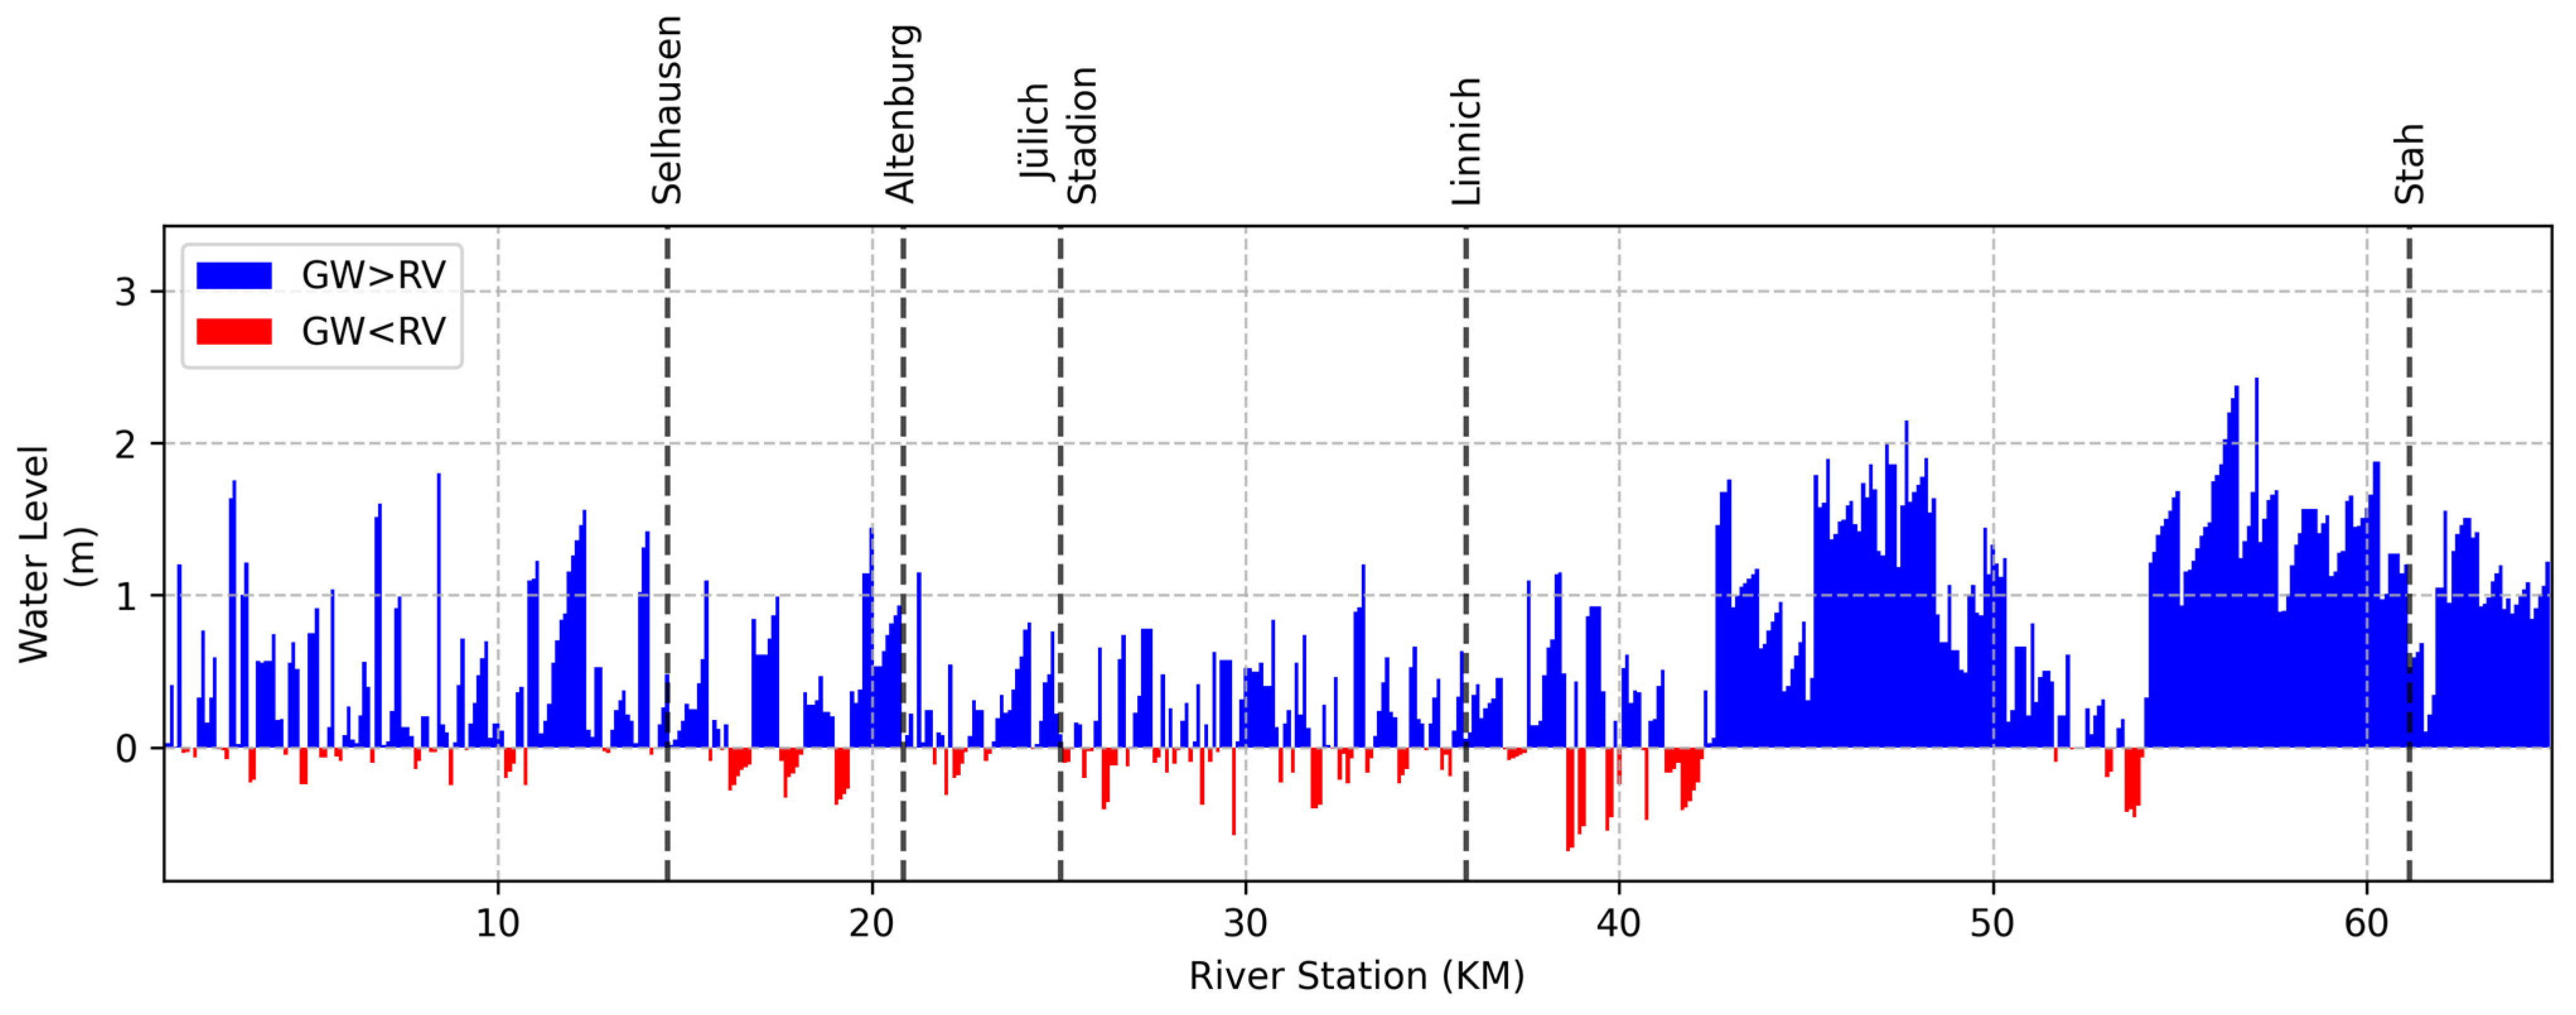
In terms of spatial analysis, exchange rates at each coupling point quantify the local groundwater–river interaction, while cumulative groundwater discharge was determined by summing exchange rates from the inlet to each respective point. Figure 8 illustrates the spatial distribution of average exchange rates and groundwater discharge along the Rur River reach for periods of 1992–2020. From the inlet to station 42 km, exchange rates exhibit significant spatial variability, ranging approximately from −0.02 m3/s to +0.02 m3/s. Certain segments are predominantly characterized by infiltration, while others are primarily influenced by exfiltration. Despite this localized variability, cumulative groundwater discharge remains positive between 0.3 and 0.75 m3/s, indicating a net long-term groundwater contribution along this stretch. Downstream of station 42 km, exchange rates become uniformly positive. Furthermore, an analysis of the average hydraulic gradient between groundwater and river levels, derived from simulation data (Figure 9), indicates a pattern similar to the spatial distribution of exchange rates. This implies that variations in exchange rates are significantly influenced by differing hydraulic gradients between groundwater and river levels along the lower Rur.
Accordingly, groundwater discharge progressively increases from 0.75 m3/s to 2.4 m3/s. At gauge Stah, groundwater discharge reaches 2 m3/s, accounting for around 18% of the median river discharge (10.86 m3/s). This highlights the substantial role of groundwater contribution at this location.
In terms of temporal analysis, the temporal resolution of daily groundwater discharge with the comparisons of the averaged river and groundwater levels from 1992 to 2020 is illustrated in Figure 10. The daily groundwater discharge varies from −2.5 m3/s to 1.44 m3/s. For most periods, average groundwater levels are higher than average river water levels, indicating a dominant groundwater exfiltration into the river. Only during short-term flood events, such as those in 2002 and 2011, river levels temporarily exceed groundwater table, resulting in brief infiltration events. This pattern is corroborated by the groundwater discharge curve, where positive rates dominate for most periods and intermittent negative peaks align with major flood events. Notably, these negative rates are much greater than the positive rates, mainly due to the increased wetted perimeter during floods. This enhances groundwater–surface water exchange and consequently leads to higher exchange fluxes.
Additionally, the seasonal patterns of monthly groundwater discharge, groundwater levels, and river water levels were evaluated and are illustrated in Figure 11. A clear seasonal pattern of monthly groundwater discharge is identified, with the peak in May (18.3 m3/s), followed by April (16.6 m3/s), June (16.6 m3/s), and July (15.9 m3/s). The moderate values (12.3–13.7 m3/s) were observed in February, March, and from August to October. During the winter months, river water levels are elevated, while monthly groundwater discharge decreases (January: 5.7 m3/s, November: 8.7 m3/s, and December: 8.3 m3/s). Both groundwater and river water levels exhibit similar temporal trends throughout the year. However, river water levels fluctuate over a broader range (69.56 m to 61.3 m) compared to the relatively stable groundwater levels (69.61 m to 68.2 m). Furthermore, river water levels demonstrate more pronounced short-term fluctuations than groundwater levels, which show smoother and more gradual changes over time. These comparisons about different flow dynamics indicate that river stages respond rapidly to precipitation and runoff events, while groundwater levels display a more buffered response due to the aquifer’s storage capacity.

4. Discussion

4.1. The Long-Term Simulation Along the Rur Reach

The HYD module within the LoFloDes is designed to simulate the groundwater and river system considering groundwater–river interaction over an extended simulation period. The module was applied in the Rur River reach to conduct a long-term simulation of both river and groundwater systems from 1991 to 2020.
A key challenge in long-term simulation is maintaining accuracy and stability over extended simulation periods. In this study, the model was calibrated and validated against long-term time series using standard statistical metrics (e.g., R2, RMSE) and temporal flow hydrographs, as suggested by [29,58]. Across most gauges, error metrics fall within acceptable range and hydrograph shapes align reasonably with observations. The contour map of simulated groundwater heads enables us to reproduce the spatial groundwater levels distribution based on the gridded data, further confirming spatial consistency. These results demonstrate both the accuracy and numerical stability of the model over extended runs.
Regarding the groundwater system, Rasters 1 and 5 exhibit low statistical errors in reproducing groundwater–head contours, whereas Rasters 2, 3, and 4 show significant deviations in certain contours. These mismatches correspond to areas affected by localized anthropogenic activities. Visual comparisons at groundwater monitoring gauges GWG_3 and GWG_4 further support the presence of localized human influences in the area. In many cases, human extraction exerts a greater influence on groundwater dynamics than climatic variability [59,60]. To improve reliability, future model setups should explicitly incorporate these anthropogenic stressors.
In terms of the river system, the model performance was lower at gauges Selhausen, Altenburg, and Jülich. The primary reason is that observed water levels at these three stations are heavily influenced by human influences, e.g., local industrial and energy facilities. For example, the Weisweiler power plant extracts about 12 million m3/year from the Rur for the cooling process. Additionally, the Jülich wastewater treatment plant is situated close to the gauge Jülich, which discharges around 4 million m3/year of treated effluent (Land NRW 2024). Such anthropogenic withdrawals and discharges significantly influence the natural hydrograph, leading to irregular flow patterns that the purely natural, process-based model is unable to reproduce.
Conversely, the simulated hydrograph at the gauge Linnich shows good agreement with observed data under low-flow conditions but degrades during flood events. This is a consequence of having calibrated key parameters, namely the leakage coefficient (kfrv) and Manning’s n, solely against dry periods from 2002 to 2005. Floods tend to clean sediments from the riverbed and banks, increasing bed permeability and thus leakage rates. Accordingly, Bucher and Denneborg [55] reported that the Rur’s leakage coefficient can rise from 5 × 10⁻⁶ s−1 under normal conditions to 1 × 10⁻⁵ s−1 during flood conditions, and Doppler et al. [61] emphasized the importance of a dynamically varying leakage factor in coupled models. Similarly, Satzinger and Bachmann [38] discussed that the application of the Manning’s n value, which was calibrated during low-flow phases, can lead to inaccuracies during higher discharge phases. In this study, parameterization based solely on dry-period data therefore limits accuracy during high-flow events, and future applications should consider calibration across the full range of flow regimes.
Additionally, spatial analysis of groundwater–surface water exchange rates indicates a progressive increase in groundwater contribution from the river inlet to its outlet. Geologically, the upper, mountainous section of the Rur is characterized by steep gradients and rapid runoff, whereas the lower reach traverses a broad alluvial plain with gentle slopes, gravel–sand substrates, and wide floodplains [48]. These conditions of the lower reach naturally promote enhanced surface water–groundwater exchange, consistent with the simulation results. Temporal analysis further reveals a persistent long-term groundwater contribution along the Rur River. Monthly groundwater discharge shows a clear seasonal variability, ranging from 5 m3/s to 17.5 m3/s. These values are comparable to those reported by Bailey et al. [28] (18.4 m3/s–22.4 m3/s) and Zhou et al. [62] (7.6 m3/s–27.3 m3/s). In agreement with these studies, monthly groundwater discharge tends to be higher during periods of low river water levels and lower during flood events. This inverse relationship between groundwater discharge and river stage was also documented by Rahimi et al. [63]. In summary, groundwater–river interactions significantly influence the local hydrological regime of the studied Rur River reach, with effects that are temporally increased during low-flow periods and spatially enhanced from upstream to downstream.
The results of the spatio-temporal analysis of exchange rates provide further context for the comparative simulations with and without groundwater contributions. Here, the river simulation with groundwater shows marked improvements during low-flow months at most gauges. Especially at gauge Stah, both metrics R2 (0.90 vs. 0.83) and RMSE (0.051 vs. 0.07) show significant enhancement. These findings are consistent with those of Bailey et al. [28], who reported a higher R2 value for simulated river discharge using SWAT-MODFLOW (with groundwater contribution; R2 = 0.40) compared to SWAT alone (without groundwater contribution; R2 = 0.35). Notably, the Stah gauge is situated in the downstream reach, an area characterized by intensified groundwater contributions. Without groundwater contributions, the model struggles to reproduce actual river dynamics, resulting in significantly poorer performance compared to the simulation with groundwater contributions.
Furthermore, ensuring computational efficiency in long-term simulations is essential. Both temporal and spatial resolutions have a major impact on run time. Numerous model users have employed monthly or weekly time steps in their coupled models [9,28,32]. However, this coarse discretization can miss critical daily low-flow events. In the study, the model was synchronized using a daily time step. The spatial resolution was chosen based on the rule to balance accurate representation of groundwater and river water distributions with minimal computational cost. The use of efficient numerical solvers further enhances computational efficiency. As a result, this configuration achieves a relative computational speed of 0.9 s per simulation step and a normalized performance index of 0.0016 s per step and element when utilizing a standard computer system. For comparison, an exemplary study employing MODFLOW was selected. In this case, a 22-year simulation of a coupled groundwater–river models was conducted, and Table 5 describes the detailed model configurations and results. Based on this information, a normalized performance index of 0.00034 s per step per element was calculated. While MODFLOW demonstrates higher computational efficiency than LoFloDes under these metrics, it should be noted that LoFloDes incorporates bidirectional coupling and employs a much finer river resolution, inherently increasing computational complexity at each computation step. Overall, the achieved simulation efficiency by this study case is considered acceptable for practical long-term applications.

4.2. Discussion on Software Usability and Further Application

Based on long-term simulations of the Rur River catchment, the HYD module reliably captures the coupled dynamics of groundwater and surface water. To date, the impact of river-to-groundwater infiltration during drought periods has been little studied [64]. Owing to the robust coupling, numerical stability, and computational efficiency over extended runs of the HYD module, it is ideally suited to investigate the process. Moreover, it can readily incorporate other key factors, such as anthropogenic influences (e.g., groundwater pumping) and irregular precipitation events, by applying point and areal boundary conditions to the groundwater elements, to facilitate in-depth studies of complex drought-propagation processes in groundwater and river system under human impact.
As a part of the LoFloDes, the LoFloDes inherits the features of ProMaiDes. It is a free and open-source software involving multiple open and free helper tools e.g., QGIS, ParaView for data assessment and data visualization. It integrates both groundwater and river systems through the modular designing, so that the users can freely implement their desired models for physical process-based base flow analysis. Furthermore, it is part of the DryRivers project, which has introduced a novel holistic approach to low-flow risk analysis. The results from the hydrodynamic analysis conducted by the HYD module are directly utilized to assess socio-economic, e.g., impacts on river navigation [65] and ecological consequences [38], suggesting a no error-prone exchange of data and enabling to quantify low-flow risks. Based on these analyses, water stakeholders can better understand the trade-offs between different water uses and make more informed management decisions during low-flow conditions.
However, improved model development and expanded usage of LoFloDes in different case studies are needed. Specific software developments focus on linking with a hydrological model to enhance groundwater recharge performance by incorporating snow impact and land-use factors. To further enhance model calibration, future development may incorporate inverse calibration methods and AI-based approaches. Moreover, various coupling techniques, including the non-linear Rushton approach and dynamic coupling approach, should be tested for better modelling performance. For the Rur model specifically, additional influential factors such as groundwater pumping and wastewater withdrawal should be incorporated to increase model accuracy. Furthermore, since the current model is limited to areas along the Rur River reach, extending simulations to encompass the entire aquifer system would provide a more comprehensive understanding of groundwater–river interactions and their effects on both river and groundwater dynamics over long-term periods.

5. Conclusions

In the HYD module of the LoFloDes software, a physically based modelling approach was implemented, comprising a 1D river module, a 2D groundwater module, and a bidirectional coupling strategy. This integrated framework improves accuracy of low-flow simulations over extended simulation periods while explicitly accounting for dynamic exchange processes between groundwater and surface water.
The model was applied in a case study to the Rur River, with calibration conducted for the period 2002–2005 and validation from 1991 to 2020. During the long-term simulation (1991–2020), the model successfully reproduced general temporal trends at selected river and groundwater gauges. Additionally, contour lines generated from simulated groundwater levels and gridded data exhibited strong agreement, further confirming the model’s high spatial accuracy. However, the current model excluded human influences and only represents natural hydrological dynamics. This limitation affected simulation accuracy in the areas impacted by human activities (e.g., gauges Selhausen, Altenburg, and Jülich). In future simulations, these factors should be incorporated.
Furthermore, simulated data for low-flow months were compared with results from a model excluding groundwater contributions. The findings indicate that incorporating groundwater significantly improves the simulation of river water levels, particularly at the Stah gauge in the downstream section. This improvement corresponds to intensified groundwater contributions observed in the spatio-temporal patterns of groundwater–river interactions from upstream to downstream. Additionally, the results reveal increasing groundwater discharge rates during low-flow periods, further underscoring the critical role of groundwater contributions during these phases.
In conclusion, there is a successful application of HYD model in the Rur River area, showing robust representation of local groundwater and river dynamics as well as numerical stability and efficiency over extended simulation periods. With these characteristics, the HYD model is a valuable tool for investigating integrated groundwater–river interactions in future studies.

Author Contributions

Y.W.: writing—original draft, software, conceptualization, methodology, visualization, formal analysis. D.B.: supervision, software, writing—review and editing. H.S.: supervision, writing—review and editing. All authors have read and agreed to the published version of the manuscript.

Funding

This research was conducted as part of the DryRivers project, funded under the Water Extreme Events (WaX) program by the German Federal Ministry of Education and Research (Bundesministerium für Bildung und Forschung) with the project number FKZ 02WEE1628A. Open access funding provided by the Open Access Publishing Fund of RWTH Aachen University.

Data Availability Statement

The simulations in this study were carried out using the software LoFloDes, developed by Daniel Bachmann, You Wu, Udo Satzinger, and Bastian Winkels. The program, first released in 2024, is written in C++ and its source code is available at https://github.com/dabachma/LoFloDes. Detailed documentation on installation, testing, and deployment can be found at https://promaides.myjetbrains.com/youtrack/articles/LFD (work in progress). The data analysis was performed using Python 3.12.2 on JupyterLab, and the corresponding analysis scripts are accessible at https://github.com/youimmortal/loflodes_data_analysis. The data used in this study are available from the authors upon reasonable request. For further information about the software LoFloDes, please contact daniel.bachmann@h2.de.

Acknowledgments

We acknowledge Bastian Winkels for assistance in software development. Declaration of generative AI and AI-assisted technologies in the writing process: During the preparation of this work the authors used ChatGPT 4 in order to improve the language used and help create a consistent paper. After using this tool/service, the authors reviewed and edited the content as needed and took full responsibility for the content of the publication.

Conflicts of Interest

The authors declare no conflicts of interest.

Abbreviations

The following abbreviations are used in this manuscript:
LoFloDesLow Flow Decision Support Tool
ProMaiDesProtection Measures against Inundation Decision Support Tool
RVRiver Water
GWGroundwater
HKHydrogeological Map
AIArtificial Intelligence

References

  1. Van Loon, A.F. Hydrological drought explained. WIREs Water 2015, 2, 359–392. [Google Scholar] [CrossRef]
  2. Cenobio-Cruz, O.; Quintana-Seguí, P.; Barella-Ortiz, A.; Zabaleta, A.; Garrote, L.; Clavera-Gispert, R.; Habets, F.; Beguería, S. Improvement of low flows simulation in the SASER hydrological modeling chain. J. Hydrol. X 2023, 18, 100147. [Google Scholar] [CrossRef]
  3. Laaha, G.; Demuth, S.; Hisdal, H.; Kroll, C.N.; van Lanen, H.A.J.; Nester, T.; Rogger, M.; Sauquet, E.; Tallaksen, L.M.; Woods, R.A.; et al. Prediction of low flows in ungauged basins. In Runoff Prediction in Ungauged Basins; Blöschl, G., Sivapalan, M., Wagener, T., Viglione, A., Savenije, H., Eds.; Cambridge University Press: Cambridge, UK, 2013; pp. 163–188. ISBN 9781139235761. [Google Scholar]
  4. Nalbantis, I.; Tsakiris, G. Assessment of Hydrological Drought Revisited. Water Resour. Manag. 2009, 23, 881–897. [Google Scholar] [CrossRef]
  5. van Loon, A.F.; van Lanen, H.A.J. A process-based typology of hydrological drought. Hydrol. Earth Syst. Sci. 2012, 16, 1915–1946. [Google Scholar] [CrossRef]
  6. Stahl, K.; Kohn, I.; Blauhut, V.; Urquijo, J.; De Stefano, L.; Acácio, V.; Dias, S.; Stagge, J.H.; Tallaksen, L.M.; Kampragou, E.; et al. Impacts of European drought events: Insights from an international database of text-based reports. Nat. Hazards Earth Syst. Sci. 2016, 16, 801–819. [Google Scholar] [CrossRef]
  7. Condon, L.E.; Kollet, S.; Bierkens, M.F.P.; Fogg, G.E.; Maxwell, R.M.; Hill, M.C.; Fransen, H.-J.H.; Verhoef, A.; Van Loon, A.F.; Sulis, M.; et al. Global Groundwater Modeling and Monitoring: Opportunities and Challenges. Water Resour. Res. 2021, 57, e2020WR029500. [Google Scholar] [CrossRef]
  8. Marchionni, V.; Daly, E.; Manoli, G.; Tapper, N.J.; Walker, J.P.; Fatichi, S. Groundwater Buffers Drought Effects and Climate Variability in Urban Reserves. Water Resour. Res. 2020, 56, e2019WR026192. [Google Scholar] [CrossRef]
  9. Hellwig, J. Grundwasserdürren in Deutschland von 1970 bis 2018. Korresp. Wasserwirtsch. 2019, 12, 10. [Google Scholar]
  10. Haque, A.; Salama, A.; Lo, K.; Wu, P. Surface and Groundwater Interactions: A Review of Coupling Strategies in Detailed Domain Models. Hydrology 2021, 8, 35. [Google Scholar] [CrossRef]
  11. Lewandowski, J.; Meinikmann, K.; Krause, S. Groundwater–Surface Water Interactions: Recent Advances and Interdisciplinary Challenges. Water 2020, 12, 296. [Google Scholar] [CrossRef]
  12. Kelly, L.; Kalin, R.M.; Bertram, D.; Kanjaye, M.; Nkhata, M.; Sibande, H. Quantification of Temporal Variations in Base Flow Index Using Sporadic River Data: Application to the Bua Catchment, Malawi. Water 2019, 11, 901. [Google Scholar] [CrossRef]
  13. Zink, M.; Samaniego, L.; Kumar, R.; Thober, S.; Mai, J.; Schäfer, D.; Marx, A. The German drought monitor. Environ. Res. Lett. 2016, 11, 74002. [Google Scholar] [CrossRef]
  14. Mishra, A.K.; Singh, V.P. A review of drought concepts. J. Hydrol. 2010, 391, 202–216. [Google Scholar] [CrossRef]
  15. Chung, S.Y.; Kim, G.-B.; Senapathi, V. Drought and Groundwater Development. Water 2023, 15, 1908. [Google Scholar] [CrossRef]
  16. Tallaksen, L.M.; Van Lanen, H.A.J. (Eds.) Hydrological Drought: Processes and Estimation Methods for Streamflow and Groundwater, 1st ed.; Reprint; Elsevier: Amsterdam, The Netherlands, 2004; ISBN 0444517677. [Google Scholar]
  17. Haslinger, K.; Koffler, D.; Schöner, W.; Laaha, G. Exploring the link between meteorological drought and streamflow: Effects of climate-catchment interaction. Water Resour. Res. 2014, 50, 2468–2487. [Google Scholar] [CrossRef]
  18. Bloomfield, J.P.; Marchant, B.P. Analysis of groundwater drought building on the standardised precipitation index approach. Hydrol. Earth Syst. Sci. 2013, 17, 4769–4787. [Google Scholar] [CrossRef]
  19. Stoelzle, M.; Stahl, K.; Morhard, A.; Weiler, M. Streamflow sensitivity to drought scenarios in catchments with different geology. Geophys. Res. Lett. 2014, 41, 6174–6183. [Google Scholar] [CrossRef]
  20. Hellwig, J.; Stahl, K. An assessment of trends and potential future changes in groundwater-baseflow drought based on catchment response times. Hydrol. Earth Syst. Sci. 2018, 22, 6209–6224. [Google Scholar] [CrossRef]
  21. Carlier, C.; Wirth, S.B.; Cochand, F.; Hunkeler, D.; Brunner, P. Exploring Geological and Topographical Controls on Low Flows with Hydrogeological Models. Ground Water 2019, 57, 48–62. [Google Scholar] [CrossRef]
  22. Zhou, Y.; Li, W. A review of regional groundwater flow modeling. Geosci. Front. 2011, 2, 205–214. [Google Scholar] [CrossRef]
  23. Guevara-Ochoa, C.; Medina-Sierra, A.; Vives, L. Spatio-temporal effect of climate change on water balance and interactions between groundwater and surface water in plains. Sci. Total Environ. 2020, 722, 137886. [Google Scholar] [CrossRef]
  24. Huo, A.-D.; Dang, J.; Song, J.-X.; Chen, X.H.; Mao, H.-R. Simulation modeling for water governance in basins based on surface water and groundwater. Agric. Water Manag. 2016, 174, 22–29. [Google Scholar] [CrossRef]
  25. Surinaidu, L.; Muthuwatta, L.; Amarasinghe, U.A.; Jain, S.K.; Ghosh, N.C.; Kumar, S.; Singh, S. Reviving the Ganges Water Machine: Accelerating surface water and groundwater interactions in the Ramganga sub-basin. J. Hydrol. 2016, 540, 207–219. [Google Scholar] [CrossRef]
  26. Amanambu, A.C.; Obarein, O.A.; Mossa, J.; Li, L.; Ayeni, S.S.; Balogun, O.; Oyebamiji, A.; Ochege, F.U. Groundwater system and climate change: Present status and future considerations. J. Hydrol. 2020, 589, 125163. [Google Scholar] [CrossRef]
  27. Singh, A. Groundwater modelling for the assessment of water management alternatives. J. Hydrol. 2013, 481, 220–229. [Google Scholar] [CrossRef]
  28. Bailey, R.T.; Wible, T.C.; Arabi, M.; Records, R.M.; Ditty, J. Assessing regional-scale spatio-temporal patterns of groundwater–surface water interactions using a coupled SWAT-MODFLOW model. Hydrol. Process. 2016, 30, 4420–4433. [Google Scholar] [CrossRef]
  29. Guzman, J.A.; Moriasi, D.N.; Gowda, P.H.; Steiner, J.L.; Starks, P.J.; Arnold, J.G.; Srinivasan, R. A model integration framework for linking SWAT and MODFLOW. Environ. Model. Softw. 2015, 73, 103–116. [Google Scholar] [CrossRef]
  30. Rodriguez, L.B.; Cello, P.A.; Vionnet, C.A.; Goodrich, D. Fully conservative coupling of HEC-RAS with MODFLOW to simulate stream–aquifer interactions in a drainage basin. J. Hydrol. 2008, 353, 129–142. [Google Scholar] [CrossRef]
  31. Miro, M.E.; Groves, D.; Tincher, B.; Syme, J.; Tanverakul, S.; Catt, D. Adaptive water management in the face of uncertainty: Integrating machine learning, groundwater modeling and robust decision making. Clim. Risk Manag. 2021, 34, 100383. [Google Scholar] [CrossRef]
  32. Chen, C.; He, W.; Zhou, H.; Xue, Y.; Zhu, M. A comparative study among machine learning and numerical models for simulating groundwater dynamics in the Heihe River Basin, northwestern China. Sci. Rep. 2020, 10, 3904. [Google Scholar] [CrossRef]
  33. Tao, H.; Hameed, M.M.; Marhoon, H.A.; Zounemat-Kermani, M.; Heddam, S.; Kim, S.; Sulaiman, S.O.; Tan, M.L.; Sa’adi, Z.; Mehr, A.D.; et al. Groundwater level prediction using machine learning models: A comprehensive review. Neurocomputing 2022, 489, 271–308. [Google Scholar] [CrossRef]
  34. Langevin, C.D.; Hughes, J.D.; Banta, E.R.; Niswonger, R.G.; Panday, S.; Provost, A.M. Techniques and Methods; US Geological Survey: Reston, VA, USA, 2017. [Google Scholar]
  35. DHI. MIKE SHE Fully Integrated Exercises; Danish Hydraulic Institute: Hørsholm, Denmark, 2025. [Google Scholar]
  36. Aquanty Inc. HydroGeoSphere (HGS) Theory Manual; Aquanty Inc.: Waterloo, ON, Canada, 2025. [Google Scholar]
  37. Maxwell, R.M.; Kollet, S.J.; Smith, S.G.; Woodward, C.S.; Falgout, R.D.; Ferguson, I.M.; Baldwin, C.; Bosl, W.J.; Hornung, R.; Ashby, S.; et al. ParFlow User’s Manual. Available online: https://parflow.readthedocs.io/en/latest/index.html (accessed on 26 September 2025).
  38. Satzinger, U.; Bachmann, D. Conceptual approach for a holistic low-flow risk analysis. Hydrol. Process. 2024, 38, e15217. [Google Scholar] [CrossRef]
  39. Bachmann, D. Beitrag zur Entwicklung eines Entscheidungsunterstützungssystems zur Bewertung und Planung von Hochwasserschutzmaßnahmen; RWTH Aachen University: Aachen, Germany, 2012. [Google Scholar]
  40. Harbaugh, A.W. MODFLOW-2005 : The U.S. Geological Survey modular ground-water model—the ground-water flow process: Techniques and Methods. Tech. Methods 2005, 6-A16. [Google Scholar] [CrossRef]
  41. Hindmarsh, A.; Serban, R. User Documentation for CVODES v2.1.0; United States. Department of Energy by the University of California: Washington, DC, USA, 2009. [Google Scholar]
  42. Wolf, S.S. The Long-Term-Memory of a Typical Mid-European Upland to Lowland River |b or Why We Struggle to Reach a Good Ecological State for Our Rivers; RWTH Aachen University: Aachen, Germany, 2023. [Google Scholar]
  43. Nilson, E. Flusslandschaften im Wandel. In Grenzüberschreitendes Integratives Gewässermanagement; Reineke, T., Lehmkuhl, F., Und Blümel, H., Eds.; Sankt Augustin, Academia-Verl.: Sankt Augustin, Germany, 2006. [Google Scholar]
  44. Forschungszentrum Jülich. MOSYRUR: Water Balance Analysis in the Rur Basin, 1st ed.; Forschungszentrum, Zentralbibliothek: Jülich, Germany, 2005; ISBN 3893363858. [Google Scholar]
  45. Eurostat. CNTR_RG_20M_2024_4326.shp. Available online: https://ec.europa.eu/eurostat/de/web/gisco/geodata/administrative-units/countries (accessed on 10 July 2025).
  46. Johann, P. Grenzen der Belastbarkeit: Die Flüsse Rur (Roer) und Inde im Industriezeitalter; Verlag der Joseph-Kuhl-Gesellschaft: Jülich, Germany, 1994; ISBN 3980398803. [Google Scholar]
  47. WVER. Die Talsperren in der Nordeifel. In 100 Jahre Wasserwirtschaft in der Nordeifel; Wasserverband Eifel-Rur: Düren, Germany, 1999; pp. 64–72. [Google Scholar]
  48. Kufeld, M.; Lange, J.; Hausmann, B. Das Einzugsgebiet der Rur: Ergebnisbericht der im Rahmen des AMICE-Projekts Durchgeführten Literaturrecherche; AMICE, meus, maas; INTERREG IVB North West Europe Project (number 074C); Lehrstuhl und Institut für Wasserbau und Wasserwirtschaft RWTH-CONV-008445: Aachen, Germany, 2010; Available online: https://publications.rwth-aachen.de/record/48070 (accessed on 5 July 2025).
  49. Land NRW. ELWAS-WEB. 2024. Available online: https://www.elwasweb.nrw.de/elwas-web/index.xhtml;jsessionid=B23452E6234727BFB72FCBA00E256060 (accessed on 10 December 2024).
  50. Bezirksregierung Köln. Hydraulik Rur: Hydraulischer Längsschnitt; Bezirksregierung Köln: Köln, Germany, 2019. [Google Scholar]
  51. LANUV NRW. Landesweite Grundwasseroberfläche (Grundwassergleichen) für Mittlere Verhältnisse (2006–2015); LANUV NRW: Düsseldorf, Germany, 2023. [Google Scholar]
  52. DWD Climate Data Center. Grids of Monthly Total Precipitation Over Germany, Version v1.0.; DWD Climate Data Center: Offenbach, Germany, 2018. [Google Scholar]
  53. DWD Climate Data Center. Monthly Grids of the Accumulated Actual Evapotranspiration over Grass and Sandy Loam, Version 0.x; DWD Climate Data Center: Offenbach, Germany, 2018. [Google Scholar]
  54. BGR & SGD. Hydrogeological Map of Germany 1:250,000 (HÜK250); The German State Geological Surveys (SGD) and The Federal Institute for Geosciences and Natural Resources (BGR): Hannover, Germany, 2019. [Google Scholar]
  55. Bucher, B.; Denneborg, M. Infiltrationsverhalten der Rur. In Wasser und Boden; Wasser und Boden GmbH: Boppard, Germany, 1993; pp. 173–177. ISBN 0043-0951. [Google Scholar]
  56. Bollrich, G. Technische Hydromechanik, 4th ed.; Verl. Bauwesen: Berlin, Germany, 1996; ISBN 3345006081. [Google Scholar]
  57. Ntona, M.M.; Busico, G.; Mastrocicco, M.; Kazakis, N. Modeling groundwater and surface water interaction: An overview of current status and future challenges. Sci. Total Environ. 2022, 846, 157355. [Google Scholar] [CrossRef]
  58. Moriasi, D.N.; Arnold, J.G.; van Liew, M.W.; Bingner, R.L.; Harmel, R.D.; Veith, T.L. Model Evaluation Guidelines for Systematic Quantification of Accuracy in Watershed Simulations. Trans. ASABE 2007, 50, 885–900. [Google Scholar] [CrossRef]
  59. Li, X.; Li, G.; Zhang, Y. Identifying Major Factors Affecting Groundwater Change in the North China Plain with Grey Relational Analysis. Water 2014, 6, 1581–1600. [Google Scholar] [CrossRef]
  60. Ren, X.; Li, P.; Wang, D.; Zhang, Q.; Ning, J. Drivers and characteristics of groundwater drought under human interventions in arid and semiarid areas of China. J. Hydrol. 2024, 631, 130839. [Google Scholar] [CrossRef]
  61. Doppler, T.; Franssen, H.-J.H.; Kaiser, H.-P.; Kuhlman, U.; Stauffer, F. Field evidence of a dynamic leakage coefficient for modelling river–aquifer interactions. J. Hydrol. 2007, 347, 177–187. [Google Scholar] [CrossRef]
  62. Zhou, P.; Wang, G.; Mao, H.; Liao, F.; Shi, Z.; Huang, H. Numerical modeling for the temporal variations of the water interchange between groundwater and surface water in a regional great lake (Poyang Lake, China). J. Hydrol. 2022, 610, 127827. [Google Scholar] [CrossRef]
  63. Rahimi, M.; Essaid, H.I.; Wilson, J.T. The role of dynamic surface water-groundwater exchange on streambed denitrification in a first-order, low-relief agricultural watershed. Water Resour. Res. 2015, 51, 9514–9538. [Google Scholar] [CrossRef]
  64. Riedel, T.; Nolte, C.; Beek, T.; Liedtke, J.; Sures, B.; Grabner, D. Niedrigwasser, Dürre und Grundwasserneubildung—Be-standsaufnahme zur Gegen-Wärtigen Situation in Deutsch-land, den Klimaprojektionen und den Existierenden Maß-Nahmen und Strategien; Umweltbundesamt: Dessau-Roßlau, Germany, 2021. [Google Scholar]
  65. Folkens, L.; Bachmann, D.; Satzinger, U.; Schneider, P. The Hydro-Economic Modeling of Low-Flow Events on the Middle Elbe: Assessing Socio-Economic Impacts on River Navigation. Water 2024, 16, 3497. [Google Scholar] [CrossRef]
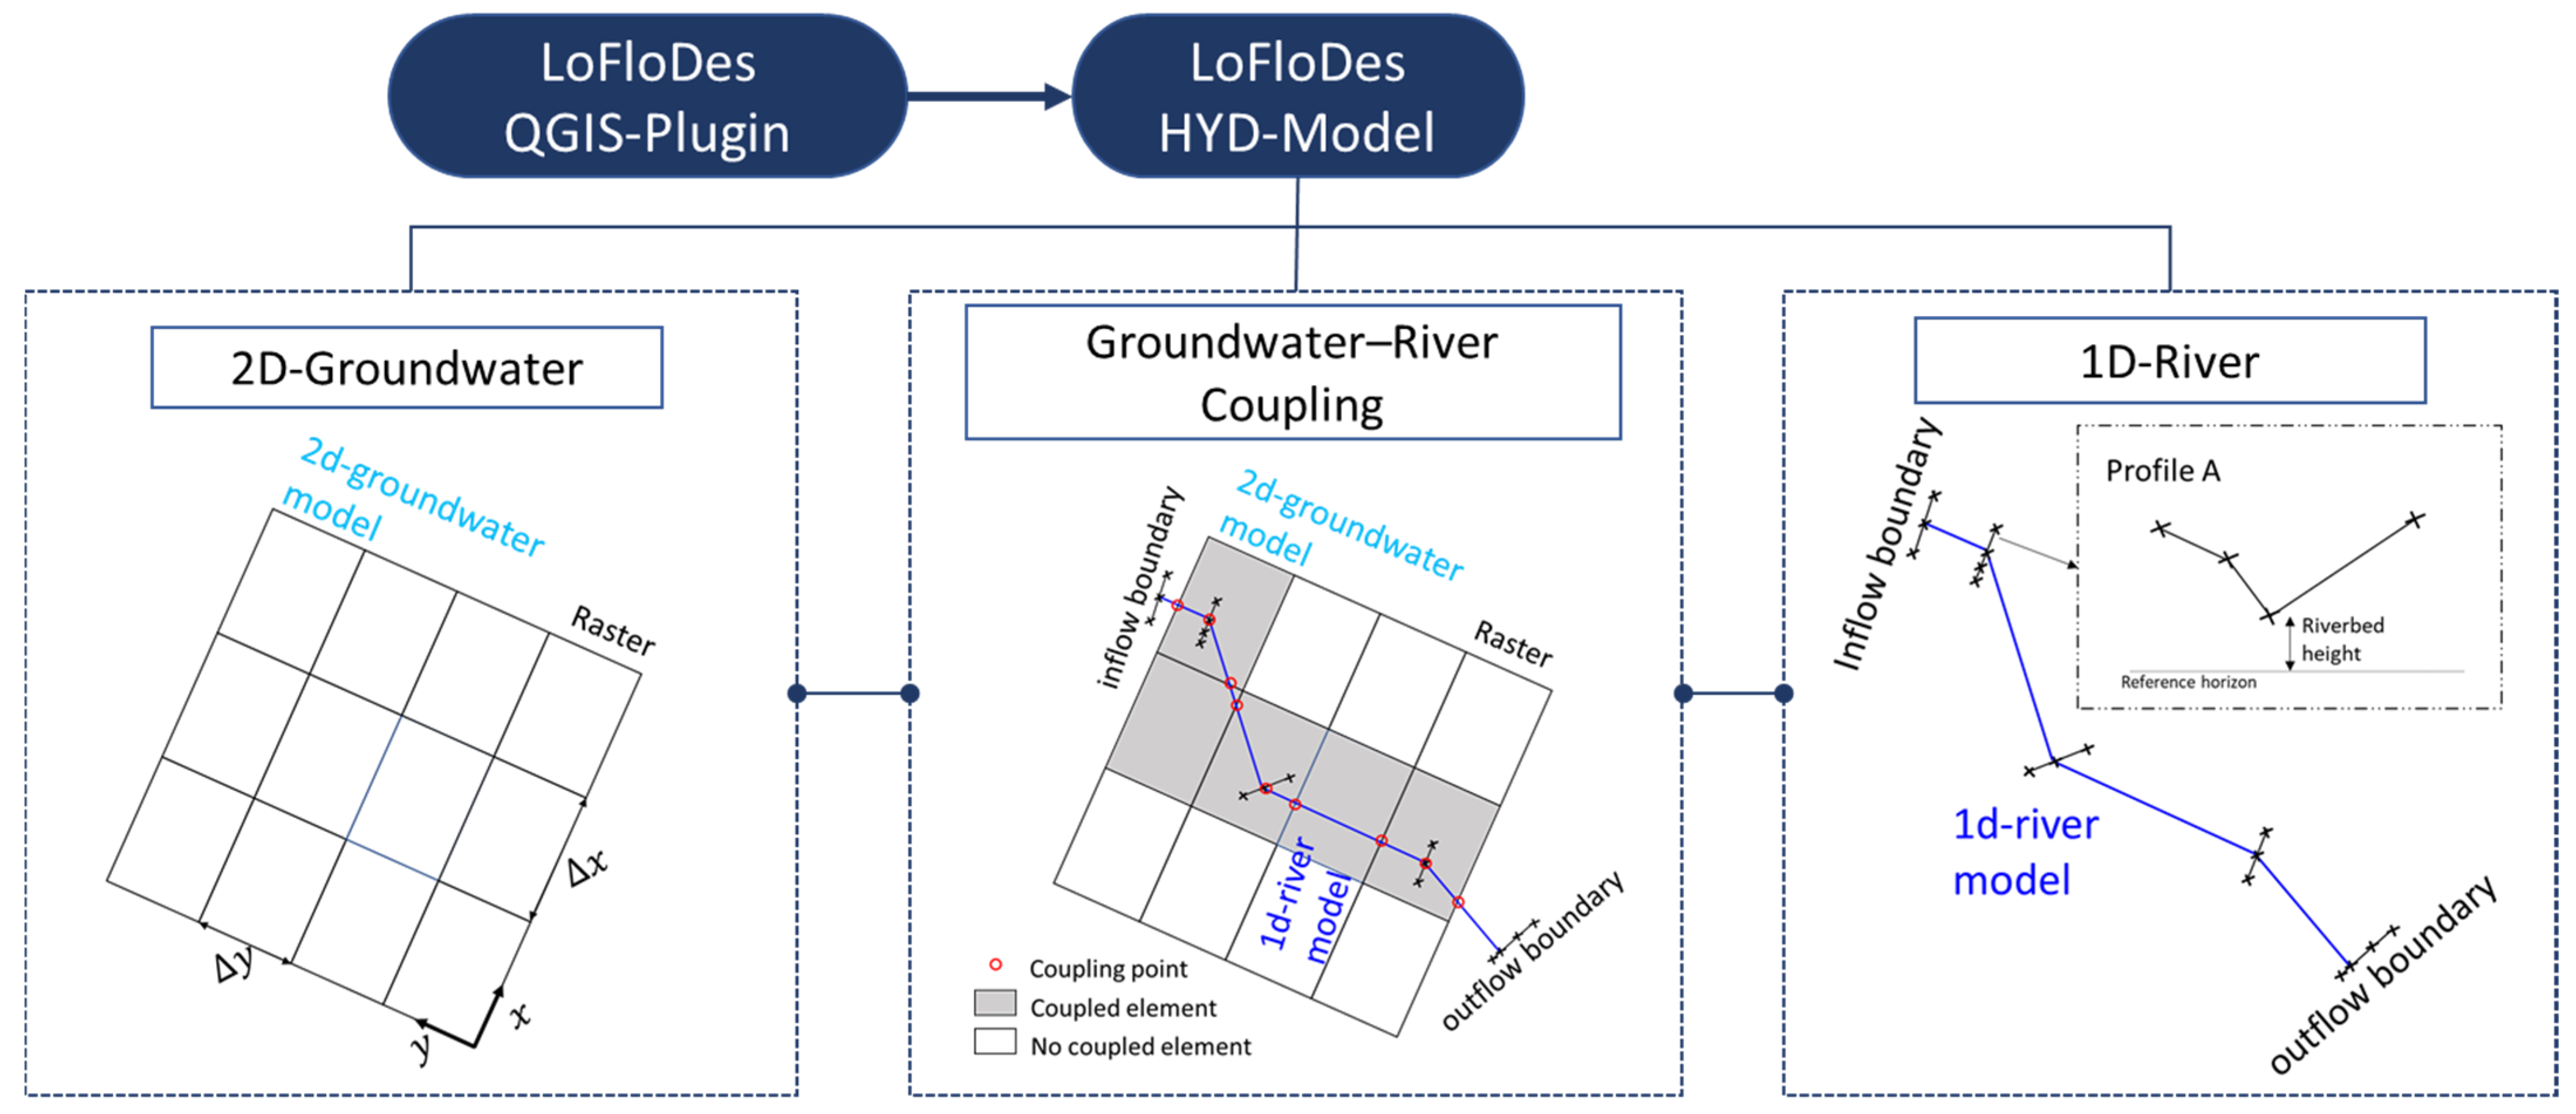
Figure 1. A conceptual modelling framework for the HYD module in LoFloDes integrating with the LoFloDes QGIS-Plugin.
Hydrology 12 00270 g001
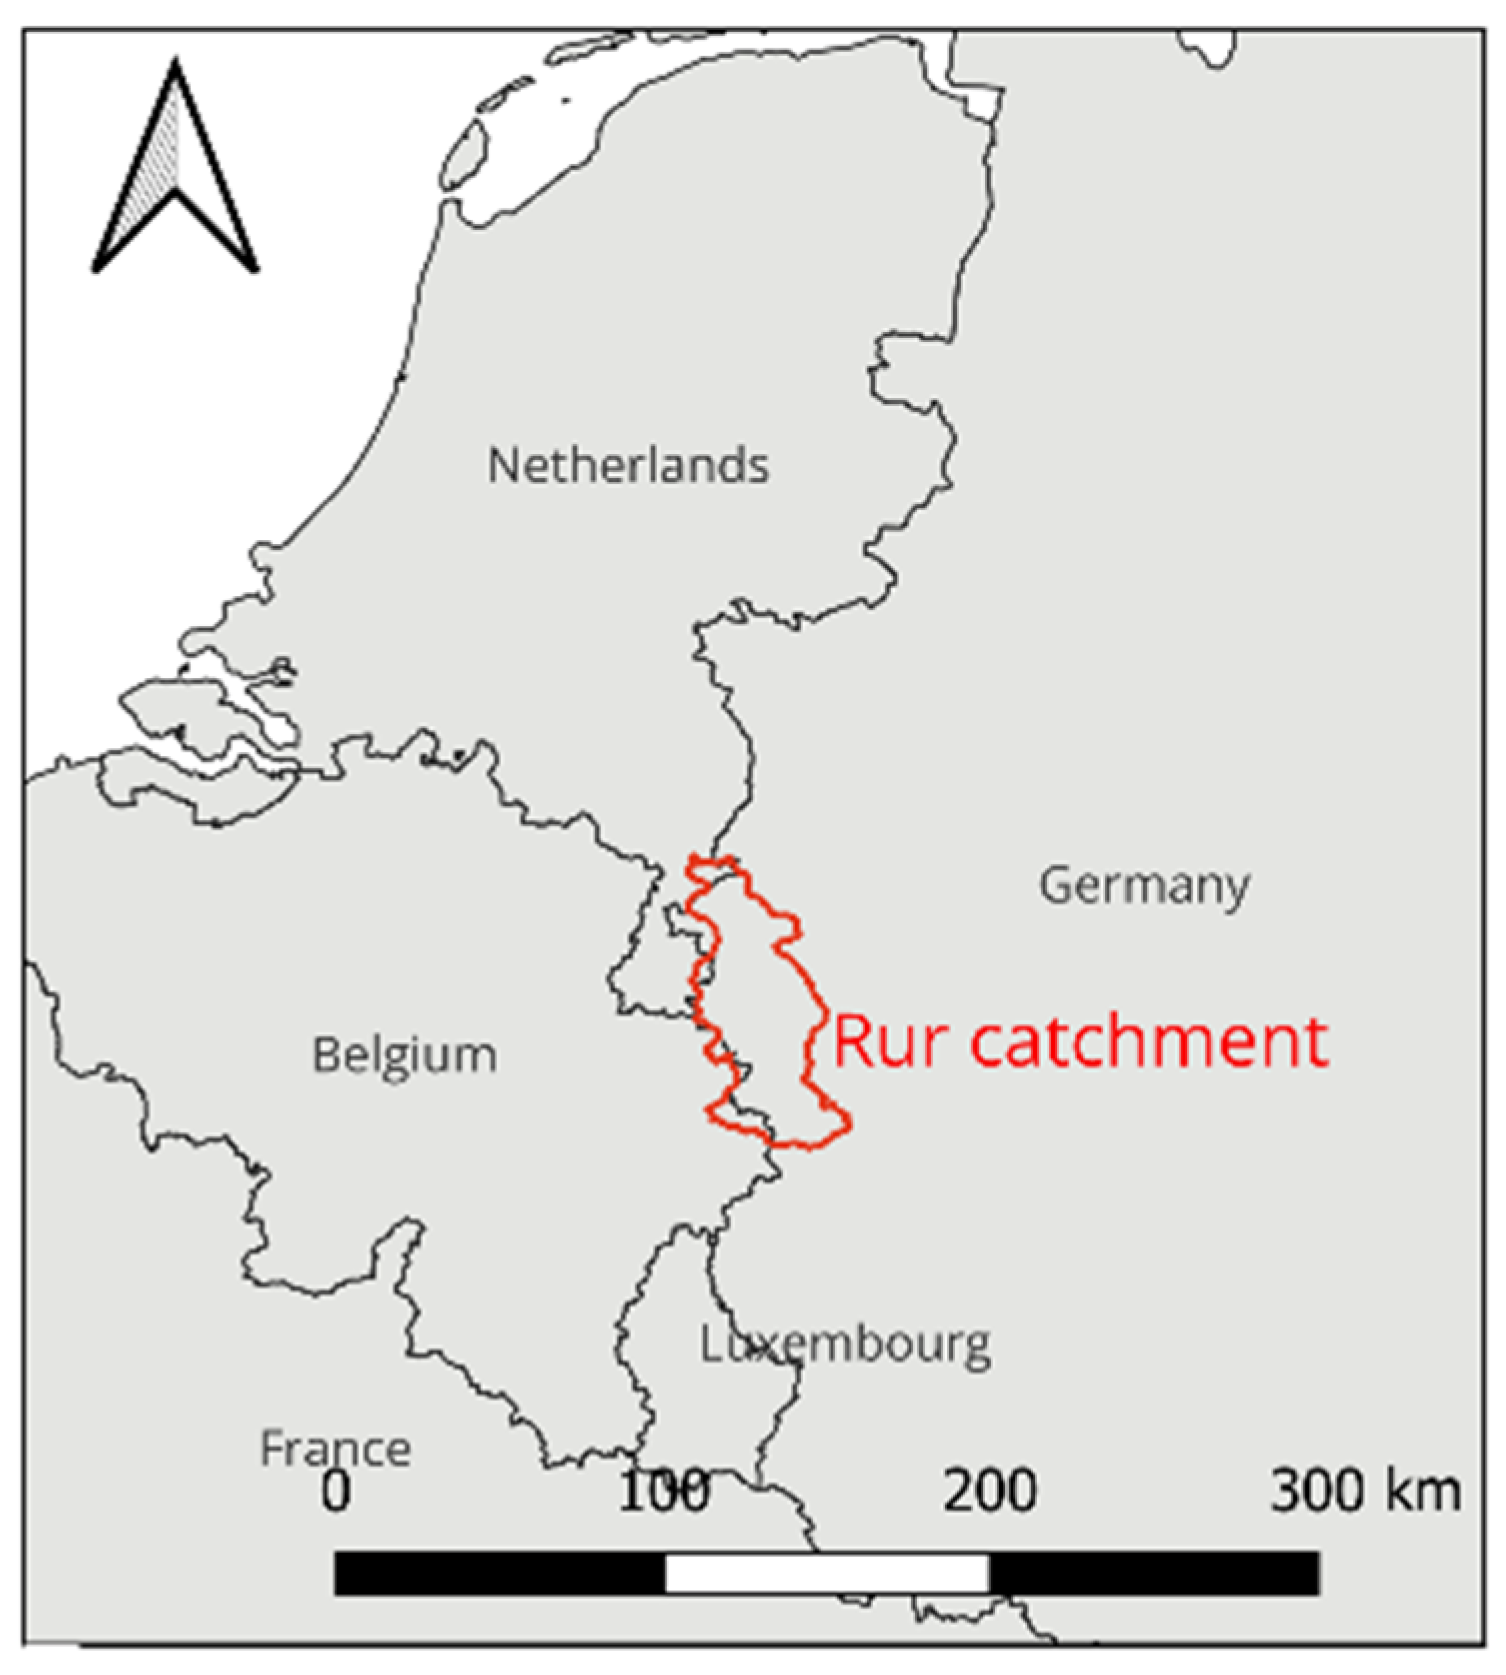
Figure 2. The location of the Rur River catchment with the country borders [45].
Hydrology 12 00270 g002
Figure 4. The development of the coupled Rur model.
Hydrology 12 00270 g004
Figure 5. Comparison of 3 m contour lines based on simulated (blue) and gridded (black) data for the average groundwater level (1992–2020) per Raster, with corresponding maps.
Hydrology 12 00270 g005
Figure 6. Comparison of simulated (blue solid line) and observed (black dashed line) groundwater levels at monitoring wells GWG_1, GWG_2, GWG_3, GWG_4, GWG_5, and GWG_6 for 1992–2020.
Hydrology 12 00270 g006
Figure 7. Comparison of simulated (green solid line) and observed (black dashed line) river water levels at river gauges of Selhausen, Altenburg, Jülich, Linnich, and Stah for 1992–2020.
Hydrology 12 00270 g007
Figure 8. Spatial distribution of simulated mean groundwater–river water exchange rate (m3/s) and mean groundwater discharge rate (m3/s) along the Rur reach for 1992–2020, with blue lines representing exfiltration (groundwater discharging into the river) and red lines indicating infiltration (river water recharging the groundwater).
Hydrology 12 00270 g008
Figure 9. Spatial distribution of simulated mean hydraulic gradient between groundwater (GW) and river water levels (RV) along the Rur reach for 1992–2020.
Hydrology 12 00270 g009
Figure 10. Temporal distribution of simulated daily groundwater discharge (m3/s) along the Rur reach for 1992–2020 with the comparison of average river water (RV) levels and groundwater (GW) levels over the same period.
Hydrology 12 00270 g010
Figure 11. Simulated monthly groundwater discharge (m3/s) for the months of one year over the period of 1992–2020 with the comparison of average river water (RV) levels and groundwater (GW) levels for the same periods.
Hydrology 12 00270 g011
Table 1. Overview of the model parameters for the HYD module in LoFloDes.
ParameterUnitExplanationLinked Equations
Z b e d mriverbed elevation(2)
h r v mabsolute river water level(2)
n s / m 1 3 manning values(2)
A r i v e r m 2 river flow area(1) and (2)
r h y d mriver hydraulic radius(2)
r w e t t e d mriver wetted perimeter(7)
Q g w 2 g w m 3 / s exchange discharge between two adjacent groundwater elements(3)
Q g w 2 r v m 3 / s exchange discharge between groundwater element and river profile (7)
Q i n / o u t f l o w m 3 / s inflow and outflow of the control volume, e.g., river profile or groundwater element(1) and (6)
Q b o u n d a r y m 3 / s additional sources and sinks as boundary conditions(1) and (6)
Q c o u p l i n g m 3 / s exchange discharges from other coupled sub-models(1) and (6)
T m 2 / s groundwater transmissivity(3)–(5)
h g w mabsolute groundwater level(3) and (5)
k f g w m/sgroundwater hydraulic conductivity(4) and (5)
M g w mgroundwater thickness(3) and (4)
z g w mgroundwater bottom elevation(3)
eP-effective porosity(6)
k f r v 1/sleakage factor (7)
L mcoupled river length(7)
M r v mriverbed thickness (7)
h mhydraulic gradient for groundwater and river:
h g w < Z b e d : h = h r v Z b e d
h g w Z b e d : h = h g w h r v
(7)
Table 2. Calibrated parameter for groundwater and river model.
Groundwater RastersKfgw (m/s)eP (-)River SegmentsKfrv (1/s)n (s/m1/3)
Raster_110−30.2inlet-Selhausen5 × 10−60.02
Raster_25 × 10−40.2Selhausen-Altenburg5 × 10−60.02
Raster_310−30.2Altenburg-Jülich Stadion5 × 10−60.01
Raster_410−30.2Jülich Stadion-Linnich5 × 10−60.01
Raster_510−30.2Linnich-Stah5 × 10−60.028
Stah-outlet5 × 10−60.02
Table 3. Statistical measures (RMSE, R2) for the groundwater and river models for the calibration period (2003–2004), with 2002 as warm-up period not included in evaluation.
Groundwater
Rasters
2003, 2004River Gauges2003, 2004
RMSE (m)R2 (−)RMSE (m)R2 (−)
Raster_11.160.98Selhausen0.030.98
Raster_21.270.90Altenburg0.050.93
Raster_31.770.87Jülich Stadion0.080.88
Raster_41.200.75Linnich0.030.94
Raster_50.900.94Stah0.040.98
Table 4. Statistical measures (RMSE, R2) comparing river simulations with and without groundwater (GW) model for low-flow months (April–September) during 1992–2020. Cells highlighted in green indicate superior model performance.
River GaugesRMSE (m) R 2 (−)
With GWNo GWWith GWNo GW
Selhausen0.0660.0700.650.60
Altenburg0.0900.1020.500.37
Jülich Stadion0.0750.0740.590.60
Linnich0.0300.0280.880.90
Stah0.0510.0700.900.83
Table 5. Comparison of long-term simulation results between this study and [32].
StudySoftwareInteraction TypeSpatial Resolution GW ModelSpatial Resolution RV ModelComputation
Time; Time Step
Normalized Computation Time
This studyHYD module
LoFloDes
Bidirectional500 m
(550 Elements)
100 m
(524 Profiles)
9900 s for 30 Years; Daily 0.0016 s per
Step-element
[32]MODFLOWUnidirectional
(RV → GW)
1000 m
(21,120 Elements)
1000 m
(Unknown)
1898 s for 22 Years; Monthly0.00034 s per
Step-element
Disclaimer/Publisher’s Note: The statements, opinions and data contained in all publications are solely those of the individual author(s) and contributor(s) and not of MDPI and/or the editor(s). MDPI and/or the editor(s) disclaim responsibility for any injury to people or property resulting from any ideas, methods, instructions or products referred to in the content.