3.1.1. Daily Intercomparisons
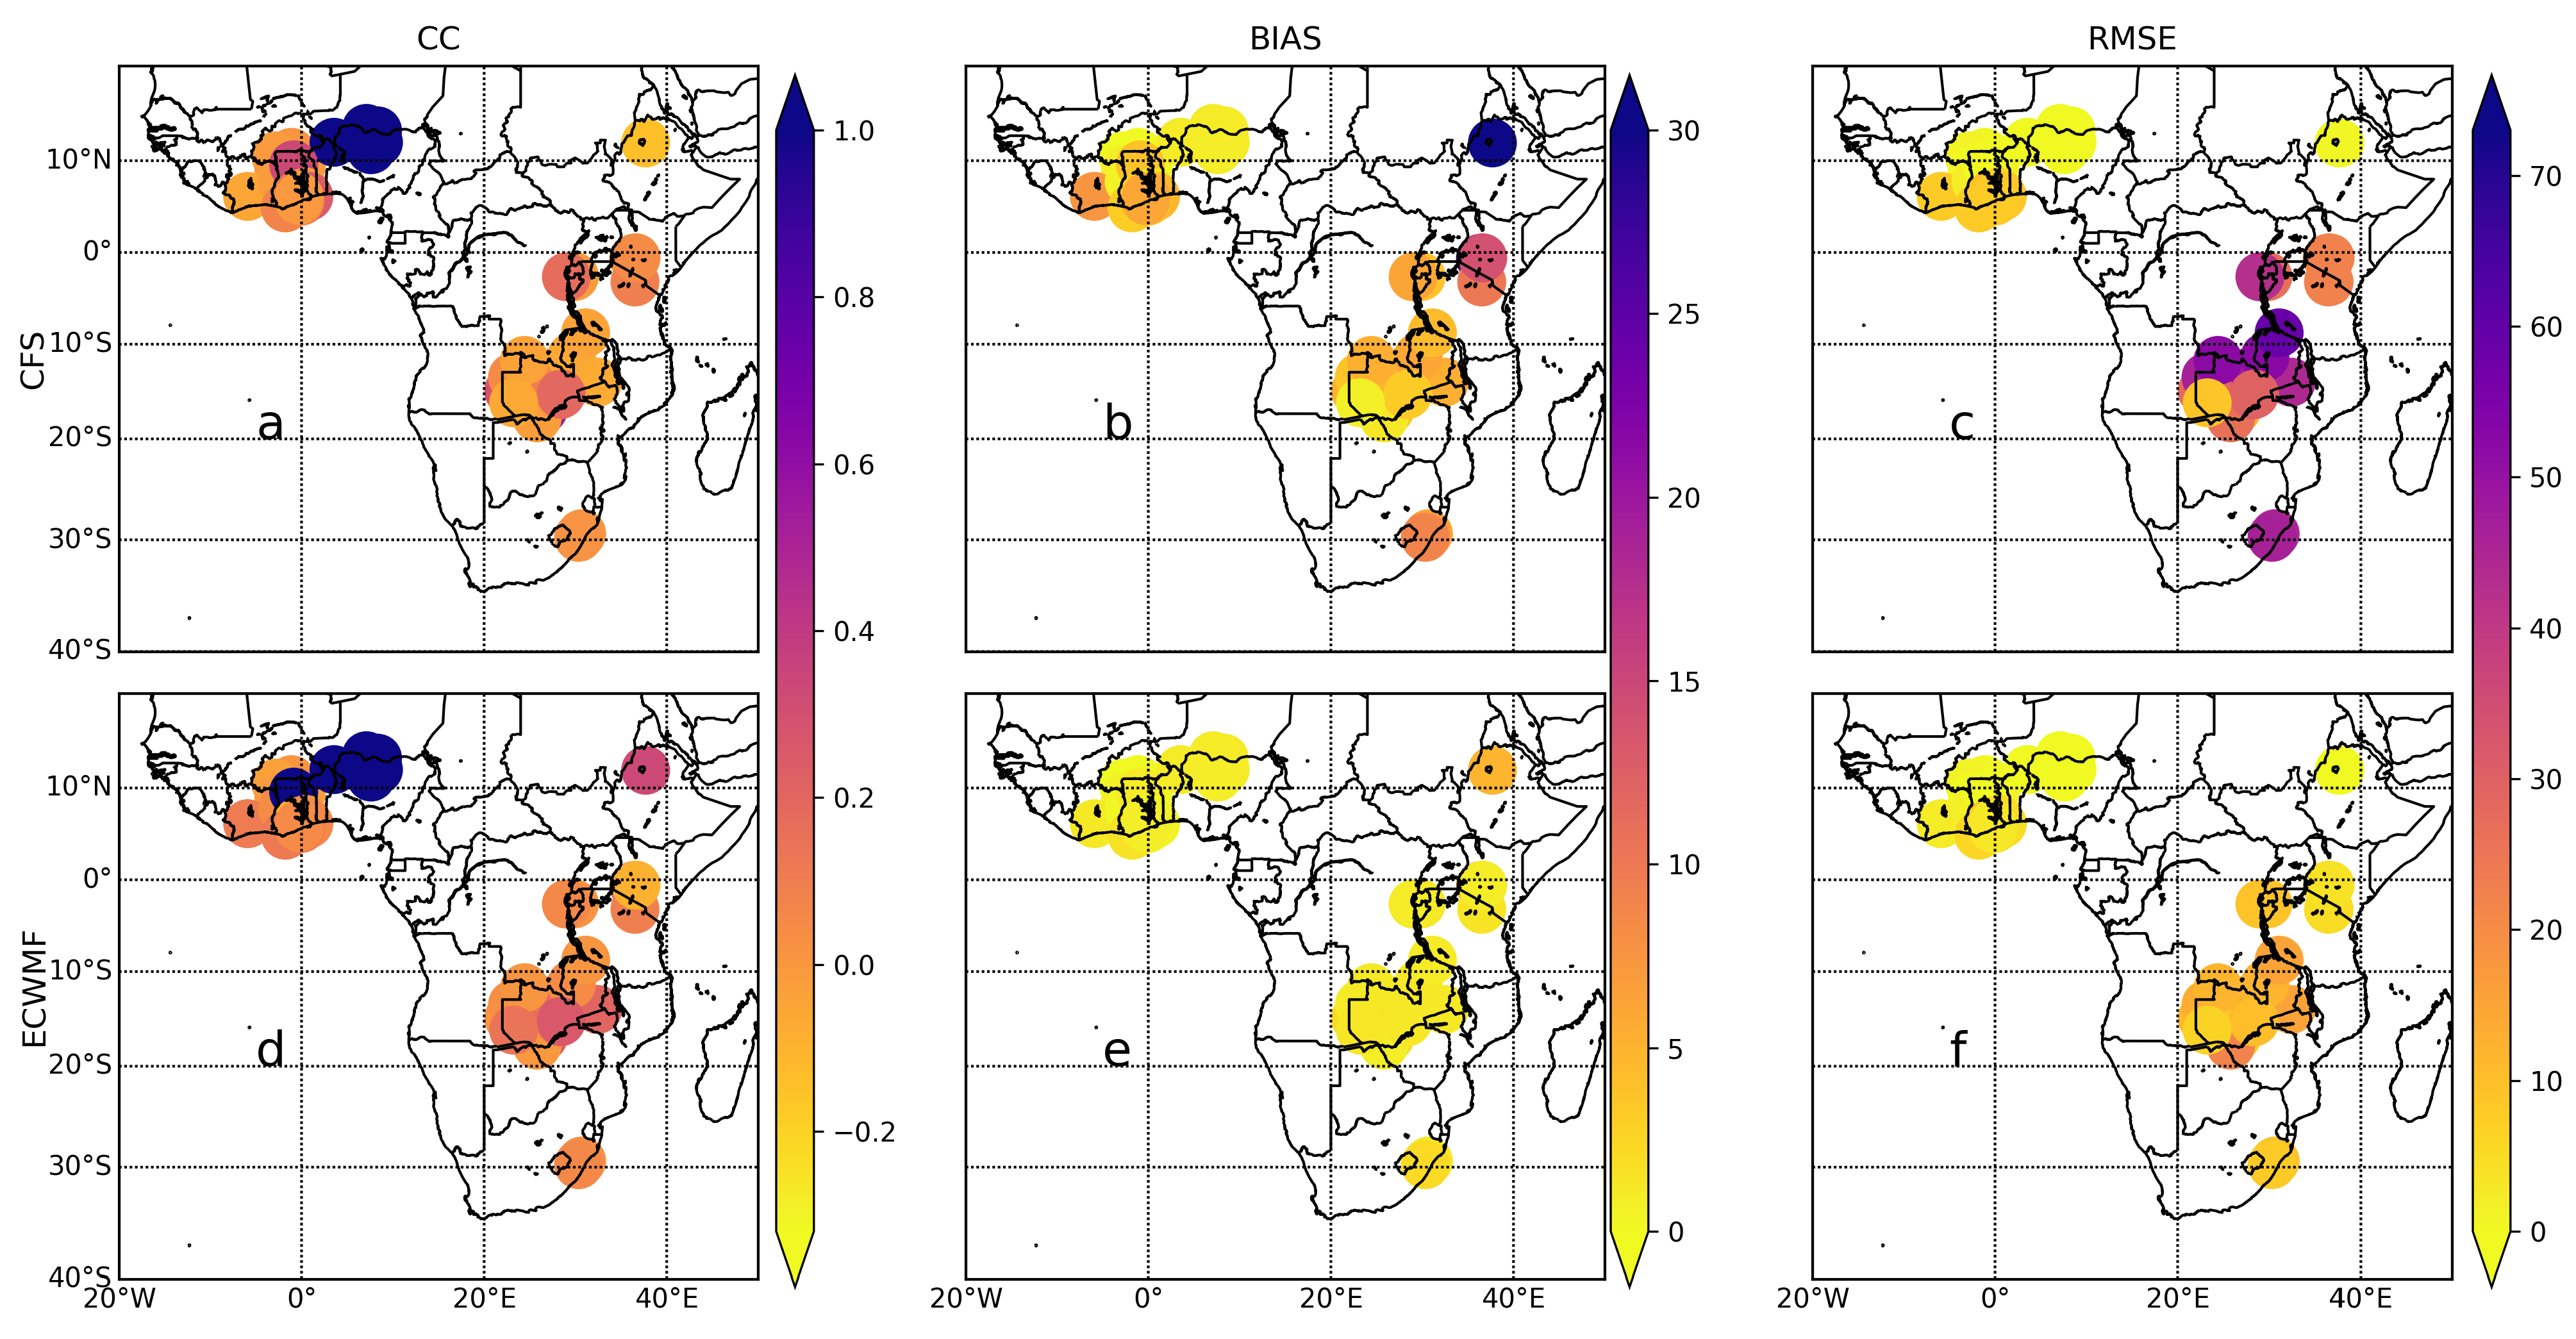
Figure 2,
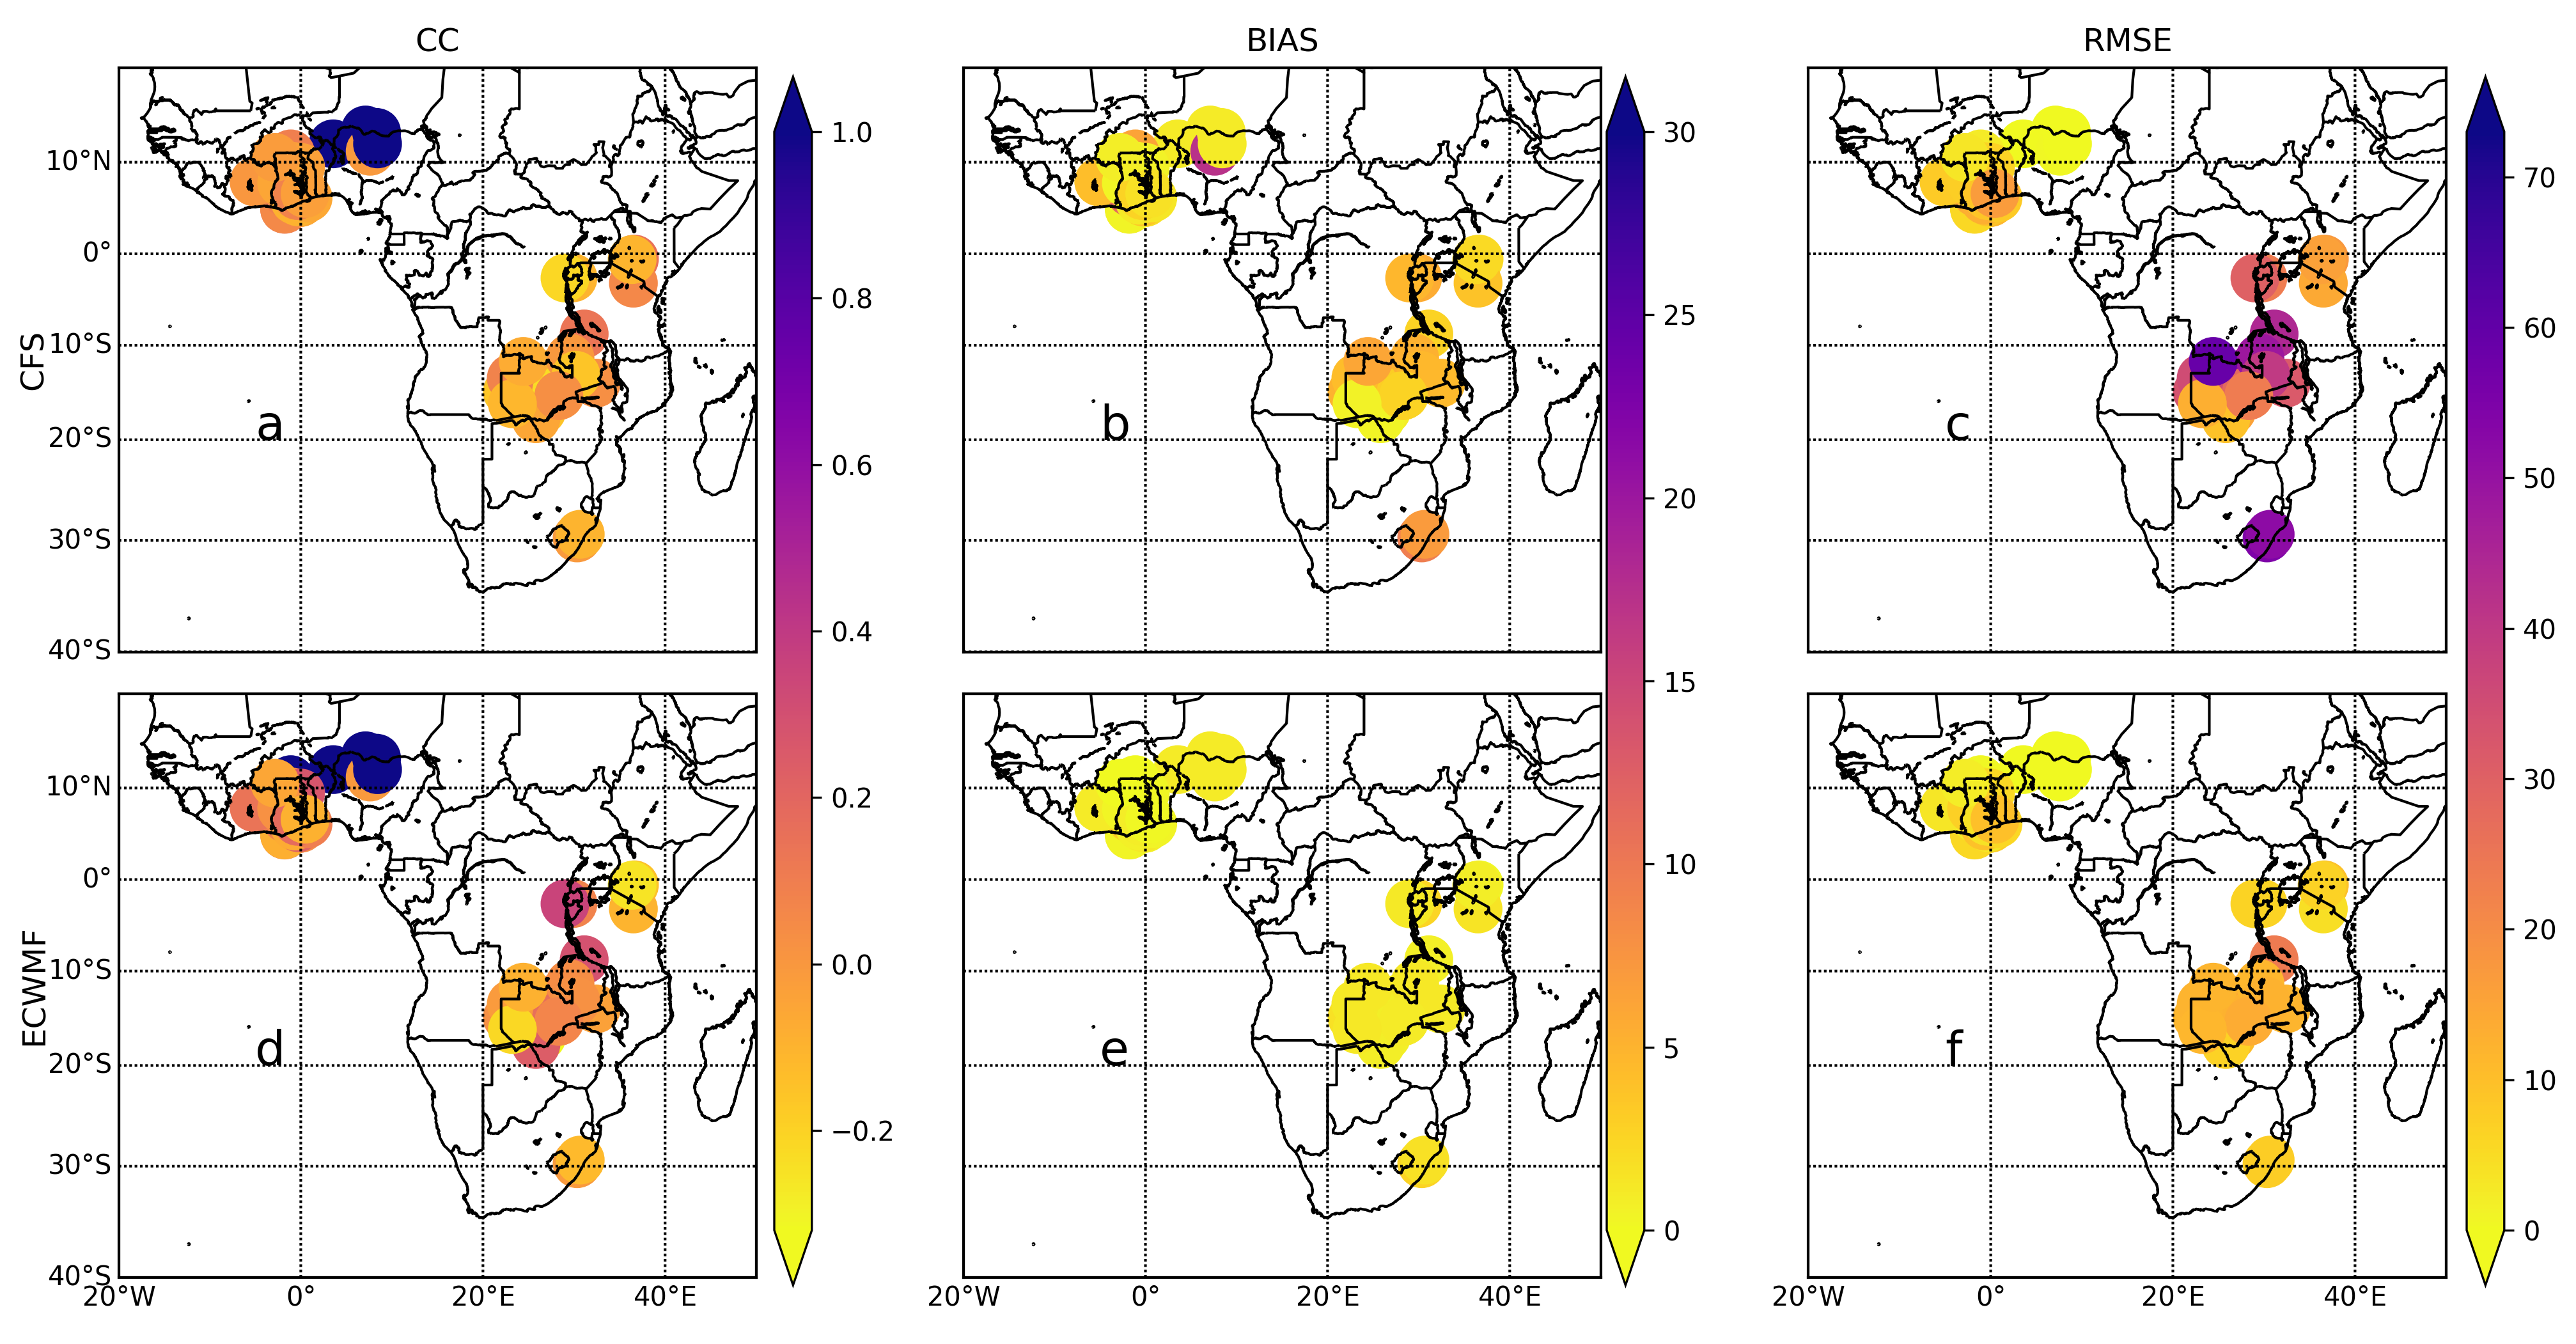
Figure 3 and
Figure 4 illustrate the volumetric metrics for three different lead times, LT0, LT1, and LT2, respectively, for CFSv2 and ECMWFv5.1 in comparison to daily gauge data. The volumetric metrics for LT0 are shown in
Figure 2a–f. Considering the correlation coefficients at LT0,
Figure 3a,d reveal that several stations in northern Nigeria, Benin, and Ghana had near-perfect temporal agreement with gauge observations (r > 0.9). The temporal agreement between gauge and the ECMWFv5.1 data in the rest of West Africa ranged between 0.2 to 0.4 and was largely > 0.2 in East and Southern Africa regions. However, the CFSv2 data showed the lowest correlation (r = −0.1) in Ethiopia compared to r = 0.4 in ECMWFv5.1 data. At LT0, stations in Kenya, Rwanda, and Burundi showed better agreement with CFSv2 than ECMWFv5.1, while the opposite was observed in Zambia and Malawi.
In terms of bias, the ECMWFv5.1 (bias < 2 mm) data consistently outperformed the CFSv2 across Africa (
Figure 3b,e). The CFSv2 showed greater bias than ECMWFv5.1 along the West African coastal belt, though it largely matched the latter in the hinterland of West Africa. Again, the CFSv2 data had the highest bias (30 mm) in the Ethiopian highlands compared to 6 mm for ECMWFv5.1 data. Similarly, the CFSv2 showed consistently higher RMSE than ECMWFv5.1 across all regions but was more pronounced in Southern Africa. Overall, at LT0 the two models showed roughly the same temporal correlation pattern, but ECMWFv5.1 clearly outperformed CFSv2 due to lower bias and RMSE. This superior performance is likely linked to ECMWFv5.1’s increased horizontal resolution and improvements in model configuration and initialisation, which have been shown to improve seasonal precipitation forecasts in many regions [
38,
48,
49]. However, model performance still degrades in complex, high-elevation terrain where orographic rainfall processes are challenging to resolve; several verification studies report both improvements with ECMWFv5.1 and remaining limitations in mountainous regions [
48]. The weaker performance of CFSv2 in the Ethiopian Highlands is consistent with earlier evaluations that reported moderate forecast skill for seasonal rainfall, with CFSv2 and ECMWFv5.1 correlations with observed JJA rainfall of approximately
and
, respectively [
50]. Such limitations are likely linked to challenges in representing complex topography and orographic rainfall processes [
51]. In contrast, CFSv2 showed relatively better agreement with observations in parts of Kenya, Rwanda, and Burundi, whereas ECMWFv5.1 outperformed it in Zambia and Malawi, as documented in regional seasonal forecast evaluations [
12]. Similar spatial variations in model skill across African sub-regions have been reported by Harrison et al. [
21], who noted that forecast accuracy depends strongly on local rainfall regimes, topographic influences, and the representation of synoptic-scale drivers.
In West Africa, the ECMWFv5.1 correlation values are observed to be relatively better than the CFSv2. This suggests that the ECMWFv5.1 model captures rainfall patterns in this sub-region more accurately. Strong positive correlations are detected in West Africa compared to East and Southern Africa for both models. Furthermore, the bias values are generally modest for ECMWFv5.1 in most sub-regions, showing that the ECMWFv5.1 model adequately captures rainfall patterns but somewhat underestimates the gauge. In contrast, biases were often more significant for CFSv2 than ECMWFv5.1, showing that the CFSv2 model tended to overestimate rainfall in those places, notably in East Africa. It is worth noting that the RMSE values between the ECMWFv5.1 and gauge are generally low in most places, while occasional differences are visible in select stations. In contrast, the RMSE values between CFSv2 and gauge datasets are significantly greater than those of ECMWFv5.1, implying that the CFSv2 model may not effectively reflect rainfall patterns in some regions, mainly South and East Africa.
The volumetric measures at LT1, as shown in
Figure 3, reveal that, while the correlation coefficients between the gauge and the CFSv2 model are strong, they are marginally lower than their performance at LT0 in all sub-regions. This indicates that the CFSv2 model’s accuracy in capturing rainfall patterns in the region has decreased, consistent with findings in Samala et al. [
26]. Some parts of the continent (East and Southern Africa) had lower correlations, indicating that the CFSv2 model needed more accuracy in these areas as the lead time progressed. This is supported by other research that has identified similar skill drops in the CFSv2 model in certain regions [
27]. Even for LT1, the ECMWFv5.1 model’s correlation coefficients with the observed ones were continuously strong. For instance, in South Africa, the ECMWFv5.1 model’s correlation values were typically higher than the CFSv2’s. This demonstrates that the ECMWFv5.1 model may be more precise for LT1 in this region. Although high values were recorded, they were slightly lower than those obtained from LT0. The bias values show that the CFSv2 model overestimates rainfall in most portions of Africa, particularly in East Africa, similar to what was observed in LT0. The ECMWFv5.1 model’s values follow a similar trend to its performance in LT0, with small underestimations noted. The RMSE values for CFSv2 remained relatively high in South Africa, with a minor increase in some areas of West Africa. RMSE values for ECMWFv5.1 were at the same margins in all sub-regions as in LT0. The consistency of ECMWFv5.1 performance across multiple lead times suggests robustness to lead-time degradation that has been specifically documented in earlier valuations [
38], corroborated by ECMWFv5.1’s operational forecast performance summaries [
52], and observed across the sub-seasonal to seasonal project’s multi-model predictions [
53].
Figure 4 illustrates the volumetric metrics at LT2. The range of correlation coefficients obtained has reduced considerably further compared to what was seen in LT1, with most stations having lower r values. As the number of lead periods increased, the CFSv2’s correlation with the observed rainfall data at most sites began to decline. For ECMWFv5.1, we observe that correlation coefficients are generally higher than those of the CFSv2 in most sub-regions. Although both datasets show a decline in correlation values at different stations as the lead times increased, ECMWFv5.1 still produced higher r values than CFSv2. The bias values between observed and CFSv2 data increased significantly in all sub-regions, particularly for stations in West Africa. Observing ECMWFv5.1 biases at LT2 (
Figure 4e), we see virtually the same margin of error as in LT1 across Africa. The RMSE values for CFSv2 have continued to rise in all sub-regions, particularly in East Africa. The ECMWFv5.1 RMSE scale values are small over Africa, but we detected a few occasions when the values increased slightly. On average, ECMWFv5.1 significantly outperformed CFSv2 in all sub-regions, especially in West Africa (
Table 4). Although correlation coefficients for CFSv2 in East and Southern Africa were relatively high, their error margins were generally much higher than those of the ECMWFv5.1. This continued superiority of ECMWFv5.1 across lead times aligns with past studies linking its skill to more advanced ensemble generation and better handling of tropical convection [
54], as well as similar early warning forecast verification work by Harrison et al. [
21]. The progressive decline in CFSv2 accuracy may reflect broader issues with its representation of tropical convection and associated mean-state biases—documented to impair forecast skill and convection propagation in sub-seasonal prediction [
55].
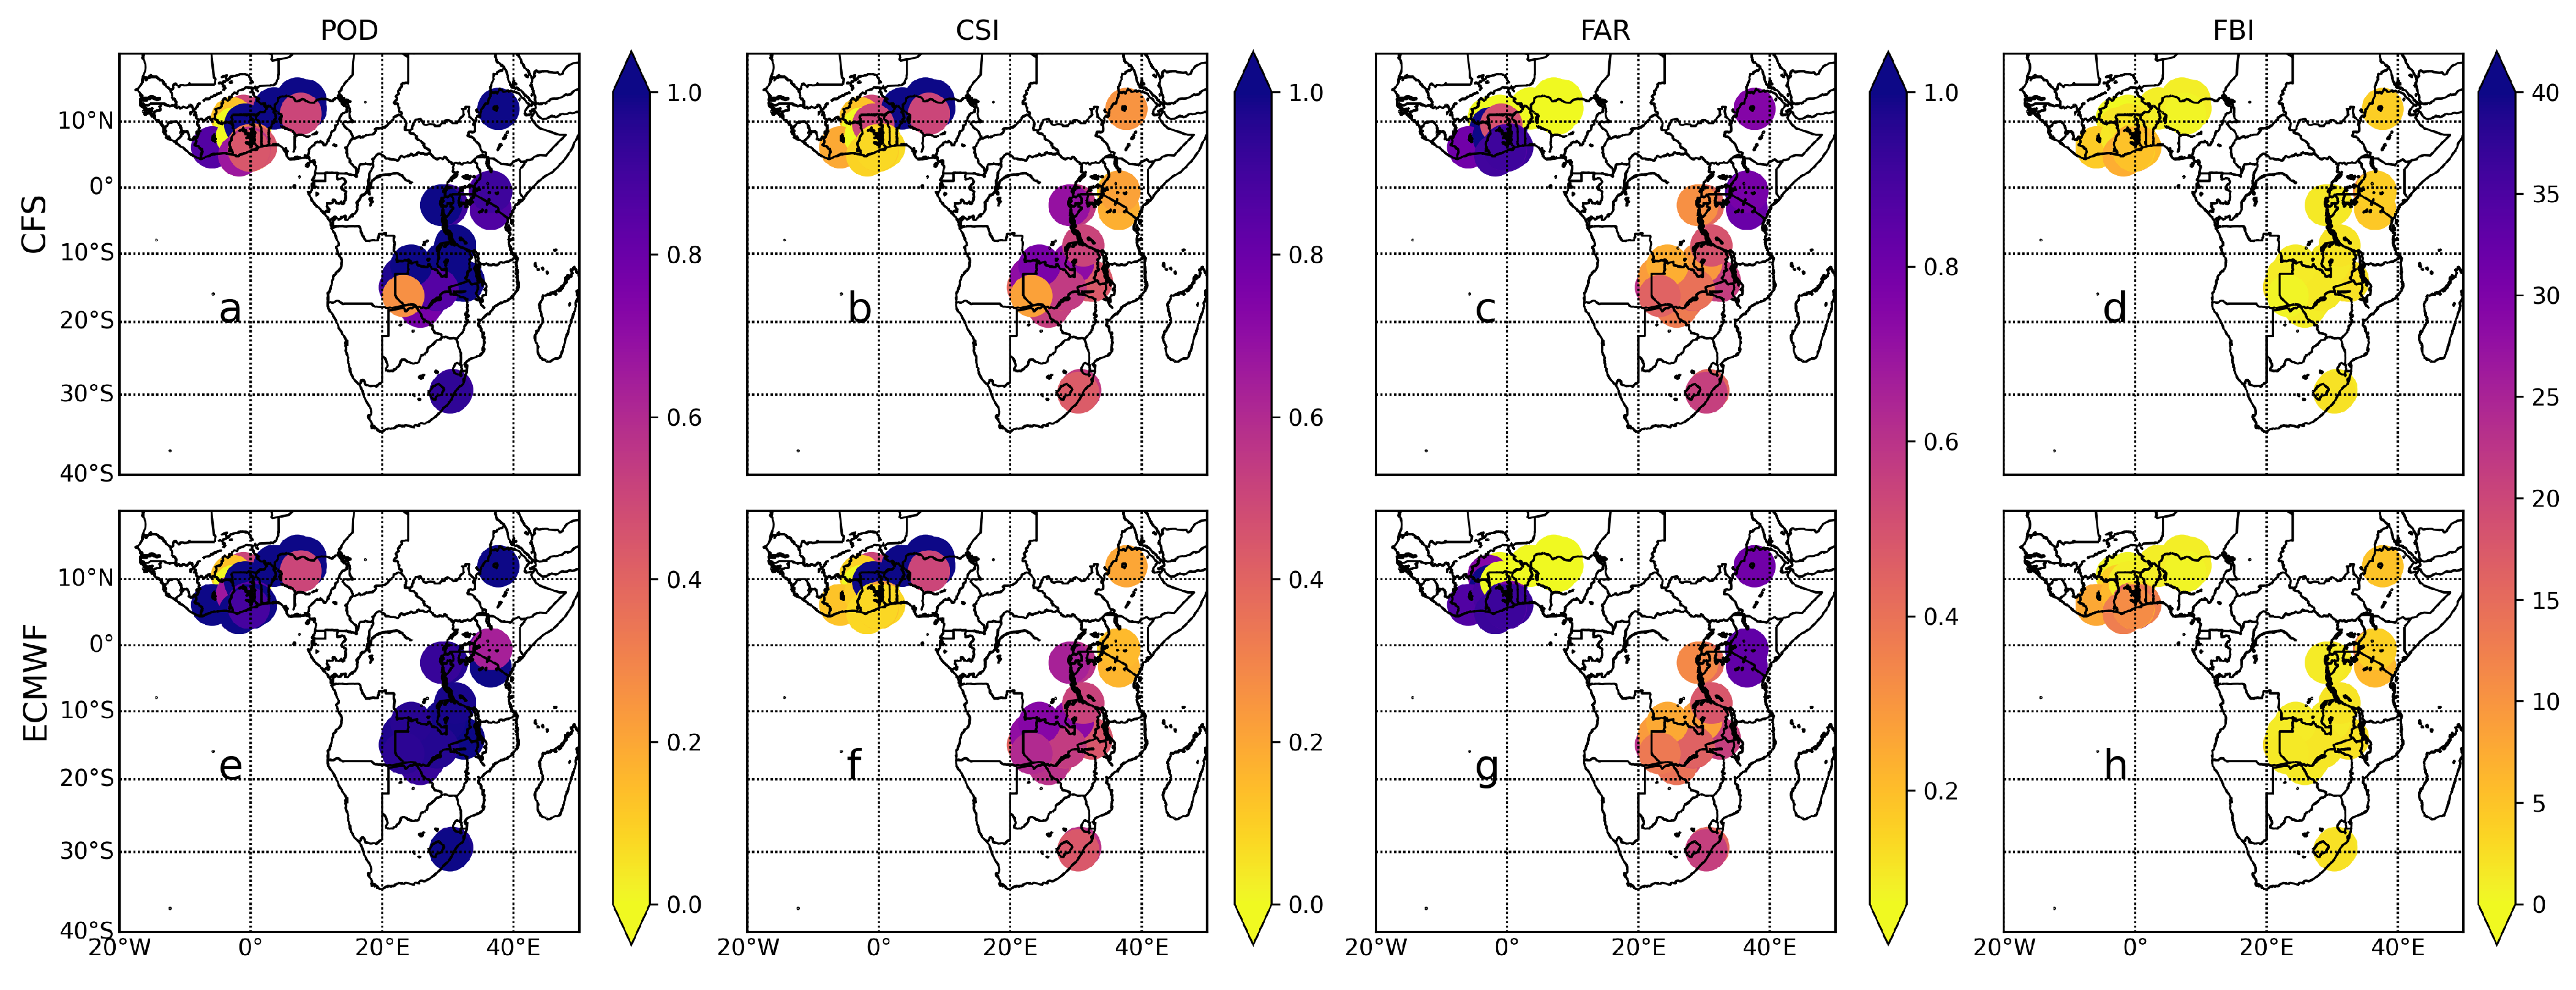
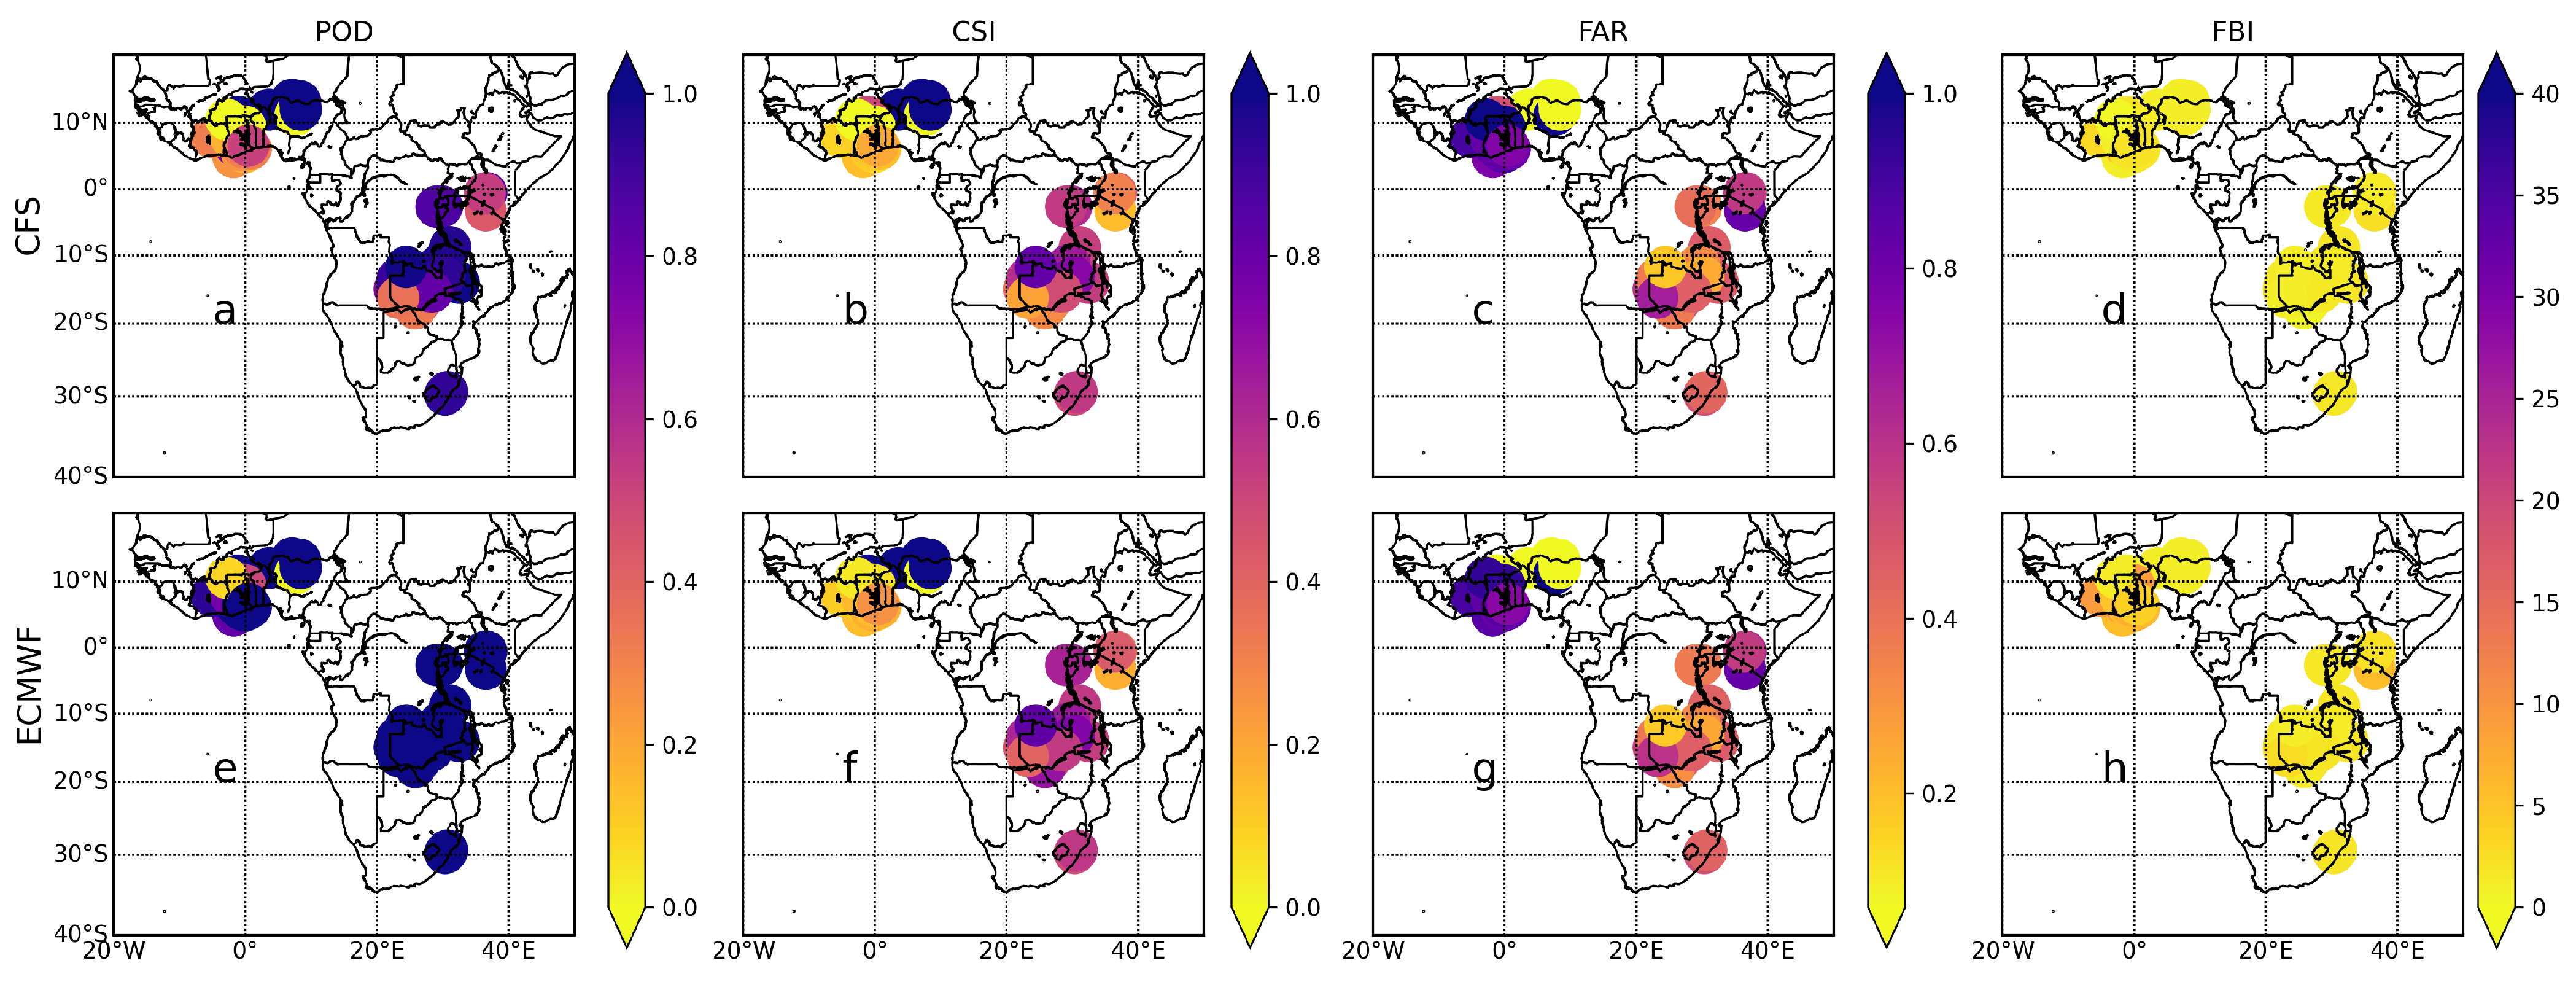
In
Figure 5,
Figure 6 and
Figure 7, we show the results for the categorical metrics of POD, CSI, FAR, and FBI for the three different lead times; LT0, LT1, and LT2, respectively, for CFSv2 and ECMWFv5.1 in comparison to gauge data. For LT0 we observe that across South Africa, ECMWFv5.1 showed superior rainfall detection skill (POD of about 1) for all stations compared to CFSv2 (see
Figure 5a,e). The high POD values observed for ECMWFv5.1 were again demonstrated across West and East Africa, but to a relatively lesser degree. This indicates that ECMWFv5.1 generally could detect rainfall events compared to observation in all sub-regions correctly. Similarly, CFSv2 has good rainfall detection skills but is relatively lower than ECMWFv5.1 in all sub-regions. Specifically, CFSv2 has a lower rainfall detection skill in West Africa than in the other sub-regions. The POD values for CFSv2 are 0–1 to 0.8–1 to 0.25–1 in West, East, and South Africa, respectively. This indicates that CFSv2 had the highest POD in east Africa. Both CFSv2 and ECMWFv5.1 are seen to have remarkably similar detection strengths in East Africa. On average, ECMWFv5.1 detects more rainfall in South and West Africa than CFSv2. In South Africa, CSI values were frequently higher for ECMWFv5.1 than CFSv2, similar to the POD values. Yet, for East Africa, the CSI values for both products were virtually invariably the same. While CFSv2 and ECMWFv5.1 had false rainfall detection (FAR) in West Africa’s westernmost regions, they also had the lowest FAR in the sub-region’s easternmost portions. FARs for both products in each sub-region were generally similar. The FBI values for CFSv2 and ECMWFv5.1 in West Africa ranged from 0–7 to 0–12, respectively. In South and East Africa, FBI values for both ECMWFv5.1 and CFSv2 were comparable, with most >1, indicating overforecasting. These results for LT0 align with previous findings that forecast skill tends to decrease in complex topographic and coastal regions, highlighting the advantage of ECMWFv5.1 in reducing false alarms and improving rainfall detection accuracy.
At LT1 (
Figure 6), we see that the POD values for West Africa observed by both CFSv2 and ECMWFv5.1 range between 0 and 1. Nonetheless, when compared to LT0, a majority of the stations in this sub-region experienced a slight drop in POD values, which is consistent with the expected decline in forecast skill with longer lead times. Similarly, we observe a drop in POD for CFSv2 in East Africa. However, in East and South Africa, the POD values for ECMWFv5.1 for LT1 are fairly comparable to those of LT0. For West Africa, the CSI values for CFSv2 and ECMWFv5.1 range from 0 to 1. Yet, compared to LT0, most of the stations in this sub-region saw a drop in CSI values. Similarly, CSI for CFSv2 and ECMWFv5.1 has reduced in East Africa. Nonetheless, the CSI values for CFSv2 and ECMWFv5.1 in South Africa were reasonably close for LT1 and LT0. CFSv2 and ECMWFv5.1 detected a slight increase in the FAR across all sub-regions. Within West Africa, ECMWFv5.1 had a somewhat larger frequency of bias index than CFSv2. However, this was generally minimal and did not significantly affect the detection accuracy of ECMWFv5.1 compared to CFSv2.
At LT2 (
Figure 7), the POD values observed by CFSv2 were further reduced across all African sub-regions. Conversely, the POD values for ECMWFv5.1 slightly rose for most sites in West Africa while remaining relatively steady in East and South Africa. In West Africa, the CSI values observed by CFSv2 and ECMWFv5.1 vary from 0 to 0.6, indicating a reduction in CSI as the lead time progressed. Within South Africa, a similar trend in CSI is found for both products. Nonetheless, the CSI for LT2 in East Africa is shown to be relatively good for ECMWFv5.1. The FARs for both products were noted to rise in West and South Africa compared to LT1 and LT0. Furthermore, the FBI in West Africa declined significantly, as detected by ECMWFv5.1, while being almost the same in East and South Africa for both CFSv2 and ECMWFv5.1. Overall, these LT2 results reinforce the earlier observation that ECMWFv5.1 consistently outperforms CFSv2 in most sub-regions, particularly in West Africa, even as lead times increase—a finding supported by similar comparative studies in the seasonal forecasting literature.
According to the results, the CFSv2 and ECMWFv5.1 models performed better at LT0 than LT1 and LT2, on average. However, the outcomes for LT0 and LT1 were somewhat comparable. A significance test was performed on the measures to assess whether LT0 significantly outperformed LT1. Considering that a 99 percent confidence interval was used, the significance threshold was 1 percent.
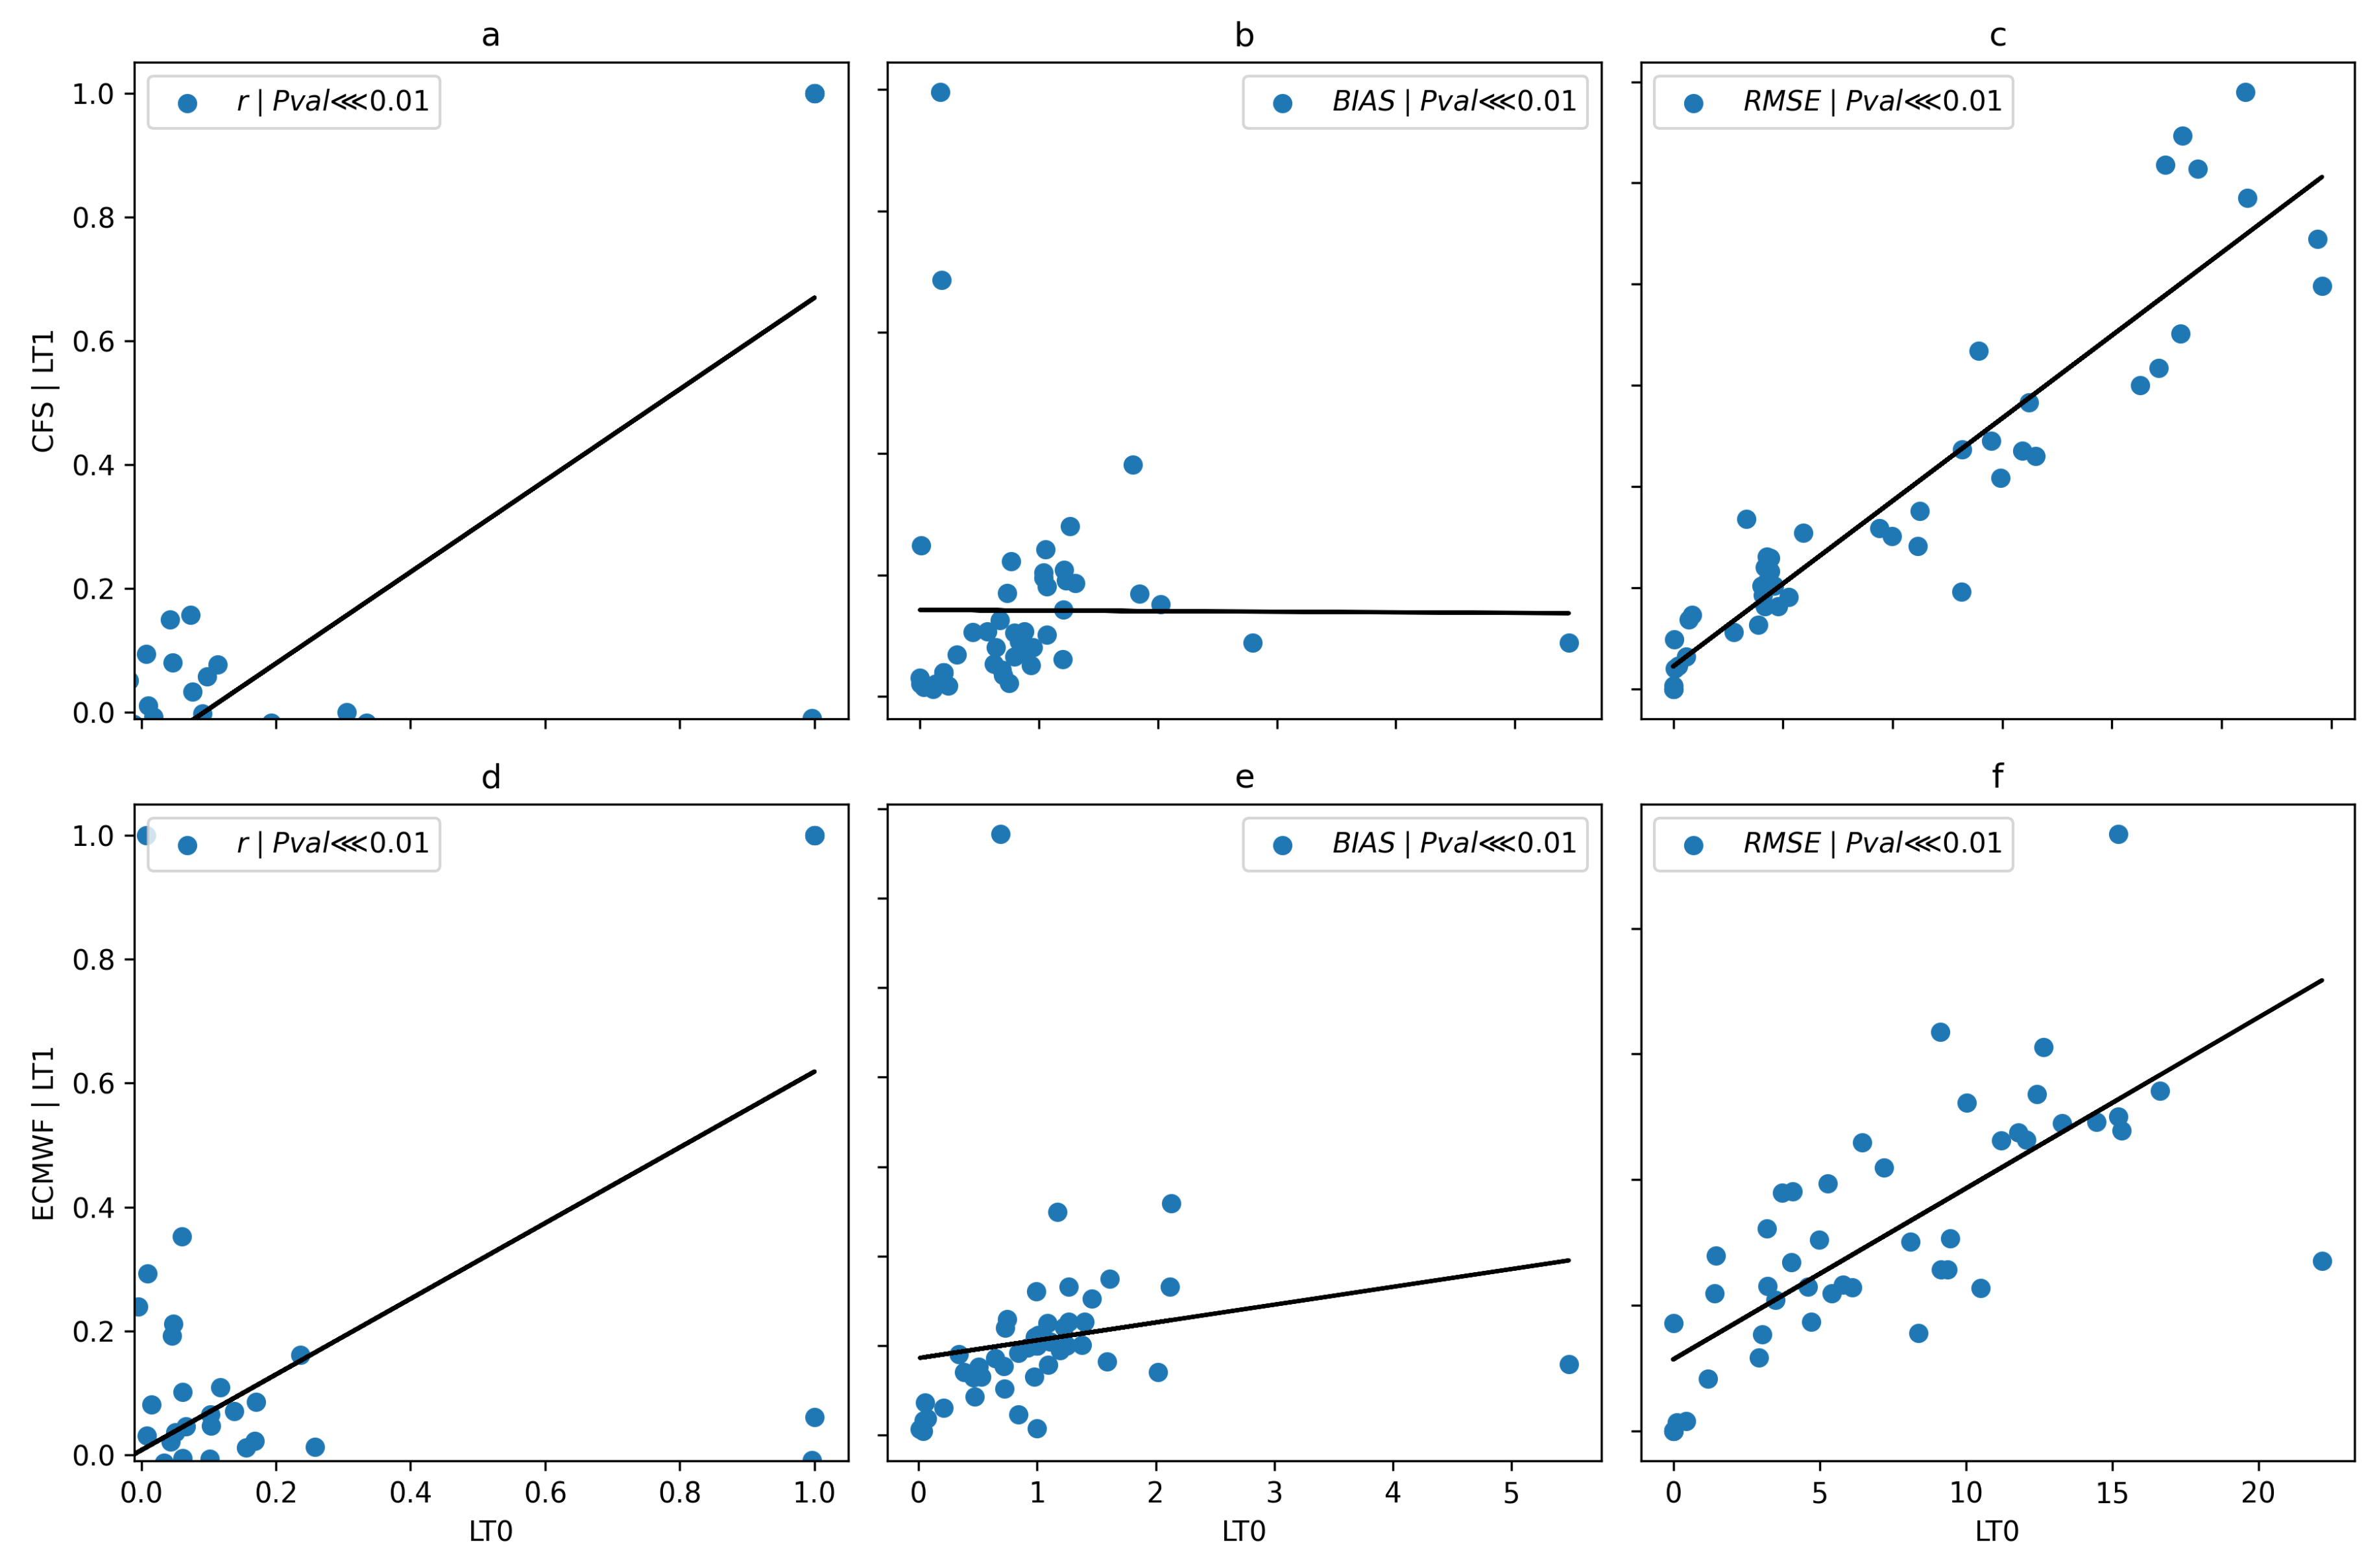
Figure 8 and
Figure 9 show the
p-values for the difference between LT0 and LT1 for volumetric and categorical metrics. The figures demonstrate that the
p-values for all metrics are extremely small (less than 0.01), indicating that LT0 significantly outperformed LT1. In
Figure 8, the bias of CFSv2 as seen in the near-flat trend line occurs because the analyzed region exhibits little long-term change in the variable considered over the study period, likely due to relatively stable climatic conditions and compensating variations within sub-regions. This was a clear example of how LT0 and LT1 differed, and thus the superior performance of LT0. Consequently, LT0 was used for all subsequent analyses.
3.1.2. Dakadal Intercomparisons of Model Performances
The performance of the models with respect to gauge at dekadal (10 days mean) time scale is evaluated in this section.
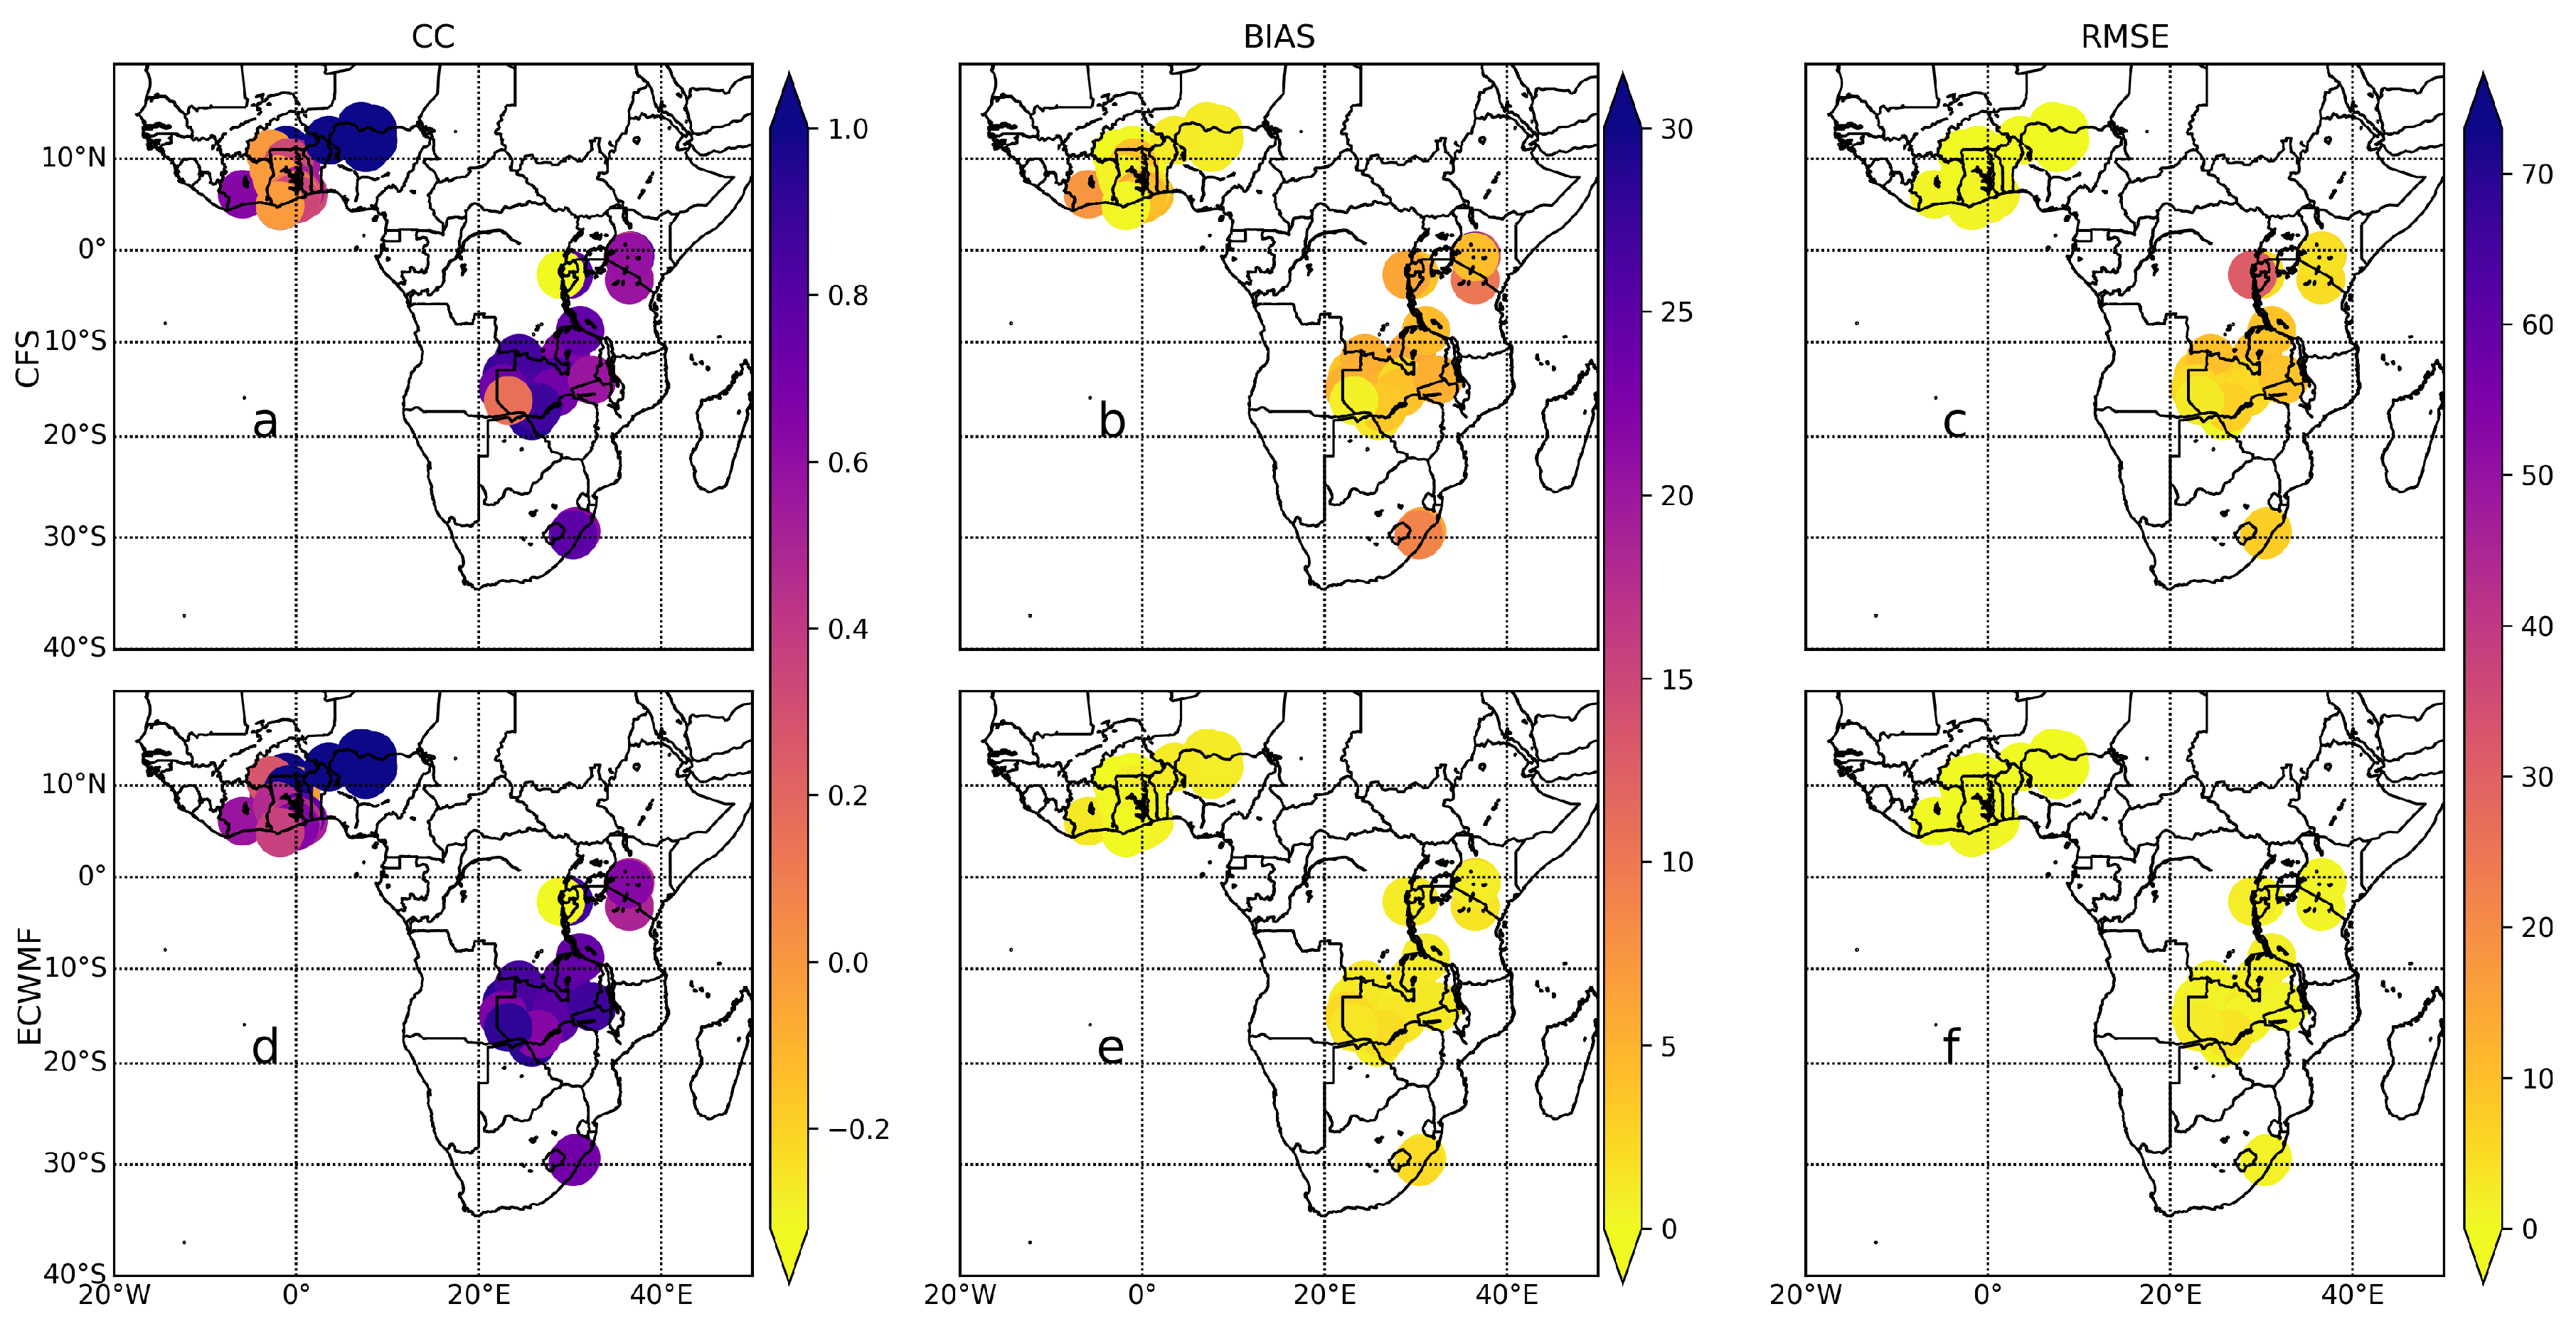
Figure 10 displays the findings of the dekadal analysis for volumetric metrics across Africa. The results shows that the CC values for CFSv2 are fairly good across the region (>0.4), with a few exceptions in South, West, and East Africa (
Figure 10a,d). The ECMWFv5.1 had the highest CC values of the two, with almost all stations having a CC value greater than 0.5. The CC values for ECMWFv5.1 were higher than those for CFSv2 in West Africa, as a strong positive association was found between the gauge data and the ECMWFv5.1. Although relatively high values for CFSv2 were seen throughout Africa, the bias values for both models were relatively small. Most notably, in East and South Africa, we saw relatively high RMSE values for CFSv2, while West Africa had the lowest values, indicating good skill of CFSv2 in the sub-region. Besides a few small spikes in East and South Africa with values no higher than 40 mm, ECMWFv5.1 showed modest RMSE values across Africa. ECMWFv5.1 values for West Africa were also better than those for other sub-regions.
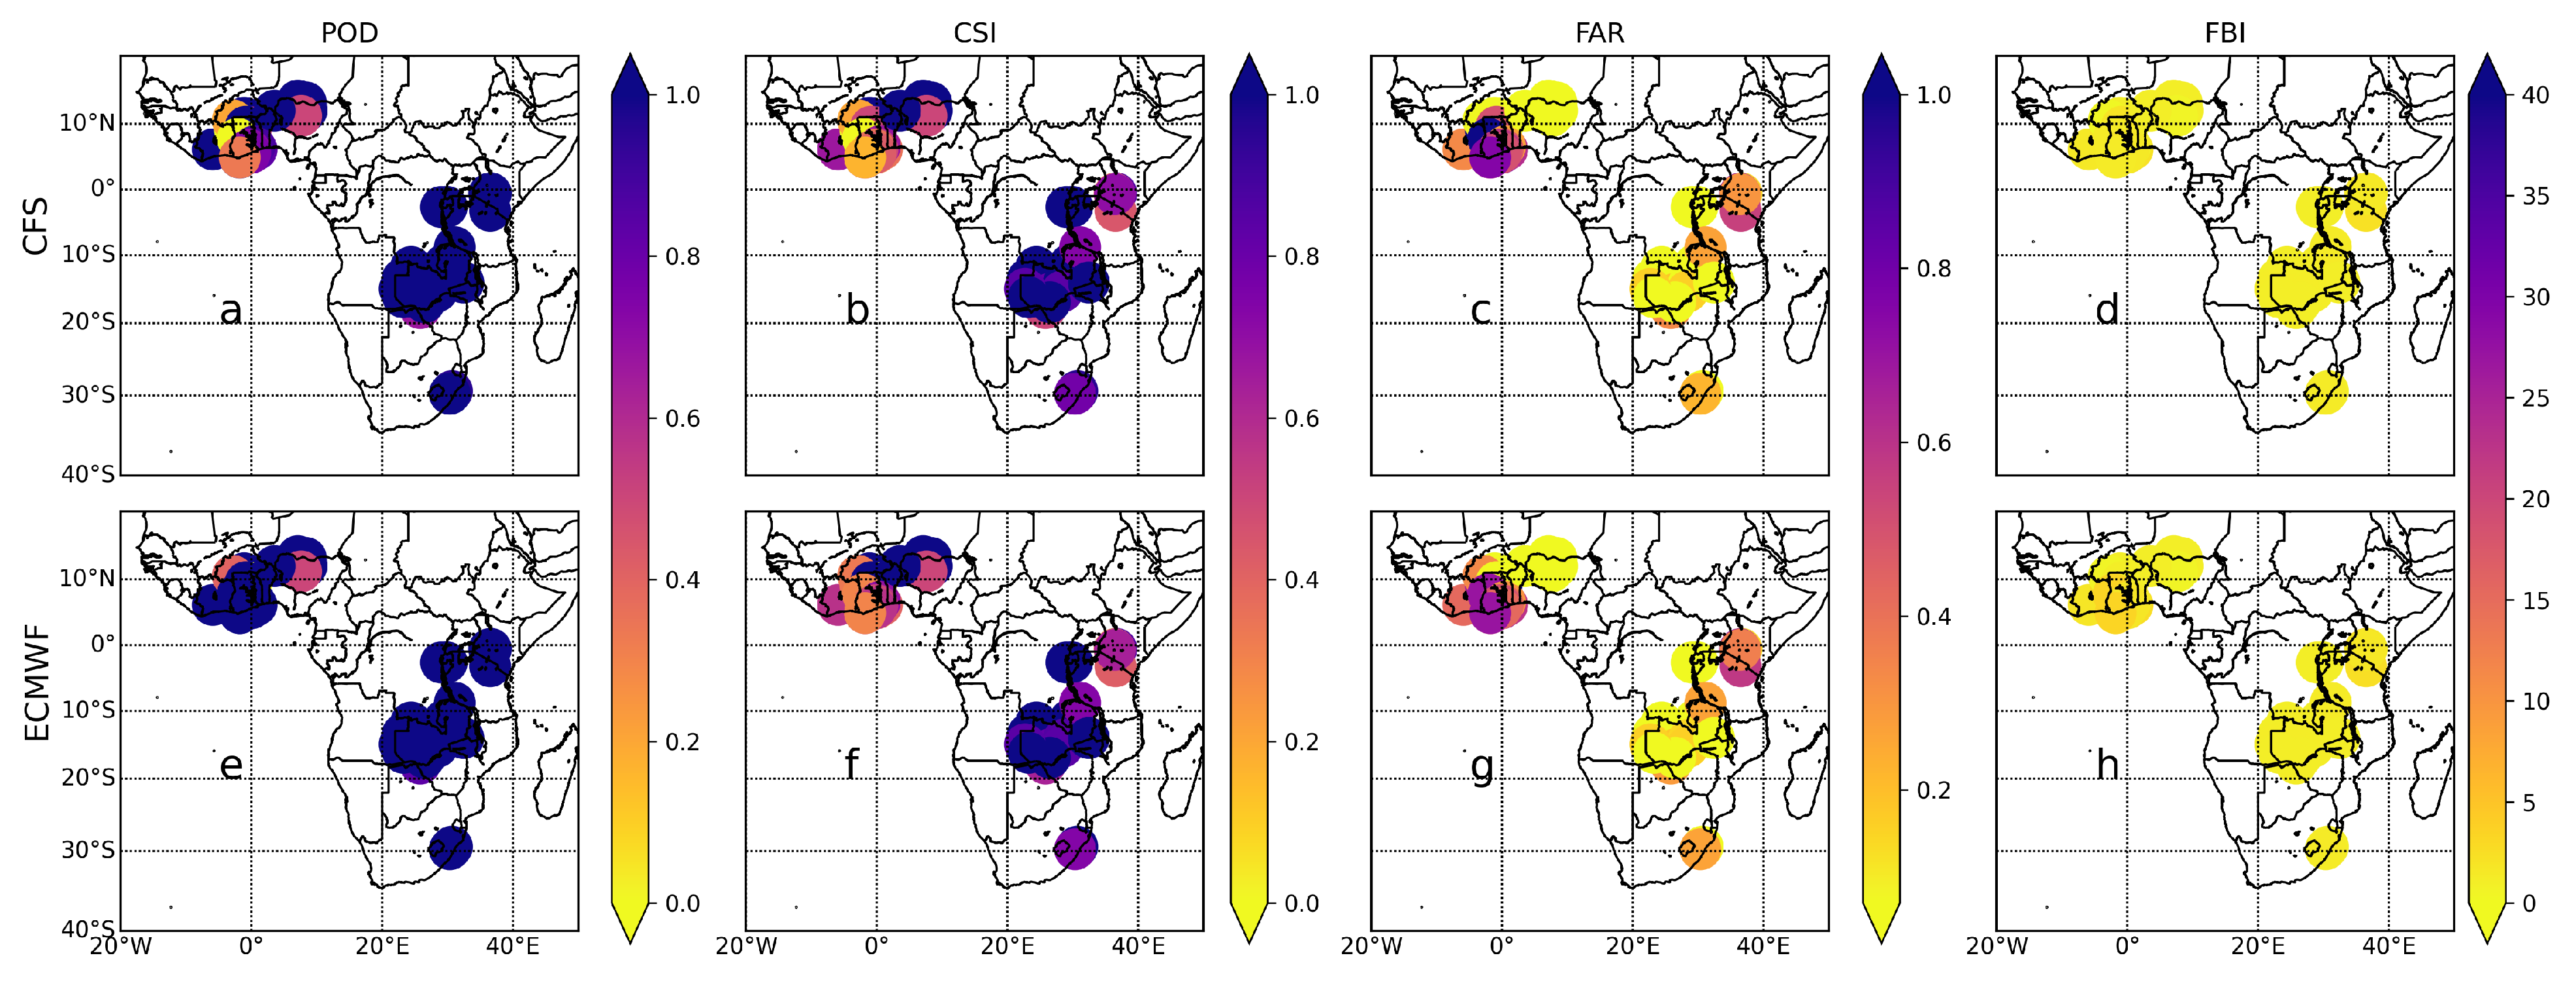
Figure 11 depicts the dekadal categorical metrics for CFSv2 and ECMWFv5.1 over Africa’s sub-regions. CFSv2 and ECWMF-S5 were found to have greater PODs in East and South Africa (POD of approximately 1). POD values measured by CFSv2 and ECMWFv5.1 in West Africa are 0–1 and 0.5–1, respectively. This demonstrates ECMWFv5.1’s ability to detect more dekadal rainfall occurrences than CFSv2 within West Africa. The CSI values of CFSv2 and ECMWFv5.1 were relatively comparable within East Africa, ranging from 0.4 to 1 for both models. A comparable CSI was also obtained for both datasets within South Africa. Yet, throughout West Africa, the CSI values for CFSv2 and ECMWFv5.1 ranged from 0 to 1 and 0.25 to 1, respectively. As a result, both datasets showed that South Africa exhibited relatively high CSI, followed by East Africa and West Africa.
Within West Africa, the FAR values range from 0 to 1 and from 0 to 0.7 for CFSv2 and ECMWFv5.1, respectively. This demonstrates that CFSv2 observed higher FAR within West Africa than ECMWFv5.1. Nonetheless, the FAR recorded by both datasets within East and South Africa were quite comparable. Consequently, within East and South Africa, FAR ranged from 0 to 0.6 and 0 to 0.3, respectively. As a result, both datasets showed very low FAR within South Africa, followed by East and West Africa. This illustrates that CFSv2 and ECMWFv5.1 detected more erroneous dekadal rainfall in West Africa than in East and South Africa. The FBI values for the entire continent were modest (<2 mm) for both models, showing that the models performed better at dekadal time frames (
Table 5).
Over dekadal time scales, ECMWFv5.1 outperforms CFSv2 in all sub-regions, depicting the model’s capacity to reflect the rainfall pattern over the continent better. Both models may be best suited for hydrological studies in West Africa. Generally, while product performance declines with rising lead times, it improves with greater temporal resolutions.
