Article

Impact of Land Cover Change on Eutrophication Processes in Phewa Lake, Nepal

1
Institute of Forestry, Pokhara Campus, Tribhuvan University, Pokhara 33700, Nepal
2
Arthur Temple College of Forestry and Agriculture, Stephen F. Austin University, Nacogdoches, TX 75962, USA
3
Department of Geography and Environment, University of North Carolina at Chapel Hill, Chapel Hill, NC 27599, USA
4
Estación Experimental de Aula Dei (EEAD-CSIC), Spanish National Research Council, 50059 Zaragoza, Spain
5
Soil and Water Management and Crop Nutrition Laboratory, Joint FAO/IAEA Centre of Nuclear Techniques in Food and Agriculture, Department of Nuclear Sciences and Applications, International Atomic Energy Agency, 1400 Vienna, Austria
*
Authors to whom correspondence should be addressed.
Hydrology 2025, 12(10), 246; https://doi.org/10.3390/hydrology12100246
Submission received: 12 August 2025 / Revised: 16 September 2025 / Accepted: 21 September 2025 / Published: 25 September 2025
(This article belongs to the Special Issue Lakes as Sensitive Indicators of Hydrology, Environment, and Climate)

Abstract

Increasing demand for land and resources in Himalayan catchments is altering hydrological processes and threatening freshwater ecosystems. Sediment mobilization and nutrient fluxes, especially during monsoon rainfall events, are intensifying the degradation of water bodies. This study investigates land cover change and its effects on nutrient dynamics in the Phewa Lake catchment, Nepal. Landsat imagery from 1990 to 2021, processed through Google Earth Engine, was used to map land changes. Nutrient loading for the two time periods was estimated with the InVEST model. Surface soils were sampled across the catchment to analyze nitrogen and phosphorus distribution, while their particle-bound transport to the lake was assessed through riverbed sediments and the suspended sediments collected during monsoon rainfalls. Pre-monsoon water quality was examined to evaluate eutrophication levels across different lake zones. Results reveal forest recovery in the upper catchment, but agricultural land in the lower catchment is being rapidly converted to urban areas. While forest recovery has enhanced sediment retention, nutrient inputs to the lake, particularly nitrogen and phosphorus, have increased. Fertilizer leaching and untreated sewage emerge as key sources in rural and urban areas, respectively. Seasonal constraints of the dataset may underestimate the overall extent of water quality deterioration, as indicated by high nutrient loads in monsoon suspended sediments. Overall, this study highlights the dual effect of land cover change: forest regrowth coincides with rising nutrient discharge. Without timely interventions, growing urban populations in the region may face worsening water quality challenges.

1. Introduction

Lakes in the Himalayan foothills, particularly in densely populated areas, are experiencing accelerated siltation and eutrophication. These processes are being intensified by climate change and extreme monsoon rainfall events. At the same time, human activities and rapid land use and land cover (LULC) changes are placing increasing pressure on freshwater systems [1]. The transfer of nutrients, both in dissolved form and bound to fine sediment, poses a growing threat to ecosystem health. This threat becomes more severe during intensified monsoon rainfall events that trigger high floods, which increase nutrient and pollutant loads into lake systems. In addition, urban expansion is affecting ecosystem services by reducing ecosystem resiliency, an area that remains largely underexplored.
The ecosystem services provided by wetland landscapes play a crucial role in supporting human societies [2]. However, over half of the world’s wetlands have already been lost, and the remaining areas face increasing threats of degradation, primarily due to anthropogenic pressures [3,4,5,6]. Freshwater ecosystems, particularly in developing countries, are under severe threat from rising nutrient loads originating from uncontrolled sources [7], which in turn leads to eutrophication [8,9]. The primary drivers include lake water pollution linked to urbanization and the use of pesticides and fertilizers within catchment areas. Eutrophication results in deteriorating water quality and ecological imbalances [10], and it has become an environmental concern for wetland systems in Nepal.
Nitrogen (N) and phosphorus (P) are among the most critical soil nutrients driving eutrophication globally [11]. Nitrogen is predominantly transported in dissolved form via runoff, whereas phosphorus is largely associated with sediment particles and is lost through particulate erosion [12]. The concentration of phosphorus (P) in soils and its subsequent release are determined by the soil’s origin, the nature of P binding within the soil matrix, and the prevailing land use practices. Soil erosion, therefore, acts as a key driver of nutrient transfer to water bodies, affecting TN and TP levels [13], and thereby affecting plant fertility, growth, and soil biological activity.
Phosphorus primarily attaches to fine soil particles, becoming immobilized in fixed forms. Nonetheless, it poses a significant environmental risk when mobilized through soil erosion processes. Agriculture is generally regarded as the land use responsible for the greatest phosphorus losses [14]. However, other land uses [15] and geomorphic features such as riverbanks [16] are identified as significant potential sources of P. Furthermore, changes in land cover exert a strong control on P fluxes within catchments [17]. Although phosphorus release from minerals is typically slow, high soil surface concentrations become critical during intense rainfall events, mobilizing soil and sediments and dissolved P beyond catchments or facilitating its co-precipitation [18]. Unlike phosphorus, nitrogen is highly soluble and is transported in both dissolved and particulate forms, with dissolved nitrogen typically prevailing [19].
The consequences of increasing eutrophication adversely affect native ecosystems by promoting the spread of invasive species. It results in excessive plant and animal biomass, more frequent algal blooms, overgrowth of rooted aquatic plants, and a decline in species diversity. Monitoring eutrophication and identifying nutrient loading sources from a catchment area is therefore essential [20]. This knowledge is also key to the design of appropriate nature-based solutions for the sustainable management of lake ecosystems [21]. Addressing pollution is critical for developing effective strategies to control eutrophication and conserve ecologically significant freshwater ecosystems.
Land use and land cover change within catchments are key indicators for identifying pollution sources, wetland health, and potential for restoration [22]. In Nepal, LULC change has been rapid and poorly regulated. Urban infrastructure and settlement expansion, driven by migration and tourism, are putting increasing pressure on lake valleys. Farmers are abandoning traditional practices because of uncertain climate patterns, intense rainfall, prolonged droughts, and declining profitability, leaving land fallow. Over the last decade, the urban population around Phewa Lake has nearly doubled, reshaping land use patterns. Agricultural land is being converted to urban settlements, while poor solid waste management contributes further to wetland degradation. In response, the government has prioritized the implementation of nature-based solutions and the promotion of integrated catchment management. Recently, the Phewa catchment was designated as one of the first protected catchment areas in the country. However, despite these measures, it remains under threat from both the growing pressure from tourism and rural-to-urban migration. Improper solid waste disposal and the conversion of agricultural land into urban settlements may have contributed to wetland degradation in the area.
Although siltation and eutrophication in Phewa Lake are well recognized, the long-term interactions between land use change, wetland loss, sediment transport, and nutrient delivery remain insufficiently quantified. In particular, little is known about how these processes differ between dry-season and monsoon conditions, when hydrological and erosion dynamics strongly influence nutrient fluxes.
To address this gap, this study examines the impacts of land use and land cover change on nutrient dynamics and water quality in the Phewa Lake catchment. The specific objectives are to (i) assess land use and land cover (LULC) changes between 1990 and 2021 using Landsat satellite imagery processed in Google Earth Engine; (ii) estimate nutrient loading for two time periods using the Integrated Valuation of Ecosystem Services and Tradeoffs (InVEST) model; (iii) assess the spatial distribution of nitrogen and phosphorus and key soil properties through surface soil sampling, riverbed sediment collection during the dry season (2022) and suspended sediment sampling during the monsoon (2023); and (iv) evaluate water quality and the spatial distribution of eutrophication across zones of Phewa Lake.
By integrating remote sensing, ecosystem services modeling, and empirical field data, this study will provide new insights into how LULC change influences nutrient delivery and lake eutrophication. These findings will provide valuable insights for catchment management and support the design of strategies to mitigate nutrient pollution in Himalayan lake systems.

2. Materials and Methods

2.1. Study Area

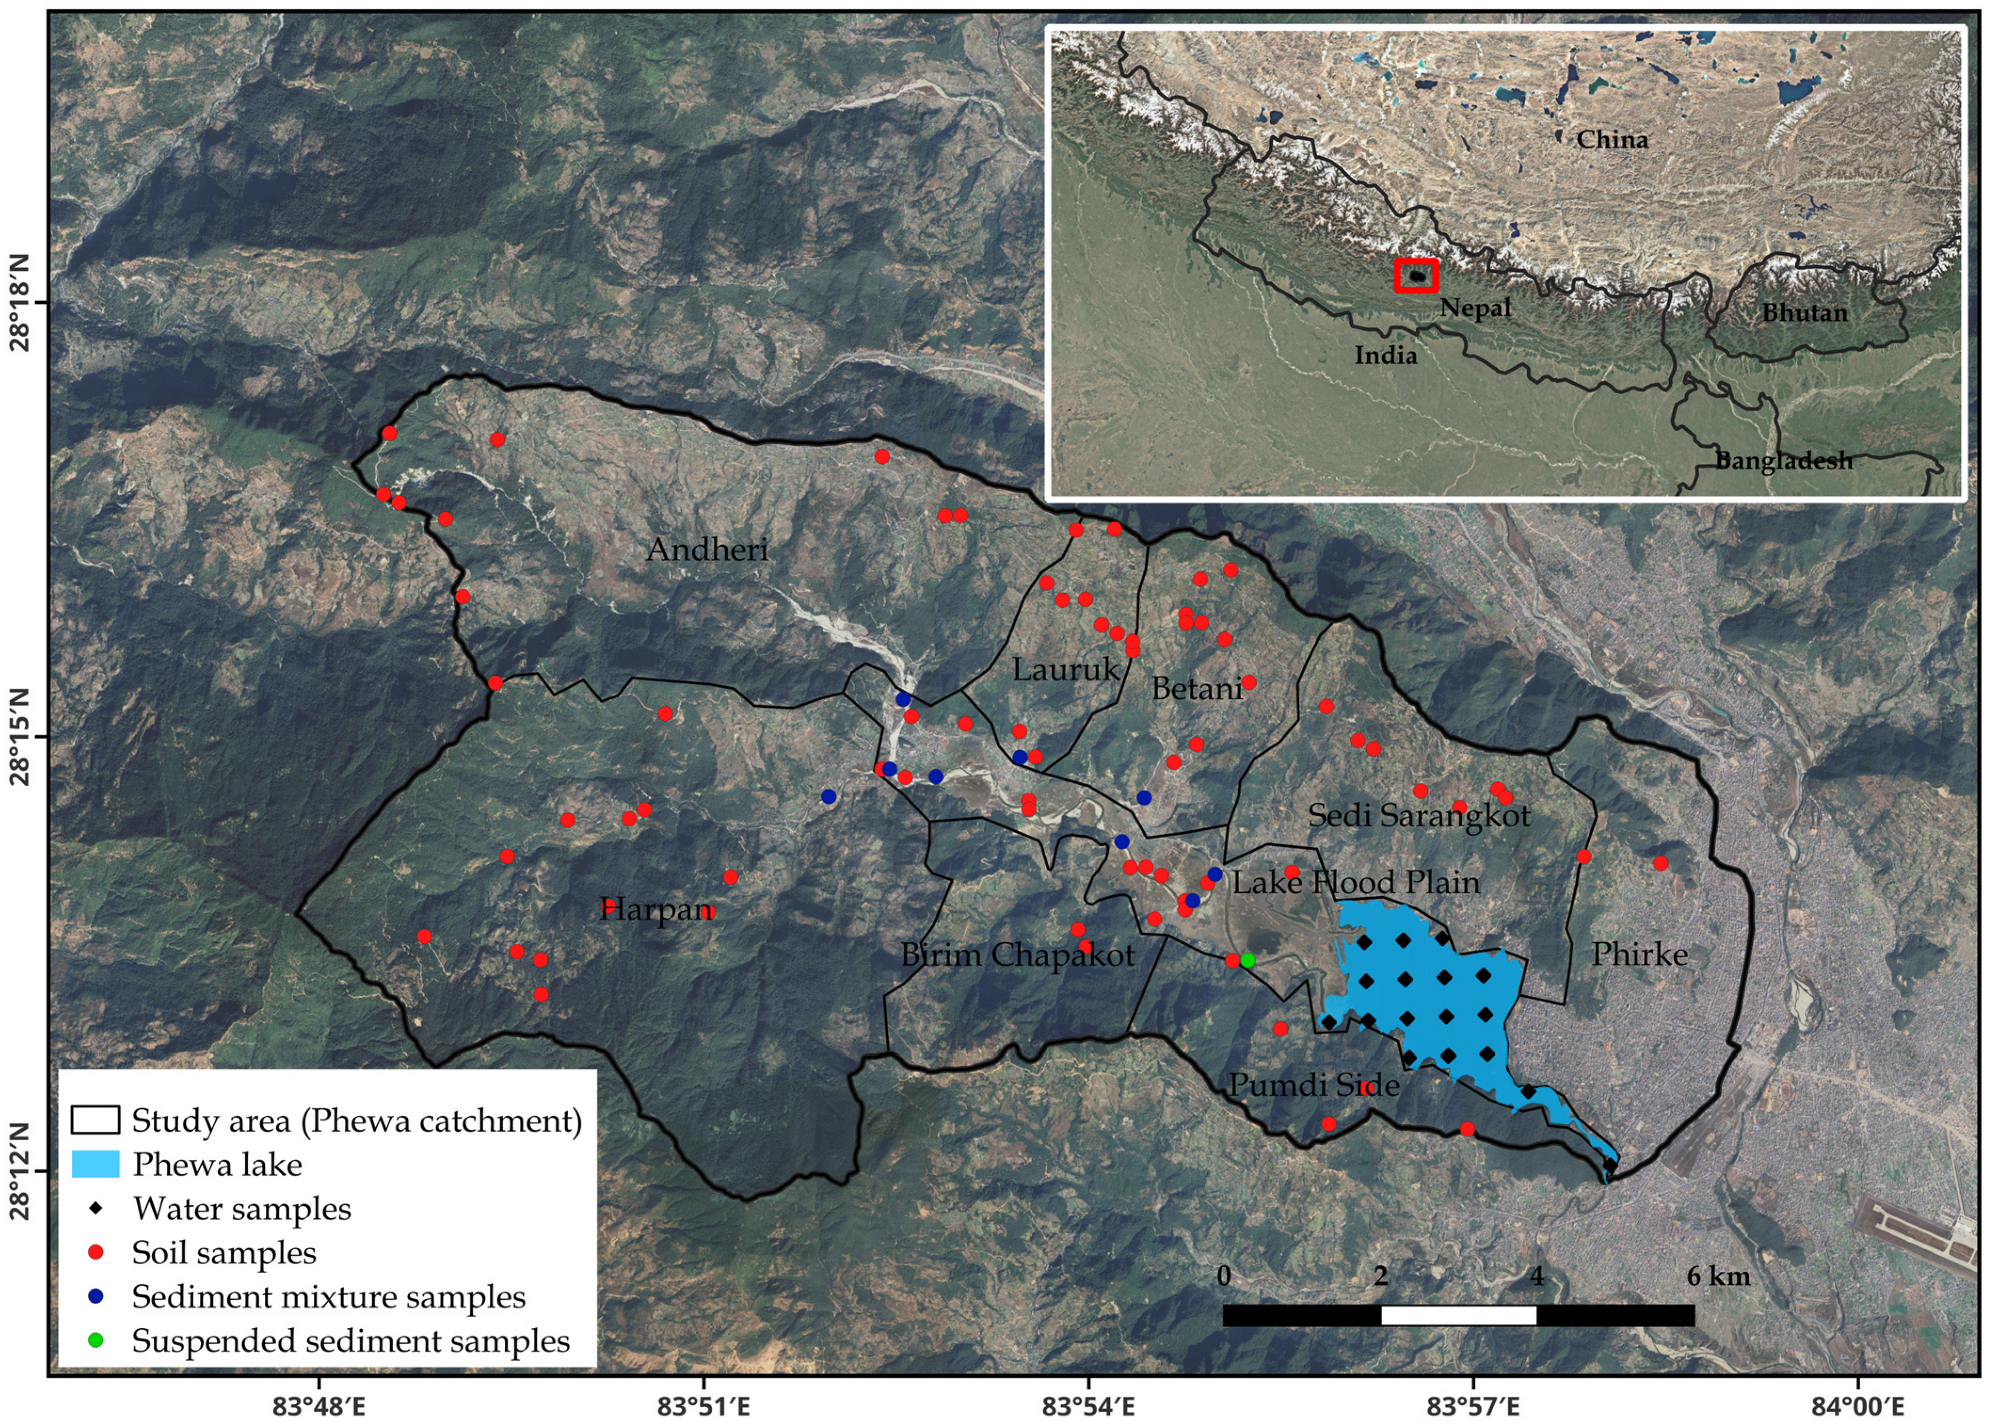
Phewa Lake is one of the largest freshwater lakes in Nepal (Figure 1), providing numerous ecosystem services and holding significant socio-ecological value. In 2016, the lake and its catchment area, including the other eight lakes of the Pokhara Valley, were designated as a Ramsar site. Several studies on Phewa Lake have identified eutrophication as a key challenge for lake management, along with sedimentation, encroachment, and waste disposal [23,24].
Phewa Lake is a stream-fed, regulated, semi-natural, freshwater subtropical mountain lake situated at an altitude of 742 m in the Pokhara Valley (28°7′–28°12′ N, 84°7′–84°19′ E). It has a maximum depth of 24 m and an average depth of 8.6 m. The lake covers an area of 4.4 km2, with a catchment area of 123 km2. This catchment extends across local administrative units, wards no. 2, 4, 5, 6, 7, 8, 18, 22, 23, and 24 of Pokhara Metropolitan City, and wards no. 1, 2, 3, 4, and 5 of Annapurna Rural Municipality. The lake and its surroundings are a major attraction in Pokhara, a popular tourist destination.
Over the past three decades, rapid urbanization and increased land conversion have placed considerable pressure on the lake’s water resources and ecosystems. For this study, the Phewa catchment has been divided into subcatchments based on major contributing tributaries and the physiographic lands associated with the lake. In total, the catchment has been categorized into nine subcatchments (Figure 1). The topographical characteristics of the various subcatchments considered in this study are summarized in Table 1.

2.2. Data Used

The data used in the study, along with their sources and purposes, are presented in Table 2.

2.3. Methods

2.3.1. LULC Mapping

LULC maps for the years 1990 and 2021 were prepared to analyze the land use pattern. Due to its high accuracy and robustness under similar settings of this study, the supervised classification using a Random Forest classifier, based on the Normalized Difference Vegetation Index (NDVI), was applied [25]. The classification scheme used in the study is described in Table 3. The LULC classes were defined based on the local context and prevailing land use practices.
The classification was carried out using temporal Landsat TM imagery on the Google Earth Engine (GEE) platform. Monthly composite NDVI images for the respective years were created for the classification. To minimize cloud interference, cloud score filtering was applied, and only images with less than 30% cloud cover were selected for analysis.
A total of 500 training points, evenly distributed across the target classes, were collected from high-resolution Google imagery and used for the classification process. Each class was equally represented to ensure balanced training data.
For the accuracy assessment, 200 points were randomly generated and placed on the classified image of the study area. The reference column in the accuracy assessment matrix was populated with the best estimate of the actual land cover at each reference point. For the year 2021, ground truth data were obtained through an on-site survey, using GPS points collected in the field. In the case of 1990, a topographic map was used to provide reference data.
A post-classification change detection technique was employed to quantify land cover changes. The spatial distribution of changes across different land cover classes was summarized in a change matrix. This matrix, generated from the classified images of 1990 and 2021, enabled analysis of the overall transitions between different land cover categories.

2.3.2. Modeling Nutrient Loading from the Catchment

Sedimentation and eutrophication have been identified as major environmental issues affecting Phewa Lake. To assess these problems, the study adopted the Integrated Valuation of Ecosystem Services and Tradeoffs (InVEST) modeling suite, specifically the Nutrient Delivery Ratio (NDR) model. InVEST was selected due to its relatively low data input requirements and its ability to model the relationship between land use/land cover (LULC) and nutrient loading.
The NDR model was used to map nitrogen and phosphorus export across the catchment. It uses a simplified mass balance approach to describe the movement of nutrient loads through space and quantifies the export of nitrogen and phosphorus. The model identifies nutrient sources based on the LULC map and associated nutrient loading rates. Nutrient loads are categorized into sediment-bound and dissolved forms, which are transported via surface and subsurface flows, respectively, ceasing once they reach a stream.
For each pixel, delivery factors were calculated based on pixel-specific attributes (e.g., slope and the retention efficiency of the land cover type) along the same hydrological flow path. These pixel-level contributions were aggregated at the outlet of the catchment or subcatchment to estimate total nutrient export.
The N D R for a given pixel i is computed as follows:
N D R i = N D R 0 , i   1 + e x p I C 0 I C 1 k 1
where I C 0 and k are calibration parameters, I C 1 is a topographic index and N D R 0 , i is the proportion of nutrient not retained downslope.
The nutrient export from each pixel i is calculated by the product of the load and NDR.
x e x p i = l o a d s u r f , i . N D R s u r f , i + l o a d s u b s , i . N D R s u b s , i
where x e x p i is the total nutrient export from pixel i (kg/ha/year) that eventually reaches the stream, l o a d s u r f , i is surface nutrient load on pixel i, N D R s u r f , i is the NDR for surface flow, l o a d s u b s , i is the subsurface nutrient load on pixel i, and N D R s u b s , i is the NDR for subsurface flow. The total nutrient export ( x e x p t o t ) for the entire catchment is given by the following:
x e x p t o t = i x e x p i
A biophysical table (Table 4) was used as an input for NDR models. This table defines the nutrient loading rates and retention efficiency values for each land use class represented in the LULC maps. The values were decided based on the field of observation, the past and present scenario of agricultural practices, including fertilizer inputs and nutrient export potentials suggested by different studies [26,27,28,29,30] and authors’ judgment.

2.3.3. Lake Water Quality Analysis

To design an appropriate sampling strategy, the lake surface area covered by water was first delineated. A polygon of the lake was created by digitizing recent imagery from Google Earth. This polygon was then divided into grids of 500 m. A total of 17 grid cells were formed within the lake boundary. Water samples were collected from 20 points representing all the grid cells (as shown in Figure 1) in March 2022. Sampling was conducted during the pre-monsoon period to avoid the complexities caused by intense rainfall, flooding, and daily fluctuations in water quality during the monsoon season.
Water quality parameters such as pH and transparency were measured on-site. The pH was measured using a Lutron Digital pH Meter, while water transparency was measured using a 20 cm diameter Secchi disk.
From each sampling site, 1000 mL of surface water (0.15 m depth) was collected in high-density polyethylene (HDPE) bottles for the analysis of total nitrogen, total phosphorus, and chlorophyll-a. Prior to sampling, the bottles were rinsed with water from their respective points. All samples were immediately stored in an icebox and transported to the laboratory for analysis. Nitrate concentrations were determined using the UV spectrophotometric method. Phosphate concentrations were analyzed using the ascorbic acid spectrophotometric method. Chlorophyll-a was measured following the procedure outlined by [31]. Water sampling and quality analysis followed the protocols recommended by APHA (American Public Health Association), as cited by [32].
The trophic state of the lake was assessed using Carlson’s Trophic State Index (CTSI) [33], which is based on the average of three parameters: log-transformed Secchi disk transparency (SD), chlorophyll-a concentration (CA), and total phosphorus (TP). The index was calculated using the following equations:
T S I   ( C A ) = 9.81   ln C A + 30.6
T S I   ( S D ) = 60 14.41   ln S D
T S I   ( T P ) = 14.42   ln T P + 4.15
where TSI refers to the Carlson Trophic State Index and ln is the natural logarithm. The CA and TP are in µg/L, and SD is in m. The final Carlson Trophic State Index (CTSI) was calculated as follows:
C T S I =   T S I C A + T S I S D + T S I T P 3
Based on the CTSI value, the lake’s trophic state was categorized as follows: oligotrophic (low productivity): CTSI = 0–40; mesotrophic (moderate productivity): CTSI = 40–50, and eutrophic (high productivity): CTSI = 50–100.

2.3.4. Soil and Sediment Sampling and Analyses

Surface soil and sediment samples were collected from various land uses, land covers, and geomorphic elements, including agricultural land, forests, bare surfaces, and riverbanks that were randomly distributed across the Phewa subcatchments. Based on the surface area occupied by each LULC category and geomorphic unit, a total of 74 point samples were proportionally allocated. Along the Harpan River, which flows into Phewa Lake, a regularly spaced sampling scheme including five points was implemented to track nutrient dynamics in fine riverbed sediments. Additionally, the outlets of the four main tributaries were sampled to represent dominant land uses, particularly cropland and forested areas, with a total of nine riverbed composite samples. During monsoon 2023, four suspended sediment samples were collected at the Harpan River inflow into the lake.
The soil and sediment samples were air-dried and homogenized. The study focused on fine-grained fractions, as nutrients and contaminants tend to accumulate in these smaller particles. Samples were sieved to ≤0.063 mm to isolate this fraction, in line with USDA standards. Particle size distribution was determined using a Coulter LS 13 320 laser diffraction particle size analyzer (Beckman Coulter, Inc., Brea, CA, USA, 2011) after removing the organic matter by pre-treating the samples with H2O2 (10%) heated to 80 °C. Standard analysis was performed to determine pH values. The soil organic matter (SOM) content was estimated by multiplying soil organic carbon (SOC) by the Van Bemmelen conversion factor (1.724). SOC was measured on finely ground subsamples using the dry combustion method, with a LECO RC-612 multiphase carbon analyzer (LECO Corporation, St. Joseph, MI, USA; LECO, 1996). Soil nitrogen (N) was measured using the LECO CN TruSpec nitrogen analyzer by determining the NOx gas evolved after combustion at 950 °C by a LECO thermal conductivity detector. Total phosphorus (P) was analyzed by inductively coupled plasma spectrometry (ICP-AES) after total acid digestion in two cycles: the first with HF (48%), HNO3, and H2O2, and the second with HNO3, HCl, and Milli-Q water in a microwave oven.
t-test and ANOVA of soil and sediment properties were performed to assess whether there were significant differences between land uses/land covers as well as among subcatchments. The relationships between different properties in both source soils and sediments were assessed using multivariate analysis based on a correlation matrix.

3. Results

3.1. Land Use, Land Cover, and Their Change Pattern

LULC maps prepared for the years 1990 and 2021 are presented in Figure 2 and Table 5. In 1990, agricultural land occupied the largest area, followed by forest and water bodies. By contrast, in 2021, forest became the dominant land cover class, followed by agricultural land. Water bodies, barren land, and swamps accounted for a significantly smaller proportion in both years compared to forest and agricultural areas.
In 1990, agriculture and forest covered approximately 51.98% and 41.43% of the catchment area, respectively. Other notable land cover classes included water bodies (3.52%), built-up areas (1.79%), degraded land (1.01%), and swamps (0.26%). The 1990 LULC map was used as a baseline for change detection analysis. Various studies in Nepal have shown that LULC patterns before and after the 1990s differed significantly due to policy shifts, socioeconomic change, conservation, and development.
The 2021 LULC map indicates that forest and agriculture continue to be the dominant land cover types, jointly accounting for over 80% of the catchment area. The proportions for each class in 2021 were as follows: forest (50%), agricultural land (39.16%), water bodies (3.21%), built-up/urban (6.30%), swamps (0.38%), and degraded/barren land (0.95%).
The land use change data presented in Table 5 reveal that forest and built-up areas have experienced positive changes over the study period, while agricultural land, water bodies, and barren land have declined. The most notable rates of change were observed in agricultural land (decline), forest cover (increase), and built-up areas (increase). Relatively smaller changes were recorded in water bodies, barren, degraded, and swamp land classes.
The overall classification accuracy was 80.56% for 1990 and 87.26% for 2021. The Kappa coefficients, indicating strong agreement between classified and reference data, were 0.801 and 0.843, respectively, falling within the “almost perfect” range (0.81–1.00).
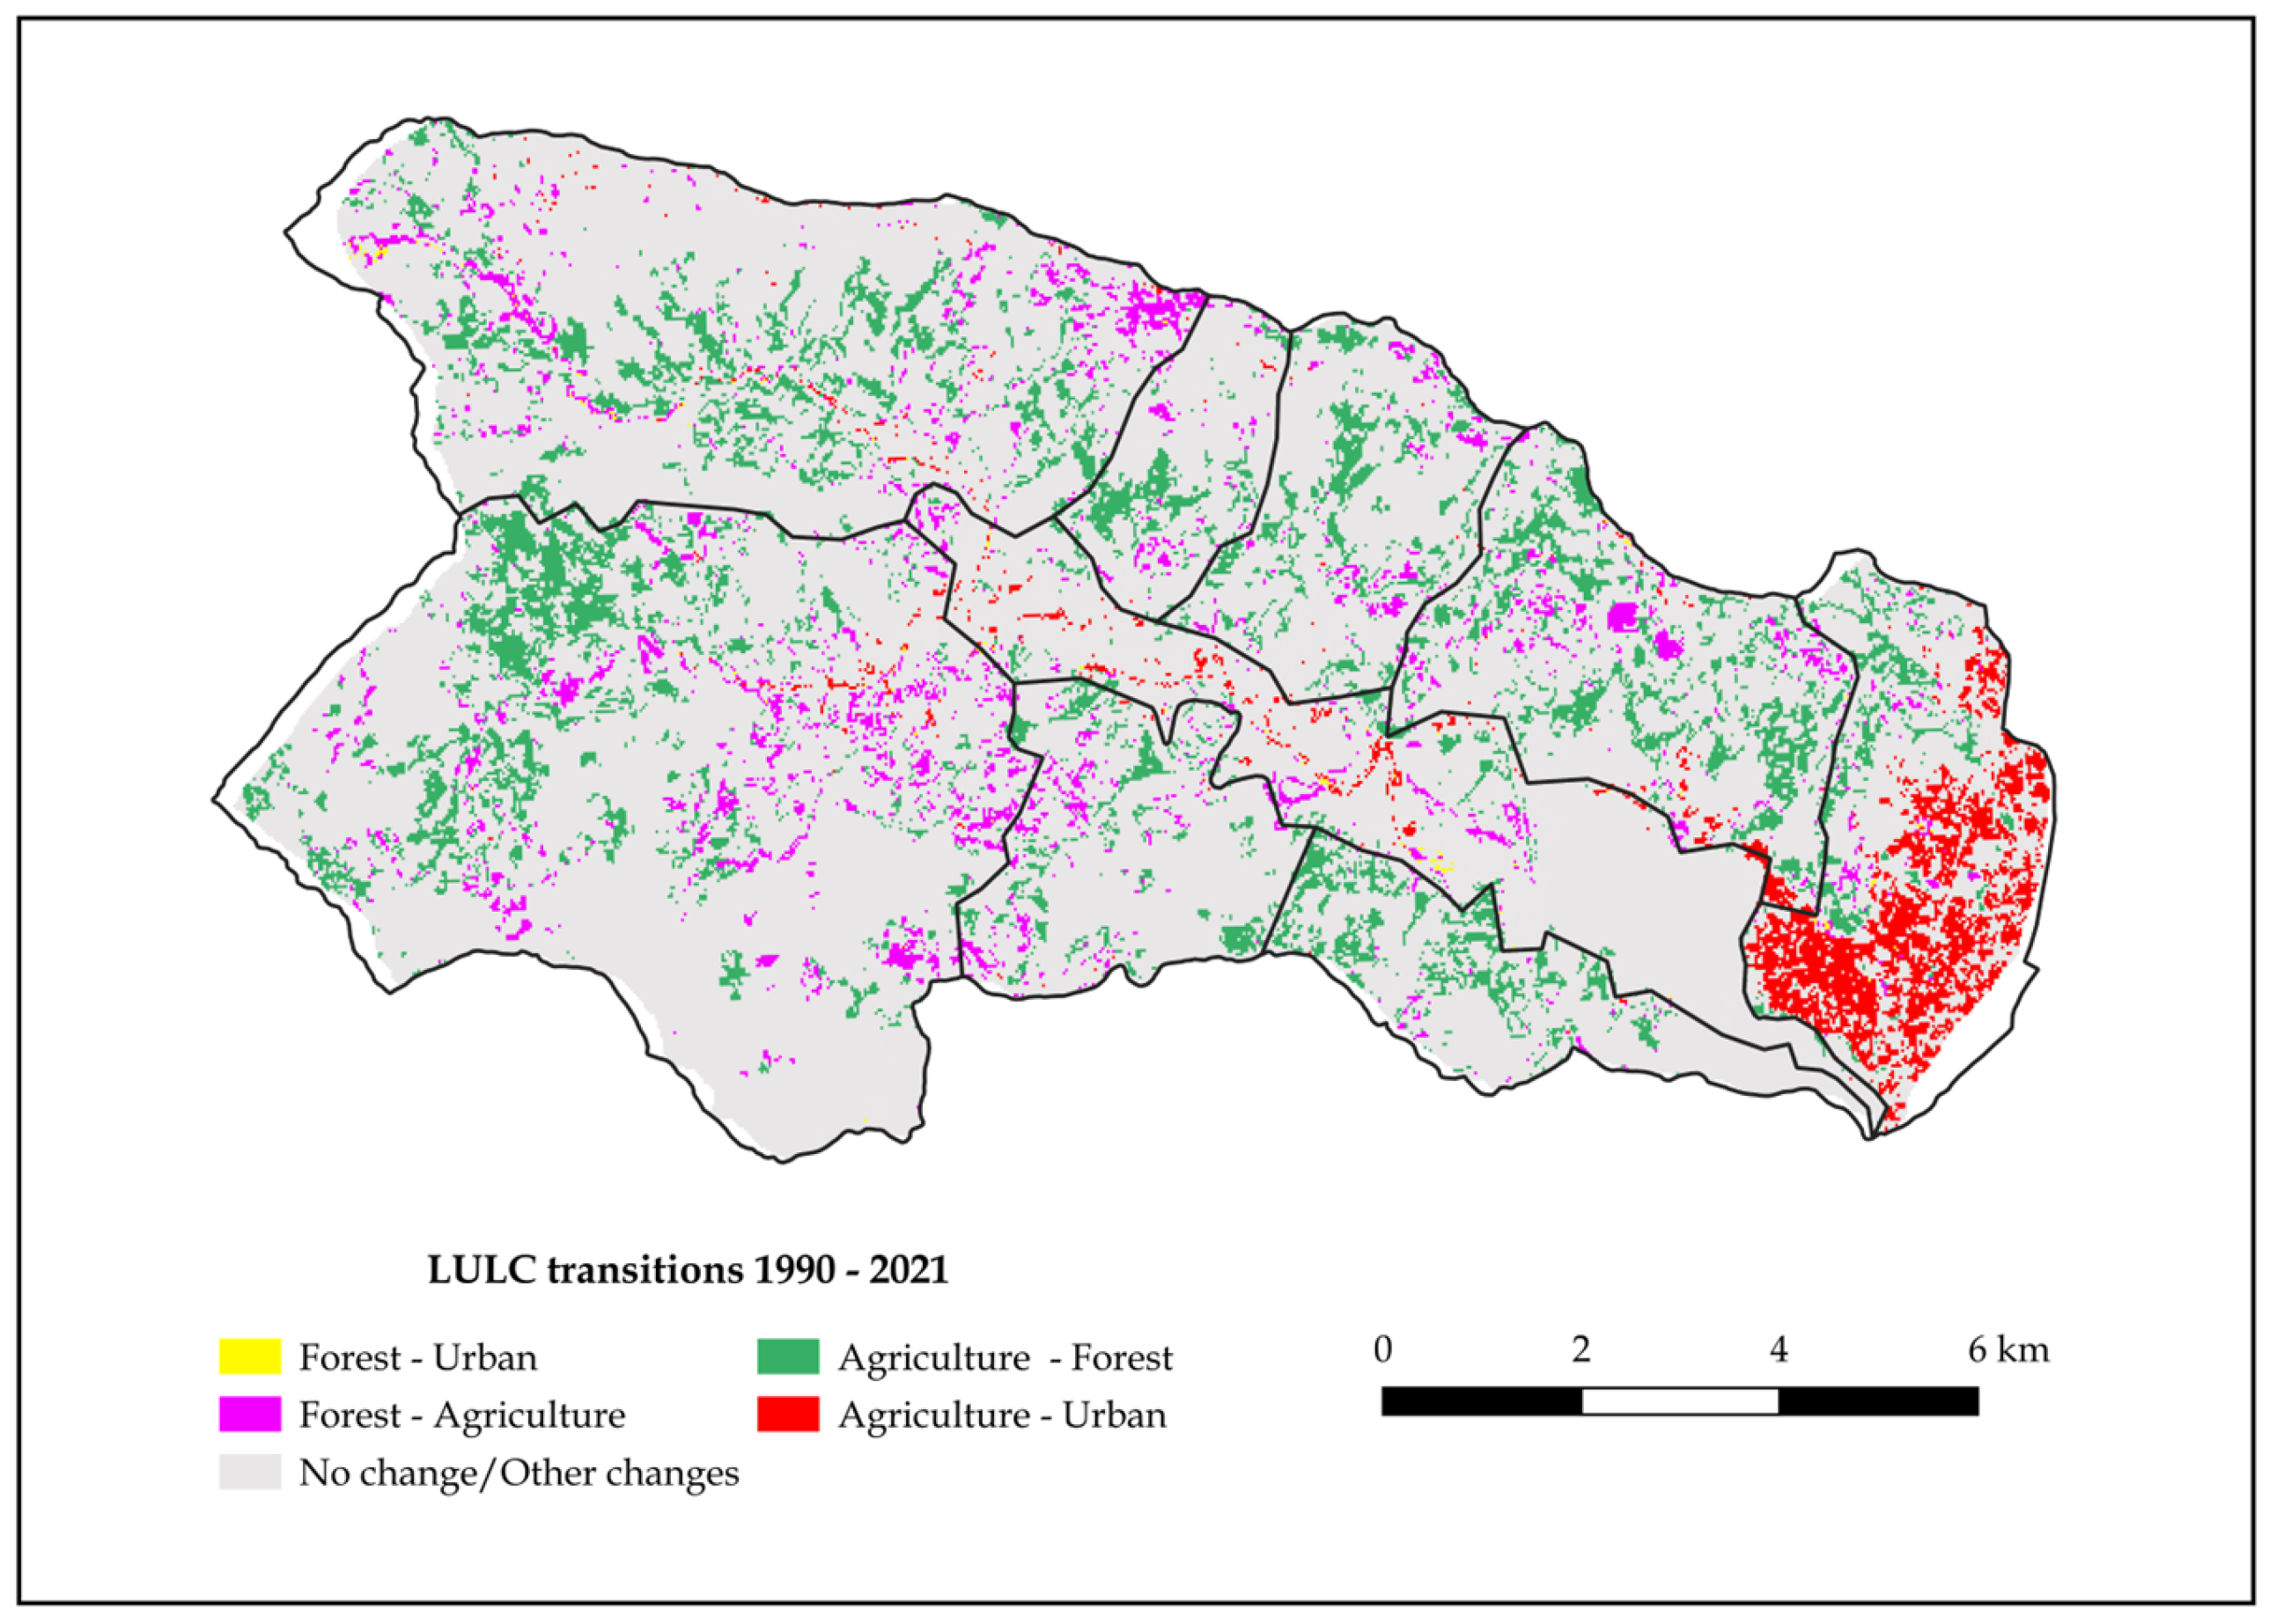
A comparative assessment of the Phewa catchment over the past three decades shows a significant increase in forest cover (over 20%) and a tripling of urban or built-up areas. Figure 3 displays the LULC transitions from 1990 to 2021. Conversely, nearly one-third of the agricultural land has been converted to other land uses during this period.
The LULC change detection analysis revealed that most land conversions occurred at the expense of agricultural land. Transitions from agriculture to forest and from agriculture to urban land were the most prevalent trends. Table 6 presents the agricultural land conversion dynamics in each subcatchment.
Among the nine subcatchments, Harpan, Birim Chapakot, Sedi Sarangkot, Betani, and Andheri showed relatively high conversion from agricultural to forest land. Meanwhile, Phirke and the Lake alluvial floodplain exhibited rapid conversion from agriculture to built-up land. Based on the current LULC map, Lauruk, Lake alluvial floodplain, Betani, Sedi Sarangkot, and Andheri still retain considerable agricultural land, whereas Harpan, Pumdi Side, and Birim Chapakot are now more forested. The Phirke subcatchment is the most urbanized area.

3.2. Nutrient Loading

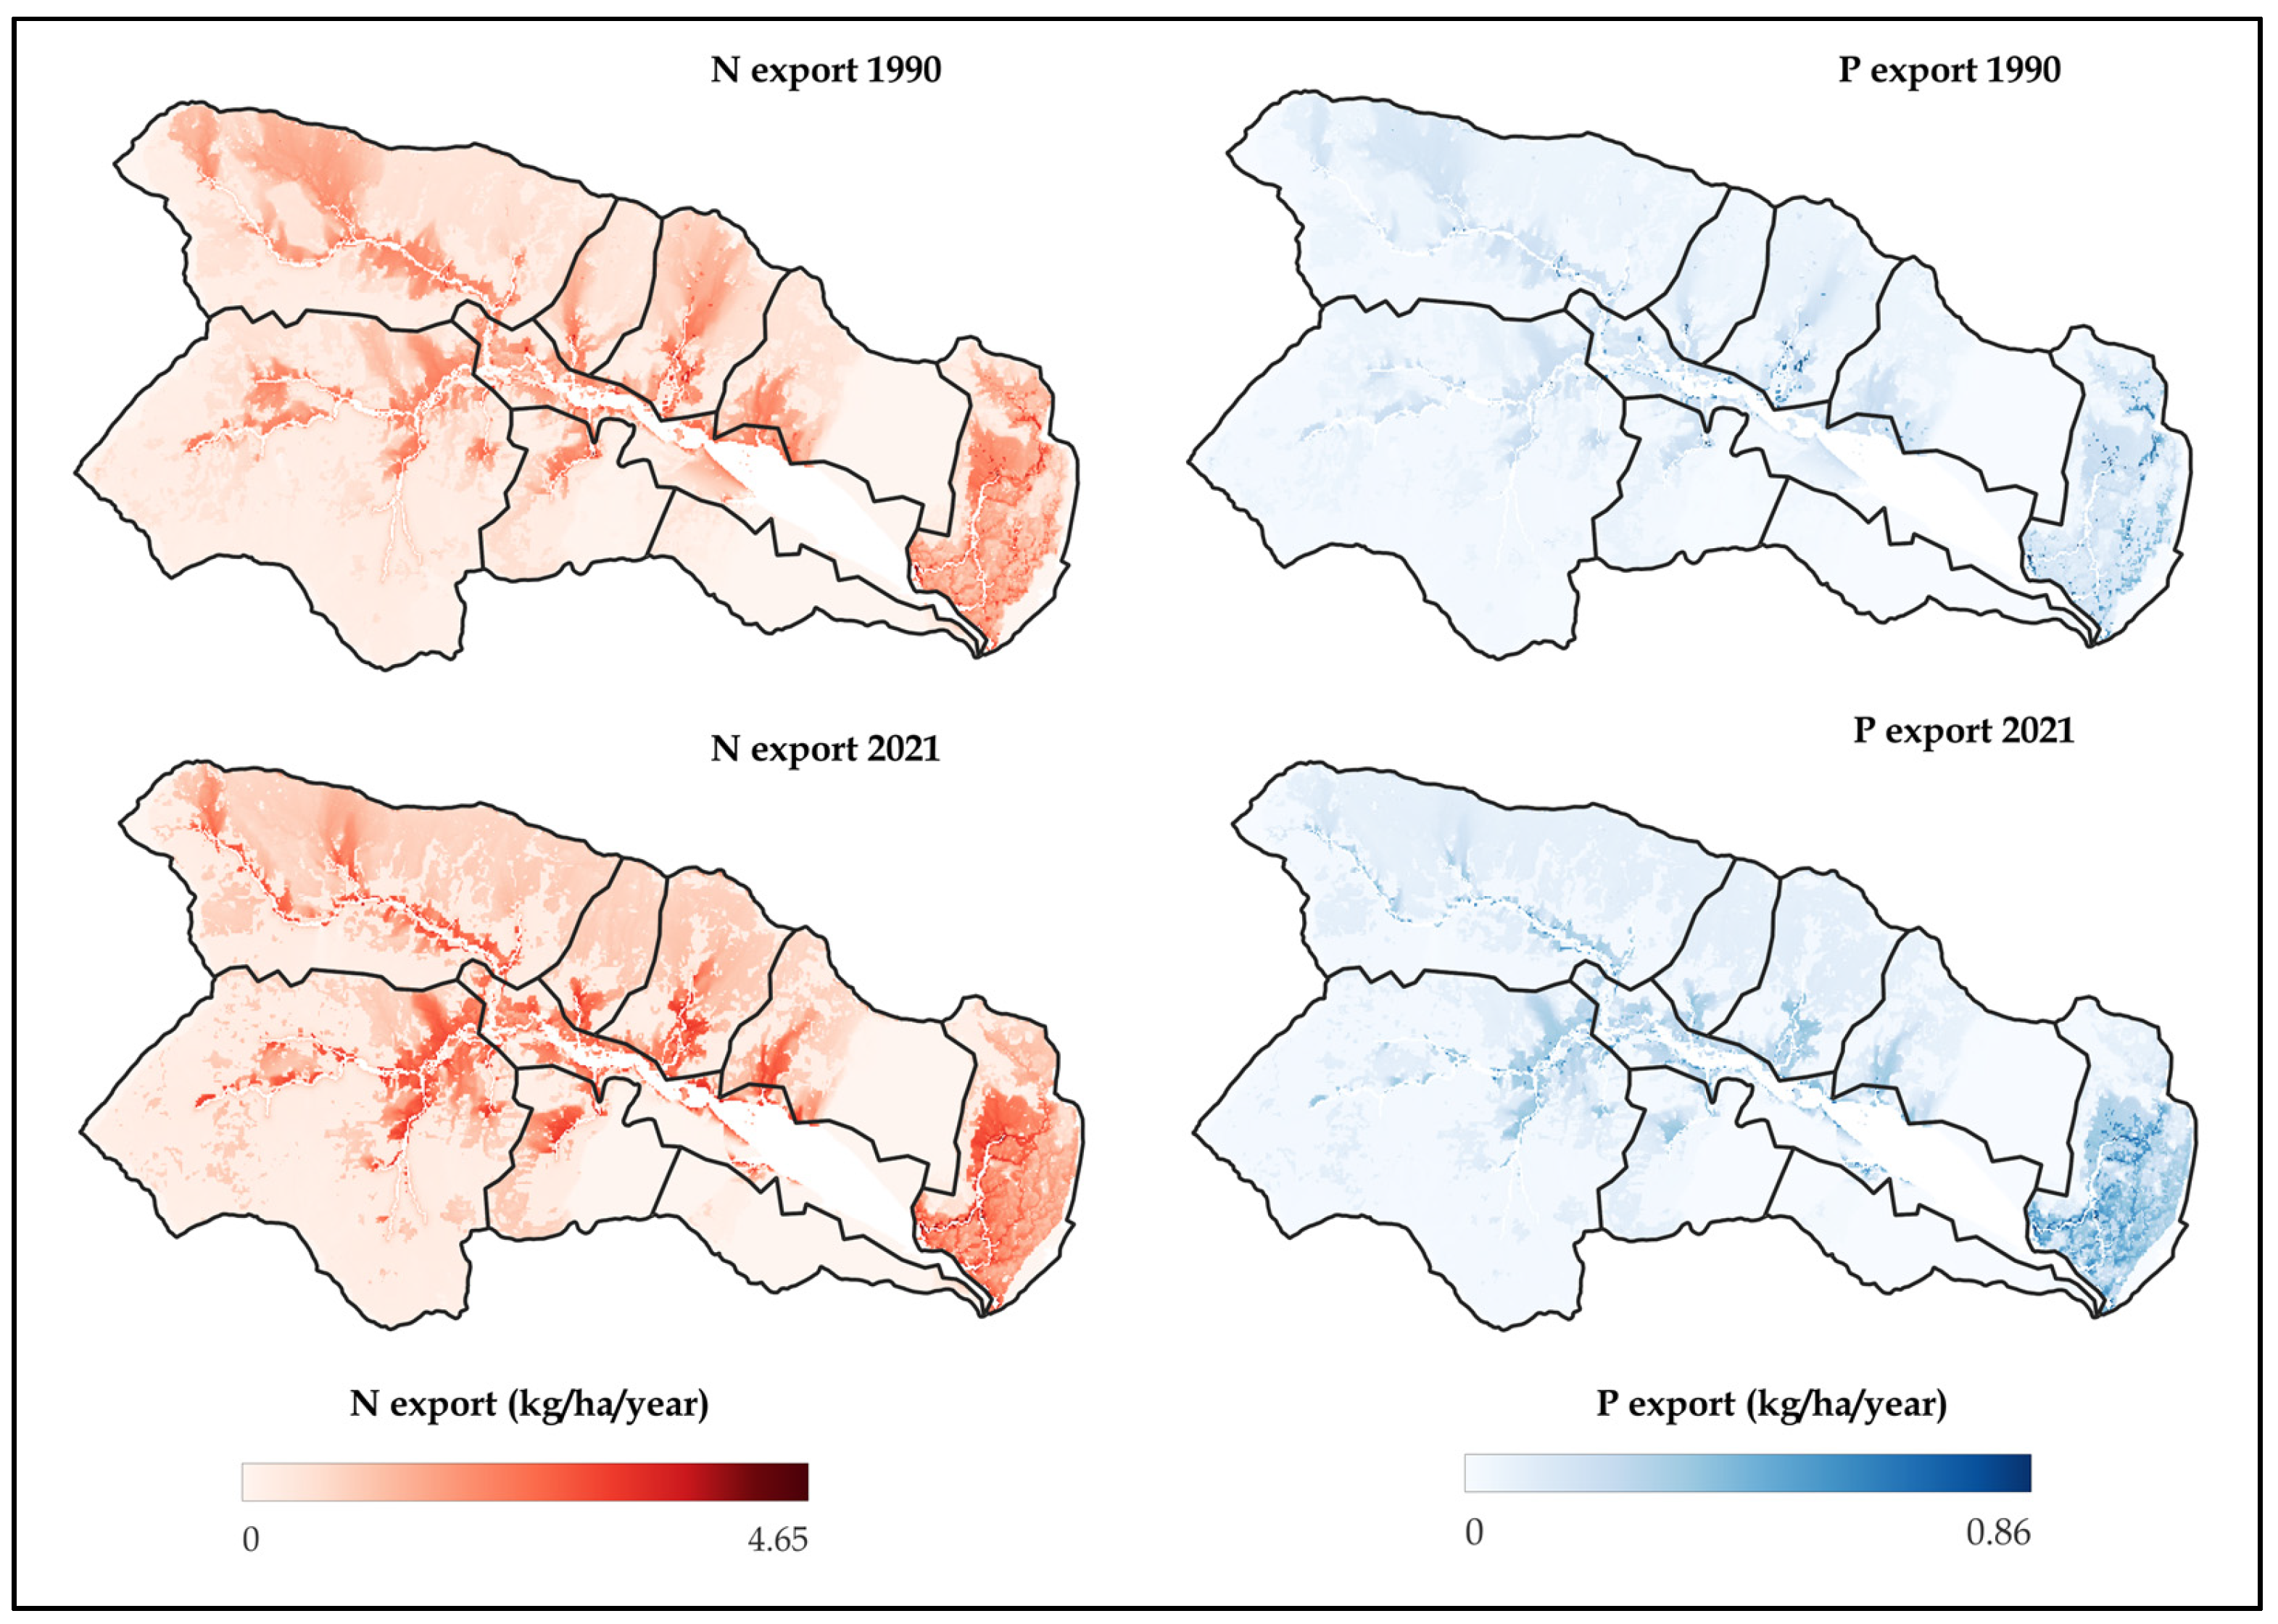
The modeled nutrient export data from subcatchments of Phewa Lake between 1990 and 2021 reveal an increase in both nitrogen (N) and phosphorus (P) exports across most subcatchments (Figure 4), indicating growing nutrient pressure on the lake ecosystem. The Phirke subcatchment showed the highest increase, with N export rising from 1.02 to 1.20 kg/ha/year and P export from 0.11 to 0.19 kg/ha/year—associated with urbanization and poor sewage management. Subcatchments like Lauruk and Betani also exhibited notable increases in both N and P loads. In contrast, Pumdi Side recorded a decline in nutrient exports, potentially reflecting land abandonment, reforestation, or reduced anthropogenic pressure. Overall, the total nutrient export to the lake increased from 0.54 to 0.60 kg/ha/year for N and from 0.05 to 0.065 kg/ha/year for P (Table 7), indicating a gradual but consistent rise in nutrient inputs, which exacerbate eutrophication risks in Phewa Lake. The estimated values were associated with different loading and efficiency inputs in the model; further calibration and validation of models with ground data can enhance the accuracy. However, the model is perfectly capturing the catchment land use management nutrient retention scenarios and nutrient enrichment conditions in the lake water body.

3.3. Content of N and P in Soils and Sediments, and Export to the Lake

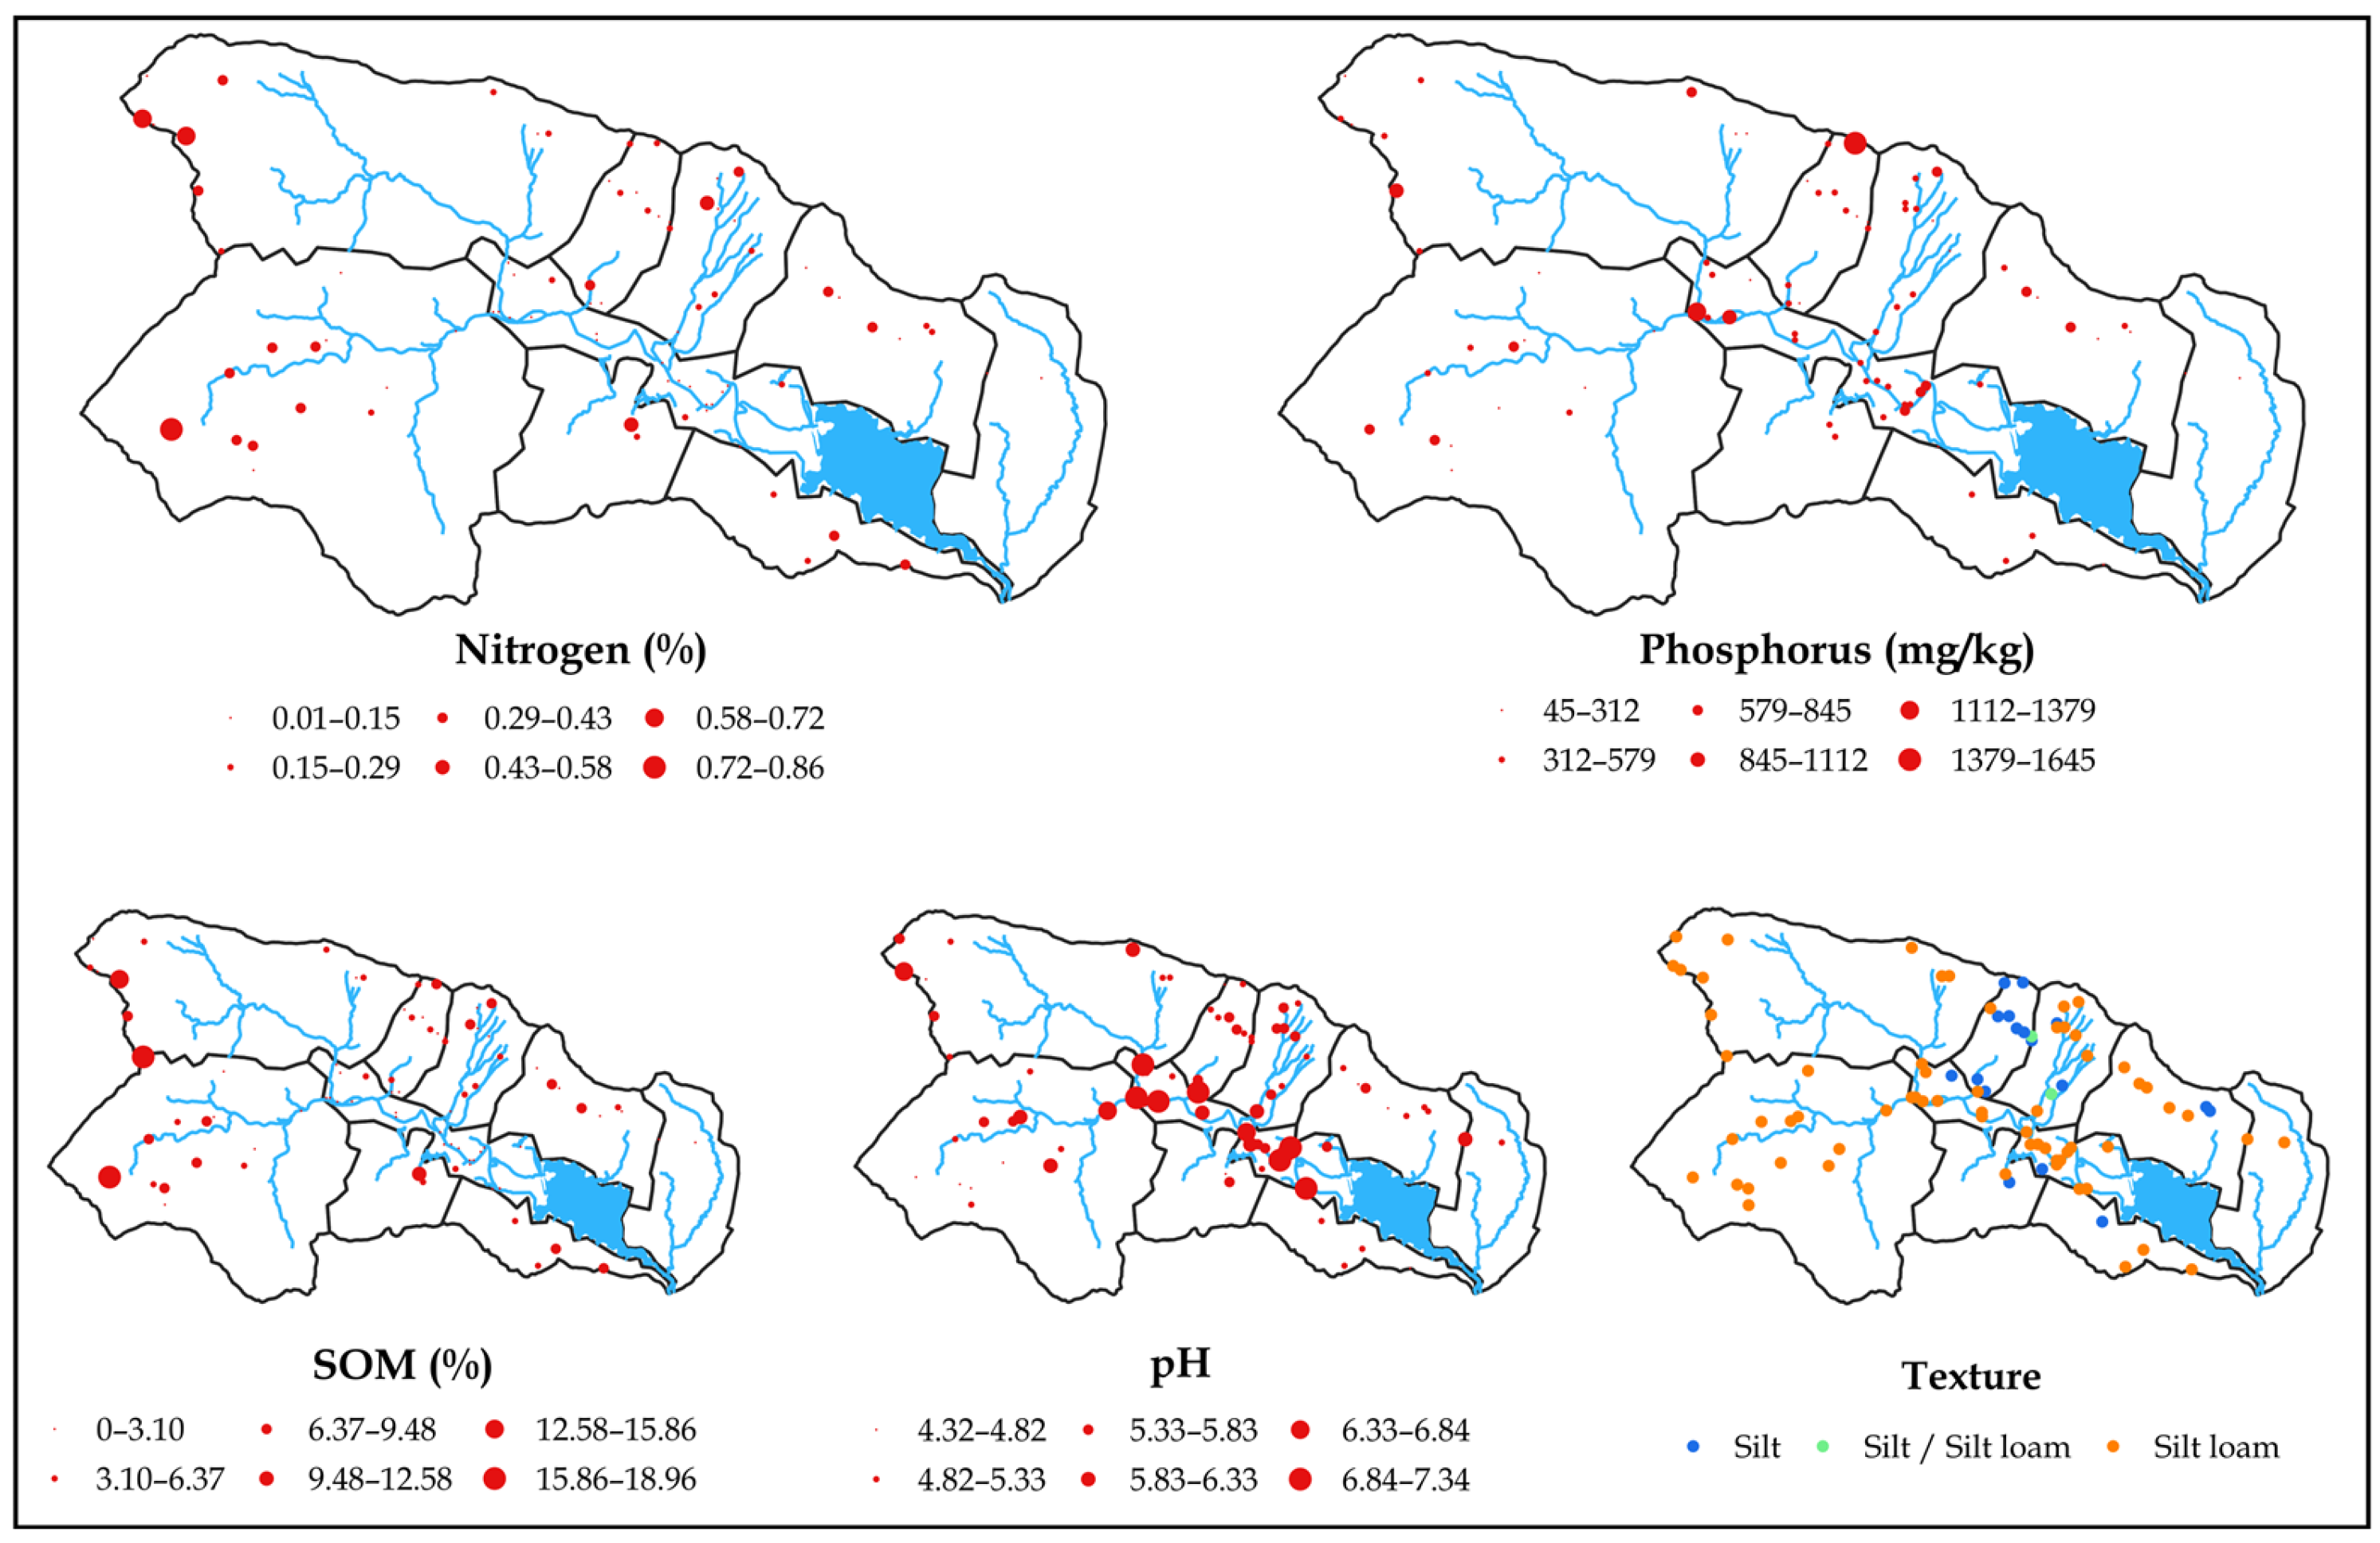
The spatial variability of nitrogen and phosphorus content distribution across the catchment is considerable (Figure 5). Much higher mean values are observed for phosphorus compared to nitrogen in both soils and sediments, as expected. The pH values range from 4.6 to 6.2, with the highest values found in riverbanks and the lowest in forests.
Table 8 shows the results of an ANOVA considering the land uses and geomorphic features. Regarding riverbanks, they exhibit the highest sand content, followed by bare surfaces, while cropland and forest are the most similar in this respect. The silt content is higher in cropland and forest and decreases mostly in riverbanks. This same trend is observed for clay content. Nitrogen levels are generally low, with the highest value reaching 0.6% in the forest and the lowest in both bare surfaces and riverbanks. For phosphorus, riverbanks and cropland areas show the highest mean contents, and forests exhibit the greatest variability. In contrast, the highest SOM content is recorded in forest areas, with the minimum SOM content found in riverbanks.
An ANOVA test for the subcatchments (Table 9) showed significant differences in mean grain size percentages, with the highest sand content in the Lake Floodplain, followed by the Andheri catchment. Silt was the most abundant grain size fraction, with mean values ranging from 70% to 82%. Clay contents were highest in the Harpan and Pumdi Side subcatchments, where the percentage of forest cover was also the highest. This coincided with the highest mean N and SOM contents. Large variability was observed in P contents among subcatchments, which was particularly notable in the Lauruk subcatchment, where the highest phosphorus content was recorded.
The assessment of the relationships between nutrients and soil and sediment properties (Table 10) revealed that, in the source samples, nitrogen content was directly and significantly correlated with the finer fractions, with the strongest correlations observed with clay, while the correlation with sand was significant and negative. A direct and strong correlation was also found with SOM. Phosphorus only correlated significantly with SOM, and no significant correlations were recorded with grain sizes.
In riverbed and suspended sediment samples, stronger correlations between N and both the finer fractions and SOM were found compared to the source samples. Although the relationships between phosphorus and grain size were not significant, a negative trend was observed with clay content, as well as with SOM, likely due to the relatively small number of samples.
The box plots in Figure 6 show that both riverbed and suspended sediments were significantly depleted in N and SOM compared to the contents found in croplands and forests, while they showed similar contents to riverbanks and bare surfaces. However, phosphorus content was higher in the sediments, although its enrichment was only significant in the suspended sediments compared to forest and bare surfaces. Sediments were enriched in sand content, whereas the opposite was recorded for silt and clay contents in comparison with the land uses and bare surfaces. When compared to riverbanks, grain size distributions were similar.
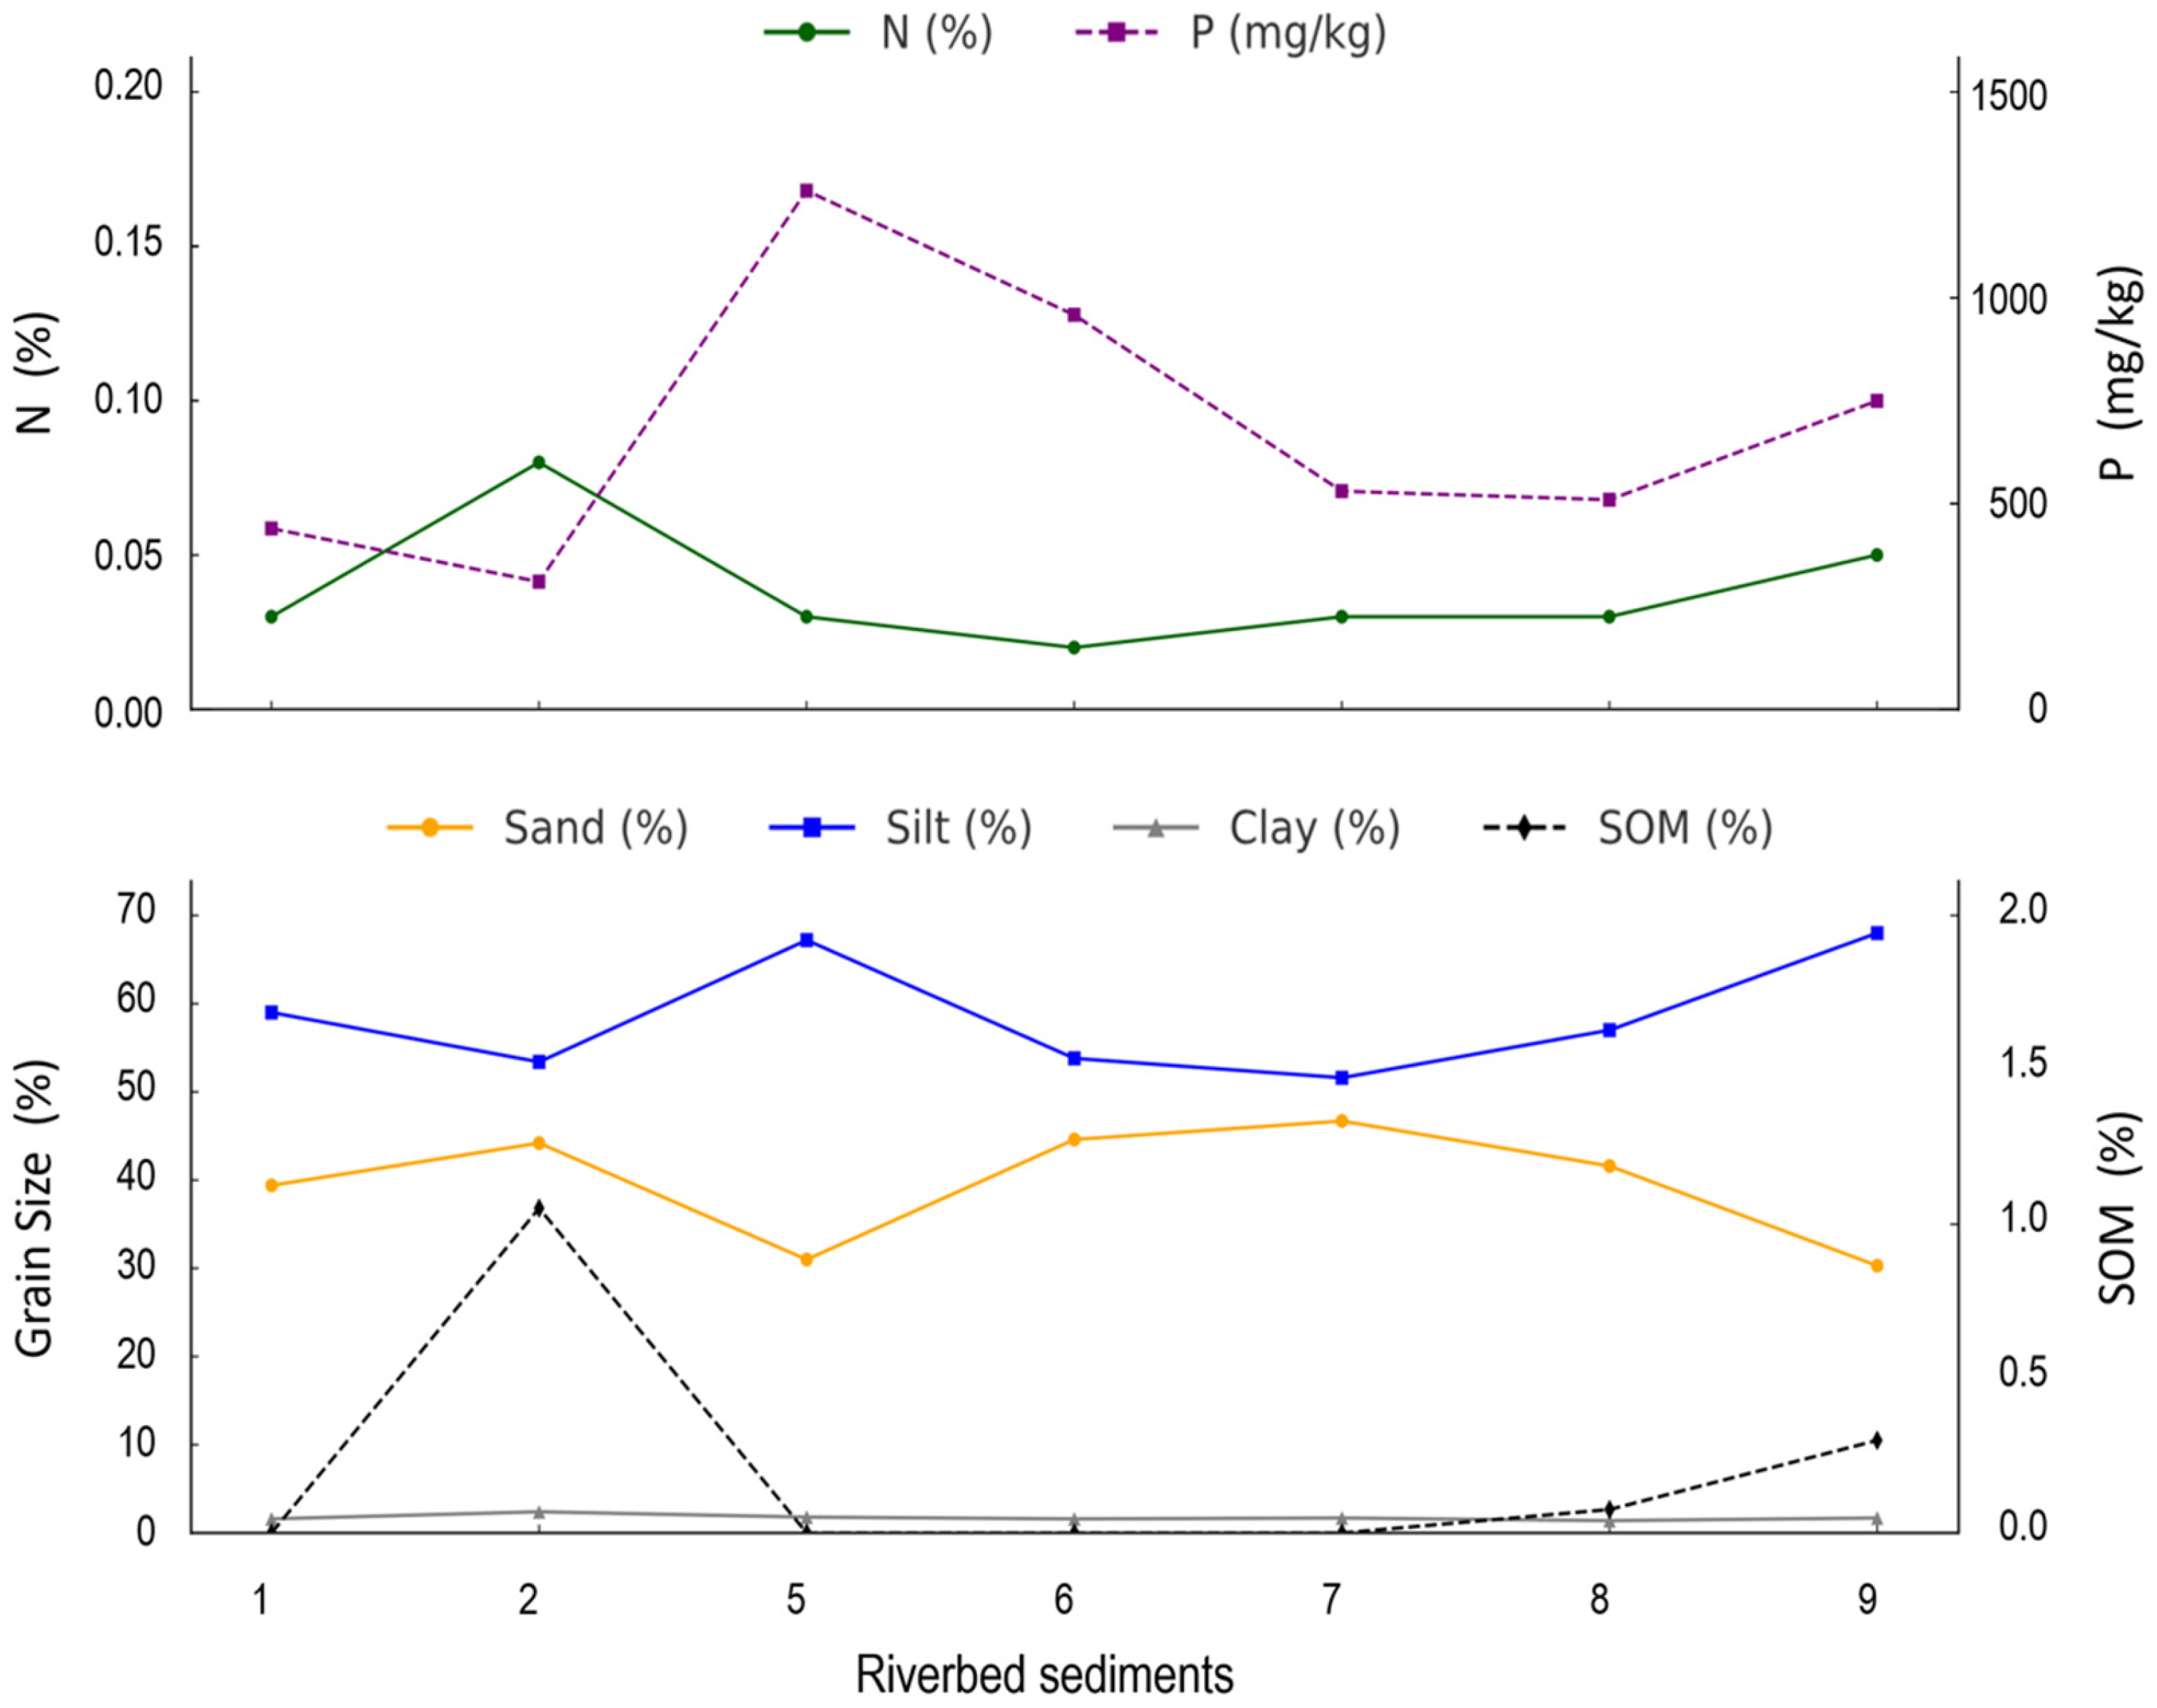
Along the Harpan River, riverbed samples showed some variations (Figure 7). While clay content remained fairly constant, sand and silt contents showed contrasting patterns, with sand content reaching its maximum at Point 5, where a confluence is located, and at the outlet, whereas silt content showed an opposite trend. SOM content was highest at the outlet of the Harpan subcatchment (P2), then decreased sharply along the river before increasing again near the river outlet close to its inflow into the lake. Coinciding with the sand peak at Point 5, phosphorus rose to its highest level, then decreased progressively before rising again near the inflow. However, the pattern for nitrogen differed, recording its maximum at the outlet of the Harpan subcatchment (P2), followed by a decrease and a subsequent rise towards the inflow into Phewa Lake.
While assessing the nutrient export maps, the comparison is not direct, as the content data are derived from point samples, whereas the maps are based on spatial raster simulations. Nonetheless, a consistent pattern is observed in the distribution of high phosphorus levels in the headwater areas of the subcatchments, particularly those dominated by agriculture on the left bank of the Harpan River overlying phyllite lithology. For N, the simulated exports in the headwater sector of the Harpan River are consistent with the relatively high nitrogen levels recorded in this area and in the headwaters of the Lauruk and Betani subcatchments on the left bank, although in the Andheri subcatchment, there was insufficient sample density for a sound comparison.

3.4. Water Quality and Lake Eutrophication

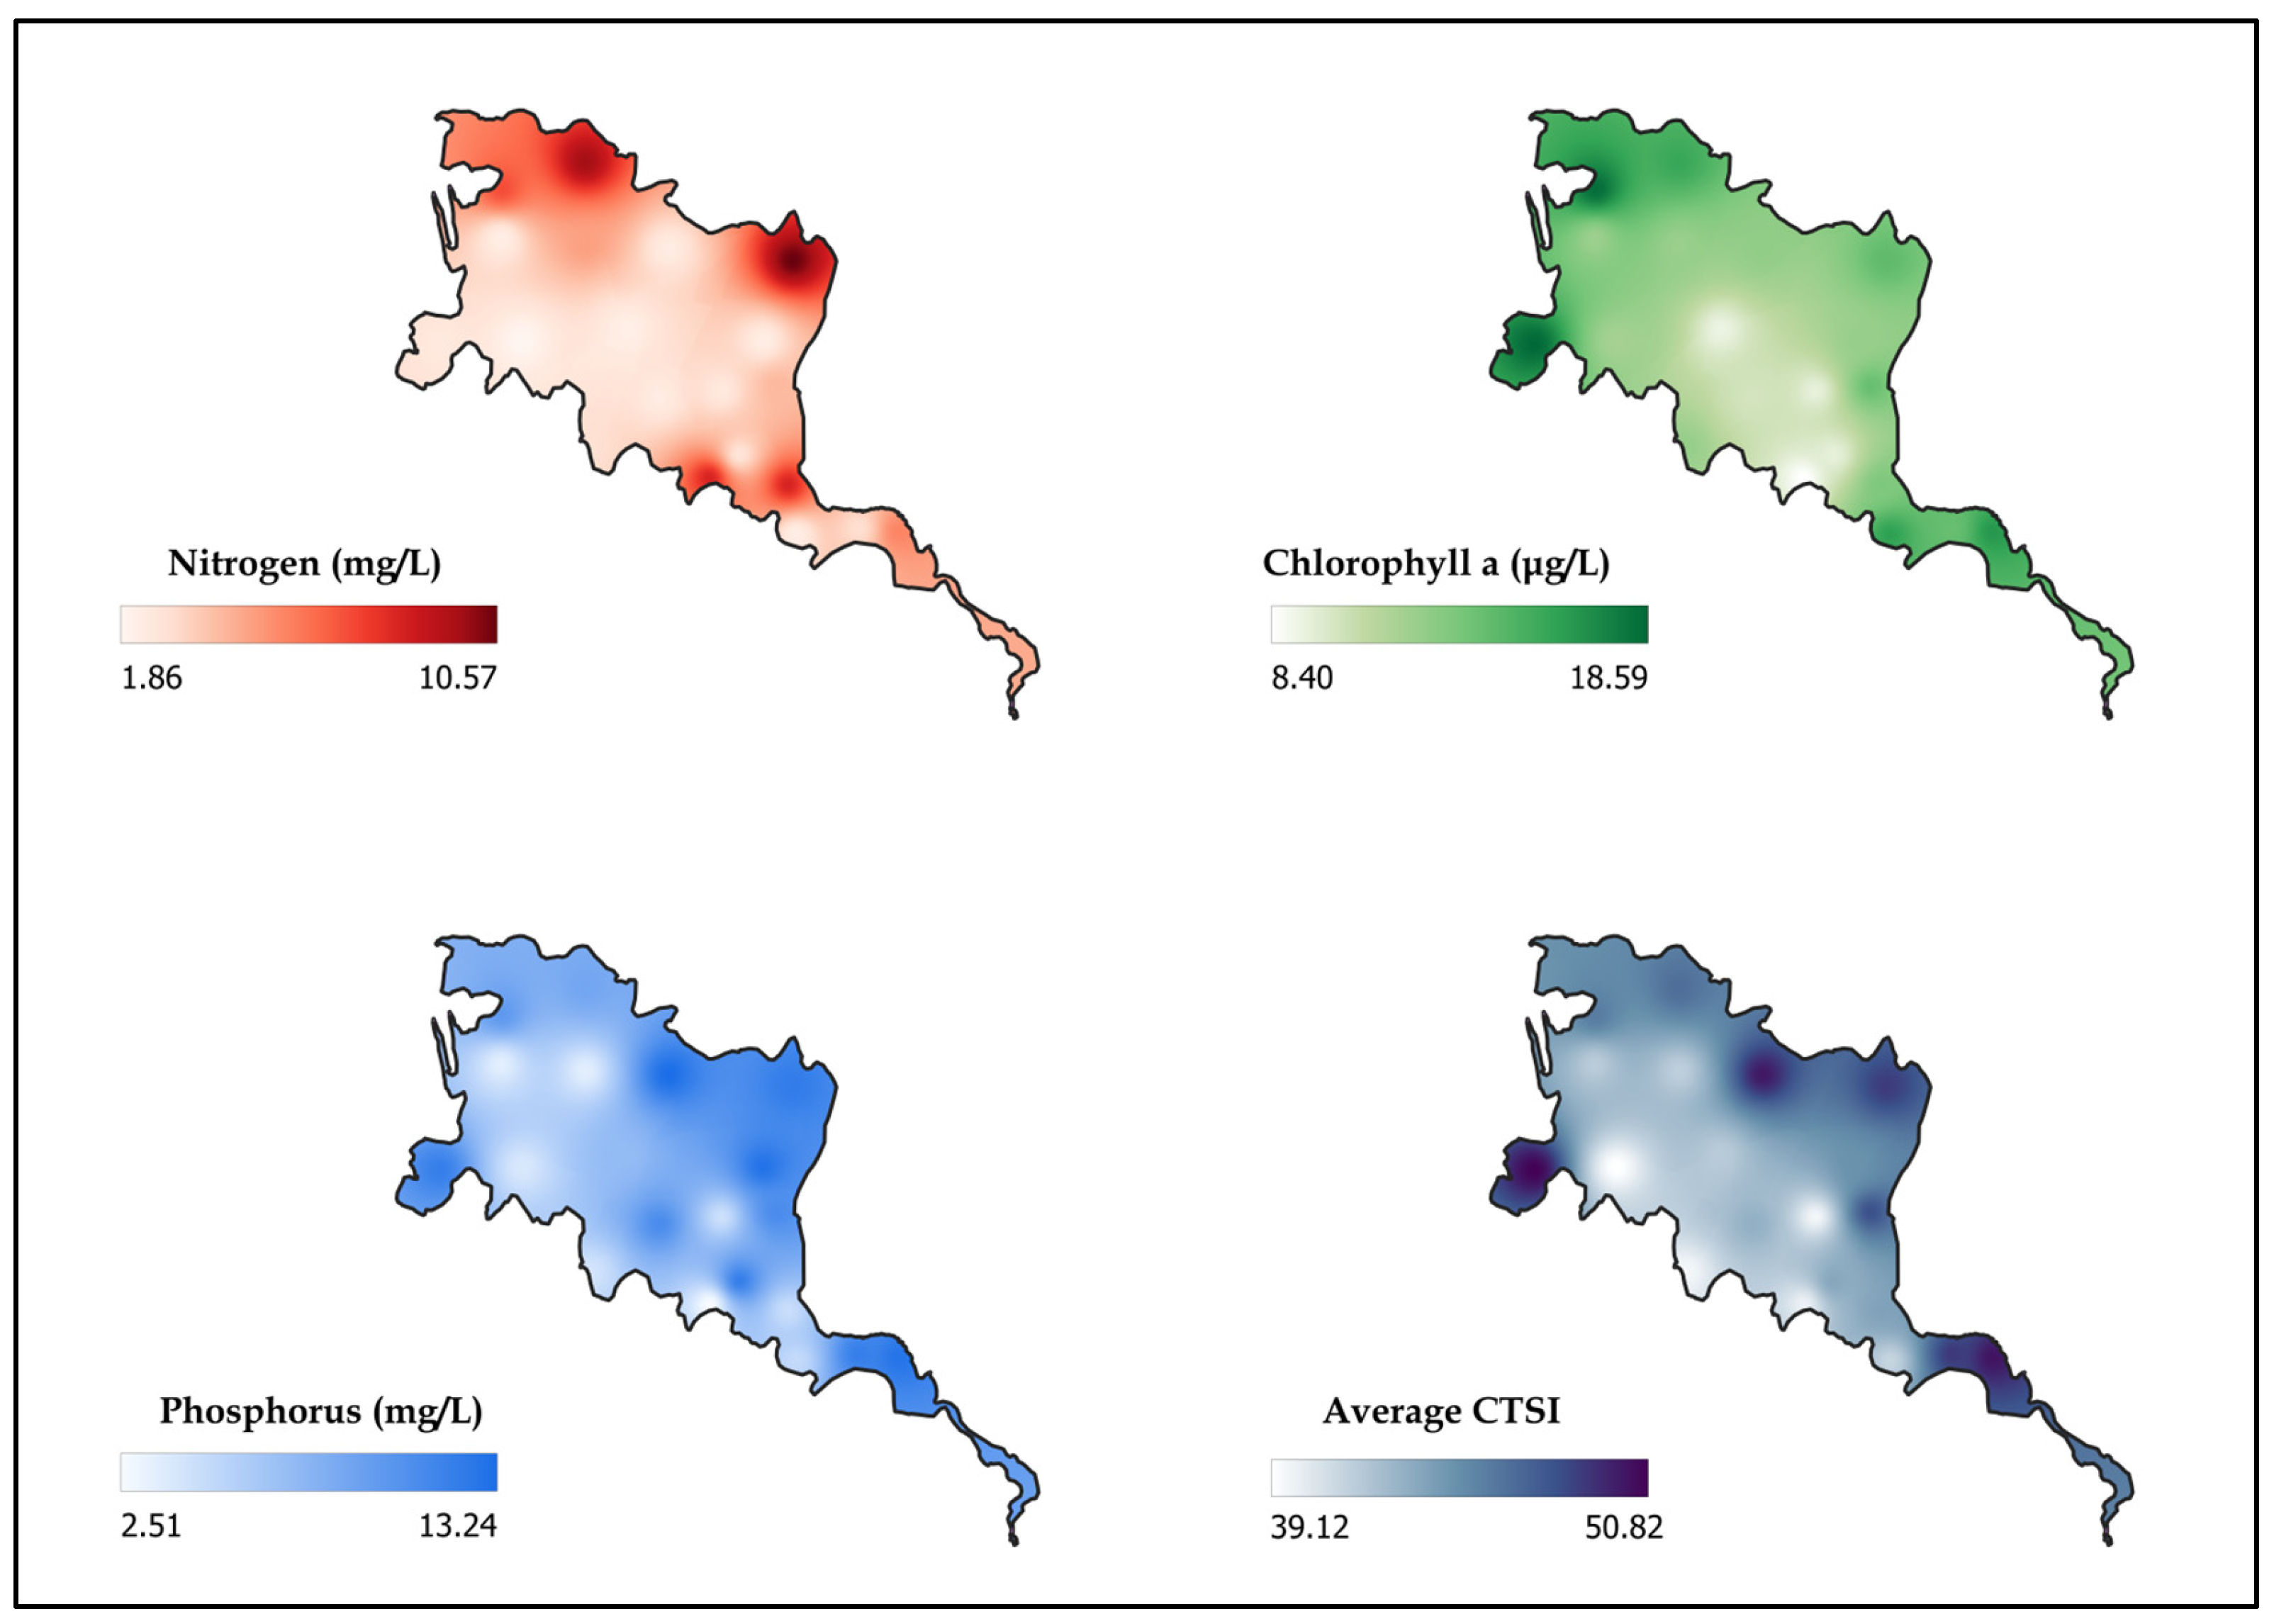
The water quality assessment of the lake based on pre-monsoon data shows notable spatial variability of nitrogen, phosphorus, and moderate ecological status (Figure 8). The lake had an average pH of 7.6, indicating slightly alkaline water and moderate nutrient levels, with mean nitrogen at 4.42 mg/L and phosphorus at 8.39 mg/L. Water clarity, as measured by Secchi depth, averaged 3.08 m, while chlorophyll-a, an indicator of algal biomass, was 13.10 µg/L, suggesting moderate productivity (Table 11). The Average Carlson Trophic State Index (CTSI) was 44.47, placing the lake in the mesotrophic category, which reflects moderate nutrient enrichment. Spatial patterns from Figure 8 show localized nutrient hotspots and trophic states ranging from oligotrophic to eutrophic, with CTSI values between 35.56 and 56.10. The Phirke subcatchment, being the most urbanized, appears to contribute the highest nutrient load.
Nitrogen concentration was found to be higher where agricultural runoff accumulated (northern part of the lake), and phosphorus concentration was higher close to urban drainage (northeast part). The nutrient concentration in water below the forested slope of the Pumdi side (southwest part) was found to be lower. Correlation analysis (Table 12) indicates weak relationships among water quality parameters, with the strongest (yet still modest) positive correlation between chlorophyll-a and phosphorus (r = 0.36), suggesting that phosphorus may partly drive algal growth. Negative correlations between Secchi depth and both chlorophyll-a (r = −0.33) and nitrogen (r = −0.45, p < 0.05) indicate that higher nutrient concentrations are associated with reduced water clarity. Overall, the lake exhibits signs of nutrient enrichment. The other studies [34,35,36] covering different seasons found the lake mesotrophic to eutrophic level, and the trend was increasing. Seasonal water quality monitoring integrated with catchment source analysis and rainfall-runoff dynamics can enhance understanding of pollution patterns and their seasonal variability.

4. Discussion

The analysis of land use/land cover (LULC) dynamics between 1990 and 2021 in the Phewa Lake catchment reveals a significant landscape transformation. The most notable trend is the decline in agricultural land and a concurrent increase in forest and built-up areas. Agricultural land, which occupied over 52% of the catchment in 1990, declined to 39% by 2021, whereas forest cover increased from 41% to nearly 50%. Built-up land tripled in the area over the 31-year period, particularly in the Phirke subcatchment and the lake’s floodplain, driven by unregulated urban expansion and infrastructure development. At the same time, significant portions of agricultural land were converted to forest in upper subcatchments such as Harpan, Andheri, and Betani, indicating the role of land abandonment, natural regeneration, and afforestation programs.
The LULC dynamics of the region are driven by complex socioecological transformation and increased forest cover, reflecting the role of conservation initiatives, policy interventions, and rural outmigration. Various studies documented LULC patterns of the catchment. The period prior to the 1990s was marked by widespread deforestation driven by the expansion of settlements and agricultural land [37]. The regain of forests from the 1970s onward and the implementation of conservation programs, particularly Community Forestry (CF), have played a pivotal role in reversing deforestation trends [38,39].
Migration, remittance income, and a declining dependency on farming practices have contributed to the abandonment of agricultural land in upland areas. Furthermore, uncertainty on the climate patterns, with intense rainfall and less economic return, demotivates farmers from continuing with the traditional farming system, leading to land abandonment. This, in turn, has created favorable conditions for forest regeneration, resulting in improved forest cover in the region [40,41].
Unregulated and disorganized urban expansion, along with shifts in farming practices from subsistence, livestock-based organic farming to more commercial approaches involving increased use of chemical fertilizers and pesticide applications, have intensified nutrient loading in the lake. Nutrient exports under different land use scenarios, estimated using the NDR InVEST model, effectively demonstrate how land use change (1990 to 2021) results in eutrophication concern for the lake.
Estimated nitrogen (N) and phosphorus (P) exports using the InVEST model at subcatchments show an overall increase from 0.54 to 0.60 kg/ha/year and 0.05 to 0.065 kg/ha/year, respectively. The Phirke subcatchment recorded the highest nutrient increases, corresponding with rapid urbanization and inadequate sewage infrastructure. Conversely, Pumdi Side showed a reduction in nutrient loads, likely due to reforestation or declining human activity. These changes signal overall rising eutrophication risks, with increased nutrient inputs potentially threatening the lake’s ecological balance. Agroforestry on private lands and reforestation on public barren areas under conservation programs have also contributed to forest cover improvements and have significantly improved ecosystem services, especially nutrient retention and soil stability, through the control of erosion and enhancement of infiltration rates [42,43]. Further classification of agricultural land into distinct cropping systems and forest areas into specific forest types, combined with the establishment of experimental plots in representative land units, would enable more accurate estimation of nutrient retention efficiencies and thereby improve model performance.
Tributaries like Phirke Khola carry untreated municipal sewage, solid waste, and effluent from hotels into the lake [44,45]. Subsurface flows from septic tanks and direct discharge from sewerage pipes have contributed to the deterioration of lake water quality, with high E. coli counts and increased concentrations of nutrients and heavy metals along the urban side [35,36]. In contrast, dense forest cover, particularly in the southwestern catchment, acts as a natural buffer, filtering sediment and pollutants.
While improved forest cover has enhanced sediment retention capacity, the construction of hilly roads and the occurrence of large-scale landslides, often due to intense rainfall and slope failures, even within forested areas, have contributed to continued sediment exports into the lake. This underscores the need for advanced modeling approaches capable of quantifying mass movement caused by landslides, road excavations, and exposed terrain. Subcatchments like Andheri and Lauruk exhibit particularly high sediment yields due to recent road construction activities and landslides [46]. The severity of erosion not only contributes to the siltation but also contributes to nutrient transport to the lake.
Agricultural intensification has compounded this issue. The use of chemical fertilizers (e.g., urea and DAP) and pesticides, particularly for cash crops like tomatoes and potatoes, has increased significantly [47]. Research indicates that 50–70% of these fertilizers and most pesticides are not absorbed by crops and are instead lost to the environment via surface runoff, contributing to eutrophication of the lake [34]. Over time, the lake has transitioned from oligotrophic conditions in the 1970s to eutrophic conditions post-1990s [35,44]. Furthermore, regular or seasonal monitoring of water quality parameters is essential to capture the complex influence of rainfall events and seasonal land use practices, as well as to monitor the impacts of implemented interventions.
Regarding the particulate nitrogen and phosphorus, the considerable spatial variability in their distributions across the Phewa catchment reflects the influence of lithology, land use, and geomorphic features. The ANOVA results indicate that riverbanks and bare surfaces are dominated by coarser textures, which is consistent with fluvial sorting processes and surface erosion exposing coarser particles. In contrast, croplands and forests, which exhibited similar textural characteristics, showed higher silt and clay contents, supporting their role in nutrient retention due to increased surface area for nutrient adsorption, particularly for nitrogen, as confirmed by its significant positive correlation with finer fractions and SOM content.
At the subcatchment scale, significant differences in grain size distributions were evident, with the Lake Floodplain and Andheri catchment dominated by sand fractions, while Harpan and Pumdi Side, with greater forest cover, showed higher clay fraction and SOM contents. This aligns with established links between land cover, erosion processes, and sediment characteristics, as forest lands typically exhibit lower erosion rates and higher SOM accumulation, enhancing nitrogen retention. The content of nitrogen is also in line with the limited nitrogen retention capacity due to intensive cropping.
In contrast, the high variability in phosphorus content across subcatchments, especially in Lauruk, may reflect the effect of parent material. The origin of P is likely from primary P-bearing minerals in phyllites, likely bound to silicates [48] and secondary minerals comprising pedogenetic metastable and metamorphic phosphates [49]. Additionally, the significant relationship between P and SOM in source samples suggests they are bound to soil organic matter, possibly through organo-mineral complexes or particulate organic matter, which may contribute to the high P content observed in croplands. Furthermore, the highest P levels in riverbanks indicate that it has been mobilized with eroded soil and sediment particles that accumulate along the Harpan riverbanks in the floodplain, potentially intensified by quarry waste deposits located in the upstream floodplain. Ramos et al. (2022) [14] also found in a Mediterranean catchment with Tertiary sand formations that croplands and riverbanks had higher P levels than forests and degraded bare surfaces.
In the riverbed and suspended sediment samples, nitrogen content showed stronger positive correlations with the finer fractions and SOM compared to the source samples, underscoring the role of organic matter and fine particles in nitrogen transport. However, phosphorus displayed a different behavior. No significant correlations were found between phosphorus content and particle size fractions, and a negative correlation with SOM was observed. This suggests that, unlike nitrogen, phosphorus transport is not driven by association with organic matter or finer particles. Considering that phyllites, the dominant lithology in the catchment, contain levels of phosphorus of around 600 ppm, it is plausible that part of the phosphorus in the sediments derives directly from mineral sources, being transported as inorganic particulate phosphorus associated with coarser mineral particles. However, the role of pedogenetic processes cannot be excluded, as weathering and soil formation under acidic conditions could mobilize phosphorus from primary minerals and redistribute it within the soil matrix, potentially contributing to the observed sediment phosphorus content.
In addition, the highest content of P in suspended sediment samples suggests high loads of P reaching the Phewa Lake during intense precipitation events. This, along with the reworking and mobilization of riverbed sediments and the erosion of riverbanks during floods, amplifies the impact of P export into Phewa Lake as found in other study areas [16,50]. The enrichment of phosphorus in suspended sediments suggests that particulate phosphorus is preferentially mobilized by greater flow energies associated with higher discharges, removing P-rich material transported in association with coarser mineral particles (Figure 6), highlighting its potential for downstream eutrophication risks. In addition, under high rainfalls that mobilize high amounts of sediments, P would also be exported in its soluble form [18].
The analysis of sediments indicated depletion in N and SOM in riverbed and suspended sediments, consistent with selective transport. The longitudinal patterns along the Harpan River further illustrate these dynamics. The relatively stable clay content, alongside contrasting sand and silt distributions, with sand content peaking at confluences and outlets, reflects typical fluvial sediment sorting processes, as well as the influence of quarrying activities in the alluvial floodplain. The coinciding peaks of phosphorus with sand content at Point 5, followed by a progressive decrease and a final rise near the lake inflow, suggest episodic sediment particulate phosphorus transport linked to hydrological connectivity and sediment inputs from tributaries, similar to findings in an upland agroforestry catchment [51]. In contrast, nitrogen showed a distinct pattern, with its highest content at the Harpan outlet (P2), likely related to the predominance of forest soils with higher nitrogen levels, followed by a downstream decrease and another increase near the lake. This may indicate localized inputs, potentially from forests as well as from increased human and livestock presence near the lake inflow. However, as dissolved nitrogen content is generally higher than particulate nitrogen [19], total nitrogen inputs could be much greater, further exacerbating pollution in Phewa Lake.
Overall, the findings highlight a dual trajectory of reforestation and urbanization in the catchment, with both positive (forest recovery) and negative (pollution and land degradation) implications for the lake’s long-term health.
The results help to identify the key environmental and anthropogenic drivers of change. The rural-to-urban migration has promoted reforestation, yet has inadvertently led to increased nutrient discharge. If current trends continue, urban populations are likely to face growing water-related challenges in the near future unless urgent remedial measures are implemented.
Despite conservation improvements, unplanned development and pollutant inputs continue to threaten the lake’s ecological integrity. Mitigating these impacts requires integrated catchment management, enforcing land use regulations, implementing wastewater treatment, and promoting sustainable agriculture. Buffer zones, effluent pretreatment, and economic incentives for conservation (e.g., environmental taxes) could work better for restoring water quality. Regular monitoring and implementation are essential to sustain ecosystem services and safeguard Phewa Lake’s long-term health.

5. Conclusions

The degradation of Phewa Lake is strongly linked to unsustainable land use practices, including unplanned urban expansion, cultivation on steep slopes, unstable road construction, and intensified rainfall-driven erosion. This study, by integrating remote sensing, ecosystem services modeling, and empirical field data, provided new insights into how LULC change influences nutrient delivery and lake eutrophication.
This study highlights key environmental and human drivers of change across the catchment. Notably, land use transitions show a shift from agriculture to forest in upland areas, partly due to rural-to-urban migration, and into built-up areas in urbanizing lowlands. While reforestation supports sediment retention and nutrient control, it also poses challenges for local agricultural productivity. In contrast, rapid urban growth has led to increased nutrient discharge and pollution of lake water. These results underscore a dual trajectory of reforestation and urbanization, with both positive (forest recovery) and negative (pollution and land degradation) consequences for the long-term health of Phewa Lake.
Our findings show marked spatial variability in nitrogen and phosphorus. Nitrogen is strongly associated with forest soils rich in SOM and fine particles, enhancing its retention, whereas phosphorus concentrations are higher in croplands and riverbanks, largely due to mineral sources and erosion. During monsoon rainfall events, suspended sediments were enriched in phosphorus and depleted in nitrogen, indicating distinct transport mechanisms and suggesting an increased risk of eutrophication during periods of high flow.
The rate of nutrient exports due to land use changes is higher in the Phirke subcatchment, which has experienced greater urbanization. This increased nutrient exports from the catchment aligns with shifts in the lake’s trophic status, as indicated by Carlson Trophic State Index values ranging from oligotrophic to eutrophic. Elevated phosphorus loading from urbanized areas, coupled with excessive use of chemical fertilizers in agriculture, along with pollution and sedimentation caused by poor waste management, improper land use, and haphazard construction activities, remains a major concern for lake conservation.
Overall, the study underscores the importance of regular water quality monitoring and integrated catchment-scale management to control pollution sources within the catchment. Recommended strategies include sustainable land use planning, targeted soil and nutrient management in agricultural headwaters, and effective urban planning and pollution control measures to mitigate nutrient exports, reduce downstream eutrophication risks, and preserve the ecological integrity and ecosystem services of Phewa Lake.
Author Contributions

R.S. and A.N. developed the research idea for the paper and took overall responsibility for the study. B.J. was involved in data collection and mapping. M.M., L.G. and G.D. contributed to the writing and analysis. All authors revised and contributed to finalizing the manuscript. In addition, all authors approved the final manuscript. All authors have read and agreed to the published version of the manuscript.

Funding

This research was partially funded by the IAEA INT 5156 project, and the APC was funded by the Spanish National Research Council (CSIC) open access publishing fund.

Data Availability Statement

The data are available from the corresponding authors upon request.

Acknowledgments

The authors would like to thank three anonymous reviewers and the Journal Editor for their in-depth reviews and suggestions. The authors would like to acknowledge the Integrated Basin Management Centre, Gandaki, and the Institute of Forestry, Nepal, for their support in field work and laboratory analysis. We appreciate the contribution from the Spanish National Research Council, Estación Experimental de Aula Dei (EEAD-CSIC), Zaragoza, Spain, and the IAEA Technical Cooperation Project titled “Building Capacity and Generating Evidence for Climate Change Impacts on Soil, Sediments, and Water Resources in Mountainous Regions”.

Conflicts of Interest

Gerd Dercon was employed by International Atomic Energy Agency. The remaining authors declare that the research was conducted in the absence of any commercial or financial relationships that could be construed as a potential conflict of interest.

References

  1. Shah, S.; Sen, S.; Sahoo, D. State of Indian Northwestern Himalayan Lakes under Human and Climate Impacts: A Review. Ecol. Indic. 2024, 160, 111858. [Google Scholar] [CrossRef]
  2. Xu, X.; Chen, M.; Yang, G.; Jiang, B.; Zhang, J. Wetland Ecosystem Services Research: A Critical Review. Glob. Ecol. Conserv. 2020, 22, e01027. [Google Scholar] [CrossRef]
  3. Carpenter, S.R.; Mooney, H.A.; Agard, J.; Capistrano, D.; DeFries, R.S.; Díaz, S.; Dietz, T.; Duraiappah, A.K.; Oteng-Yeboah, A.; Pereira, H.M.; et al. Science for Managing Ecosystem Services: Beyond the Millennium Ecosystem Assessment. Proc. Natl. Acad. Sci. USA 2009, 106, 1305–1312. [Google Scholar] [CrossRef] [PubMed]
  4. Delgado, L.E.; Marín, V.H. Ecosystem Services and Ecosystem Degradation: Environmentalist’s Expectation? Ecosyst. Serv. 2020, 45, 101177. [Google Scholar] [CrossRef]
  5. Zedler, J.B.; Kercher, S. WETLAND RESOURCES: Status, Trends, Ecosystem Services, and Restorability. Annu. Rev. Environ. Resour. 2005, 30, 39–74. [Google Scholar] [CrossRef]
  6. Nelson, G.C.; Bennett, E.; Berhe, A.A.; Cassman, K.; DeFries, R.; Dietz, T.; Dobermann, A.; Dobson, A.P.; Janetos, A.; Levy, M.; et al. Anthropogenic Drivers of Ecosystem Change: An Overview. Ecol. Soc. 2006, 11, 29. [Google Scholar] [CrossRef]
  7. Kemka, N.; Njiné, T.; Togouet, S.H.Z.; Menbohan, S.F.; Nola, M.; Monkiedje, A.; Niyitegeka, D.; Compère, P. Eutrophication of Lakes in Urbanized Areas: The Case of Yaounde Municipal Lake in Cameroon, Central Africa. Lakes Reserv. Sci. Policy Manag. Sustain. Use 2006, 11, 47–55. [Google Scholar] [CrossRef]
  8. Smith, V.H.; Schindler, D.W. Eutrophication Science: Where Do We Go from Here? Trends Ecol. Evol. 2009, 24, 201–207. [Google Scholar] [CrossRef]
  9. Zou, W.; Zhu, G.; Cai, Y.; Vilmi, A.; Xu, H.; Zhu, M.; Gong, Z.; Zhang, Y.; Qin, B. Relationships between Nutrient, Chlorophyll a and Secchi Depth in Lakes of the Chinese Eastern Plains Ecoregion: Implications for Eutrophication Management. J. Environ. Manag. 2020, 260, 109923. [Google Scholar] [CrossRef]
  10. Bhagowati, B.; Ahamad, K.U. A Review on Lake Eutrophication Dynamics and Recent Developments in Lake Modeling. Ecohydrol. Hydrobiol. 2019, 19, 155–166. [Google Scholar] [CrossRef]
  11. Haque, S.E. How Effective Are Existing Phosphorus Management Strategies in Mitigating Surface Water Quality Problems in the U.S.? Sustainability 2021, 13, 6565. [Google Scholar] [CrossRef]
  12. Ramos, M.C.; Lizaga, I.; Gaspar, L.; Quijano, L.; Navas, A. Effects of Rainfall Intensity and Slope on Sediment, Nitrogen and Phosphorous Losses in Soils with Different Use and Soil Hydrological Properties. Agric. Water Manag. 2019, 226, 105789. [Google Scholar] [CrossRef]
  13. Ramos, M.C.; Lizaga, I.; Gaspar, L.; Catalá, A.; Navas, A. Factors Affecting Mobility/Export of Particle-Bound Stable Elements after Erosive Rainfalls in Agroforestry Mediterranean Catchments of Aragón (Spain). Geomorphology 2024, 451, 109099. [Google Scholar] [CrossRef]
  14. Ramos, M.C.; Lizaga, I.; Gaspar, L.; Navas, A. The Impacts of Exceptional Rainfall on Phosphorus Mobilisation in a Mountain Agroforestry Catchment (NE, Spain). CATENA 2022, 216, 106407. [Google Scholar] [CrossRef]
  15. Wang, R.; Cai, C.; Zhang, J.; Sun, S.; Zhang, H. Study on Phosphorus Loss and Influencing Factors in the Water Source Area. Int. Soil Water Conserv. Res. 2022, 10, 324–334. [Google Scholar] [CrossRef]
  16. Granger, S.J.; Harris, P.; Upadhayay, H.R.; Sint, H.; Pulley, S.; Stone, M.; Krishnappan, B.G.; Collins, A.L. Novel Approaches to Investigating Spatial Variability in Channel Bank Total Phosphorus at the Catchment Scale. CATENA 2021, 202, 105223. [Google Scholar] [CrossRef]
  17. Hervé-Fernandez, P.; Oyarzún, C.E.; Woelfl, S. Throughfall Enrichment and Stream Nutrient Chemistry in Small Headwater Catchments with Different Land Cover in Southern Chile. Hydrol. Process. 2016, 30, 4944–4955. [Google Scholar] [CrossRef]
  18. Stutter, M.I.; Langan, S.J.; Cooper, R.J. Spatial and Temporal Dynamics of Stream Water Particulate and Dissolved N, P and C Forms along a Catchment Transect, NE Scotland. J. Hydrol. 2008, 350, 187–202. [Google Scholar] [CrossRef]
  19. Ma, Y.; Wang, S.; Zhang, X.; Shen, Z. Transport Process and Source Contribution of Nitrogen in Stormwater Runoff from Urban Catchments. Environ. Pollut. 2021, 289, 117824. [Google Scholar] [CrossRef]
  20. Nyenje, P.M.; Foppen, J.W.; Uhlenbrook, S.; Kulabako, R.; Muwanga, A. Eutrophication and Nutrient Release in Urban Areas of Sub-Saharan Africa—A Review. Sci. Total Environ. 2010, 408, 447–455. [Google Scholar] [CrossRef]
  21. Dhyani, S.; Gupta, A.K.; Karki, M. Nature-Based Solutions for Resilient Ecosystems and Societies; Springer: Berlin/Heidelberg, Germany, 2020; ISBN 978-981-15-4711-9. [Google Scholar]
  22. Fraterrigo, J.M.; Downing, J.A. The Influence of Land Use on Lake Nutrients Varies with Watershed Transport Capacity. Ecosystems 2008, 11, 1021–1034. [Google Scholar] [CrossRef]
  23. Pant, R.R.; Pal, K.B.; Adhikari, N.L.; Adhikari, S.; Mishra, A.D. Water Quality Assessment of Begnas and Rupa Lakes, Lesser Himalaya Pokhara, Nepal. J. Inst. Eng. 2019, 15, 113–122. [Google Scholar] [CrossRef]
  24. Sharma, S.; Bajracharya, R.M.; Sitaula, B.K.; Merz, J. Water Quality in the Central Himalaya. Curr. Sci. 2005, 89, 774–786. [Google Scholar]
  25. Azad, M.; Afroz, M.; Saha, R.; Rowshan, R.; Azad, M. Remote Sensing-Based Monitoring of Peri-Urban Landscape Dynamics: A Case Study of Rupganj, Bangladesh. DYSONA—Appl. Sci. 2026, 7, 28–40. [Google Scholar] [CrossRef]
  26. Tiwari, K.R.; Sitaula, B.K.; Nyborg, I.L.P.; Paudel, G.S. Determinants of Farmers’ Adoption of Improved Soil Conservation Technology in a Middle Mountain Watershed of Central Nepal. Environ. Manag. 2008, 42, 210–222. [Google Scholar] [CrossRef]
  27. Thapa, G.; Kumar, A.; Joshi, P.K. Agricultural Transformation in Nepal: Trends, Prospects, and Policy Options; Thapa, G., Kumar, A., Joshi, P.K., Eds.; Springer: Singapore, 2019; ISBN 978-981-329-647-3. [Google Scholar]
  28. Bhandari, G. An Overview of Agrochemicals and Their Effects on Environment in Nepal. Appl. Ecol. Environ. Sci. 2014, 2, 66–73. [Google Scholar] [CrossRef]
  29. Poudel, K.P.; Paudel, U. Urbanization and Its Challenges in Nepal. In Urban Dynamics, Environment and Health: An International Perspective; Sinha, B.R.K., Ed.; Springer Nature: Singapore, 2023; pp. 107–131. ISBN 978-981-99-5744-6. [Google Scholar]
  30. Fleming, W.M. Phewa Tal Catchment Management Program: Benefits and Costs of Forestry and Soil Conservation in Nepal. In Forest and Watershed Development and Conservation in Asia and the Pacific; Routledge: Oxford, UK, 1983; ISBN 978-0-429-04958-3. [Google Scholar]
  31. Lorenzen, C.J. Determination of Chlorophyll and Pheo-Pigments: Spectrophotometric Equations. Limnol. Oceanogr. 1967, 12, 343–346. [Google Scholar] [CrossRef]
  32. APHA Method 9221; Standard Methods for the Examination of Water and Wastewater. American Public Health Association: Washington, DC, USA, 1992.
  33. Carlson, R.E. A Trophic State Index for Lakes. Limnol. Oceanogr. 1977, 22, 361–369. [Google Scholar] [CrossRef]
  34. Pant, R.R.; Rehman, F.U.; Wang, G.; Bishwakarma, K.; Adhikari, S. Hydrochemical Characterization and Seasonal Variations in Water Quality of Phewa Lake, Nepal. Wetlands 2025, 45, 55. [Google Scholar] [CrossRef]
  35. Khadka, U.R.; Ramanathan, A. Hydrogeochemical Analysis of Phewa Lake: A Lesser Himalayan Lake in the Pokhara Valley, Nepal. Environ. Nat. Resour. J. 2021, 19, 68–83. [Google Scholar] [CrossRef]
  36. Timalsina, R.; Acharya, S.; Đurin, B.; Awasthi, M.P.; Pant, R.R.; Joshi, G.R.; Byanju, R.M.; Panthi, K.P.; Joshi, S.; Kumar, A.; et al. An Assessment of Seasonal Water Quality in Phewa Lake, Nepal, by Integrating Geochemical Indices and Statistical Techniques: A Sustainable Approach. Water 2025, 17, 238. [Google Scholar] [CrossRef]
  37. Ramsay, W.J.H. Erosion in the Middle Himalaya, Nepal with a Case Study of the Phewa Valley; University of British Columbia: Vancouver, BC, Canada, 1985. [Google Scholar]
  38. Fleming, B.; Fleming, J.P. A Watershed Conservation Success Story in Nepal: Land Use Changes over 30 Years. Waterlines 2009, 28, 29–46. [Google Scholar] [CrossRef]
  39. Paudyal, K.; Baral, H.; Keenan, R.J. Assessing Social Values of Ecosystem Services in the Phewa Lake Watershed, Nepal. For. Policy Econ. 2018, 90, 67–81. [Google Scholar] [CrossRef]
  40. Ning, C.; Subedi, R.; Hao, L. Land Use/Cover Change, Fragmentation, and Driving Factors in Nepal in the Last 25 Years. Sustainability 2023, 15, 6957. [Google Scholar] [CrossRef]
  41. Tripathi, S.; Subedi, R.; Adhikari, H. Forest Cover Change Pattern after the Intervention of Community Forestry Management System in the Mid-Hill of Nepal: A Case Study. Remote Sens. 2020, 12, 2756. [Google Scholar] [CrossRef]
  42. Kunwar, B.B.; Adhikari, B.R.; Muensit, N.; Techato, K.; Gyawali, S. Role of Vegetation for the Protection of Phewa Watershed, Kaski, Nepal. Environ. Ecol. Res. 2022, 10, 161–173. [Google Scholar] [CrossRef]
  43. Ross, J.; Gilbert, R. Lacustrine Sedimentation in a Monsoon Environment: The Record from Phewa Tal, Middle Mountain Region of Nepal. Geomorphology 1999, 27, 307–323. [Google Scholar] [CrossRef]
  44. Gautam, R.; Shrestha, S.M. Hydrogeochemical Evaluation and Characterization of Water Quality in the Phewa Lake, Pokhara, Nepal. Environ. Sci. Pollut. Res. 2024, 31, 60568–60586. [Google Scholar] [CrossRef]
  45. Malla-Pradhan, R.; Suwunwong, T.; Phoungthong, K.; Joshi, T.P.; Pradhan, B.L. Microplastic Pollution in Urban Lake Phewa, Nepal: The First Report on Abundance and Composition in Surface Water of Lake in Different Seasons. Environ. Sci. Pollut. Res. 2022, 29, 39928–39936. [Google Scholar] [CrossRef]
  46. Jojiju, B.; Subedi, R. Comparative Study of Sediment Loading in Sub-Watersheds of Phewa Lake, Nepal. J. Geogr. Cartogr. 2023, 6, 2184. [Google Scholar] [CrossRef]
  47. Kafle, B.K.; Dahal, B.M.; Sharma, C.M.; Gurung, S.; Kafle, K.R.; Raut, N. Implications on Lake Phewa and Kulekhani Reservoir of Chemical Fertiliser Application by Farmers. Asian J. Water Environ. Pollut. 2023, 20, 57–65. [Google Scholar] [CrossRef]
  48. Spohn, M. Phosphorus and Carbon in Soil Particle Size Fractions: A Synthesis. Biogeochemistry 2020, 147, 225–242. [Google Scholar] [CrossRef]
  49. Kabata-Pendias, A. Trace Elements in Soils and Plants, 4th ed.; CRC Press: Boca Raton, FL, USA, 2010; ISBN 978-0-429-19203-6. [Google Scholar]
  50. Fox, G.A.; Purvis, R.A.; Penn, C.J. Streambanks: A Net Source of Sediment and Phosphorus to Streams and Rivers. J. Environ. Manag. 2016, 181, 602–614. [Google Scholar] [CrossRef]
  51. Ramos, M.C.; Lizaga, I.; Gaspar, L.; Navas, A. Particulate Phosphorus in Runoff in a Mediterranean Agroforestry Catchment Driven by Land Use and Rainfall Characteristics. Land Degrad. Dev. 2023, 34, 4882–4896. [Google Scholar] [CrossRef]
Figure 1. Study area map showing the subcatchments, the location of surface soil and riverbed sediment sampled across the Phewa catchment, the suspended sediment samples, and the water sampling points in Phewa Lake. The red rectangle in the inset highlights the location of the Phewa catchment.
Hydrology 12 00246 g001
Figure 2. Maps of land use and land cover in 1990 and 2021.
Hydrology 12 00246 g002
Figure 3. Map of land use/land cover transitions between 1990 and 2021.
Hydrology 12 00246 g003
Figure 4. Maps of nitrogen and phosphorus exports simulated for 1990 and 2021 in the Phewa Lake catchment.
Hydrology 12 00246 g004
Figure 5. Spatial distribution of nitrogen, phosphorus, soil organic matter, pH, and texture across the Phewa Lake catchment.
Hydrology 12 00246 g005
Figure 6. Boxplots of study properties by land use (croplands, forests), landforms (bare surfaces, riverbanks), and sediment type (riverbeds and monsoon suspended sediments). Different letters indicate significant differences at the 95% confidence level between groups.
Hydrology 12 00246 g006
Figure 7. Variation in nutrients and grain size contents in sampling points at the outflow of the two headwater tributaries (1, 2) and along the Harpan River (5 to 9).
Hydrology 12 00246 g007
Figure 8. Spatial variation of nitrogen, chlorophyll-a, phosphorus, and the Carlson Trophic State Index (CTSI) in Phewa Lake during the pre-monsoon period of 2022.
Hydrology 12 00246 g008
Table 1. Topographical characteristics of the study subcatchments.
Subcatchments(km2)Slope (Degree °)Elevation Range (m)Aspect
AverageMinMax
Lake Flood Plain12.676.990.0147.81759–1091Flat
Lauruk4.2818.130.6849.12805–1728South
Andheri25.9821.280.1657.43816–2063South
Betani7.7820.140.0153.9787–1770South
Harpan35.0224.860.0160.65794–2481North
Phirke10.999.240.0150.23788–1340South
Sedi Sarangkot11.2520.390.0654.12781–1649South
Birim Chapakot7.7025.60.1952.74784–1715North
Pumdi Side6.2528.520.354.69787–1462North
Table 2. Data used in the study.
DataSourcePurpose
Landsat data for the years 1990 and 2021 (resolution 30 m)Google Earth EngineLand use/Land cover (LULC) mapping and change detection
Digital Elevation Model (DEM; resolution 1 arc-second)ASTER DEMTopographical analysis, InVEST NDR modeling
PrecipitationDepartment of Hydrology and Meteorology (DHM) NepalTo prepare erosivity map
Topographic map (scale 1:25,000)Department of Survey, NepalFor the accuracy assessment LULC map
Ground Global Positioning System (GPS) pointsField survey, 2022For training points and accuracy assessment of LULC map
Soil dataSoil sampling and analysis, 2023Spatial distribution of soil properties and key nutrients
Water quality dataWater sampling and analysis, 2022For eutrophication study
Table 3. Land use and land cover descriptions.
ClassDescription
Forest Trees, shrubs, and bushes, evergreen, sparse forest area, private forest, grassland with scattered trees
AgricultureCultivation land/area with seasonal and perennial agricultural crops, plowed land, seasonal land, and terrace land
Built-up (urban)Settlement areas, human infrastructures, construction sites, road networks
Degraded landRiverbanks, landslide zones, floodplain, areas covered by sand
Waterlakes, streams, ponds
Swamp LandWetlands, areas with aquatic vegetation, seasonally submerged by water
Table 4. Biophysical table used as input for InVEST Nutrient Delivery Ratio (NDR) models.
LULC ClassLoad_n (kg/ha/year)Load_p (kg/ha/year)Eff_n (0–1)Eff_p
(0–1)
Justification
Past Agriculture (low inputs)5.00.50.40.4traditional mixed farming; limited farmyard manure (FYM) and compost; low chemical input
Current Agriculture (medium inputs)8.00.80.50.4FYM + moderate fertilizer use; some agroforestry; moderate cover
Degraded/Barren1.00.10.30.3sparse vegetation, erosion-prone; contributes adsorbed P via runoff
Forest (less dense)2.00.20.80.8leaf litter contributes nutrients; high retention due to organic layer
Swamp/Wetland0.20.020.850.85strong nutrient sinks through sedimentation, plant uptake
Urban (poor management)8.01.50.40.4rapid runoff, direct discharge, impervious surface; typical of unregulated mid-hill towns
Water0.00.01.01.0not a source; endpoint of nutrient flow
Table 5. Land use/land cover change dynamics from 1990 to 2021 (%).
LULC Class1990
AgricultureDegraded/
Barren
ForestSwampUrbanWaterTotal
2021Agriculture34.410.483.490.060.540.1839.16
Degraded/Barren0.530.230.060.010.060.050.95
Forest12.220.0637.380.130.110.1150.00
Swamp0.130.010.120.030.000.090.38
Urban4.600.230.220.021.080.156.30
Water0.090.000.140.020.002.953.21
Total51.981.0141.430.261.793.52100.00
Table 6. Land use and agricultural land conversion from 1990 to 2021.
SubcatchmentsLand Use Land Cover (%)Agriculture Land Conversion (1990–2021)
19902021
ForestUrbanAgricultureForestUrbanAgricultureTo Forest (%)To Urban (%)
Lake Flood Plain22.673.6873.6523.1313.6963.192.167.52
Lauruk17.411.0681.5328.131.4070.4817.231.29
Andheri35.770.4663.7743.112.0154.8818.782.21
Betani23.312.3374.3536.011.8562.1420.841.35
Harpan69.510.1030.3976.551.1522.3037.722.61
Phirke11.0813.6675.2717.9248.1633.9211.0647.41
Sedi Sarangkot25.111.3573.5441.032.8856.0926.823.55
Birim Chapakot62.330.6337.0470.000.5329.4731.071.36
Pumdi Side67.620.4131.9786.970.2412.800.133.82
Table 7. Estimated nutrient export from subcatchments of Phewa Lake.
SubcatchmentsN Export (kg/ha/year)P Export (kg/ha/year)
1990202119902021
Lake Flood Plain0.41050.40700.04040.0484
Lauruk0.64890.81210.05790.0817
Andheri0.65620.69560.05820.0650
Betani0.83660.85370.07120.0842
Harpan0.44870.52370.03900.0505
Phirke1.02211.19600.11300.1866
Sedi Sarangkot0.34500.38830.03260.0385
Birim Chapakot0.38670.42510.03470.0387
Pumdi Side0.07520.04540.00570.0040
Total0.53980.59680.05010.0646
Table 8. ANOVA of soil properties by land use (croplands and forests) and landform type (bare surfaces and riverbanks). Bold p-value numbers indicate significance at the 95% confidence level.
CroplandsForestsBare SurfacesRiverbanksANOVA
nMeansdnMeansdnMeansdnMeansdp-Value
Sand%2515.66.62113.77.62221.29.9636.23.90.000
Silt%2577.84.22176.66.22272.58.2662.03.90.000
Clay%256.64.2219.74.0226.33.761.80.30.000
pH 255.40.4214.80.2225.40.465.60.60.000
N%250.20.1210.40.2220.10.060.10.00.000
Pmg/kg25511.0142.821456.9304.222210.8100.76523.2130.40.000
SOM%254.42.5217.84.5221.00.960.40.60.000
Table 9. ANOVA of soil properties across the study subcatchments. Bold p-value numbers indicate significance at the 95% confidence level. sd: standard deviation.
AndheriHarpanLaurukBetaniBirim
Chapakot
PhirkePumdi SideSedi
Sarangkot
Lake Flood PlainANOVA
MeansdMeansdMeansdMeansdMeansdMeansdMeansdMeansdMeansdp-Value
Sand22.813.916.17.712.83.216.76.417.46.814.61110.41.913.83.4279.60.002
Silt70.310.172.64.881.53.177.64.977.63.873.44.778.31.978.23.170.58.60.002
Clay74.911.33.65.72.55.73.35.1312.16.311.3181.52.61.30.000
pH5.30.65.10.55.30.25.20.35.30.75.60.74.90.25.10.35.50.40.182
N0.20.20.30.20.20.10.20.10.40.20.10.10.30.10.20.10.10.10.053
P346.4251.4363.2201500.9454.3428.2120.8482.183.7229.30.4318.8130.4433.8222.7459.9129.50.682
SOM5.15.65.75.23.32.543.27.34.21.31.55.134.52.71.21.40.088
Table 10. Correlation matrix of the study properties for (a) land use and landform types, and (b) riverbed and suspended sediment samples. Asterisks indicate significance at the 95% confidence level. The heatmap displays significant positive correlations in red (light red for r < 0.5, medium red for 0.5 ≤ r < 0.75, and dark red for r ≥ 0.75) and significant negative correlations in blue (light blue for r > −0.5, medium blue for −0.75 < r ≤ −0.5, and dark blue for r ≤ −0.75).
SandSiltClayNPSOM
%%%%mg/kg%
(a) Land uses and landforms
Sand 1−0.91 *−0.70 *−0.55 *−0.18−0.38 *
Silt 10.34 *0.38 *0.180.23
Clay 10.59 *0.080.48 *
N 10.37 *0.88 *
P 10.38 *
SOM 1
(b) Riverbed and suspended sediments
Sand 1−1.00 *−0.55 *−0.61 *0.08−0.55 *
Silt 10.520.59 *−0.060.53
Clay 10.74 *−0.460.73 *
N 1−0.540.99 *
P 1−0.53
SOM 1
Table 11. Water quality parameters in the Phewa Lake (pre-monsoon 2022). sd: standard deviation, CI: confidence interval.
ParametersMeansdMin.Max.CI
pH7.600.706.108.707.6 ± 0.33
Nitrogen (mg/L)4.422.841.8610.584.42 ± 1.37
Secchi depth (m)3.081.201.604.703.08 ± 0.6
Phosphorus (mg/L)8.393.922.5013.258.39 ± 2.02
Chl-a (µg)13.102.988.4018.6013.1 ± 1.59
AvgCTSI44.473.9339.1250.8344.47 ± 2.18
Table 12. Pearson’s correlation coefficients among water quality parameters. Asterisks indicate significance at the 95% confidence level.
ParameterspHNitrogenSecchi-DepthPhosphorusChlorophyll-a
mg/Lmmg/Lµg
pH10.130−0.32−0.22
Nitrogen 1−0.45 *−0.010.25
Secchi-depth 1−0.17−0.33
Phosphorus 10.36
Chlorophyll-a 1
Disclaimer/Publisher’s Note: The statements, opinions and data contained in all publications are solely those of the individual author(s) and contributor(s) and not of MDPI and/or the editor(s). MDPI and/or the editor(s) disclaim responsibility for any injury to people or property resulting from any ideas, methods, instructions or products referred to in the content.