Water Level Temporal Variability of Lake Mégantic during the Period 1920–2020 and Its Impacts on the Frequency of Heavy Flooding of the Chaudière River (Quebec, Canada)
Abstract
1. Introduction
2. Materials and Methods
2.1. Choice and Description of the Study Site
2.2. Data Sources and Constitution of Hydroclimatic Series
2.3. Statistical Data Analysis
3. Results
3.1. Analysis of the Temporal Variability in Water Levels in Lake Mégantic during the Period 1920–2020
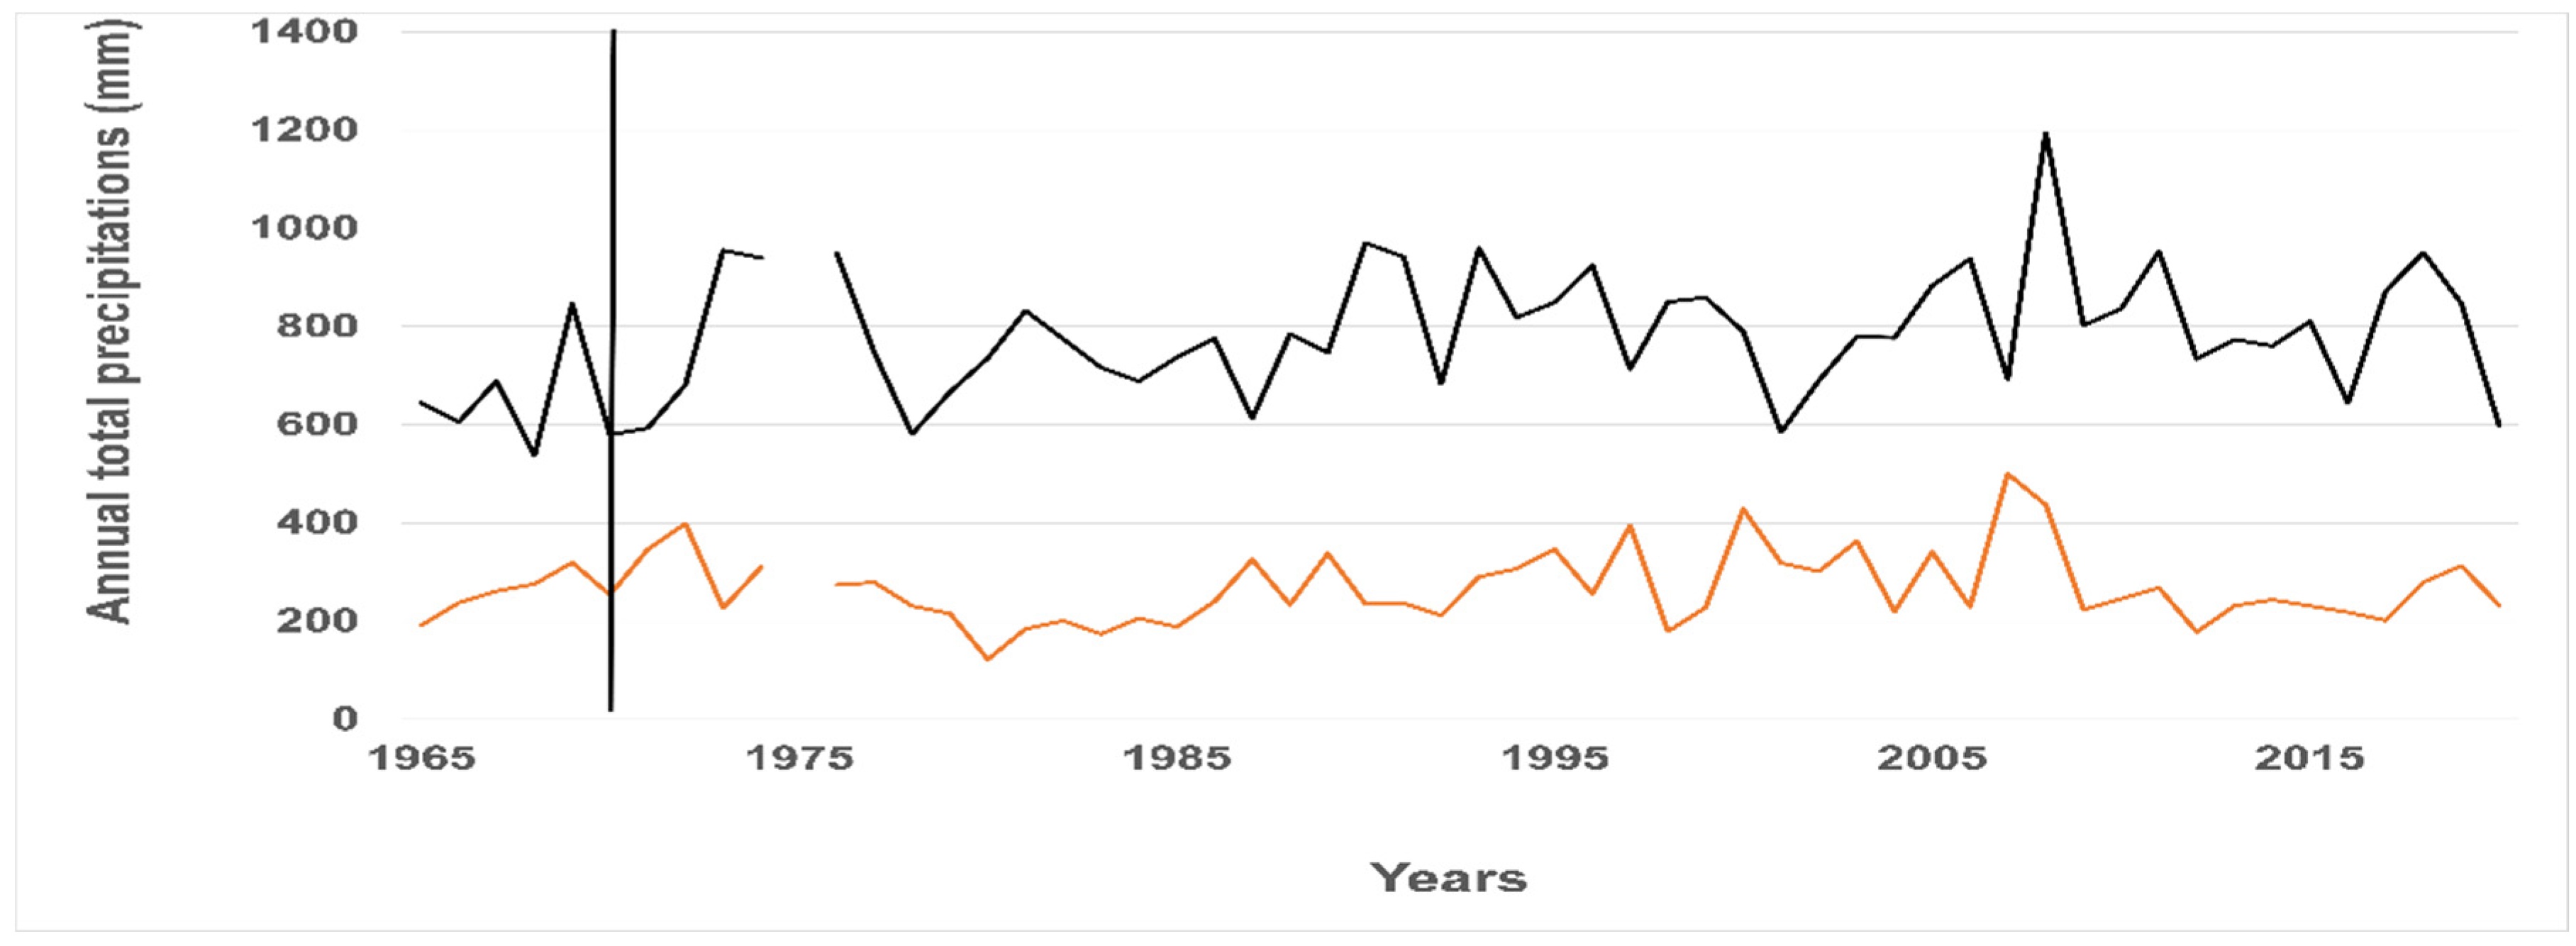
3.2. Analysis of the Temporal Variability in the Flows of the Famine River as Well as the Temperatures and Precipitation Measured at the Saint-Ludger Climatic Station
3.3. Relationship between Water Levels and Climate Indices
3.4. Analysis of the Impacts of Lake Mégantic on the Long-Term Flow Trend and Flooding of the Chaudière River
4. Discussion
5. Conclusions
Author Contributions
Funding
Data Availability Statement
Acknowledgments
Conflicts of Interest
References
- Messager, M.L.; Lehner, B.; Grill, G.; Nedeva, I.; Schmitt, O. Estimating the volume and age of water stored in global lakes using a geo-statistical approach. Nat. Commun. 2016, 7, 13603. [Google Scholar] [CrossRef] [PubMed]
- McGregor, G. Hydroclimatology, modes of climatic variability and stream flow, lake and groundwater level variability: A progress report. Prog. Phys. Geogr. 2017, 4, 496–513. [Google Scholar] [CrossRef]
- Gronewold, A.D.; Rood, R.B. Recent water level changes across Earth’s largest lake systems and implication for future variability. J. Great Lakes Res. 2019, 45, 1–3. [Google Scholar] [CrossRef]
- Kraemer, B.M.; Seimon, A.; Adrian, R.; McIntyre, P.B. World lake level trends and responses to background climate variation. Hydrol. Earth Syst. Sci. 2020, 24, 2593–2608. [Google Scholar] [CrossRef]
- Maihemuti, B.; Aishan, T.; Simayi, Z.; Alifujiang, Y.; Yang, S. Temporal scaling of water level fluctuations in shallow lakes and its impacts on the lake eco-environments. Sustainability 2020, 12, 3541. [Google Scholar] [CrossRef]
- Rezaei, A.; Gurdak, J.J. Large-scale climate variability controls on climate, vegetation coverage, lake and groundwater storage in the Lake Urmia watershed using SSA and wavelet analysis. Sci. Total Environ. 2020, 724, 138273. [Google Scholar] [CrossRef]
- Sinyukovich, V.N.; Georgiadi, A.G.; Groisman, P.Y.; Borodin, O.O.; Aslamov, I.A. The variation in the water level of lake Baikal and its relationship with the inflow and outflow. Water 2024, 16, 560. [Google Scholar] [CrossRef]
- Sulca, J.; Apaéstegui, J.; Tacza, J. New insights to-multidecadal variability of the water level fluctuation in Lake Titicaca in the 20th century. Front. Clim. 2024, 5, 1325224. [Google Scholar] [CrossRef]
- Tan, Q.; Liu, Y. Spatiotemporal variation and climatic response of water level of major lakes in China, Mongolia, and Russia. Open Geosci. 2020, 12, 1200–1211. [Google Scholar] [CrossRef]
- VanDeweghe, A.; Lin, V.; Jayaram, J.; Gronewold, A.D. Changes in large lake water level dynamics in response to climate change. Front. Water 2022, 4, 805143. [Google Scholar] [CrossRef]
- Vuglinsky, V.S.; Kuznetsova, M.R. The world’s largest lakes water level changes in the context of global warming. Nat. Resour. 2019, 10, 28–46. [Google Scholar] [CrossRef]
- Ye, Z.; Liu, H.; Chen, Y.; Shu, S.; Wu, Q.; Wang, S. Analysis of water level variation of lakes and reservoirs in Xinjiang, China using ICESat laser altimetry data (2003–2009). PLoS ONE 2017, 12, e0183800. [Google Scholar] [CrossRef]
- Górniak, A.; Więcko, A. Wigry Lake: The cradle of Polish hydrobiology-A century of limnological exploration. In Science of Lakes. Multidisciplinary Approach; Assani, A.A., Ed.; Intechopen: London, UK, 2024; pp. 51–70. [Google Scholar] [CrossRef]
- Plourde-Lavoie, P.; Archer, M.; Gagnon, K.; Sirois, P. Level variations in Lake Saint-Jean: Effects on fish reproduction in riparian wetland habitats. Le Nat. Can. 2018, 142, 66–77. (In French) [Google Scholar] [CrossRef][Green Version]
- Assani, A.A. Variability of Mean Annual Flows in Southern Quebec (Canada). Water 2022, 14, 1370. [Google Scholar] [CrossRef]
- Assani, A.A. Comparison of Spatio-Temporal Variability of Daily Maximum Flows in Cold-Season (Winter and Spring) in Southern Quebec (Canada). Hydrology 2023, 10, 44. [Google Scholar] [CrossRef]
- Assani, A.A. Spatiotemporal variability of fall daily maximum flows in the southern Quebec (Canada) from 1930 to 2018. J. Flood Risk Manag. 2024, 17, e12971. [Google Scholar] [CrossRef]
- Assani, A.A. Analysis of the impacts of climate change, physiographic factors and land use/cover on the spatiotemporal variability of seasonal daily mean flows in southern Quebec (Canada). Appl. Water Sci. 2024, 14, 109. [Google Scholar] [CrossRef]
- Assani, A.A.; Zeroual, A.; Roy, A.; Kinnard, C. Spatio-temporal variability of seasonal daily minimum flows in the southern Quebec: Synthesis on the impacts of climate, agriculture and wetlands. Hydrol. Res. 2022, 53, 1494. [Google Scholar] [CrossRef]
- Assani, A.A.; Zeroual, A.; Roy, A.; Kinnard, C. The new “surface storage” concept versus the old ‘sponge effect’ concept: Application to the analysis of the spatio-temporal variability of the annual daily maximum flow characteristics in southern Quebec (Canada). J. Water Clim. Change 2023, 14, 2543. [Google Scholar] [CrossRef]
- Bouchard-Verret, S.; Tardif, C.; Thibault, G. Flooding on the Chaudière River; Technical Report; COBARIC: Scott, QC, Canada, 2022; 27p. [Google Scholar]
- Ghobrial, T.; Pelchat, G.; Morse, B. A comprehensive field investigation of the dynamic break-up processes on the Chaudière River, Quebec, Canada. Hydrol. Res. 2023, 54, 797. [Google Scholar] [CrossRef]
- Loewen, B.; Simard, F. Historical witnesses. The head of Lac Mégantic at the time of steam navigation, 1880–1930. In Between Lakes and Mountains in Méganticois, 12,000 Years of Amerindian History; Chapdelaine, C., Ed.; Amerindian Research in Quebec: Madison, QC, Canada, 2007; pp. 337–374. [Google Scholar]
- Assani, A.A.; Charron, S.; Matteau, M.; Mesfioui, M.; Quessy, J.-F. Temporal variability modes of floods for catchments in the St. Lawrence watershed (Quebec, Canada). J. Hydrol. 2010, 385, 292–299. [Google Scholar] [CrossRef]
- Assani, A.A.; Chalifour, A.; Légaré, G.; Manouane, C.-S.; Leroux, D. Temporal Regionalization of 7-Day Low Flows in the St. Lawrence Watershed in Quebec (Canada). Water Resour. Manag. 2011, 25, 3559–3574. [Google Scholar] [CrossRef]
- Assani, A.A.; Maloney-Dumont, V.; Pothier-Champagne, A.; Kinnard, C.; Quessy, J.-F. Comparison of the temporal variability of summer temperature and rainfall as it relates to climate indices in southern Quebec (Canada). Theor. Appl. Climatol. 2019, 137, 2425–2435. [Google Scholar] [CrossRef]
- Sneyers, R. On the Statistical Analysis of Series of Observations; Technical Notes N°143; World Meteorological Organization: Geneva, Switzerland, 1990; 192p. [Google Scholar]
- von Storch, H. Misuses of statistical analysis in climate research. In Analysis of Climate Variability; von Storch, H., Navarra, A., Eds.; Springer: Dordrecht, The Netherlands, 1995; pp. 11–26. [Google Scholar]
- Hamed, K.H. Enhancing the effectiveness of prewhitening in trend analysis of hydrologic data. J. Hydrol. 2009, 368, 143–155. [Google Scholar] [CrossRef]
- Hamed, K.H.; Rao, A.R. A modified Mann-Kendall trend test for autococorrelated data. J. Hydrol. 1998, 204, 182–196. [Google Scholar] [CrossRef]
- Lombard, F. Rank tests for changepoint problems. Biometrika 1985, 74, 615–624. [Google Scholar] [CrossRef]
- Quessy, J.F.; Favre, A.C.; Saïd, M.; Champagne, M. Statistical inference in Lombard’s smooths-change model. Environmetrics 2011, 22, 882–893. [Google Scholar] [CrossRef]
- Anctil, F.; Martel, F.; Hoang, V.D. Analyse régionale des crues journalières de la province du Québec. Can. J. Civ. Eng. 1998, 25, 125–146. (In French) [Google Scholar] [CrossRef]
- Ruiz, J. Modernization agriculture and agricultural land cover in Quebec (1951–2011). Cah. Géographie Québec 2019, 63, 213–230. (In French) [Google Scholar] [CrossRef]
- Provencher, L.; Dagneau, B.; Dubois, J.-M. Biophysical Characterization and Evolution of Wetlands South of Lake Mégantic and Summary Opinion on the Impact of Lowering the Water Level; Technical Report; Ministry of Environment and Wildlife of Quebec: Sherbrooke, QC, Canada, 1998; 30p. (In French)


| Scale | MMK | TPCW | MMKH | LTP | Lombard Test | |||||
|---|---|---|---|---|---|---|---|---|---|---|
| Z | p-Values | Z | p-Values | Z | p-Values | Z | p-Values | Sn | T1–T2 | |
| Year | ||||||||||
| Maximum | −8.909 * | 0.000 | −9.135 * | 0.000 | −9.817 * | 0.000 | −4.917 * | 0.000 | 0.671 * | 1957–1963 |
| Minimum | −1.232 | 0.218 | −1.181 | 0.238 | −1.144 | 0.253 | −0.758 | 0.449 | 0.025 | - |
| Mean | −8.545 * | 0.000 | −9.970 * | 0.000 | −6.404 * | 0.000 | −2.096 * | 0.036 | 0.624 * | 1959–1963 |
| Winter | ||||||||||
| Maximum | −5.418 * | 0.000 | −5.454 * | 0.000 | −8.285 * | 0.000 | −2.691 * | 0.007 | 0.292 * | 1959–1960 |
| Minimum | −3.302 * | 0.001 | −3.650 * | 0.000 | −3.218 * | 0.001 | −1.602 | 0.109 | 0.106 * | 1959–1960 |
| Mean | −4.880 * | 0.000 | −5.382 * | 0.000 | −5.606 * | 0.000 | −2.446 * | 0.014 | 0.205 * | 1959–1960 |
| Spring | ||||||||||
| Maximum | −8.584 * | 0.000 | −8.742 * | 0.000 | −9.103 * | 0.000 | −5.233 * | 0.000 | 0.648 * | 1957–1963 |
| Minimum | −4.839 * | 0.000 | −4.553 * | 0.000 | −5.698 * | 0.000 | −3.695 * | 0.000 | 0.200 * | 1962–1963 |
| Mean | −9.972 * | 0.000 | −11.341 * | 0.000 | −4.093 * | 0.000 | −2.708 * | 0.007 | 0.755 * | 1960–1963 |
| Summer | ||||||||||
| Maximum | −8.244 * | 0.000 | −8.926 * | 0.000 | −5.117 * | 0.000 | −2.615 * | 0.009 | 0.572 * | 1960–1963 |
| Minimum | −0.983 | 0.326 | −0.921 | 0.000 | −1.190 | 0.234 | −0.591 | 0.554 | 0.005 | - |
| Mean | −6.312 * | 0.000 | −6.685 * | 0.000 | −6.629 * | 0.000 | −2.524 * | 0.012 | 0.380 * | 1961–1962 |
| Fall | ||||||||||
| Maximum | −6.235 * | 0.000 | −6.280 * | 0.000 | −6.877 * | 0.000 | −4.238 * | 0.000 | 0.339 * | 1962–1963 |
| Minimum | −3.797 * | 0.000 | −3.186 * | 0.000 | −4.150 * | 0.000 | −2.254 * | 0.024 | 0.134 * | 1945–1946 |
| Mean | −6.379 * | 0.000 | −6.163 * | 0.000 | −5.816 * | 0.000 | −3.802 * | 0.000 | 0.354 * | 1937–1911 |
| Water Levels | Before Mean Shift Period (1920–1956) | After Mean Shift Period (1964–2020) | ||
|---|---|---|---|---|
| Sn | T1–T2 | Sn | T1–T2 | |
| Year | ||||
| Maximum | 0.010 | - | 0.0403 * | 1991–1993 |
| Minimum | 0.000 | - | 0.339 | - |
| Mean | 0.000 | - | 0.258 ** | 1991–1993 |
| Winter | ||||
| Maximum | 0.010 | - | 0.116 ** | 1991–1993 |
| Minimum | 0.001 | - | 0.002 | - |
| Mean | 0.000 | - | 0.258 ** | 1991–1993 |
| Spring | ||||
| Maximum | 0.001 | - | 0.0395 * | 1990–1993 |
| Minimum | 0.001 | - | 0.0152 | - |
| Mean | 0.005 | - | 0.208 ** | 1990–1993 |
| Summer | ||||
| Maximum | 0.001 | - | 0.197 ** | 1991–1992 |
| Minimum | 0.001 | - | 0.120 ** | 1991–1992 |
| Mean | 0.001 | - | 0.223 ** | 1991–1993 |
| Fall | ||||
| Maximum | 0.001 | - | 0.115 ** | 1991–1992 |
| Minimum | 0.001 | - | 0.018 | - |
| Mean | 0.001 | - | 0.163 ** | 1991–1992 |
| MK | TPCW | MMKH | Lombard Test | |||||
|---|---|---|---|---|---|---|---|---|
| Z | p-Values | Z | Sn | T1–T2 | p-Values | Sn | T1–T2 | |
| Famine River | ||||||||
| Year | ||||||||
| Maximum | 1.138 | 0.255 | 1.118 | 0.264 | 1.138 | 0.255 | 0.0168 | - |
| Minimum | 2.665 ** | 0.008 | 2.207 ** | 0.027 | 2.269 ** | 0.023 | 0.0678 ** | 2002–2003 |
| Mean | 0.389 | 0.697 | 0.203 | 0.839 | 0.432 | 0.666 | 0.0029 | - |
| Winter | ||||||||
| Maximum | 1.150 | 0.344 | 0.855 | 0.392 | 1.194 | 0.232 | 0.008 | - |
| Minimum | 2.657 ** | 0.014 | 2.396 ** | 0.017 | 2.657 ** | 0.008 | 0.072 ** | 1992–1993 |
| Mean | 1.180 | 0.070 | 1.378 | 0.168 | 1.810 | 0.070 | 0.025 | - |
| Spring | ||||||||
| Maximum | 0.557 | 0.573 | 0.261 | 0.794 | 0.587 | 0.558 | 0.0071 | - |
| Minimum | 0.933 | 0.351 | 0.697 | 0.486 | 0.999 | 0.318 | 0.0093 | - |
| Mean | −0.572 | 0.567 | −0.900 | 0.368 | −0.576 | 0.567 | 0.0055 | - |
| Summer | ||||||||
| Maximum | −1.033 | 0.3016 | 0.943 | 0.346 | −1.033 | 0.010 | 0.0101 | - |
| Minimum | 1.798 * | 0.072 | 1.301 | 0.193 | 1.729 * | 0.084 | 0.0283 | - |
| Mean | −1.395 | 0.163 | −1.466 | 0.143 | −1.310 | 0.190 | 0.028 | - |
| Fall | ||||||||
| Maximum | 2.059 * | 0.039 | 1.673 * | 0.094 | 1.803 * | 0.071 | 0.054 ** | 2002–2003 |
| Minimum | −0.624 | 0.533 | −0.640 | 0.522 | −0.773 | 0.440 | 0.003 | - |
| Mean | 1.503 | 0.133 | 1.356 | 0.175 | 1.503 | 0.173 | 0.025 | - |
| Saint-Ludger station (Annual daily mean temperature and annual total precipitations) | ||||||||
| Temperature | 0.1744 ** | 1996–1997 | ||||||
| Rainfall | 0.0634 ** | 1971–1972 | ||||||
| Snowfall | 0.0063 | - | ||||||
| AMO | AO | GMLOT | NAO | NINO | ONI | PDO | |
|---|---|---|---|---|---|---|---|
| Year | |||||||
| Maximum (year) | −0.095 | −0.284 ** | −0.611 ** | −0.150 | −0.195 | 0.001 | −0.351 ** |
| Minimum (year) | 0.284 ** | 0.045 | −0.008 | −0.042 | −0.041 | −0.018 | −0.108 |
| Mean (year) | 0.053 | −0.140 | −0.597 ** | −0.082 | −0.189 | 0.015 | −0.204 * |
| Winter | |||||||
| Maximum (fall) | 0.109 | −0.010 | −0.220 * | 0.185 | 0.039 | 0.132 | 0.002 |
| Minimum (fall) | 0.039 | 0.202 * | −0.039 | 0.341 ** | 0.087 | 0.123 | −0.205 * |
| Mean (fall) | −0.012 | 0.123 | −0.193 | 0.294 ** | 0.021 | 0.088 | 0.034 |
| Spring | |||||||
| Maximum (spring) | −0.104 | −0.121 | −0.610 ** | 0.035 | −0.152 | 0.021 | −0.399 ** |
| Minimum (spring) | 0.323 ** | −0.237 ** | −0.251 ** | −0.171 | −0.013 | 0.094 | −0.059 |
| Mean (spring) | 0.060 | −0.214 * | −0.733 ** | 0.011 | −0.202 * | 0.025 | −0.346 ** |
| Summer | |||||||
| Maximum (spring) | 0.090 | −0.199 | −0.582 ** | 0.054 | −0.269 ** | −0.100 | −0.229 * |
| Minimum (spring) | 0.119 | 0.183 | −0.037 | −0.025 | 0.011 | 0.033 | 0.191 |
| Mean (summer) | 0.001 | 0.108 | −0.435 ** | 0.016 | −0.173 | −0.019 | 0.025 |
| Fall | |||||||
| Maximum (summer) | −0.131 | 0.020 | −0.548 ** | −0.037 | −0.200 | −0.016 | −0.094 |
| Minimum (summer) | −0.033 | 0.049 | −0.355 ** | −0.008 | −0.199 | −0.095 | −0.071 |
| Mean (fall) | −0.109 | 0.020 | −0.530 ** | −0.009 | −0.212 * | −0.041 | −0.049 |
| Daily Flows | S1 (1170 km2): 1920–1983 | S2 (781 km2): 1979–2020 | ||
|---|---|---|---|---|
| Sn | T1–T2 | Sn | T1–T2 | |
| Year | ||||
| Maximum | 0.0647 * | 1931-1932 | 0.0045 | - |
| Minimum | 0.0136 | - | 0.0172 | - |
| Mean | 0.0238 | - | 0.0138 | - |
| Winter | ||||
| Maximum | 0.0453 * | 1970-1972 | 0.0110 | - |
| Minimum | 0.0053 | - | 0.009 | - |
| Mean | 0.0353 | - | 0.0037 | - |
| Spring | ||||
| Maximum | 0.0557 * | 1931-1932 | 0.0180 | - |
| Minimum | 0.0261 | - | 0.0027 | - |
| Mean | 0.0476 * | 1952-1953 | 0.0052 | - |
| Summer | ||||
| Maximum | 0.0172 | - | 0.0019 | - |
| Minimum | 0.0039 | - | 0.0080 | - |
| Mean | 0.0070 | - | 0.0093 | - |
| Fall | ||||
| Maximum | 0.0183 | - | 0.0197 | - |
| Minimum | 0.0045 | - | 0.0041 | - |
| Mean | 0.0078 | - | 0.0117 | - |
| Return Period (in Years) | Chaudière River (781 km2) Downstream from Mégantic Dam | Famine River (696 km2) Pristine River | ||
|---|---|---|---|---|
| Flows (m3/s) * | Frequency (in Years) | Flows (m3/s) * | Frequency (in Years) | |
| Q10 | 241.9 | 0 | 223.2 | 13 |
| Q25 | 276.4 | 0 | 255 | 10 |
| Q50 | 299.6 | 0 | 276.4 | 7 |
| Q100 | 320.9 | 0 | 296 | 3 |
| Qmax | 190.6 | <Q10 | 500.2 | >Q500 |
Disclaimer/Publisher’s Note: The statements, opinions and data contained in all publications are solely those of the individual author(s) and contributor(s) and not of MDPI and/or the editor(s). MDPI and/or the editor(s) disclaim responsibility for any injury to people or property resulting from any ideas, methods, instructions or products referred to in the content. |
© 2024 by the authors. Licensee MDPI, Basel, Switzerland. This article is an open access article distributed under the terms and conditions of the Creative Commons Attribution (CC BY) license (https://creativecommons.org/licenses/by/4.0/).
Share and Cite
Goulet, S.; Assani, A.A.; Roy, A. Water Level Temporal Variability of Lake Mégantic during the Period 1920–2020 and Its Impacts on the Frequency of Heavy Flooding of the Chaudière River (Quebec, Canada). Hydrology 2024, 11, 130. https://doi.org/10.3390/hydrology11090130
Goulet S, Assani AA, Roy A. Water Level Temporal Variability of Lake Mégantic during the Period 1920–2020 and Its Impacts on the Frequency of Heavy Flooding of the Chaudière River (Quebec, Canada). Hydrology. 2024; 11(9):130. https://doi.org/10.3390/hydrology11090130
Chicago/Turabian StyleGoulet, Samuel, Ali Arkamose Assani, and Alexandre Roy. 2024. "Water Level Temporal Variability of Lake Mégantic during the Period 1920–2020 and Its Impacts on the Frequency of Heavy Flooding of the Chaudière River (Quebec, Canada)" Hydrology 11, no. 9: 130. https://doi.org/10.3390/hydrology11090130
APA StyleGoulet, S., Assani, A. A., & Roy, A. (2024). Water Level Temporal Variability of Lake Mégantic during the Period 1920–2020 and Its Impacts on the Frequency of Heavy Flooding of the Chaudière River (Quebec, Canada). Hydrology, 11(9), 130. https://doi.org/10.3390/hydrology11090130


