Article

Estimation of Incoming Sediments and Useful Life of Haditha Reservoir with Limited Measurements Using Hydrological Modeling

1
Glenn Department of Civil Engineering, Clemson University, Clemson, SC 29634, USA
2
Zachary Department of Civil & Environmental Engineering, Texas A&M University, College Station, TX 77840, USA
3
Civil Engineering Department, King Saud University, Riyadh 12372, Saudi Arabia
*
Author to whom correspondence should be addressed.
Hydrology 2024, 11(8), 128; https://doi.org/10.3390/hydrology11080128
Submission received: 9 July 2024 / Revised: 19 August 2024 / Accepted: 19 August 2024 / Published: 21 August 2024

Abstract

:
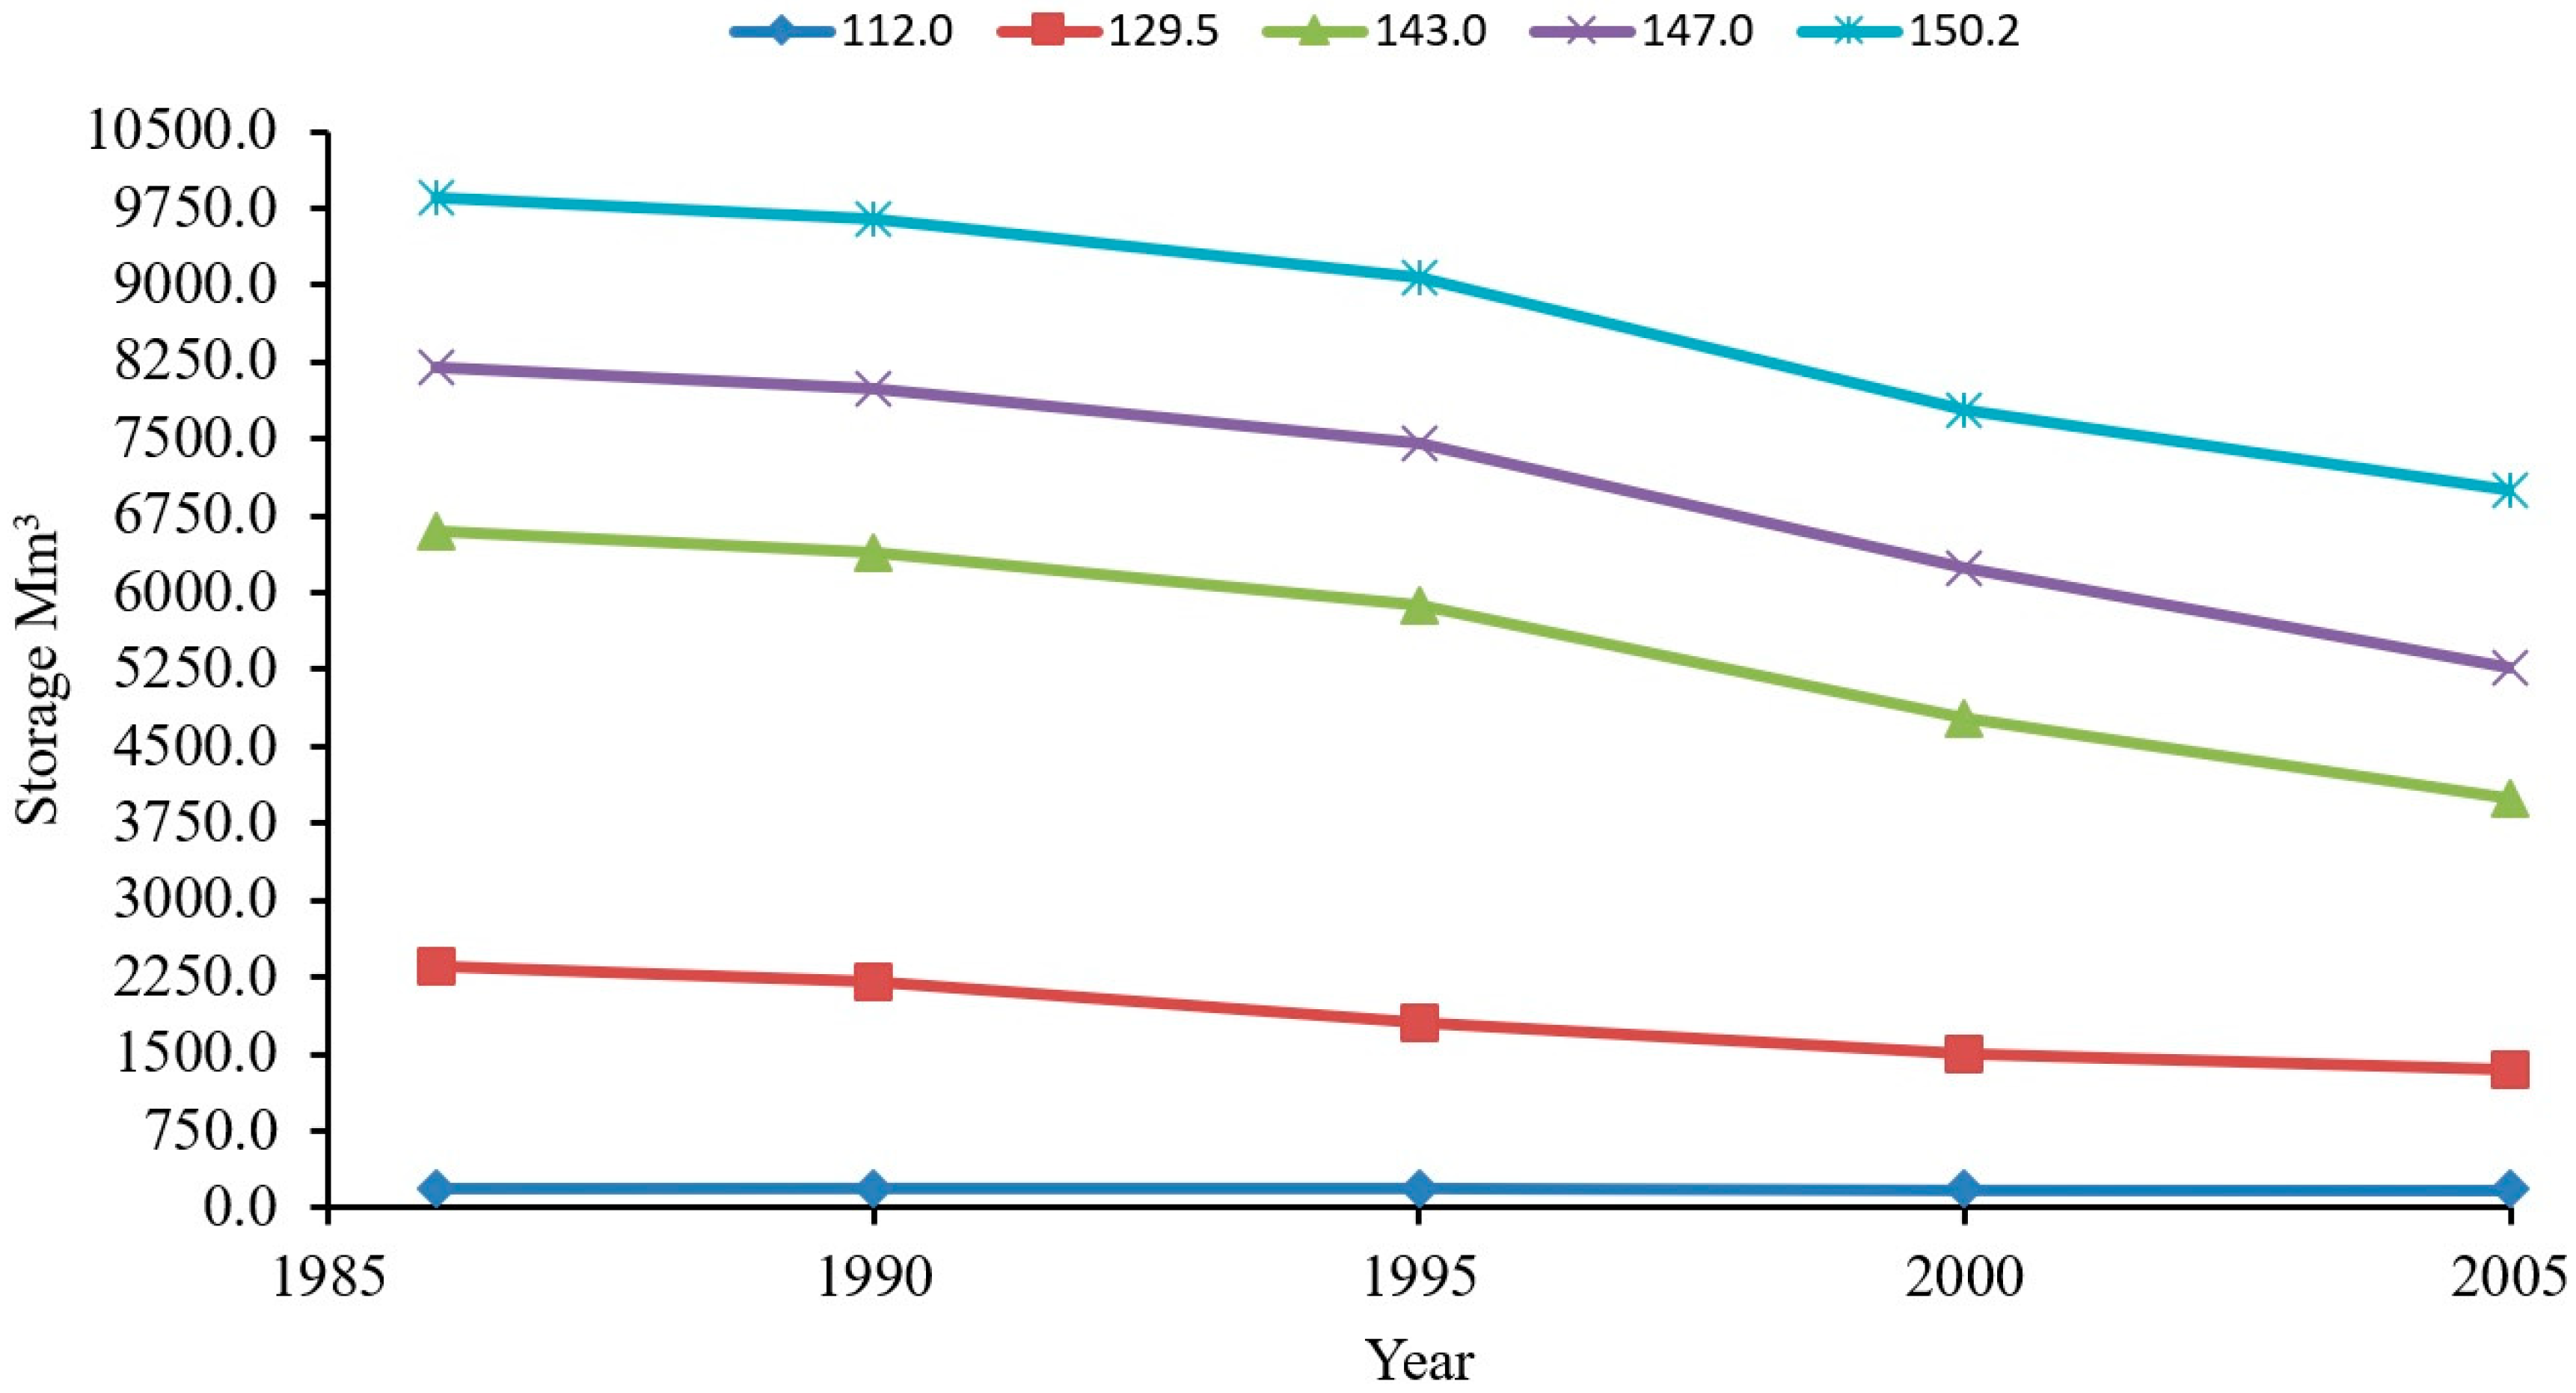
Many dammed reservoirs in dry climate conditions witness high sediment inflow rates due to higher soil erodibility, yet there are limited actual sediment influx measurements. Therefore, this study first applies the Soil and Water Assessment Tool (SWAT) hydrologic model to simulate reservoir sedimentation inflow to the Haditha Reservoir. Next, utilizing sediment inflows estimated by the SWAT model, the Trap Efficiency Function (TEF) is employed to estimate its remaining storage capacity and its useful life at multiple reservoir water levels. Calibration (1986–1997) and validation (1998–2007) of the SWAT model were conducted at three streamflow gaging stations and one sediment station located upstream of the reservoir. Results show that the SWAT model performed better during calibration than during the validation period for all streamflow and sediment gaging stations. In addition, modeled streamflow and sediment predictions were relatively more accurate on a monthly scale than on a daily scale. Simulated daily sediment inflow to the reservoir demonstrates slightly lower accuracy than daily streamflow, where the Coefficient of Determination (R2) and Nash-Sutcliffe Efficiency values are 0.34 and 0.32 in the case of sediment load, compared to 0.39 and 0.33 for streamflow, respectively. Reservoir storage capacity for the period (1986–2005) shows a continuous decrease with time at all reservoir water levels, which indicates an increase in sediment accumulation. According to measurements taken between 1986 and 2005, sediment accumulation has reduced the reservoir’s capacity by approximately 15% at a water level of 112 m (the lowest water level in the reservoir). During the same period, the storage capacity loss at 147 m (the design working water level in the reservoir) was calculated to be 35%. Over 19 years of operation (1986–2005) at the 147-m water level, the total sediment buildup in the reservoir is estimated at 3.2 million tons. Notably, about one-third of this sediment was deposited in the five-year span from 2000 to 2005.

1. Introduction

Winter rains are the primary source of water in the highlands of the Upper Euphrates River Basin (UERB) upstream of the Haditha Dam (in North West Iraq), occurring mainly for a short duration (January–March), and resulting in large amounts of runoff and sediment load across the river basin [1]. Since Haditha Dam is situated in a semi-arid climate, soil erosion from sills and channels usually causes higher rates of deposition in the Haditha Reservoir (HR). Deposited materials will eventually reduce the water storage capacity and consequently lower HR usefulness in achieving its design goals [2]. Besides the natural causes of soil erosion (e.g., semi-arid climate, poor vegetation cover, highly erodible soils), recent land cover and land use changes due to new agricultural developments in the upper part of the Euphrates River Basin, mainly in southern Turkey, have negatively impacted nearby water resources and have increased soil erosion in the lower part of the Euphrates River Basin (i.e., Syria and Iraq) [3,4]. These irrigation developments have resulted in gradual reductions in streamflows and available reservoir water storage capacity due to sedimentation, as well as threaten the expected useful lifespan of the reservoir [5]. Additionally, prolonged dryness leads to soil compaction and weakened aggregate stability, which reduces the soil’s ability to absorb water. Consequently, more water flows over the surface, increasing runoff and soil particle detachment [6]. It is important to predict accurately the amount of sediment that will be deposited in the reservoir during the planning, design, and operational phases of the reservoir.
The complex nature of sedimentation as a hydro-morphological phenomenon makes it challenging to accurately predict. It has been underestimated in the past, perceived as a minor problem that can be controlled by sacrificing a certain volume of the reservoir for sediment accumulation (dead storage). The continuous loss of reservoir capacity due to sedimentation must be countered by planning sediment control measures at the source, as well as by minimizing reservoir capacity loss using innovative approaches in the planning phase of the reservoir and during regular operation and maintenance periods [7]. Previous sedimentation studies have used Brune and Churchill curves [8,9] to predict sediment trap efficiencies in reservoirs by using several empirical curves built from surveys to relate reservoir trap efficiency to the reservoir capacity–inflow relation [10,11,12]. TE is defined as the ratio of sediment trapped permanently in the reservoir to the total sediment inflow for a given time. Although these methods are simple in concept, they are effective in quantifying sediment deposition in reservoirs, especially in areas with limited inflow sediment observations, e.g., South Africa [13], Australia [14], and Eastern Asia [15]. However, these methods do not consider watershed morphology or the characteristics of the sediment flowing into the reservoir [16]. More advanced models based on the empirical curves have been developed for estimating a universal trap efficiency for reservoirs located in different environments. These models consider the parameters controlling the sediment process, such as the particle-size distribution of the incoming sediment, retention time, and turbulence, which affect settling velocity [17]. Yeoh et al. (2004) [18] introduced the new generalized term β to the Trap Efficiency Function (TEF) developed by Brune (1953) [8] to reflect the hydraulic properties of reservoirs and the decay of the storage capacity of reservoirs due to the ongoing siltation process. Other models adopt a theoretical approach to simulate sediment behavior for ponds and reservoirs under quiescent or turbulent and steady or variable discharge conditions [19,20]. These methods require observed streamflow and sediment inflow data caused by soil erosion upstream of the reservoir, which are not available for many reservoirs and ponds around the world [21,22].
The Soil and Water Assessment Tool (SWAT) is used in this study, as it provides a comprehensive model framework that includes hydrological processes, land use, and management practices across different scales, enhancing its adaptability and accuracy compared to other models [23]. It is a physical-based watershed model, and can simulate soil erosion, sediment transport, and runoff from a watershed, which allows the prediction of the impact of watershed management practices and land-use changes on sediment transport [24]. In addition, SWAT is often used to estimate basin-wide sediment and nutrient transport as a part of regional water resources planning and management [25]. Sediment yield in the SWAT model is based on a Hydrologic Response Unit (HRU) and is related to parameters such as soil type, land-use, and slope. Applying the SWAT model to large watersheds can result in higher uncertainties due to the complexity of hydrological systems with limited spatiotemporal input data and the uncertainty in estimating model parameters [26,27,28]. Therefore, a multi-variable and multi-site calibration approach is used for calibrating the SWAT model to reduce model uncertainties. Many studies have evaluated the suitability of the SWAT model for estimating soil erosion and sediment inflow for reservoirs [25,29,30]. Duru et al. (2017) [31] modeled sedimentation deposition in the Ankara Cayi Catchment, Turkey (4932 km2), and reported that the model performs reasonably well for streamflow and sediment deposits with a Nash-Sutcliffe Efficiency (NSE) of 0.8. Licciardello et al. (2009) [32] estimated the annual and seasonal deposition of sediment in a Mediterranean reservoir in a semi-arid climate and found good agreement with the actual discharges; however, the sediment rates were 8.1% lower than the bathymetric measurements.
Over the last few decades, there has been a remarkable increase in the incoming sediment to the HR, which is attributed to the substantial agricultural developments in the UERB and their associated water usage and land-use changes. The analysis of sediment transport in the UERB is challenging because the observed hydro-climate measurements are limited due to ongoing conflicts and political instability. Therefore, the goals of this study are the following: (i) to apply the SWAT model to the UERB to simulate streamflow and sediment inflow to the HR, located in the UERB, with limited actual data; (ii) to develop a step calibration method based on daily and monthly streamflow and sediment measurements to constrain model uncertainties and to allow robust sediment estimation; and (iii) to use the simulated stream and sediment inflow from the SWAT model to estimate the sediment accumulation and the useful life of the HR using the TEF.

2. Study Area

The Haditha Dam, completed in 1981, is located on the Euphrates River in Iraq. It is positioned approximately 8 km upstream from the city of Haditha. The dam consists of the dam body, a hydro-electrical station containing six power units (totaling 660 MW), a spillway with six openings, and two bottom outlets. The reservoir of the dam was formed by the storage that began in 1986 [33]. The dam is located in the southern part of the UERB, between longitude (41°55′–42°27′) east and latitude (34°13′–34°40′) north. The HR extends for 100 km upstream from Abushabor (the site of the dam) in the south to the city of Rawa in the northwest. Figure 1 shows the location of the dam, the reservoir, and the study area. At 147 m water level, the reservoir has a live storage capacity of 8.28 billion cubic meters, and a dead storage capacity of 0.23 billion cubic meters. The corresponding surface storage area is 500 km2. Sediment accumulated in the reservoir contains silt, clay, sand, and gypsite deposits. The highlands in the UERB are characterized by their semi-humid climate and their transition to a semi-arid climate in the lowlands, where evaporation rates exceed precipitation rates [1,34]. The rainy season in the lower part of the UERB near the reservoir begins in October (with monthly precipitation of 5.7 mm) and lasts until June, reaching its maximum in April (22.50 mm). The rainfall during the dry season (June–September) is approximately zero. Evaporation has a positive relationship with the amount of solar radiation and an inverse relationship with the amount of rainfall. The higher temperatures in the summer months (June–July) in the study area led to increased evaporation. The highest monthly rate of evaporation (330 mm) is during July, whereas January and December have the lowest rate of evaporation [1].

3. Model Data Inputs

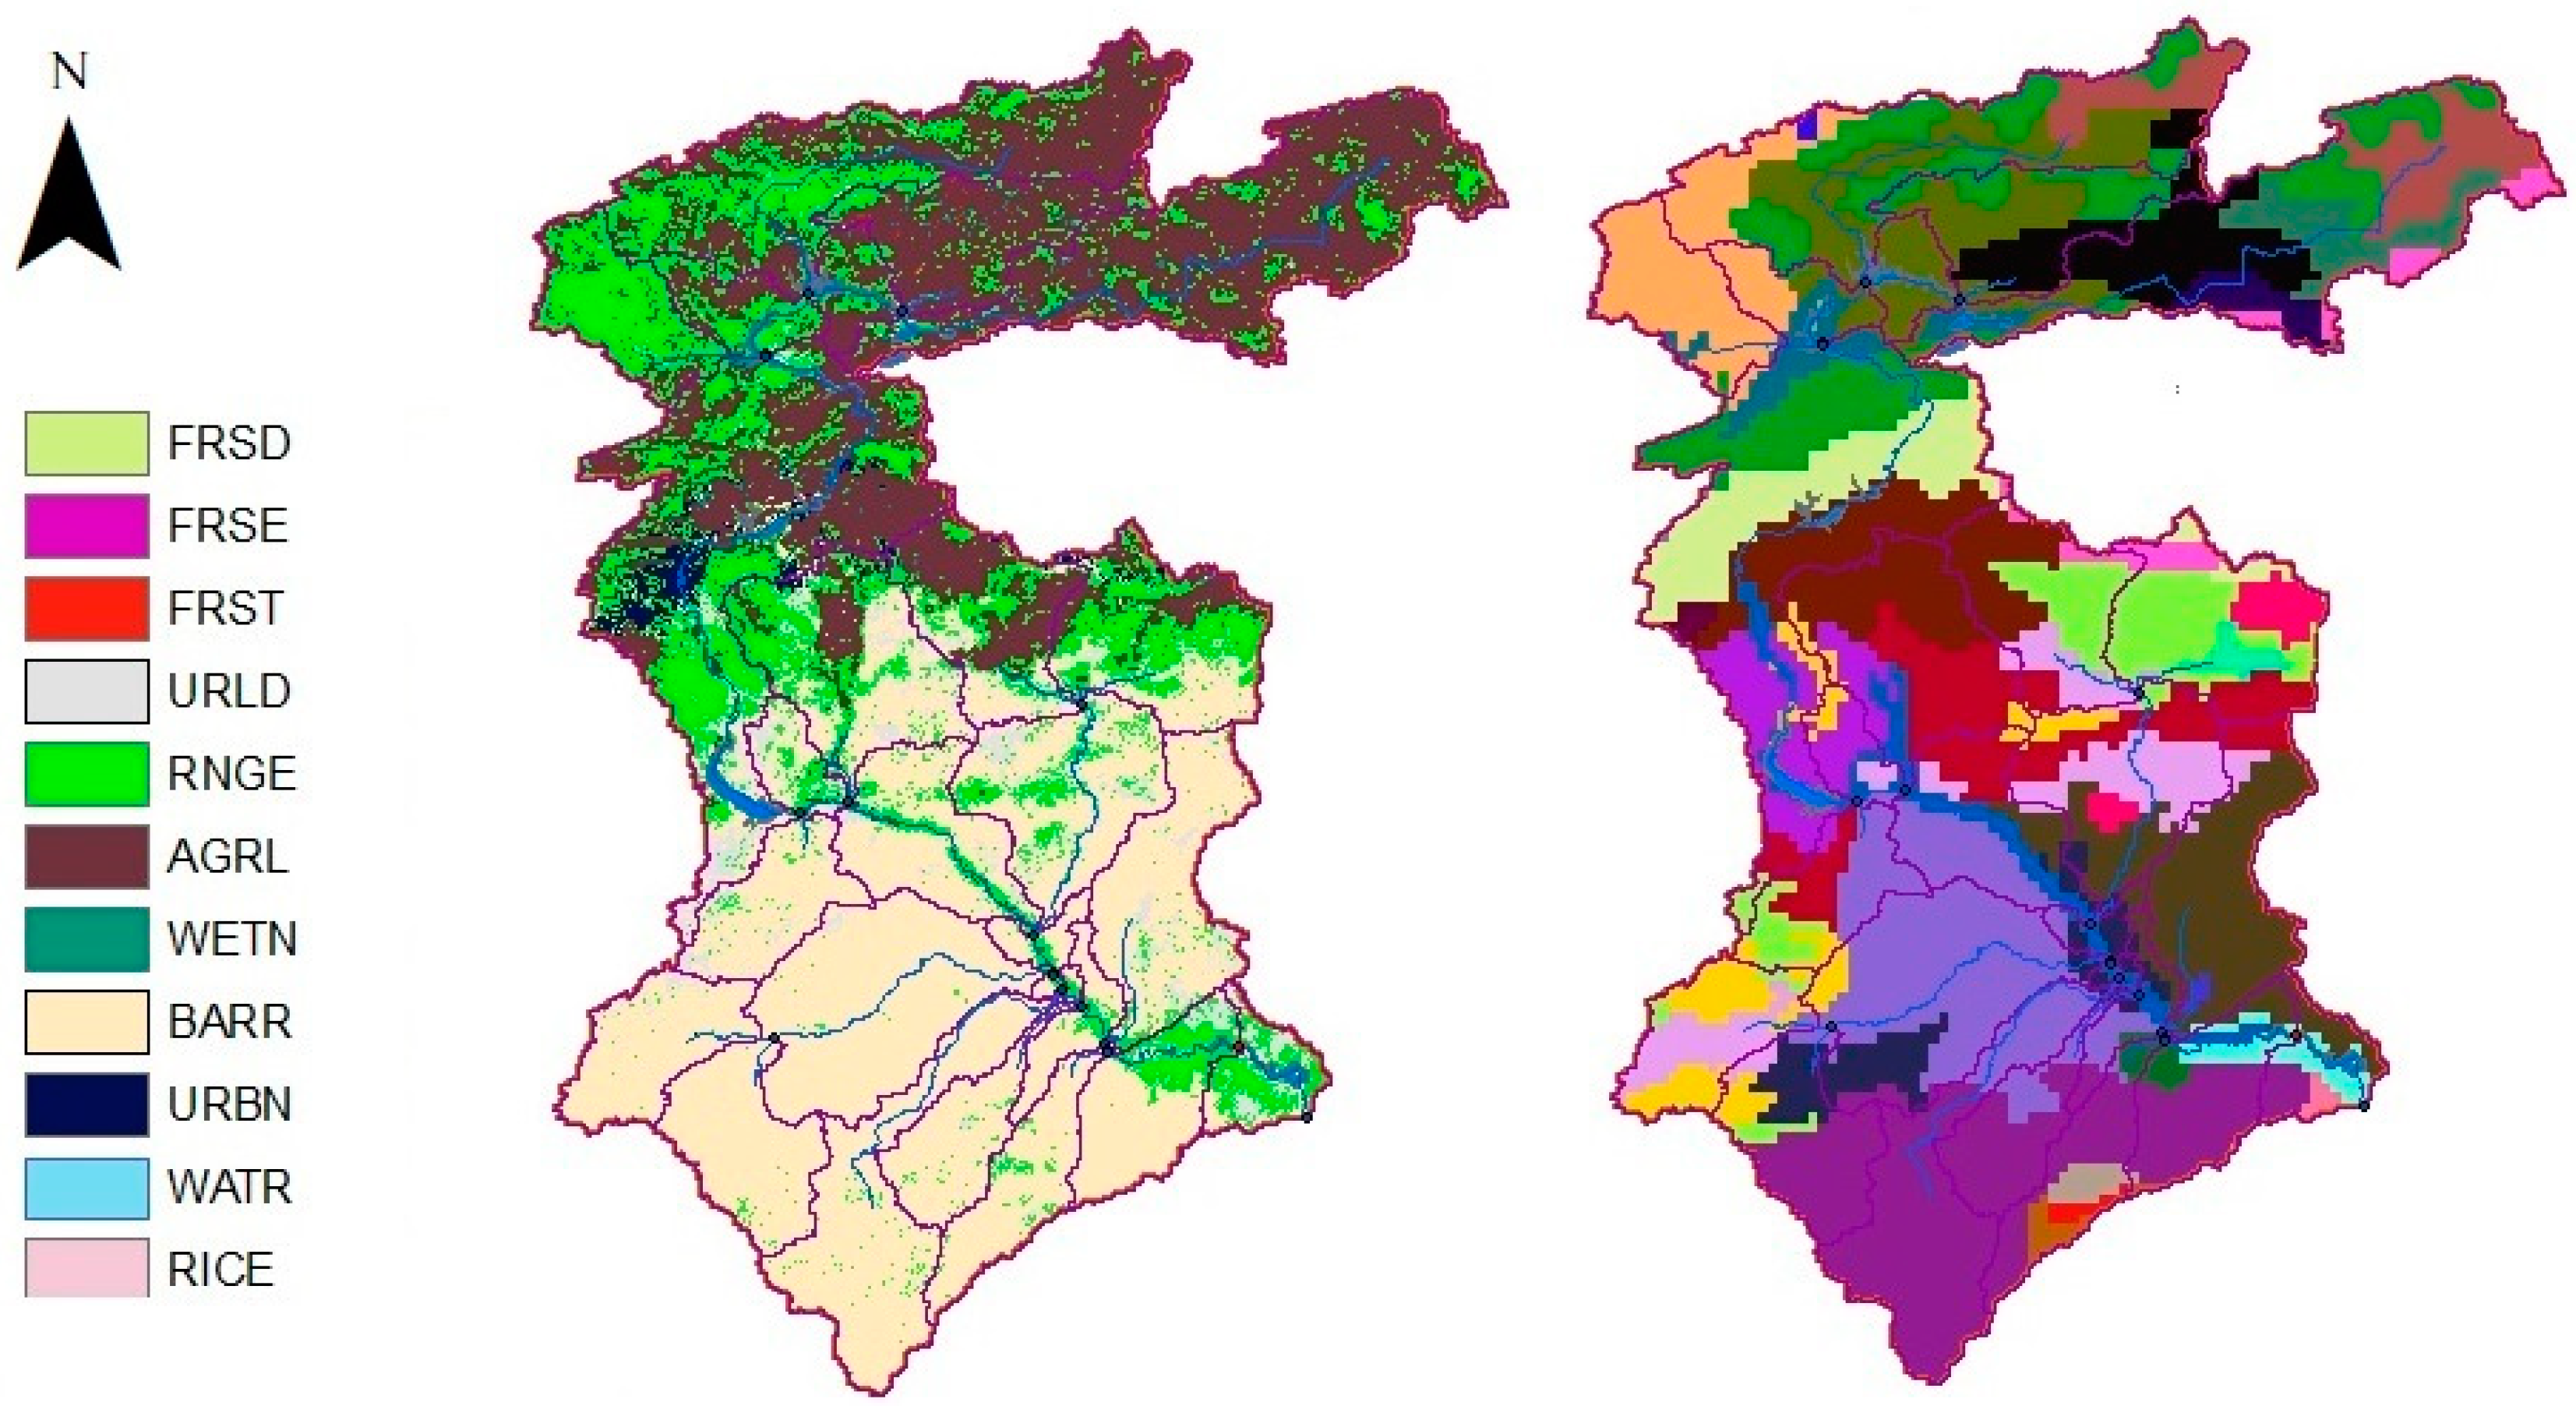
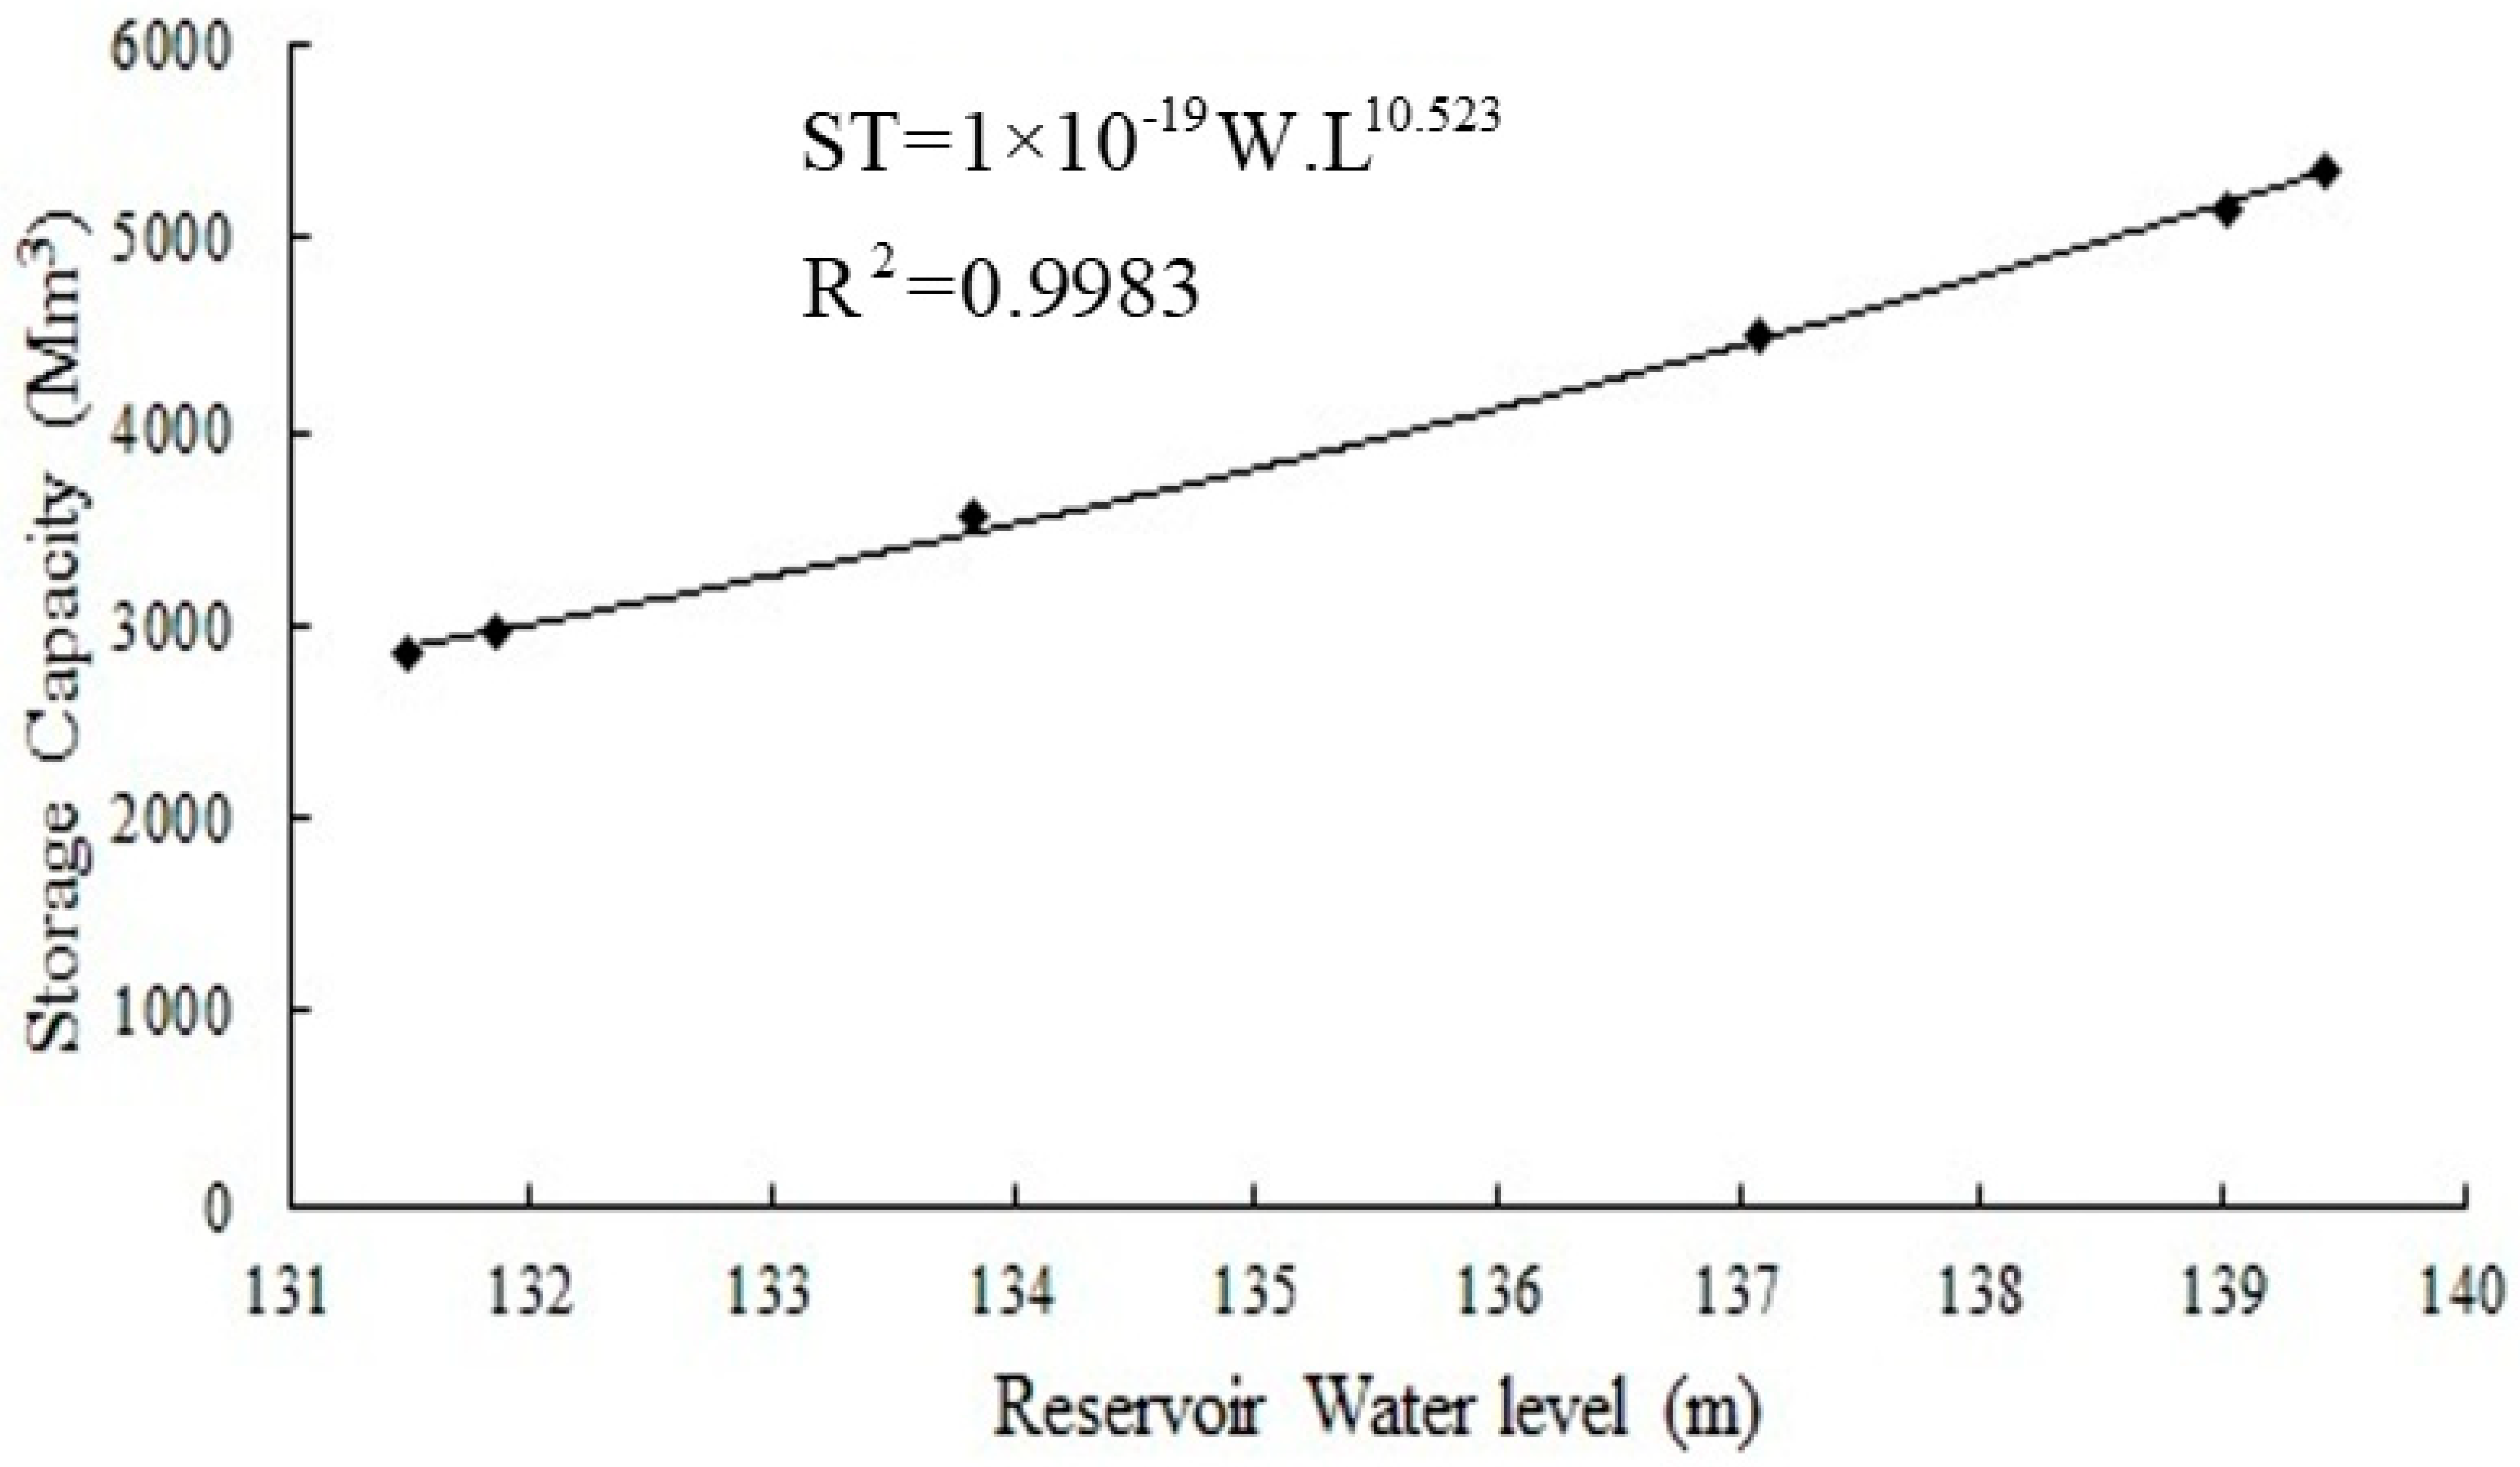
Multiple spatiotemporal data sets (i.e., ground elevations, soil type, land use, and hydroclimate data) were first collected from different sources and used in the SWAT model for simulation. Figure 2 represents the land use and soil type spatial maps for the UERB. As mentioned above, the output from the SWAT model was used in the TEF and evaluated against the actual bathymetric sediment surveys collected for the HR. The quality and quantity of the data used in this study are discussed in this section. Reservoir water levels and the corresponding storage capacities are available from the Ministry of Water Resources (MWR), Iraq (2020) [35]. Some operational data regarding water levels and the corresponding water storage capacities for 1986, 1990, 1995, 2000, and 2003 are shown in Table 1 [35]. A graphical representation of the relationship between water level and reservoir storage capacity is shown in Figure 3. The graph illustrates a strong correlation between the water level and the storage capacity of the reservoir, exhibiting an exponential relationship. This connection is substantiated by a high R2 value, indicating a robust fit between the data points and the fitted line. The observed concentrations of sediment inflow to the HR were obtained from the previous work of Khassaf and Abde Al-Rahman (2005) [36], where sediment inflow concentrations and bed loads were recorded by the MWR on a daily basis for the period of 26 January 2003 to 16 December 2003. The sediment load equations developed by Khassaf and Abde Al-Rahman (2005) [36] are used for calibration and validation purposes. Table 2 shows the names and locations of streamflow gaging stations used for calibrating and validating the SWAT model. The streamflow data at the gaging stations were obtained from the MWR (2020) [35]. In the table, UERBQ_1 and UERBQ_2 refer to the same station, at which discharge and sediment flux were measured. These stations are located just upstream of the HR. For sediment flux measurements, nine river cross-sections (each one km apart) downstream of UERBQ_2 were used [36]. The suspended sediment materials mainly consist of clay and silt, while the bed material is composed of larger sand grains and some small gravel particles with gypsite [36]. The sediment load data was formatted for SWAT model requirements and used for sediment load calibration and validation. The other two stations, UERBQ_3 and UERBQ_4, are located downstream of the Haditha Dam. For streamflow calibration and validation, the study domain was extended to include more observed streamflow data for better estimation of parameters in the SWAT model.
The APHRODITE (Asian Precipitation–Highly Resolved Observational Data Integration Towards Evaluation) precipitation data product was developed by Yatagai et al. (2012) [37]. APHRODITE is a gridded precipitation data product interpolated from rain gauges and is available for various regions in Asia, including the Himalayas, Southeast Asia, and the mountainous areas of the Middle East, for the period of 1951–2007. In this study, the precipitation data for the entire TRB domain was obtained from the APHRODITE product with a spatial resolution of 0.25°.
Landcover and land use data used in the SWAT model were derived from maps provided by the European Commission Joint Research Center for Central Asia for the year 2000 [38]. A soil map of the study area was obtained from the Food and Agricultural Organization of the United Nations. A Digital Elevation Model (DEM) of 30 m resolution was acquired from the Shuttle Radar Topography Mission (SRTM) and used to delineate the watershed. The sources for all meteorological inputs, except for precipitation, (i.e., temperature, wind, humidity, solar radiation) were the National Centers for Environmental Prediction (NCEP) and the Climate Forecast System Reanalysis (CFSR) data sets [39,40]. This data source provides multi-layer, gridded atmospheric data globally, assimilated from different sources, including models, satellite data, and reanalysis data. The data include daily records from 1979 onward and have been updated for the current climate conditions.
The hydroclimate data (i.e., precipitation, streamflow, wind speed, minimum and maximum temperature) were checked for continuity and consistency before analysis. Gaps in data were eliminated using several techniques, such as interpolation and the calculation of arithmetic means to fill in the missing data. Missing precipitation, wind speed, and temperature data at each grid location were filled in using the Kriging interpolation method, which has been successfully used for such data [41,42]. Measured streamflow records were also examined for any missing data, and the missing values were filled by averaging the two preceding and following data points. Missing sediment data from the lone gaging station were estimated using an empirical formula specifically developed for the reservoir using dimensional analysis [36]. This formula was developed based on the measured amount of sediment loads entering the HR for the period mentioned above and is given by Equation (1), in which C is the total sediment concentration in ppm by weight, V is the average flow velocity (m/s), u * is the bed shear velocity (m/s), R h is the hydraulic radius (m), w is the average fall velocity of sediment particles (m/s), d 50 is the median grain size (m), ν is the kinematic viscosity in m2/s, and B is the width of channel at the water surface (m).
C = 55.1 V u * + 10164.1 R h B + ν w d 50 449.3

4. Methodology

To achieve the stated research objectives, this section first describes the steps that were necessary to build, calibrate, and validate the SWAT model for both streamflow and sediment. Then, it discusses using the SWAT model’s total sediment outputs to estimate the sediment accumulation and life span of the HR using the TEF.

4.1. SWAT Model Setup and Calibration

The UERB watershed was delineated using a Digital Elevation Model (DEM) raster map. Sinks, drainage networks, flow direction, and flow accumulation maps were automatically processed in ArcSWAT 2012. Next, the soil, land use, and land slope maps were used by the SWAT model to define HRUs. The output from this step was an HRU map. The SWAT model calculated evapotranspiration, runoff, and other hydrologic variables for each HRU. After the HRUs were defined, the climate data, which is the main driver for the model, was imported to ArcSWAT. The model was run for the period of 1986–2007 on both a daily and a monthly time scale (as more streamflow records are available on a monthly scale). The first ten years were used as a warm-up period to generate runoff and streamflow so as to reach model equilibrium. The SUFI-2 algorithm, a component of the SWAT-CUP package, was used to conduct parameter sensitivity analysis, which saved time during the calibration period [43]. The most sensitive parameter ranges, related to streamflow and sediment transport, were adjusted in the calibration process, and the resulting streamflow and sediment transport parameters were evaluated against their corresponding observed values. The calibration of streamflow was conducted first, followed by sediment transport calibration. Table 3 provides an overview of the parameters used for the calibration analysis with their units and final ranges. These parameters were selected based on similar studies that used monthly and daily flow data for calibrating SWAT models [21,44,45].

4.2. Trap Efficiency and Sediment Accumulation

The procedure used for estimating the remaining capacity of the reservoir after t years of operation and the sediment accumulated in the reservoir is presented in this section. The annual sediment inflow to the HR was estimated from the calibrated SWAT model and used in the TEF for estimating sediment accumulation and the remaining capacity of the reservoir. Except total sediment loads, all other parameters for the TEF necessary for estimating the remaining capacity of the reservoir were obtained either using data from bathymetric surveys carried out in the reservoir in the years 1986, 1990, 1995, 2000, and 2003 or from the literature. To estimate accumulated sediments in the reservoir over time, the storage capacities of the reservoir at the different water levels and years were compared to that of 1986. Based on this analysis, the comparison between accumulated sediment volumes deposited in different surveys was obtained, enabling the calculation of the remaining capacity of the reservoir.

4.3. SWAT Hydrologic Model

SWAT is a long-term, lumped, continuous, watershed-scale, hydrological and water quality model developed by the USDA-Agriculture Research Services (USDA-ARS). The main purpose of the SWAT model is to assess the impact of different management practices on surface water, sediment, and agriculture chemicals yields on a subbasin scale [23]. The watershed area is partitioned into subbasins that are then further divided into unique combinations using land use, soil, and slope, known as HRUs [46]. The SWAT model’s surface water calculation is based on a water balance equation (Dalton, 1806) [47] given by Equation (2). In this equation, S W t is the soil water content at time t , S W o is the initial soil water content, R is precipitation, Q is runoff, E T is evapotranspiration, P is percolation, and Q R is the return flow. All variables are measured in mm and t represents time in day.
S W t = S W o + t = 1 n ( R Q E P Q R )
The SWAT model estimates the combination of surface water and infiltration using either the Soil Conservation Service method (used in this study) or the Green-Apt infiltration method [48]. The methods of Penman-Monteith (used in this study), Priestley-Taylor, or Hargreaves are commonly used for estimating evapotranspiration. SWAT simulates snow as an equivalent water depth because the snow is packed with different densities. The precipitation within an HRU is classified as snow if the mean air temperature drops below the threshold temperature for snow melt, which is determined through calibration [49]. The groundwater component in the SWAT model is represented by two components—shallow acquifer and deep aquifer—where the shallow aquifer receives water percolated from the upper unsaturated soil profile with a delay estimated via the delay exponential function. The SWAT model relies significantly on groundwater components because they control baseflow, which in turn affects streamflow as well as reservoir storage levels. In addition, they help in capturing the interactions between surface water and groundwater, providing a fuller understanding of the water and sediment dynamics within the watershed. Only a fraction of the infiltrated water is allowed to move to the deep aquifer and eventually out of the system [23]. The surface water generated by SWAT enters the channel network. The flow routing within the channel network is achieved in the SWAT model by using either the Muskingum method or the variable storage method (used in this study). Both methods utilize parameters such as reach length, channel geometry, floodplain slope, and channel roughness to estimate outflow at the end of each day [50].
The erosion caused by rainfall and runoff is computed in SWAT model using the Modified Universal Soil Loss Equation (MUSLE) [51], which is a modification of the Universal Soil Loss Equation (USLE). In the MUSLE equation, the sediment yield is predicted as a function of runoff energy, which is itself a function of the anticipated moisture content and rainfall energy. The MUSLE equation is given by Equation (3), where s e d is the sediment yield on a given day (metric tons), Q s u r f is the surface runoff volume (mm of water/ha), K U S L E , C U S L E , P U S L E , L S U S L E are the USLE soil erodibility, cover management, support practice, and topographic factors, respectively, q p e a k is the peak runoff rate (m3/s), a r e a h r u is the area of the HRU (ha), and C F R G is the coarse fragment factor. The CFRG is determined by the percentage of rocks present in the topmost soil layer (CFRG = exp(−0.053.rock)). When no rocks are found in this layer, the CFRG value is equal to 1. As the rock content increases, the CFRG value decreases, leading to a reduction in soil erosion. This factor plays a role in assessing the potential for soil loss in a given area.
s e d = 11.8   ( Q s u r f q p e a k a r e a h r u ) 0.56   K U S L E   C U S L E   P U S L E   L S U S L E   C F R G

4.4. The Trap Efficiency Function (TEF)

The remaining capacity of a reservoir is expressed as a functional relationship between the incoming sediment, stream inflow, and the trap efficiency of a reservoir [18]. The change of storage capacity over time due to sedimentation of a reservoir is given by Equation (4), where V is the volume of water stored after t years of operation in the reservoir at normal retention level, Q s is the sediment inflow to a reservoir in kg/s, t is the time in years, γ is the average density of the deposit material in kg/m3 ( γ also varies with time), and η is the trap efficiency of the reservoir (defined as ratio of the sediment retained to the total incoming sediment in the reservoir).
d V d t = η Q s γ
The trap efficiency depends on the inflow rate of sediment and water discharge, the capacity and shape of reservoir, the fall velocity of sediment particles, and the manner in which reservoir operations are conducted. Since the major cause of storage capacity loss is sediment deposition, the monitoring program can determine depletion caused by sediment deposition since the closure of the storage dam. The trap efficiency is given by Equation (5), where β is the sedimentation factor and I is the annual inflow of water to the reservoir. The sedimentation factor reflects the decay of the storage capacity of the reservoir due to the ongoing sedimentation process. Substituting Equation (5) into Equation (4) yields Equation (6):
η = e β I V
d V d t = e β I V Q s γ
Expanding the exponential term and integrating Equation (6), while neglecting the higher order terms and evaluating the integration constant with the assumed original reservoir capacity V o at t = 0 , and substituting γ = γ 1 t n to simplify the integration process, results in Equation (7). This equation provides the general relationship for predicting the capacity of the reservoir after t years of operation:
V o V + β l n V o V β 2 I 2 2 ( 1 V o 1 V ) β 3 I 3 12 ( 1 V o 2 1 V 2 ) = Q s t ( 1 n ) γ 1 ( 1 n )
The list below shows some of the main experimental and empirical values of the hydrologic variables and some parameters used in the TEF, along with their sources.
  • The appropriate mean sedimentation factor, β , is 0.00688 [8].
  • The values of g a m m a 1 and k for the inflow sediment mixture are estimated to be 1100 kg/m3 and 0.85, respectively [52].
  • Gill’s number, n , was obtained from Equation (8), discussed later.
  • Equation (7) is solved by trial and error to determine the remaining capacity of the reservoir V after t years of operation, noting that V o is the original volume of the reservoir.
  • The sediment accumulated in the reservoir is calculated as the difference between base line capacity ( V o ) and the computed capacity ( V ) at the specified levels during the specific survey.
  • The average d 50 , measured at nine cross sections of the Euphrates River upstream of the HR, is estimated to be 0.23 mm [36].
The required inputs are the following: (1) initial volume of the reservoir at normal retention level, V o (m3); (2) volume stored after t years of operation in the reservoir at normal retention level, V (m3); (3) the annual inflow of water to the reservoir I (m3); (4) the annual inflow of sediment to the reservoir, Q s , (kg); (5) initial density of the deposited sediment after first year of operation, γ (kg/m3); and (6) appropriate value for the sedimentation factor, β . The turbulence strength and the convection strength of the flow tend to decrease the trap efficiency and may impact the sedimentation factor [18]. The value of n (known as Gill’s number) is given by Equation (8), where k is the compaction factor and γ 1 is the density of deposited sediment at the end of the first year:
n = 0.5 l o g ( 1 + 2 k γ 1 )

5. Results and Discussion

5.1. Calibration and Uncertainties in SWAT Model Outputs

The SWAT model was calibrated for the period of 1986–1997 and validated for the period of 1998–2007 at four streamflow stations located in the UERB. A global sensitivity analysis was performed using SWAT-CUP to find out the optimal values for the candidate parameters in the SWAT model. The most sensitive parameters identified in the sensitivity analysis step were adjusted via the SUFI-2 algorithm to optimize the final values and reduce uncertainties in the simulated streamflows. The rankings of the eleven most sensitive streamflow parameters, determined by their p-values and t-statistics, along with their final values after calibration are shown in Table 3. The t-statistics and the p-value are two parameters that measure the level of sensitivity and its significance, respectively. Results from this table show that parameters related to groundwater and surface runoff, such as the threshold depth of water in the shallow aquifer for the return flow to occur (GWQMN) and the Curve Number (CN2), were the most sensitive parameters. The calibrated model was run to produce streamflow, sediment outputs, and the final set of parameters for validating the flow and sediment data.

5.2. Simulation of Streamflow and Sediment Inflow

Monthly streamflow simulations were carried out first at three gauges because of the availability of the actual water discharge data at those locations. The model was also calibrated for one additional streamflow and sediment transport dataset based on the daily records. The simulated monthly discharges showed a good match with the measured data during both calibration and validation. This goodness-of-fit is demonstrated in terms of the p-factor, r-factor, R2, and NSE, and is presented in Table 4. The two statistical criteria of p-factor and r-factor are used to quantify uncertainties in simulated results (expressed as the lower and upper bands of the 95% Prediction Probability Uncertainty (95PPU)), while R2 and NSE quantify the model streamflow and sediment performance compared to the actual data. The NSE metric categorizes model performance into three groups [53]. According to Cardoso de Salis et al. (2019) [54], a model is considered to have performed very good with NSE values between 0.75 and 1.0, good with NSE values between 0.65 and 0.75, and fair with NSE values between 0.5 and 0.65. A model performance with NSE values less than 0.5 is considered inadequate. The coefficient of determination, or the R2 value, can be classified into three main ranges to assess model performance. When R2 is near 1.0, it signifies an exceptional model fit with strong explanatory capabilities. R2 values ranging from 0.5 to 1.0 indicate moderate to good fit, while those below 0.5 suggest poor fit and limited explanatory abilities.
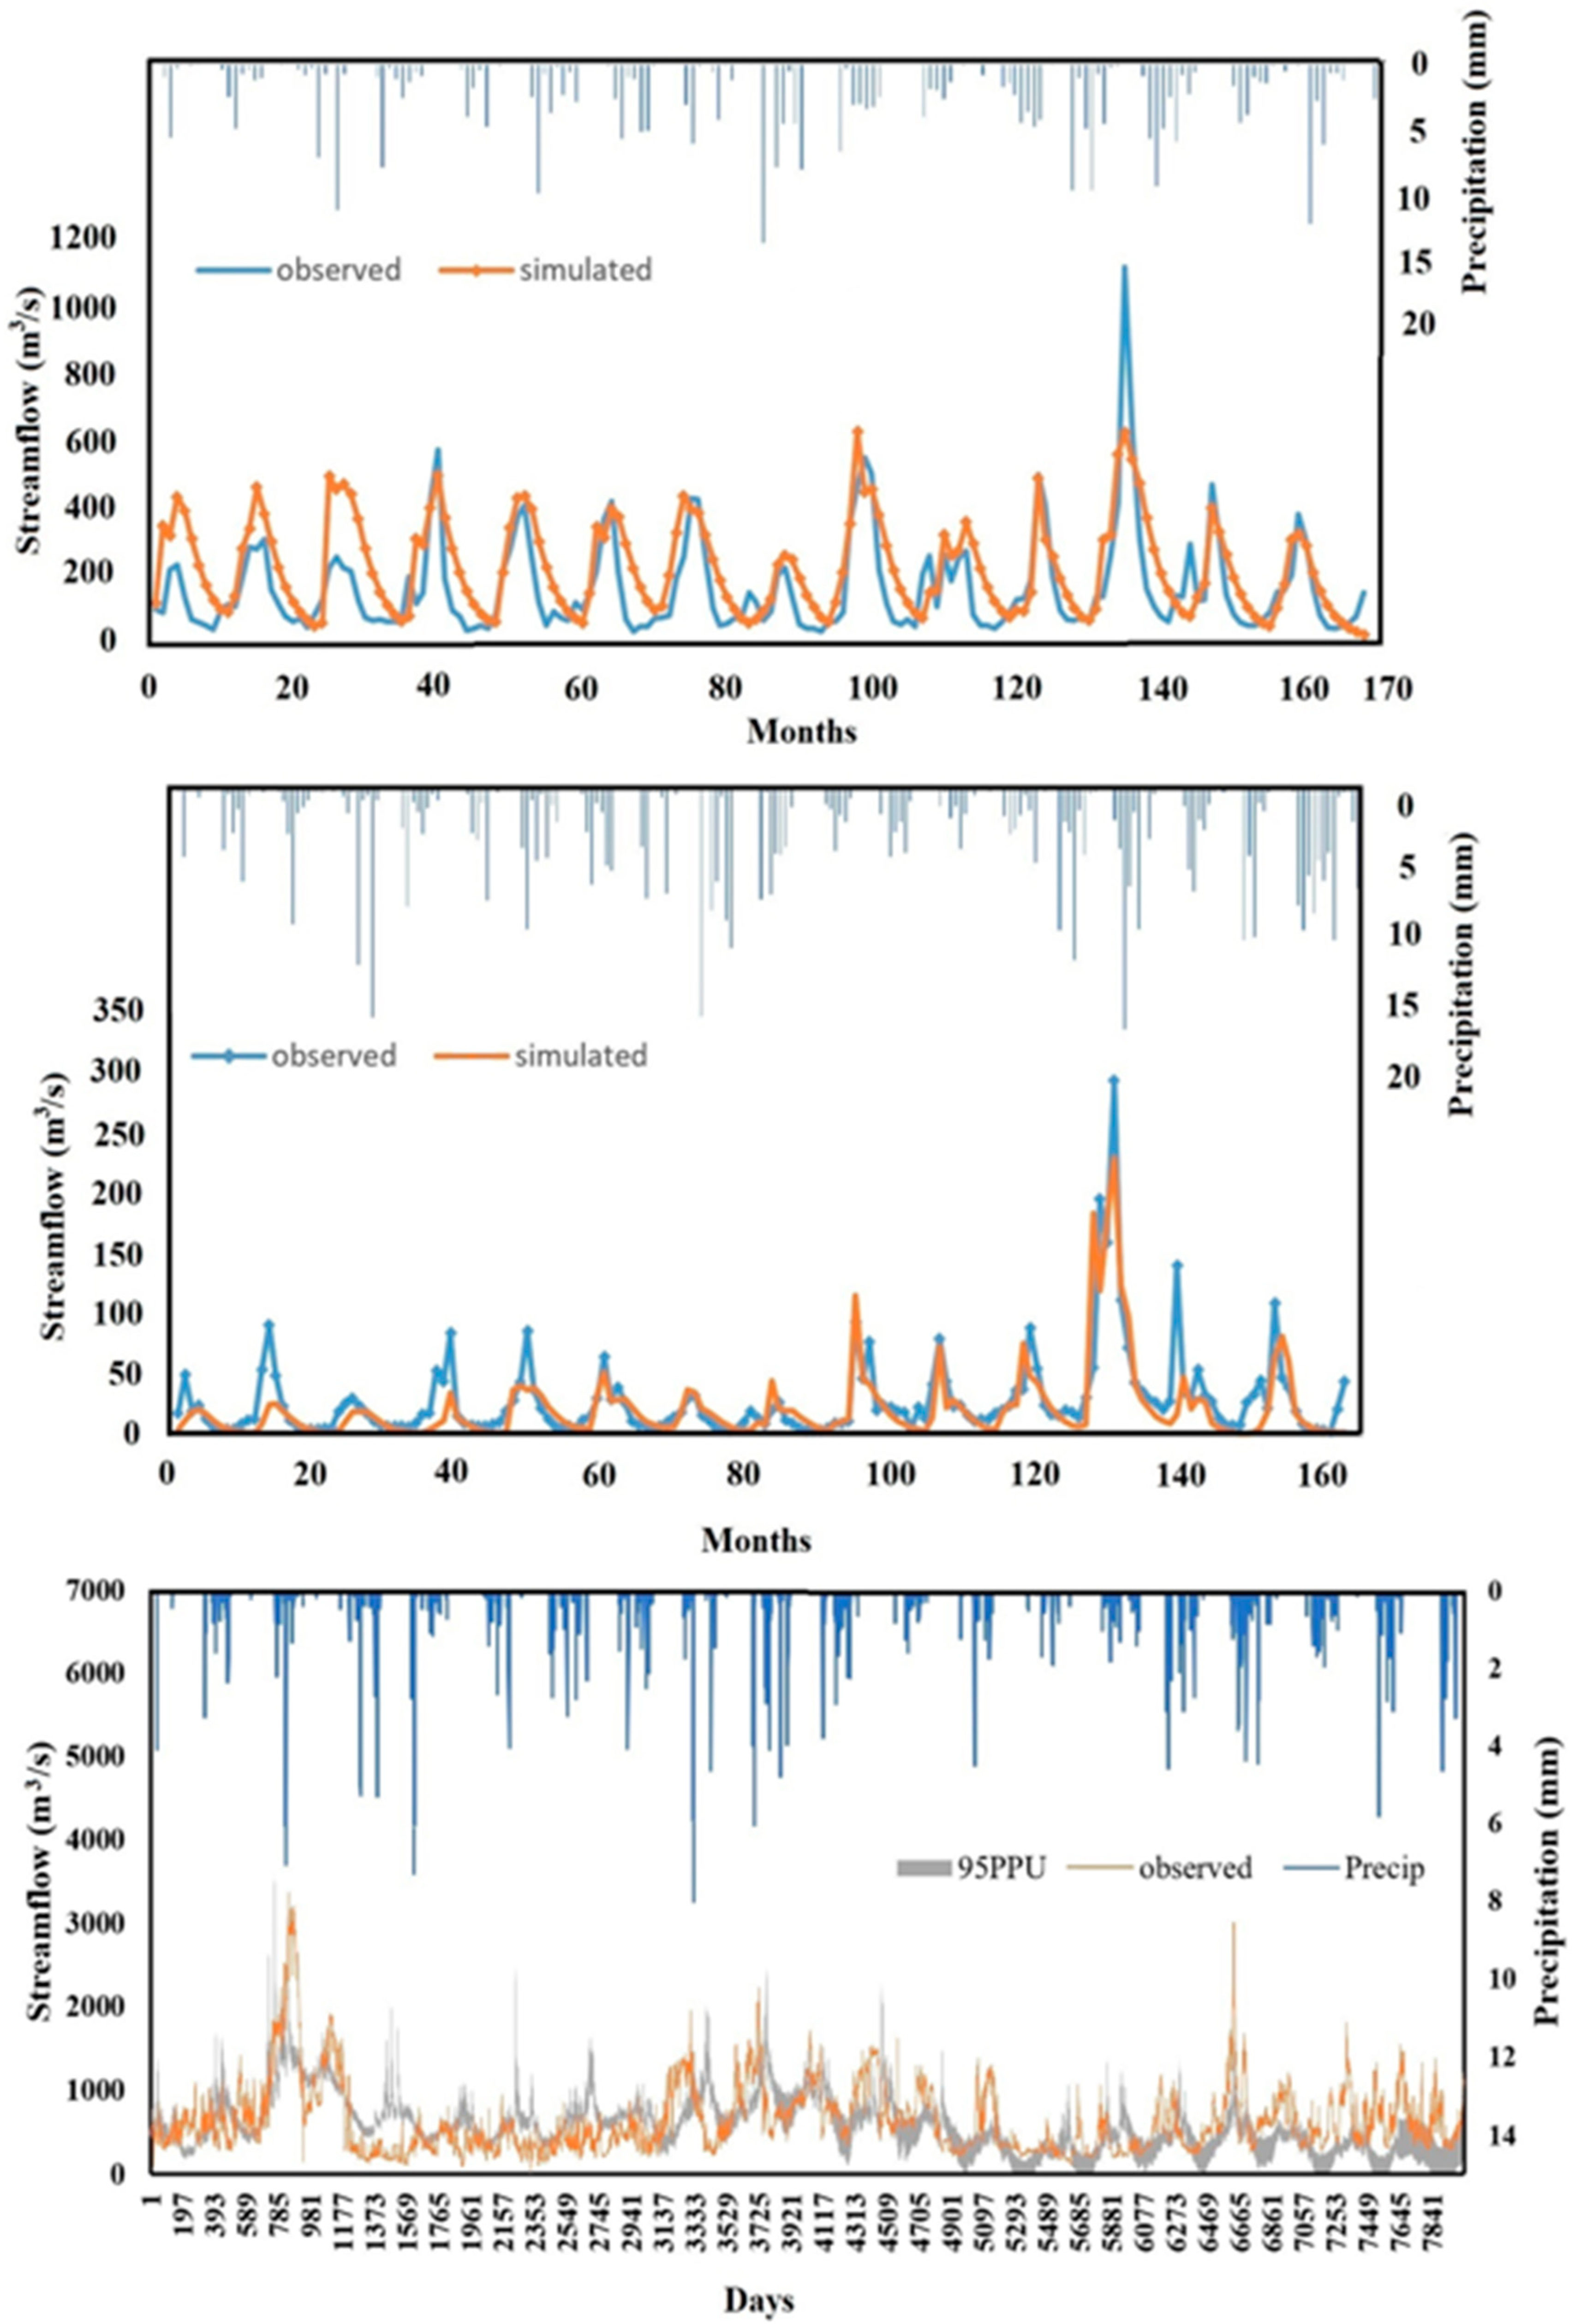
Overall, the simulations indicate a good agreement between simulated and observed values of monthly and daily flow and sediment, as R2 ranges from 0.39 to 0.64 for streamflow and from 0.34 to 0.37 for sediment. These statistics match with the SWAT model-based flow and sediment transport results for other similar watersheds [43,45,55]. The efficiency of the model, measured by the upper and the lower bands of model simulation, was also satisfactory, with p-factor and r-factor values close to 0.5. The performance of the SWAT model was better during calibration than the validation phase for all four locations. In addition, the model’s predictive ability was higher on a monthly than on a daily time scale, which was also reported by Arnold et al. (2012) [56]. This suggests that the results based on the daily scale are subject to higher levels of variability. The calibration and validation performance for the daily sediment loads from different subbasins to the reservoir was less than the daily streamflow simulation. The calibration and validation results for UERBQ_3 had low NSE values (less than 0.5); although the R2 values were satisfactory. This gage station is located immediately downstream of the dam and is directly impacted by the dam’s operation. As such, accurate operational data for the dam is necessary, but which is not available. This has also been reported by Chawanda et al. (2024) [57], where lack of dam operational data resulted in poor predictions for the stations immediately downstream of the dams. For the sediment influx study the UERBQ_2 station data was used, which are based on the monthly streamflow data and have satisfactory NSE and R2 values.
Figure 4 compares the observed and simulated monthly and daily streamflow simulated by the SWAT model. It can be noticed that the SWAT model performed more robustly in the case of monthly streamflow than the daily because of its higher variability, as noted in the hydrographs. Also, the fluctuations in daily streamflow happened in a shorter time period, which introduces more complexity when routing these changes in the SWAT model. The simulated peaks were overall under-predicted by the model at all gage stations. This could be due, in part, to underestimating the high rainfall events in the precipitation data. Another possible reason is that APHRODITE precipitation data are available on a coarser grid resolution (0.25°), which may misrepresent the spatial variability in precipitation information at smaller scales [1].
The observed and simulated monthly sediment inflows to the HR throughout 2003 along with the monthly water inflow to the reservoir are shown in Figure 5. Both observed and simulated sediments show a direct relationship with the amounts of water inflow into the reservoir. The quantity of observed sediment supplied to the reservoir by various subbasin units in the UERB ranges from 48,754 tons in May to 1,620,731 tons in February. Comparatively, these values have been well estimated by the SWAT model, with an acceptable accuracy where the relative error for these two months was 6% and 20%, respectively. The SWAT model performed better in estimating the amount of soil eroded from the watershed during dry months than wet months. In addition, since the reservoir is located in a semi-arid climate, sandstorms (not included in this analysis) are considered another source of soil erosion that could lead to the loss of a considerable portion of storage [58]. Other events, such as gully erosion, landslides, and mass wasting, may contribute to sediment influx but are not considered in the SWAT model, which is a shortcoming of the MUSLE model. This shortcoming is also identified in other studies [59,60].
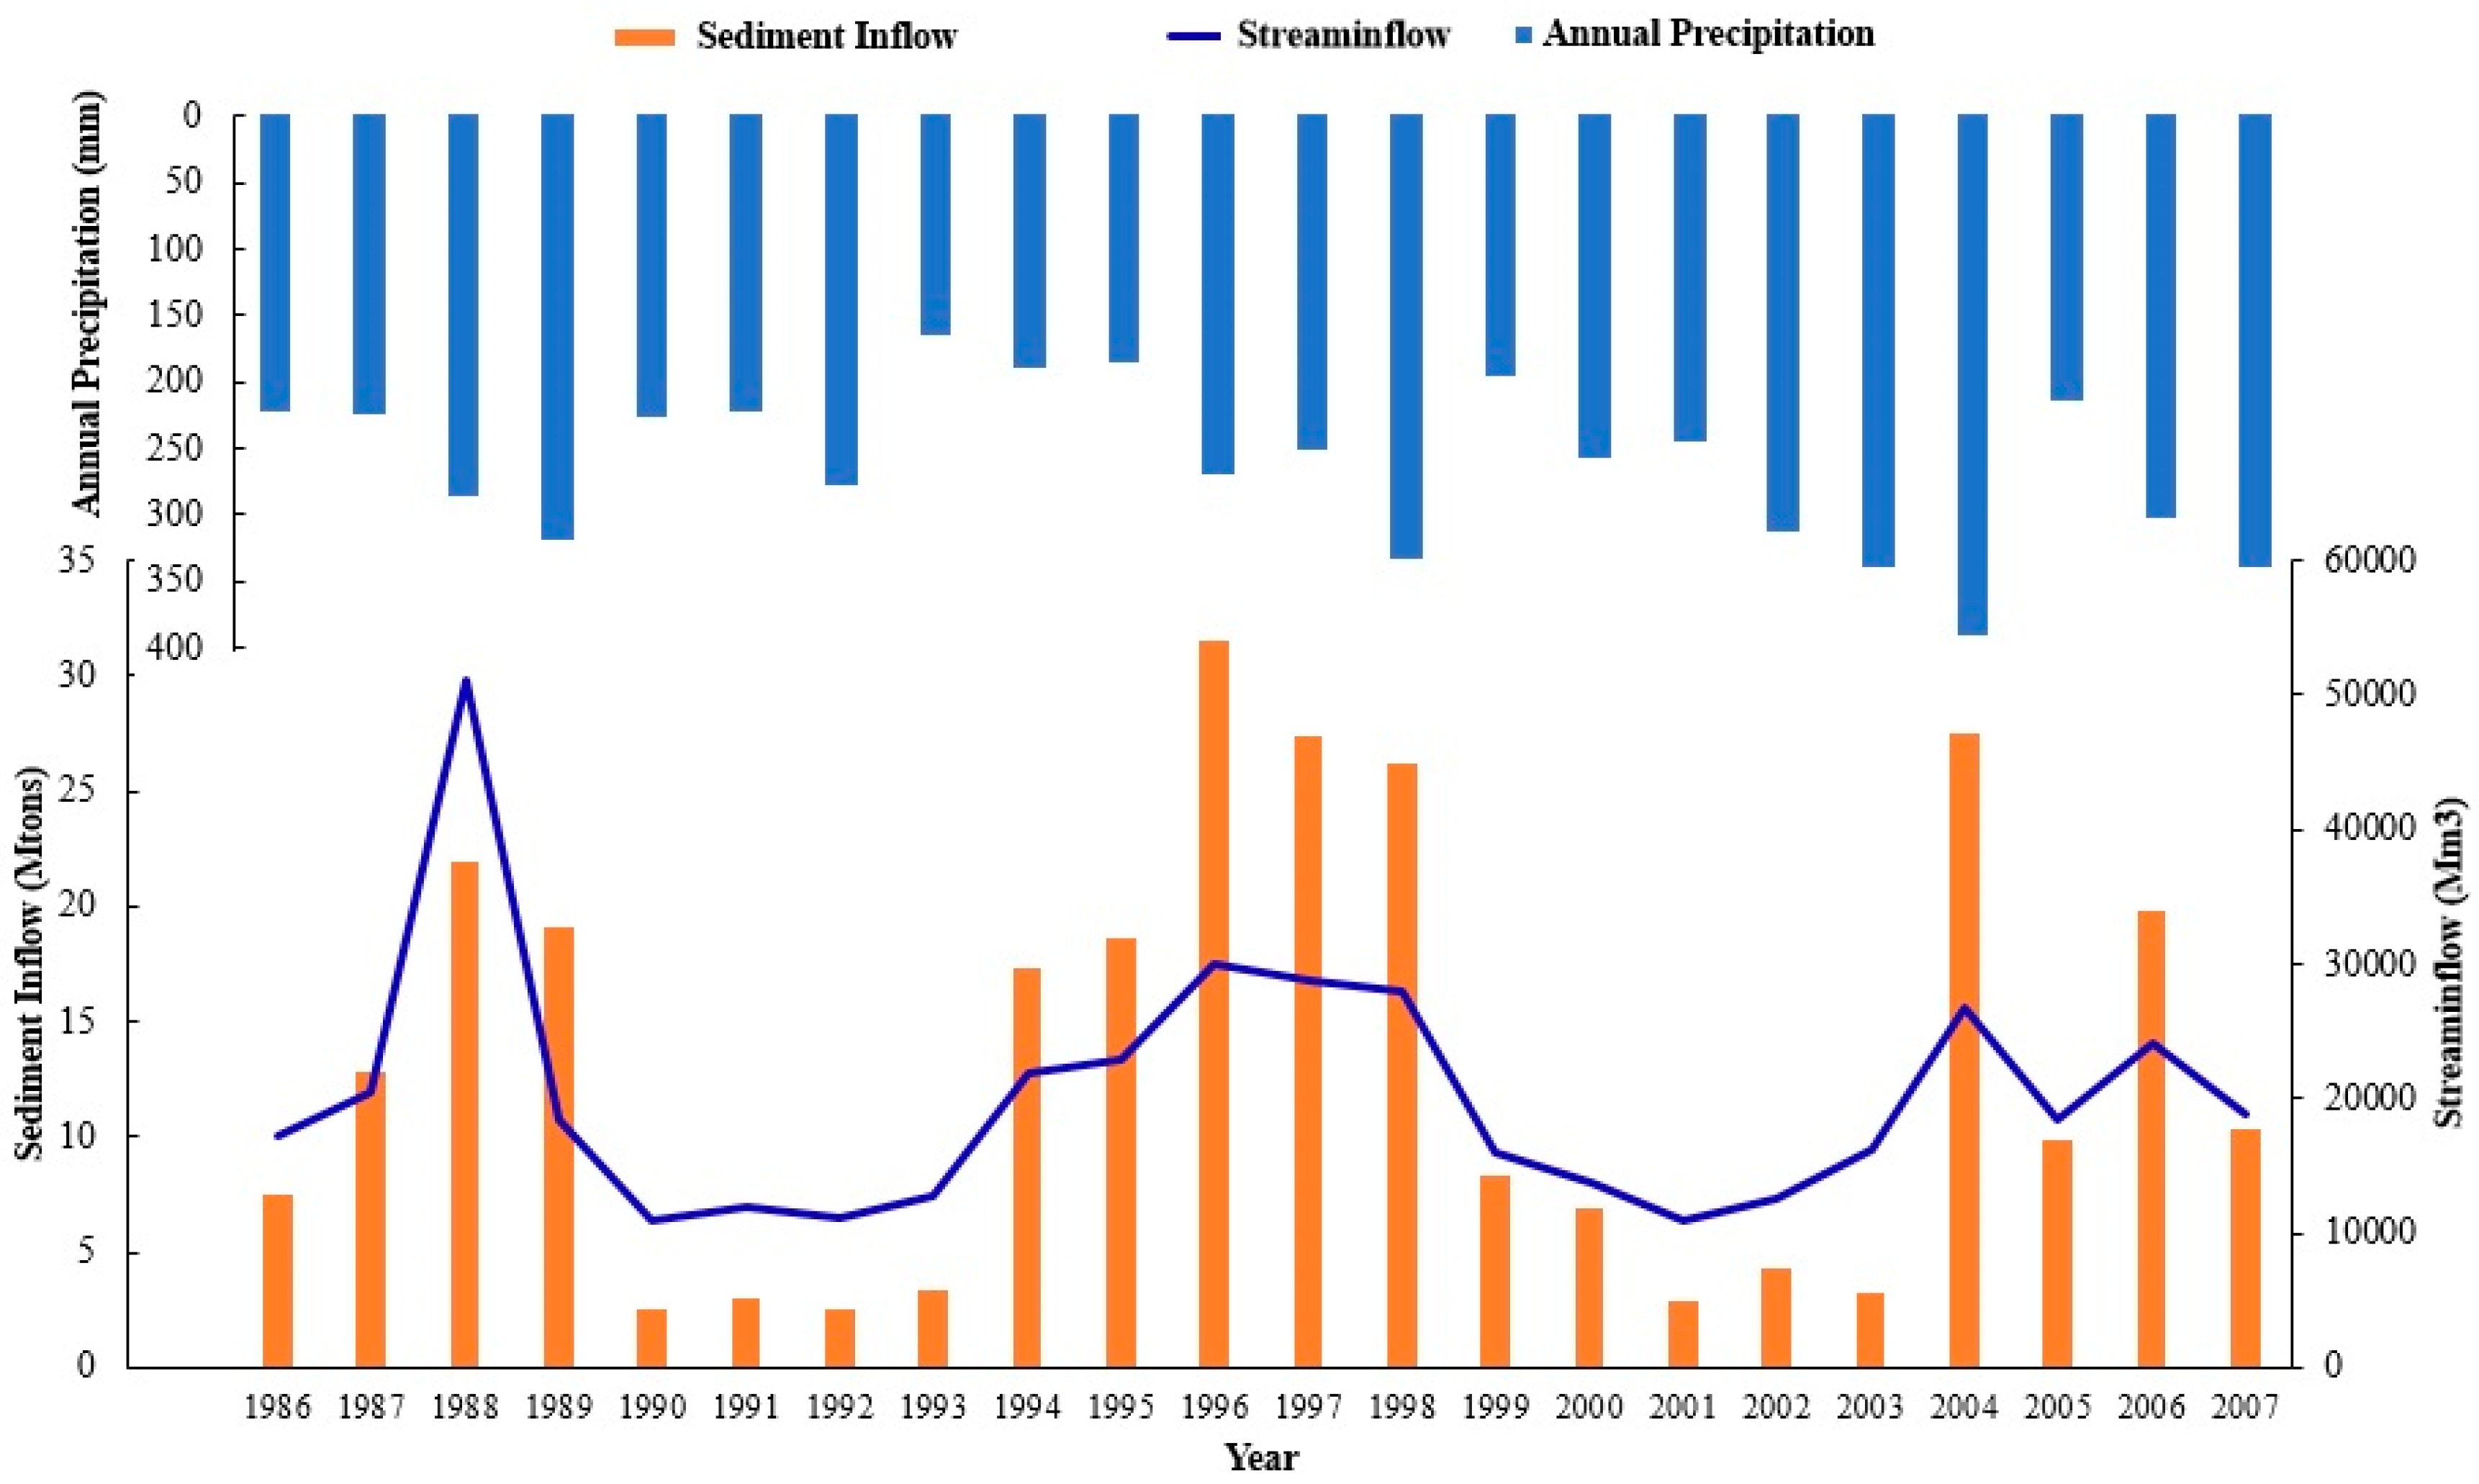
Figure 6 represents the yearly sediment inflow to the HR originating from subbasins and channels upstream of the reservoir. The sediment inflow in the SWAT model during 2003 is 3.2 m-ts, compared to the sediment inflow of 4.93 m-ts calculated by Khassaf and Abde Al-Rahman (2005) [36] based on actual measurements. The result shows that the SWAT model is capable of predicting sediment influx with a more than 65% accuracy. The total simulated sediment inflow to the HR during the entire period of 1986–2007 was 287.18 m-ts. The annual highest sediment inflow rate was registered during the 1996–1998 period and in the year 2004 because of the higher streamflows in these years. Although the stream inflow in the year of 1998 has the highest value, the SWAT model under-predicted the estimated sediment inflow because the precipitation information was underestimated for that year. All other years register moderate to higher rates of sediment inflow to the HR. The overall performance of the SWAT model in estimating sediment inflow to the HR indicates that there are clear relationships between rainfall, runoff, and sediment inflow at the HR inlet based on the 20 years of simulation. The input data quality in the SWAT model, such as regarding precipitation, land use composition, slope, snow properties, and soil type, is one of the main factors affecting model accuracy and uncertainty [43]. Additionally, the lack of actual precipitation data is another main limitation in this watershed, necessitating the use of satellite data as an alternative source of data in hydrologic modeling.

5.3. Sediment Accumulation in HR

Sediment inflow estimated by the SWAT model during the period of 1986–2005, after the construction of the Haditha Dam, is used in the TEF to determine sediments accumulated over time and the life span of the HR. This analysis is performed by including several hydrological variables required for the TEF (e.g., streamflow and sediment inflow to the reservoir). Estimating sediment contents from the TEF also requires the variations of the reservoir storage capacities with their elevations, which are calculated from the bathymetric surveys of the years, 1986, 1990, 1995, 2000, and 2005. Figure 7 shows reductions in reservoir storage capacity at five different operating water levels (Table 1), starting at 112 m (the lowest water level in the reservoir), up to 147 m (the design working water level), and finally to the maximum water level of 150.2 m. In 1986, the initial storage capacity at water level 112 m was established to be 188 million cubic meters, and the loss of capacity for this level was 15% from the initial storage in 2005, while the initial capacity for the water level 147 m was established to be 8200 million cubic meters, with a storage loss for this level of 35% in 2005. This is due to higher sediment rates entering the reservoir at higher water levels and the low turbulence in the reservoir, which tends to increase the trap efficiency.
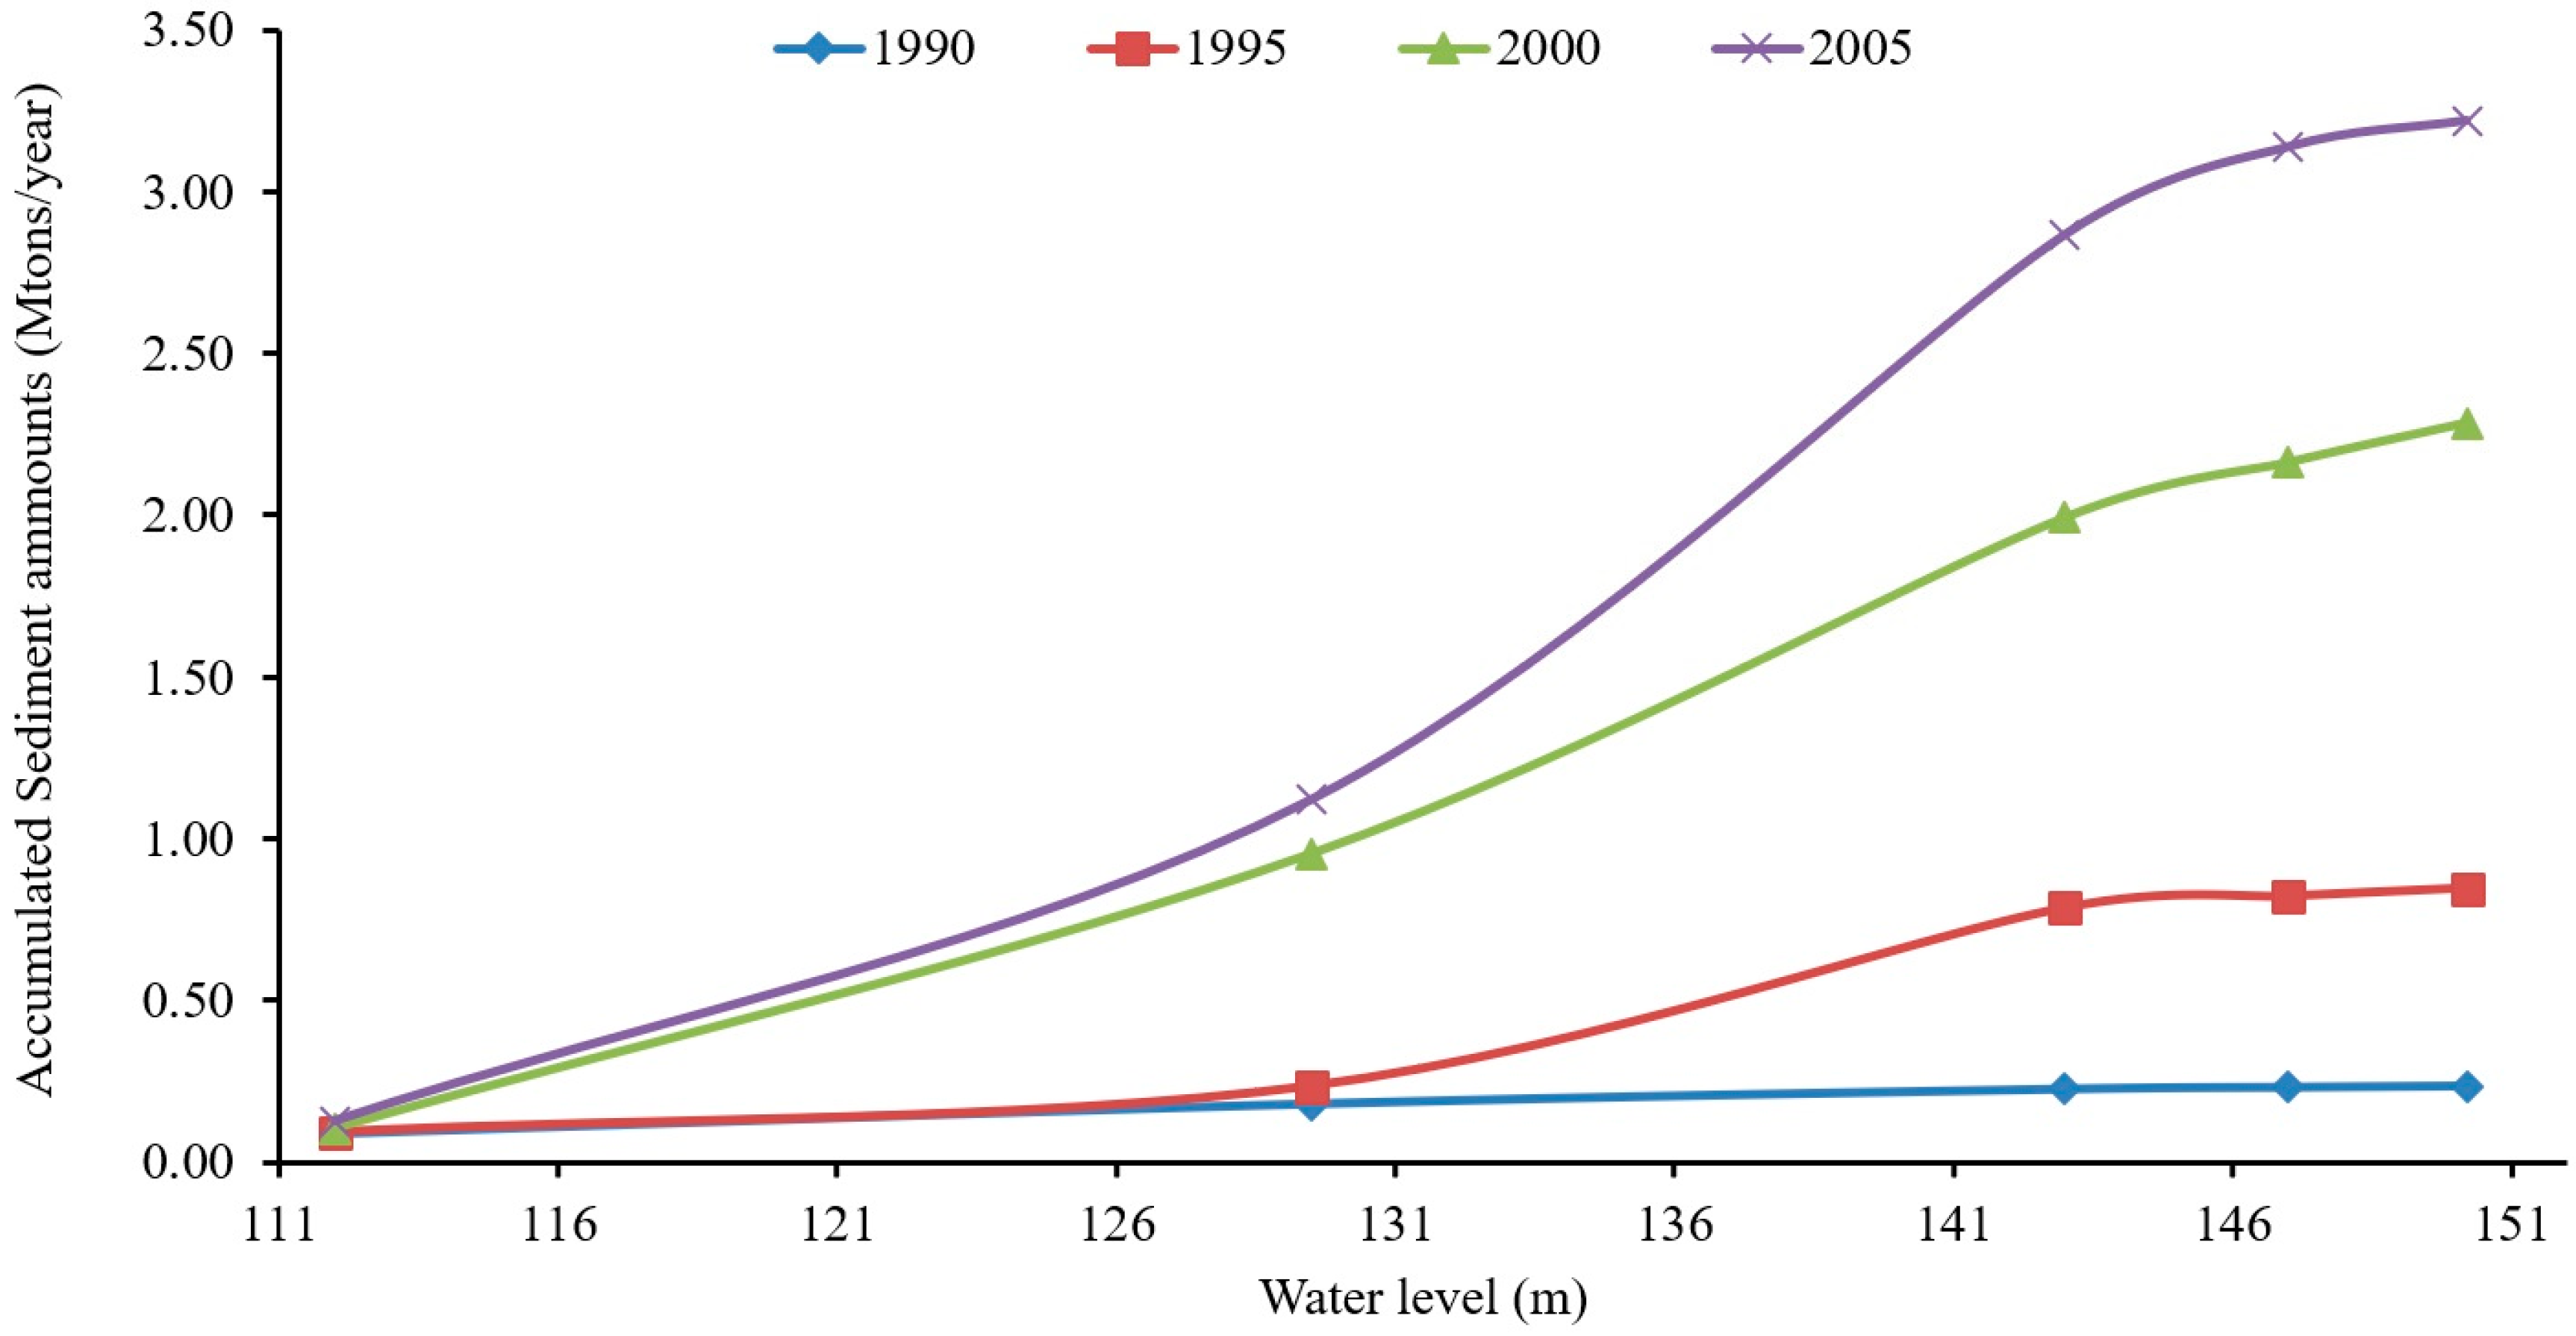
Figure 8 depicts the cumulative amounts of sediment deposited in the HR for different water levels during the years of survey. It is obvious that there is an increase in the sedimentation deposits over time at all water levels. For example, after 19 years of operation (1986–2005), at 147 m water level, the quantity of accumulated sediment deposited in the reservoir is predicted to be 3.20 m-ts, with approximately 0.98 m-ts added during the period between 2000 and 2005. As noted above, a high reservoir water level, causing higher sediment influx and low turbulence in the reservoir, results in a higher trap efficiency.
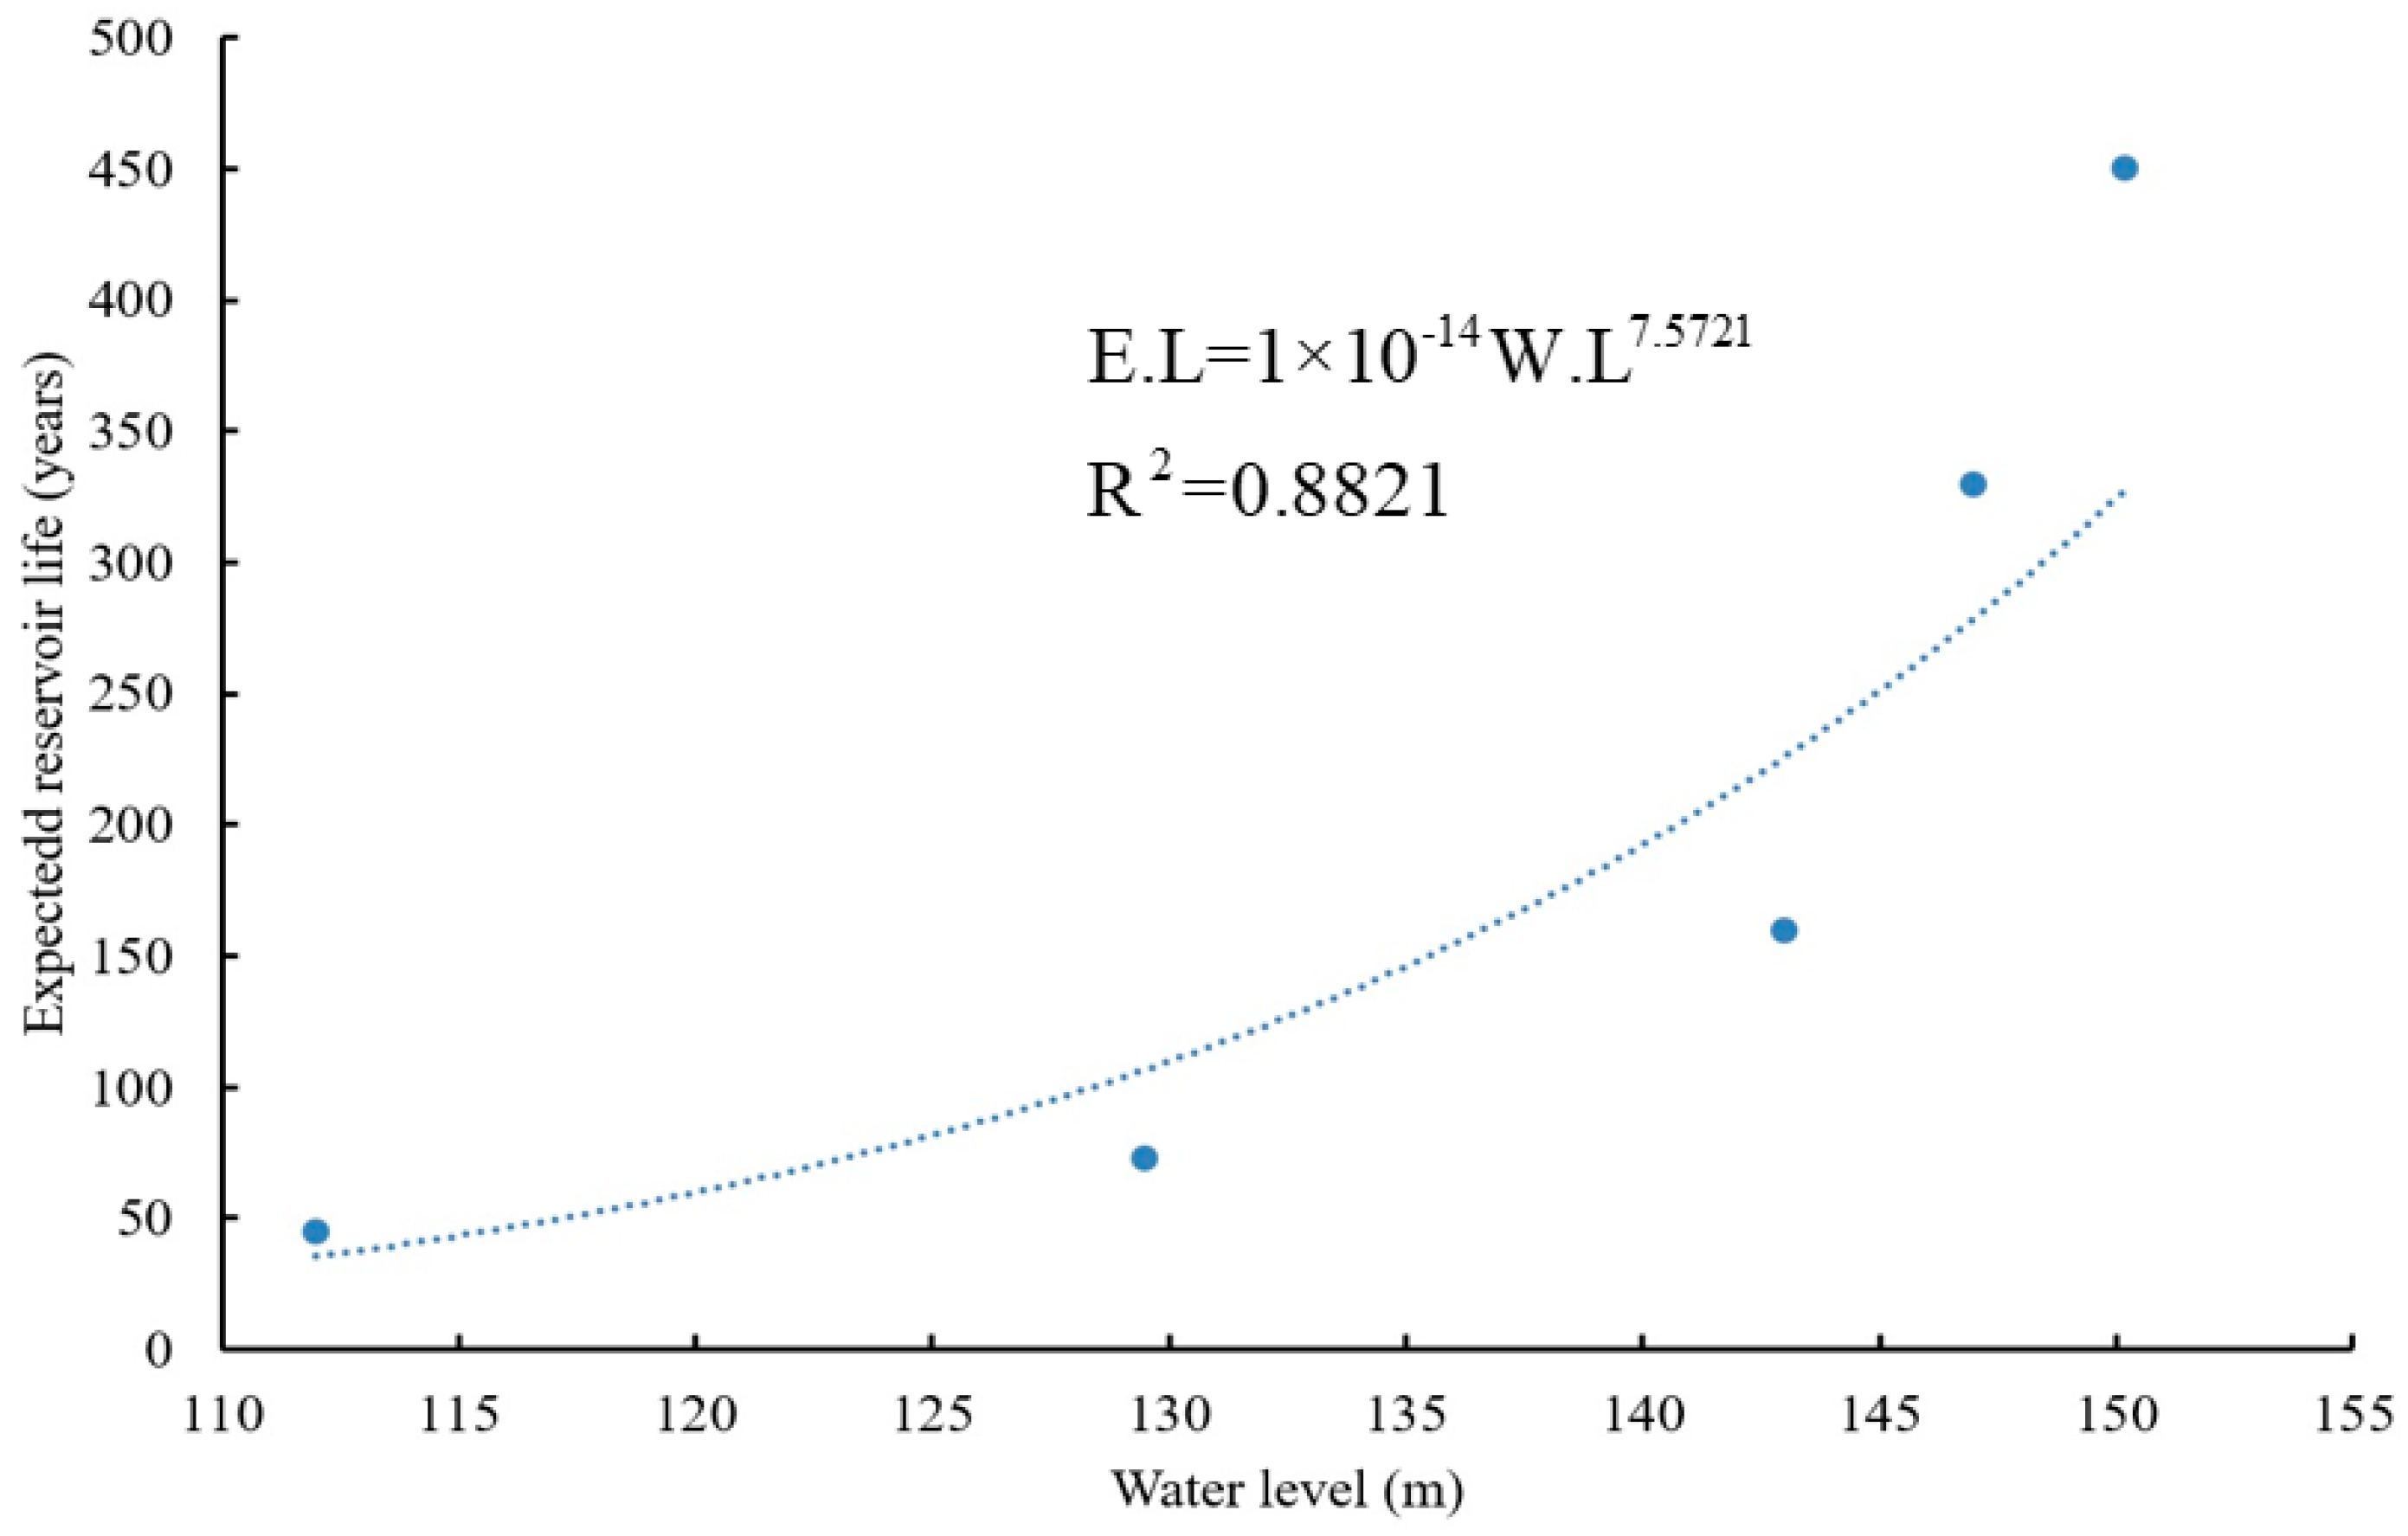
The TEF was also utilized to determine the expected useful life of the HR under the predicted sediment deposition rates. The useful life of the reservoir is defined as the period in which the reservoir can serve the defined purpose. Initial storage capacity depletion of 70% at a given water level is considered as an end of the useful life of the reservoir. Figure 9 demonstrates the expected useful life of the reservoir at different operating water levels. The values in this figure were based on the long-term average sediment and water inflow rates to the reservoir, which were fed to the TEF at each storage capacity associated with a certain water level. Figure 9 shows that the estimated useful life increases with the increase in water level and storage capacity. Based on this study, the useful life of the HR is 73 years at a 129.5 m operation level, and 330 years with the dam operation at an operating water level of 147.0 m. Although the estimations are difficult to verify as this is the only study conducted on the HR, these results are very close in range to previous studies done on reservoirs with similar conditions [15,61,62]. The results regarding the remaining capacity and useful life, estimated based on sediment inflow from the SWAT model simulation and presented in this study, may be implemented in the future for other watersheds with a lack of sediment data.

6. Conclusions

This study evaluates sediment inflow into the Haditha Reservoir using SWAT modeling and TEF calculations to determine sediment buildup and reservoir capacity. Model calibration and validation were conducted across various timeframes. Daily statistical results exhibit less consistency with previous research findings compared to monthly data, as noted by Abbaspour (2015), Mukundan et al. (2010), and Rostamian et al. (2008) [43,45,55]. This discrepancy suggests that daily outcomes are more susceptible to short-term fluctuations. In contrast, monthly results show greater alignment with these studies. The observed difference implies that daily measurements may be influenced by higher levels of variability. Conversely, monthly results tend to reflect more closely the established patterns identified by these previous studies. This distinction highlights the importance of considering the time scale when interpreting statistical data in this field. The following points can be ascertained from the SWAT simulations:
  • Based on the statistical measures adopted, the performance of the SWAT model in predicting streamflows was better during calibration than validation for all three locations.
  • The SWAT model predictive ability was higher on a monthly time scale than a daily time scale.
  • The daily sediment loads during calibration and validation were predicted at lower R2 and NSE values than the daily streamflows.
  • The storage capacity during the period ranging from 1986 to 2005 was continuously decreasing with time for all operating water surface levels in the reservoir. For 1986, the initial storage capacity at water level 112 m was established to be 188 m-m3 and the loss of capacity for this level in 2005 was 15% from the initial storage, while the initial capacity for the 147 m water level was established to be 8200 m-m3, and the storage loss for this level was 35% in 2005.
  • After 19 years of operation (1986–2005) at 147 m water level, it is predicted that the quantity of accumulated sediment deposited in the reservoir is 3.20 m-ts, with about 0.98 m-ts added during the years 2000 to 2005. This suggests an increasing rate of sedimentation over time.
It is recommended that a well-planned program for sediment data collection be established. The characteristics and the movement of sediment in the reservoir should be monitored. The Euphrates River near the Syrian border should be monitored to understand the effect that changes and interventions in the upstream catchment have on the sediment flux in the river. Also, regular bathymetric surveys, monitoring of the sediment accumulation, and reservoir trap efficiency are recommended to assess the effects of the interventions.
This study provides important information on reservoir management by using the SWAT model to predict sediment flux and the trap efficiency function (TEF) to assess reservoir capacity and life. The research can help plan reservoir maintenance and improve water management in dry climates by accurately predicting sediment accumulation and its impact on reservoirs. One of the limitations of the present study is relying solely on basic methods like arithmetic means or interpolated values instead of advanced tools, such as LOADEST for data population, which can result in less precise and dependable estimates. This approach may fail to incorporate sophisticated modeling techniques and error evaluation, potentially missing complex data patterns and trends. Consequently, the resulting analyses may lack the depth and accuracy provided by more advanced estimation tools.

Author Contributions

A.A.A.: formal analysis, investigation, writing—original draft; A.A.K.: writing—review and editing; A.K.M.: writing—review and editing; S.H.A.: review and editing. All authors have read and agreed to the published version of the manuscript.

Funding

This research received no external funding.

Institutional Review Board Statement

Not applicable.

Informed Consent Statement

Not applicable.

Data Availability Statement

Data are available with the corresponding author and available upon request.

Conflicts of Interest

The authors declare no conflicts of interest.

Correction Statement

This article has been republished with a minor correction to the title. This change does not affect the scientific content of the article.

References

  1. Ajaaj, A.A.; Mishra, A.K.; Khan, A.A. Comparison of BIAS correction techniques for GPCC rainfall data in semi-arid climate. Stoch. Environ. Res. Risk Assess. 2016, 30, 1659–1675. [Google Scholar]
  2. Mustafa, A.S.; Sulaiman, S.O.; Hussein, O.M. Application of swat model for sediment loads from valleys transmitted to Haditha Reservoir. J. Eng. 2016, 22, 184–197. [Google Scholar]
  3. Ozdogan, M.; Salvucci, G.D. Irrigation-induced changes in potential evapotranspiration in southeastern Turkey: Test and application of Bouchet’s complementary hypothesis. Water Resour. Res. 2004, 40. [Google Scholar] [CrossRef]
  4. Olcay Unver, I.H. Southeastern Anatolia Project (GAP). Int. J. Water Resour. Dev. 1997, 13, 453–484. [Google Scholar]
  5. Morris, G.L.; Fan, J. Reservoir Sedimentation Handbook: Design and Management of Dams, Reservoirs, and Watersheds for Sustainable Use; McGraw Hill: New York, NY, USA, 1998. [Google Scholar]
  6. Wang, J.; Watts, D.B.; Meng, Q.; Ma, F.; Zhang, Q.; Zhang, P.; Way, T.R. Influence of soil wetting and drying cycles on soil detachment. AgriEngineering 2022, 4, 533–543. [Google Scholar] [CrossRef]
  7. Siyam, A.M.; Mirghani, M.; Elzein, S.; Golla, S.; El-Sayed, S. Assessment of the Current State of the Nile Basin Reservoir Sedimentation Problems; Nile Basin Capacity Building Network (NBCBN), River morphology Research Cluster, Group1: Cairo, Egypt, 2005. [Google Scholar]
  8. Brune, G.M. Trap efficiency of reservoirs. Trans. Am. Geophys. Union 1953, 34, 407–418. [Google Scholar]
  9. Curchill, M. Discussion of Analysis and use of reservoir sedimentation data by Gottschalk L. C. In Proceedings of the Federal Interagency Sedimentation Conference, Denver, FL, USA, 6–8 May 1947; pp. 139–140. [Google Scholar]
  10. Alighalehbabakhani, F.; Miller, C.J.; Baskaran, M.; Selegean, J.P.; Barkach, J.H.; Dahl, T.; Abkenar, S.M.S. Forecasting the remaining reservoir capacity in the Laurentian Great Lakes watershed. J. Hydrol. 2017, 555, 926–937. [Google Scholar]
  11. Deletic, A. Modelling of water and sediment transport over grassed areas. J. Hydrol. 2001, 248, 168–182. [Google Scholar]
  12. Reinwarth, B.; Riddell, E.S.; Glotzbach, C.; Baade, J. Estimating the sediment trap efficiency of intermittently dry reservoirs: Lessons from the Kruger National Park, South Africa. Earth Surf. Process. Landf. 2018, 43, 463–481. [Google Scholar]
  13. Samson-Dô, M.; St-Hilaire, A. Characterizing and modelling the trapping efficiency of sedimentation basins downstream of harvested peat bog. Can. J. Civ. Eng. 2018, 45, 478–488. [Google Scholar]
  14. Lewis, S.E.; Bainbridge, Z.T.; Kuhnert, P.M.; Sherman, B.S.; Henderson, B.; Dougall, C.; Cooper, M.; Brodie, J.E. Calculating sediment trapping efficiencies for reservoirs in tropical settings: A case study from the Burdekin Falls Dam, NE Australia. Water Resour. Res. 2013, 49, 1017–1029. [Google Scholar]
  15. Garg, V.; Jothiprakash, V. Estimation of useful life of a reservoir using sediment trap efficiency. J. Spat. Hydrol. 2008, 8. [Google Scholar]
  16. Verstraeten, G.; Poesen, J. Estimating trap efficiency of small reservoirs and ponds: Methods and implications for the assessment of sediment yield. Prog. Phys. Geogr. 2000, 24, 219–251. [Google Scholar]
  17. Heinemarm, H.G. A new sediment trap efficiency curve for small reservoirs. J. Am. Water Resour. Assoc. 1981, 17, 825–830. [Google Scholar]
  18. Yeoh, J.; Loveless, J.; Siyam, A. New approach in determining useful life of reservoirs. In Hydraulics of Dams and River Structures: Proceedings of the International Conference, Tehran, Iran, 26–28 April 2004; Yadandoost, F., Attari, J., Eds.; CRC Press: Boca Raton, FL, USA, 2004; pp. 229–236. [Google Scholar]
  19. Environmental Protection Authority. FDR Ethiopia. National Action Programme to Combat Desertification; FDR Ethiopia: Addis Ababa, Ethiopia, 1998. [Google Scholar]
  20. Haan, C.T.; Barfield, B.J.; Hayes, J.C. Design Hydrology and Sedimentology for Small Catchments; Elsevier: Amsterdam, The Netherlands, 1994. [Google Scholar]
  21. Azari, M.; Moradi, H.R.; Saghafian, B.; Faramarzi, M. Climate change impacts on streamflow and sediment yield in the North of Iran. Hydrol. Sci. J. 2016, 61, 123–133. [Google Scholar]
  22. Dutta, S. Soil erosion, sediment yield and sedimentation of reservoir: A review. Model. Earth Syst. Environ. 2016, 2, 123. [Google Scholar]
  23. Arnold, J.G.; Fohrer, N. SWAT2000: Current capabilities and research opportunities in applied watershed modelling. Hydrol. Process. 2005, 19, 563–572. [Google Scholar]
  24. Gassman, P.W.; Reyes, M.R.; Green, C.H.; Arnold, J.G. The soil and water assessment tool: Historical development, applications, and future research directions. Trans. Am. Soc. Agric. Biol. Eng. 2007, 50, 1211–1250. [Google Scholar]
  25. Vigiak, O.; Malagó, A.; Bouraoui, F.; Vanmaercke, M.; Obreja, F.; Poesen, J.; Habersack, H.; Fehér, J.; Grošelj, S. Modelling sediment fluxes in the Danube River Basin with SWAT. Sci. Total Environ. 2017, 599–600, 992–1012. [Google Scholar]
  26. Gassman, P.W.; Sadeghi, A.M.; Srinivasan, R. Applications of the SWAT model special section: Overview and insights. J. Environ. Qual. 2014, 43, 1–8. [Google Scholar] [PubMed]
  27. Najafi, M.R.; Moradkhani, H.; Jung, I.W. Assessing the uncertainties of hydrologic model selection in climate change impact studies. Hydrol. Process. 2011, 25, 2814–2826. [Google Scholar]
  28. Pechlivanidis, I.G.; Jackson, B.M.; McIntyre, N.R.; Wheater, H.S. Catchment scale hydrological modelling: A review of model types, calibration approaches and uncertainty analysis methods in the context of recent developments in technology and applications. Glob. NEST J. 2011, 13, 193–214. [Google Scholar]
  29. Dutta, D.; Das, R.; Mazumdar, A. Assessment of runoff and sediment yield in the Tilaya Reservoir, India using SWAT model. Asian J. Water Environ. Pollut. 2017, 14, 9–18. [Google Scholar]
  30. Setegn, S.G.; Dargahi, B.; Srinivasan, R.; Melesse, A.M. Modeling of sediment yield from Anjeni-gauged watershed, Ethiopia using SWAT model. J. Am. Water Resour. Assoc. 2010, 46, 514–526. [Google Scholar]
  31. Duru, U.; Wohl, E.; Ahmadi, M. Factors controlling sediment load in The Central Anatolia Region of Turkey: Ankara River Basin. Environ. Manag. 2017, 59, 826–841. [Google Scholar]
  32. Licciardello, F.; Govers, G.; Cerdan, O.; Kirkby, M.J.; Vacca, A.; Kwaad, F.J.P.M. Evaluation of the PESERA model in two contrasting environments. Earth Surf. Process. Landf. 2009, 34, 629–640. [Google Scholar]
  33. Al-Ansari, N.A.; Assad, N.M.; Walling, D.E.; Hussan, S.A. The suspended sediment discharges of the River Euphrates at Haditha, Iraq: An assessment of the potential for establishing sediment rating curves. Geogr. Annaler. Ser. A Phys. Geogr. 1988, 70, 203–213. [Google Scholar]
  34. Al-Hadithi, K.I.M. Hydrology and Hydrogeochemistry of Al-Qadisiya Dam Reservoir-Iraq. Ph.D. Thesis, University of Baghdad, Baghdad, Iraq, 1994. [Google Scholar]
  35. Ministry of Water Resources, Iraq. (2020). Private Communications with Aws Ajaaj.
  36. Khassaf, S.I.; Abde Al-Rahman, K.Z. Sediment transport upstream of reservoir of Haditha Dam. Eng. Dev. 2005, 9, 45–66. [Google Scholar]
  37. Yatagai, A.; Kamiguchi, K.; Arakawa, O.; Hamada, A.; Yasutomi, N.; Kitoh, A. APHRODITE: Constructing a long-term daily gridded precipitation dataset for Asia based on a dense network of rain gauges. Bull. Am. Meteorol. Soc. 2012, 93, 1401–1415. [Google Scholar]
  38. Tateishi, R.; Uriyangqai, B.; Al-Bilbisi, H.; Ghar, M.A.; Tsend-Ayush, J.; Kobayashi, T.; Kasimu, A.; Hoan, N.T.; Shalaby, A.; Alsaaideh, B.; et al. Production of global land cover data–GLCNMO. Int. J. Digit. Earth 2011, 4, 22–49. [Google Scholar]
  39. Dile, Y.T.; Srinivasan, R. Evaluation of CFSR climate data for hydrologic prediction in data-scarce watersheds: An application in the Blue Nile River Basin. J. Am. Water Resour. Assoc. 2014, 50, 1226–1241. [Google Scholar]
  40. Fuka, D.R.; Walter, M.T.; MacAlister, C.; Degaetano, A.T.; Steenhuis, T.S.; Easton, Z.M. Using the climate forecast system reanalysis as weather input data for watershed models. Hydrol. Process. 2014, 28, 5613–5623. [Google Scholar]
  41. Bargaoui, Z.K.; Chebbi, A. Comparison of two kriging interpolation methods applied to spatiotemporal rainfall. J. Hydrol. 2009, 365, 56–73. [Google Scholar]
  42. Haylock, M.R.; Hofstra, N.; Klein Tank, A.M.G.; Klok, E.J.; Jones, P.D.; New, M. A European daily high-resolution gridded data set of surface temperature and precipitation for 1950–2006. J. Geophys. Res. Atmos. 2008, 113. [Google Scholar] [CrossRef]
  43. Abbaspour, K.C. SWAT Calibration and Uncertainty Programs. A User Manual; Swiss Federal Institute of Aquatic Science and Technology: Eawag, Switzerland, 2015; Volume 103, pp. 17–66. [Google Scholar]
  44. Duru, U.; Arabi, M.; Wohl, E.E. Modeling stream flow and sediment yield using the SWAT model: A case study of Ankara River Basin, Turkey. Phys. Geogr. 2018, 39, 264–289. [Google Scholar]
  45. Rostamian, R.; Jaleh, A.; Afyuni, M.; Mousavi, S.F.; Heidarpour, M.; Jalalian, A.; Abbaspour, K.C. Application of a SWAT model for estimating runoff and sediment in two mountainous basins in central Iran. Hydrol. Sci. J. 2008, 53, 977–988. [Google Scholar]
  46. Wible, T. Enhanced Watershed Modeling and Data Analysis with a Fully Coupled Hydrologic Model and Cloud-Based Flow Analysis. Ph.D. Thesis, Colorado State University, Fort Collins, CO, USA, 2014. [Google Scholar]
  47. Dalton, J., III. On the absorption of gases by water and other liquids. Philos. Mag. 1806, 24, 15–24. [Google Scholar]
  48. Arnold, J.G.; Srinivasan, R.; Muttiah, R.S.; Williams, J.R. Large area hydrologic modeling and assessment part I: Model development. J. Am. Water Resour. Assoc. 1998, 34, 73–89. [Google Scholar]
  49. Wang, X.; Melesse, A. Evaluation of the SWAT model’s snowmelt hydrology in a northwestern Minnesota watershed. Trans. ASAE 2005, 48, 1359–1376. [Google Scholar]
  50. Arnold, J.G.; Allen, P.M.; Muttiah, R.; Bernhardt, G. Automated base flow separation and recession analysis techniques. Groundwater 1995, 33, 1010–1018. [Google Scholar]
  51. William, J.R. Sediment yield prediction with universal equation using runoff energy factor. In Present and Prospective Technology for Predicting Sediment Yields and Sources, Proceeding of the Sediment Yield Workshop, USDA Sedimentation Laboratory, Oxford, MO, USA, 28–30 November 1972; Agricultural Research Service, US Department of Agriculture: Washington, DC, USA, 1975; ARS-S-40; pp. 244–252. [Google Scholar]
  52. Punmia, B.C.; Jain, A.K.; Jain, A.K. Soil Mechanics and Foundations; Laxmi Publications: New Delhi, India, 2005. [Google Scholar]
  53. Nash, J.E.; Sutcliffe, J.V. River flow forecasting through conceptual models part I—A discussion of principles. J. Hydrol. 1970, 10, 282–290. [Google Scholar]
  54. Cardoso de Salis, H.H.; Monteiro da Costa, A.; Moreira Vianna, J.H.; Azeneth Schuler, M.; Künne, A.; Sanches Fernandes, L.F.; Leal Pacheco, F.A. Hydrologic modeling for sustainable water resources management in urbanized karst areas. Int. J. Environ. Res. Public Health 2019, 16, 2542. [Google Scholar] [CrossRef]
  55. Mukundan, R.; Radcliffe, D.; Risse, L. Spatial resolution of soil data and channel erosion effects on SWAT model predictions of flow and sediment. J. Soil Water Conserv. 2010, 65, 92–104. [Google Scholar]
  56. Arnold, J.G.; Moriasi, D.N.; Gassman, P.W.; Abbaspour, K.C.; White, M.J.; Srinivasan, R.; Santhi, C.; Harmel, R.D.; van Griensven, A.; Van Liew, M.W.; et al. SWAT: Model use, calibration, and validation. Trans. Am. Soc. Agric. Biol. Eng. 2012, 55, 1491–1508. [Google Scholar]
  57. Chawanda, C.J.; Nkwasa, A.; Thiery, W.; van Griensven, A. Combined impacts of climate and land-use change on future water resources in Africa. Hydrol. Earth Syst. Sci. 2024, 28, 117–138. [Google Scholar]
  58. Sissakian, V.K.; Al-Ansari, N.; Knutsson, S. Sand and dust storm events in Iraq. J. Nat. Sci. 2013, 5, 1084–1094. [Google Scholar]
  59. Breshears, D.D.; Whicker, J.J.; Johansen, M.P.; Pinder, J.E. Wind and water erosion and transport in semi-arid shrubland, grassland and forest ecosystems: Quantifying dominance of horizontal wind-driven transport. Earth Surf. Process. Landf. 2003, 28, 1189–1209. [Google Scholar]
  60. Lavee, H.; Imeson, A.C.; Sarah, P. The impact of climate change on geomorphology and desertification along a mediterranean-arid transect. Land Degrad. Dev. 1998, 9, 407–422. [Google Scholar]
  61. Gill, M.A. Sedimentation and useful life of reservoirs. J. Hydrol. 1979, 44, 89–95. [Google Scholar]
  62. Mulu, A.; Dwarakish, G.S. Different approach for using trap efficiency for estimation of reservoir sedimentation. An overview. Aquat. Procedia 2015, 4, 847–852. [Google Scholar]
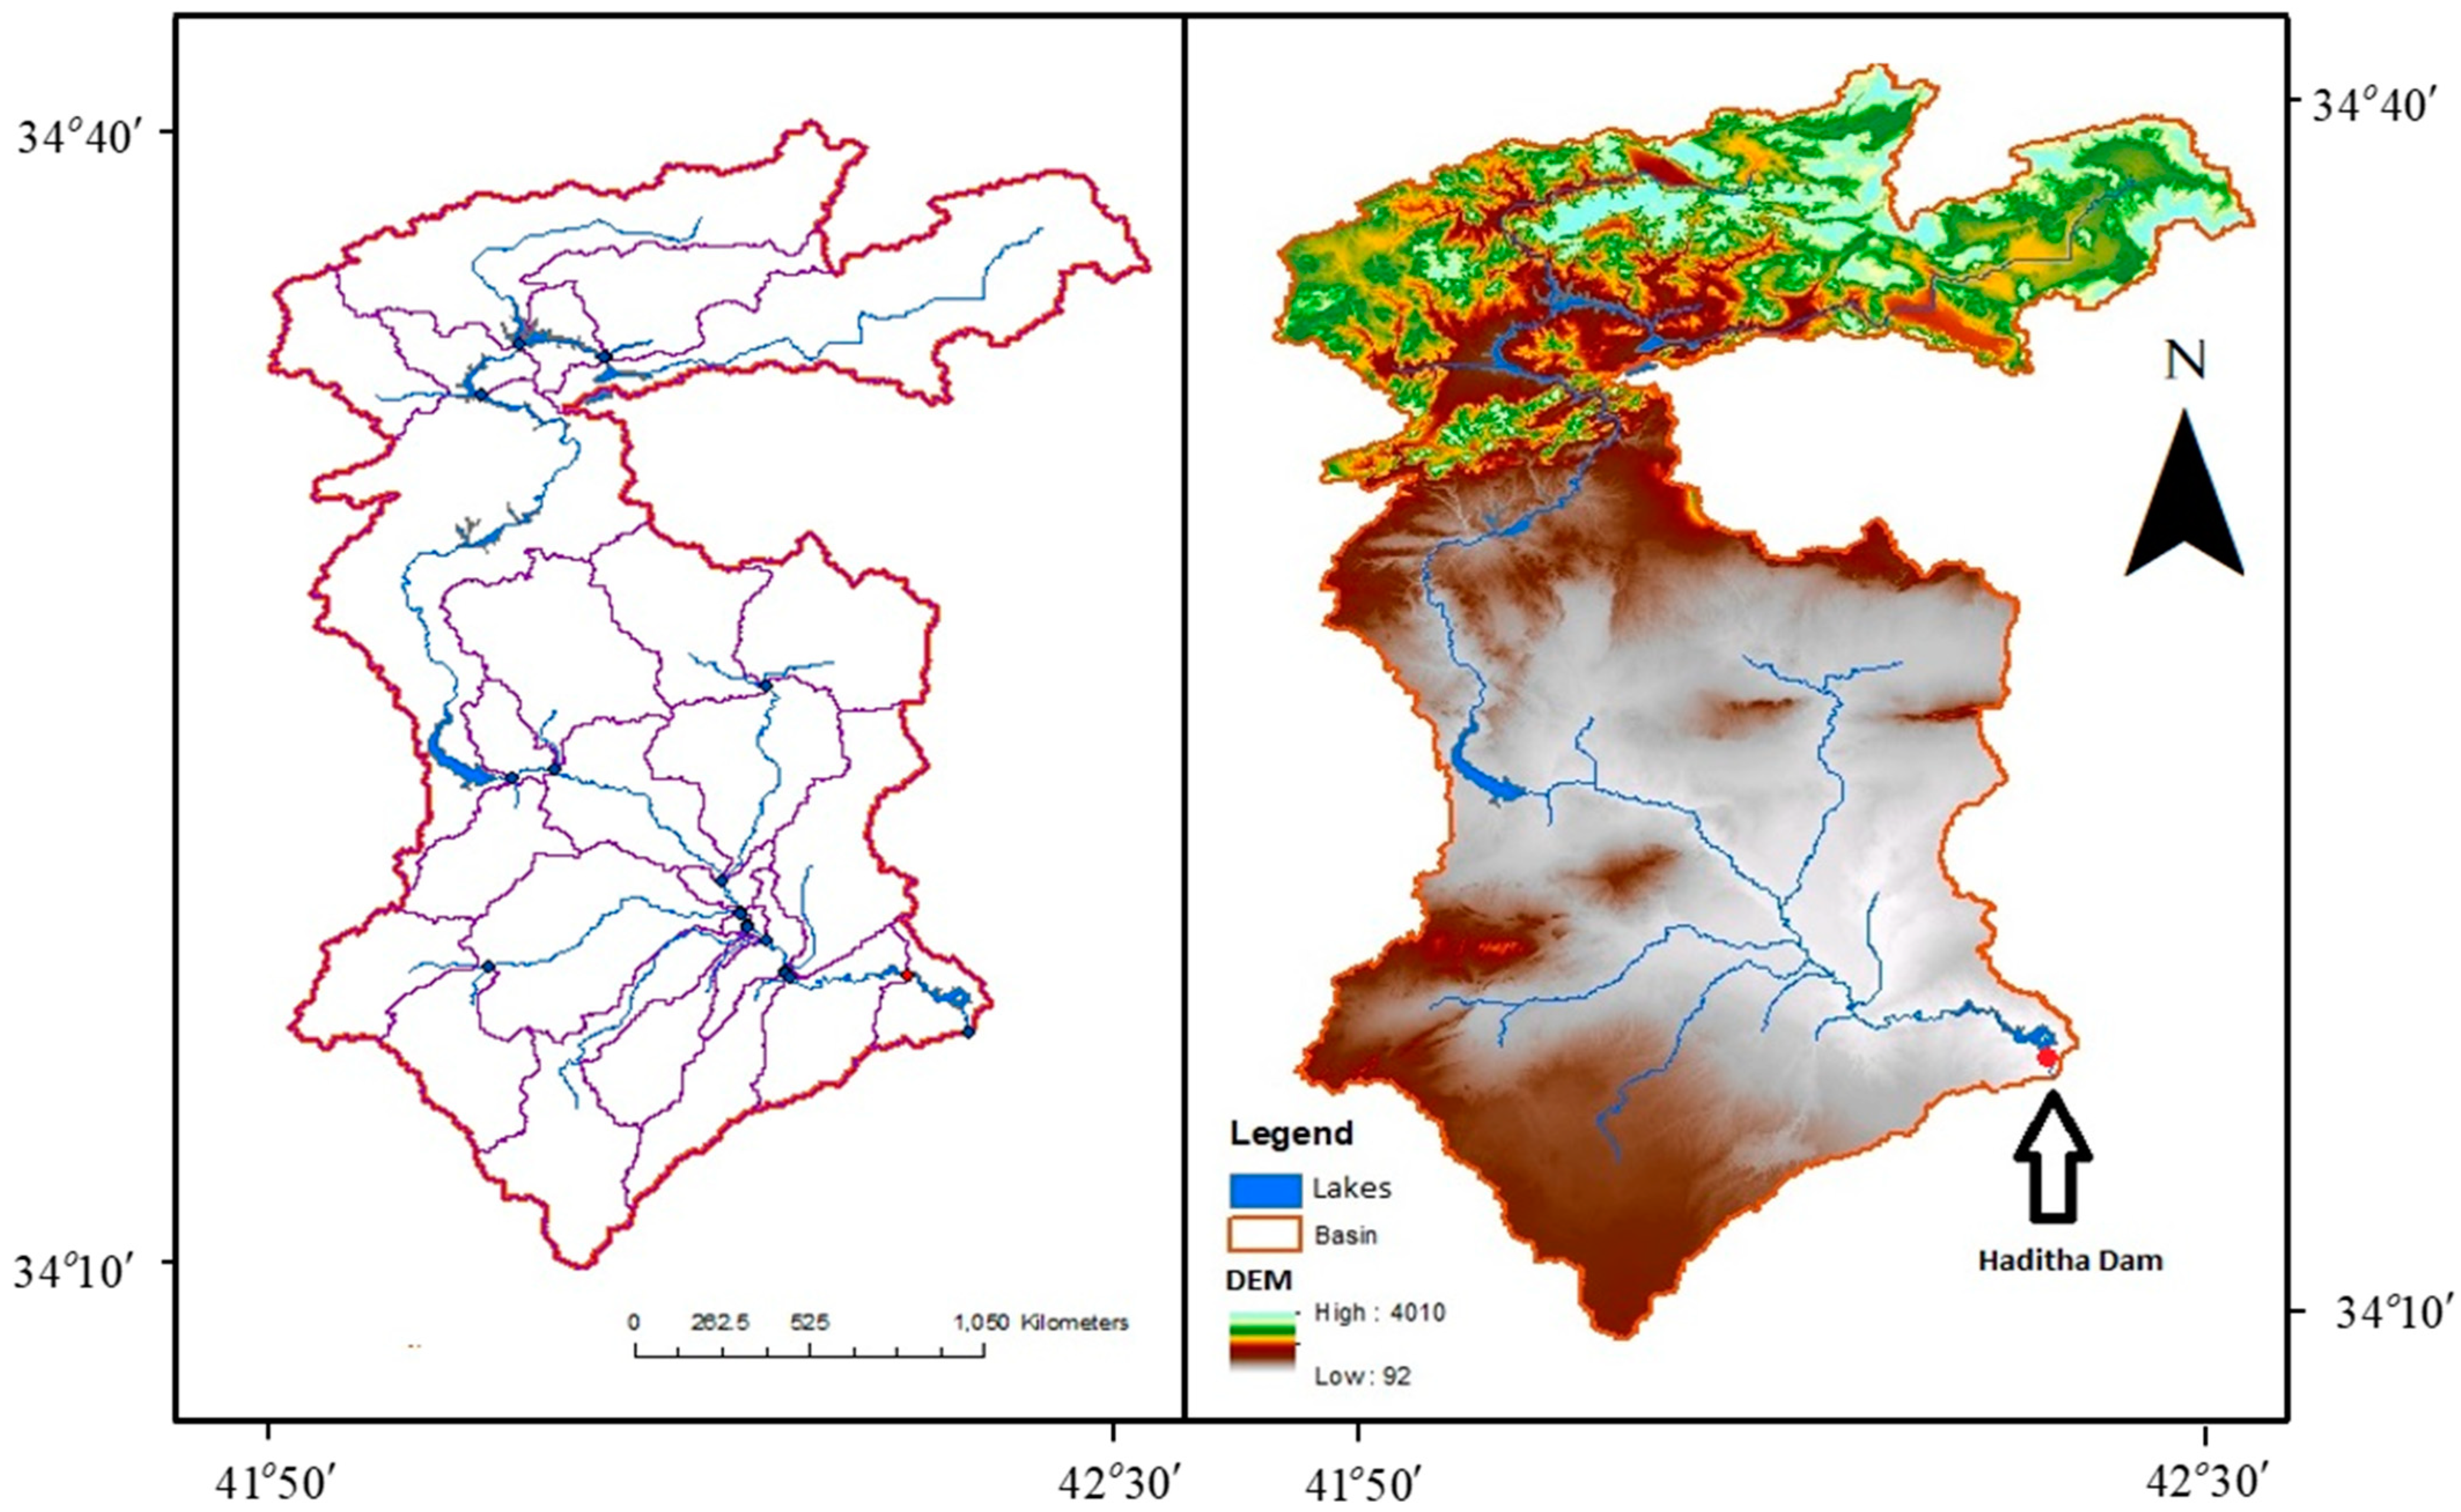
Figure 1. UERB map showing the location of the HR (study area), the boundary of the delineated watershed with subbasins and outlet locations (left), and the topography of the UERB from the DEM (right).
Hydrology 11 00128 g001
Figure 2. Landuse (left) and soil type (right) spatial maps for the UERB.
Hydrology 11 00128 g002
Figure 3. Storage capacity versus water level relationship for the HR based on bathymetric surveying.
Hydrology 11 00128 g003
Figure 4. Comparison of observed and simulated monthly and daily streamflow simulations using SWAT models up until 2007 (Top: UERBQ_2, Middle: UERBQ_3, Bottom: UERBQ_1).
Hydrology 11 00128 g004
Figure 5. Observed and simulated monthly sediment and water inflow to the HR using the SWAT model (Blue bar: observed sediment influx; orange bar: simulated sediment influx; line: stream inflow).
Hydrology 11 00128 g005
Figure 6. Simulated annual sediment and water inflow to the HR using the SWAT model for the period of 1986–2007.
Hydrology 11 00128 g006
Figure 7. The HR remaining capacity due to sediment deposition estimated after 1986 at different operating water levels.
Hydrology 11 00128 g007
Figure 8. Accumulated sediment deposited after 1986 for different years.
Hydrology 11 00128 g008
Figure 9. The useful life of the HR based on the TE analysis at different operating water levels and storage capacities.
Hydrology 11 00128 g009
Table 1. Storage capacity in million m3 (Mm3) at different reservoir Water Levels (WLs).
Water Level DescriptionWL (m)19861990199520002003
Lower Water level112188169.95149.03130.03119.6
Lower working water level129.523622330.082290.232250.432226.56
Normal working water level14365916558.16516.996475.896451.24
Design working water level14782008166.998125.748084.518059.77
Maximum water level150.298509816.919775.579734.249709.45
Table 2. Gage stations at which streamflow and sediment were evaluated.
LocationNameTime StepDrainage Area (km2)LatitudeLongitudeData Type
Euphrates River Upstream of HRUERBQ_1Daily---Streamflow and Sediment
Euphrates River at HussaybahUERBQ_2Monthly221,00034.4241.01Streamflow
Euphrates River at HitUERBQ_3Monthly264,10033.6142.84Streamflow
Euphrates River Downstream of Hindiyah BarrageUERBQ_4Monthly274,10032.7244.27Streamflow
Table 3. Rank of the topmost nine sensitive parameters obtained from Global Sensitivity.
RankParameter_NameFitted ValueMin. ValueMax. Valuet-Statp-Value
1R__GWQMN.gw−0.601−0.736−0.466−9.5610.000
2R__CN2.mgt−0.644−0.777−0.512−3.7740.001
3R__GW_REVAP.gw−0.046−0.1200.028−2.2570.031
4R__BIOMIX.mgt−0.066−0.1500.018−1.9740.057
5R__EPCO.hru0.030−0.0360.0961.3070.201
6R__CH_N2.rte0.062−0.0200.1440.1680.427
7R__CH_K2.rte−0.090−0.1860.0060.8040.427
8R__ALPHA_BF.gw−0.426−0.9060.053−0.8030.428
9R__CANMX.hru0.070−0.0160.156−0.6780.503
10R__OV_N.hru−0.022−0.0840.040−0.6690.508
11R__SOL_BD(..).sol−0.090−0.1860.006−0.6340.531
Table 4. Statistical measures between average monthly and daily measured and simulated streamflow and sediment yield for calibration/validation periods.
StationVariable Calibratedp-Factorr-FactorR2NSE
UERBQ_1Daily-Streamflow0.36/0.320.59/0.540.45/0.390.35/0.33
UERBQ_1Daily-Sediment0.34/0.300.43/0.420.37/0.340.30/0.32
UERBQ_2Monthly-Streamflow0.43/0.420.37/0.320.64/0.620.60/0.55
UERBQ_3Monthly-Streamflow0.45/0.460.4/0.410.56/0.660.36/0.34
UERBQ_4Monthly-Streamflow0.36/0.340.31/0.300.64/0.560.61/0.60
Disclaimer/Publisher’s Note: The statements, opinions and data contained in all publications are solely those of the individual author(s) and contributor(s) and not of MDPI and/or the editor(s). MDPI and/or the editor(s) disclaim responsibility for any injury to people or property resulting from any ideas, methods, instructions or products referred to in the content.