Article

Sequential Changes in Coastal Plain Rivers Influenced by Rising Sea-Level

by
Jonathan D. Phillips
Earth Surface Systems Program, University of Kentucky, Lexington, KY 40506, USA
Hydrology 2024, 11(8), 124; https://doi.org/10.3390/hydrology11080124
Submission received: 20 June 2024 / Revised: 7 August 2024 / Accepted: 14 August 2024 / Published: 17 August 2024
(This article belongs to the Section Hydrology–Climate Interactions)

Abstract

:
Coastal backwater effects on low-gradient coastal plain rivers extend well upstream of the head of the estuary and propagate upstream as sea-level rises. Hydrological, geomorphological, and ecological indicators can serve as sentinels of the upriver encroachment. Analyzing the along-river spatial distribution of these indicators as a space-for-time substitution allows the prediction of sequential changes. Interpretation of results from 20 rivers in Virginia and the Carolinas shows that backwater effects at the leading edge result in higher river stages, increasing floodplain inundation, and raising water tables. Lower slopes and flow velocities reduce sediment transport, reducing river sediment input and floodplain deposition. This inhibits natural levee development, reducing bank heights. These factors combine to increase the frequency and duration of inundation, resulting in semi-permanently flooded wetlands. Anaerobic conditions limit organic decomposition, and ponding allows transported and suspended organic matter to settle, leading to organic muck and peat floodplain soils. This accumulation, coupled with general valley-filling, buries alluvial terrace remnants. Finally, vegetation changes driven by salinity increases occur, resulting in swamp conversions to brackish marsh. Backwater encroachment is strongly controlled by channel bed slope, with relatively steeper channels experiencing slower rates of tidal extension. With accelerating sea-level rise (SLR), the lowest-sloping channels could experience encroachment rates of >1 km yr−1. Hydrological changes associated with SLR are most rapid at the leading, upriver end—averaging 71 km upstream of the head of the estuary in the study rivers at present—and at the lowermost, downstream end of the fluvial-estuarine transition zone.

1. Introduction

Eustatic sea levels reached a minimum at the last glacial maximum (LGM) about 18 ka, with coastlines well seaward of their current positions and rivers flowing across what is now the continental shelf. Notwithstanding uncertainty and debate about rates of sea-level change, the occurrence of a Holocene high stand, oscillations in eustatic sea-level, local variations, and the offsetting or exacerbating effects of uplift and subsidence, sea levels have generally been rising since. Former river valleys are now inundated by the ocean on the continental shelves and converted to drowned river valley estuaries near the coast. The effects of sea-level rise (SLR) extend upstream of the estuaries, with physical implications such as backwater effects, bidirectional tidal fluxes, deltaic sedimentation, and saltwater intrusion. With SLR and the hydrogeomorphic and ecohydrological responses accelerating [1,2] the need to understand these changes is increasingly urgent. However, most assessments of hydrological and ecological responses to SLR inland from the ocean coast do not extend above the head of the estuary [3,4,5,6]. The purpose of this study is to identify the sequence of hydrological and hydrology-driven changes as backwater effects extend upstream due to SLR, using a space-for-time substitution approach in 20 rivers from the Albemarle Sound drainage of North Carolina and Virginia to Cape Romain, South Carolina.
While a general upstream propagation of SLR in rivers has been ongoing for several millennia, SLR is accelerating in many locations, and visible effects inland of the seacoast are evident, such as increased flooding in urban areas, “ghost forests” formed as trees are killed by salinization, and the conversion of freshwater forested wetlands to brackish marshes. Coupled with extensive anthropic impacts on rivers and estuaries and impacts of climate change on river flow regimes and coastal storms, from a human perspective, these sea-level-driven changes have important implications for land use and water planning, wetland conservation and management, water supply and quality, commercial and recreational fishing, water- and wetland-based outdoor recreation, water transport and navigation, flood hazards, and other concerns. The fluvial-to-estuary transition zones (FETZs) of coastal plain rivers are hot spots for hydrological, ecological, and geomorphological impacts of sea level and climate change.
The transition from purely fluvial systems, rarely if ever influenced by coastal processes, to estuaries constantly and dominantly affected by coastal processes can occur along 50 to >100 km of river length in the U.S. Atlantic and Gulf coastal plains [7,8,9,10,11,12]. This study examines the sequence of changes as the effects of rising sea levels move upstream. As monitoring programs and legacy data are limited temporally and spatially, this study is based on a space-for-time substitution. Thus, the upstream-most impacts are considered to be the leading edge of SLR effects, with impacts further downstream assumed to occur later. Conditions at the head of the estuary (the downstream boundary of the FETZ) are considered to represent the final stages of SLR effects on the fluvial (as opposed to the coastal or estuarine) system.
Impacts of the upstream movement of the fluvial-coastal interface include effects on water chemistry (especially salinity, conductivity, and sulfate reduction in wetlands), hydraulic slope gradients, net flow directions and velocities, and the frequency of overbank flow. Sea-level-driven coastal backwater effects on channel and floodplain morphology include bank height, channel cross-section and planform morphology, the formation and abandonment of subchannels and anabranches, watershed fragmentation, crevasse and avulsion dynamics, and floodplain sediment storage [8,9,11,12,13,14,15,16,17]. The impacts described in these references are historically recent; there is also extensive literature on geomorphic changes in fluvial systems in response to long-term Quaternary sea-level changes. SLR effects in rivers are contributing to an increase in compound flooding events (due to interactions of fluvial, pluvial, and coastal flooding) in the U.S. south Atlantic coastal plain (e.g., [6,18,19]). In the lower reaches of coastal plain rivers, overbank flooding is often far more common than is usually the case in alluvial rivers, occurring multiple times per year [12,15,20,21,22,23,24]. In many cases, this is directly related to hydraulic backwater effects and/or to river and floodplain morphology associated with backwater effects and therefore affected by SLR. These impacts all occur in the freshwater reaches of the FETZ well, upstream of saltwater or other chemical effects. Further downstream within the FETZ, a variety of ecological, biogeochemical, and soil changes occur due to increased salinity (e.g., [4,25,26,27,28,29,30,31]).
Fluvial sediment delivery to estuaries in coastal plain rivers is often surprisingly low, due to sediment sequestration within the FETZ (see reviews by [32,33]). As upstream encroachment proceeds, the locus of sediment deposition also migrates upstream.

1.1. Definitions

Coastal plain rivers include those whose drainage is entirely within the Coastal Plain Physiographic Province and larger rivers that rise outside the coastal plain (in Virginia and the Carolinas, the Piedmont and Blue Ridge Mountain provinces) and flow across the coastal plain. Relative sea-level rise includes eustatic sea-level rise, plus or minus any subsidence or uplift. SLR in this paper refers to relative SLR.
The mouth of a river or the head of an estuary can be surprisingly difficult to pinpoint, particularly based on hydrodynamics or water chemistry, which can vary significantly over time periods of hours to months. For example, the tidal freshwater zone of the Aransas River, Texas, varied in length by more than 12 km (about 20 percent of its total median length) over the course of a year [10]. The situation is even more complicated in wind-dominated estuaries such as the Albemarle-Pamlico estuarine system of North Carolina [3,12,34,35]. For the study rivers, the head of the estuary (corresponding with the lower limit of the FETZ) was chosen based on morphology as the point where open water occupies at least 50 percent of the width of the valley bottom, which in the study rivers is occupied entirely by water, wetlands, or alluvial terrace remnants.

1.2. Backwater Impacts

Most studies of SLR effects on rivers have focused on salinity intrusion and related water chemistry effects, as well as changes in head-of-tide locations. Coastal backwater effects and flooding are influenced not only by the ongoing press disturbance of sea-level change, but also by the pulse disturbance of storms, which influence both storm surge and river discharges. Backwater effects occur when there is a transition from uniform river flow to non-uniform flow as a river approaches a standing body of water, such as an estuary. The depth-averaged water velocity decelerates in the downstream direction, with a water surface profile that asymptotically approaches mean base level (in this case, sea level). Backwater length scales have traditionally been approximated by L = Dbf/S, where Dbf is bankfull flow depth and S is channel slope. However, Wu and Nitterour’s [36] analysis indicates that the extent of non-uniform flow extends further upstream than the backwater length scale.

1.3. Space-for-Time

In this paper, the upstream-to-downstream distribution of impacts attributable to sea-level encroachment in the rivers is assumed to represent the sequence of changes over time. Thus, effects at the leading edge of detectable coastal backwater effects upriver represent the first SLR impacts, while those at and just upstream of the head of the estuary characterize the last stages (from a fluvial perspective).
Space-for-time substitutions are widely used in pedology, ecology, and geomorphology, where they are often referred to as chronosequences. Examples include environmental changes on ground exposed by retreating glaciers, ecological succession on old fields at different ages of abandonment, and soil and landform development on alluvial terraces of different ages. Space-for-time substitutions are less common in hydrology, but changes in soil hydrologic properties along a chronosequence have been studied [37,38,39].
Chronosequences and space-for-time substitutions have inherent weaknesses, mainly because few, if any, conform fully to the assumption that all factors except time or stage of development are constant. However, absent detailed historical reconstructions or long-term monitoring—neither of which are available for this study—chronosequences, notwithstanding their flaws, are often the best option.

2. Study Area

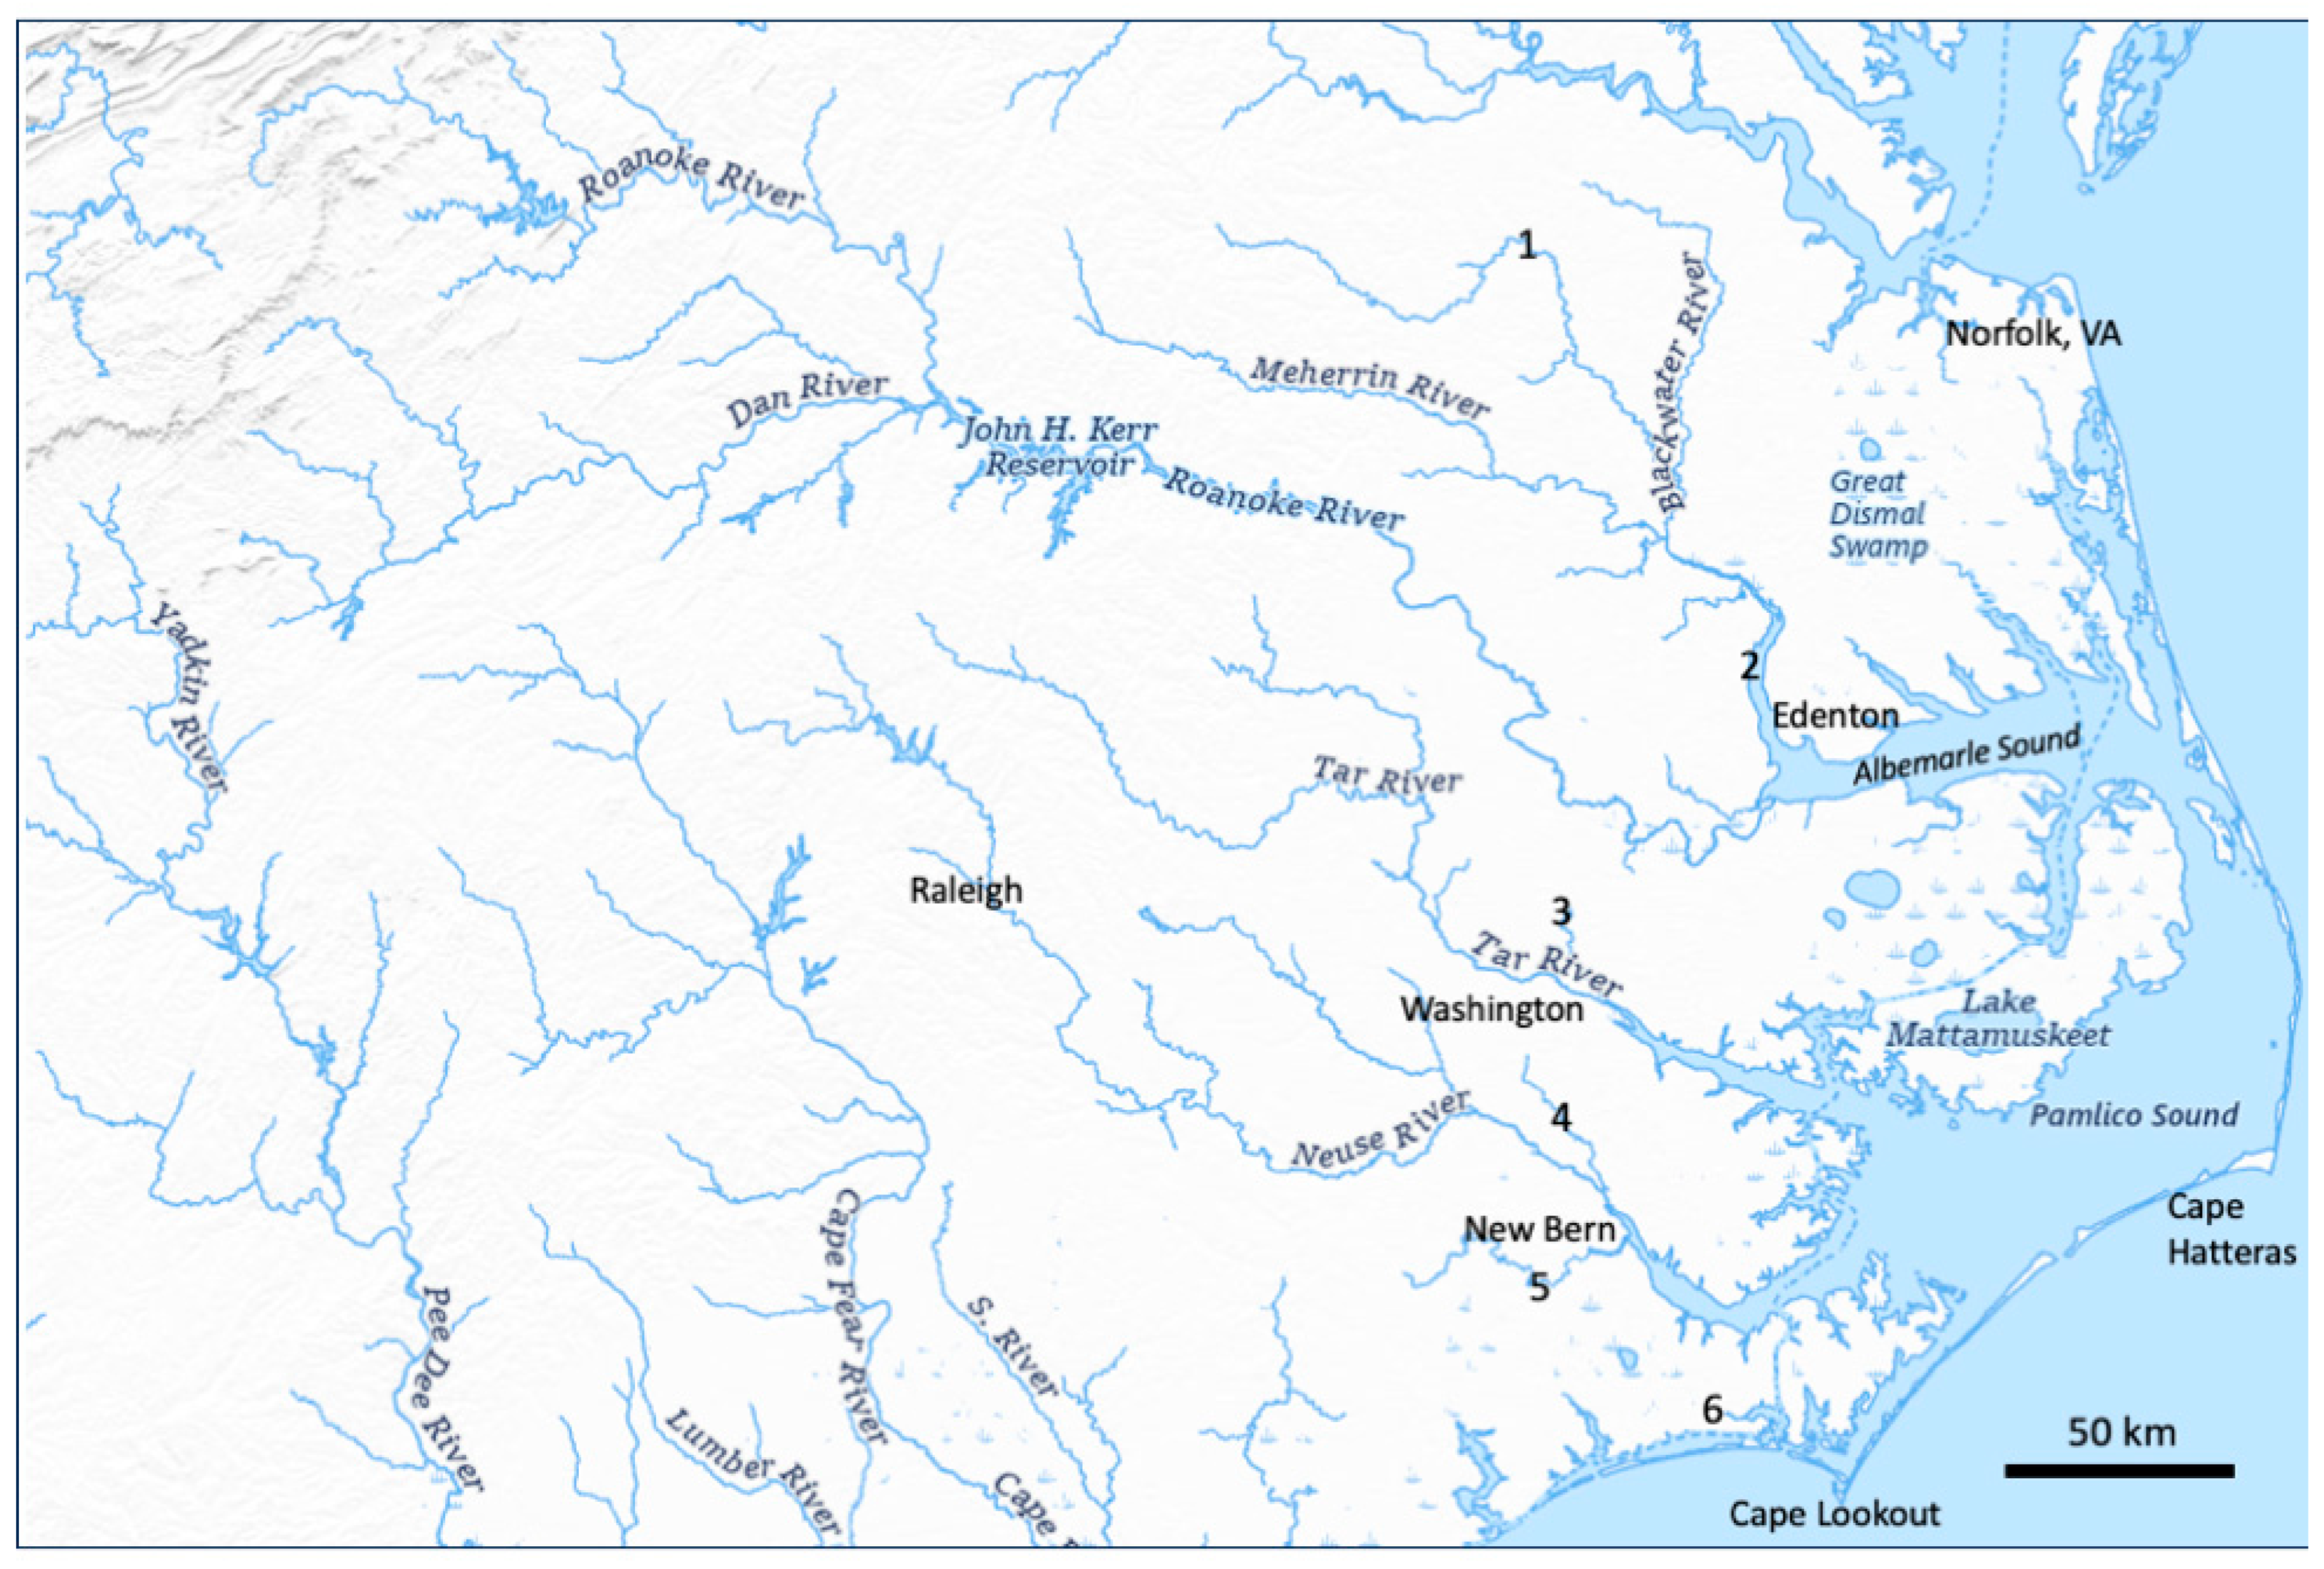
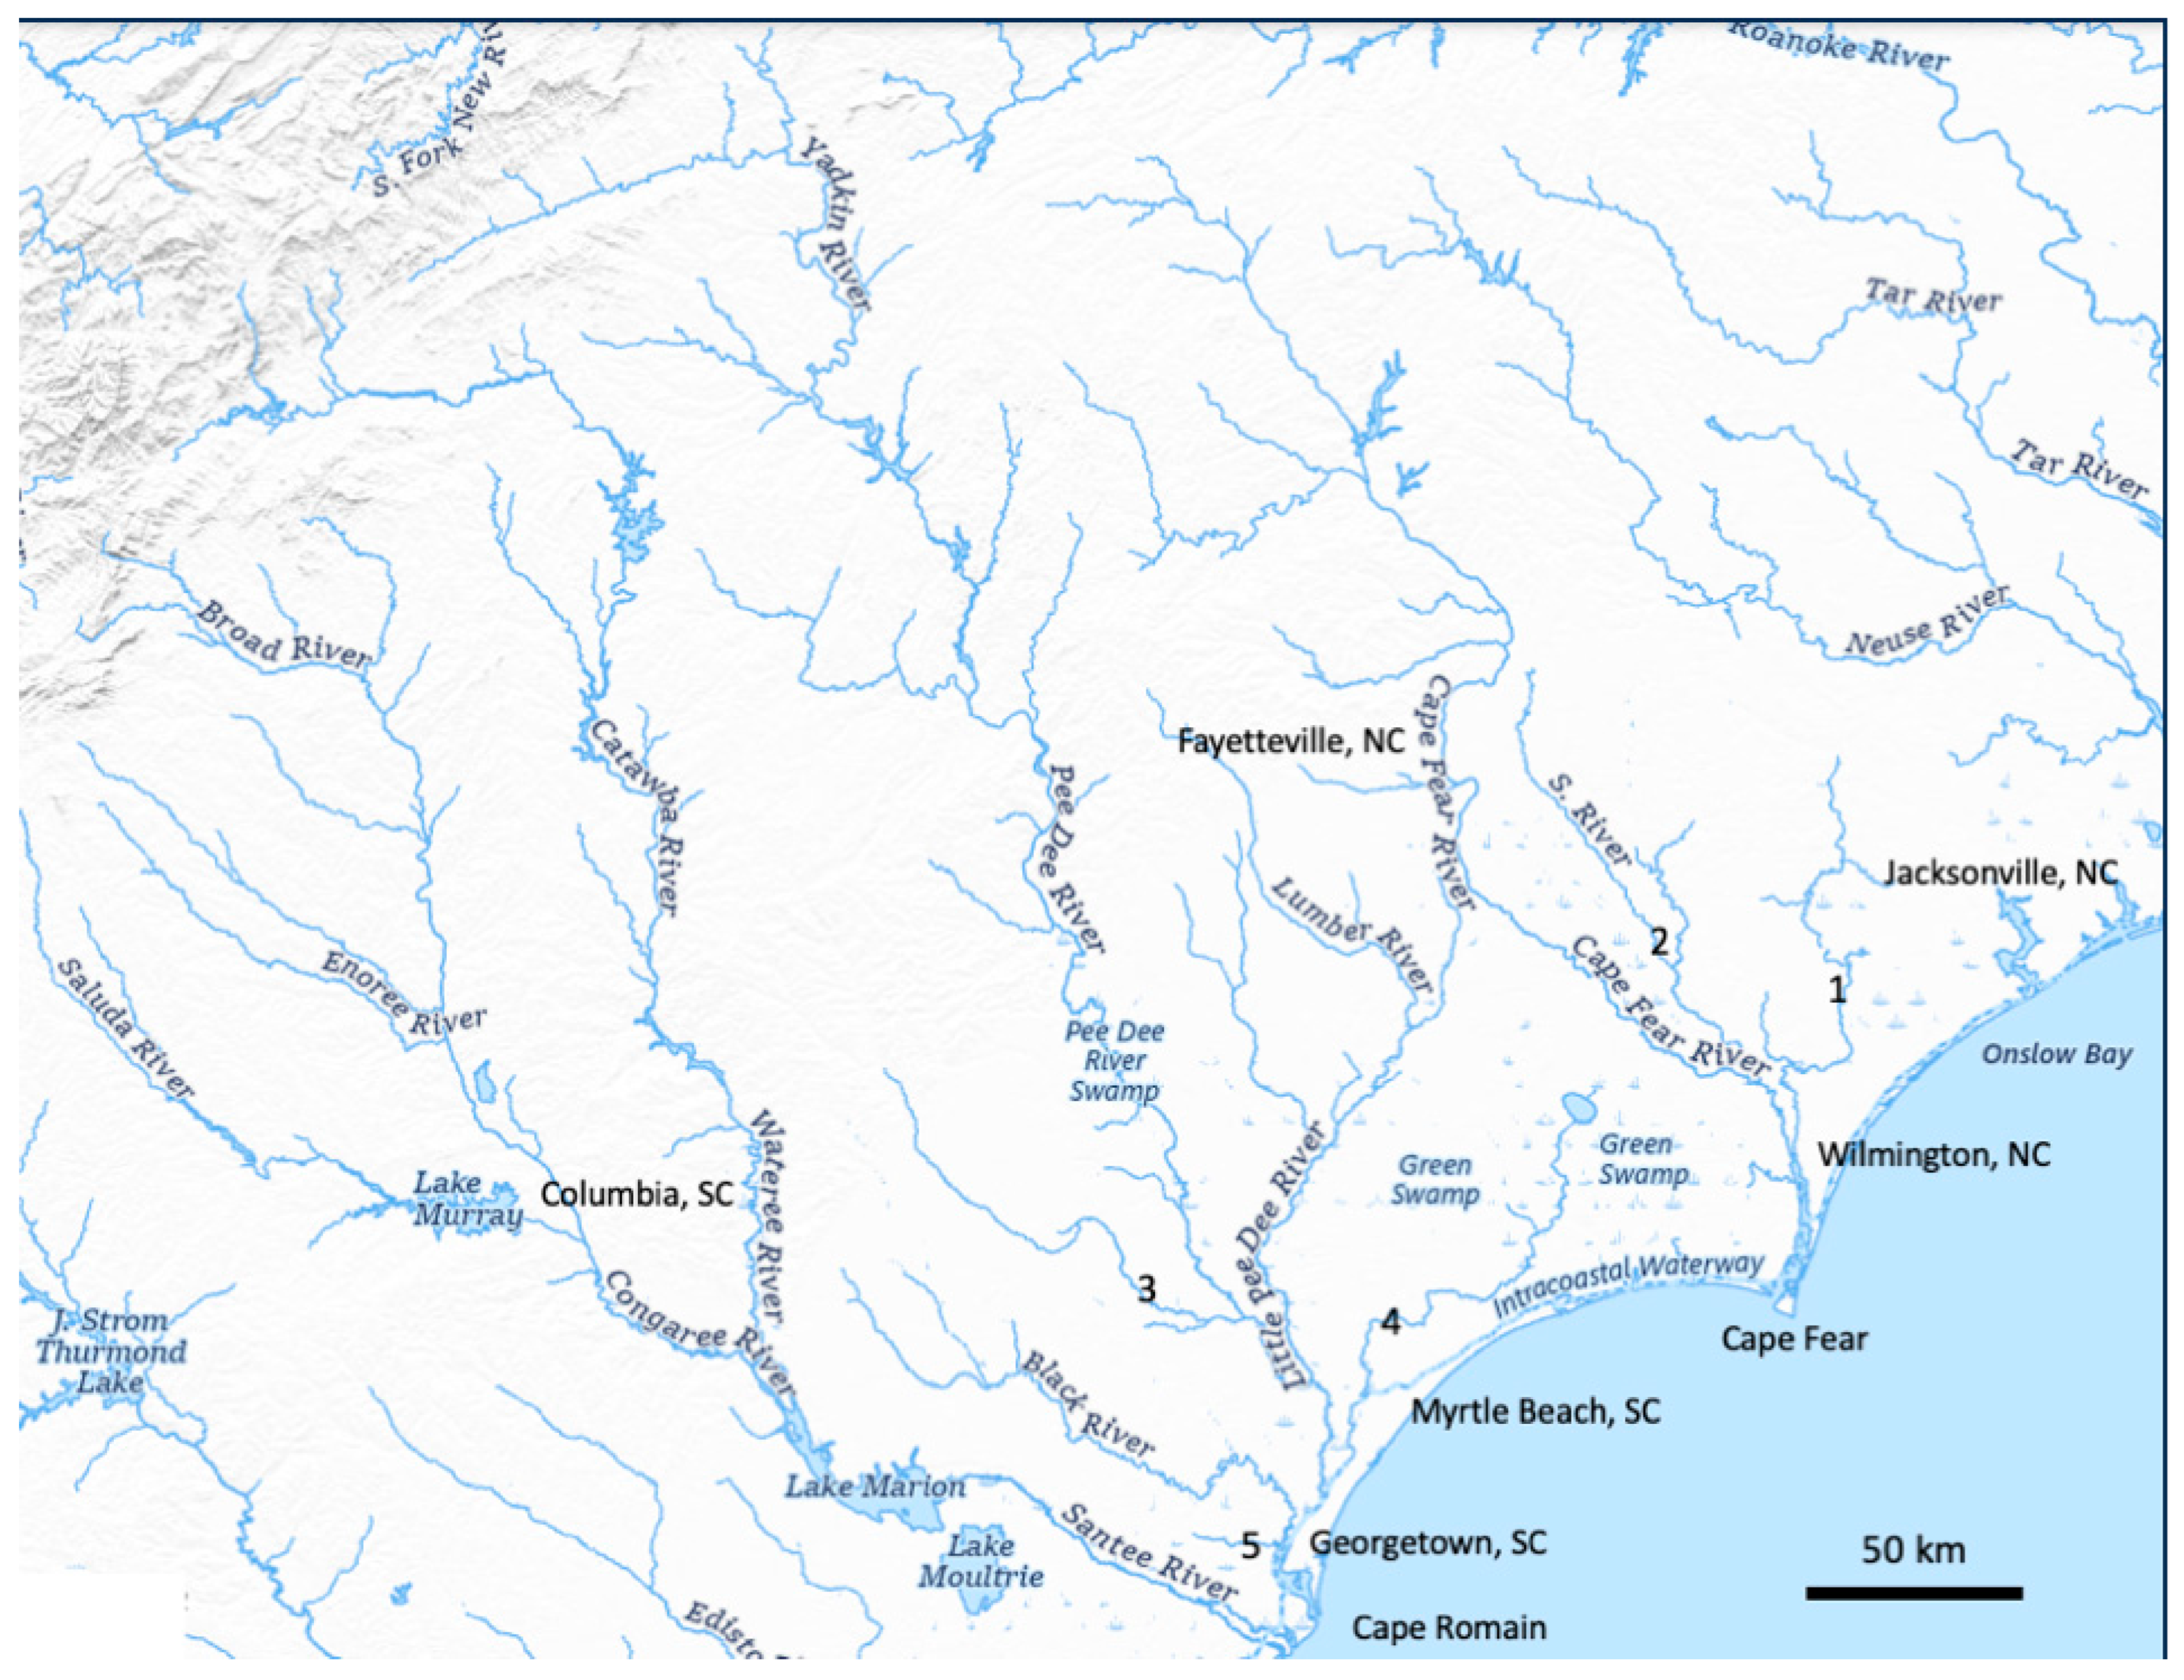
The study area includes coastal plain rivers from the Albemarle Sound region of northeastern North Carolina (and adjacent areas of Virginia) to Cape Romain, South Carolina (Figure 1). The rivers were selected to represent larger regional rivers rising in the mountains and piedmont as well as smaller systems mainly or entirely within the coastal plain. The study rivers also reflect systems with minimal astronomical tides, such as those draining to the wind-dominated Albemarle and Pamlico Sounds, and those with stronger tidal influences. The rivers and estuaries include the embayed section of the Atlantic Coastal Plain (Albemarle embayment), as well as those affected by the Cape Fear Arch and the East Coast Fault System [40,41,42,43]. Drainage areas of the fluvial systems range from 310 to 64,400 km2, and astronomical tidal ranges in the estuaries range from <0.15 to 1.4 m. The study rivers also include “blackwater” systems whose drainage basins are mostly forested, with extensive riparian swamps confined to the coastal plain (so named because organic acids combined with low suspended sediment concentrations give the water a dark color). “Brownwater” rivers with higher turbidity and mainly originating inland of the coastal plain are also represented. General characteristics of the study rivers are shown in Table 1, and locations are shown in Figure 2 and Figure 3.

Sea-Level Trends

U.S. National Oceanographic and Atmospheric Administration (NOAA) forecasts of SLR in the region are approximately 0.3 m by 2040 and 1.5 m by 2100, according to the “Intermediate High” scenario. In other scenarios, the estimates are 0.26 m by 2040 and 2.17 m by 2100 (Intermediate Low), and 0.32 to 2.03 m in the High scenario. The figures are for Wilmington, N.C.; the estimates are only slightly different at other forecast sites in the study region [44]. Margolin and Halls [30] calculated relative SLR rates of 2.47 mm yr−1 for the Wilmington area from tide gage data, and [45] found acceleration of SLR in recent years of almost 0.05 mm yr−1 at Wilmington. Measured sea levels are also affected by stream flows [46], which have seen an apparent long-term increase in the region in the past 1.1 Ka [47], though discharges were higher in the late Pleistocene [48]. In a study showing accelerated SLR over the 2007–2019 period in the Waccamaw and Pee Dee Rivers, [49] found greater sea-level increases upstream and that these were affected by river discharges. Parkinson and Wdowinski’s [2] analysis showed that 2003–2022 trends are tracking with intermediate to high scenario-based estimates. Recent SLR rates in the Georgia Bight (which encompasses the study area) are nearly double any previous Holocene pace, and at the current rate, they estimate water level elevations relative to the 2000 datum will be 0.46 m higher by 2050 at Wilmington. They found even faster rates at Beaufort, N.C., near Cape Lookout.

3. Methods

Markers of aspects of sea-level effects on the study rivers include hydrological, geomorphological, ecological, and pedological indicators. The logic behind each is summarized below, along with the methods used to measure or estimate them. For each, the upstream-most occurrence or limit of the indicator was identified, and its distance upstream of the head of the estuary (HOE) was measured using GIS tools. The HOE is based on the proportion of the valley bottom width occupied by open water vs. marshes and swamps. As sea level drowns river valleys, the margins of the valleys are sites of wetland formation, which are eventually converted to open water as coastal submergence continues. Further upstream, narrower, more distinct channels are flanked by more extensive wetlands. The wetland/open water ratio is used in this study as an indicator of the head of the estuary and the lower boundary of the FETZ. The ratio of 0.5 (i.e., the FETZ begins at the point where wetlands and open water each occupy half the valley) used in this study generally corresponds with the occurrence of islands in the upper estuary and frequent low salinity conditions upstream.
Some potential indicators, listed below, were considered but not used. Some lowland rivers transform from a single to multi-channel planform as they approach their coastal outlets. Both distributary deltas and anastomosing multi-channel systems form where sediment transport capacity is reduced by low slope, resulting in sediment deposition. The onset of anastomosing often occurs within the FETZ, suggesting this as a potential morphological indicator of the upstream effects of SLR. However, pilot studies in the Carolinas showed that some rivers have only very short multichannel reaches or lack them altogether, making this an unreliable general indicator. Changes in sinuosity may occur in the lower reaches, but SLR effects on sinuosity (via channel slope) are variable due to the offsetting effects of base-level elevation rise vs. channel-shortening effects of upstream encroachment. Sinuosity is also influenced by other factors, such as bank resistance and flow regimes [17]. Both anastomosing patterns and sinuosity changes can also be related to tectonic effects rather than base-level changes. This has been shown to be the case for many of the study rivers affected by uplift arches in southeastern Virginia and southeastern N.C. and by a buried fault zone running approximately parallel to the coastline [40,41,42].
Backwater channels and embayments are features that may convey flow downstream at high river discharges but are commonly backflooded, with negligible downstream flow and occasional upstream flux. Such features are common in fluvial reaches affected by SLR. However, pilot studies found that embayed features often occurred well upstream of any possible coastal backwater effects.
In some areas, standing dead trees killed by waterlogging and/or salinity due to SLR are evident. They are called “ghost trees” because they become light colored due to bark loss and sun bleaching. Multiple ghost trees, particularly when surrounded by marsh vegetation, are a good indicator of inundation-driven vegetation change [4,30,50,51,52]. Ghost forests are easy to identify in the field and from aerial images and do not require special expertise. However, ghost forests (as opposed to individual dead trees, which are not reliable indicators) have not yet been identified near the inland or upstream leading edge of SLR effects, and the impacts of salinity and wetness vary considerably among affected tree species. Species-level identification is also difficult from images and from barkless dead trees.
SLR-driven shoreline or bank erosion where bald cypress (Taxodium distichum) grow can leave the trees—which, once established, can tolerate constant inundation with fresh or low-salinity water—stranded in open water. Stranded cypress stands are present in the Albemarle-Pamlico Sound rivers, but not otherwise. While individual stranded trees occur throughout the study river FETZs, stands associated with shoreline erosion, where found, were not located far from the HOE. Thus, while some stands of stranded cypress are apparently indicative of SLR effects, their absence may not be meaningful, and the indicator status of individuals or small patches is uncertain.

3.1. Backwater Effects

Backwater effects occur at the transition from uniform to non-uniform flow, where stream flows are slowed, blocked, impeded, or reversed by base level effects, astronomical or wind tides, or storm surges. Here the concern is with coastal backwater effects on the main river channels, as opposed to backwater effects of lakes or dams (none of which occur within the study reaches). These were assessed based on gaging stations, mapping of the limit of mean higher high water (MHHW) flooding, and independent assessments based on topography. All upstream length or distance measurements are based on distance along the channel centerline using GIS tools.
Where water level (stage or gage height) or flow (discharge) measurements are available, backwater effects are indicated by tidal oscillations in stage and/or discharge, negative (upstream) flows, and changes in water level unrelated to incoming flows from upstream. Such measurements are available at U.S. Geological Survey (USGS) gaging stations. Additional water level measurements are made at other locations in some cases by the U.S. National Weather Service (NWS) and cooperating agencies in support of NWS flood prediction programs. On two ungaged rivers (Newport and Sampit), the location of tidal prediction stations is indicates a minimum upstream limit of backwater effects.
For each study, river data from the lowermost gaging station was examined for evidence of backwater effects. Successive upstream stations were then examined, if available, until a station was reached with no evidence of backwater effects. This enabled the identification of a river reach in which the upstream limit of backwater effects occurred, but this was often tens of km long.
The U.S. National Oceanic and Atmospheric Administration (NOAA) mapping tool for estimating the impacts of SLR includes areas directly hydrologically connected to the ocean that are currently inundated at the mean higher high water (MHHW) elevation for designated locations at the coast. The MHHW elevation is established by analysis of tidal gage records and accounts for the effects of geophysical influences on sea surface elevations and climate phenomena such as ENSO (El Niño-Southern Oscillation). The inundation levels are then projected using a bathtub-type model (i.e., assuming the inundated topography is unchanged) using the best available digital elevation model data, which in the study area is generally 3 m horizontal resolution or finer. Methods are described by NOAA OCM [53,54]. The NOAA tool also includes maps of areas subject to high tide flooding, often called “recurrent or nuisance flooding”, defined as water levels exceeding local thresholds for minor impacts to infrastructure. These are based on national flood thresholds established using methods described in [55]. The upstream limits of both MHHW inundation and high tide flooding were measured.
The limit of backwater effects was also estimated based on an independent assessment of channel elevations. Where the channel bed is below mean sea level, some backwater effects must occur, but the effects extend at least some distance upstream of this point.
Digital elevation model (DEM) data at 10 m horizontal resolution were obtained from the USGS 3D Elevation Program (3Dep), based on bare-earth LiDAR measurements, which are available throughout the study area. These provided a rough indicator of where channel beds are below or only slightly above sea-level. The estimated upstream limit of backwater effects was established at the point where channel bed elevations were ≤1 masl and at least some of the adjacent floodplain was ≤2 masl. These were established based on the general trend of the riverbed profile rather than on local pits or spikes that could be due to topographic irregularities such as bars, riffles, or pools, or to DEM errors.
No independent channel slope data are available, but the limit of backwater effects is negatively associated with slope. Estimated mean channel slopes from the upstream limit of backwater effects to the head of the estuary were computed by determining water depth at the HOE from nautical charts, using the electronic versions accessible from the NOAA Office of Coast Survey https://nauticalcharts.noaa.gov/enconline/enconline.html, accessed on 4 May 2024). Slopes were then calculated based on (HOE depth + 1)/backwater distance in meters. Note that the datum for the DEM data is NAV88, while the datum for the water depths is local mean lower low water.

3.2. Wetlands

Salt- and brackish-water wetlands in the study region are marshes dominated by salt-tolerant grasses, rushes, sedges, and shrubs. Further upstream within the FETZ, freshwater marshes are found, and swamps dominated by woody vegetation are variously characterized as bottomland hardwood swamps or tidal freshwater forested wetlands. The marsh/swamp transition is often characterized by a zone of interspersed trees and marsh. The marsh/swamp difference is easily recognized from aerial imagery, though specific vegetation types cannot be reliably identified this way. The conversion of swamp to marsh is a recognized diagnostic of increased salinity due to SLR.
FETZs frequently lack well-defined banks or feature low banks that are frequently overtopped. This is associated with a transition from seasonally flooded swamps upstream to semi-permanently flooded swamps downstream. While the vegetation of the semi-permanently and seasonally flooded swamps has considerable overlap, the hydrological and morphological differences are attributable to the local flow regime and thus linked to backwater effects impacted by SLR.
Semi-permanently flooded wetlands (SPFW) include swamps and marshes that are inundated most of each year, or on each tidal cycle. Even when not inundated, these wetlands have water tables <30 cm and usually <15 cm from the surface. Fieldwork in Swift Creek and the lower Tar, Neuse, Trent, Waccamaw, Little Pee Dee, and Newport Rivers suggested that these wetland types correspond closely with the very low or no-bank sections of the rivers. In the Neuse, the upstream limit of these wetlands occurred within the FETZ, upstream of some other indicators, suggesting the possibility of a good indicator of the upstream leading edge of backwater effects [12]. In the upper estuaries and lowermost FETZ, these are mainly brackish marshes, and further upstream patches of freshwater marsh occur. Generally, however, these are bottomland hardwood swamps.
The upstream limit was first determined from U.S. National Wetlands Inventory maps (NWI; https://www.fws.gov/program/national-wetlands-inventory/wetlands-mapping; last accessed 14 May 2024), with classification based on salinity, vegetation physiognomy, and hydrological regime. Because some NWI maps are based on older and/or low-resolution imagery, the boundary was checked against at least two of the following: field observations, DEM-based topography, high-resolution aerial imagery, and soil maps. The upstream boundary of SPFW was sometimes adjusted based on this additional evidence.
The NWI classification codes have a form such as PFO1/2T, where the leading letter indicates the general wetland or deepwater system (P, for example, indicates palustrine and includes a variety of nontidal and freshwater tidal wetlands). The next letter(s) indicate general vegetation physiognomy (e.g., FO = forested), and the number(s) following are vegetation subclasses (e.g., 1 = broad-leaved deciduous; 2 = needle-leaved deciduous). The final letter indicates the water regime, where T is semi-permanently flooded tidal. Water regimes indicated by F (semi-permanently flooded) or T were used to identify the upstream limit of semi-permanently flooded wetlands. The typical transition is from PF01/2F (palustrine forested, broadleaf deciduous/needle-leaved deciduous, semi-permanently flooded) to forested wetlands with a water regime of C (seasonally flooded). The PFO1/2C or F designation within the study region indicates bottomland hardwood swamps dominated by bald cypress (a deciduous conifer) and various broad-leafed hardwoods such as swamp tupelo, water tupelo, red maple, water hickory, and black ash.
The NWI analysis considered only wetlands directly adjacent to channels (some SPFW occur in backswamp depressions). In some South Carolina study rivers, adjacent SPFW occur in river sections affected by tectonic movements in the upper coastal plain; these were not considered.

3.3. Floodplain Histosols

Soils are products of the combined, interacting effects of climate, biota, topography, hydrology, parent material, and time. Soils are mapped and interpreted in this context, and thus soil types can serve as indicators of depositional environments of the parent material, geomorphic setting, hydrology and drainage, and geomorphic age. Kroes et al. [17] showed that hydrogeomorphic features and traits exist that are characteristic of river reaches transforming from fluvial to tidal. As soils reflect hydrogeomorphic (and other) factors, certain soil types are indicative of sea-level encroachment in coastal plain river valleys. Daniels et al. [56] suggested that the upstream limit of the Dorovan series (Dysic, thermic Typic Haplosaprists in U.S. Soil Taxonomy) corresponded with the effects of Holocene sea-level rise on alluvial soils. Phillips [12,57] confirmed this relationship in the Neuse River FETZ. Similar transitions from dominantly mineral to dominantly organic soils occur in the FETZ of other rivers in the Carolinas. Such a transition implies low mineral sediment input, which is consistent with the locus of sediment deposition moving upstream, and low rates of organic matter decomposition due to anaerobic conditions associated with waterlogging.
Soil maps were obtained from SoilWeb (https://casoilresource.lawr.ucdavis.edu/gmap/, accessed on 14 June 2024), based on U.S. Department of Agriculture Natural Resources Conservation Service soil mapping at a 1:24,000 scale. In addition to the Dorovan series, other swamp (as opposed to marsh or pocosin wetland) Histosols mapped in riparian areas include the Hobonny and Chowan Series. Hobonny is a Euic, thermic Typic Haplosaprist, differing from Dorovan only with respect to acidity (Euic and Dysic families are distinguished based on pH of ≥4.5 or <4.5, respectively). The Chowan series is a Fine-silty, mixed, active, nonacid, thermic Thapto-Histic Fluvaquent consisting of mineral soil with limited pedogenic development overlying a thick organic buried soil. It is interpreted as representing historical soil erosion from adjacent land deposited on a Dorovan-like sapric peat or muck [13,58].
In some older surveys, such as on some portions of the lower Tar River, wet alluvial soils were mapped simply as “swamp”. Many of these may be Dorovan, Hobonny, or similar soils. These were evaluated on a case-by-case basis using field observations.

3.4. Terrace Burial

Quaternary sea-level changes have resulted in a series of river aggradation and floodplain formation episodes, interspersed with periods of river incision, forming alluvial terraces. As sea level rises, the terraces are progressively buried by Holocene alluvium, as several studies on the Atlantic and Gulf coastal plains have shown [12,48,59,60,61,62,63]. Terrace remnants at valley sides are difficult to interpret in this regard and are often found even in estuarine areas. However, terrace remnants preserved as islands surrounded by lower-elevation alluvium typically disappear in lower river valleys. These remnants may be recognized topographically or in terms of composition and soil types. Where such terrace islands are present but disappear in the lowermost river reaches—especially if valley-side terrace remnants are present—this suggests that mid-river corridor islands have been buried. Ogg et al. [64] refer to these remnants as intra-swamp terraces. These features indicate terrace remnants isolated by channel changes during Pleistocene floodplain-building and incision cycles [12,64,65].
Seven alluvial terrace soil series are found in lower coastal plain river valleys in the study area. These are somewhat poorly to excessively drained, as opposed to the poorly- or very poorly drained adjacent floodplain soils. They range from weakly developed sandy Entisols to Ultisols. These soils sometimes occur as islands surrounded by floodplain soils in the lower river bottoms. Where this is the case, there is a location downstream of which they do not occur as islands within the floodplain but where remnants are still present along valley sides. This downstream point is evidence of the upstream extent of terrace burial, a process associated with back-stepping (as termed by coastal sedimentologists). The terrace remnant islands were identified using the soil mapping tools mentioned above and checked against DEM-based topographic profiles across the floodplain. In all cases, the terrace islands were associated with topographic highs at least 2 m higher than surrounding wetlands.
No dates are available for terrace remnants, but their geomorphic and stratigraphic context is clearly Pleistocene. An origin as alluvial terraces is indicated by their location and context, interpretation by soil mappers, and soil-geomorphic studies at some sites within the region [12,43,56,58,64].

3.5. Field Observations

Field observations were conducted (mainly via kayak but also on foot and by powerboat) in portions of the Tar River, Tranter’s Creek, Neuse, Trent, and Newport Rivers, Swift Creek, Waccamaw, Pee Dee, and Little Pee Dee Rivers. The focus was on identifying areas with very low or indistinct banks (typically associated with organic soils) and organic epipedons.

4. Results

4.1. Backwater Effects

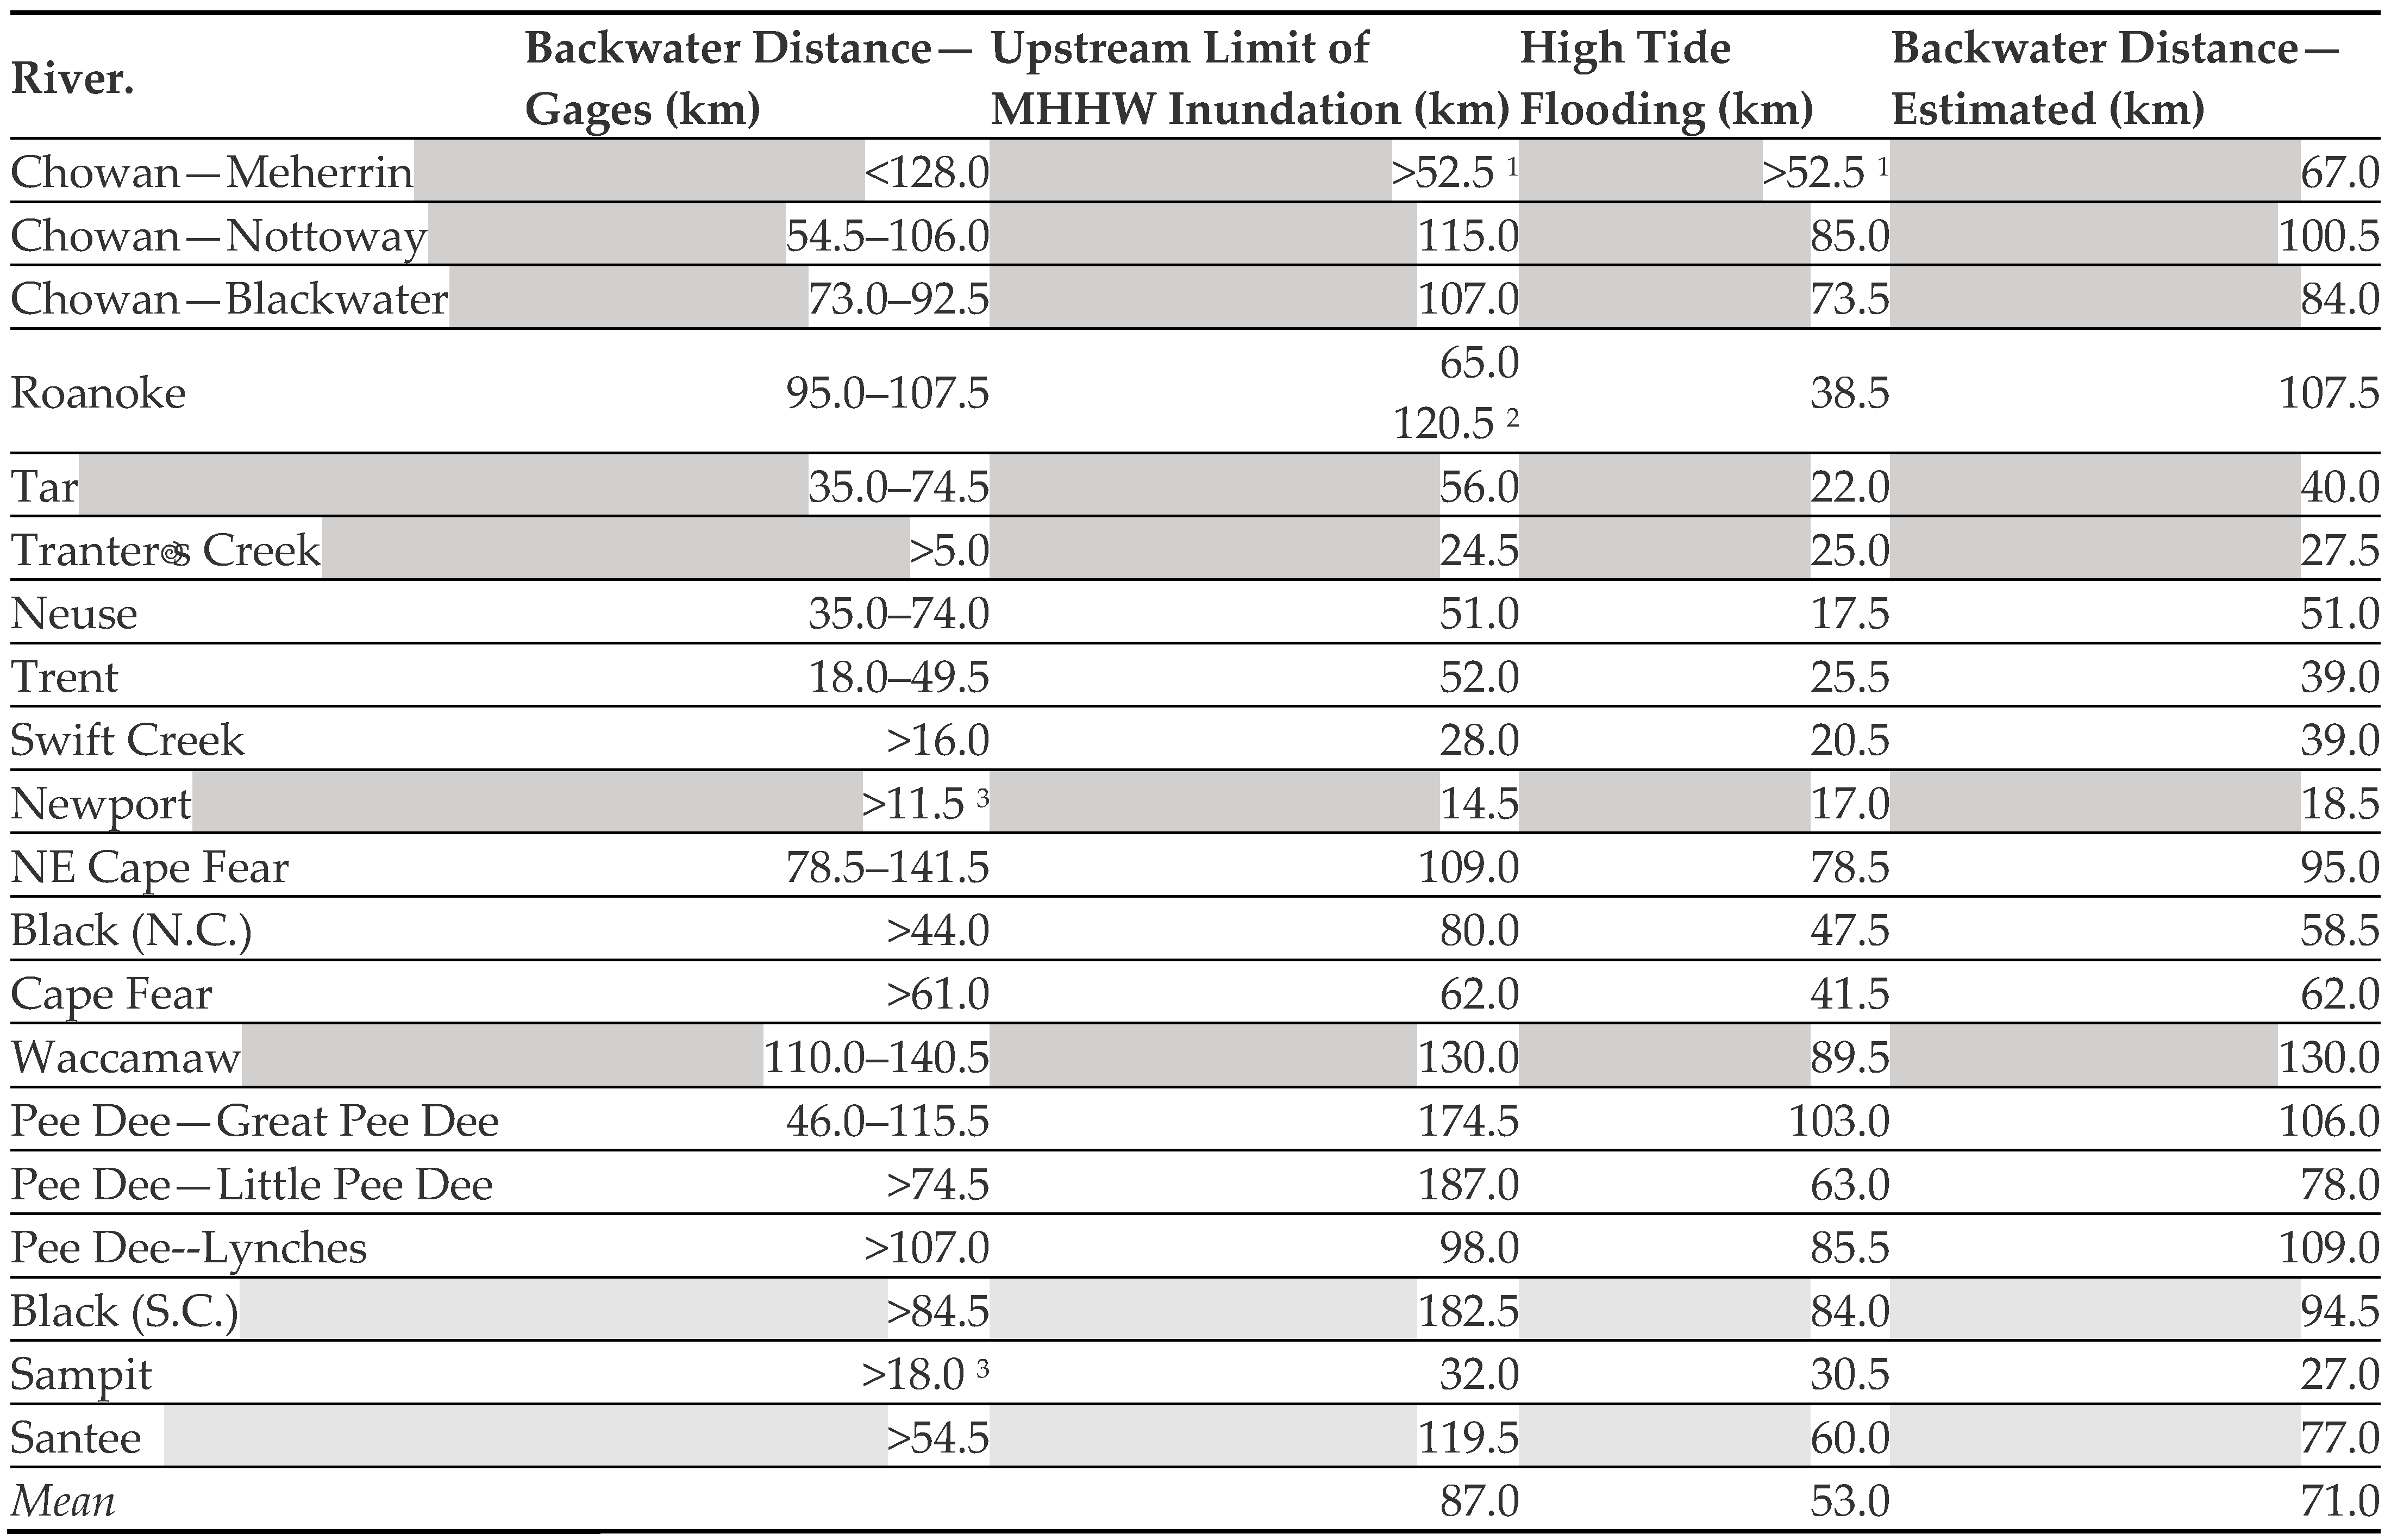
The upstream limit of backwater effects is shown in Table 2. In the “gages” column, a less-than (<) sign means the downstream-most gaging site shows no evidence of tidal oscillation or backwater effects. A greater-than (>) sign indicates that backwater effects are evident at the only station. Where a range is shown, the lower end corresponds to the upstream-most station where such effects are evident and the next gaging station upstream, where the effects are not observed.
The “estimated” column shows the estimated upstream limit of backwater effects based on channel elevations ≤1 m above sea level (masl) and adjacent floodplain elevations ≤2 masl. Also shown are the upstream limits of inundation at MHHW flooding and of high tide flooding.
The gaging stations are the most direct and accurate indication of backwater effects, but the least precise in terms of the upstream limit. In eight cases, the backwater estimate, MHHW limit, and high tide flood limit are all consistent with the gages. The estimated backwater limit based on channel bed and adjacent floodplain elevations is consistent with the gages in all 20 rivers. The mapped upstream limit of high tide flooding was within the range indicated by gages in 11 cases and the MHHW inundation limit in 14. The MHHW inundation estimates are much farther upstream than the other estimates in the Great and Little Pee Dee Rivers and (S.C.) Black River systems, all of which are tributaries to Winyah Bay, but not in the Lynches (a Pee Dee Tributary) or the Sampit River, which flows into Winyah Bay. The MHHW estimate for the Santee River is also much further upstream than any of the other backwater effect indicators. The estimated backwater limit is accepted as the best estimate in further analysis and discussion below.
The length of backwater effects upstream from the head of the estuary ranges from 27 km (Sampit River) to 130 km (Waccamaw River). There is no apparent relationship with drainage area (the best-fit equation yields R2 = 0.15). While the rivers with the smallest drainage areas all have backwater lengths < 40 km, the two with the longest backwater lengths (Waccamaw and Lynches Rivers) do not have large watersheds compared to some of the other rivers. Cape Fear, with the fourth largest drainage area, has a backwater length less than the mean for the study rivers. There is also no evident relationship with tidal ranges in the receiving estuary—rivers draining to the same estuary often have quite different backwater lengths.
The apparent upstream limit of backwater effects as reflected in the channel morphology of the Santee River, with the largest drainage area, does not appear to be influenced by the dams. Likewise, navigation locks and dams on the Cape Fear do not appear to influence the location of the backwater limit. In both cases, however, a lack of influence cannot be ruled out.
Channel slope is inversely related to upstream encroachment for a given increase in water level. Lower slopes are associated with more rapid upstream propagation of backwater effects, and vice versa. The mean slopes ranged from 1.15 to 43.3 × 10⁻⁵, with a mean, median, and standard deviation of 8.57, 7.30, and 8.98 × 10⁻⁵, respectively. The Sampit River has an anomalously high slope, nearly 3.5 times that of the next steepest; this is apparently due to dredging in the lower channel associated with the port of Georgetown. Dredged channels may also affect the depth and, thus, the slope of rivers in the Cape Fear system. Dredged channels in the Newport River are well downstream of the HOE.

4.2. Semi-Permanently Flooded Wetlands

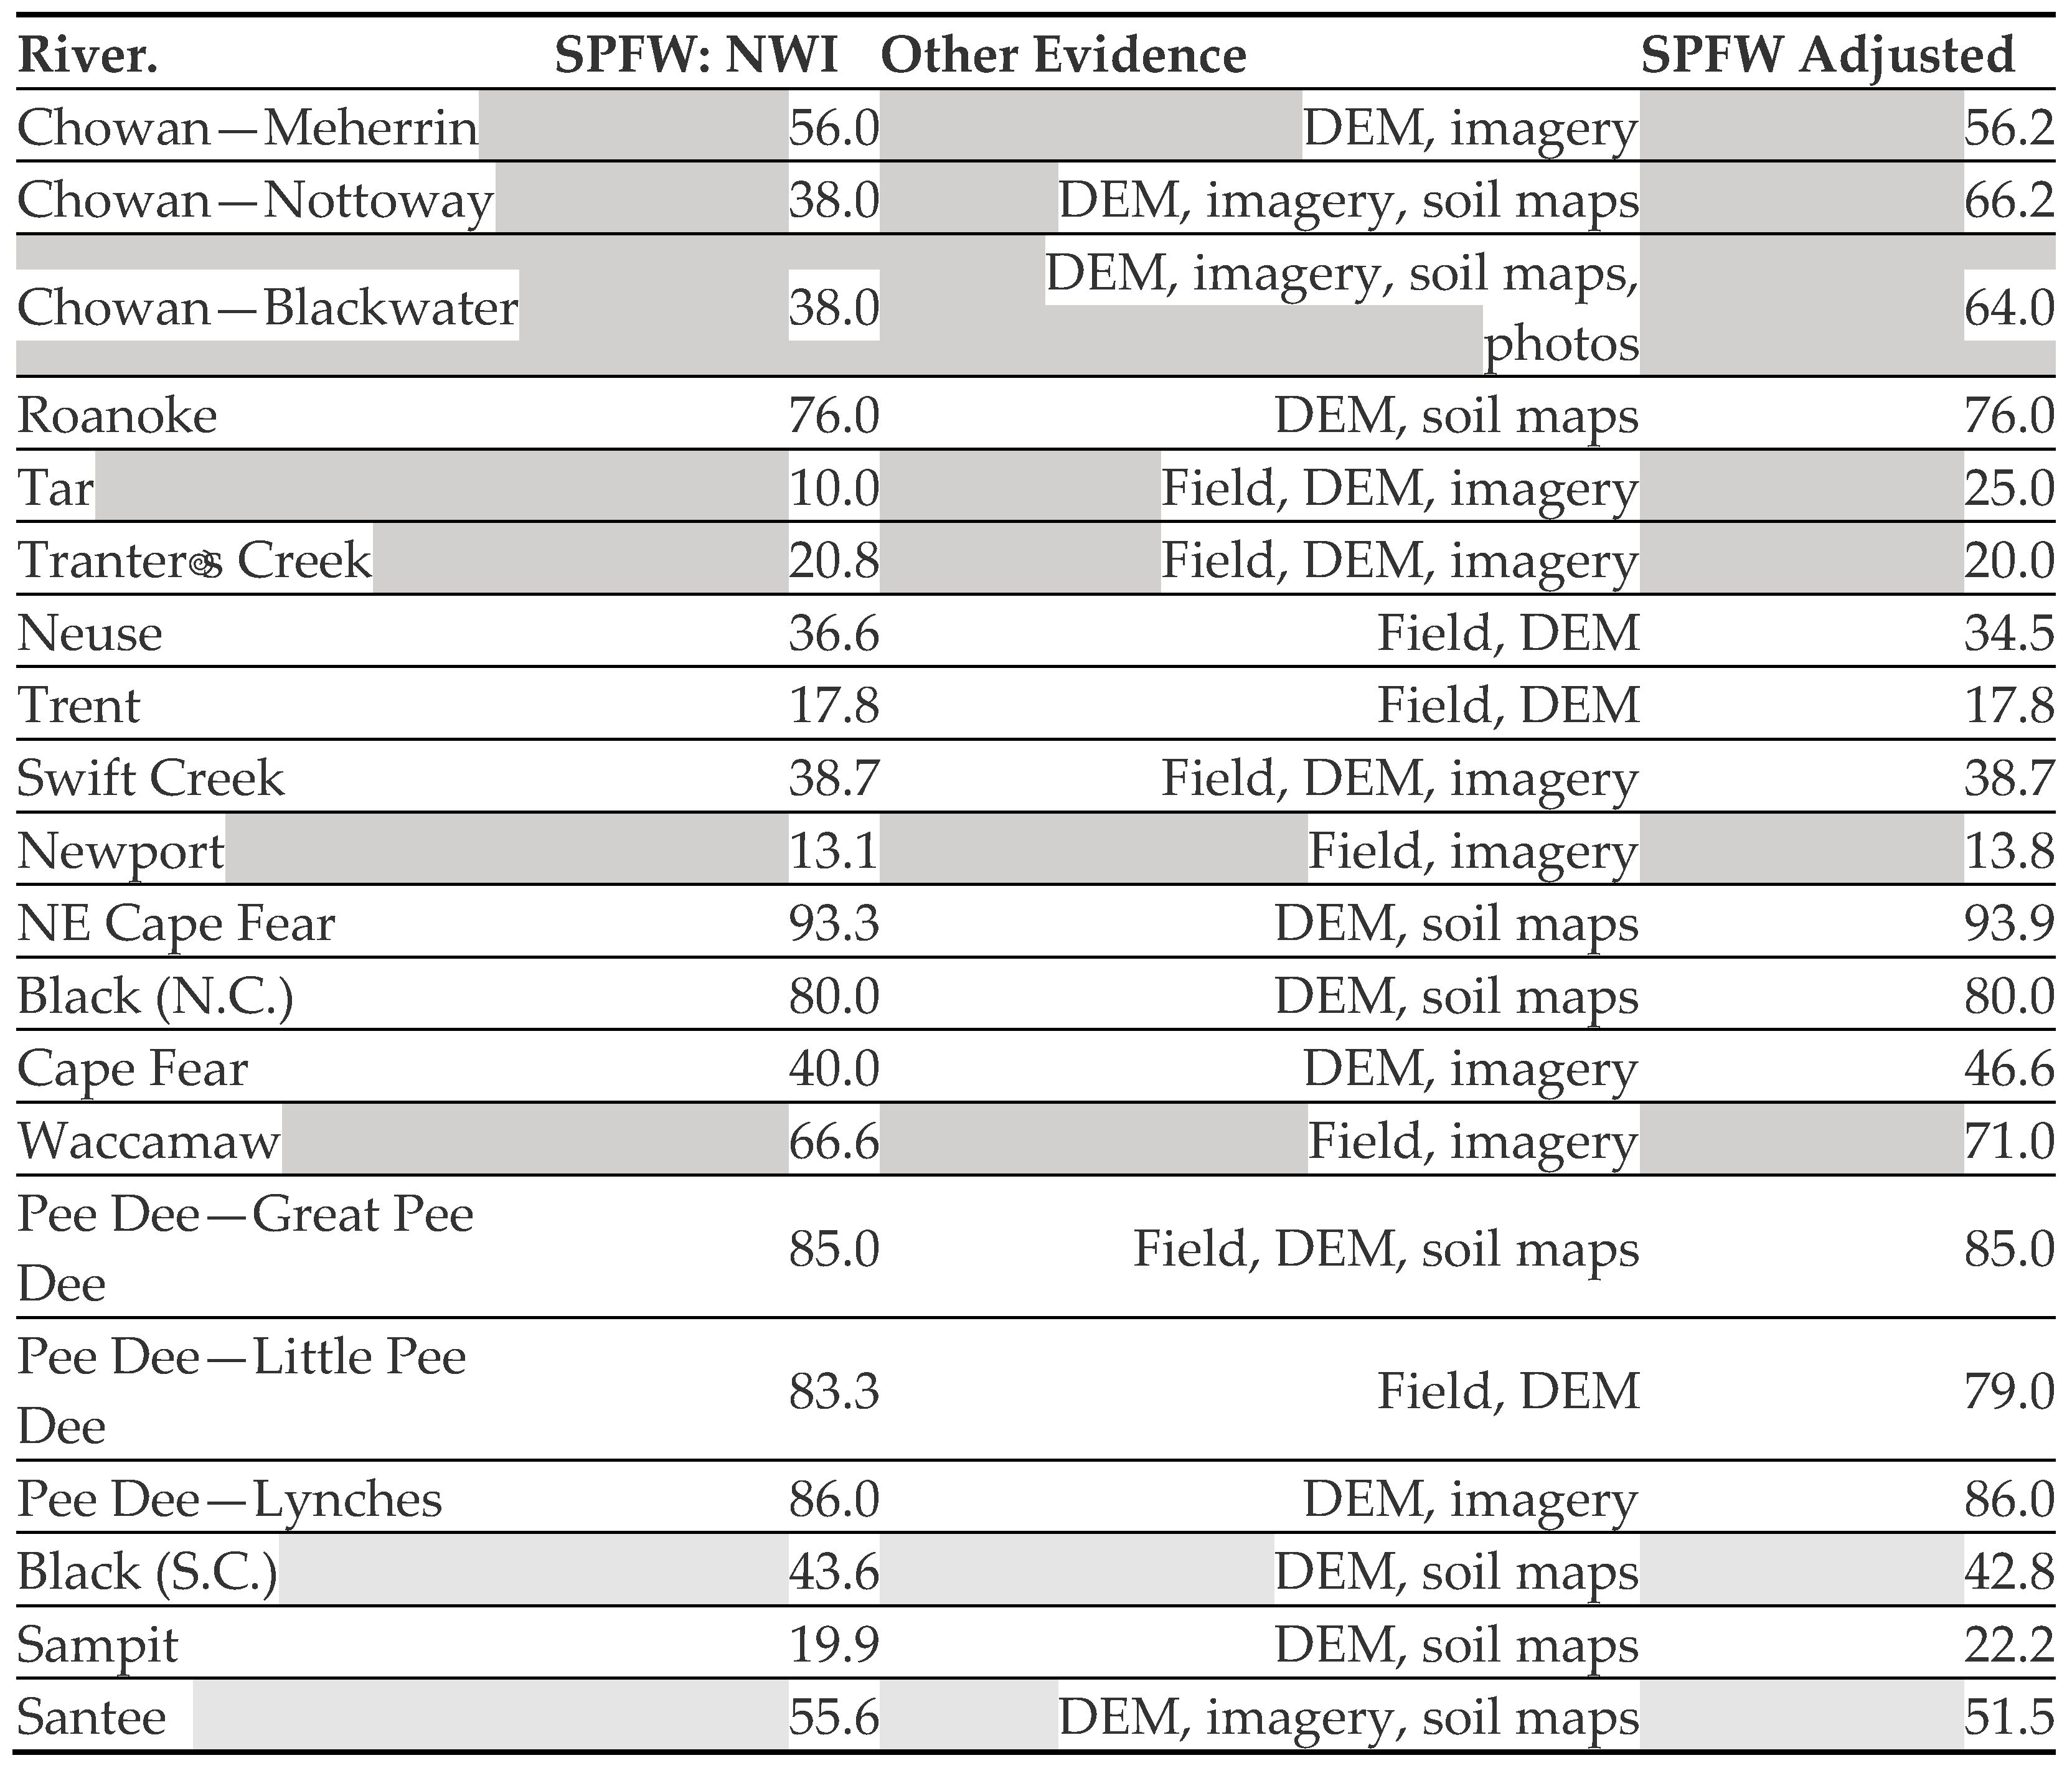
Once the upstream limit according to the NWI map was identified, other evidence as described in the methods section was used to confirm or adjust the boundary. In 18 cases, the adjusted boundary was the same as, or within a few river kilometers of, the NWI boundary (Table 3). Of these, the largest difference (about 6.5 km) was on the Cape Fear River; in 14 cases, the difference was <1 km. The exceptions were the Nottoway and Blackwater Rivers, where the wetlands inventory maps show no semi-permanently flooded wetlands upstream of their junction with the Chowan. In those cases, the boundary was adjusted according to the presence of very poorly drained organic soils, floodplain surfaces ≤2 masl as indicated by the DEMs, aerial imagery consistent with frequently flooded sites, and photographs discovered via online image searches that show very low or indistinct banks nearby. In the 12 rivers where adjustments were made, the boundary was shifted further upstream in seven and downstream in five.
The adjusted distances range from about 14 to 94 km (Newport and NE Cape Fear Rivers, respectively), with a mean of 51.8 km (standard deviation 27.1). The SPFW distance as a proportion of the length of backwater effects averaged 0.72 (standard deviation 0.26). In two cases (Black River, N.C.; Little Pee Dee River), the ratio was >1 (i.e., SPFW occurred further upstream than the limit of coastal backwater effects). In two other cases, the ratio was near 0.99 (Swift Creek, NE Cape Fear River). The lowest ratios (0.28; 0.432) were in the Tar and Newport Rivers.

4.3. Floodplain Histosols

The three most common organic floodplain soils are the Dorovan, Hobonny, and Chowan series. One or more of these were found on every study river except the Santee. The Pamlico series (see Table 4), which is sometimes also found in upland depressions, was found along the Santee and (N.C.) Black Rivers. Only riparian map units adjacent to main channels were included in the inventory. In some cases, the alluvial Histosols are found in backswamp depressions some distance from the main channel that cannot be regularly influenced by backwater effects from the river channel. In the Cape Fear River system and the South Carolina rivers, the Dorovan and Hobonny series also occur along anomalously low-gradient stream segments or depressions associated with tectonic movements along buried faults, as described by [40]. These are too far upstream to be influenced by coastal backwater effects and were also not considered in identifying the furthest upstream occurrence of the organic floodplain soils.
The Dorovan was more common in the North Carolina rivers and the Hobonny in South Carolina. These differ only with respect to pH of <4.5 (Dorovan) or >4.5. As some survey areas indicate that their Dorovan map units are taxadjuncts that may not meet the acidity criteria, these series are considered equivalent for the purpose of this study. The Chowan series (a histosol buried by mineral soil) occurs in the Chowan and Cape Fear River systems. Because of its higher pH and occurrence adjacent to uplands currently or historically used for agriculture, it is interpreted in the Chowan County, N.C., soil survey, where the series was established in 1982, as representing recent or historical erosion of limed agricultural areas resulting in deposition on existing peat and muck soils [58].
The variations of different soil survey units were sometimes evident, reflecting different time frames, field surveyors, and survey compilers. In the Tar River, for example, the river and Tranter’s Creek serve as part of the county line separating Beaufort and Pitt Counties, N.C. Floodplain soils mapped as Dorovan occur on the more recently surveyed Beaufort County side, with “swamp” mapped across the river in the older Pitt survey (in recent digital maps these have been redesignated as the Johnston series, though fieldwork shows some true Histosols). For another example, on the (N.C.) Black River, Dorovan and Chowan soils seem to disappear at the New Hanover/Pender County line, with organic soils (Dorovan and Pamlico) reappearing where the river crosses the Pender/Bladen County line.
The upstream extent of these soils from the head of the estuary ranged from about 1 km (Trent) to nearly 82 km (Black River, S.C.), with a mean of 31.6 km (standard deviation 22.9). These distances were compared to the upstream limit of backwater effects, with no general relationship. The organic floodplain soil/backwater effects distance ratios range from 0.3 to 0.86 (mean ratio 0.49; standard deviation 0.23).
The floodplain Histosol limit was less (it did not extend as far upstream) than the upstream limit of semi-permanently flooded wetlands in 15 of 20 cases.

4.4. Intra-Swamp Alluvial Terrace Soils

Islands of mineral soils surrounded by poorly and very poorly drained floodplain soils occurred in 18 of the 20 rivers, the exceptions being the two small tidal rivers (Sampit and Newport). In every case, these terrace island soil map units were associated with local topographic highs indicated on DEMs and topographic maps. Non-island terrace soils along the valley side walls occur downstream of the terrace islands, indicating that the termination of the island remnants is not because there was no terrace formation downstream. The downstream-most terrace island, interpreted as the upstream limit of terrace burial, occurred from 2 (Trent River) to 54 km (Pee Dee River and tributaries) upstream of the head of the estuary. In Tranters and Swift Creeks, the organic floodplain soil upstream limit occurred only a short distance downstream of the buried terrace boundary.

4.5. Forest-Marsh Transitions

Forest-to-marsh transitions were observed only in the lowermost FETZ and HOE areas. These thus represent the trailing edge of SLR effects on the rivers.
Ghost forests and other vegetation indicators of SLR effects are present on many of the study rivers (for instance, ghost forests along the Cape Fear and Northeast Cape Fear Rivers are easily visible from highway bridges in the Wilmington area) and probably present to some extent on all of them. However, in these cases, they occur in conjunction with forest-to-marsh conversions in the lower FETZ near the head of the estuary. Like the transitions, ghost trees showing evidence of salinity-based mortality linked to SLR are found only in the lower FETZ and estuary areas [66].

4.6. Comparison

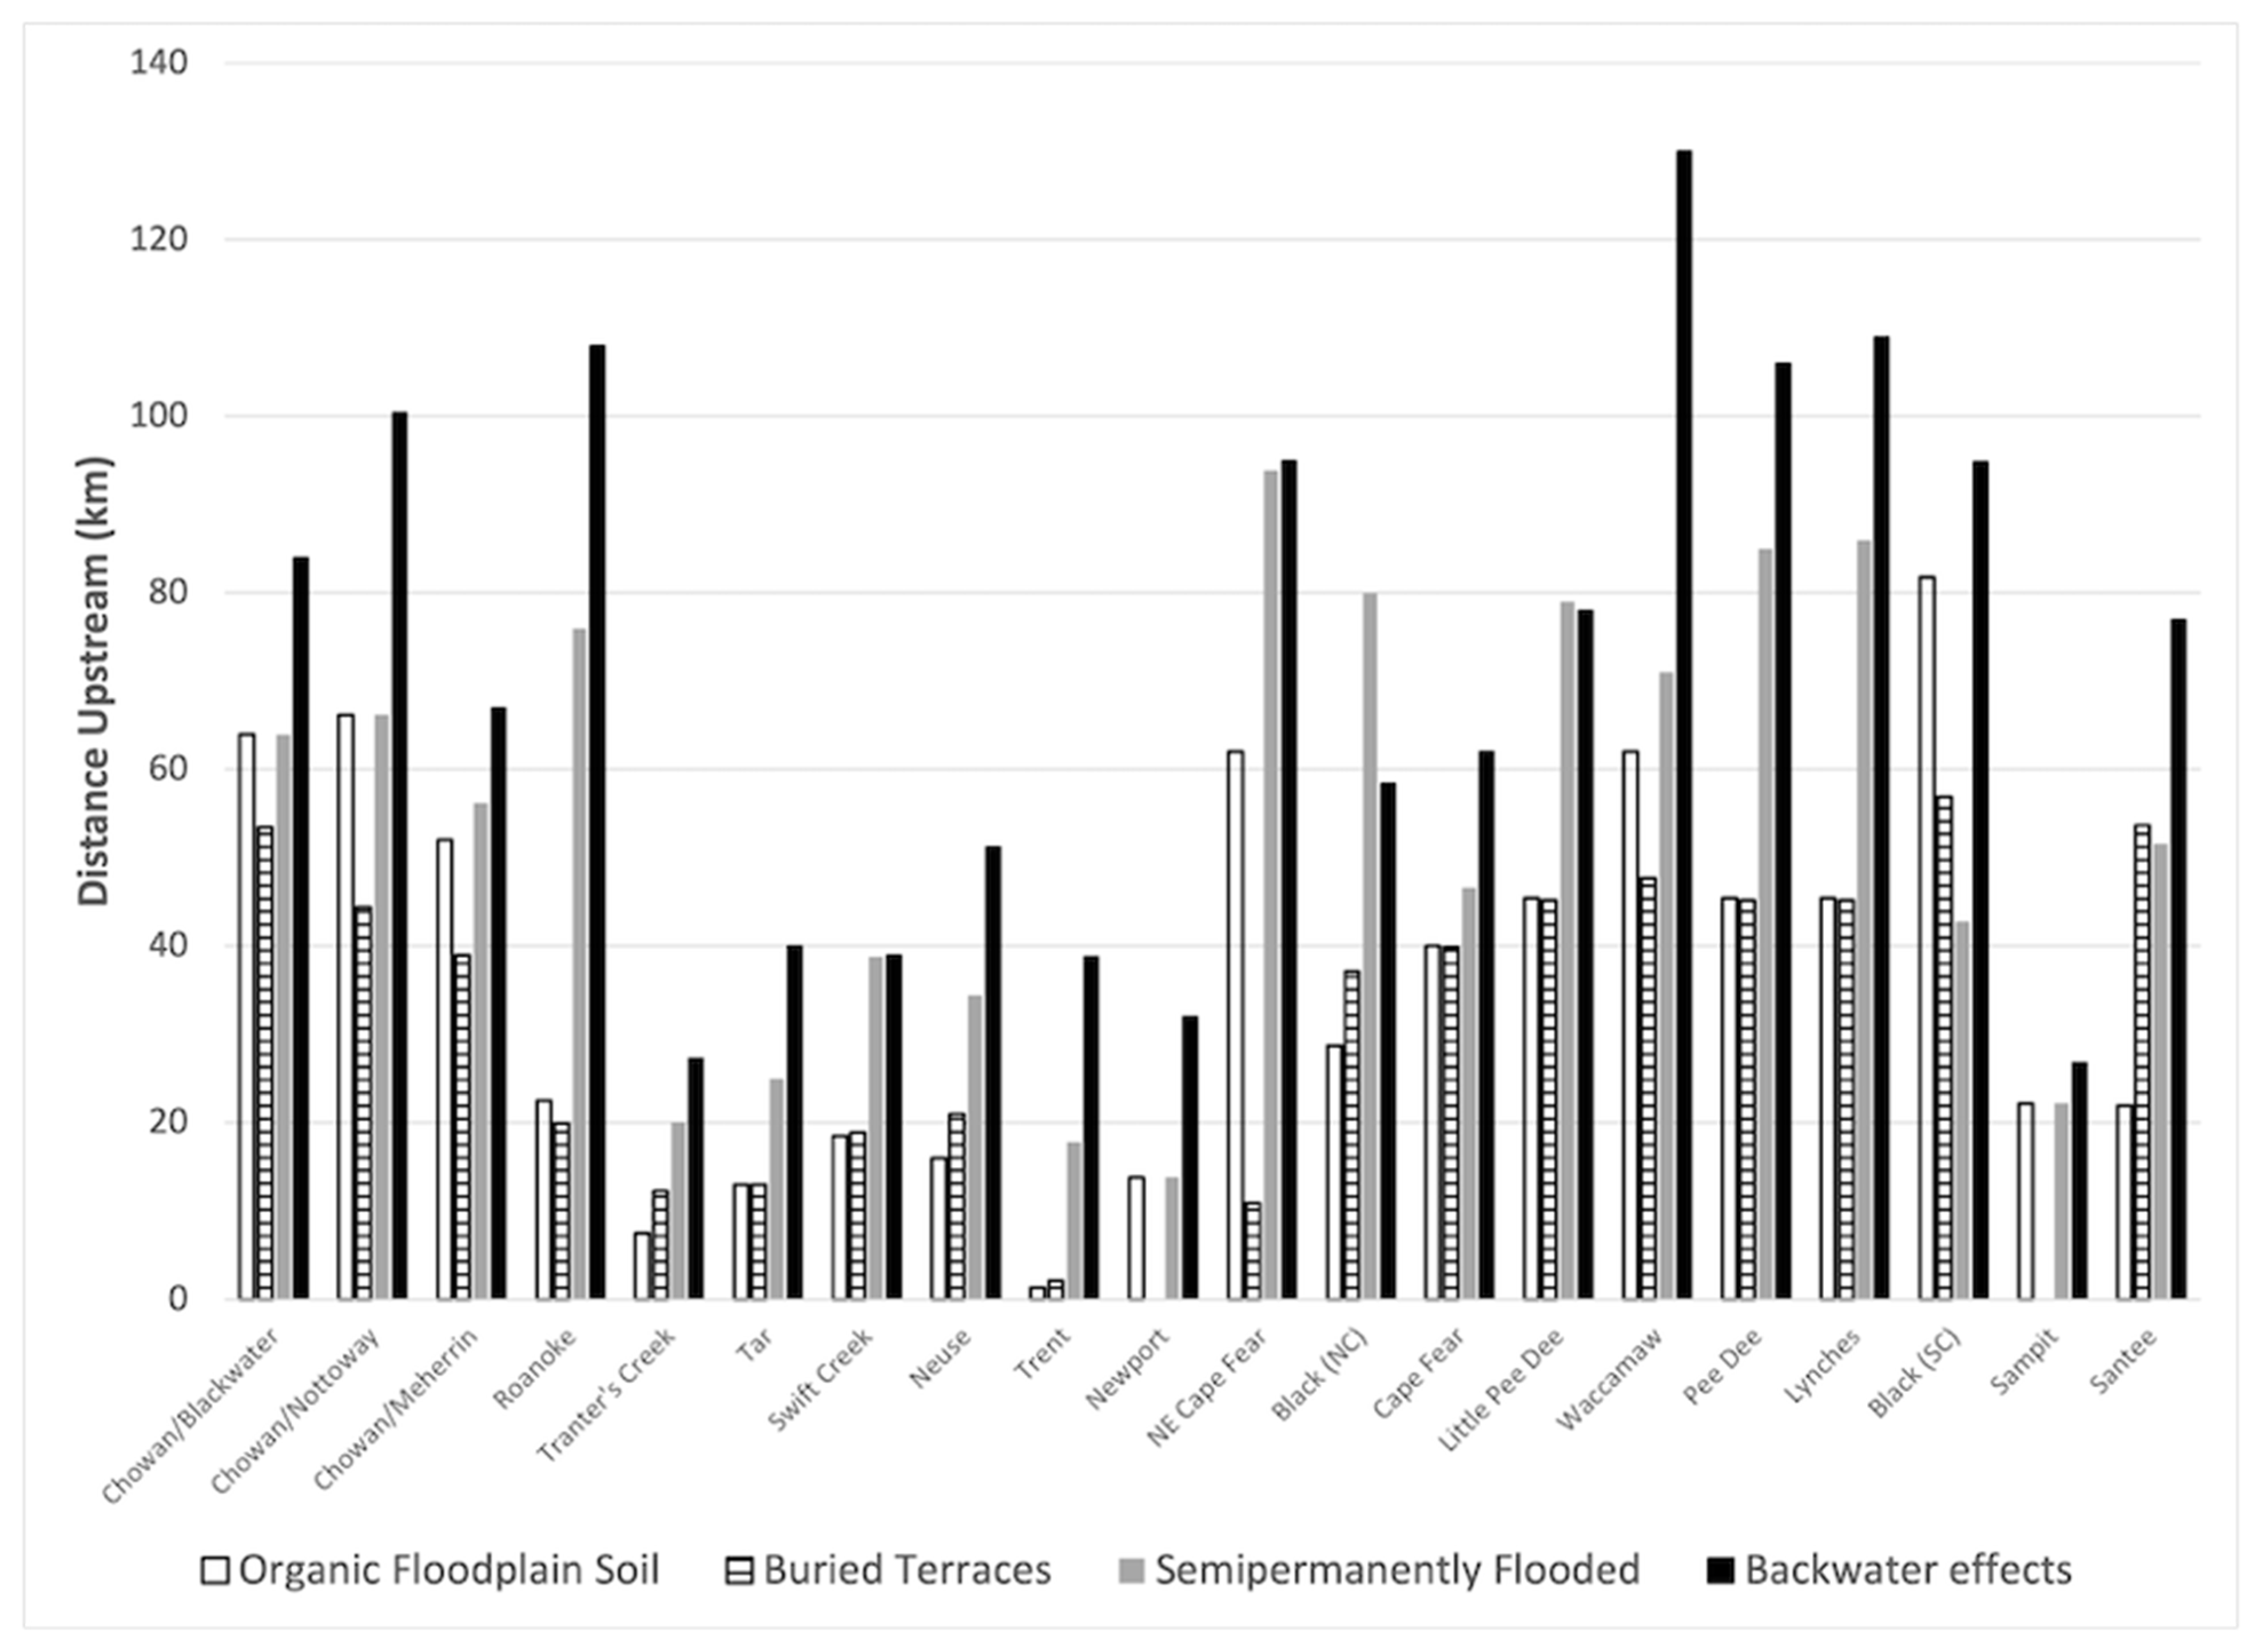
Figure 4 compares the upstream limits of organic floodplain soils, buried terrace islands, semi-permanently flooded wetlands, and backwater effects. The backwater effects encompass the other three indicators in all rivers except the N.C. Black River. In the latter case, the SPFW occurs in floodplain depressions at a lower elevation than the river channel, in a tectonically influenced area where the Tomahawk lineament cuts across the flank of the Cape Fear Arch [40].
The backwater limit and the upstream SPFW boundary in the NE Cape Fear River are also in an area associated with tectonic effects ([40], Figure 12), On the Cape Fear, the wetland and backwater boundaries are in an area of anomalous river morphology and depressions associated with the East Coast Fault System [40,42].
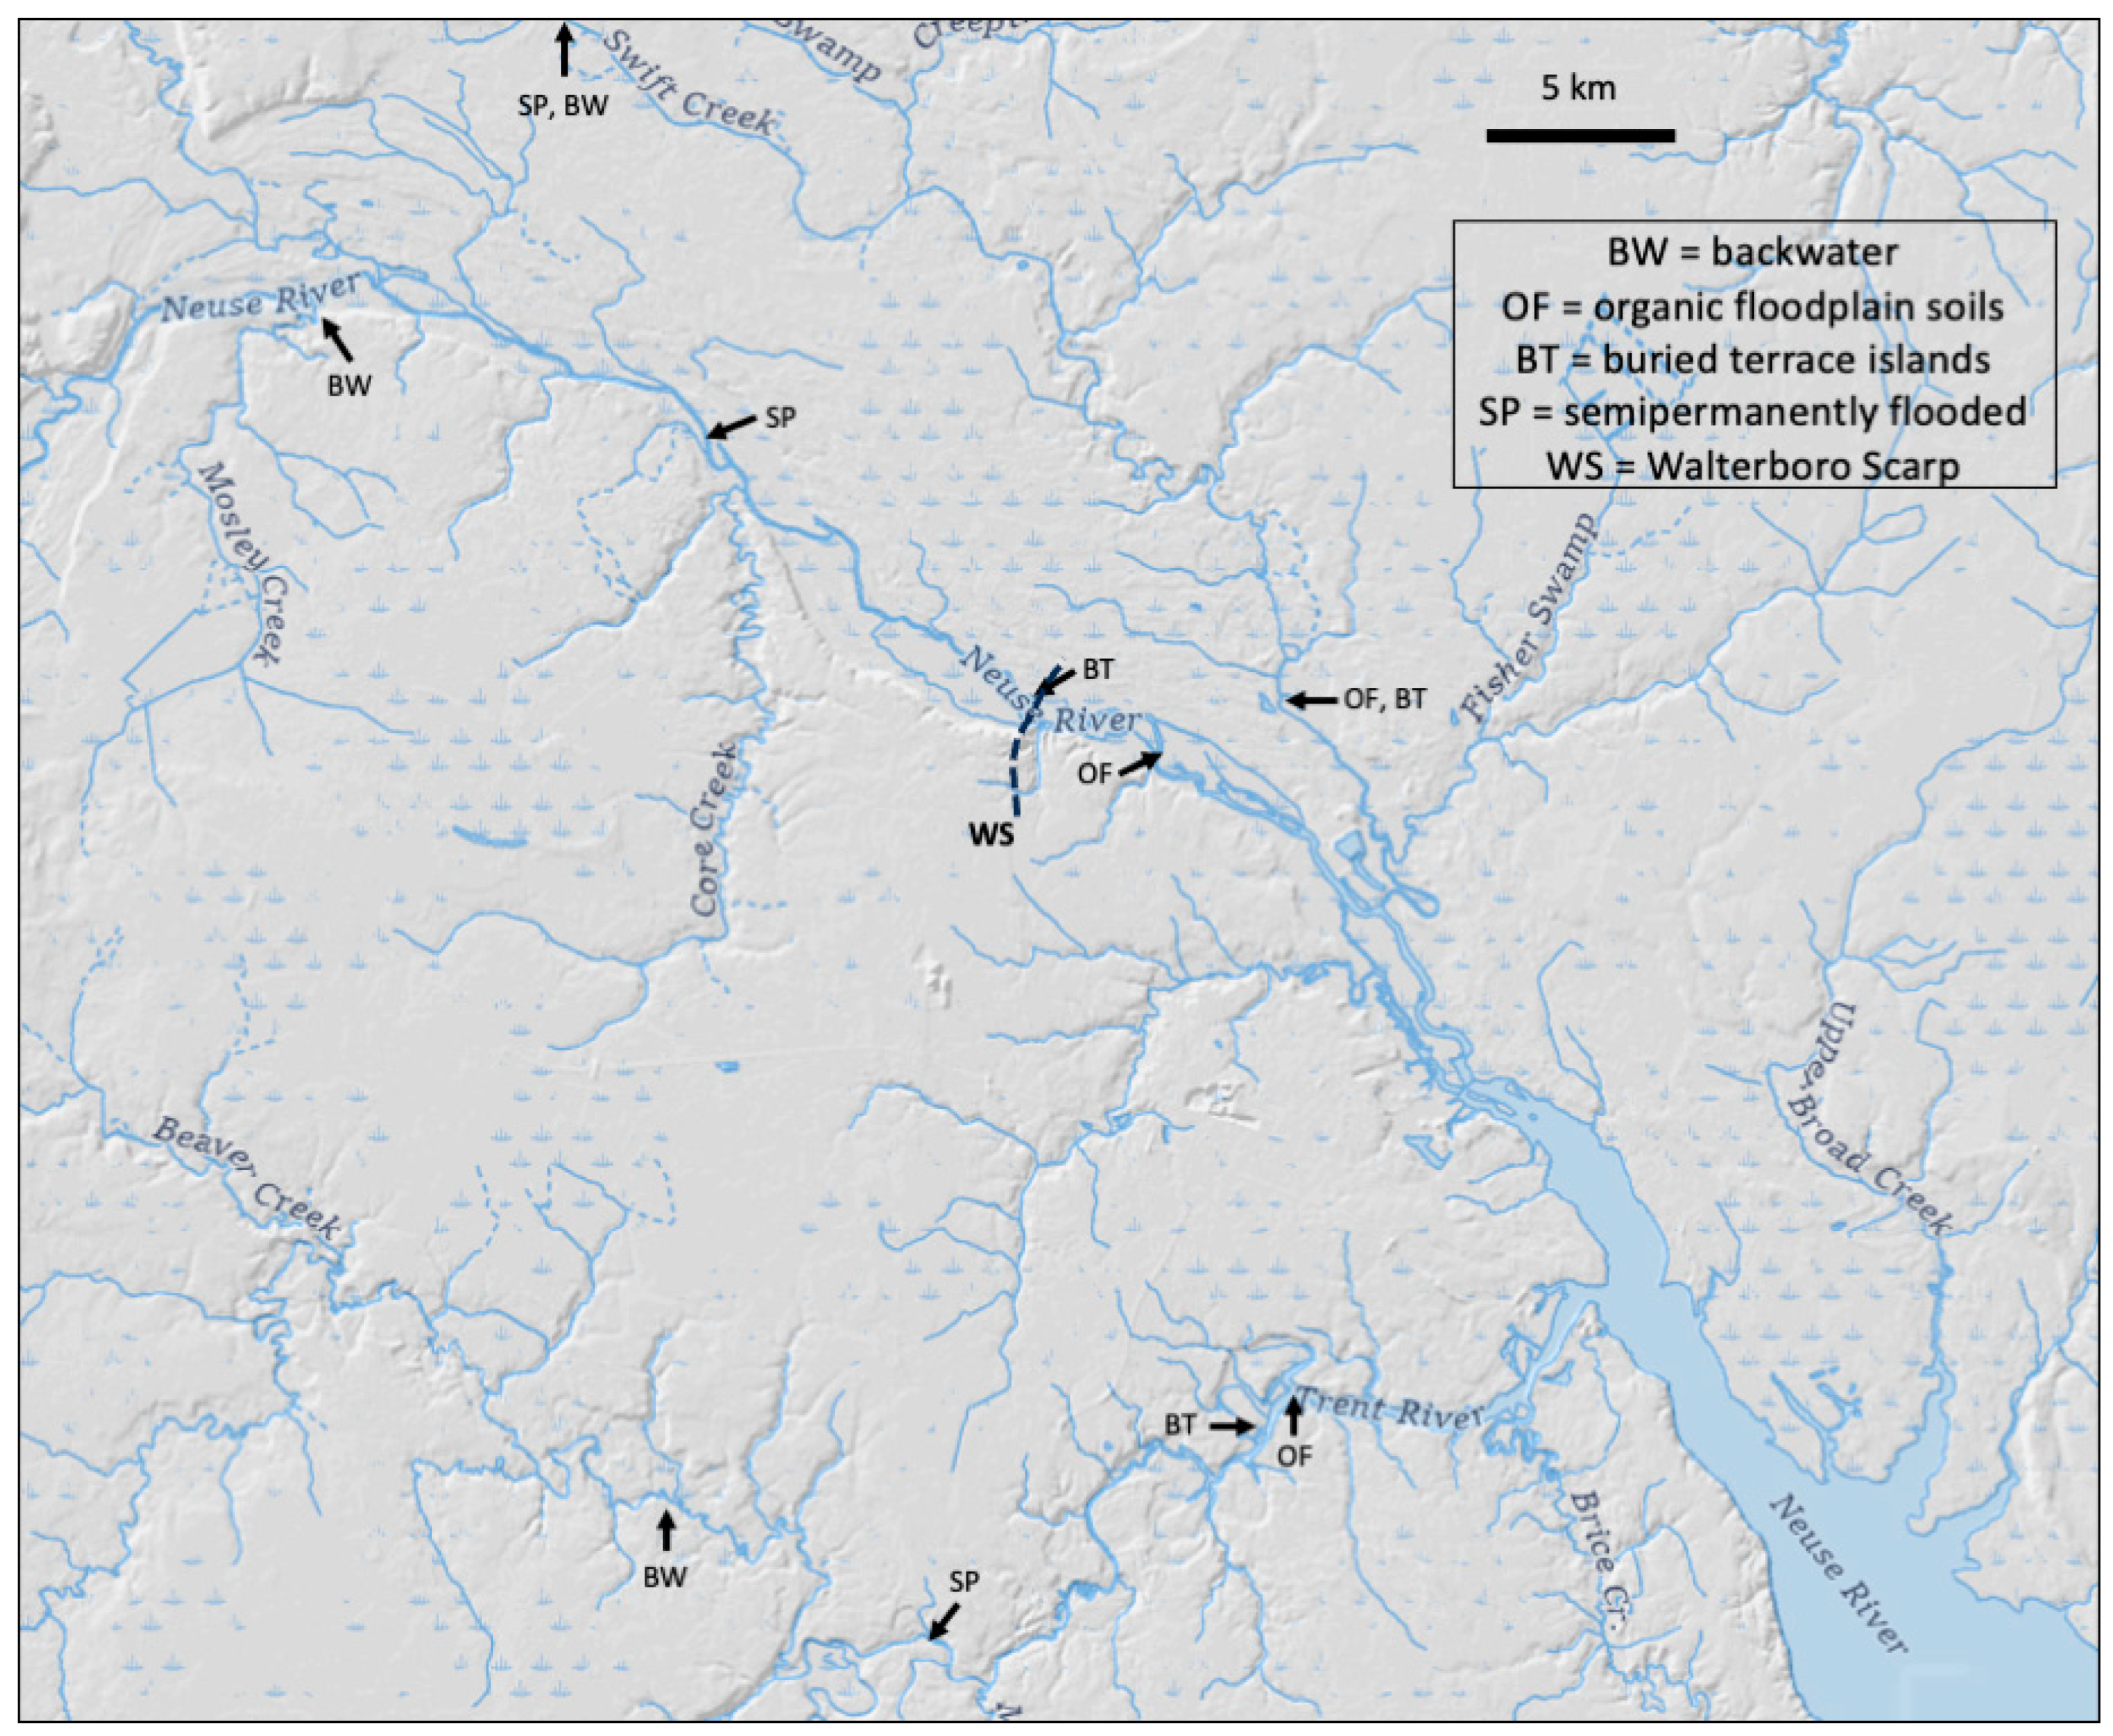
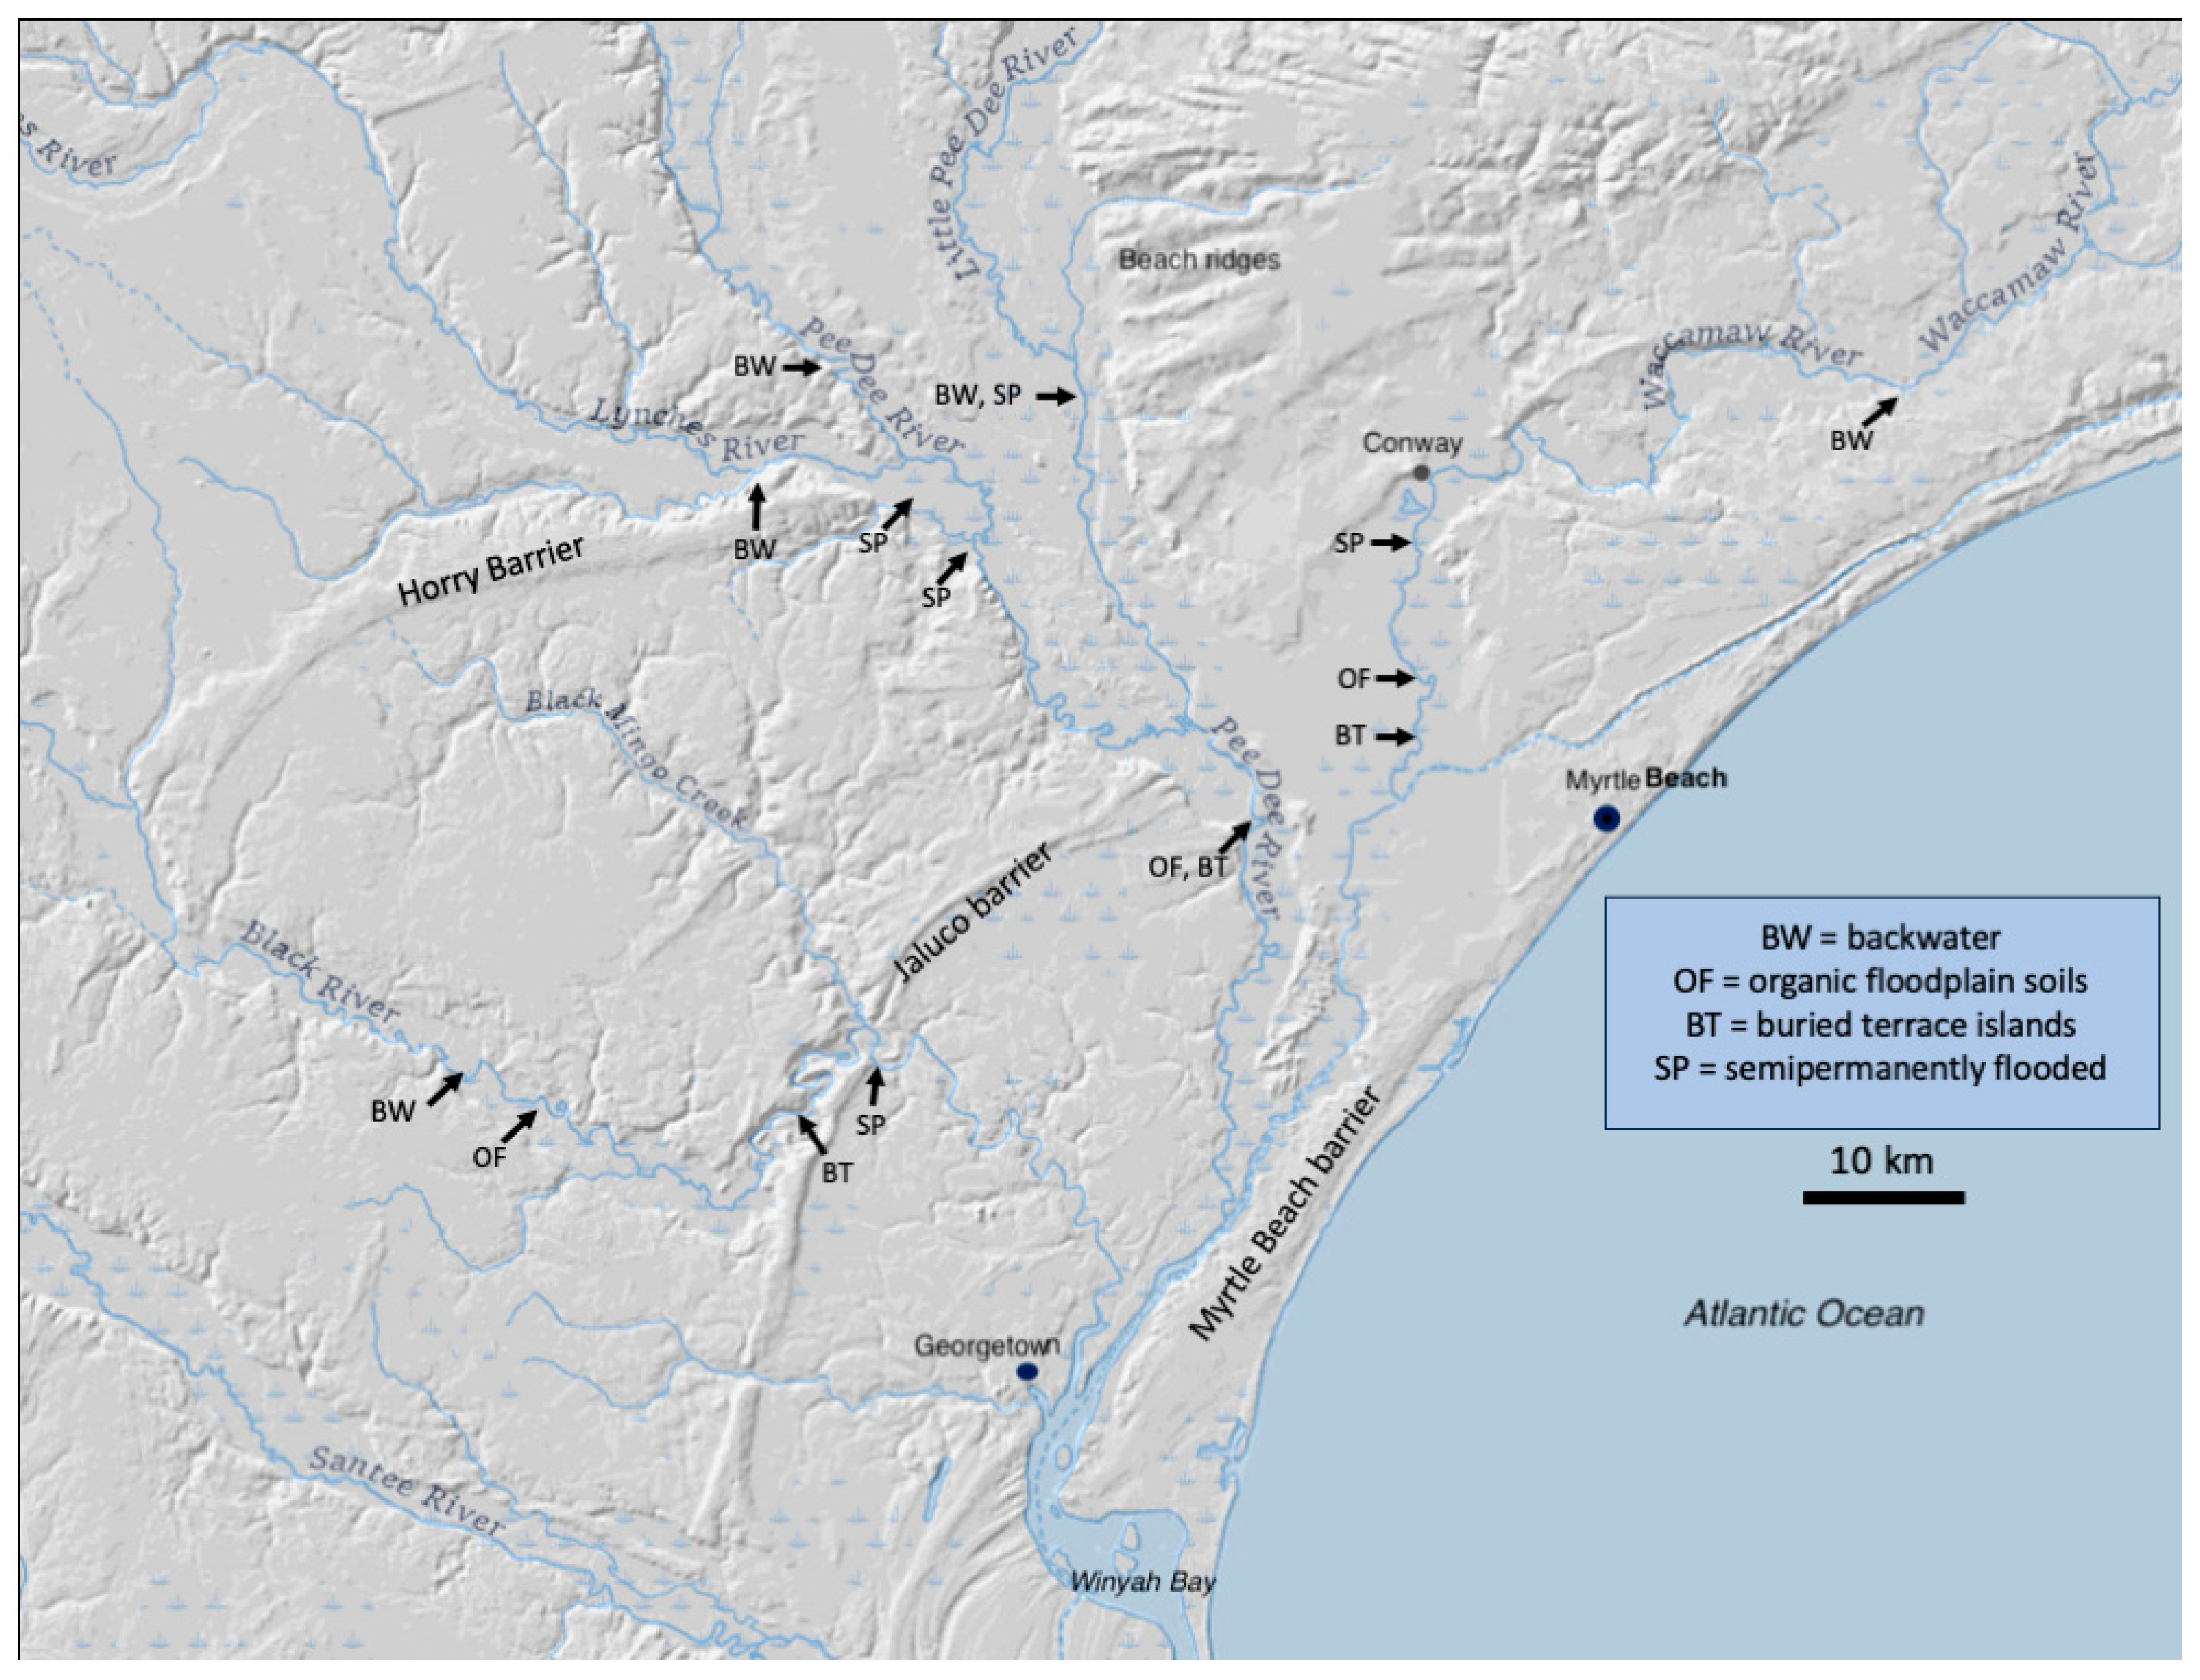
In the Neuse River, the organic soil and buried terrace boundaries lie close to where a Pleistocene paleoshoreline (the Walterboro scarp) transects the valley). Relic barrier islands and paleoshorelines also influence rivers in South Carolina (Figure 5 and Figure 6).

5. Discussion

5.1. Sequence of Changes

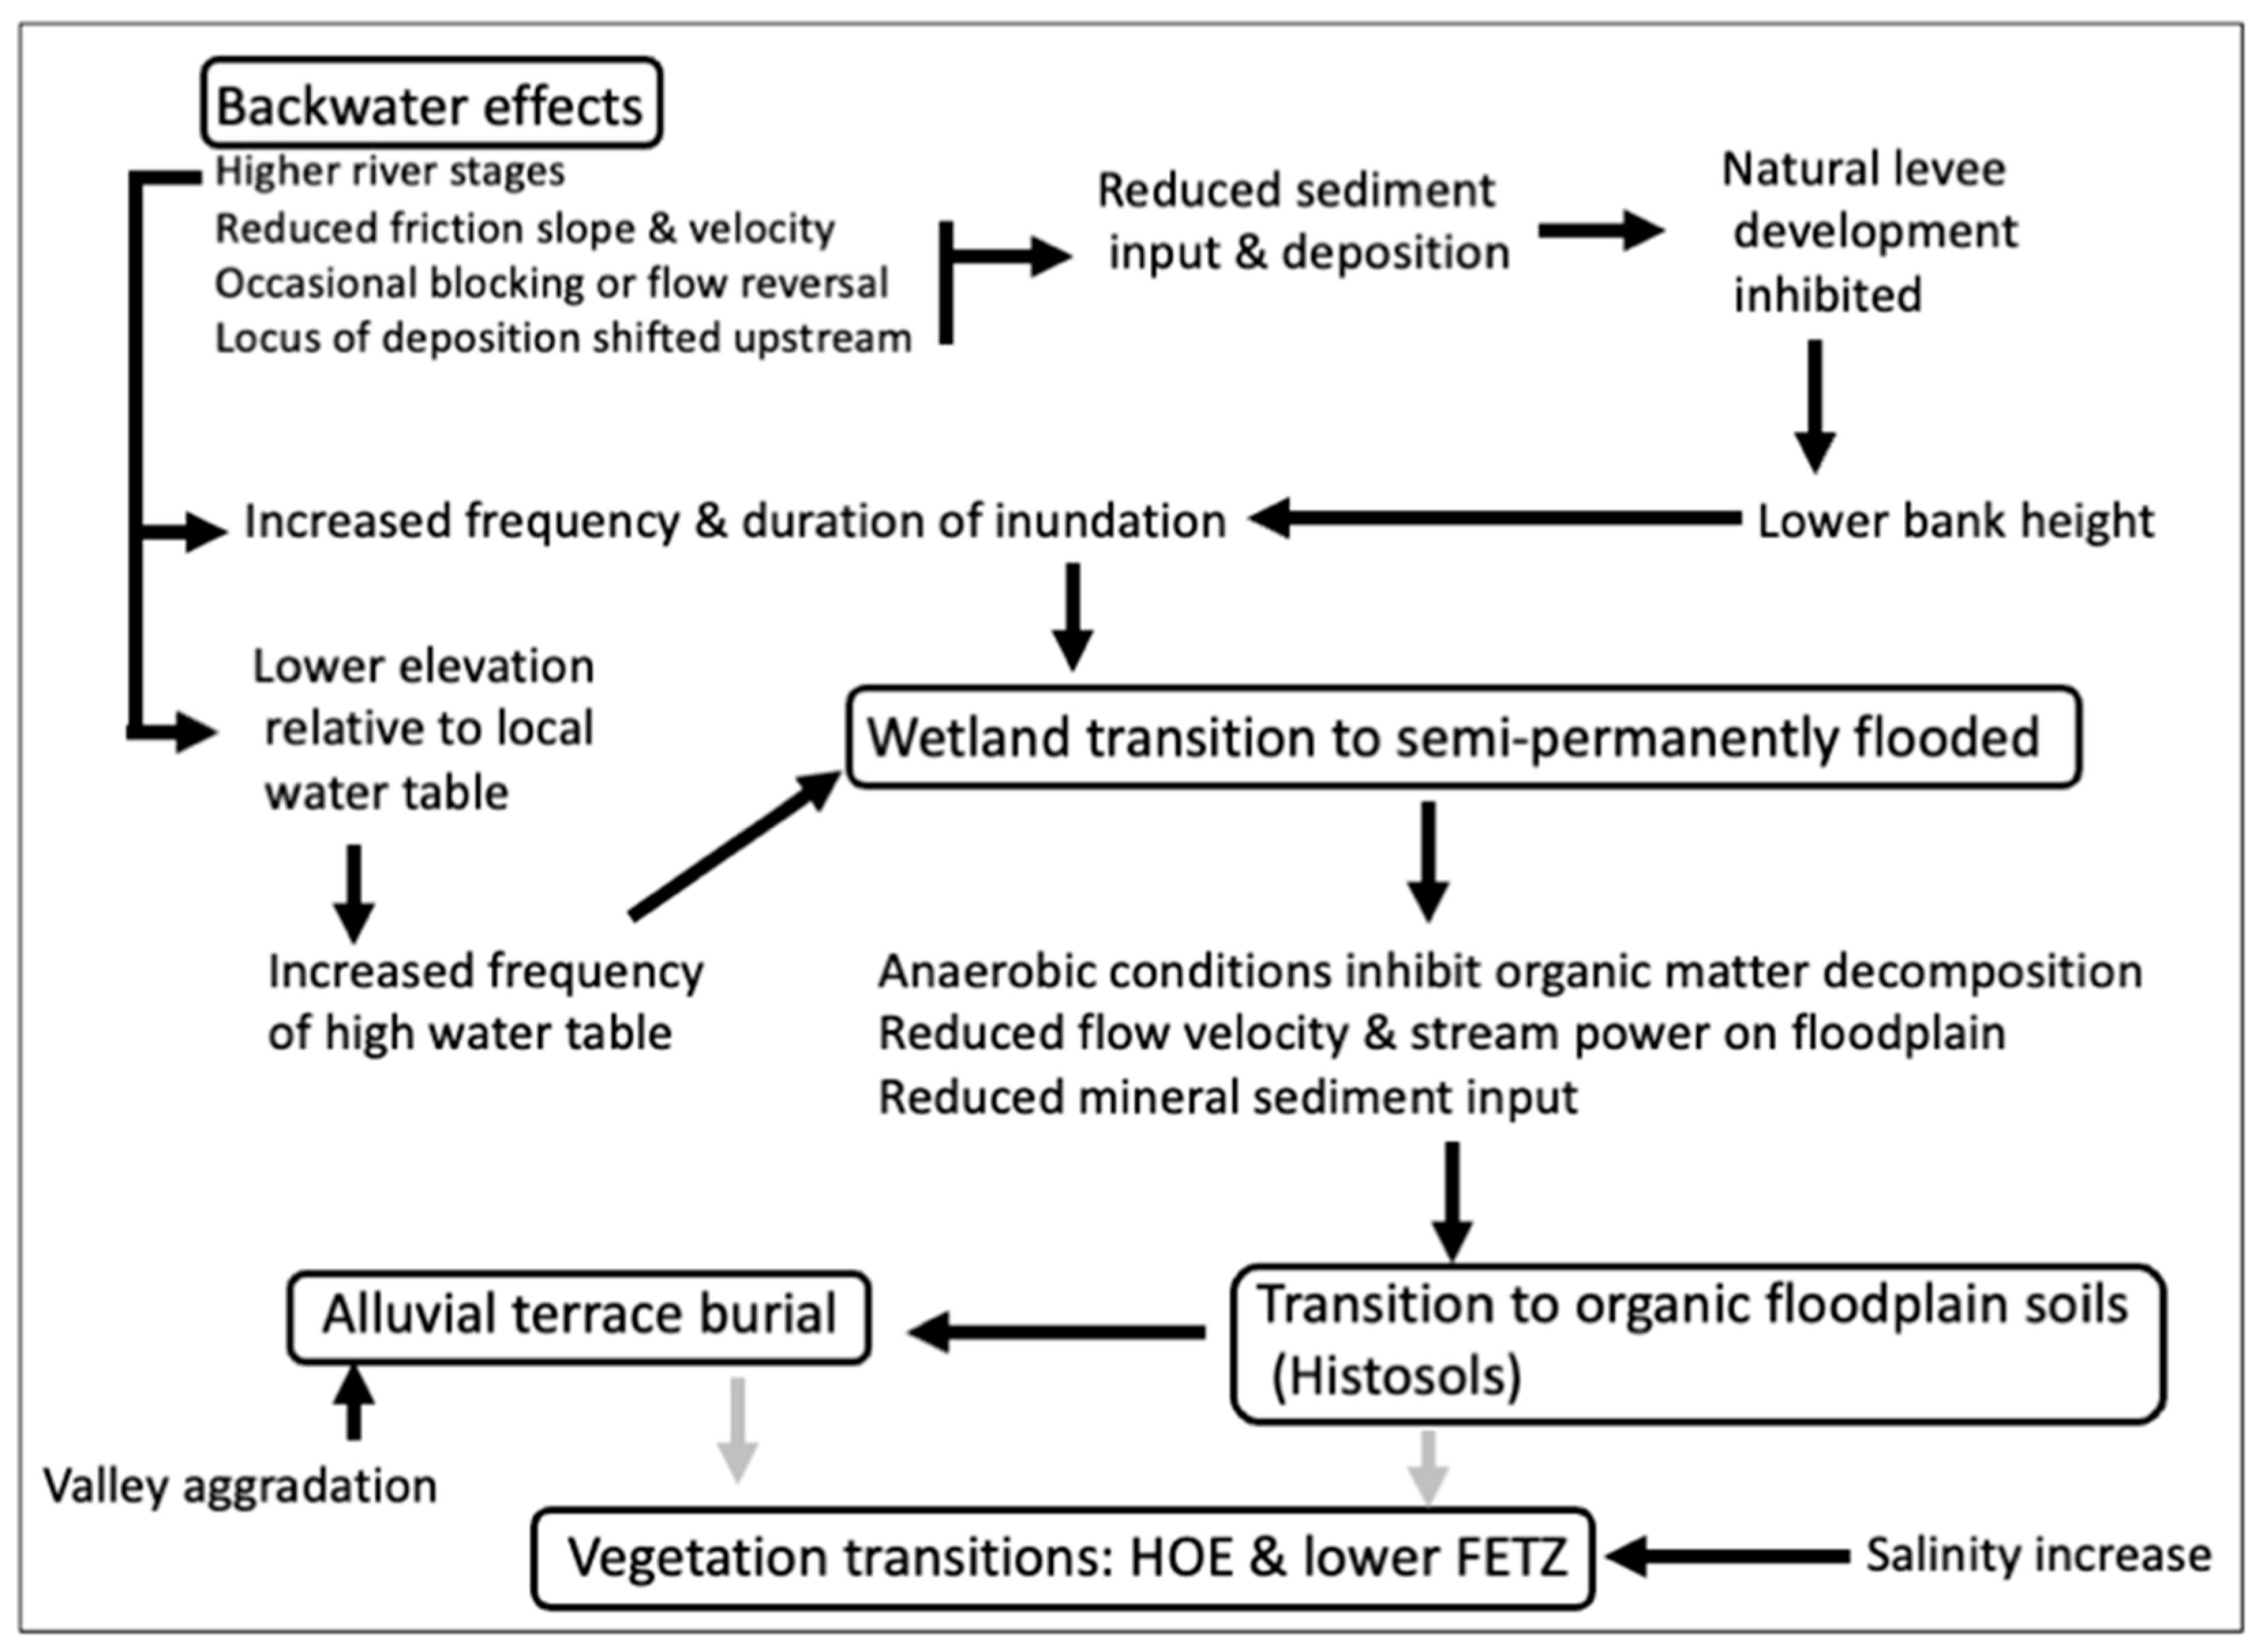
The space-for-time substitution suggests that the first impacts of backwater extension due to SLR are hydraulic effects in the main channel, followed by a change in flooding regimes and channel-floodplain connectivity, resulting in the formation of or transformation to semi-permanently flooded swamps. Later comes a transition from dominantly mineral floodplain soils to organic Histosols, roughly coinciding with the burial of intra-swamp alluvial terrace remnants. Last, and furthest downstream, are vegetation transitions associated with salinity effects, mainly forest-to-marsh transitions.
This sequence suggests a chain of transformations summarized in Figure 7. The backwater effects at the leading edge of upstream encroachment result in higher average river stages, which increase the frequency and duration of floodplain inundation and raise the local water table. Flow in the main channel can be represented using the momentum equation in the diffusive wave method:
D b f   x S c + S f = 0  
Dbf is the bankfull flow depth, x is distance, and Sc, Sf are the channel bed and friction slopes, respectively. When coastal backwater effects are encountered, the water surface slope (approximating Sf) flattens out, so that Sf < Sc. Thus D b f / x must increase to maintain the momentum balance.
In addition, reductions in the friction slope of the flow and in velocity, as well as occasional blocking or reversal of downstream river flows, reduce sediment transport capacity. This, plus upstream displacement of the locus of deposition, reduces fluvial sediment inputs and floodplain deposition. This inhibits natural levee development, reducing bank heights relative to the higher stages. These factors combine to increase the frequency and duration of inundation, resulting in frequently or semi-permanently flooded wetlands (rather than seasonally or occasionally flooded).
Biomass production remains high in the SPFW, while anaerobic conditions associated with the increased wetness retard organic decomposition rates. Ponding allows transported and suspended organic matter to settle out. This produces organic-rich surficial horizons, and eventually histic epipedons and Histosols. The Histosols generally (but not always) occur upstream of the lower limit of still-exposed intra-swamp terraces, and the terraces are often apparently buried by the organic alluvial soils. This transition thus likely precedes the terrace burial. The latter is also affected by the general valley filling associated with SLR. Finally, vegetation changes associated with water chemistry—mainly salinity—occur, eventually followed by erosion or drowning and conversion to open water.
Like all hydrological, hydrogeomorphic, and ecohydrological phenomena, none of the indicators studied here is solely influenced by SLR, backwater effects, or any other single factor. Fluvial discharge, groundwater, and tidal regimes, along with local variations in antecedent topography and morphology, relative SLR or coastal submergence, human impacts, land and water use histories, and ecological variables, may all affect the locations of the indicator phenomena.

5.2. Rates of Change

A key uncertainty is the rate at which these changes occur. With little in the way of dating or age control, there is no way of knowing when, for instance, a particular map unit or pedon of organic floodplain soil began accumulation or the burial date of an alluvial terrace remnant. The current fluvial-estuary suite of landforms, soils, habitats, and hydrological regimes has developed since a general slowing of the rate of SLR about 4 ka, when the estuaries of the region occupied their approximate modern positions. Within that time frame, however, various transformations in the rivers and estuaries occurred at varying paces.
Some data are available for recent decades. Because of the accelerated rates of SLR and the additive effects of some anthropic alterations, these are likely to be more applicable to the near future than to the Holocene past. Decadal-scale vegetation change attributable to increasing inundation and salinity due to SLR is evident around estuaries in the region, such as the formation of ghost forests [51,52,67,68]. Further upstream, historical and ongoing SLR-driven changes in tidal swamps have been documented on rivers in the study area (e.g., [29,31,69,70,71]). Bald cypress apparently killed by saltwater intrusion have been mapped well into the Neuse River FETZ [66]. This transformation had to have occurred in less time than the lifetime of the trees—given the history of logging, probably less than two centuries in that area, though cypress can live much longer.
Only one study based on dating and pollen analysis of the floodplain soils on the study rivers has been published, on the Roanoke River. Willard et al. [72] did not explicitly mention sampling of Histosols, but their radiocarbon-dated profile is described as organic-rich mud with wood fragments and occurs in an area mapped as the Dorovan series. Calibrated ages are 300 to 660 years in the upper meter and 1330 to 2710 years in the 1–1.6 m interval. This is consistent with a Holocene/historical origin. Their pollen analyses indicate the presence of bottomland hardwood trees throughout, though regionally copious pine pollen is abundant too. Nyssa and Taxodium have been present in the wettest sites throughout the period represented by the profiles.
Conversion of freshwater swamp forest to brackish marsh and other ecological and pedological responses to increasing salinity have been documented in the lower Cape Fear River and tributaries over timescales of two decades or less [4,30]. In the lower Neuse River FETZ, loss and drowning of marsh islands and conversion of forested wetlands to brackish marshes have occurred since the mid-2oth century over (at least) a 2 km long river reach. A significant amount of change occurred during a single event (Hurricane Florence in 2018; [73,74]). As a general phenomenon, this is likely prevalent, as hydrological, geomorphological, and ecological changes are often episodic and associated with disturbance events such as storms and floods.
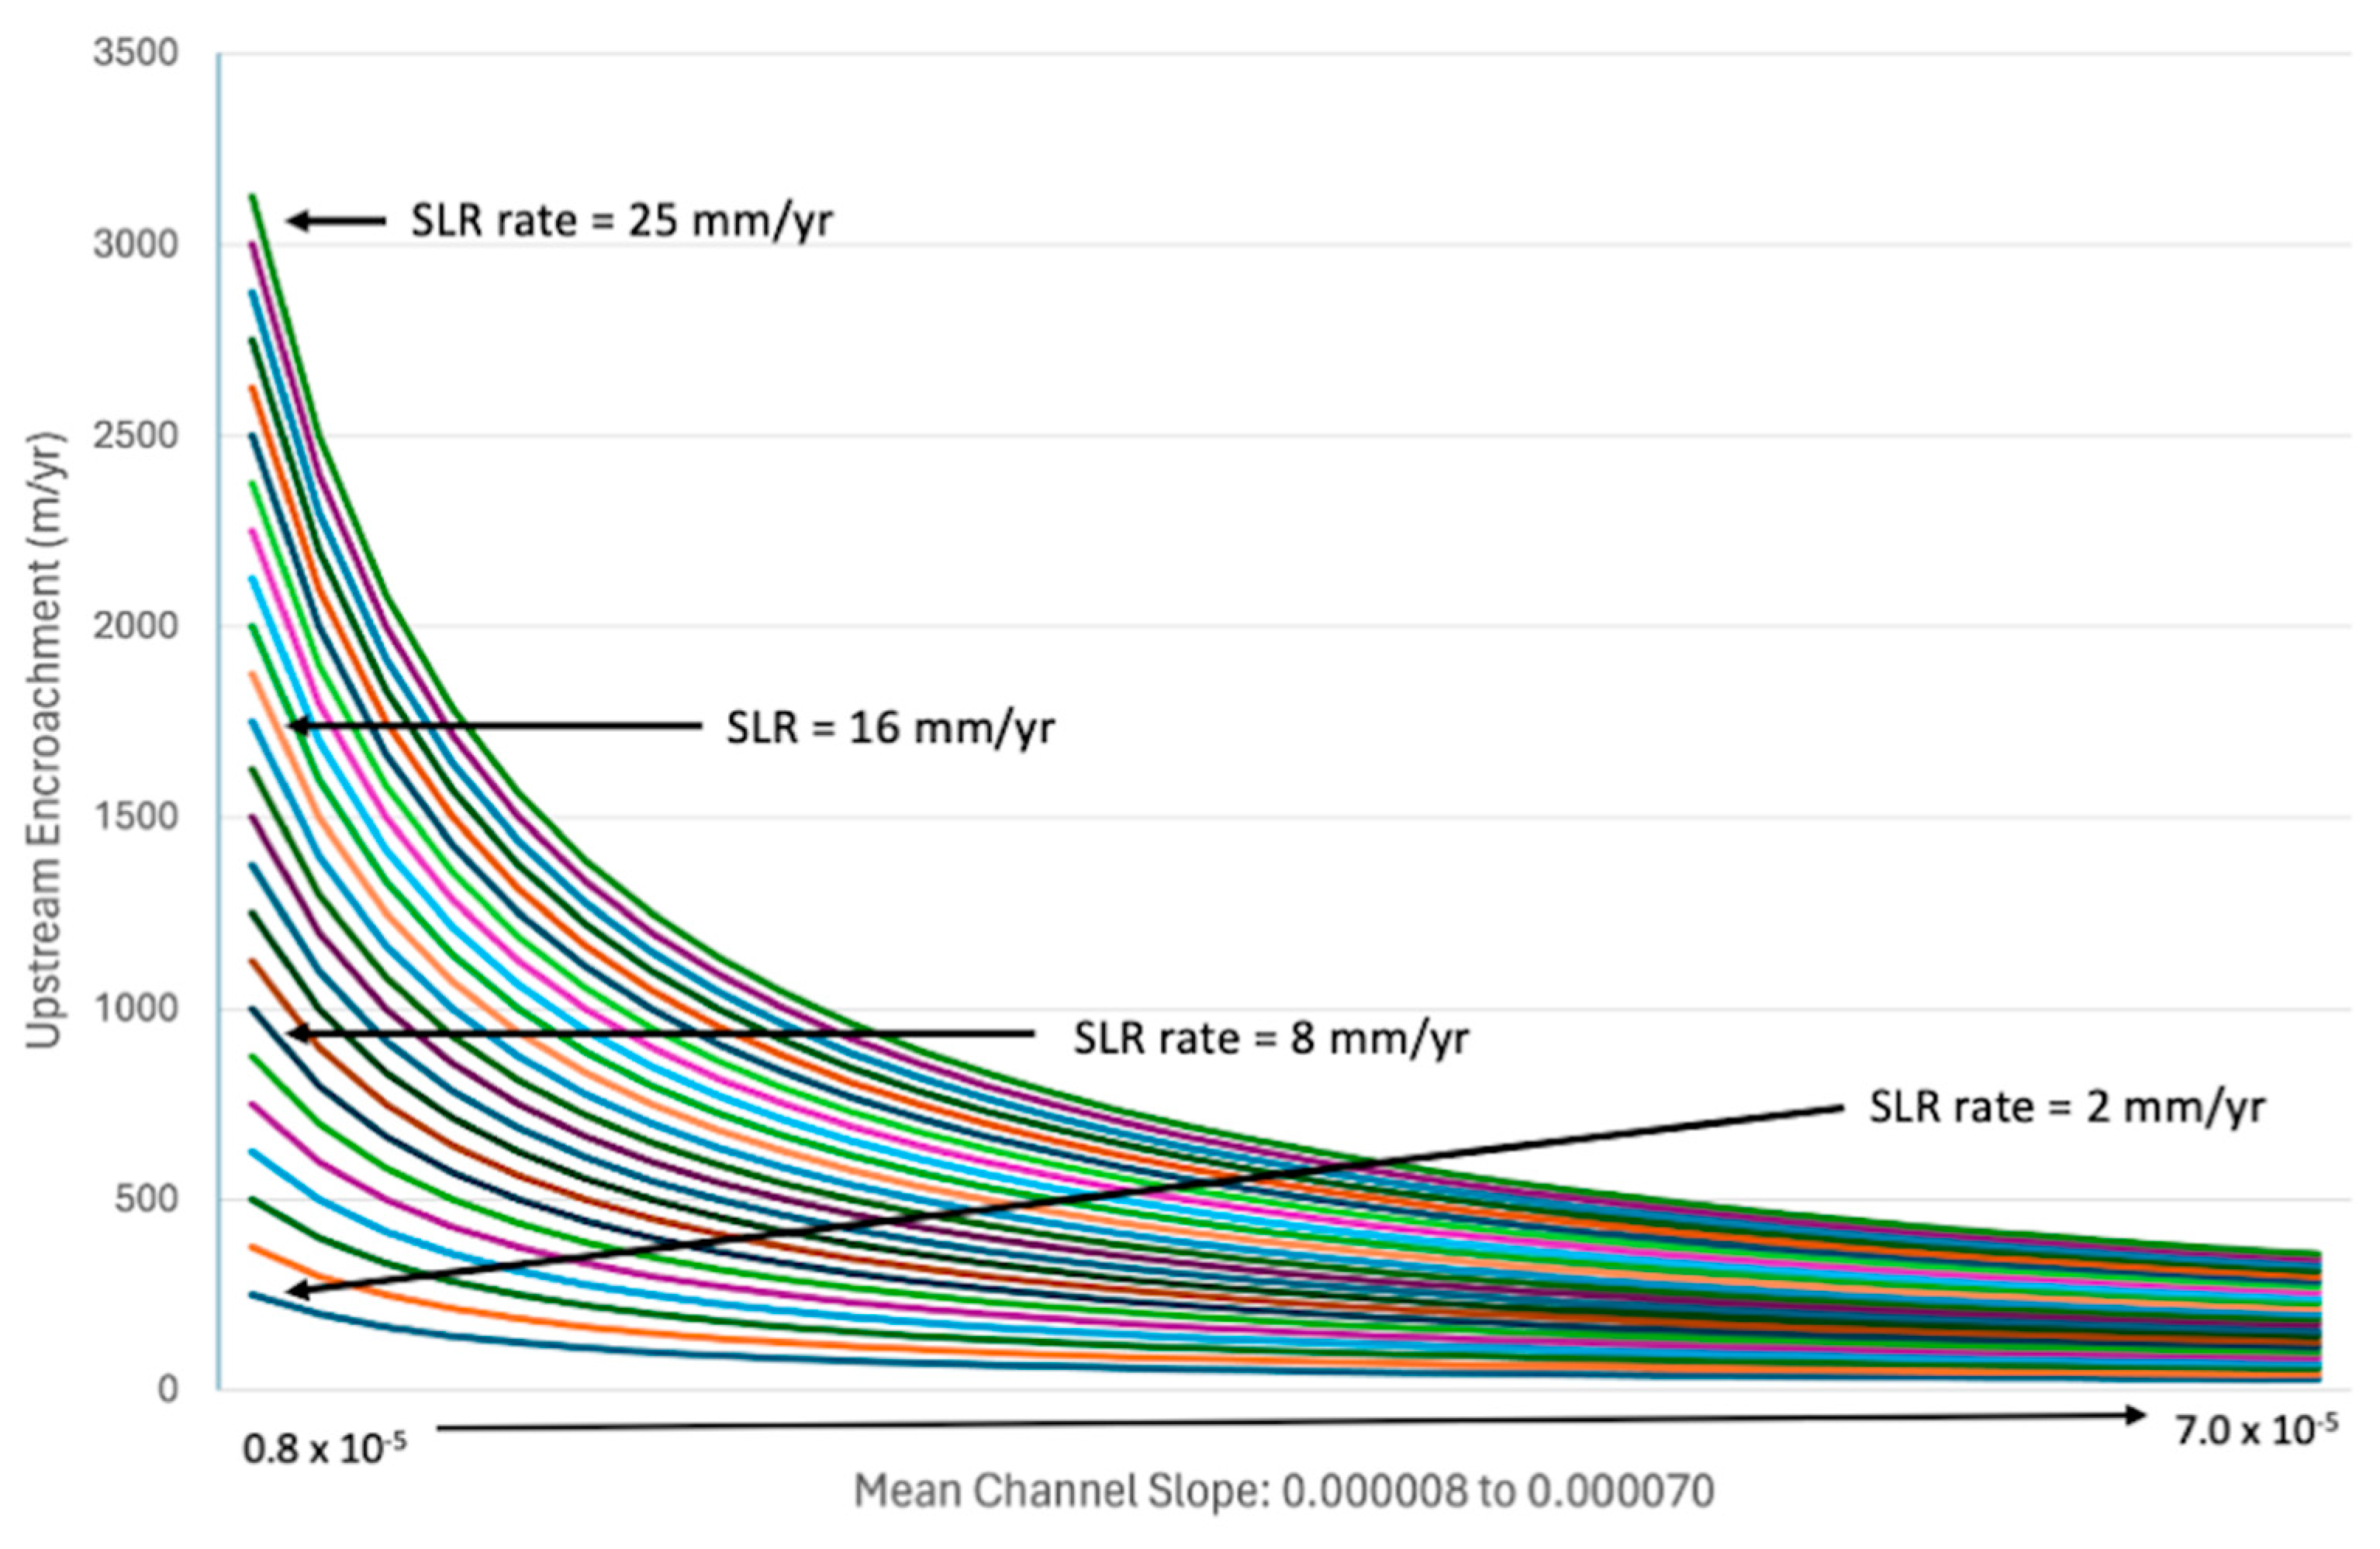
Ensign and Noe [75] proposed a simple estimate of tidal extension (E) as a function of SLR and channel slope:
E = SLR/S
where SLR is the amount of sea-level rise and S is the channel slope gradient. This simple geometric estimate ignores hydrological and geomorphic changes but does give a first-order estimate of the upstream rate of encroachment.
Figure 8 shows the tidal extension for channel slopes ranging from 0.8 to 7.0 × 10⁻⁵, which encompasses the range of mean channel slopes for the FETZs of the study rivers for SLR rates from 2 to 25 mm yr−1. These rates range from less than 20th-century averages up to the high scenario for 2022–2100. The graph confirms that low-gradient streams are more vulnerable, with encroachment at high SLR rates of >2 km yr−1. By contrast, relatively steep channels are much less sensitive, though upstream encroachment of several hundred m yr−1 is indicated for rates associated with intermediate-low and intermediate scenarios.
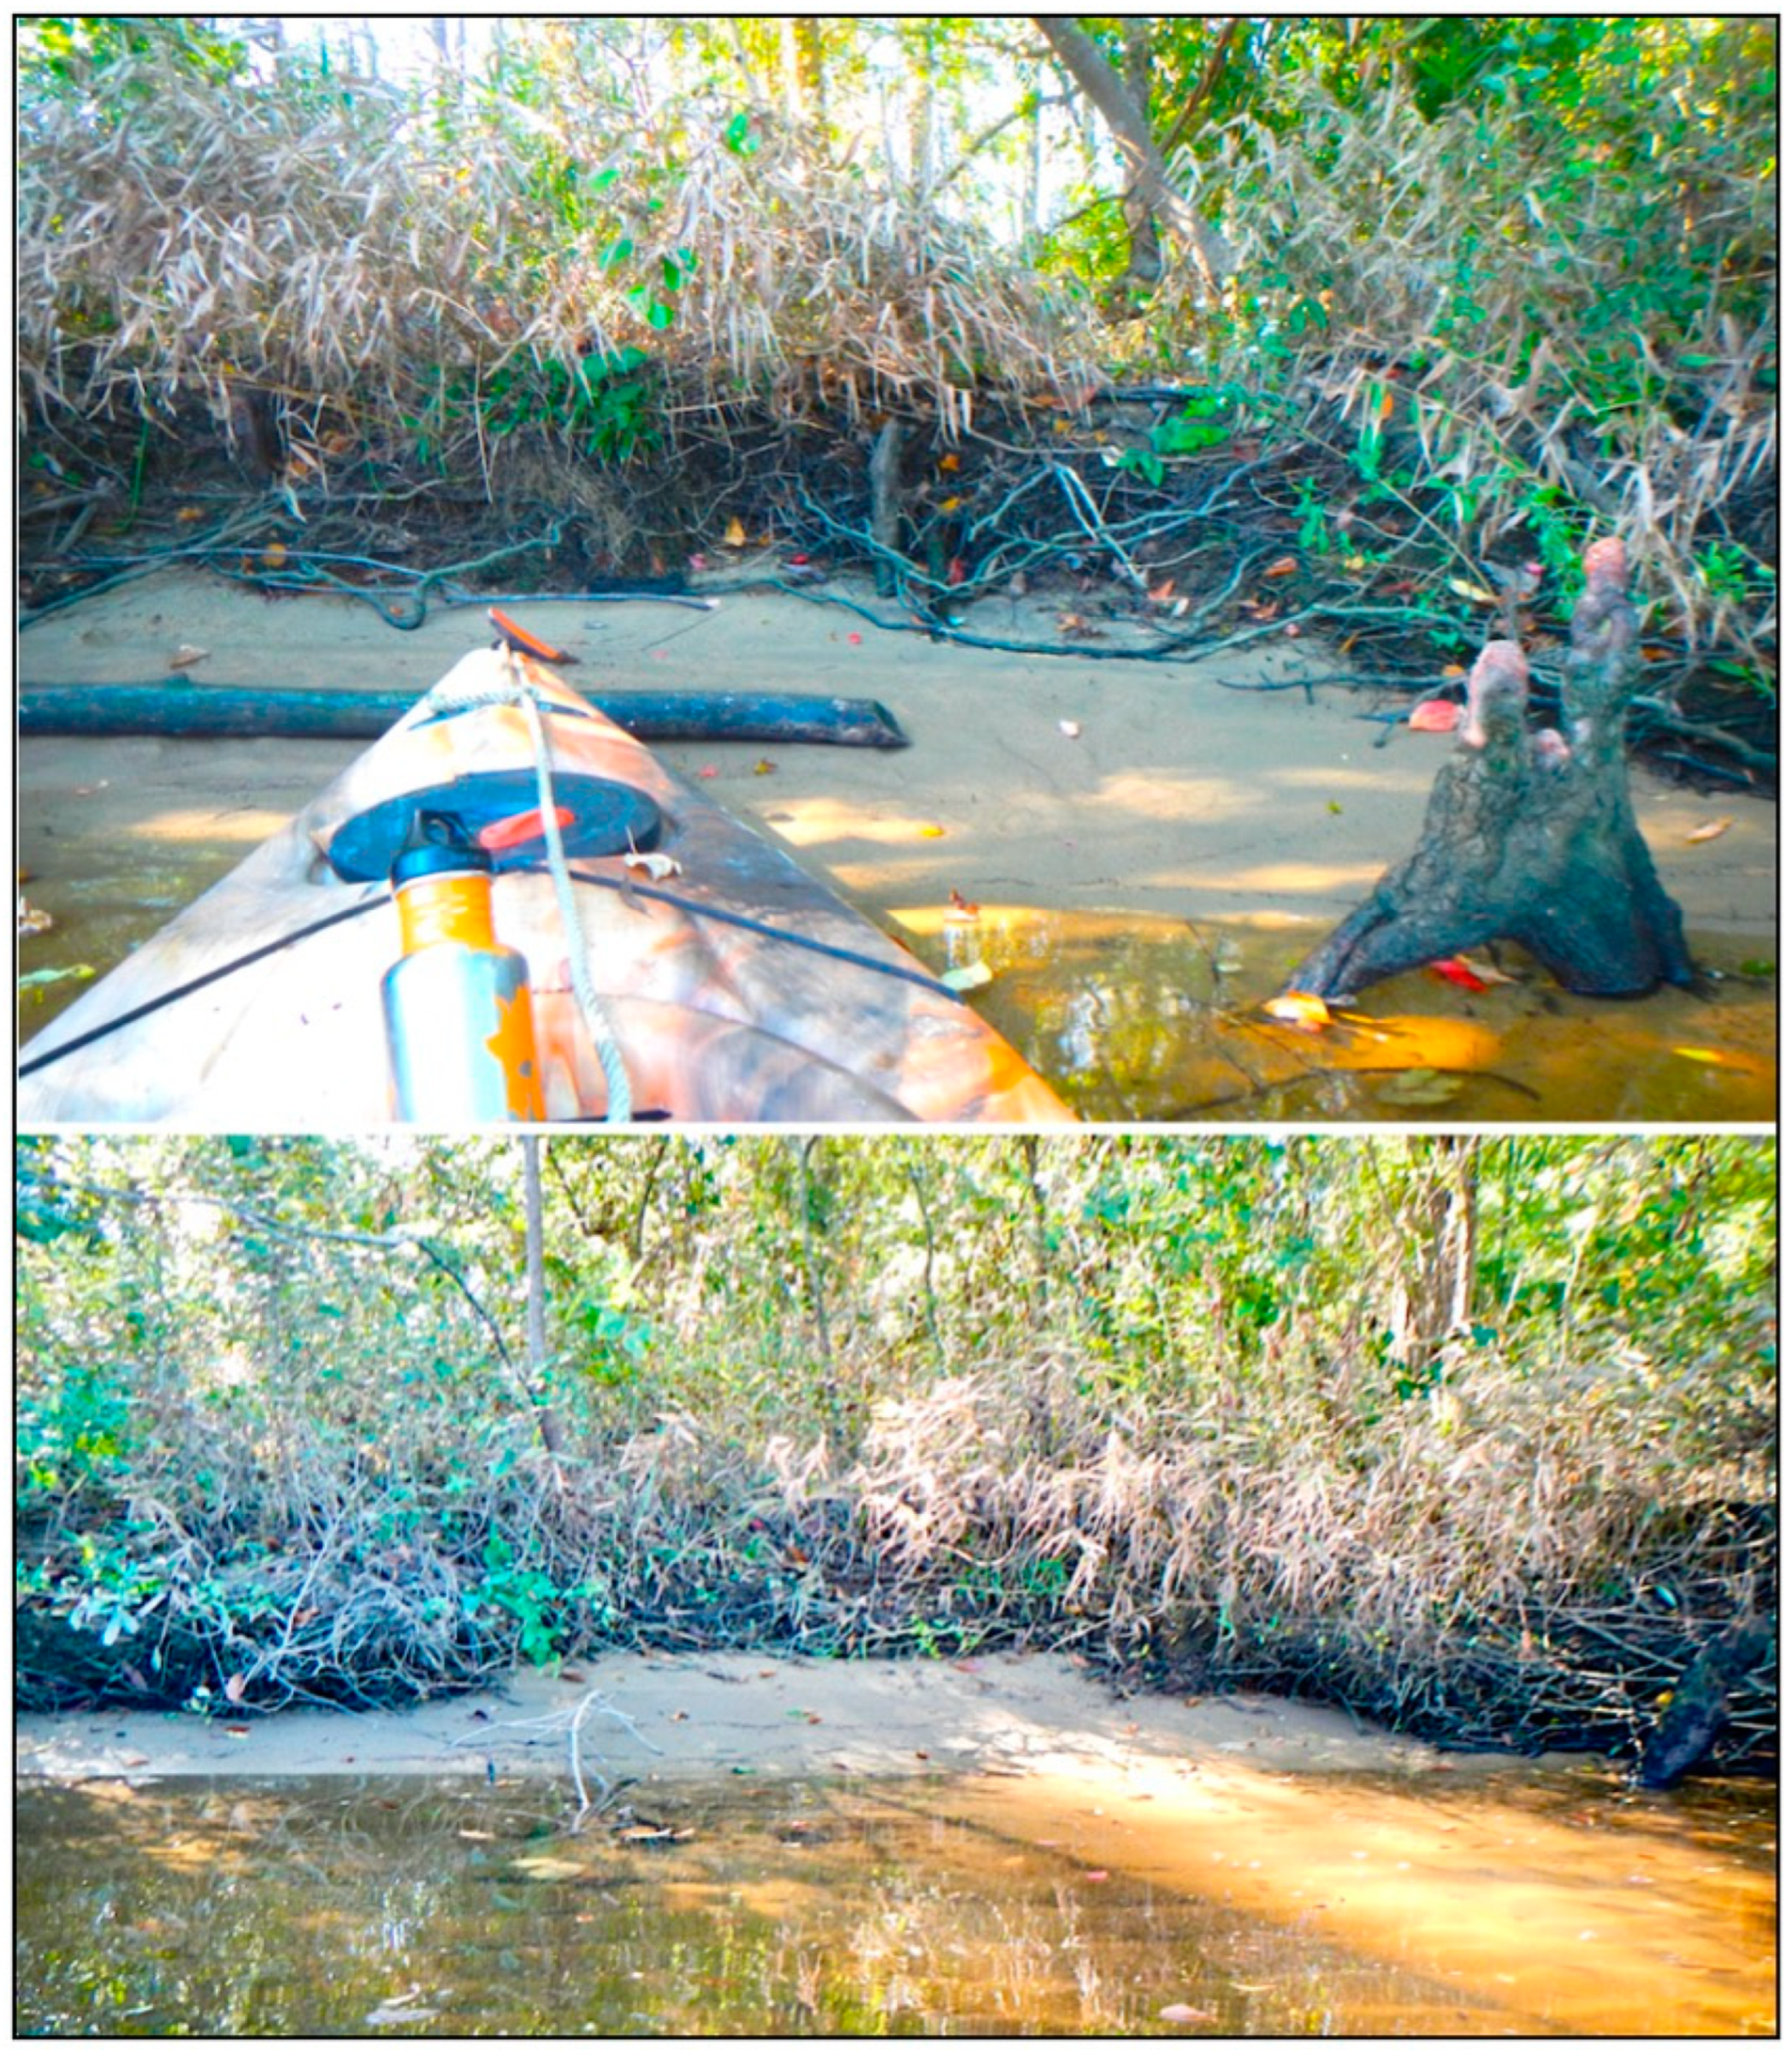
The transition from dominantly mineral to dominantly organic deposition could be relatively rapid—field observations (Figure 9) and soil profile descriptions from soil surveys often show organic layers directly overlying massive or single-grained sand, suggesting an abrupt transition to the organic accumulation regime. However, the time for soil types such as the Hobonny and Dorovan series to develop and extend upstream would be much longer. By definition, a Histosol must have an organic horizon at least 40 cm thick; many of the floodplain histosols in the study area are much thicker, with organic layers typically 1.3 to >2 m thick. Net vertical accretion would include gains from in situ biomass production and litterfall and particulate or solid organic matter deposition from fluvial processes, losses due to decomposition and fluvial export, and erosion. As the peat or muck accumulates, some decrease in thickness occurs through densification owing to autocompaction.
A 2 m thickness accumulating in 4000 years implies a mean net vertical accretion rate of 0.5 mm yr−1. Recent and contemporary rates of vertical accretion of organic material in coastal wetlands around Albemarle Sound averaged 1.6 mm yr−1 across a variety of sites, ranging up to 3.5 and 8.8 mm yr−1 at the two most rapidly accreting sites [76]. Drexler et al. [77] found vertical accretion rates in forested peatlands of the Great Dismal Swamp (North Carolina and Virginia) and the Alligator River National Wildlife Refuge in the Albemarle Sound area of 1.0 to 5.6 mm yr−1.
Using the same range of slopes and simplified geometric logic as in Figure 8, organic accumulation rates <3 mm yr−1 would result in upstream expansion of floodplain Histosols lagging well behind backwater effects.
On eight of the study rivers, near the upstream limit of the organic floodplain soil mapping units, the Johnston and/or Masonboro soil series were adjacent to the Histosols. Both are Cumulic Humaquepts with organic-rich surficial horizons, indicating the ongoing accumulation of significant amounts of organic matter. In four other rivers, the Chastain series (Fluvaquentic Endoaquepts) was found. Chastain soils are fine-grained, clay-rich soils reflecting deposition in low-energy, ponded, or backwater settings. The Chastain, Johnston, and Masonboro may be transitional series to the Dorovan or Hobonny in some cases.
The terrace island intra-swamp remnants are generally >2 m above the general floodplain elevation and are surrounded by the floodplain Histosols or the transitional series. Terrace burial is therefore at least roughly coeval with the accumulation of organic soils. The rate of burial of the intra-swamp terraces likely depends on floodplain accretion rates relative to SLR. On the Roanoke River between the Piedmont and Albemarle Sound, Hupp et al. [78] found contemporary deposition rates of 0.3 to 5.9 mm yr−1, with rates systematically increasing downriver and varying according to measurement method. Sediment deposition from the period of early European settlement (1725 to 1850) estimated from dendrogeomorphic methods was about 5 mm yr−1 in the lowermost river, increasing upstream to about 40 mm yr−1 (indicating the extensive trapping up of Piedmont-derived sediment in the upper and middle Coastal Plain). The effect of upstream dams, they concluded, selectively decreases levee and increases backswamp deposition.
Ensign et al. [72] measured sediment accretion at four sites along a fresh-to-oligohaline gradient on the Waccamaw River, its tributary Turkey Creek, and the Savannah River. Accretion ranged from 4.5 mm yr−1 at a moderately salt-impacted forest on the Savannah River to 19.1 at a relict, highly salt-impacted forest downstream. Oligohaline marsh sediment accretion was 1.5–2.5 times greater than in tidal freshwater forests. Accretion was significantly higher in hollows than on hummocks in tidal freshwater forests. Organic sediment accretion was similar to autochthonous litter production at all sites, but inorganic sediment constituted most of the accretion at both marshes and the highly salt-impacted Savannah River forest. A strong correlation between inorganic sediment accumulation and autochthonous litter production indicated a positive-feedback relationship between herbaceous plant production and allochthonous sediment deposition.
In the upper tidal reaches of the Waccamaw River, Krauss et al. [79] measured vertical accretion of 7.4 mm yr−1 on floodplain hummocks and 9.2 in hollows. Phillips [80] estimated a mean forested floodplain deposition rate for the lowermost Neuse River and its tributaries of 39.2 t ha−1 yr−1 for the entire post-European settlement period. Depending on the density of the deposited material, this implies a mean vertical accretion rate of about 3.9 to 4.4 mm yr−1 (not accounting for autocompaction).
In the aggregate, evidence suggests that floodplain sedimentation and vertical accretion rates—and, by extension, the pace of terrace burial, are of the same order of magnitude as recent and historical rates of SLR, though only the highest accretion rates are commensurate with near-future projected rates. Historical measurements and estimates include periods of accelerated soil erosion and sediment input to rivers, and the backwater effects of SLR will push the locus of alluvial deposition upstream. Thus, any burial of alluvial terraces will depend on local conditions both within and between river systems. Where vertical accretion does not keep pace with SLR, there could be an increase in the number of terrace islands surrounded by open water rather than swamps.

5.3. Leading and Trailing Edges

The upstream extension of backwater effects is the leading edge of SLR impacts on coastal rivers. Estimated extension rates for historical, 20th century SLR rates in the region range from rough 30 to 600 m yr−1, depending on channel slope. Rates under projected SLR rates range from about 140 to 3000 m yr−1, a roughly five-fold acceleration.
Conversion of seasonally to semi-permanently flooded wetlands will lag behind, and the development of floodplain Histosols and the burial of terraces will be slower still. At the trailing end of FETZ, forest-to-marsh transitions and other vegetation indicators (such as ghost trees and stranded cypress), though later in the sequence of changes, are occurring at time scales readily observable to laypersons and are accelerating.
This indicates that the progression of changes will not be a simple translational wave upstream, due to the more rapid extension of backwater effects upstream and forest-to-marsh conversions at the downstream end of the FETZ. The more rapid responses of fluvial hydrodynamics at one end and vegetation and ecohydrology at the other, with slower geomorphological, sedimentological, and pedological responses in between, coupled with the localized controls and influences on all responses, will make for more complex spatiotemporal changes.
The upper and middle reaches of the study river FETZs are typically in remote, sparsely populated, inaccessible areas with few gaging or monitoring stations, but are worthy of greater attention given the ongoing and accelerating effects. Where it is not feasible to establish gaging stations or monitoring sites, low-cost alternatives should be considered (e.g., [81,82]). Citizen monitoring by paddlers, boaters, fishermen, hunters, birdwatchers, etc. could also be considered. Sensitizing organizations already involved in citizen monitoring (e.g., the Riverkeepers and Waterkeepers and their parent organizations; https://www.riverkeeper.org/; accessed on 3 June 2024) to SLR and backwater encroachment issues and indicators is another possibility.

6. Conclusions

The effects of relative sea-level rise on low-gradient coastal plain rivers extend well upstream of the head of the estuary, from 10 s to >100 km in the 20 study rivers. These include changes in flow hydraulics, flood regimes, wetland hydroperiods, water chemistry, geomorphic and sedimentary processes, soil properties, and vegetation. While many of these properties can vary on a daily or even hourly basis, certain hydrological, geomorphological, pedological, and ecological indicators can serve as indicators—sentinels, in effect—of the upriver propagation of the effects of SLR. Considering the along-river spatial distribution of these indicators as a space-for-time substitution allows the qualitative prediction of a sequence of changes at the river reach scale.
For the 20 study rivers, this suggests that first, backwater effects at the leading edge produce higher average river stages, which increase the frequency and duration of floodplain inundation and raise local water tables. Reductions in hydraulic slope and flow velocity reduce sediment transport capacity. Along with upstream displacement of the locus of deposition, this reduces fluvial sediment inputs and floodplain deposition. Natural levee development is thereby impeded, reducing bank heights relative to the higher stages. These factors combine to increase the frequency and duration of inundation, resulting in frequently or semi-permanently flooded wetlands. Anaerobic conditions associated with increased wetness limit organic decomposition, and ponding allows transported and suspended organic matter to settle out, leading to organic-rich surficial horizons and eventually histic epipedons and Histosols. This accumulation, coupled with deltaic backstepping and general valley-filling, progressively buries alluvial terrace remnants. Finally, vegetation changes associated with water chemistry—mainly salinity—occur, resulting in swamp conversions to brackish marsh, eventually followed by erosion or drowning and conversion to open water.
The pace of backwater encroachment is strongly influenced by channel bed slope, with relatively steeper channels experiencing slower rates of tidal extension than those with lower slopes. With accelerating SLR, the lowest-sloping channels could experience encroachment rates of >1 km yr−1. Hydrological, geomorphological, and ecological transitions associated with SLR are most rapid at the leading, upriver end and the lowermost, downstream end of the fluvial-estuarine transition zone.

Funding

This research received no external funding.

Data Availability Statement

Data are available from the author on request.

Acknowledgments

Two anonymous reviewers provided constructive comments and corrections, which improved this paper.

Conflicts of Interest

The authors declare no conflicts of interest.

References

  1. Weston, N.B.; Rodriguez, E.; Donnelly, B.; Solohin, E.; Jezycki, K.; Demberger, S.; Sutter, L.A.; Morris, J.T.; Neubauer, S.C.; Craft, C.B. Recent acceleration of wetland accretion and carbon accumulation along the U.S. east coast. Earth’s Future 2023, 11, e2022EF003037. [Google Scholar] [CrossRef]
  2. Parkinson, R.W.; Wdowninski, S. Geomorphic response of the Georgia Bight coastal zone to accelerating sea level rise, Southeastern USA. Coasts 2024, 4, 1–20. [Google Scholar] [CrossRef]
  3. Manda, A.K.; Giuliano, A.S.; Allen, T.R. Influence of artificial channels on the source and extent of saline water intrusion in the wind tide dominated wetlands of the southern Albemarle estuarine system (USA). Env. Earth Sci. 2014, 71, 4409–4419. [Google Scholar] [CrossRef]
  4. Hackney, C.T.; Avery, G.G. Tidal wetland community response to varying levels of flooding by saline water. Wetlands 2015, 35, 227–236. [Google Scholar] [CrossRef]
  5. Pricope, N.G.; Shivers, G. Wetland vulnerability metrics as a rapid indicator in identifying nature-based solutions to mitigate coastal flooding. Hydrology 2022, 9, 218. [Google Scholar] [CrossRef]
  6. Mukherji, A.; Curtis, S.; Helgeson, J.; Kruse, J.; Ghosh, A. Mitigating compound coastal water hazards in eastern North Carolina. J. Environ. Plan. Manag. 2023, 67, 1852–1870. [Google Scholar] [CrossRef]
  7. Phillips, J.D.; Slattery, M.C. Sediment storage, sea level, and sediment delivery to the ocean by coastal plain rivers. Prog. Phys. Geogr. 2006, 30, 513–530. [Google Scholar] [CrossRef]
  8. Yankovsky, A.E.; Torres, R.; Torres-Garcia, L.M.; Jeon, K. Interaction of tidal and fluvial processes in the transition zone of the Santee River, S.C., USA. Estuaries Coasts 2012, 35, 1500–1509. [Google Scholar] [CrossRef]
  9. Torres, R. Channel geomorphology and the fluvial–tidal transition, Santee River, USA. Geol. Soc. Am. Bull. 2017, 129, 1681–1692. [Google Scholar] [CrossRef]
  10. Jones, A.E.; Hardison, A.K.; Hodges, B.R.; McClelland, J.W.; Moffett, K.B. Defining a riverine tidal freshwater zone and its spatiotemporal dynamics. Wat. Resour. Res. 2020, 56, e2019WR026619. [Google Scholar] [CrossRef]
  11. Sulaiman, Z.A.; Viparelli, E.; Torres, R.; Yankovsky, A.; Grego, J. The influence of tides on coastal plain channel geomorphology: Altamaha River, Georgia, USA. J. Geophys. Res. Earth Surf. 2021, 126, e2020JF005839. [Google Scholar] [CrossRef]
  12. Phillips, J.D. Geomorphology of the fluvial-estuarine transition zone, Neuse River, North Carolina. Earth Surf. Proc. Landf. 2022, 47, 2044–2061. [Google Scholar] [CrossRef]
  13. Phillips, J.D. A short history of a flat place: Three centuries of geomorphic change in the Croatan. Ann. Assoc. Am. Geogr. 1997, 87, 197–216. [Google Scholar] [CrossRef]
  14. Phillips, J.D. Anastamosing channels in the lower Neches River valley, Texas. Earth Surf. Proc. Landf. 2014, 39, 1888–1899. [Google Scholar] [CrossRef]
  15. Phillips, J.D.; Slattery, M.C. Downstream trends in discharge, slope, and stream power in a coastal plain river. J. Hydrol. 2007, 334, 290–303. [Google Scholar] [CrossRef]
  16. Smith, V.; Mason, J.; Mohrig, D. Reach-scale changes in channel geometry and dynamics due to the coastal backwater effect: The lower Trinity River, Texas. Earth Surf. Proc. Landf. 2020, 45, 565–573. [Google Scholar] [CrossRef]
  17. Kroes, D.E.; Noe, G.B.; Hupp, C.R.; Doody, T.R.; Bukaveckas, P.A. Hydrogeomorphic changes Along mid-Atlantic coastal plain rivers transitioning from non-tidal to tidal: Implications for a rising sea level. Estuaries Coasts 2023, 46, 1438–1458. [Google Scholar] [CrossRef]
  18. Gori, A.; Lin, N.; Smith, J. Assessing compound flooding from landfalling tropical cyclones on the North Carolina coast. Water Resour. Res. 2020, 56, e2019WR026788. [Google Scholar] [CrossRef]
  19. Dykstra, S.L.; Dzwonkowski, B. The role of intensifying precipitation on coastal river flooding and compound river-storm surge events, northeast Gulf of Mexico. Water Resour. Res. 2021, 57, e2020WR029363. [Google Scholar] [CrossRef] [PubMed]
  20. Benke, A.C.; Chaubey, I.; Ward, G.M.; Dunn, E.L. Flood pulse dynamics of an unregulated river floodplain in the southeastern U.S. coastal plain. Ecology 2000, 81, 2730–2741. [Google Scholar] [CrossRef]
  21. Hupp, C.R. Hydrology, geomorphology and vegetation of Coastal Plain rivers in the southeastern USA. Hydrol. Proc. 2000, 14, 2991–3010. [Google Scholar] [CrossRef]
  22. Phillips, J.D. Geomorphic controls and transition zones in the lower Sabine River. Hydrol. Proc. 2008, 22, 2424–2437. [Google Scholar] [CrossRef]
  23. Heitmuller, F.T. Channel adjustments to historical disturbances along the lower Brazos and Sabine River, south-central USA. Geomorphology 2014, 204, 382–398. [Google Scholar] [CrossRef]
  24. Tull, N.; Passalacqua, P.; Hassenruck-Gudipati, H.J.; Rahman, S.; Wright, K.; Hariharan, J.; Mohrig, D. Bidirectional river-floodplain connectivity during combined pluvial-fluvial events. Water Resour. Res. 2022, 58, e2021WR030492. [Google Scholar] [CrossRef]
  25. Weston, N.B.; Vile, M.A.; Neubauer, S.C.; Velinsky, D.J. Accelerated microbial organic matter mineralization following saltwater intrusion into tidal freshwater marsh soils. Biogeochemistry 2011, 102, 135–151. [Google Scholar] [CrossRef]
  26. Weston, N.B.; Neubauer, S.C.; Velinsky, D.J.; Vile, M.A. Net ecosystem carbon exchange and the greenhouse gas balance of tidal marshes along an estuarine salinity gradient. Biogeochemistry 2014, 120, 163–189. [Google Scholar] [CrossRef]
  27. Zhai, L.; Krauss, K.W.; Liu, X.; Duberstein, J.A.; Conner, W.H.; DeAngelis, D.L.; Sternberg, L.D. Growth stress response to sea level rise in species with contrasting functional traits: A case study in tidal freshwater forested wetlands. Environ. Exp. Bot. 2018, 155, 378–386. [Google Scholar] [CrossRef]
  28. Helton, A.M.; Ardón, M.; Bernhardt, E.S. Hydrologic context alters greenhouse gas feedbacks of coastal wetland salinization. Ecosystems 2019, 22, 1108–1125. [Google Scholar] [CrossRef]
  29. Duberstein, J.A.; Krauss, K.W.; Baldwin, M.J.; Allen, S.T.; Conner, W.H.; Salter, J.S., Jr.; Miloshis, M. Small gradients in salinity have large effects on stand water use in freshwater wetland forests. For. Ecol. Manag. 2022, 473, 118308. [Google Scholar] [CrossRef]
  30. Margolan, J.L.; Halls, J.N. A multi-decadal investigation of tidal creek wetland changes, water level rise, and ghost forests. Remote Sens. 2020, 12, 1141. [Google Scholar] [CrossRef]
  31. Conner, W.; Whitmire, S.; Duberstein, J.; Stalter, R.; Baden, J. Changes within a South Carolina coastal wetland forest in the face of rising sea level. Forests 2007, 13, 414. [Google Scholar] [CrossRef]
  32. Slattery, M.C.; Phillips, J.D. Controls on sediment delivery in coastal plain rivers. J. Environ. Manag. 2010, 92, 284–289. [Google Scholar] [CrossRef] [PubMed]
  33. Ensign, S.H.; Halls, J.N.; Peck, E.K. Watershed sediment cannot offset sea level rise in most US tidal wetlands. Science 2023, 382, 1191–1195. [Google Scholar] [CrossRef] [PubMed]
  34. Giese, G.L.; Wilder, H.B.; Parker, G.G. Hydrology of Major Estuaries and Sounds of North Carolina; USGS Water Supply Paper 2221; US Government Printing Office: Washington, DC, USA, 1985.
  35. Lagomasino, D.; Corbett, D.R.; Walsh, J.P. Influence of wind-driven inundation and coastal geomorphology on sedimentation in two microtidal marshes, Pamlico River estuary, N.C. Estuaries Coasts 2013, 36, 1165–1180. [Google Scholar] [CrossRef]
  36. Wu, C.; Nitterour, J.A. Impacts of backwater hydrodynamics on fluvial-deltaic stratigraphy. Basin Res. 2019, 32, 567–584. [Google Scholar] [CrossRef]
  37. Bens, O.; Wahl, N.A.; Fischer, H.; Huettl, R.F. Water infiltration and hydraulic conductivity in sandy Cambisols: Impacts of forest transformation on soil hydrological properties. Eur. J. For. Res. 2007, 126, 101–109. [Google Scholar] [CrossRef]
  38. Hart, T.M.; Davis, S.E. Wetland development in a previously mined landscape of East Texas, USA. Wet. Ecol. Manag. 2011, 19, 317–329. [Google Scholar] [CrossRef]
  39. Young, M.H.; McDonald, E.V.; Caldwell, T.G.; Benner, S.G.; Meadows, D.G. Hydraulic properties of a desert soil chronosequence in the mojave desert, USA. Vadose Zone J. 2004, 3, 956–963. [Google Scholar] [CrossRef]
  40. Marple, R.T.; Hurd, J.D., Jr. Investigation of the Cape Fear arch and East Coast fault system in the Coastal Plain of North Carolina and northeastern South Carolina, USA, using LiDAR data. Atl. Geol. 2021, 57, 311–341. [Google Scholar] [CrossRef]
  41. Marple, R.T.; Talwani, P. Evidence of possible tectonic upwarping along the South Carolina Coastal Plain from an examination of river morphology and elevation data. Geology 1993, 21, 651–654. [Google Scholar] [CrossRef]
  42. Marple, R.T.; Talwani, P. Evidence for a buried fault system in the coastal plain of the Carolinas and Virginia—Implications for neotectonics in the southeastern United States. Geol. Soc. Am. Bull. 2000, 112, 200–220. [Google Scholar] [CrossRef]
  43. Soller, D.R. Geology and Tectonic History of the Lower Cape Fear River Valley, Southeastern North Carolina; USGS Professional Paper 1466-A; US Geological Survey: Reston, VA, USA, 1988.
  44. NOAA OCM. Sea Level Rise Viewer. National Oceanic and Atmospheric Administration Office of Coastal Management. 2022. Available online: https://coast.noaa.gov/slr/ (accessed on 31 May 2024).
  45. Houston, J.R. Sea-level acceleration: Analysis of the world’s high-quality tide gages. J. Coast. Res. 2021, 37, 272–279. [Google Scholar] [CrossRef]
  46. Piecuch, C.G.; Bittermann, K.; Kemp, A.C.; Ponte, R.M.; Little, C.M.; Engelhart, S.E.; Lentz, S.J. River-discharge effects on United States Atlantic and Gulf coast sea-level changes. Proc. Nat. Acad. Sci. USA 2018, 115, 7729–7734. [Google Scholar] [CrossRef] [PubMed]
  47. Maxwell, J.T.; Harley, G.L.; Tucker, C.S.; Galuska, T.; Ficklin, D.L.; Bregy, J.C.; Heeter, K.J.; Au, T.F.; Lockwood, B.R.; King, D.J.; et al. 1100-year reconstruction of baseflow for the Santee River, South Carolina reveals connection to the North Atlantic subtropical high. Geophys. Res. Lett. 2022, 49, e2022GL100742. [Google Scholar] [CrossRef]
  48. Suther, B.E.; Leigh, D.S.; Brook, G.A. Fluvial terraces of the Little River valley, Atlantic Coastal Plain, North Carolina. Southeast. Geol. 2011, 48, 73–83. [Google Scholar]
  49. Williams, T.M.; O’Halloran, T.L. Relative sea level rise in the Winyah Bay-Waccamaw River tidal system over the last thirteen years. J. South Carol. Water Resour. 2023, 9, 29–38. [Google Scholar] [CrossRef]
  50. Penfound, W.T.; Hathaway, E.S. Plant communities in the marshlands of Southeast Louisiana. Ecol. Monogr. 1938, 8, 1–56. [Google Scholar] [CrossRef]
  51. Taillie, P.J.; Moorman, C.E.; Poulter, B.; Ardón, M.; Emanuel, R.E. Decadal-scale vegetation change driven by salinity at leading edge of rising sea level. Ecosystems 2019, 22, 1918–1930. [Google Scholar] [CrossRef]
  52. Ury, E.A.; Yang, X.; Wright, J.P.; Bernhardt, E.S. Rapid deforestation of a coastal landscape driven by sea-level rise and extreme events. Ecol. App. 2021, 31, e02339. [Google Scholar] [CrossRef] [PubMed]
  53. NOAA OCM. Detailed Method for Mapping Sea-Level Rise Inundation. National Oceanic and Atmospheric Administration Office of Coastal Management. 2017. Available online: https://coast.noaa.gov/data/digitalcoast/pdf/slr-inundation-methods.pdf (accessed on 1 May 2024).
  54. Schmid, K.; Hadley, B.; Waters, K. Mapping and portraying inundation uncertainty of bathtub-type models. J. Coast. Res. 2014, 30, 548–561. [Google Scholar] [CrossRef]
  55. Sweet, W.V.; Dusek, G.; Obeysekera, J.; Marra, J.J. Patterns and Projections of High Tide Flooding along the U.S. Coastline Using a Common Impact Threshold; NOAA Technical Report NOS CO-OPS 86; U.S. National Ocean and Atmospheric Administration, National Ocean Service: Washington, DC, USA, 2018.
  56. Daniels, R.B.; Kleiss, H.J.; Buol, S.W.; Byrd, H.J.; Phillips, J.A. Soil Systems in North Carolina; North Carolina Agricultural Research Service Bulletin: Raleigh, NC, USA, 1984; Volume 467. [Google Scholar]
  57. Phillips, J.D. Delivery of upper-basin sediment to the lower Neuse River, North Carolina, U.S.A. Earth Surf. Proc. Land. 1992, 17, 699–709. [Google Scholar] [CrossRef]
  58. Tant, P.L. Soil Survey of Chowan and Perquimans Counties, North Carolina; US. Department of Agriculture: Washington, DC, USA, 1986.
  59. Blum, M.D.; Morton, R.A.; Durbin, J.M. Deweyville terraces and deposits of the Texas Gulf coastal plain. Gulf Coast Assoc. Geol. Soc. Trans. 1995, 45, 53–60. [Google Scholar]
  60. Otvos, E.G. Numerical chronology of Pleistocene coastal plain and valley development; extensive aggradation during glacial low sea-levels. Quat. Int. 2005, 135, 91–113. [Google Scholar] [CrossRef]
  61. Rodriguez, A.B.; Anderson, J.B.; Simms, A.R. Terrace inundation as an autocyclic mechanism for parasequence formation: Galveston estuary, Texas, U.S.A. J. Sediment. Res. 2005, 75, 608–620. [Google Scholar] [CrossRef]
  62. Leigh, D.S. Late Quaternary climates and river channels of the Atlantic coastal plain, southeastern USA. Geomorphology 2008, 101, 90–108. [Google Scholar] [CrossRef]
  63. Waters, M.R.; Forman, S.L.; Stafford, T.W.; Foss, J. Geoarchaeological investigations at the Topper and Big Pine Tree sites, Allendale County, South Carolina. J. Archaeol. Sci. 2009, 36, 1300–1311. [Google Scholar] [CrossRef]
  64. Ogg, C.M.; Wilson, M.A.; Reed, J.M.; Gulley, C.D. Sediment provenance and geomorphic development of soils in a blackwater ecosystem, South Carolina Coastal Plain. Geoderma 2013, 192, 394–406. [Google Scholar] [CrossRef]
  65. Hughes, K.; Croke, J.; Bartley, R.; Thompson, C.; Sharma, A. Alluvial terrace preservation in the wet tropics, northeast Queensland, Australia. Geomorphology 2015, 248, 311–326. [Google Scholar] [CrossRef]
  66. Phillips, J.D. Ghost cypress as indicators of sea-level rise in the Neuse River, North Carolina. Wetl. Ecol. Manag. 2024, 32, 287–302. [Google Scholar] [CrossRef]
  67. Peterson, A.T.; Li, X. Niche-based projections of wetlands shifts with marine intrusion from sea level rise: An example analysis for North Carolina. Environ. Earth Sci. 2015, 73, 1479–1490. [Google Scholar] [CrossRef]
  68. Smart, L.S.; Taillie, P.J.; Poulter, B.; Vukomanovic, J.; Singh, K.K.; Swenson, J.J.; Mitasova, H.; Smith, J.W.; Meentemeyer, R.K. Aboveground carbon loss associated with the spread of ghost forests as sea levels rise. Environ. Res. Lett. 2020, 15, 104028. [Google Scholar] [CrossRef]
  69. Craft, C.B. Tidal freshwater forest accretion does not keep pace with sea level rise. Glob. Chang. Biol. 2012, 18, 3615–3623. [Google Scholar] [CrossRef]
  70. Ensign, S.H.; Doyle, M.W.; Piehler, M.F. The effect of tide on the hydrology and morphology of a freshwater river. Earth Surf. Proc. Land. 2013, 38, 655–660. [Google Scholar] [CrossRef]
  71. Ensign, S.H.; Hupp, C.R.; Noe, G.B.; Krauss, K.W.; Stagg, C.L. Sediment accretion in tidal freshwater forests and oligohaline marshes of the Waccamaw and Savannah Rivers, USA. Estuaries Coasts 2014, 37, 1107–1119. [Google Scholar] [CrossRef]
  72. Willard, D.; Bernhardt, C.; Brown, R.; Landacre, B.; Townsend, P. Development and application of a pollen-based stratigraphic reconstruction from the lower Roanoke River Basin, North Carolina. Holocene 2010, 21, 305–317. [Google Scholar] [CrossRef]
  73. Phillips, J.D. Geomorphic impacts of Hurricane Florence on the lower Neuse River: Portents and particulars. Geomorphology 2022, 397, 108026. [Google Scholar] [CrossRef]
  74. Phillips, J.D. Landscape change and climate attribution, with an example from estuarine marshes. Geomorphology 2023, 430, 108666. [Google Scholar] [CrossRef]
  75. Ensign, S.H.; Noe, G.B. Tidal extension and sea-level rise: Recommendations for a research agenda. Front. Ecol. Environ. 2018, 16, 37–43. [Google Scholar] [CrossRef]
  76. Gunderson, G.C. Long-Term Accumulation of Sediments, Carbon and Nitrogen by Coastal Wetlands in the Albemarle Sound, North Carolina. Master’s Thesis, North Carolina State University, Raleigh, NC, USA, 2017. [Google Scholar]
  77. Drexler, J.Z.; Fuller, C.C.; Orlando, J.; Salas, A.; Wurster, F.C.; Duberstein, J.A. Estimation and uncertainty of recent carbon accumulation and vertical accretion in drained and undrained forested peatlands of the southeastern USA. J. Geophys. Res. Biogeosci. 2017, 122, 2563–2579. [Google Scholar] [CrossRef]
  78. Hupp, C.R.; Schenk, E.R.; Kroes, D.E.; Willard, D.; Townsend, P.; Peet, R. Patterns of floodplain sediment deposition along the regulated lower Roanoke River, North Carolina: Annual, decadal, centennial scales. Geomorphology 2015, 228, 666–680. [Google Scholar] [CrossRef]
  79. Krauss, K.W.; Noe, G.B.; Duberstein, J.A.; Cormier, N.; From, A.S.; Doody, T.R.; Conner, W.H.; Cahoon, D.R.; Johnson, D.J. Presence of hummock and hollow microtopography reflects shifting balances of shallow subsidence and root zone expansion along forested wetland river gradients. Estuaries Coasts 2023. [Google Scholar] [CrossRef]
  80. Phillips, J.D. Decoupling of Sediment Sources in Large River Basins. In Effects of Scale on Interpretation and Management of Sediment and Water Quality; Osterkamp, W.R., Ed.; International Association of Hydrological Sciences Publication: Wallingford, UK, 1995; Volume 226, pp. 11–16. [Google Scholar]
  81. Purnell, D.; Gomez, N.; Minarik, W.; Langston, G. Real-time water levels using GNISS-IR: A potential tool for flood monitoring. Geophys. Res. Lett. 2024, 51, e20223GL105039. [Google Scholar] [CrossRef]
  82. Güneralp, I.; Castillo, C.R.; Hales, B.U. Monitoring surface-water connectivity in a coastal lowland river using field-based data loggers. J. Hydrol. 2024, 633, 130972. [Google Scholar] [CrossRef]
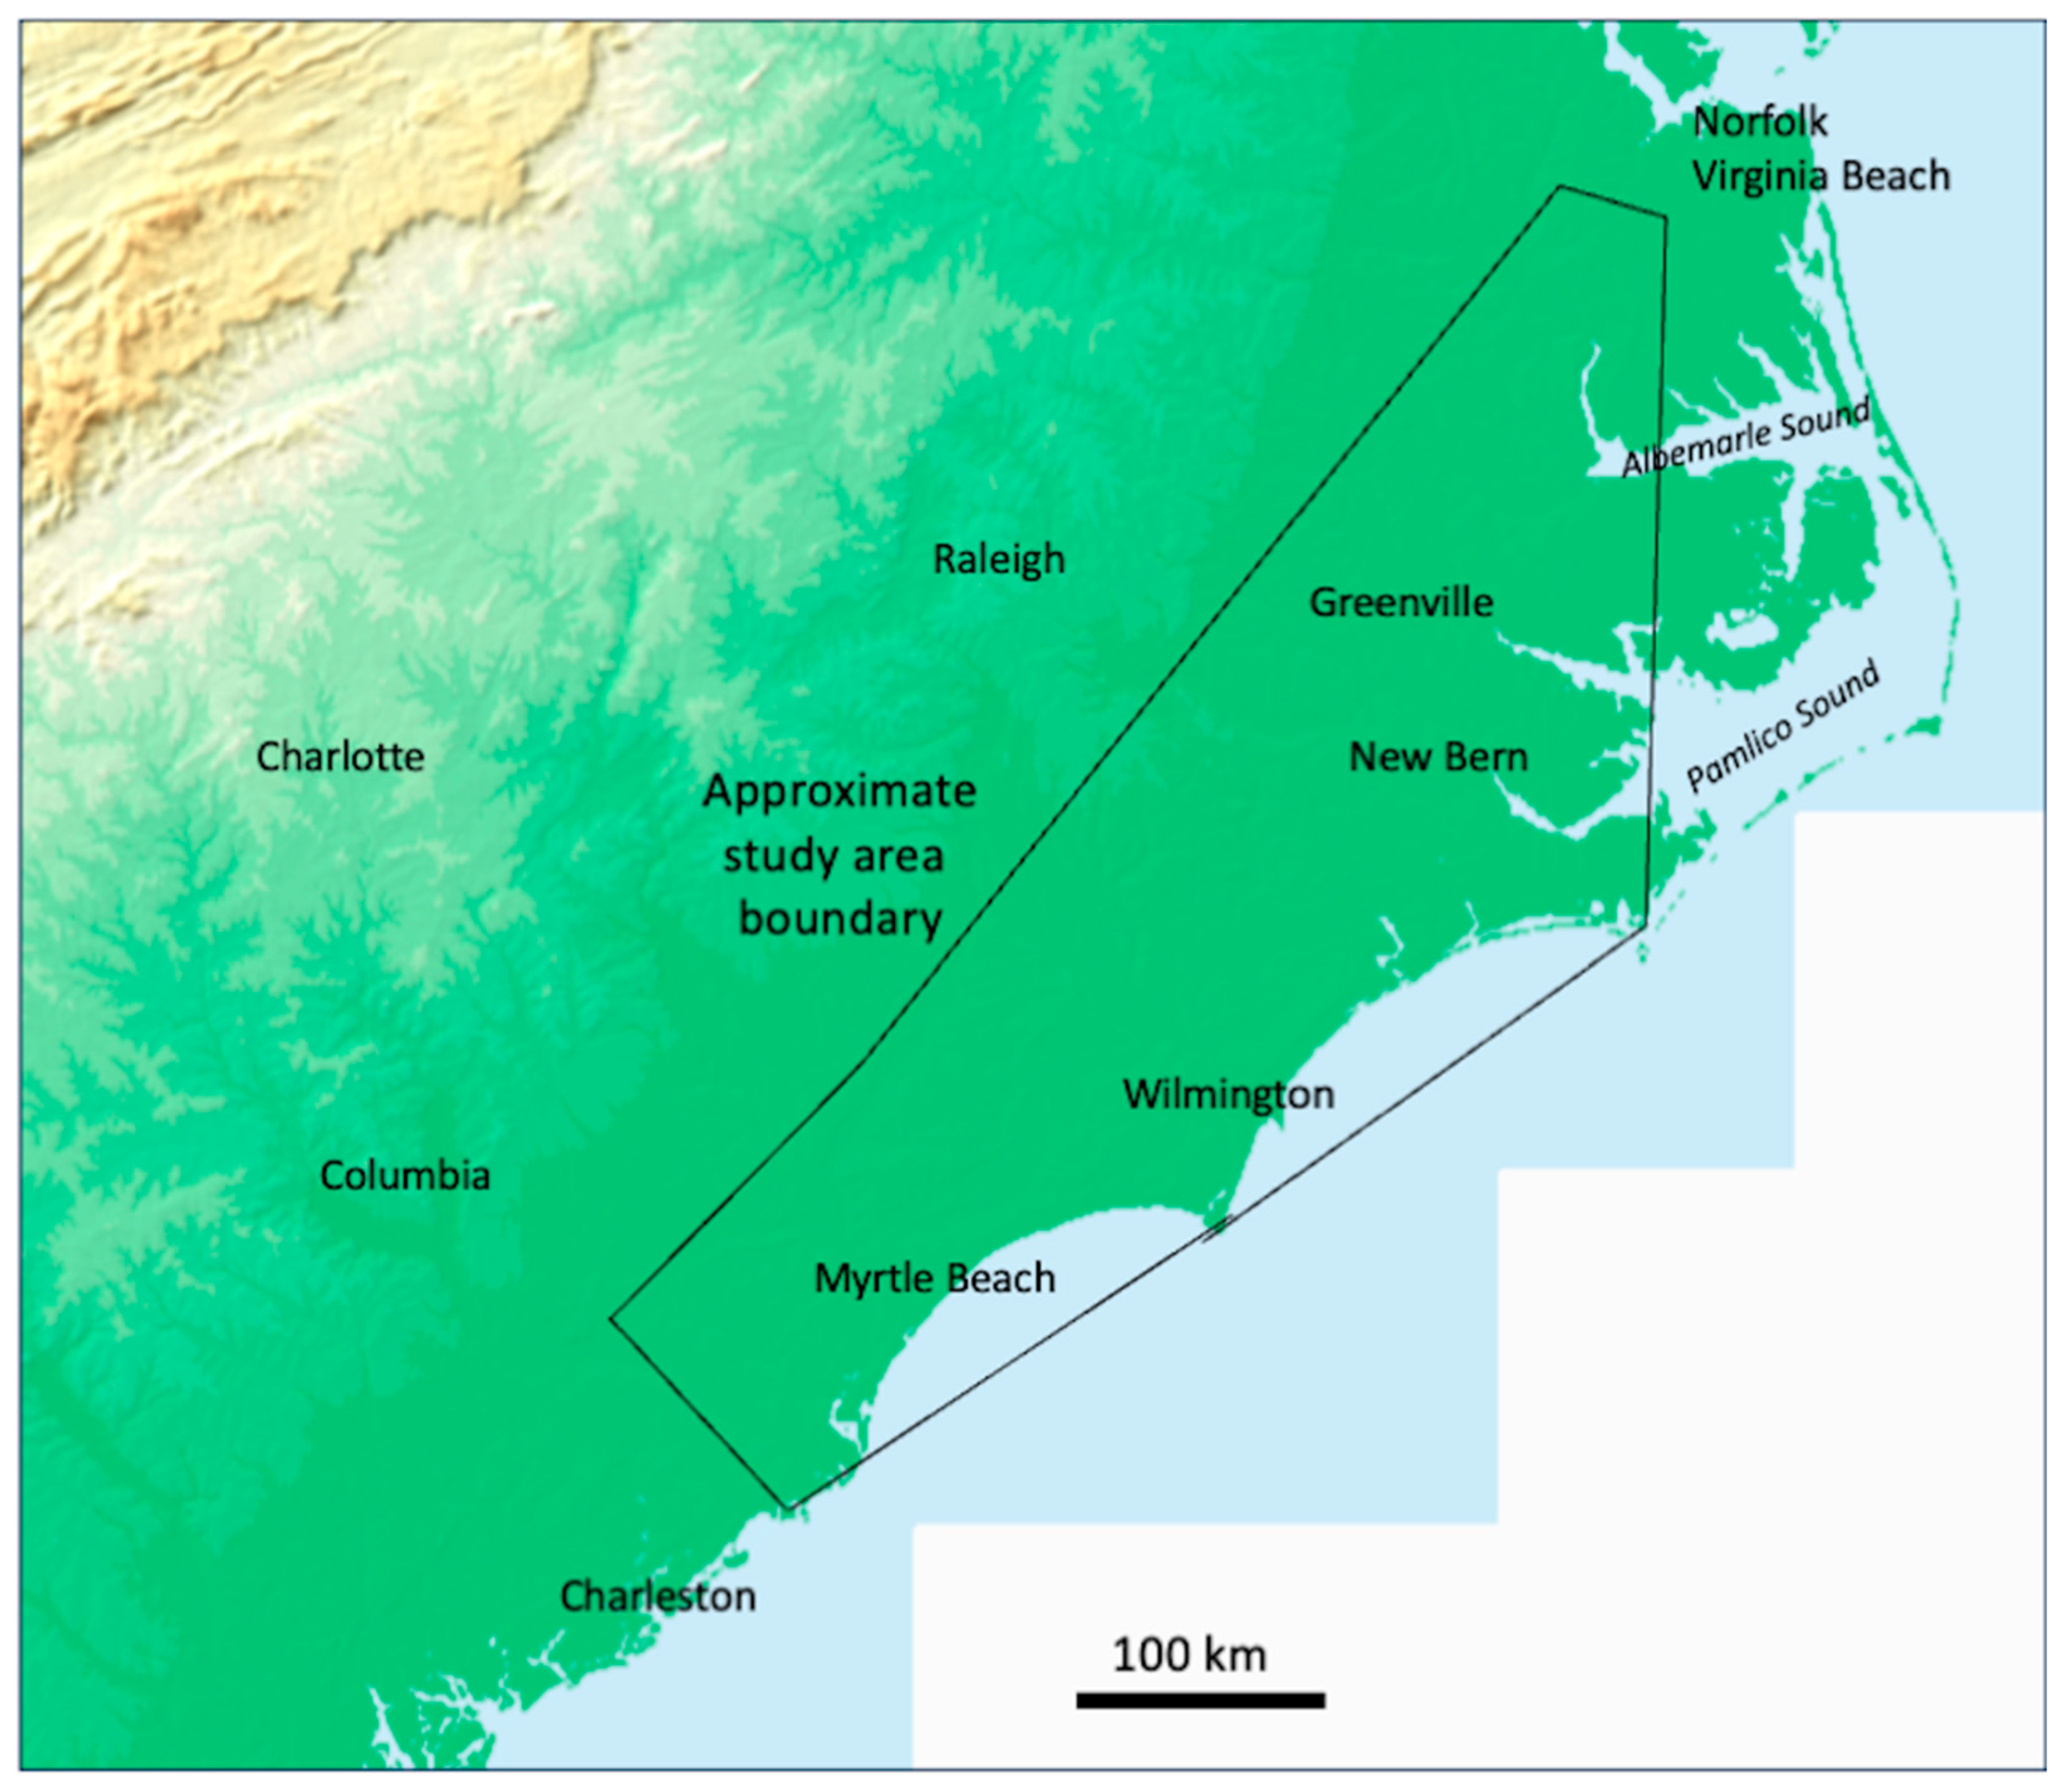
Figure 1. General regional setting of the study area.
Hydrology 11 00124 g001
Figure 2. Study rivers in the Albemarle Embayment area as shown on the U.S. Geological Survey National Hydrography Database map, with additional added place name labels. Labeled study rivers include the Blackwater, Meherrin, Roanoke, Tar, and Neuse Rivers. Numbers indicate other study rivers: (1) Nottoway, (2) Chowan, (3) Tranter’s Creek, (4) Swift Creek, (5) Trent River, and (6) Newport River.
Hydrology 11 00124 g002
Figure 3. Study rivers in the Cape Fear Arch area as shown on the U.S. Geological Survey National Hydrography Database map, with additional added place name labels. Labeled study rivers include the Cape Fear, Pee Dee, Little Pee Dee, Black (S.C.), and Santee Rivers. Numbers indicate other study rivers: (1) Northeast Cape Fear; (2) Black (N.C.; the labeled S. River is a tributary of the Black); (3) Lynches; (4) Waccamaw; (5) Sampit.
Hydrology 11 00124 g003
Figure 4. Distance upstream from the head of the estuary of floodplain histosols, buried terrace islands, semi-permanently flooded riparian wetlands, and coastal backwater effects.
Hydrology 11 00124 g004
Figure 5. Locations of the upstream limits of backwater effects, organic floodplain soils, buried terraces, and semi-permanently flood wetlands for study rivers draining to the Neuse River estuary, shown on a digital elevation model basemap. The Walterboro Scarp in the vicinity of the Neuse River is also shown.
Hydrology 11 00124 g005
Figure 6. Locations of the upstream limits of backwater effects, organic floodplain soils, buried terraces, and semi-permanently flood wetlands for study rivers draining to Winyah Bay, shown on a digital elevation model basemap.
Hydrology 11 00124 g006
Figure 7. Inferred sequence of transformations in low-gradient coastal plain rivers due to upstream extension of backwater effects. Boxed elements are observed transformations in the space-for-time substitution. The other elements shown relate to processes. The black arrows indicate causal relations; the gray arrows indicate sequential changes where no apparent direct causal link is known.
Hydrology 11 00124 g007
Figure 8. Each curve (colored lines) above represents the upstream encroachment of backwater effects (based on Equation (2)) for a rate of sea-level rise for a range of channel slope gradients.
Hydrology 11 00124 g008
Figure 9. Examples from the Tar River of peat and muck soils directly overlying single-grained sand.
Hydrology 11 00124 g009
Table 1. Study rivers. HOE = head of estuary location (nearest town); DA = drainage area (km2); TR = estuarine tidal range (m).
RiverEstuaryHOEHeadwatersDATRNotes
Chowan (Meherrin, Nottoway, Blackwater)Albemarle SoundEdenton, N.C.Piedmont, VA12,950<0.15Meherrin, Nottoway & Blackwater Rivers, VA join to form the Chowan River
RoanokeAlbemarle SoundPlymouth, N.C.Blue Ridge Mtns., VA25,100<0.15Affected by large dams in lower Piedmont
TarPamlico River/Pamlico SoundWashington, N.C.Piedmont, N.C.14,400<0.15Name changes from Tar to Pamlico River at HOE
Tranter’s CreekPamlico River/Pamlico SoundWashington, N.C.Coastal Plain, N.C.637<0.15Tar River tributary
NeuseNeuse River/Pamlico SoundNew Bern, N.C.Piedmont, N.C.14,600<0.15
Swift CreekNeuse RiverNew Bern, N.C.Coastal Plain, N.C.700<0.15Neuse River tributary; confluence upstream of New Bern
Trent RiverTrent RiverRiver Bend, N.C.Coastal Plain, N.C.1420<0.15Trent estuary tributary to Neuse estuary
Newport RiverNewport RiverMorehead City, N.C.Coastal Plain, N.C.3100.94–1.06Possible effects of dredging in estuary
Northeast Cape FearCape Fear RiverWilmington, N.C.Coastal Plain, N.C.44401.30–1.42Joins Cape Fear River at Wilmington
Cape FearCape Fear RiverWilmington, N.C.Piedmont, N.C.23,7301.30–1.42Possible effects of navigational dredging in estuary
Black (N.C.)Cape Fear RiverWilmington, N.C.Coastal Plain, N.C.16801.30–1.42Tributary of lower Cape Fear River
WaccamawWinyah BayGeorgetown, S.C.Coastal Plain, N.C.28901.00–1.40Joins Pee Dee River at Winyah Bay
Great Pee DeeWinyah BayGeorgetown, S.C. Upper piedmont, N.C.47,0601.00–1.40
Little Pee DeeWinyah BayGeorgetown, S.C.Coastal Plain, N.C.78001.00–1.40Upper reaches in N.C. called Lumber River; tributary to Great Pee Dee
LynchesWinyah BayGeorgetown, S.C.Lower piedmont, N.C. & S.C.27001.00–1.40Tributary to Great Pee Dee
Black (SC)Winyah BayGeorgetown, S.C.Piedmont, S.C.8501.00–1.40
SampitWinyah BayGeorgetown, S.C.Coastal Plain, S.C.4261.00–1.40
SanteeSouth Santee River & North Santee BayCape Romain, S.C.Blue Ridge Mtns, N.C. & S.C.64,4001.16–1.29Affected by large dams in upper coastal plain
Table 2. Distance of coastal backwater effects (rounded to the nearest 0.5 km) upstream from the head of the estuary. Shaded/unshaded patterns group together rivers within the same larger drainage basin.
Hydrology 11 00124 i001
1 This was the upstream limit of the measurement zone. 2 Inundation limit extends to 65 km, but the “low-lying area” mapped along the channel is 120.5 km. 3 Tide forecast location.
Table 3. Upstream limit of semi-permanently flooded wetlands (SPFWs) (km) from the head of the estuary, based on NWI (National Wetlands Inventory) maps and as adjusted based on additional evidence.
Hydrology 11 00124 i002
Shaded/unshaded patterns group together rivers within the same larger drainage basin.
Table 4. Floodplain swamp Histosols were mapped on the study rivers.
Soil SeriesTaxonomyRivers
ChowanFine-silty, mixed, active, nonacid, Thapto-Histic FluvaquentsChowan, Cape Fear
DorovanDysic, thermic, Typic HaplosapristsChowan (inc. Meherrin, Blackwater, Nottoway), Roanoke, Tar, Neuse, Tranter’s, Swift, Newport, Cape Fear, NE Cape Fear, Black (N.C.)
HobonnyEuic, thermic Typic HaplosapristsTrent, Waccamaw, Pee Dee, Little Pee Dee, Lynches, Black (S.C.), Sampit
PamlicoSandy or sandy-skeletal, siliceous, dysic, thermic Terric HaplosapristsBlack (N.C.), Santee
Disclaimer/Publisher’s Note: The statements, opinions and data contained in all publications are solely those of the individual author(s) and contributor(s) and not of MDPI and/or the editor(s). MDPI and/or the editor(s) disclaim responsibility for any injury to people or property resulting from any ideas, methods, instructions or products referred to in the content.