Analysis of Runoff Changes and Their Driving Forces in the Minjiang River Basin (Chengdu Section) in the Last 30 Years
Abstract
1. Introduction
2. Materials and Methods
2.1. Study Site
2.2. Data Sources
2.3. Study Framework
2.4. Study Methods
2.4.1. SWAT Model Construction and SUFI-2 Algorithm
2.4.2. Mann–Kendall Test and Theil–Sen Slope
2.4.3. Relative Importance Analysis
2.4.4. The Partial Least Squares Structural Equation Modeling (PLS-SEM) Construction
3. Results
3.1. The Construction of the SWAT Model
3.2. Runoff Simulation Analysis
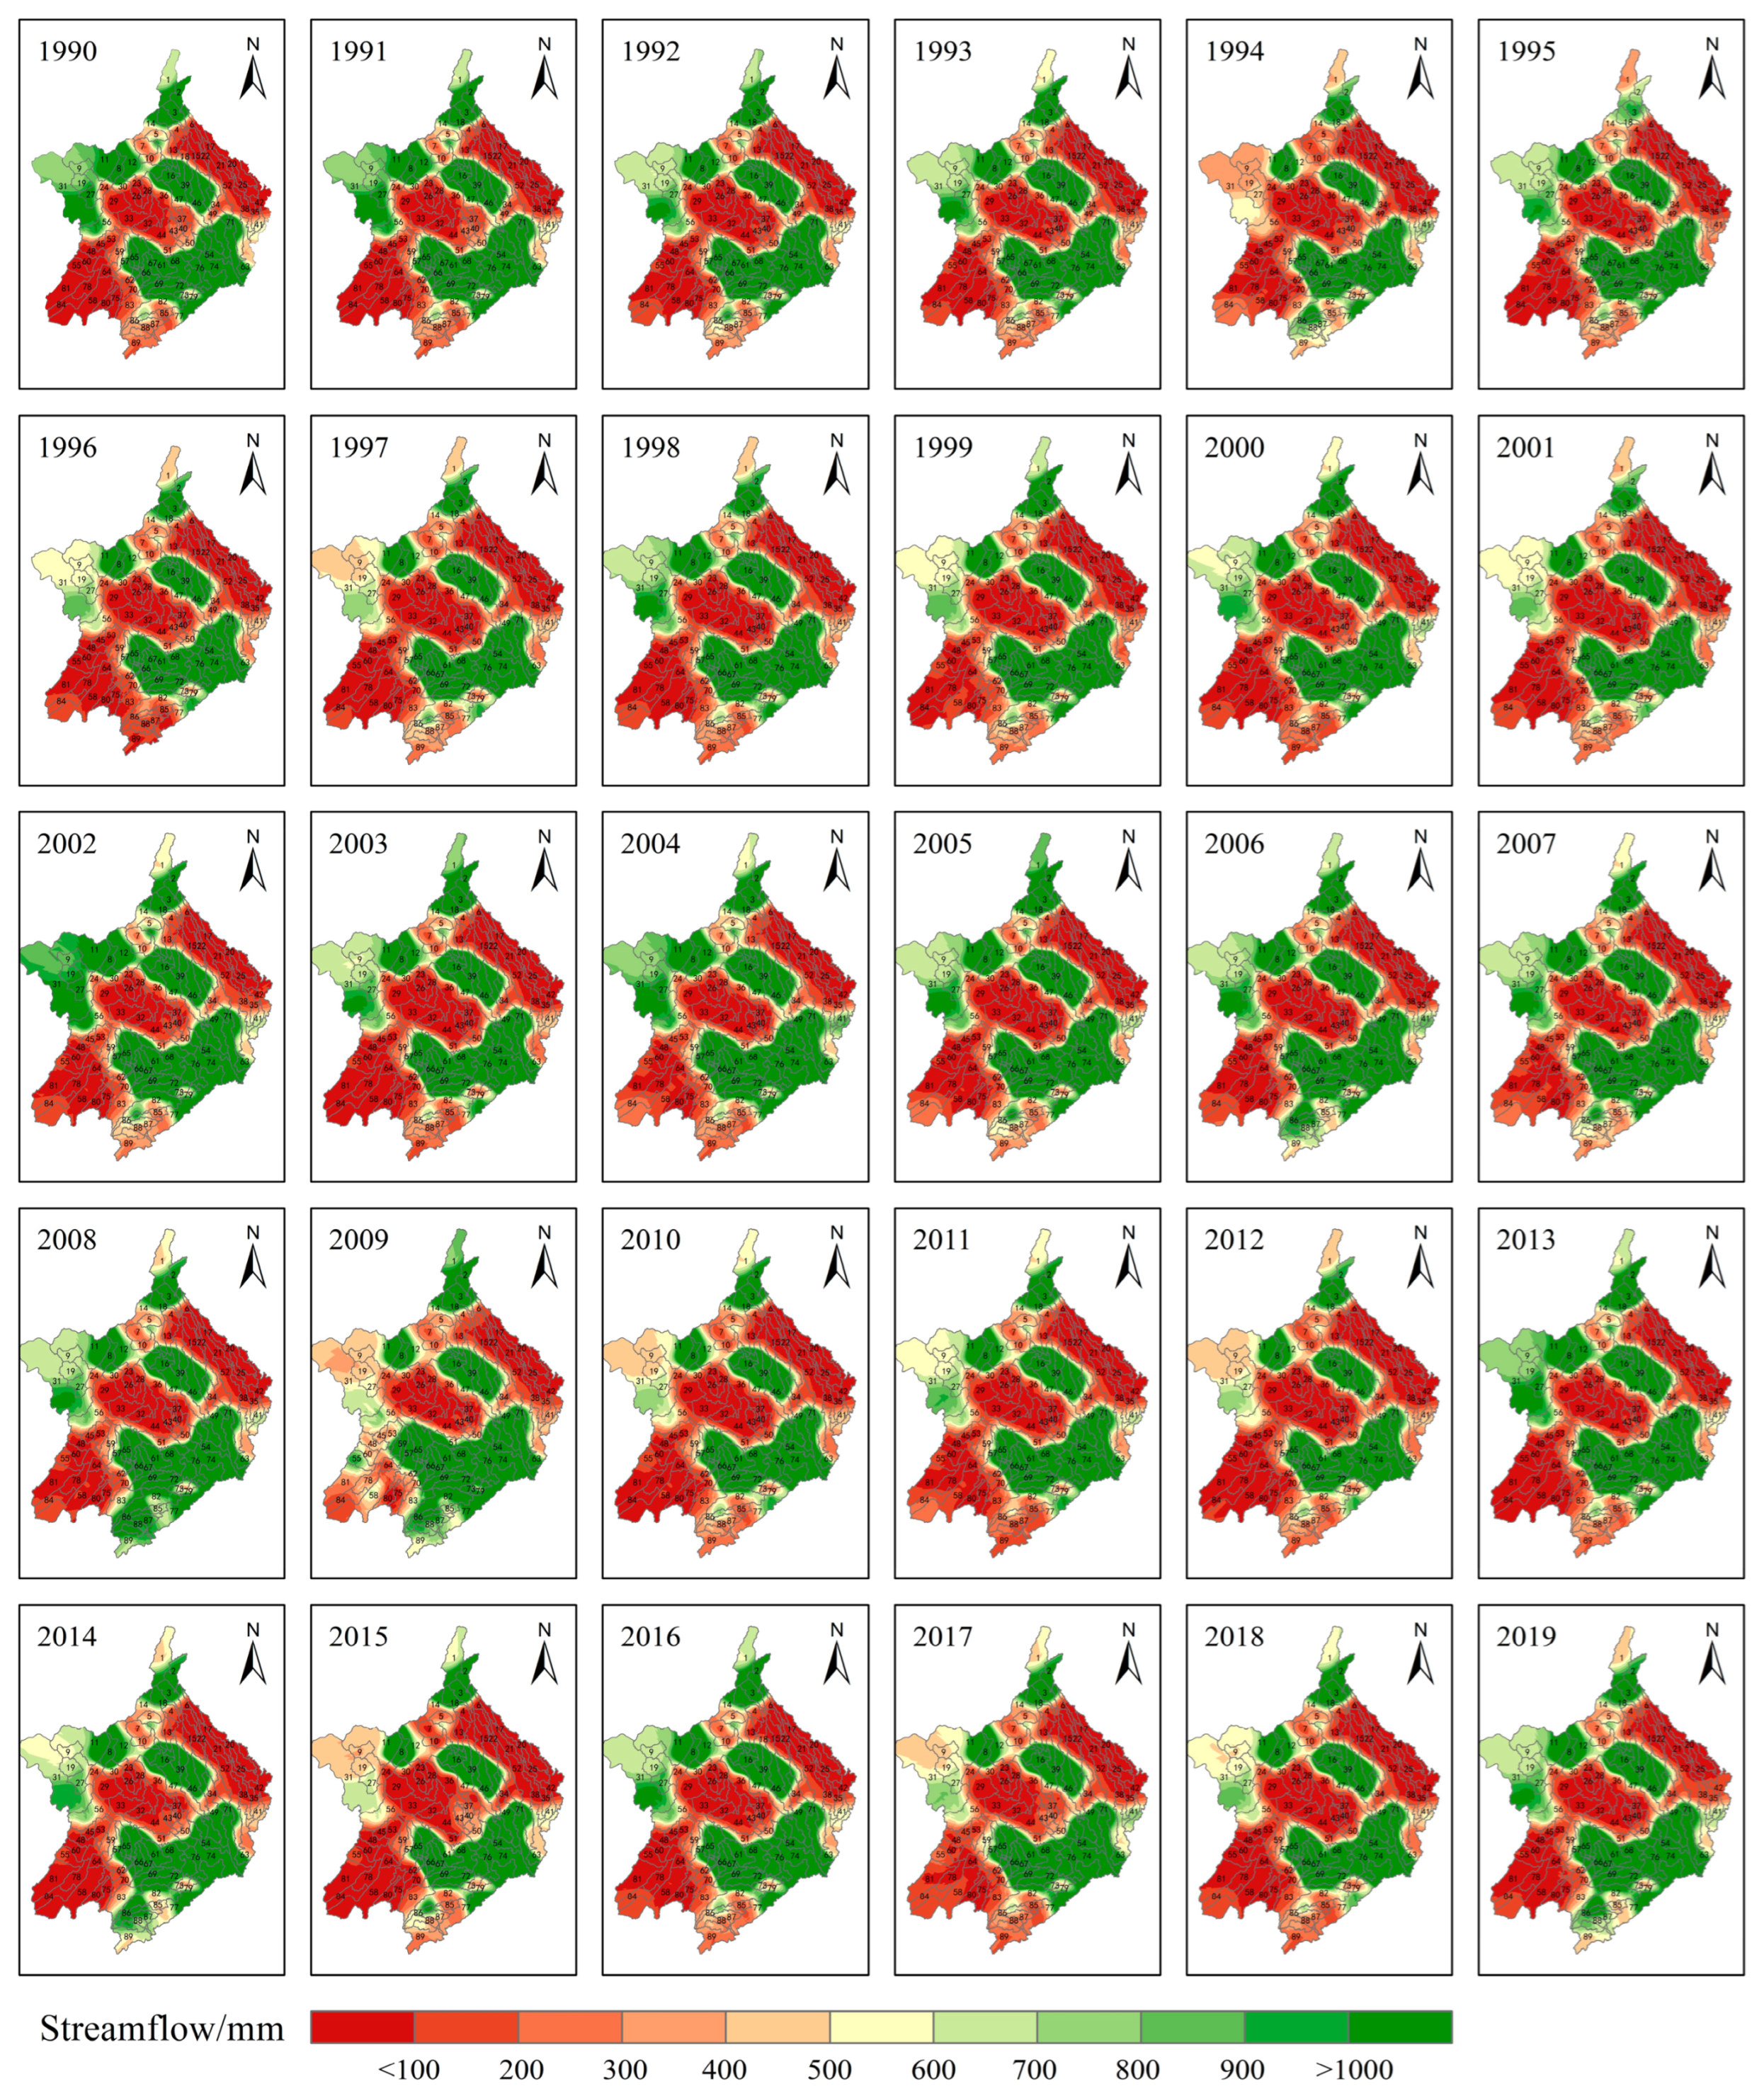
3.2.1. Inter-Annual Variability of Runoff
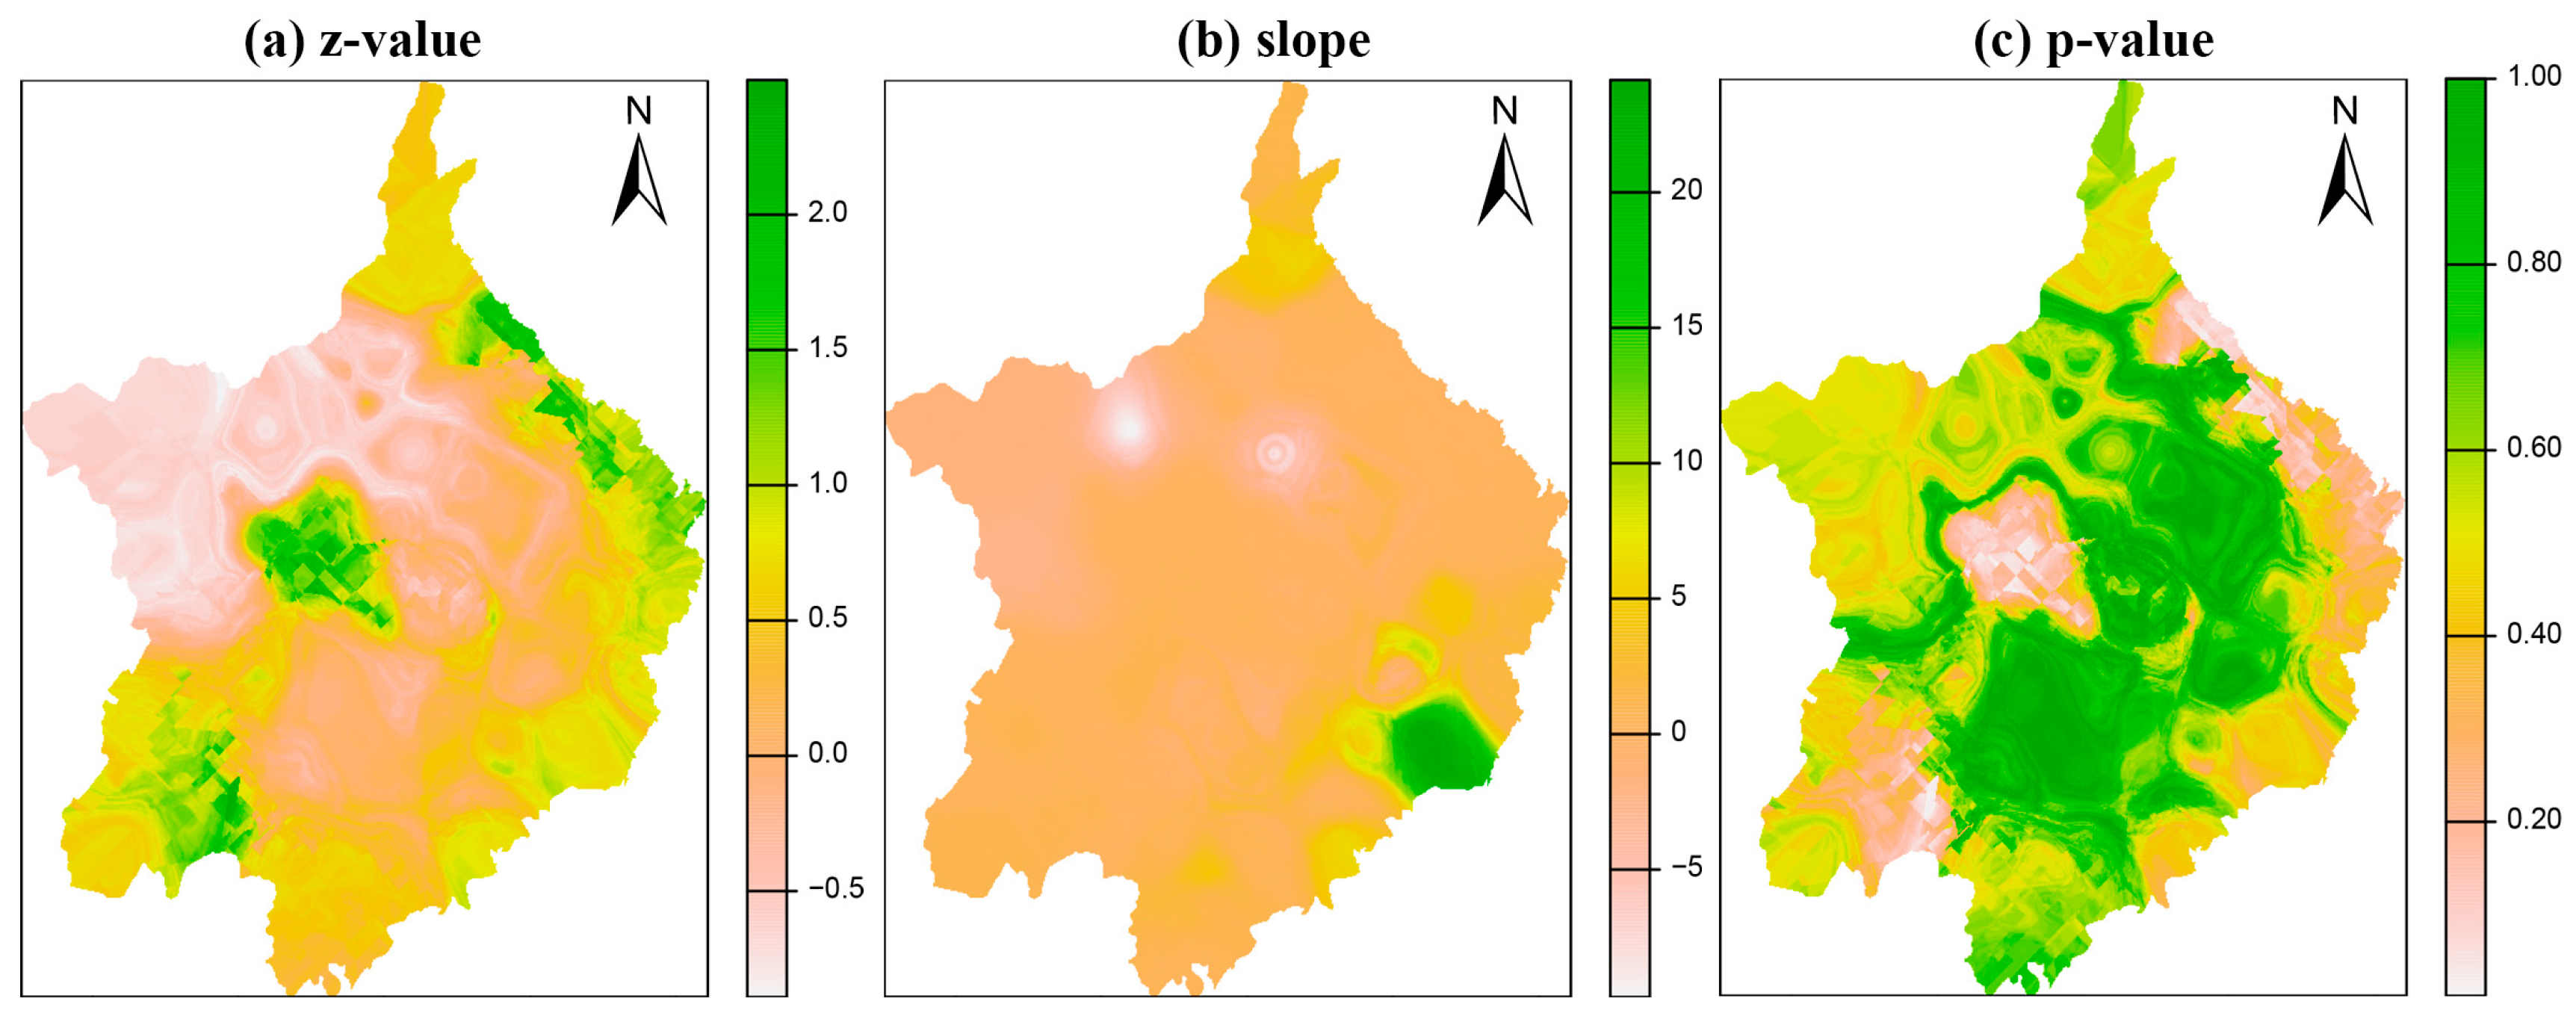
3.2.2. Characteristics of the Spatial Distribution of Runoff
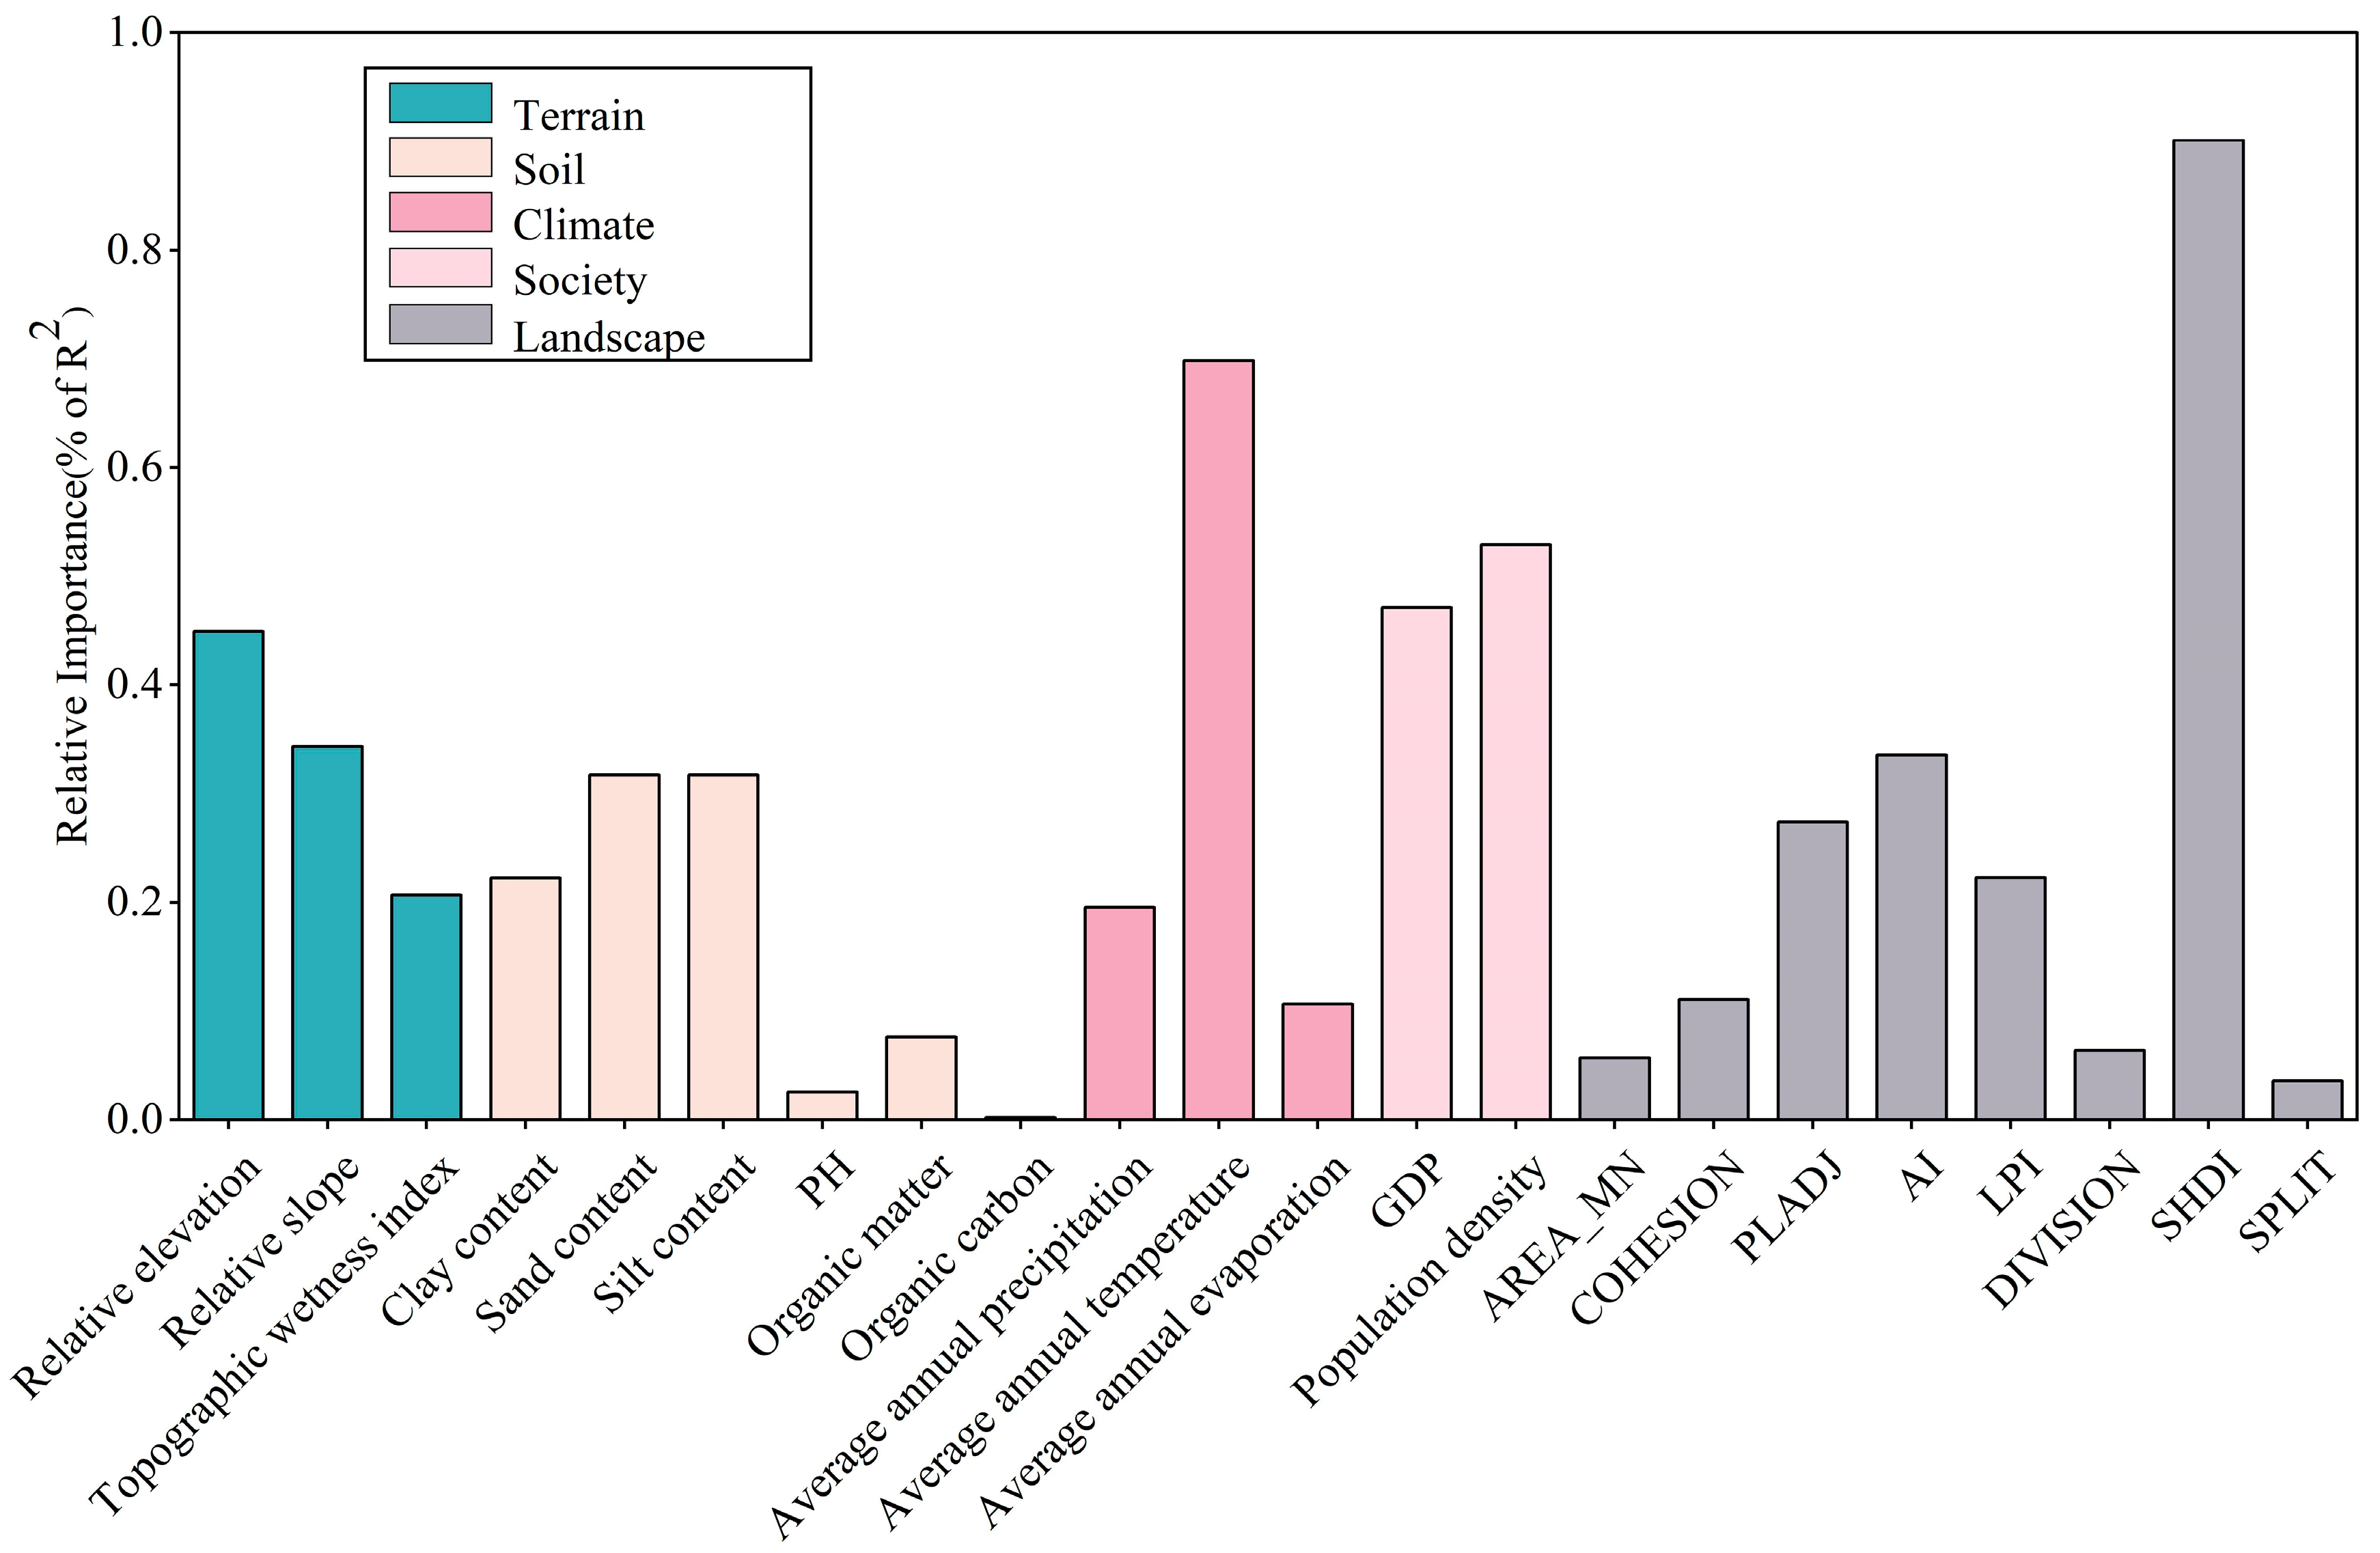
3.3. Relative Importance of Drivers
3.4. The PLS-SEM Model Assessment
3.4.1. Assessment of Measurement Models
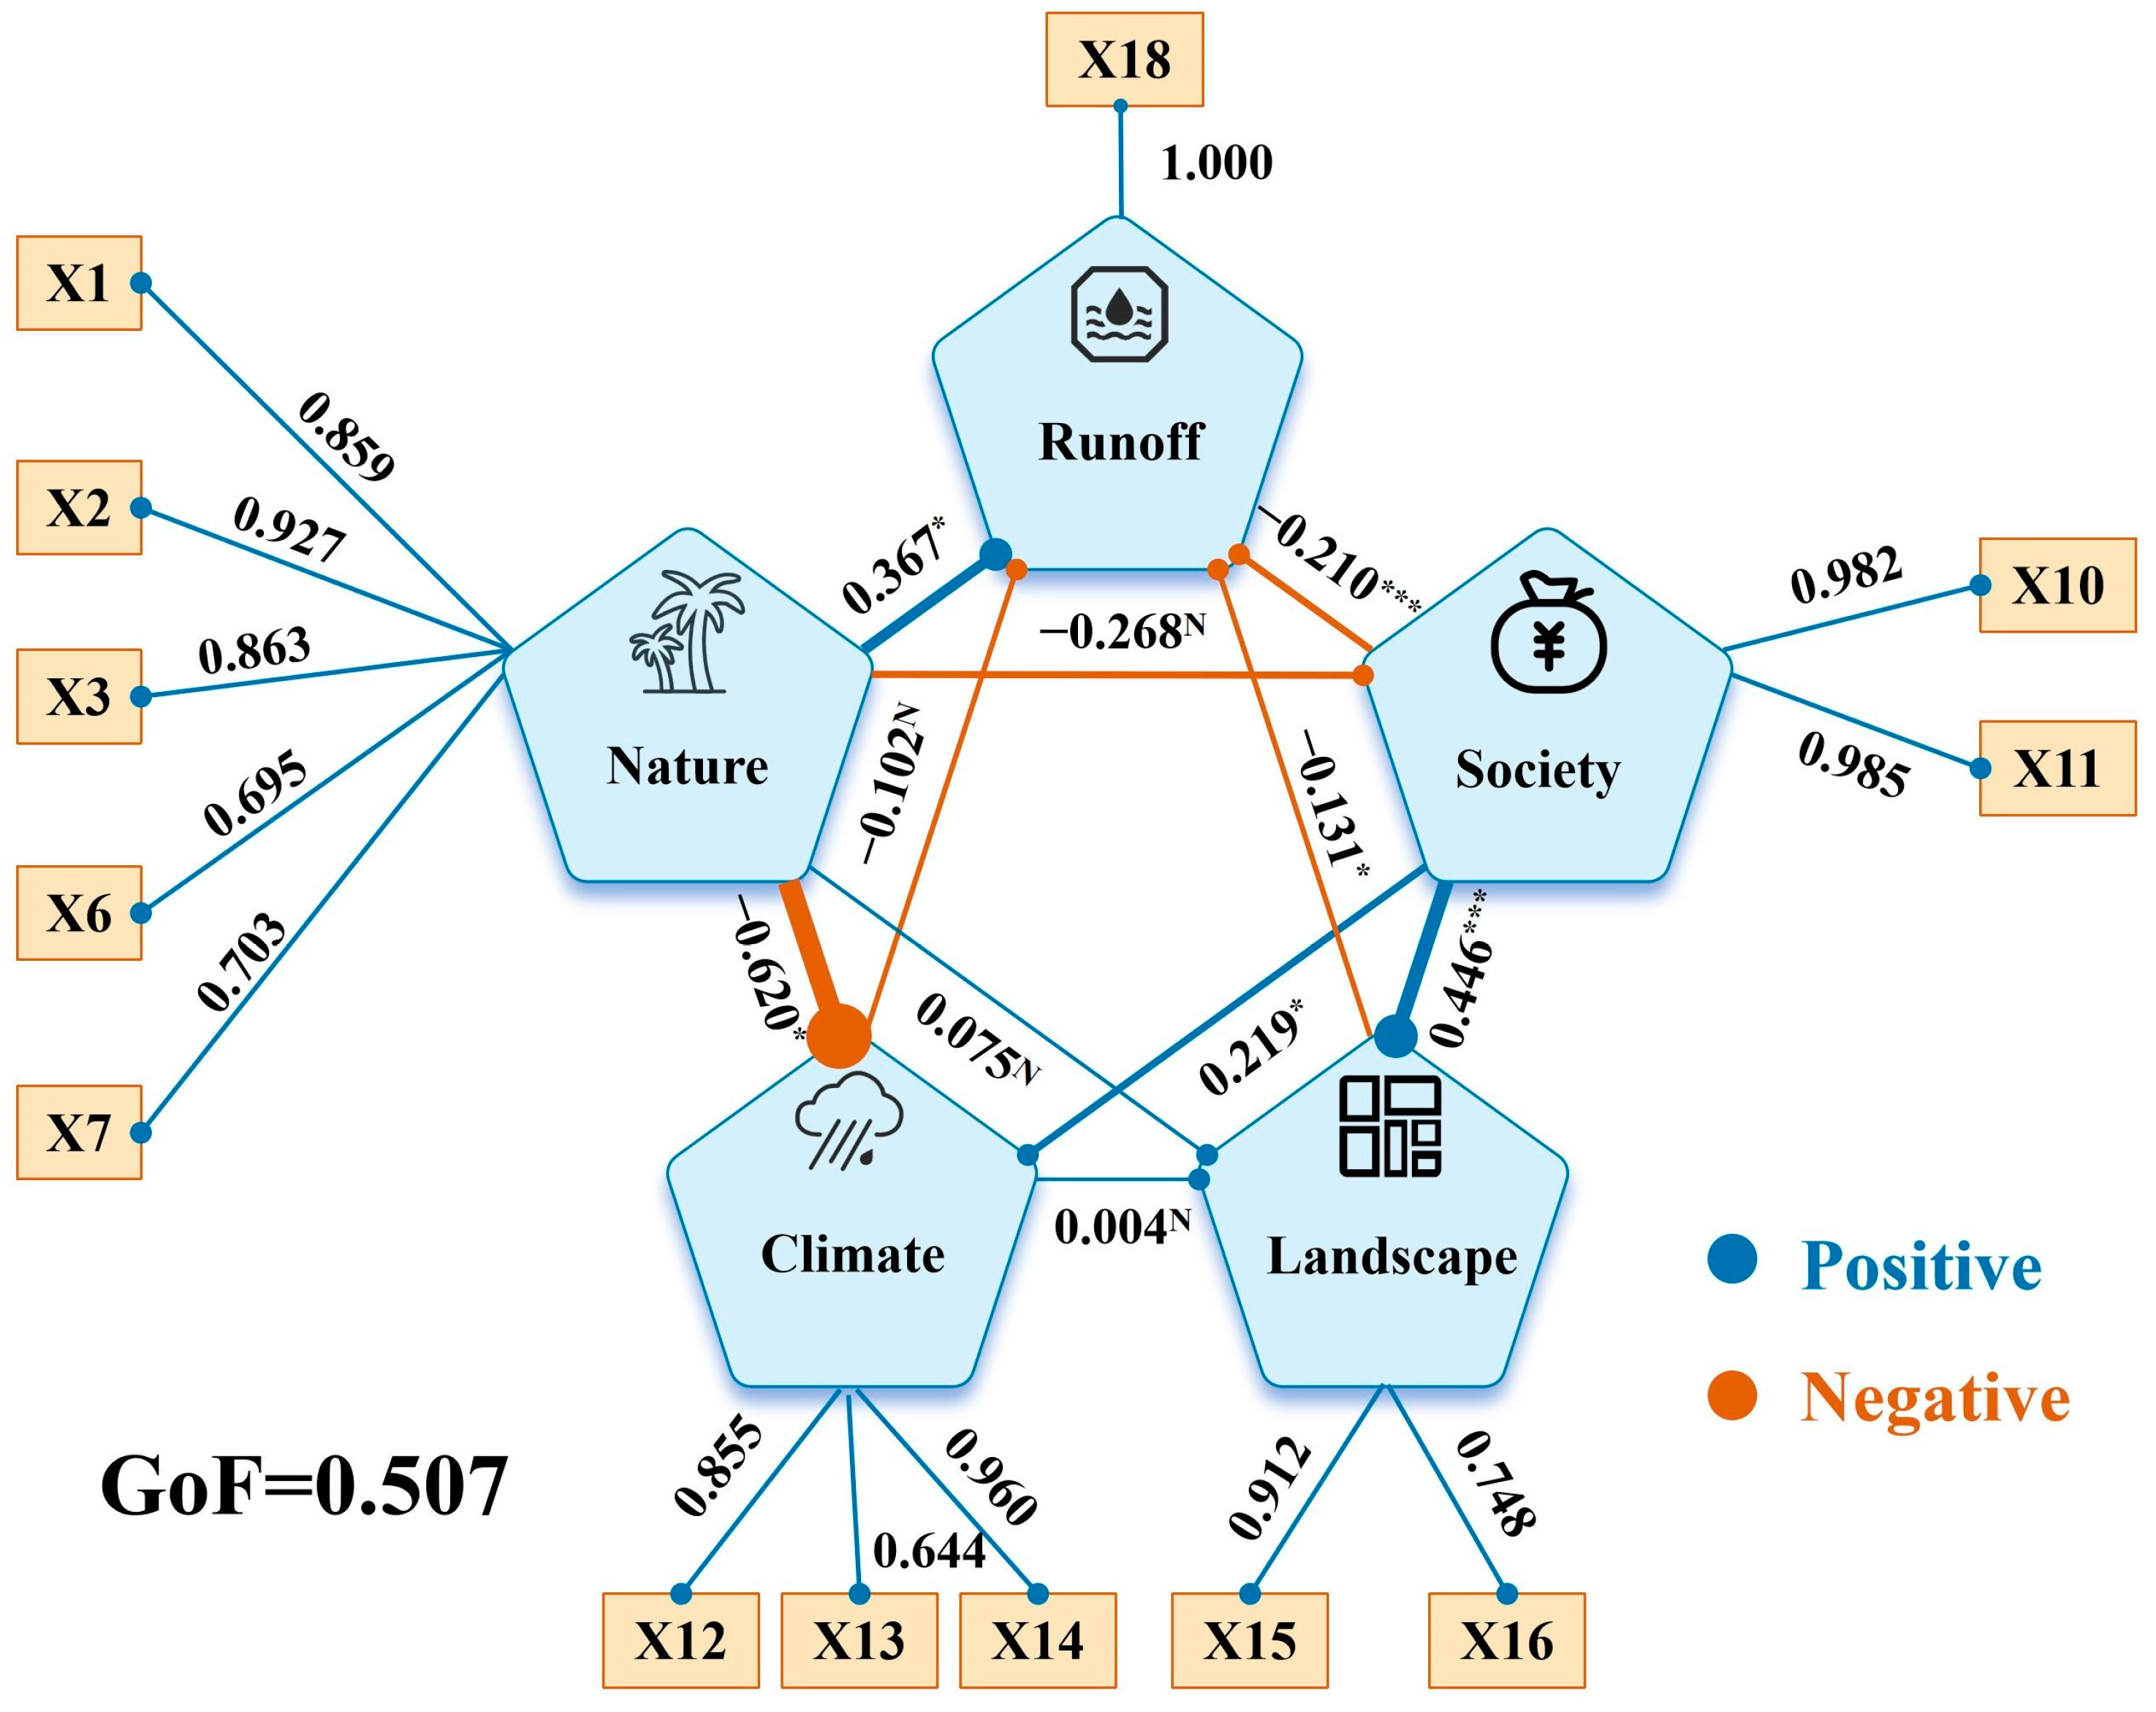
3.4.2. Assessment of Structural Models
4. Discussion
4.1. Spatial and Temporal Variability of Runoff
4.2. Analysis of the Drivers of Runoff Change
4.2.1. Significant Positive Impact of Natural Factors
4.2.2. Significant Negative Impacts of Human Activities
4.2.3. Significant Negative Effects of Landscape Factors
4.2.4. Non-Significant Effects of Climatic Factors
5. Conclusions
Author Contributions
Funding
Data Availability Statement
Conflicts of Interest
References
- Owuor, S.O.; Butterbach-Bahl, K.; Guzha, A.C.; Rufino, M.C.; Pelster, D.; Díaz-Pinés, E.; Breuer, L. Groundwater recharge rates and surface runoff response to land use and land cover changes in semi-arid environments. Ecol. Process. 2016, 5, 16. [Google Scholar] [CrossRef]
- Li, X.; Liu, S.; Xiao, Q.; Ma, M.; Jin, R.; Che, T.; Wang, W.; Hu, X.; Xu, Z.; Wen, J.; et al. A multiscale dataset for understanding complex eco-hydrological processes in a heterogeneous oasis system. Sci. Data 2017, 4, 170083. [Google Scholar] [CrossRef] [PubMed]
- Rumynin, V.G.; Rumynin, V.G. Surface Runoff Generation, Vertical Infiltration and Subsurface Lateral Flow. Overl. Flow Dyn. Solute Transp. 2015, 26, 3–50. [Google Scholar] [CrossRef]
- Zheng, J.; Wang, H.; Liu, B. Impact of the long-term precipitation and land use changes on runoff variations in a humid subtropical river basin of China. J. Hydrol. Reg. Stud. 2022, 42, 101136. [Google Scholar] [CrossRef]
- Gray, L.C.; Zhao, L.; Stillwell, A.S. Impacts of climate change on global total and urban runoff. J. Hydrol. 2023, 620, 129352. [Google Scholar] [CrossRef]
- Dimitriadou, S.; Nikolakopoulos, K.G. Evapotranspiration trends and interactions in light of the anthropogenic footprint and the climate crisis: A review. Hydrology 2021, 8, 163. [Google Scholar] [CrossRef]
- Wu, M.; Liu, P.; Lei, X.; Liao, W.; Cia, S.; Xia, Q.; Zou, K.; Wang, H. Impact of surface and underground water uses on streamflow in the upper-middle of the Weihe River basin using a modified WetSpa model. J. Hydrol. 2023, 616, 128840. [Google Scholar] [CrossRef]
- Zhai, R.; Tao, F. Contributions of climate change and human activities to runoff change in seven typical catchments across China. Sci. Total Environ. 2017, 605, 219–229. [Google Scholar] [CrossRef]
- Li, Z.; Quiring, S.M. Identifying the Dominant Drivers of Hydrological Change in the Contiguous United States. Water Resour. Res. 2021, 57, e2021WR029738. [Google Scholar] [CrossRef]
- Piao, S.; Friedlingstein, P.; Ciais, P.; de Noblet-Ducoudré, N.; Labat, D.; Zaehle, S. Changes in climate and land use have a larger direct impact than rising CO2 on global river runoff trends. Proc. Natl. Acad. Sci. USA 2007, 104, 15242–15247. [Google Scholar] [CrossRef]
- Wang, D.; Hejazi, M. Quantifying the relative contribution of the climate and direct human impacts on mean annual streamflow in the contiguous United States. Water Resour. Res. 2011, 47, 411. [Google Scholar] [CrossRef]
- Farsi, N.; Mahjouri, N. Evaluating the contribution of the climate change and human activities to runoff change under uncertainty. J. Hydrol. 2019, 574, 872–891. [Google Scholar] [CrossRef]
- Zhai, R.; Tao, F.; Lall, U.; Fu, B.; Elliott, J.; Jägermeyr, J. Larger drought and flood hazards and adverse impacts on population and economic productivity under 2.0 than 1.5 C warming. Earth’s Future 2020, 8, e2019EF001398. [Google Scholar] [CrossRef]
- Zhang, Y.; Zheng, H.; Zhang, X.; Leung, L.R.; Liu, C.; Zheng, C.; Guo, Y.; Chiew, F.H.; Post, D.; Kong, D.; et al. Future global streamflow declines are probably more severe than previously estimated. Nat. Water 2023, 1, 261–271. [Google Scholar] [CrossRef]
- Fang, D.; Hao, L.; Cao, Z.; Huang, X.; Qin, M.; Hu, J.; Liu, Y.; Sun, G. Combined effects of urbanization and climate change on watershed evapotranspiration at multiple spatial scales. J. Hydrol. 2020, 587, 124869. [Google Scholar] [CrossRef]
- Hagras, A. Runoff modeling using SCS-CN and GIS approach in the Tayiba Valley Basin, Abu Zenima area, South-west Sinai, Egypt. Model. Earth Syst. Environ. 2023, 9, 3883–3895. [Google Scholar] [CrossRef]
- Jia, M.; He, D.; Huo, X.; Zhang, H.; Jia, S.; Zhang, J. Exploring the impact of climate change on flood risk at cultural heritage sites using a GIS-based SCS-CN method: A case study of Shanxi province, China. Int. J. Disaster Risk Reduct. 2023, 96, 103968. [Google Scholar] [CrossRef]
- Soulis, K.X.; Valiantzas, J.D. SCS-CN parameter determination using rainfall-runoff data in heterogeneous watersheds–the two-CN system approach. Hydrol. Earth Syst. Sci. 2012, 16, 1001–1015. [Google Scholar] [CrossRef]
- Randall, M.; Sun, F.; Zhang, Y.; Jensen, M.B. Evaluating Sponge City volume capture ratio at the catchment scale using SWMM. J. Environ. Manag. 2019, 246, 745–757. [Google Scholar] [CrossRef]
- Akoko, G.; Le, T.H.; Gomi, T.; Kato, T. A review of SWAT model application in Africa. Water 2021, 13, 1313. [Google Scholar] [CrossRef]
- Li, H.; Wang, W.; Fu, J.; Wei, J. Spatiotemporal heterogeneity and attributions of streamflow and baseflow changes across the headstreams of the Tarim River Basin, Northwest China. Sci. Total Environ. 2023, 856, 159230. [Google Scholar] [CrossRef] [PubMed]
- Tan, M.L.; Gassman, P.W.; Yang, X.; Haywood, J. A review of SWAT applications, performance and future needs for simulation of hydro-climatic extremes. Adv. Water Resour. 2020, 143, 103662. [Google Scholar] [CrossRef]
- Zhou, S.; Wang, Y.; Chang, J.; Guo, A.; Li, Z. Investigating the dynamic influence of hydrological model parameters on runoff simulation using sequential uncertainty fitting-2-based multilevel-factorial-analysis method. Water 2018, 10, 1177. [Google Scholar] [CrossRef]
- Li, Z.; Huang, S.; Liu, D.; Leng, G.; Zhou, S.; Huang, Q. Assessing the effects of climate change and human activities on runoff variations from a seasonal perspective. Stoch. Environ. Res. Risk Assess. 2020, 34, 575–592. [Google Scholar] [CrossRef]
- Dijkstra, T.K.; Henseler, J. Consistent and asymptotically normal PLS estimators for linear structural equations. Comput. Stat. Data Anal. 2015, 81, 10–23. [Google Scholar] [CrossRef]
- Hair, J.; Hollingsworth, C.L.; Randolph, A.B.; Chong, A.Y.L. An updated and expanded assessment of PLS-SEM in information systems research. Ind. Manag. Data Syst. 2017, 117, 442–458. [Google Scholar] [CrossRef]
- He, Y.; Pan, H.; Wang, R.; Yao, C.; Cheng, J.; Zhang, T. Research on the cumulative effect of multiscale ecological compensation in river basins: A case study of the Minjiang River Basin, China. Ecol. Indic. 2023, 154, 110605. [Google Scholar] [CrossRef]
- Cui, X.; Liu, S.; Wei, X. Impacts of forest changes on hydrology: A case study of large watersheds in the upper reaches of Minjiang River watershed in China. Hydrol. Earth Syst. Sci. 2012, 16, 4279–4290. [Google Scholar] [CrossRef]
- Yao, C.; He, Y.M.; Cheng, J.X.; Zhang, T.Y.; Pan, H.Y.; Ma, H.J. Evaluation of ecological security pattern and optimization suggestions in Minjiang River Basin based on MCR model and gravity model. Acta Ecol. Sin. 2023, 43, 7083–7096. [Google Scholar] [CrossRef]
- Li, A.; Ran, M.; Song, L.; Xue, J.; Zhang, Y.; Li, C.; Deng, Q.; Fang, H.; Dai, T.; Li, Q. Spatial Distribution Characteristics and Influencing Factors of Cropland Topsoil Organic Carbon Content in the Sichuan Basin. Resour. Environ. Yangtze Basin 2023, 32, 1102–1112. [Google Scholar] [CrossRef]
- Aawar, T.; Khare, D. Assessment of climate change impacts on streamflow through hydrological model using SWAT model: A case study of Afghanistan. Model. Earth Syst. Environ. 2020, 6, 1427–1437. [Google Scholar] [CrossRef]
- Li, M.; Di, Z.; Duan, Q. Effect of sensitivity analysis on parameter optimization: Case study based on streamflow simulations using the SWAT model in China. J. Hydrol. 2021, 603, 126896. [Google Scholar] [CrossRef]
- Wang, Y.; Jiang, R.; Xie, J.; Zhao, Y.; Yan, D.; Yang, S. Soil and water assessment tool (SWAT) model: A systemic review. J. Coast. Res. 2019, 93, 22–30. [Google Scholar] [CrossRef]
- Arnold, J.G.; Moriasi, D.N.; Gassman, P.W.; Abbaspour, K.C.; White, M.J.; Srinivasan, R.; Santhi, C.; Harmel, R.D.; Van Griensven, A.; Van Liew, M.W.; et al. SWAT: Model use, calibration, and validation. Trans. ASABE 2012, 55, 1491–1508. [Google Scholar] [CrossRef]
- Hosseini, S.H.; Khaleghi, M.R. Application of SWAT model and SWAT-CUP software in simulation and analysis of sediment uncertainty in arid and semi-arid watersheds (case study: The Zoshk–Abardeh watershed). Model. Earth Syst. Environ. 2020, 6, 2003–2013. [Google Scholar] [CrossRef]
- Malik, M.A.; Dar, A.Q.; Jain, M.K. Modelling streamflow using the SWAT model and multi-site calibration utilizing SUFI-2 of SWAT-CUP model for high altitude catchments, NW Himalaya’s. Model. Earth Syst. Environ. 2022, 8, 1203–1213. [Google Scholar] [CrossRef]
- Gocic, M.; Trajkovic, S. Analysis of changes in meteorological variables using Mann-Kendall and Sen’s slope estimator statistical tests in Serbia. Glob. Planet. Chang. 2013, 100, 172–182. [Google Scholar] [CrossRef]
- Gao, J.; Bian, H.; Zhu, C.; Tang, S. The response of key ecosystem services to land use and climate change in Chongqing: Time, space, and altitude. J. Geogr. Sci. 2022, 32, 317–332. [Google Scholar] [CrossRef]
- Tonidandel, S.; LeBreton, J.M. Relative importance analysis: A useful supplement to regression analysis. J. Bus. Psychol. 2011, 26, 1–9. [Google Scholar] [CrossRef]
- Chin, W.W. The partial least squares approach to structural equation modeling. Mod. Methods Bus. Res. 1998, 295, 295–336. [Google Scholar]
- Hair, J.F.; Sarstedt, M.; Ringle, C.M.; Mena, J.A. An assessment of the use of partial least squares structural equation modeling in marketing research. J. Acad. Mark. Sci. 2012, 40, 414–433. [Google Scholar] [CrossRef]
- Sarstedt, M.; Ringle, C.M.; Hair, J.F. Partial least squares structural equation modeling. In Handbook of Market Research; Springer International Publishing: Cham, Switzerland, 2021; pp. 587–632. [Google Scholar]
- Wang, F.; Shao, W.; Yu, H.; Kan, G.; He, X.; Zhang, D.; Ren, M.; Wang, G. Re-evaluation of the power of the Mann-Kendall test for detecting monotonic trends in hydrometeorological time series. Front. Earth Sci. 2020, 8, 14. [Google Scholar] [CrossRef]
- Miao, C.; Wu, Y.; Fan, X.; Su, J. Projections of global land runoff changes and their uncertainty characteristics during the 21st century. Earth’s Future 2023, 11, e2022EF003286. [Google Scholar] [CrossRef]
- Bai, X.; Zhao, W. Impacts of climate change and anthropogenic stressors on runoff variations in major river basins in China since 1950. Sci. Total Environ. 2023, 898, 165349. [Google Scholar] [CrossRef] [PubMed]
- Yang, L.; Zhao, G.; Tian, P.; Mu, X.; Tian, X.; Feng, J.; Bai, Y. Runoff changes in the major river basins of China and their responses to potential driving forces. J. Hydrol. 2022, 607, 127536. [Google Scholar] [CrossRef]
- Wang, B.; Wang, H.; Jiao, X.; Huang, L.; Chen, H.; Guo, W. Runoff change in the Yellow River Basin of China from 1960 to 2020 and its driving factors. J. Arid. Land 2024, 16, 168–194. [Google Scholar] [CrossRef]
- Li, B.; Feng, Q.; Wang, Y. Historical and future runoff changes and their impacts on stormflow characteristics in the upper Yangtze River basin, China. Catena 2024, 235, 107684. [Google Scholar] [CrossRef]
- Yang, T.; Yang, X.; Jia, C. Detecting the main driving force of runoff change in the Beiluo River Basin, China. Environ. Sci. Pollut. Res. 2023, 30, 89823–89837. [Google Scholar] [CrossRef]
- Hu, G.R.; Li, X.Y.; Yang, X.F. The impact of micro-topography on the interplay of critical zone architecture and hydrological processes at the hillslope scale: Integrated geophysical and hydrological experiments on the Qinghai-Tibet Plateau. J. Hydrol. 2020, 583, 124618. [Google Scholar] [CrossRef]
- Yang, Z.H.A.N.G.; Yu, D.E.N.G.; Fu-quan, N.I.; Chao, N.I.E.; Jie, M.A. Spatial and Temporal Variation Characteritics of Blue and Green Water Resources in Min-Tou River Basin were Analyzed Based on SWAT Model. Chin. J. Agrometeorol. 2020, 41, 345–356. [Google Scholar] [CrossRef]
- Hu, J.; Ma, J.; Nie, C.; Xue, L.; Zhang, Y.; Ni, F.; Deng, Y.; Liu, J.; Zhou, D.; Li, L.; et al. Attribution Analysis of Runoff change in Min-tuo River Basin based on SWAT model simulations, China. Sci. Rep. 2020, 10, 2900. [Google Scholar] [CrossRef]
- Zhai, H.; Wang, M.; Shen, D.; Hu, B.; Li, Y. Analysis of runoff variation and driving factors in the Minjiang River Basin over the last 60 years. J. Water Clim. Chang. 2022, 13, 3675–3691. [Google Scholar] [CrossRef]
- Leonarduzzi, E.; Maxwell, R.M.; Mirus, B.B.; Molnar, P. Numerical analysis of the effect of subgrid variability in a physically based hydrological model on runoff, soil moisture, and slope stability. Water Resour. Res. 2021, 57, e2020WR027326. [Google Scholar] [CrossRef]
- Nagaveni, C.; Kumar, K.P.; Ravibabu, M.V. Evaluation of TanDEMx and SRTM DEM on watershed simulated runoff estimation. J. Earth Syst. Sci. 2019, 128, 2. [Google Scholar] [CrossRef]
- Mahato, S.; Pal, S.; Talukdar, S.; Saha, T.K.; Mandal, P. Field based index of flood vulnerability (IFV): A new validation technique for flood susceptible models. Geosci. Front. 2021, 12, 101175. [Google Scholar] [CrossRef]
- Zhang, Y.; Bi, Z.; Zhang, X.; Yu, Y. Influence of landscape pattern changes on runoff and sediment in the Dali River watershed on the Loess Plateau of China. Land 2019, 8, 180. [Google Scholar] [CrossRef]
- Jahanishakib, F.; Salmanmahiny, A.; Mirkarimi, S.H.; Poodat, F. Hydrological connectivity assessment of landscape ecological network to mitigate development impacts. J. Environ. Manag. 2021, 296, 113169. [Google Scholar] [CrossRef] [PubMed]
- Wu, L.; Zhang, M.; Xie, X.; Lv, J.; Zhou, X.; Shen, N. Effect of wetland hydrological connectivity on runoff based on a basin comparison. J. Hydrol. 2023, 619, 129348. [Google Scholar] [CrossRef]


| Data Types | Specific Figures | Data Sources | Data Description |
|---|---|---|---|
| Topographic data | Elevation maps, Slope maps, Topographic humidity index maps | Geospatial Data Cloud (http://www.gscloud.cn/, accessed on 7 July 2023) | 30 m, slope and Topographic Wetness Index were extracted from elevation |
| Land use data | 1990, 1995, 2005, 2015, and 2019 | Pixel Information Expert Engine, accessed on 10 July 2023 | 30 m |
| Soil data | Soil organic carbon content, organic matter content, clay content, sand content, and silt content data | Harmonized World Soil Database, accessed on 15 July 2023 | 1000 m |
| Climate data | / | National Meteorological Data Centre (http://data.cma.cn/, accessed on 17 July 2023) | Daily |
| Hydrological data | / | Sichuan Hydrological Statistical Yearbook (accessed on 18 July 2023) | Monthly runoff |
| Socio-economic data | Gross Domestic Product (GDP), population density | Centre for Resource and Environmental Sciences and Data, Chinese Academy of Sciences (https://www.resdc.cn/, accessed on 20 July 2023) | 1000 m, where the 1990 GDP is interpolated through the statistical yearbook |
| Latent Variables | Apparent Variables | Explanation |
|---|---|---|
| Natural factors | Relative elevation | T = Tmax − Tmin (Difference between the maximum and minimum elevation values within the hydrological response cell), Unit: m |
| Relative slope | S = Smax − Smin(Difference between the maximum and minimum slope values within the hydrological response cell), Unit:° | |
| Topographic Wetness index | TWI = ln(α/tanβ) Where: α represents the unit grid catchment area; β represents the slope | |
| Soil pH | Soil potential of hydrogen | |
| Clay contents | Percentage of clay in soil, Unit: % | |
| Sand contents | Percentage of sand in soil, Unit: % | |
| Silt contents | Percentage of silt in soil, Unit: % | |
| Soil organic matter | Carbon-containing organic compounds in soil, Unit: % | |
| Soil organic carbon | Humus formed through microbial action, Unit: % | |
| Climatic factors | Average annual precipitation | Multi-year average precipitation, 1 km resolution, Unit: mm |
| Average annual temperature | Multi-year average temperature, 1 km resolution, Unit: °C | |
| Average annual evaporation | Multi-year average evaporation, 1 km resolution, Unit: mm | |
| Socio-economic factors | Gross Domestic Product (GDP) | Based on spatialisation of national sub-county GDP statistics, Unit: millions of yuan. |
| Population density | Based on spatialisation of national sub-county demographics, Unit: persons. | |
| Landscape factors | Landscape change | Raster values with no landscape change were recorded as 0 and those with landscape change were recorded as 1. The number of rasters with landscape change was counted as a proportion of each hydrological response cell. |
| Landscape connectivity | Landscape connectivity indicators were constructed based on the relative importance of each of these indicators: Connectivity = α1AREA_MN + α2COHESION + α3PLADJ + α4AI + α5LPI Where: Connectivity represents landscape connectivity, and α1 − α5 represent the relative importance share of each metric, respectively. | |
| Landscape fragmentation | A landscape fragmentation index was constructed based on the relative importance of each of the above indicators: Fragmentation = β1DIVISION + β2SHDI + β3SPLIT Where: Fragmentation represents the degree of landscape fragmentation, and β1-β3 represent the relative importance of each indicator. |
| Parameters | t-Stat | p-Value | Parameter Optimum | Sensitivity | Connotation |
|---|---|---|---|---|---|
| v__SFTMP.bsn | 0.04 | 0.97 | 4.16 | NO | Snowfall temperature/°C |
| v__SMTMP.bsn | −0.44 | 0.66 | −7.72 | NO | Base temperature for snowmelt/°C |
| v__SMFMX.bsn | 0.17 | 0.87 | −1.62 | NO | Snowmelt factor on 21 June (mm/(°C·day)) |
| v__TIMP.bsn | 0.25 | 0.80 | 0.23 | NO | Snow temperature lag factor |
| v__SURLAG.bsn | −1.30 | 0.20 | 20.16 | YES | Surface runoff hysteresis factor |
| v__TLAPS.sub | 0.58 | 0.57 | 10.74 | NO | direct temperature decrease (°C/km) |
| v__SLSUBBSN.hru | −2.76 | 0.01 | 43.67 | YES | Average slope length (m) |
| v__HRU_SLP.hru | −0.24 | 0.81 | 1.49 | NO | Average specific gravity (m/m) |
| v__CANMX.hru | −0.65 | 0.52 | 73.21 | NO | Maximum canopy retention (mm) |
| v__ESCO.hru | −0.40 | 0.69 | 0.43 | NO | Soil evaporation compensation factor |
| v__EPCO.hru | 1.16 | 0.24 | 1.14 | YES | Plant uptake compensation factor |
| v__OV_N.hru | 1.41 | 0.16 | 0.12 | YES | Values of Manning’s coefficient n for diffuse flow on slopes |
| r__CN2.mgt | 5.95 | 0.00 | 0.45 | YES | Initial SCS runoff curve number for moisture condition II |
| r__BIOMIX.mgt | 1.20 | 0.23 | −0.80 | YES | Biomixing efficiency |
| v__CH_COV1.rte | −0.11 | 0.91 | 0.32 | NO | Channel erosion factor |
| v__CH_COV2.rte | 0.43 | 0.67 | 0.99 | NO | Stream cover factor |
| v__GW_DELAY.gw | −1.42 | 0.16 | −428.75 | YES | Time delay in groundwater (day) |
| v__ALPHA_BF.gw | 0.64 | 0.52 | 0.66 | NO | Baseflow α factor (day) |
| v__GWQMN.gw | 7.94 | 0.00 | 2260.49 | YES | Water level threshold of the shallow aquifer required for return flow to occur (mm) |
| v__GW_REVAP.gw | 2.12 | 0.03 | 0.13 | YES | Groundwater revap coefficients |
| v__REVAPMN.gw | 0.80 | 0.42 | 522.34 | NO | Water level threshold of the shallow aquifer required for revap or infiltration into the deep aquifer to occur (mm) |
| v__RCHRG_DP.gw | 6058 | 0.00 | 0.23 | YES | Permeability coefficient of deep aquifers |
| a__SOL_AWC.sol | −1.33 | 0.18 | 0.11 | YES | Effective water content of the soil layer (mm/mm) |
| Slope | Z_Value | Trends in Runoff | Area/km2 | Proportion of Study Area/% |
|---|---|---|---|---|
| Slope > 0 | |Z| > 1.96 | Significant increase | 52.25 | 0.96 |
| Slope > 0 | |Z| < 1.96 | No significant increase | 3440.44 | 63.01 |
| Slope < 0 | |Z| < 1.96 | No significant decrease | 1917.2 | 35.11 |
| Slope < 0 | |Z| > 1.96 | Significant decrease | 50.02 | 0.92 |
| Latent Variable | AVE | CR | DG.rho | Loading | t-Test | Observed Variable | Test Results |
|---|---|---|---|---|---|---|---|
| Natural factors | 0.619 | 0.882 | 0.887 | 0.859 | 2.604 | Relative elevation | accept |
| 0.927 | 2.565 | Relative slope | accept | ||||
| 0.863 | 2.546 | Topographic humidity index | accept | ||||
| 0.148 | 1.329 | Soil PH | reject | ||||
| 0.045 | 0.434 | Clay contents | reject | ||||
| 0.695 | 2.498 | Sand contents | accept | ||||
| 0.703 | 2.478 | Silt contents | accept | ||||
| 0.369 | 2.060 | Organic matter contents | reject | ||||
| 0.029 | 0.435 | Organic carbon contents | reject | ||||
| Climatic factors | 0.618 | 0.841 | 0.813 | 0.855 | 2.214 | Average annual precipitation | accept |
| 0.644 | 2.357 | Average annual temperature | accept | ||||
| 0.960 | 2.316 | Average annual evaporation | accept | ||||
| Socio-economic factors | 0.696 | 0.976 | 0.984 | 0.982 | 91.722 | GDP | accept |
| 0.985 | 135.008 | Population density | accept | ||||
| Landscape factors | 0.968 | 0.671 | 0.827 | 0.912 | 20.478 | Landscape change | accept |
| 0.748 | 6.471 | Landscape connectivity | accept | ||||
| 0.277 | 2.392 | Landscape fragmentation | reject | ||||
| Runoff | 1.000 | 1.000 | 1.000 | 1.000 | Runoff | accept |
| Direct Paths | Path Coefficient | T-Value | p-Value | Test Results |
|---|---|---|---|---|
| Socio-economic—>Runoff | −0.210 | 4.251 | 0.000 | significant |
| Socio-economic—>Landscape | 0.446 | 8.223 | 0.000 | significant |
| Socio-economic—>Climate | 0.219 | 2.018 | 0.044 | significant |
| Landscape—>Runoff | −0.131 | 2.164 | 0.030 | significant |
| Climate—>Runoff | −0.102 | 1.266 | 0.205 | insignificant |
| Climate—>Landscape | 0.004 | 0.042 | 0.966 | insignificant |
| Nature—>Socio-economic | −0.268 | 1.734 | 0.083 | insignificant |
| Nature—>Runoff | 0.367 | 2.901 | 0.037 | significant |
| Nature—>Landscape | 0.075 | 0.879 | 0.879 | insignificant |
| Nature—>Climate | −0.620 | 2.200 | 0.028 | significant |
Disclaimer/Publisher’s Note: The statements, opinions and data contained in all publications are solely those of the individual author(s) and contributor(s) and not of MDPI and/or the editor(s). MDPI and/or the editor(s) disclaim responsibility for any injury to people or property resulting from any ideas, methods, instructions or products referred to in the content. |
© 2024 by the authors. Licensee MDPI, Basel, Switzerland. This article is an open access article distributed under the terms and conditions of the Creative Commons Attribution (CC BY) license (https://creativecommons.org/licenses/by/4.0/).
Share and Cite
Liu, J.; Yan, K.; Liu, Q.; Lin, L.; Peng, P. Analysis of Runoff Changes and Their Driving Forces in the Minjiang River Basin (Chengdu Section) in the Last 30 Years. Hydrology 2024, 11, 123. https://doi.org/10.3390/hydrology11080123
Liu J, Yan K, Liu Q, Lin L, Peng P. Analysis of Runoff Changes and Their Driving Forces in the Minjiang River Basin (Chengdu Section) in the Last 30 Years. Hydrology. 2024; 11(8):123. https://doi.org/10.3390/hydrology11080123
Chicago/Turabian StyleLiu, Jingjing, Kun Yan, Qin Liu, Liyang Lin, and Peihao Peng. 2024. "Analysis of Runoff Changes and Their Driving Forces in the Minjiang River Basin (Chengdu Section) in the Last 30 Years" Hydrology 11, no. 8: 123. https://doi.org/10.3390/hydrology11080123
APA StyleLiu, J., Yan, K., Liu, Q., Lin, L., & Peng, P. (2024). Analysis of Runoff Changes and Their Driving Forces in the Minjiang River Basin (Chengdu Section) in the Last 30 Years. Hydrology, 11(8), 123. https://doi.org/10.3390/hydrology11080123


