Abstract
This paper discusses the groundwater vulnerability to pollution assessment for the Tirana–Ishmi alluvium aquifer, Albania. Economic activities, municipal wastewater discharged into rivers and groundwater overexploitation threaten to pollute the groundwater. Based on the aquifer characteristics and the available data, SINTACS was selected as the most realistic assessment model. The SINTACS parameters’ rates assigned to the aquifer’s characteristics (water table depth, infiltration, unsaturated zone, soil media, aquifer media, hydraulic conductivity, topography) were adapted to the local features, followed by GIS vulnerability mapping. Statistical analysis indicates that the unsaturated zone, hydraulic conductivity and aquifer media have the highest influence on groundwater vulnerability, whereas topography has the lowest influence. Validation through sensitivity analysis and nitrates content confirms the rational selection of the SINTACS model and the reliability of the study’s outputs. The most vulnerable areas to pollution are the recharge zones, followed by the highly urbanized Tirana City area, characterized by high levels of groundwater extraction rate and wastewater discharged into the rivers. The paper, being the first completed groundwater vulnerability assessment of the study area, could serve as a basis for a scientific–based groundwater management that should be considered in local territory planning.
1. Introduction
The present paper discusses the groundwater vulnerability (GWV) assessment of the Tirana–Ishmi aquifer, in Albania, and the related mapping using a Geographical Information System (GIS). The concept of aquifer vulnerability expresses the aquifer’s susceptibility to be affected by contaminant substances from the land surface [1,2,3]. This susceptibility is defined in the context of the standard hazard–pathway–receptor model [4,5]. The vulnerability is a relative, non–measurable and dimensionless aquifer attribute indicating the aquifer’s sections where contamination is most likely to occur [6,7]. The GWV can be intrinsic or specific. The intrinsic vulnerability depends on the hydrogeological characteristics of an aquifer, while the specific vulnerability is based on the risk of the contamination generated by anthropogenic activities [7]. Based on the concept of GWV and the hydrogeological factors influencing it, the first vulnerability maps were prepared at the end of the 1960s in countries such as the USA, Czechoslovakia, etc. [8], and in 1970 in France [9]. Aiming at groundwater protection and its optimal usage, the hydrogeologists’ efforts worldwide were focused on the detailed study of GWV and its influencing factors [10], as well as in the preparation of GWV maps, which should be taken into account by decision makers for the groundwater’s protection from pollution and territory planning [11,12].
Based on the characteristics of the study area and the available data and information, the intrinsic vulnerability is the appropriate choice for assessing the GWV of the Tirana-Ishmi aquifer. Amongst numerous intrinsic methods [13], SINTACS [14,15,16] was selected as the most realistic one for the purposes of this study. The parameters taken into consideration by SINTACS are water table depth, infiltration, unsaturated zone, soil media, aquifer media, hydraulic conductivity and terrain slope. The assigned rates to these parameters were adapted to local features.
The GWV was mapped using a GIS [16,17]. The used data were submitted to a statistical analysis [18], which indicates that the unsaturated zone, hydraulic conductivity and aquifer media have the highest influence on the GWV, whereas the topography has the lowest influence. Validation through sensitivity analysis (SA) [19] and nitrates content [20] confirmed the rational selection of the used GWV assessment method and the reliability of the study’s outputs and outcomes. The vulnerability map, which is the main output of this study, indicates that the areas most vulnerable to pollution are the recharge zones, followed by the highly urbanized Tirana City area, characterized by high levels of both groundwater extraction rate and wastewater discharged into the rivers.
The study area is located in Middle Albania [21]. It represents a flat alluvial valley bordered by an open flat terrain northwestward and by molassic hills from the other sides (Figure 1) [21,22]. The aquifer is composed of Quaternary alluvial deposits that outcrop only in the rivers’ beds in the eastern edge of the study area [21,23,24]. The area is home to nearly 650,000 inhabitants, who use the groundwater for drinking, domestic, industrial and irrigation purposes. The local population in the southern part of the area has significantly grown in the last 30 years due to uncontrolled demographic movements. At the same time, the extracted groundwater amount in this area has substantially intensified. [25]. Municipal wastewater is discharged into the middle and lower course of the local rivers [25,26]. An exception is made for some villages in the central and northern part of the lowland, whose sewage is discharged into private septic holes or tanks. As of the time of preparation of this paper, there is no wastewater treatment plant (WWTP) in the study area [25], although the construction of a WWTP for Tirana City is already planned [27]. The wastewater flowing into the rivers poses a threat to the population’s health, due to the risk of groundwater pollution [28,29,30], which is associated with the hydrogeological and hydrological features of the study area, as well as with the location and characteristics of the groundwater pollution sources.
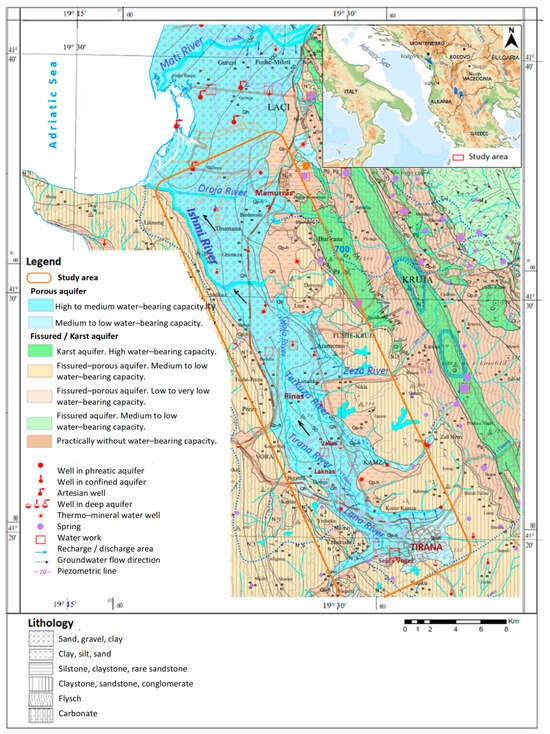
Figure 1.
Hydrogeological map of the study area (according to the hydrogeological map of Albania, 1:200,000).
The GWV assessment in Albania has been subject to four scientific papers, three of which discuss the GWV in other regions of the country [31,32,33], while the fourth paper aims rather to show how to use GIS technology for groundwater protection from pollution [33]. None of these papers use either a statistical analysis or a validation of the GWV assessment. The fourth paper [34], whose study area includes the Tirana–Ishmi aquifer, has limitations regarding the GWV assessment as it does not provide the hydrogeological settings, does not indicate the potential sources of groundwater pollution, does not present the map of each DRASTIC parameter, does not validate the used assessment, etc. Therefore, the present article can be considered as the first completed scientific paper attempting to integrally assess the vulnerability of the Tirana–Ishmi aquifer.
Based on the reliability of its outputs and expected outcomes, this article could serve as a reliable basis for preparing a scientific–based management plan of the aquifer and for inclusion of the GWV assessment in the development plans of the study area [16,17]. The absence of a GWV discussion and elaboration in the recent “Management plan of the Ishmi River basin for the period 2024–2029” [25], approved by the Albanian government [35], indicates that the decision makers are not yet aware either of the importance of GWV in the river basins’ management plans and other spatial development plans, or of a closer involvement of hydrogeology experts in the preparation of these plans.
2. Study Area
2.1. General Features
The Tirana–Ishmi aquifer lies in a flat valley oriented in the SE–NW direction (Figure 1). Its surface area is roughly 190 km2 and the length is about 37 km, while the width varies roughly from 3 km to 10 km [36]. The approximate altitude above the sea level (a.s.l) is 100 m in the south, 30 m in the center and 2.0 m in the north. The altitude decreases from east to west, by roughly 50 m a.s.l. in the south, 20 m a.s.l. in the center and 11–12 m a.s.l. in the north. The height of the hilly ranges surrounding the study area varies from 310 to 390 m a.s.l. Eastward of the hills that border the study area from the east lies the Kruje–Dajti carbonate mountain range, whose maximum height is 1613 m a.s.l. [22,36]. The small rivers of Lana, Tirana, Terkuza, Zeza and Droja, all of which originate at the Kruje–Dajti mountain range, traverse the study area and form the Ishmi River, which is a typical lowlands river. There are no water springs in the study area. The closest springs are located in the Kruje–Dajti karst massif [21,23,24,37,38]. Soft and wet winters and hot and dry summers characterize the climate in the study area [39]. The annual average, the minimum absolute and maximum absolute temperatures are 15.0 °C, −12.9 °C and 41.5 °C, respectively. The annual average rainfall is roughly 1250 mm/year [39,40,41].
The main urban centers in the study area include Tirana City and the Kamza, Fushe Kruje and Mamurras towns (Figure 1). A considerable number of population live in agricultural areas. The population of Tirana and Kamza in the last 30 years has drastically grown due to uncontrolled population movements. The population in the southern half of the study area is about 600,000 inhabitants [25]. The industrial facilities are mainly located in the southwest of the area. They comprise car reparation units, facilities for the assemblage of laundry and dishwasher detergents, facilities for the production of alcoholic and non-alcoholic beverages, wood, milk, cereals and meat processing plants, etc. The wastewater of these facilities is discharged into the Lana and Tirana Rivers [25]. The sewage flows into the same sewers as rain and then drains into the nearby rivers by gravity, thanks to the favorable terrain slope [25]. The sewerage flows into the middle and lower course of the closest rivers. Currently, the urban wastewater of the Tirana–Kamza area flows into the Lana and Tirana Rivers, that of Fushe Kruje flows into the Zeza River and that of Mamurras into the Droja River [25,42]. The urban solid waste of Tirana City and its neighboring area is disposed of into a landfill and does not pollute either the surface waters or the groundwater. The use of fertilizers in agriculture over the last 30 years is almost absent.
The extracted groundwater amount from hydrogeological wells is about 970–1000 L/s for drinking purposes, 200–300 L/s for technological purposes and about 100–200 L/s for irrigation. The amount extracted from private wells is not known. The total amount varies from 1270 to 1500 L/s [25]. The annual groundwater utilization rate in the southern part of the study area varies from 0.85 to 0.95 [43]. The aquifer supplies drinking water to almost all the villages of the study area and a part of Tirana City. The wells in the territory of this city supply roughly 300–490 L/s [25]. The remaining water amounts needed for Tirana are supplied by other sources located outside the study area [43].
2.2. Geological Settings
The study area is located in the Tirana–Ishmi syncline [23,24,44]. The hills surrounding the study area from the east, west and south consist of Upper Miocene molasses composed of Serravalian (), Tortonian () and Messinian () age deposits (Figure 2) [22] represented by intercalations of coarse-grain sandstone layers with siltstone and clay layers [22,45,46]. The upper geological section of the area consists of prolluvial (Qp–h) and alluvial (Qh) Quaternary deposits. The thickness of the prolluvial deposits varies from 3.0 m to 8.0 m [47]. They are mainly composed of gravel, sand and siltstone originating from the erosion of the hilly slopes and river and stream beds. They extend mainly to the east and south of the study area. In the western part of the area, they form a narrow strip along the foothills. [22] (Figure 2). The alluvial deposits (Qh), which cover the central and western parts of the study area, are represented by the terraces of the rivers that cross the area. The alluvial deposits are composed of gravels, sands and clays [21,45].
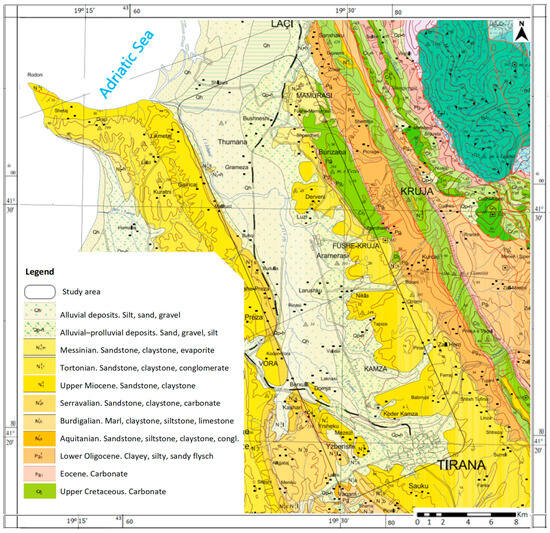
Figure 2.
Geological map of the study area (according to geological map of Albania, 1:200,000).
The thickness of the alluvial deposits increases from south to north and from east to west. In the south to north direction, this thickness varies from nearly 5 m in Tirana City to 100–120 m in the northwestern edge of the study area (Figure 3). Meanwhile, in the east to west direction, in the Fushe Kruje–Mamurras sector, this thickness varies from 20 m in the east to 100–120 m in the west [47].
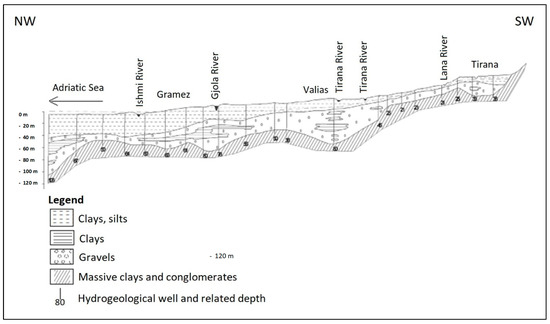
Figure 3.
Schematic hydrogeological longitudinal cross-section of the Tirana–Ishmi aquifer.
2.3. Hydrogeological Settings
Several scientific papers describe in detail the hydrogeological features of the aquifer under study [48,49,50,51,52,53,54,55,56,57,58], which consists of a single gravelly layer, with the exception of some sectors where the gravels form two or more layers separated by clayey lentils (Figure 3) [54,55]. Based on the lithological data from 35 wells [50,54,57,58], we applied Groundwater Modeling System (GMS) software [59] to create a 3D model of the aquifer (Figure 4). The gravelly layers have good hydraulic connections between them. Their thickness increases from south to north. In the west of Tirana City, this thickness is about 5 m, while in the north of the aquifer, it reaches 60–70 m. The only exception consists of a limited area in the southwest of Tirana, where the thickness of the water–bearing gravels reaches 31 m. The gravelly aquifer is overlaid by a clayey layer, the thickness of which increases from 2–3 m in the south to 20 m to 30 m in the north of the study area [54]. The gravelly deposits outcrop on the surface only in the recharge zones, which are located in the eastern part of the aquifer [49,54,56,58] (Figure 4). The aquifer is unconfined in the southern sector (Tirana City and its neighboring area) and confined in the central and northern sectors. In the northwest of the study area, the water wells are artesian. In the sectors where the aquifer is unconfined (or phreatic), it is recharged by the infiltration of atmospheric precipitation and the Lana, Tirana, Terkuza, Zeza and Droja Rivers. The possibility of the aquifer’s recharging from the underlying mollassic deposits is not excluded. Although these deposits have a low water–bearing capacity, their water could drain through sandstone fractures due to high pressure [57]. The main groundwater flow direction in the aquifer is southeast–northwest [21], with a hydraulic slope gradient of I = 0.007–0.009 [57].
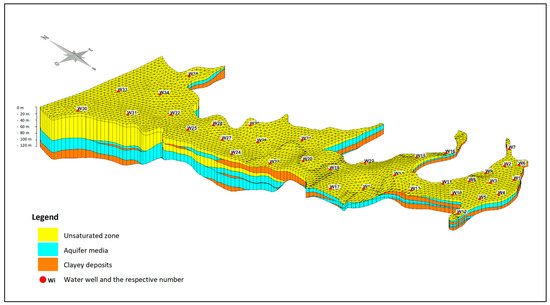
Figure 4.
A 3D model of the aquifer.
Information on the aquifer’s hydraulic properties is based on the Albanian Geological Survey (AGS) studies and other scientific papers [50,57,58], which are all based on the 130 wells’ pumping data collected by the AGS during the period 1964–2011 [57,58]. The hydraulic conductivity in the recharge zones of the Tirana and Terkuza Rivers varies from 180 to 300 m/day [57,58]. Similarly, the recharge zones of the Zeza and Droja Rivers have a high hydraulic conductivity, too [60]. In the southwestern edge of Tirana City (Selita Vogel) and in the other main wellfields (Laknas–Berxulle, Rinas–Valias and Larushk–Fushe Kruje), located in the center of the study area, the hydraulic conductivity varies from 100 to 300 m/day. Around these wellfields, the hydraulic conductivity varies from 50 to 90 m/day, whereas in the other parts of the aquifer, it is lower than 50 m/day [57,58]. The average specific discharge within these wellfields varies from 10 to 15 L/s/m, while the maximum specific discharge in some wells varies from 20 to 30 L/s/m [58].
The groundwater extraction impact on the water level is evaluated by comparing the data obtained from the annual and monthly water level variation in three monitoring wells, located in areas of intensive groundwater extraction [61,62,63]. This monitoring shows that the largest variations were recorded in the areas of intensive groundwater extraction, such as in the Mezez–Laknas and Fushe Kruje–Gjola River bridge sectors (Figure 1), where the water table varies from 2.05 m to 8.07 m and from 2.15 m to 12.2 m, respectively [63]. There is no monitoring well in the recharge zones.
The natural flow from the rivers is roughly 610 L/s, while the contribution of both the net recharge and the molassic deposits is roughly 100 L/s [63]. The total inflow (710 L/s) is lower than the total outflow, which varies from 1270 to 1500 L/s [25]. The increase in the groundwater outflow compared to the natural inflow occurs thanks to induced filtration due to the groundwater recharging directly from the rivers and the lowering of the dynamic groundwater level.
The groundwater of the Tirana–Ishmi aquifer has good physical–chemical properties, which are monitored in 14 wells. It is of a calcium hydrocarbonate type. The Total Hardness (TH) varies from 20 to 26 German degrees and the Total Dissolved Solids (TDS) from 650 to 900 mg/L [55,64,65].
3. Methodology
3.1. Selection of Appropriate Groundwater Vulnerability Assessment Method
The GWV studies are continuously refined to consider the impacts of a growing population, including increased economic activities, which lead to an increase in the extracted groundwater amount and a threat to groundwater quality due to pollution [28] and overexploitation [43,66]. The selection process of the GWV assessment methods and their performance evaluation should avoid contrasting findings [67]. This imposes a clear understanding of the GWV notion and assessment methods and of the local factors. Moraru and Hannigan [68] think that the most appropriate definition of GWV is provided by Zaporozec, who defines it as ‘‘an intrinsic property of a groundwater system that depends on the sensitivity of the system to human and/or natural impacts’’. As such, GWV can be ‘‘intrinsic or natural’’ or ‘‘specific or integrated” [2]. Intrinsic vulnerability is a function of hydrogeological factors, while specific vulnerability concerns mostly the risk of the aquifer’s contamination [11,69,70]. Civita stresses that the specific vulnerability depends on the physical–chemical characteristics, rate of occurrence and spatial distribution of contaminants [71]. Due to a lack of available data, it is impossible to assess the specific vulnerability of the Tirana–Ishmi aquifer. Thus, the intrinsic GWV is the most appropriate for the purposes of the present study. Given that there are numerous intrinsic vulnerability methods [13], we made efforts to select the most feasible of them based on the available data and information about the study area. Civita and De Maio selected more than 20 main intrinsic vulnerability methods [14,15,16,71], which are included in two main classes in terms of their use: use for any physiographic scenario or for any particular area [14,16]. These classes are subdivided into three basic groups [14,16,71,72], as follows:
- Hydrogeologic Complex and Setting assessment—HCS;
- Parametric System assessment: Matrix Systems (MSs); Rating Systems (RSs); and Point Count System Models (PCSMs);
- Analogical Relation (AR) and numerical model assessment.
Zaporozec and Vrba summarized the main worldwide research on GWV and classified vulnerability maps in terms of their purpose and content, scale and graphic representation [73]. The choice of the most appropriate GWV assessment model and mapping technique should be based on a realistic evaluation of the quantity, distribution and reliability of the available data and information [13,71]. This choice depends on the correlation between three main factors: the density of the monitoring points, the available information for each point and the map’s scale. HCS methods and small-scale maps are used when the specific basic information is inadequate and/or scarce and scattered throughout the area under study. Parametric System assessment and medium-scale maps are used when there is a moderate monitoring point density, with a satisfying spatial distribution and information, while large-scale maps are prepared when the available information per unit area is sufficient [16,71]. AR and numerical model assessment take into consideration only a part of the features of the area to be assessed. The AR methods proposed by Zampetti [74] and Fried [75] take into consideration only the unsaturated zone and water table depth, to which Marcolongo and Pretto [76] added the net recharge and the effective soil moisture. As the data reliability in an area can widely vary with the mean elevation a.s.l., simple methods such as HCS and MS should be used for mapping the vulnerability of hilly and mountainous areas. By contrast, the parametric RS and PCSM methods are mostly recommended for flat and foothill areas, when the amount and reliability of data, measurements, tests and analyses can be considered to be sufficient for the required mapping scale [16,71]. The parametric methods are an extension of the HCS methods, as they use a rating or a numerical score for each hydrogeological parameter included and judged necessary and adequate for assessing GWV. In addition to the rating score, the PCSM methods assign an importance weight to each considered parameter, in order to reflect the relationships between the different parameters, as well as their relevance in the vulnerability assessment. PCSM methods can be easily implemented, modified, updated and used for large areas [69].
Based on the above and the available data and information on the Tirana–Ishmi aquifer, the PCSM methods’ results are the most suitable for the assessment of this aquifer. Civita and De Maio [16,71] distinguish four main PCSM methods; DRASTIC (Aller and Thornhill, 1987) [77], Trojan and Perry (1988) [78], ISIS (Civita and De Regibus, 1995) [79] and SINTACS (Civita, 1990 [80] and 1994 [14]; and Civita and De Maio, 1997 [15]). The Trojan and Perry method is used mostly for areas of large extensiveness [78]. The ISIS method is applied in both porous and karst aquifer systems [79]. The Trojan and Perry and ISIS methods do not take into account the aquifer’s hydraulic conductivity [13,16]. Amongst the four main PCSM methods, the most used worldwide are DRASTIC and SINTACS, which take into consideration more parameters than the other ones. Although DRASTIC remains the most popular [69,81], the ratings and weights of the factors taken into consideration by this method need to be adapted to the local features [69,82,83]. Although both the DRASTIC and SINTACS models use the same parameters, the rating and weighting of the SINTACS procedure is more flexible to specific features of a study area [8,69,84,85]. Gogu and Dassargues prefer the methods resulting in a more contrasted sensitivity for a specific area, because their results can be used and interpreted better [86]. This preference can be satisfied using SINTACS, which allows one to assign different weighting rates to different zones of the same aquifer in terms of the local features. Similarly to other PCSM methods, the results of SINTACS can be influenced by subjectivity in the weighting rate assignment [69]. However, this subjectivity can be reduced through the statistical analysis and validation of the used method [87,88]. SINTACS was created, elaborated and continuously improved by Italian researchers [14,15,16,17,71,80]. It is a development of the DRASTIC model adapted to the geological, hydrogeological, soil and climatic conditions that are typical to Italy and therefore to other Mediterranean countries, including Albania, whose natural features are more or less comparable to those of Italy. Based on the characteristics of the study area, the available data and information and the appropriate scale of the vulnerability map and its purpose, as well as on the characteristics of SINTACS model [6,89], SINTACS stands out as the most appropriate method for assessing the vulnerability of the Tirana–Ishmi aquifer. Furthermore, as the study area is a flat alluvial plain [21,22], the reliability of the vulnerability assessment using SINTACS should be high [14,15,16,90]. The map’s scale, 1:50,000, is preferred for the purposes of the present study. The use of a GIS for mapping the aquifer’s vulnerability allows for the continuous update and improvement of the vulnerability assessment whenever the data and information are updated and/or completed.
3.2. SINTACS Method
The acronym SINTACS derives from the first letters of the Italian names of the seven parameters taken into account by the SINTACS method [14,15,91], as follows:
- Soggiaceza—water table depth;
- Infiltrazione efficace—net recharge;
- Non saturo—unsaturated zone;
- Tipologia della copertura—soil media;
- Acquifero—aquifer media;
- Conducibilita idraulica—hydraulic conductivity;
- Superficie topografica—topographic slope.
Each parameter is assigned a range of values divided into discrete intervals from 1 to 10. Each interval is given a rate which reflects the relative vulnerability degree. Each parameter is multiplied by a weighting coefficient, which expresses the relationships amongst the parameters and their relevance to the GWV assessment. The rate given to each interval is multiplied by the weighting string of each parameter, and the products are summed, thus giving the vulnerability index (VI), as provided by Formula (1).
where Pi—parameter’s value and Wi—relative weight of the selected weighting strings. Based on the vulnerability index, the study area is split into polygons. The interval of the vulnerability index values for each polygon ranges from 26 to 260 [15]. The higher the vulnerability index, the more sensitive to pollution is the groundwater system.
The SINTACS model uses five weighting strings which correspond to normal impact, high impact, with drainage, karst and fissured rocks [15]. Based on the geological and hydrogeological settings of the study area, and on its socio–economic aspects, the most suitable weighting string corresponds to normal impact. Table 1 provides the theoretical weighs for normal impact, in accordance with the provisions of the SINTACS method [92].

Table 1.
SINTACS parameters’ theoretical weights for normal impact.
The vulnerability degree is divided into classes in terms of the vulnerability index, as provided in Table 2 [92].

Table 2.
Groundwater vulnerability (GWV) classes in terms of the vulnerability index.
3.3. Tools for Aquifer’s Vulnerability Mapping
Each SINTACS parameter map and the GWV map were prepared through ArcGIS software [93], while the aquifer 3D model was created based on the interpolation of 35 water wells’ data, using the Groundwater Modeling System (GMS), version 10.7 [59].
3.4. Validation
The validation of both the selected vulnerability model and the prepared vulnerability map serves to avoid any eventual subjectivity that may lead to an inaccurate assessment [86]. The validation was performed through a sensitivity analysis (SA), which expresses the effect of change in one factor on another one. SA influences the model formulation, calibration and verification [19], and helps to analyze the interaction between parameters, their appropriate range and spatial variability, and to identify the parameters having the highest impact on the model response and outputs, which in turn influence the model outcomes [94].
3.4.1. Sensitivity Analysis
The selected SA approach includes the map removal SA and the single-parameter SA [87,88,95,96,97]. The map removal SA expresses the effect of each parameter’s map on the vulnerability index [87]. Formula (2) provides the SA in terms of the variation index Si.
where Vi is the total vulnerability index for N = 7 layers, while Vpi is the vulnerability index corresponding to n = 6 layers after the removal of the parameter p map.
The single-parameter SA helps to compare the effective weights for each parameter to their theoretical weights [88] provided by the SINTACS method. Formula (3) calculates the effective weight for each polygon of the vulnerability map.
where Pri and Pwi are, respectively, the rates and the weight of the layer P of the polygon i, while VI is the vulnerability index of the polygon i.
3.4.2. Validation Using the Nitrates Content in Groundwater
The accuracy of the selected vulnerability assessment method was validated using nitrates content (NO3 in mg/L), which is an anthropogenic pollution indicator. The NO3 concentration in groundwater is largely used and recommended worldwide for validating vulnerability assessment methods [84,97,98,99]. The nitrates content in the groundwater comes from different contaminants [100], including fertilizers and the municipal wastewater that flows into the local rivers and constitutes the main source of groundwater pollution in the study area [101,102,103]. The data on NO3 were taken from the State of Environment Report (SoER), which is annually published by the National Environment Agency (NEA) [104]. The monitoring period extents from 2015 to 2022.
4. Results and Discussion
4.1. Parameters Maps
The seven SINTACS parameters [92] were discussed and mapped based on the available data and information.
Parameter “S”: the water table depth. The water table depth is in inverse proportion to the natural vulnerability. The assigned SINTACS rates to this parameter decrease with the increase in the water table depth, following a hyperbolic curve. The assigned range varies from 10 to 1. The rate 10 is assigned to the recharge zones, and when the water table is on the ground surface. SINTACS rates should be corrected for confined aquifers, especially for artesian ones [92]. The data on water levels in the wells are collected from hydrogeological monitoring projects carried out by the AGS during the 2015–2022 period [104] and from the hydrogeological map [21], as well as from several published studies [49,50,53,54,55].
In the Tirana City area and the terraces of the Tirana, Terkuza, Zeza and Droja Rivers, the aquifer is unconfined (or phreatic). The water wells document that the cover layer thickness in these sectors varies from 0.3 m to 5m, with the exception of the river beds, where the cover layer is nonexistent. The water table depth varies from zero to 5.0 m from the ground surface and is subject to seasonal precipitation [49,53,54]. The SINTACS rate assigned to parameter “S” in these sectors is 9 [92] (Table 3). In the Laknas–Berxulle area that lies north of Tirana City, the aquifer was confined until about 20 years ago [49,50,53], but nowadays it has changed to unconfined due to overexploitation [23,104]. As the water table depth in this area varies from 5 m to 10 m, the assigned SINTACS rate is 7 [92]. In the southern edge of Tirana and in the sector extending from the central part of the study area towards its NW, the aquifer is confined. According to Civita, when an aquifer is confined, the water table depth is considered equal to the cover layer’s thickness [92]. In the SINTACS range assessment, the assigned rates corresponding to cover layer thicknesses of 10–20 m, 20–30 m and greater than 30 m are 4, 2.5 and 2–1, respectively (Table 3). For water table thicknesses greater than 30 m, the assigned rate is 1.

Table 3.
Intervals of groundwater depth and SINTACS rating evaluation.
Table 3 provides the depth intervals and the evaluation of the “S” parameter, based on the water level depth analysis.
The water table depth parameter map (Figure 5) shows that roughly up to 65% of the study area’s surface is assigned the lowest rates (1, 2 and 4) and up to 25%, rate 7, whereas the remaining 10% earns the highest rate (9). The lowest rate belongs to the confined parts of the aquifer, where the piezometric surface is close to the ground surface, whereas the highest rate is associated with the recharge zones located in the rivers’ terraces.
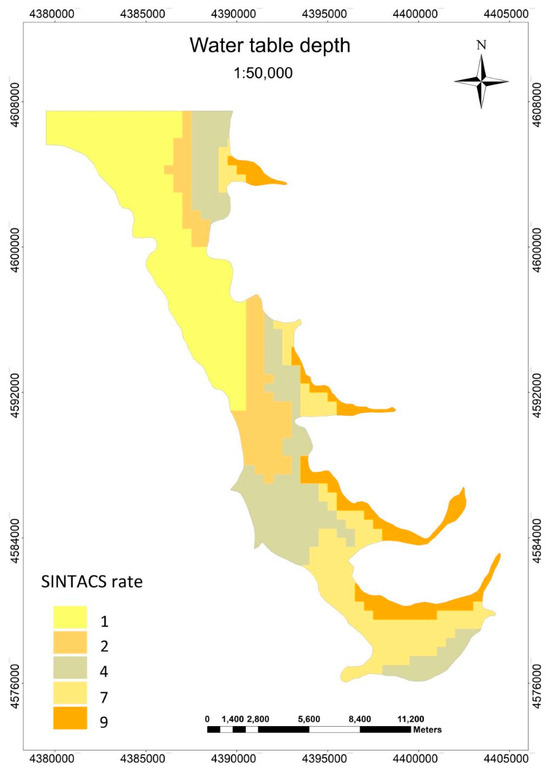
Figure 5.
Map of the water table depth parameter.
Parameter “I”: the net recharge. Precipitation is the main aquifer recharge source. Basic information on the net recharge (or effective infiltration) is obtained from a series of continuous data collected in the period 1961–2020 from the former Institute of Hydrometeorology (HIDMET) [41] and nowadays from the Institute of Geosciences (IGEO). Nearly 10–15% of the precipitation amount infiltrates through the cover layer, while the remaining goes to evapotranspiration and surface runoff [41]. The rainfalls’ distribution is almost uniform for the whole Albanian Western Lowland where the study area is included [41]. The net recharge is calculated according to Turc [105] for an average precipitation of 1250 mm/year and an average temperature of 15 °C. The net recharge is calculated as the product of the infiltration with the potential infiltration coefficient χ. Table 4 provides the potential infiltration coefficient of a cover layer consisting of medium to fine alluvial deposits [92].

Table 4.
Intervals of cover layer thickness, potential infiltration coefficient and SINTACS rate.
In the areas where the cover layer thickness varies from zero to 5.0 m, the potential infiltration coefficient is χ = 0.3, and the calculated effective infiltration is 213 mm/year. The assigned SINTACS rate is 9. In the aquifer sectors where the cover layer thickness varies from 5 m to 10 m and the lithological composition includes clays, sand and gravel with a potential infiltration coefficient χ = 0.2, a rate 6 is assigned (Table 4). In the sectors with a cover layer of 10 m to 20 m thickness, the assigned SINTACS rate is 5. By contrast, in the confined part of the aquifer in the northwest of the study area, due to the high clay content and large thickness of the cover layer, the impact of the net recharge is practically nonexistent, and therefore the rate zero has been assigned to the parameter “I”.
Figure 6 shows the net recharge parameter map, which indicates that the assigned SINTACS rate for this parameter is zero in roughly 50% of the study area, where the aquifer is confined and the cover layer is thick and composed of fine alluvial deposits. In 40% of the study area, this parameter has the medium rate, 5–6, whereas the remaining 10% has high rates, assigned to the rivers’ terraces, where the cover layer is nonexistent or is thinner than 5 m and non–uniformly spread.
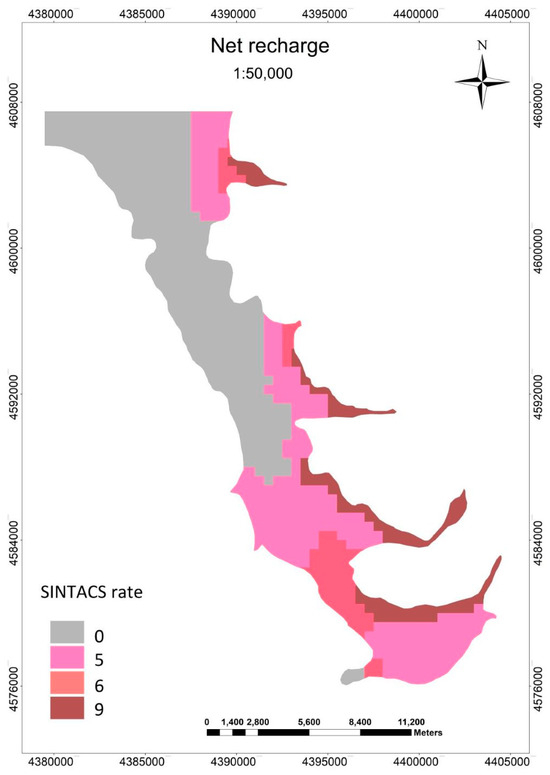
Figure 6.
Map of the net recharge parameter.
Parameter “N”: unsaturated media. Both the soil media and unsaturated media protect the aquifer from pollution, thanks to their physical and chemical properties. The texture of the unsaturated media determines the travel time of a contaminant [92]. The lithology of the unsaturated zone observed in situ or in the drilled wells [23,24,49,50] plays an important role in the creation of a conceptual model of the hydrogeological system of this zone. In the 3D model created for this study’s purposes (Figure 4), the lithological data are correlated. The reliability of this model was verified based on the lithotypes provided in the geotechnical maps [106,107,108,109,110,111]. Based on the lithology of each polygon, the value of parameter “N” was defined using the weighted average calculation provided in Formula (4).
where Pi is the SINTACS rate of each lithotype (Table 5), hi is the thickness of each lithotype and h is the unsaturated zone’s thickness.

Table 5.
Lithotypes of the unsaturated zone and the respective SINTACS range.
Table 5 provides the lithotypes of the unsaturated zone and the respective SINTACS range corresponding to alluvial deposits [92], while Figure 7 shows the map of the unsaturated zone parameter.
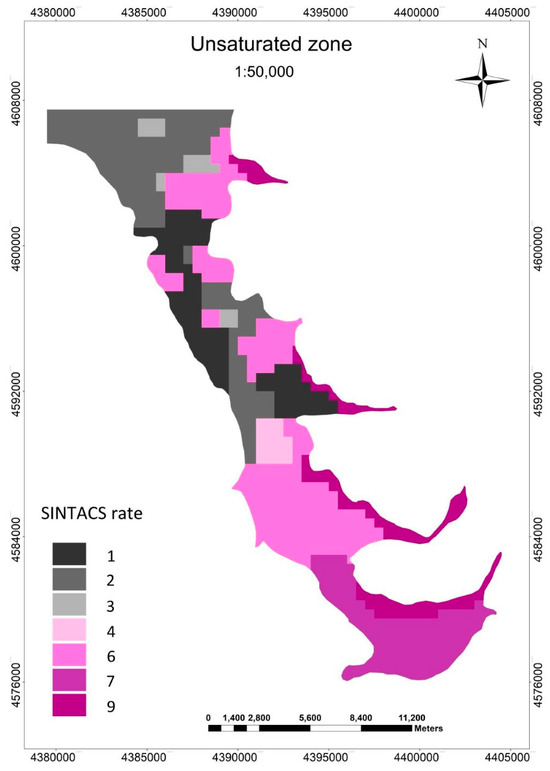
Figure 7.
Map of the unsaturated zone parameter.
According to Figure 7, the unsaturated zone parameter rates indicate a larger spatial variability compared to the other parameters. The highest rates are associated with the river terraces (rate 9) and Tirana City area (rate 7) that constitute roughly 10% and 20% of the study area’s surface, respectively. Roughly up to 30% of the study area, belonging to the central and northeastern parts of this area, is assigned an almost medium rate (rate 6). The lowest rates (1, 2 and 3) belong to about 40% of the study area, mainly in its western and northwestern parts, where the unsaturated zone is composed of thick clays and silts.
Parameter “T”: soil media. The soil media are the first barrier to groundwater pollution. The soil classification is based on the World Reference Base for Soil Resources (WRB) [112,113]. On the basis of their physical–morphological characteristics, the soil horizons are distinguished from their composition, the grain diameter size and the texture and structure [113,114,115,116,117]. A large number of physical–chemical analyses have been effectuated by the Albanian Institute of Soil Science in the framework of different scientific projects, whose findings were synthesized in the preparation of a geo–referenced soil database for Albania [118,119], followed by soil mapping at 1:250,000 scale for the whole country and at 1:50,000 scale for the Western Lowland of Albania [120,121]. According to the WRB classification, the soil types within the study area are of the Fluvisol, Cambisol, Arenosol and Luvisol types [121] (Figure 8). Table 6 provides the study area’s soil types and the respective SINTACS rates [92].
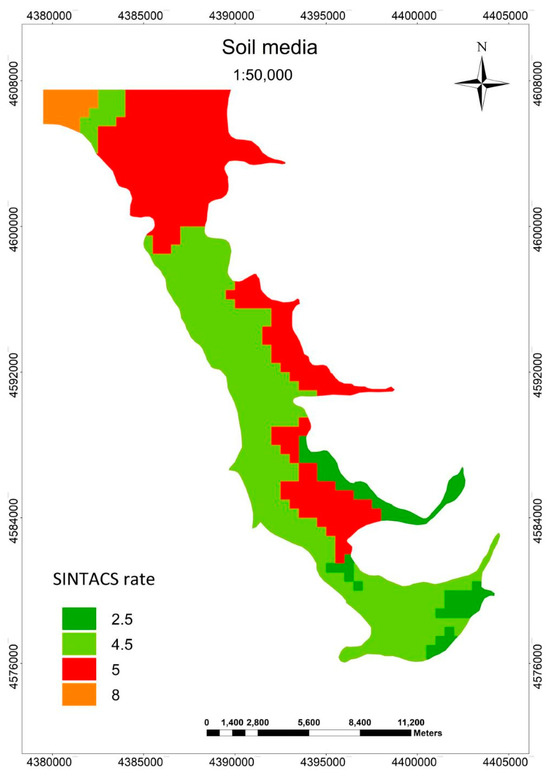
Figure 8.
Map of the soil media parameter.

Table 6.
Soil types in the study area and the respective SINTACS rates.
Figure 8 shows the soil media parameter map, which indicates that roughly up to 5% of the aquifer has a high rate (8), 88% has rate 5 and 4.5 and 7% has a low rate (2.5).
Parameter “A”: aquifer media. When a pollutant penetrates through both the soil media and the unsaturated zone and reaches the aquifer, its impact can be mitigated through the natural processes of dilution, dispersion and absorption, as well as by the chemical processes that may occur in the geological formation.
The influence of the aquifer media characteristics on GWV includes the following:
- The recharge zones, which are located in the riverbeds in the eastern edge of the study area;
- The unconfined areas of the aquifer;
- The confined areas of the aquifer;
- The heterogeneity of the aquifer’s particles size;
- The groundwater flow direction.
Based on the available data and information on the above aquifer media’s features [21,23,24,54,57,58], Table 7 provides the assigned SINTACS rate, in terms of the lithotypes of the saturated zone [92].

Table 7.
Lithotypes of the saturated zone and the respective SINTACS rates.
Figure 9 shows the aquifer media parameter map, which indicates that the highest rate (9 and 8) is assigned to roughly 50% of the aquifer, located in the southern, central and eastern parts of the study area. This high rate is due to the presence of the recharge zones, the unconfined aquifer sections and the coarse grain-size alluvium deposits. The latter are found mainly in the southern and eastern part of the study area, close to the foothills. In the western and northwestern part of the study area, the assigned SINTACS rate for this parameter is 6 and 7, corresponding to 20% and 30% of the area, respectively.
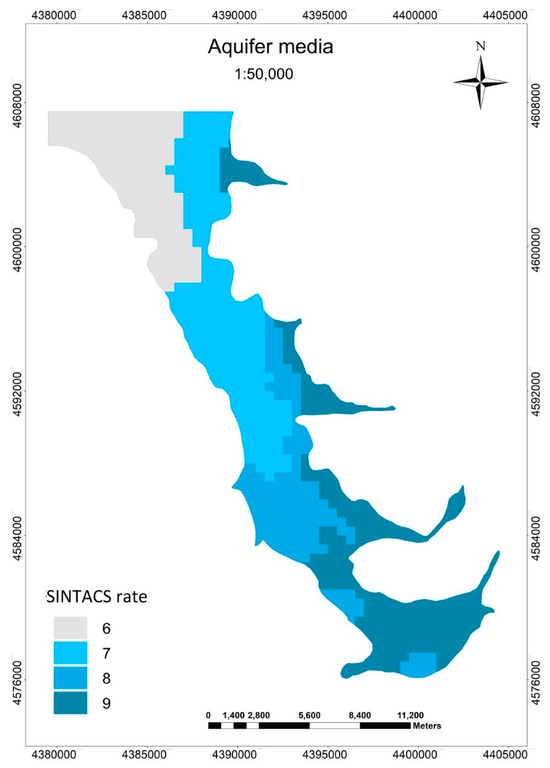
Figure 9.
Map of the aquifer media parameter.
Parameter “C”: hydraulic conductivity. The hydraulic conductivity controls the rate of the groundwater flow through the porous media. The higher the hydraulic conductivity, the higher is the aquifer’s vulnerability. The assigned SINTACS rate to this parameter for each polygon (Table 8) is based on the experimental data on the hydraulic conductivity of the study area [49,50,53,54].

Table 8.
Hydraulic conductivity and the respective SINTACS rates.
Figure 10 shows the hydraulic conductivity parameter map, which indicates that the highest hydraulic conductivity rates (8–9) belong to roughly 50% of the aquifer, while rate 7 is assigned to the northwestern part of the study area, where the grain size of the sediments composing the aquifer is smaller
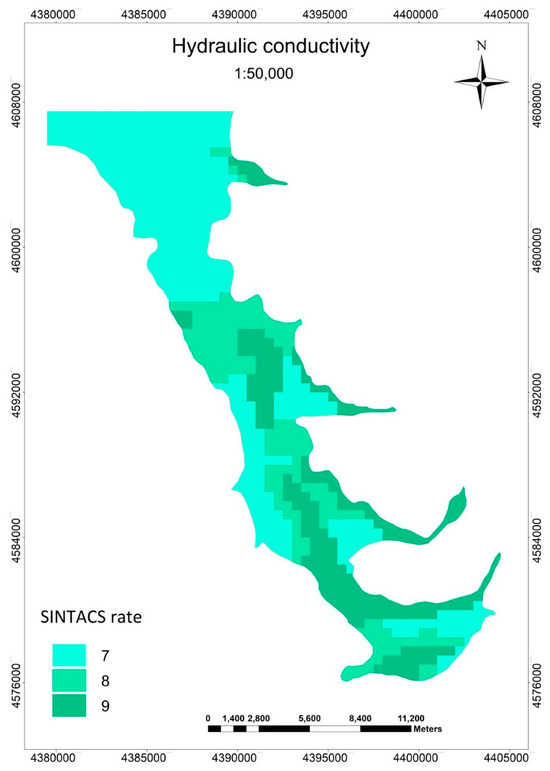
Figure 10.
Map of the hydraulic conductivity parameter.
Parameter “S”: topographic slope. The topography controls whether the pollutants will run away or will be infiltrated throughout the cover layer and reach and affect the groundwater. The terrain slope map of the study area is based on the topographic surface slope of each elementary polygon. According to the digital terrain model map, whose vertical accuracy is ±10 cm for urban areas, ±20 cm for rural areas and ±40 cm for mountainous areas [36], the study area is located mainly on flat terrain (slope of 0–2%), with the exception of a few small areas with a very low slope of 2–4%. By classifying the whole study area at a slope of 0–4%, the assigned SINTACS rate to the parameter S is 9 [92]. Figure 11 shows the terrain and the topographic slope parameter maps.
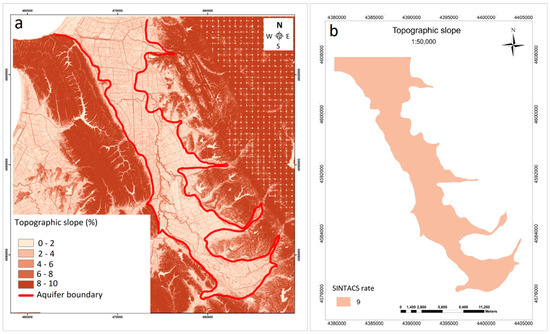
Figure 11.
Map of topographic slope. (a) Topographic slope according to terrain map, (b) map of topographic slope parameter.
4.2. Statistical Analysis of the SINTACS Parameters
To interpret their reliability, the obtained results were submitted to a statistical analysis [18], which helps also to compare the relevance of each of the seven parameters in the vulnerability index [122]. The mean value, the standard deviation and the variation coefficient were analyzed for each parameter [123,124]. The standard deviation measures the amount of variation or dispersion in a set of data values relative to its mean, while the coefficient of variation, also called the relative standard deviation, is the ratio of the standard deviation to the mean value. The lower the standard deviation and the coefficient of variation, the closer to the mean are the parameters’ values. Table 9 provides statistical data on the seven parameters used in the SINTACS method for vulnerability mapping.

Table 9.
Statistical analysis of SINTACS parameters.
Table 9 indicates that the unsaturated zone has the highest impact on the vulnerability index, as its mean has the highest value (24.37), followed by hydraulic conductivity (23.36) and the aquifer media (23.04). The soil media and the water table depth show almost the same mean value, 21.55 and 20.97, respectively. The net recharge has the minimum mean value (14.28). The very high value (94.42) of the variation coefficient related to net recharge indicates that the vulnerability index is highly influenced by this parameter, even when it varies slightly. Although the soil media parameter and the water table depth have more or less the same mean value, their variation coefficients are different—respectively, 31.93 and 70.72—indicating that the water table depth has a higher contribution to the variation in the vulnerability index than the soil media. Lastly, because of the zero value of its variation coefficient, it is not expected that the topographic slope will influence the vulnerability index variation.
4.3. Vulnerability Map According to the Theoretical Weights of the SINTACS Parameters
Table 10 provides the vulnerability classes for the Tirana–Ishmi aquifer, and the related surface areas for each class, in compliance with the SINTACS assessment [92], using GIS mapping [14,15,16,17]. It indicates that, based on the vulnerability index, there are four vulnerability classes within the Tirana–Ishmi aquifer: low, moderate, high and extremely high. The GWV for normal impact is mapped using the GIS (Figure 12). As it has not yet been submitted to a sensitivity analysis, the prepared map is called a preliminary vulnerability map.

Table 10.
GWV classes and the related surface areas for the Tirana–Ishmi aquifer according to the theoretical weights of the SINTACS parameters.
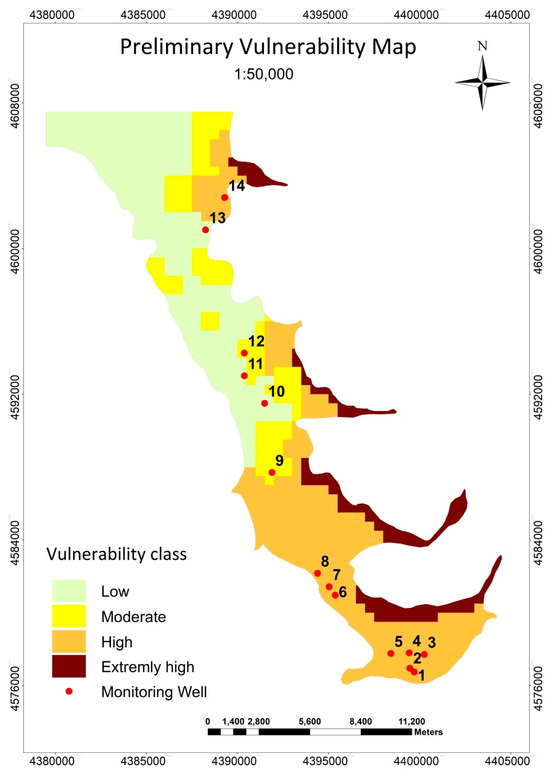
Figure 12.
Preliminary GWV map of the Tirana–Ishmi aquifer at 1:50,000 scale based on theoretical weights of the SINTACS model parameters.
The preliminary vulnerability map shows that the extremely high vulnerability class is associated with the recharge zones of the Tirana, Terkuza, Gjola and Zeza riverbeds, within the eastern part of the study area. The high vulnerability class characterizes the southern part of the study area where the aquifer is mostly unconfined, as well as some sections in the study area eastern part, where the cover layer consists mostly of medium grain-size alluvial deposits. The moderate vulnerability class characterizes mainly some confined aquifer parcels that border from the east the aquifer section of low vulnerability. The latter includes the confined aquifer sections, which are overlaid by a thick clayey cover layer.
4.4. Validation of Preliminary Vulnerability Map Using Sensitivity Analysis
The validation of the preliminary vulnerability map was performed using the SA that includes the map removal sensitivity analysis and the single-parameter SA. In addition, the NO3 content measured in situ is taken into consideration as an indicator of anthropogenic pollution [84,97,98,99,100]. The SA approach used in this study includes the map removal SA and the single-parameter SA.
Map removal sensitivity analysis. The aim of the map removal SA is to evaluate the relevance of each of the seven SINTACS parameters in the vulnerability assessment. Lodwick et al. [87] suggest to analyze the sensitivity by removing one parameter map, to better understand the relevance of each parameter (Table 11). The statistical parameters of the variation index in Table 11 are calculated based on Equation (2), by each time removing one parameter map.

Table 11.
Map removal sensitivity analysis, removing one SINTACS parameter.
Table 11 indicates that the most significant parameter in the variation index (SI) is the net recharge (mean value = 1.13), which has the highest standard deviation value. That is probably related to the high value (4) of its theoretical weight. The variation index is also sensitive to the removal of the unsaturated zone, followed by the depth to groundwater. The mean values of these parameters are respectively 1.02 and 0.87. This may result from their high theoretical weights, which, according to the SINTACS model, have a value of 5 for both these parameters. The relatively high impact of the unsaturated zone is associated with the cover layer’s influence on aquifer vulnerability. Similarly, the water table depth has a relatively high impact, but slightly lower than that of the unsaturated zone, because the aquifer is mainly confined, whereas the aquifer media have less effect on the variation index, which shows the lowest mean value (0.53) after the removal of this parameter. This is probably due to the increase in the sandy fraction towards the northwest of the aquifer. Likewise, the variation index shows a low mean value (0.54) after the removal of the topographic slope map. This low value is linked to the low (2) theoretical weight. Since their mean values are 0.67 and 0.60, respectively, hydraulic conductivity and soil media have a moderate contribution to the variation index.
Single-parameter sensitivity analysis. This analysis compares the parameters’ effective weights with their respective SINTACS model’s theoretical weights (Table 12).

Table 12.
Single-parameter sensitivity analysis of Tirana–Ishmi aquifer using SINTACS method.
Figure 13 shows the mean effective weights and the mean theoretical weights of the SINTACS parameters.
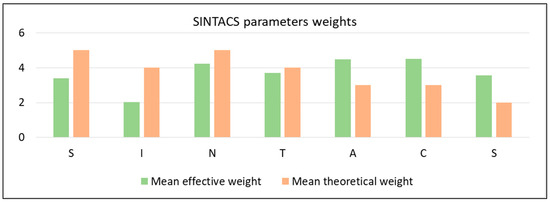
Figure 13.
Mean effective and theoretical weights of the SINTACS parameters.
Table 12 and Figure 13 indicate that the effective weight of the water table depth (S) is 36% lower than its theoretical value, which seems to be overestimated. This difference may be due to the fact that in confined aquifers, the water table depth is not a significant parameter. Therefore, when the aquifer is confined, the theoretical value of the water table depth is lowered. The net recharge (I) has an effective weight twice lower than its theoretical one. Table 11 indicates that this parameter has the greatest impact in the vulnerability index. This can be due to the overestimation of its theoretical weight. The net recharge is low or negligible in roughly 70% of the study area. This parameter is linked to the thickness and lithological composition of the cover layer. The mean effective weights of the unsaturated zone (N) and the soil media (T) are, respectively, nearly 14% and 7% lower than their theoretical values. Therefore, their effective and theoretical weights are closer to each other compared to the other SINTACS parameters. The unsaturated zone and the soil media constitute, respectively, the second and first barrier to groundwater pollution. Both the mean effective weights of the aquifer media (A) and hydraulic conductivity (C) are 50% higher than their theoretical ones. Because of the flat terrain, the topographic slope (S) has a mean effective weight nearly 1.8 times greater than its SINTACS theoretical value.
Based on the above, the aquifer media, hydraulic conductivity and topographic slope seem to be underestimated in the selected vulnerability assessment model; whereas, the water table depth and the net recharge are overestimated. Regarding the unsaturated zone and soil media, the model weights are close to the effective weights. Therefore, for a realistic parameters assessment, accurate, detailed and representative information is needed for all these parameters.
4.5. Vulnerability Map Using Effective Parameters’ Weights
The last step of GWV mapping is the preparation of the vulnerability map using effective weights, which hereinafter is called the final vulnerability map or, simply, the vulnerability map (Figure 14).
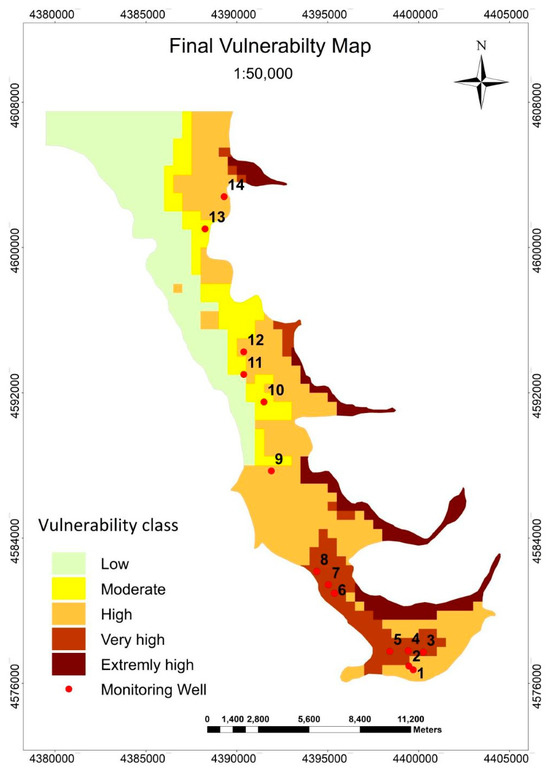
Figure 14.
GWV map of the Tirana–Ishmi aquifer at 1:50,000 scale based on effective weights of the SINTACS model parameters.
The (final) GWV map includes five vulnerability classes: “extremely high”, “very high”, “high”, “moderate” and “low”. The comparison of this map (Figure 14) to the theoretical weights’ map (or preliminary map) (Figure 12), indicates that the areas of an “extremely high” vulnerability class are the same in both maps and represent only the recharge zones. The “very high” vulnerability class is not present in the preliminary map. This class appears in the final map, where it is located in the areas of the “high vulnerability” class of the preliminary map. Figure 14 shows that the “very high” vulnerability class is also encountered in small areas located mainly westward of the extremely high vulnerability class areas. In the areas of a “very high” vulnerability class, the aquifer is mostly unconfined or has been transformed into unconfined due to groundwater overexploitation. This occurs mainly in the southern part of the study area, which is highly urbanized. Compared to the preliminary map, in the final map, there is a noticeable decrease in the surface areas with “high”, “moderate” and “low” vulnerability classes, as well as a displacement of these areas northwestward and westward. Table 13 indicates the vulnerability classes of the Tirana–Ishmi aquifer based on the effective weights, as well as their spatial extent.

Table 13.
GWV classes and the related aquifer’s surface areas based on effective weights.
4.6. Validation Using Nitrates Content in Groundwater
Apart the validation performed using the sensitivity analysis, the reliability of the selected vulnerability assessment model and of the prepared final vulnerability map were also validated using the nitrates content, which is an indicator of the groundwater’s anthropogenic pollution [84,97,98,99,100]. However, it should be noted that the use of nitrates content has some limitations, due to the insufficient number of monitoring wells in the study area and their spatial distribution. As shown in the vulnerability map (Figure 14), the 14 monitoring wells are not uniformly distributed in the areas associated with different vulnerability classes. In particular, there are no monitoring wells in the areas with “extremely high” and “low” vulnerability classes. In the areas with “very high”, “high” and “moderate” vulnerability, the number of monitoring wells is six, five and three, respectively, which is not sufficient.
The accuracy of the preliminary vulnerability map is evaluated using the nitrates content as a validation indicator (Figure 15). Although the SINTACS parameters were not yet submitted to sensitivity analysis, Figure 15 indicates a satisfying correlation between the vulnerability classes and the variation trend of the nitrates content in the groundwater. Therefore, it can be said that the use of the nitrates content as a validation technique supports the selection of SINTACS as a GWV model and the necessity of the performed statistical analysis. In Figure 15, the average NO3 content in the monitoring wells for the period 2015–2022 is, respectively, 9.45 mg/L in the “low” vulnerability class, 11.65 mg/L in the “moderate” vulnerability class and 18.3 mg/L in the “high” vulnerability class. The highest NO3 content is 36 mg/L, which is lower than the maximum value allowed by national standards (50 mg/L). It should be noted that the Albanian drinking water quality standards [125] are identical to the EU Directive 98/83/EC standards [126], which have been updated by EU Directive 2020/2184 [127].
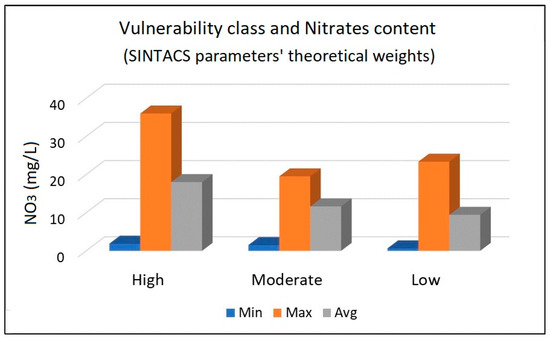
Figure 15.
GWV classes in the Tirana–Ishmi aquifer using theoretical weights of the SINTACS parameters, and the related nitrates content values.
Figure 16 shows the monitored nitrates content in the aquifer and the vulnerability classes after the model’s submission to sensitivity analysis. Figure 17, Figure 18 and Figure 19 show the vulnerability classes and the spatial and temporal variation in the nitrates content during the period 2015–2022 [104].
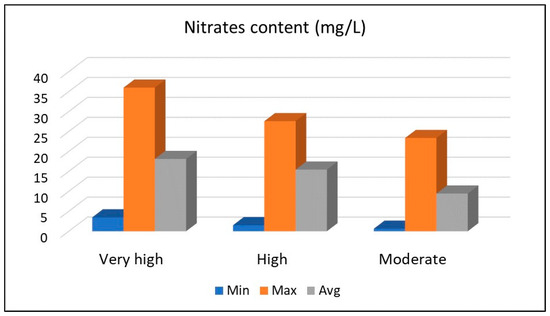
Figure 16.
GWV classes in the Tirana–Ishmi aquifer using effective weights of the SINTACS parameters, and the related nitrates content values.
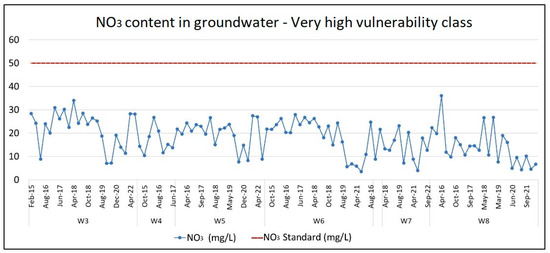
Figure 17.
“Very high” GWV class and spatial and temporal distribution of the nitrates content.
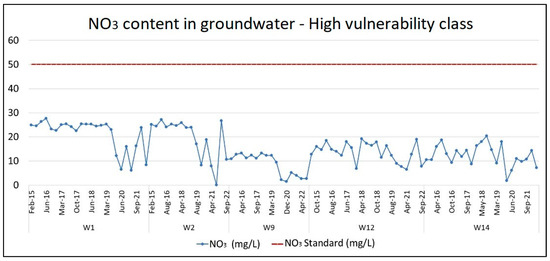
Figure 18.
“High” GWV class and spatial and temporal distribution of nitrates content.
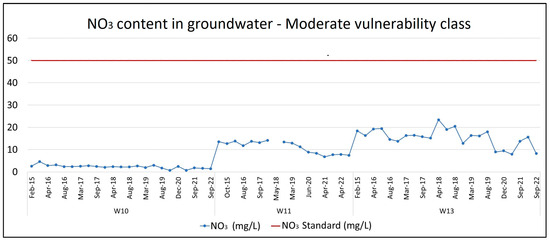
Figure 19.
“Moderate” GWV class and spatial and temporal distribution of nitrates content.
Figure 16 shows that the higher the NO3 content in the groundwater, the higher is the aquifer vulnerability and vice versa. The overall low level of NO3 content in the whole aquifer could be due to the very low use of fertilizers in agriculture during the last 30 years. There are no studies on nitrates’ travel time throughout the cover layer in the study area. The travel time of the nitrates depends on the water table depth, the hydraulic properties of the cover layer, the soil type, etc. [101]. Bancheri et al. calculated that the average travel time of the nitrates through a clayey-rich cover layer and the overlaid soil in a case study in Italy was roughly 37 years [101]. The higher the clayey content in the cover layer and soil, the longer is the travel time of the nitrates from the surface to the groundwater. Regarding the Tirana–Ishmi aquifer, the highest nitrates content is observed in the Tirana City area and its neighboring area, where the aquifer is phreatic, the water table is almost shallow, the cover layer is composed of medium grain-size alluvium deposits, and both the levels of the groundwater extraction rate and the amount of wastewater discharged into the local rivers’ waters are high. The sources of nitrates in groundwater in this part of the study area are mostly sewage and industrial activities [29,100,103,128]. The lowest level of NO3 content is observed in the northwestern part of the study area, where the aquifer is confined, the groundwater extraction rate is low and the cover layer is thick and composed of fine grain-size alluvium deposits.
The NO3 in the recharge zones is not monitored, because of the lack of monitoring wells in these zones. The nitrates’ transport velocity in the unsaturated zone is determined by many factors, such as rock types, permeability, porosity and amount of groundwater recharge [129]. The cover layer in the recharge zones of the study area is composed of coarse alluvium deposits of high porosity and permeability. Its thickness varies from zero to 5 m [49,53,54]. As mentioned in Section 2.3, the hydraulic conductivity in the recharge zones of the aquifer varies from 180 to 300 m/day [57,58,60]. Therefore, it is expected that the travel time of the nitrates in the recharge zones of the study area will be insignificant.
Figure 16 indicates that the variation trend of the nitrates content in the groundwater is in line with the variation trend of the vulnerability classes of the (final) vulnerability map. Once again, it can be said that the use of nitrates content as a validation technique supports the rational selection of SINTACS as a GWV model and the necessity of the performed statistical analysis, as well as a realistic approach concerning the effective weights assigned to the SINTACS parameters.
4.7. Groundwater Vulnerability Changes Over Time
The present map of the intrinsic GWV of the area under study may change over time. Possible changes may occur as a result of the addition of hydrogeological data and information, the addition of new monitoring wells, changes in land use, climate change, etc.
Currently, there are no monitoring wells within the recharge zones. Additional data from additional wells—in particular, monitoring wells within the recharge areas—can change the surface size and geometrical configuration of the areas of an extremely high vulnerability class. However, the vulnerability class of the recharge zones will remain extremely high. In general, due to additional data and information, the sub-zones with different vulnerability classes may change in surface size and horizontal geometrical configuration, but it is thought that the core of the prepared intrinsic vulnerability map will not change, because of the reliability of the used data and information and the careful selection of the assessment method. Given that the GIS-created model is a “living model”, the use of additional data and information for each SINTACS parameter can improve the study outputs and reduce the hydrologists’ subjectivism.
The study area consists mainly of urban and agricultural areas. There are no forests in the study area, the deforestation of which would imply changes in the soil media properties and infiltration [130]. Population growth, intensive urbanization and increasing economic activity will intensify the extracted groundwater amount and therefore the risk to groundwater pollution. In the present GWV map, the sub-zone with high vulnerability corresponds to Tirana City and its surroundings, where the groundwater extraction rate is high and currently the municipal wastewater is discharged into the local rivers. The construction of a WWTP for Tirana City, as planned by the Tirana Municipality [27], will reduce this risk. But increases in the amount of groundwater extraction may affect the water table depth, which could slightly modify the present GWV map. However, it should be emphasized that in recent years, additional sources of drinking water for Tirana City are being sought outside the study area [43].
Climate change may affect the GWV [131,132] and therefore the outputs of the present study. Climate change projections for the Albanian Western Lowland [133], including the area under study, include precipitation and temperature rises. Changes in rainfall amounts and their seasonal distribution may impact the GWV. A temperature increase will increase evapotranspiration, which in turn may reduce the portion of surface water infiltrating to the groundwater. Therefore, it is expected that the projected climate change may affect the water table depth and infiltration. A statistical analysis helps to understand why and how climate change may affect the prepared vulnerability map. Table 9 indicates that small changes in water table depth and infiltration parameters have a great influence on the vulnerability index, due to the high variation coefficient.
4.8. Study’s Limitations
This article has some limitations, which should be taken into consideration in future studies on the aquifer’s vulnerability. The potential impact of densely urbanized areas on groundwater pollution could be considered as an additional parameter that should be taken into consideration through using a modified SINTACS method. Furthermore, as mentioned in the previous section, it is necessary to complete the groundwater monitoring network with additional monitoring wells, especially in the recharge areas, which correspond to the areas of an extremely high vulnerability class.
5. Conclusions
Based on the aquifer characteristics and the available data and information, SINTACS resulted in the most realistic groundwater assessment model for the Tirana–Ishmi alluvium aquifer. Validation through both a sensitivity analysis and nitrates content confirmed the rational selection of the SINTACS model and the reliability of the study’s outputs and outcomes. The aquifer vulnerability to pollution assessment and the prepared vulnerability map indicate the following main conclusions:
- The recharge areas show an “extremely high” vulnerability class (or degree) due to absence of both the unsaturated zone and soil media. This allows direct contact between the surface waters and the groundwater.
- Tirana City and its neighboring area, which occupy about 10.2% of the study area, show a “very high” degree of vulnerability due to the following:
- ○
- The shallow thickness and the composition (medium grain-size deposits) of the unsaturated zone may allow the penetration of the surface waters to the groundwater. Due to the absence of a wastewater treatment plant, the municipal wastewater of this area flow into the Lana and Tirana Rivers’ waters, which in turn could gradually pollute the groundwater.
- ○
- The increasing groundwater extraction rate impacts the groundwater quality and the aquifer type, which has been transformed from confined to unconfined.
- The area with the lowest GWV vulnerability is located in the northwest of the aquifer and covers roughly 28.7% of the study area. The insignificant threat posed to groundwater quality in this sector comes mainly from the following:
- ○
- The cover layer is thick enough and composed of fine grain-size deposits that do not allow the surface waters’ pollution to pass through this layer and affect the groundwater quality.
- ○
- Low groundwater extraction rate.
The main practical findings from this paper include the following:
- To prevent the aquifer’s pollution, it is necessary to complete the construction of the wastewater treatment plant for Tirana City that has been under construction for many years. It should be noted that the planned capacity of this plant (350,000 inhabitants) is not sufficient for the whole study area.
- The groundwater extraction rate in the Tirana City territory and its neighboring area should be reduced, to prevent the groundwater quality deterioration that will be followed by the groundwater’s natural self–purification.
- To better monitor the groundwater’s quality and vulnerability, there is a need for a larger number of monitoring wells and a better spatial distribution of them, particularly within the recharge zones, which represent the most vulnerable areas to aquifer pollution and therefore to the groundwater users’ health.
- The vulnerability zones indicated in the vulnerability map may change in terms of the updating of the used data and information. Given that the GIS-created model is a “living model”, the use of additional data and information for each SINTACS parameter can improve the study outputs and reduce the hydrologists’ subjectivism.
- This paper could serve as a scientific–based document for a more detailed study on the Tirana–Ishmi aquifer. The groundwater vulnerability map could serve as a basis for preparing a scientific–based aquifer management plan. Such a plan should be considered in the local territory planning, a practice disregarded in the recent Ishmi River catchment management plan.
Author Contributions
Conceptualization, E.D.; methodology, E.D. and A.S.; data collecting, E.D. and A.S.; data analyses, E.D.; writing—original draft preparation, E.D. and A.S.; writing—review and editing, A.S.; supervision, E.D. and A.S.; GIS expert, A.D. All authors have read and agreed to the published version of the manuscript.
Funding
This research received no external funding.
Data Availability Statement
Readers can contact the authors for the available data and materials.
Acknowledgments
The authors are grateful to Vangjo Kovaçi for his helpful clarifications on soil issues.
Conflicts of Interest
The authors declare no conflicts of interest.
References
- Margat, J. Vulnérabilité des Nappes d’Eau Souterraine à la Pollution. In Bases de sa Cartographie—BRGM, 68 SGL 198 HYD; BRGM, Ed.; BRGM: Orléans, France, 1968; 12p, Available online: https://infoterre.brgm.fr/rapports/68-SGN-198-HYD.pdf (accessed on 10 January 2024).
- Zaporozec, A. Concept of Groundwater Vulnerability. In Guidebook on Mapping Groundwater Vulnerability, 1st ed.; Vrba, J., Zaporozec, A., Eds.; IAH, International Contributions to Hydrogeology, Verlag Heise: Hanover, Germany, 1994; Volume 16, pp. 3–9. ISBN 3-922705-97-9. [Google Scholar]
- Foster, S.; Hirata, R.; Andreo, B. The Aquifer Pollution Vulnerability Concept: Aid or Impediment in Promoting Groundwater Protection. Hydrogeol. J. 2013, 21, 1389–1392. [Google Scholar] [CrossRef]
- Dochartaigh, B.E.; Ball, D.F.; MacDonald, A.M.; Lilly, A.; Fitzsimons, V.; Del Rio, M.; Auton, C.A. Mapping Groundwater Vulnerability in Scotland: A New Approach for the WFD. Scott. J. Geol. 2005, 41, 21–30. [Google Scholar] [CrossRef]
- European Union. Annex II.2. Groundwater. In The EU Water Framework Directive; DG ENV: Brussels, Belgium, 2014; pp. 43–44. Available online: https://eur-lex.europa.eu/legal-content/EN/TXT/PDF/?uri=CELEX:02000L0060-20141120 (accessed on 2 February 2024).
- Banerjee, A.; Creedon, L.; Jones, N.; Gill, L.; Gharbia, S. Dynamic Groundwater Contamination Vulnerability Assessment Techniques: A Systematic Review. Hydrology 2023, 10, 182. [Google Scholar] [CrossRef]
- Stigter, T.Y.; Ribeiro, L.; Dill, A.M.M.C. Evaluation of an Intrinsic and a Specific Vulnerability Assessment Method in Comparison with Groundwater Salinization and Nitrate Contamination Levels in Two Agricultural Regions in the South of Portugal. Hydrogeol. J. 2006, 14, 79–99. [Google Scholar] [CrossRef]
- Vrana, M. Measures for the Protection of Groundwater against Contamination and Depletion: Methodology for Construction of Groundwater Protection Maps. In Hydrogeological Principles of Groundwater Protection, Handbook of Scientific Methods, 1st ed.; UNESCO/UNEP, Ed.; UNESCO/UNEP, USSR: Moscow, Russia, 1988; Volume 1, pp. 147–153. Available online: https://unesdoc.unesco.org/ark:/48223/pf0000099378 (accessed on 11 February 2024).
- Albinet, M. Les Cartes de Vulnérabilité des Nappes d’Eau Souterraine à la Pollution; BRGM: Orléans, France, 1970; 31p, Available online: https://infoterre.brgm.fr/rapports/70-SGN-325-HYD.pdf (accessed on 15 December 2023). (In French)
- UNESCO/UNEP. Hydrogeological Principles of Groundwater Protection. Handbook of Scientific Methods, 1st ed.; UNESCO/UNEP, Ed.; UNESCO/UNEP, USSR: Moscow, Russia, 1981; Volume 1, 163p, Available online: https://unesdoc.unesco.org/ark:/48223/pf0000099378 (accessed on 24 January 2024).
- Vrba, J.; Civita, M. Assessment of Groundwater Vulnerability. In Guidebook on Mapping Groundwater Vulnerability, 1st ed.; Vrba, J., Zaporozec, A., Eds.; IAH, International Contributions to Hydrogeology, Verlag Heinz Heise: Hanover, Germany, 1994; Volume 16, pp. 31–49. ISBN 3-922705-97-9. [Google Scholar]
- Ball, D.; McConvey, P.; Campbell, E. A Groundwater Vulnerability Screening Methodology for Northern Ireland. Groundwater Management Programme, Commissioned Report CR/05/103N; British Geological Survey: Keyworth, Nottingham, UK, 2005; 41p, Available online: https://nora.nerc.ac.uk/id/eprint/11296/1/CR05103N.pdf (accessed on 23 February 2024).
- Broda, S.; Gunther, A.; Reichling, J. Comparison of Internationally Commonly Applied Index Methodologies for Assessing the Vulnerability of the Upper Aquifer to Pollution; BGR: Hanover, Germany, 2019; p. 9. Available online: https://repository.europe-geology.eu/egdidocs/hover/hover%2Bd7_1_report_final.pdf (accessed on 9 February 2024).
- Civita, M. Le Carte della Vulnerabilita degli Acquiferi All’inquinamento: Teoria e Pratica; Pitagora: Bologna, Italy, 1994; 325p, ISBN 9788837106881. (In Italian) [Google Scholar]
- Civita, M.; De Maio, M.; SINTACS. Un Sistema Parametrico per la Valutazione e la Cartografia della Vulnerabilità degli Acquiferi all’Inquinamento. Metodologia e Automazione, Quaderni di Tecniche di Protezione Ambientale; Pitagora: Bologna, Italy, 1997; 191p, ISBN 9788837108991. (In Italian) [Google Scholar]
- Civita, M.; De Maio, M. Assessing and Mapping Groundwater Vulnerability to Contamination: The Italian “Combined” Approach. Geofísica Int. 2004, 43, 513–532. [Google Scholar] [CrossRef]
- Civita, M.; De Maio, M. Valutazione e Cartografia Automatica della Vulnerabilità degli Acquiferi all’Inquinamento con il Sistema Parametrico—SINTACS R5—A New Parametric System for the Assessment and Automatic Mapping of Groundwater Vulnerability to Contamination; Pitagora: Bologna, Italy, 2000; 226p, ISBN 9788837112318. (In Italian) [Google Scholar]
- Osmani, S.; Korini, T. Geostatistics and Data Processing, 1st ed.; Shtepia Botuese Librit Universitar: Tirana, Albania, 2001; ISBN 99927-0-117-X. (In Albanian) [Google Scholar]
- McCuen, R.H. The Role of Sensitivity Analysis in Hydrologic Modeling. J. Hydrol. 1973, 18, 37–53. [Google Scholar] [CrossRef]
- Holman, I.; Palmer, R.; Bellamy, P.; Hollis, J. Validation of an Intrinsic Groundwater Pollution Vulnerability Method Using a National Nitrate Database. Hydrogeol. J. 2005, 13, 665–674. [Google Scholar] [CrossRef]
- Albanian Geological Survey. Hydrogeological Map of Albania, Scale 1:200,000; Albanian Geological Survey: Tirana, Albania, 2015. (In Albanian) [Google Scholar]
- Albanian Geological Survey. Geological Map of Albania, Scale 1:200,000; Albanian Geological Survey: Tirana, Albania, 2002. (In Albanian) [Google Scholar]
- Albanian Geological Survey. Water Resources of Tirana County Territory. In Georesources and Geological Risks of Tirana County; Albanian Geological Survey: Tirana, Albania, 2014; pp. 51–65. (In Albanian) [Google Scholar]
- Albanian Geological Survey. Water Resources of Durres County Territory. In Georesources and Geological Risks of Durres County; Albanian Geological Survey: Tirana, Albania, 2014; pp. 45–57. (In Albanian) [Google Scholar]
- Water Resources Management Agency. Annex 7—Groundwater. In Ishmi River Basin Management Plan; Water Resources Management Agency: Tirana, Albania, 2023. Available online: http://www.ambu.gov.al (accessed on 20 February 2024). (In Albanian)
- Bode, A. Environmental Effects of the Human Activities on the Tirana Basin. Ph.D. Thesis, Faculty of Geology and Mining, Polytechnic University of Tirana, Tirana, Albania, 2012. (In Albanian). [Google Scholar]
- Tirana Municipality Water and Sanitation Company. Available online: https://www.shuk.al/tirane (accessed on 30 May 2024).
- WHO. Application of the Guidelines in Specific Circumstances. In Guidelines for Drinking Water Quality: Fourth Edition Incorporating the First Addendum; WHO: Geneva, Switzerland, 2021; pp. 93–116. Available online: https://www.who.int/publications/i/item/9789241549950 (accessed on 24 February 2024).
- Chambers, P.A.; Allard, M.; Walker, S.L.; Marsalek, J.; Lawrence, J.; Servos, M.; Busnarda, J.; Munger, K.S.; Adare, K.; Jefferson, C.; et al. The Impacts of Municipal Wastewater Effluents on Canadian Waters: A Review. Water Qual. Res. J. Can. 1997, 32, 659–714. [Google Scholar] [CrossRef]
- Wu, J.; Sun, Z. Evaluation of Shallow Groundwater Contamination and Associated Human Health Risk in an Alluvial Plain Impacted by Agricultural and Industrial Activities, Mid–west China. Expo. Health 2016, 8, 311–329. [Google Scholar] [CrossRef]
- Dindi, E. Sustainable Groundwater Resources Exploitation and Management in Vlore Region, Vjose–Shushice Area (Albania). Ph.D. Thesis, Polytechnic University of Tirana, Faculty of Geology and Mining, Tirana, Albania, 2009. (In Albanian). [Google Scholar]
- Dindi, E. Mapping the Ground Water Vulnerability of the Vjose—Shushice Quaternary Aquifer Using the SINTACS Method. In Proceedings of the 5th Conference on Water Observation and Information System—BALWOIS 2012, Ohrid, Macedonia, 28 May–2 June 2012; 15pAvailable online: https://balwois.com/wp-content/uploads/old_proc/975.pdf (accessed on 20 February 2024).
- Beqiraj, A.; Cenameri, M. Groundwater Vulnerability Assessment to Contamination (Erzeni Basin, Albania). In Proceedings of the Scientific Annals, School of Geology, Aristotle University of Thessaloniki, Proceedings of the XIX CBGA Congress, Thessaloniki, Greece, 23–26 September 2010; Volume 100, pp. 15–21. [Google Scholar]
- Progni, F.; Beqiraj, A.; Cenameri, M. Vulnerability Assessment—A Prerequisite for Groundwater Protection to Contamination (Use of GIS Technology). In Proceedings of the 17th Meeting of the Association of European Geological Societies, Belgrade, Serbia, 14–18 September 2011; pp. 43–46. [Google Scholar]
- Albanian Government. Decree 624/2023 on the Approval of the Ishmi River Basin Management Plan for the 2024–2029 Period. Off. J. 2023, 165, 19677–20098. (In Albanian) [Google Scholar]
- State Authority for Geospatial Information. Available online: https://geoportal.asig.gov.al/map/ (accessed on 23 January 2024).
- Eftimi, R. Karst and Karst Water Resources of Albania and their Management. Carbonates Evaporites 2020, 35, 69. [Google Scholar] [CrossRef]
- Eftimi, R.; Liso, I.S.; Parise, M. Hydrogeological Characteristics of the Makaresh Carbonate Karst Massif (Central Albania). Hydrology 2024, 11, 29. [Google Scholar] [CrossRef]
- Institute of Hydrometeorology. Climatic Atlas of Albania; HIDMET, Ed.; Academy of Sciences of Albania: Tirana, Albania, 1988. (In Albanian) [Google Scholar]
- MeteoTirana. Available online: https://www.meteotirana.al/template/pages/station/climate (accessed on 20 February 2024).
- Institute of Hydrometeorology. Climatic and Hydrologic Characteristics of the Albanian Western Lowland; HIDMET, Ed.; Academy of Sciences of Albania: Tirana, Albania, 1985; pp. 175–194. (In Albanian) [Google Scholar]
- Albanian Geological Survey. Geoenvironment of Tirana County. In Georesources and Geological Risks of Tirana County; Albanian Geological Survey: Tirana, Albania, 2014; p. 86. (In Albanian) [Google Scholar]
- Eftimi, R.; Shehu, K.; Sara, F. Hydrogeological Aspects of the Municipal Water Supply of Albania: Situation and Problems. Hydrology 2023, 10, 193. [Google Scholar] [CrossRef]
- Aliaj, S.; Mesonjesi, A. Scholar’s Viewpoints about Periadriatic Basin (Onshore Albania). Eur. J. Appl. Sci. 2023, 11, 383–407. [Google Scholar]
- Albanian Geological Survey. Neo–Tectonic Zonation—Adriatic Lowland. In Text of the Geological Map of Albania, Scale 1:200,000, 1st ed.; Albanian Geological Survey: Tirana, Albania, 2002; pp. 322–323. (In Albanian) [Google Scholar]
- Albanian Geological Survey. Stratigraphy—Adriatic Lowland. In Text of the Geological Map of Albania, Scale 1:200,000, 1st ed.; Albanian Geological Survey: Tirana, Albania, 2002; pp. 186–187. (In Albanian) [Google Scholar]
- Water Resources Management Agency. Overview of Ishmi River Basin—Geological Characteristics. In Ishmi River Basin Management Plan; Water Resources Management Agency: Tirana, Albania, 2023; pp. 72–73. Available online: http://www.ambu.gov.al (accessed on 9 December 2023). (In Albanian)
- Eftimi, R. Overview of the Hydrogeology of Mati River Alluvial Plain. Përmbledhje Stud. 1966, 4, 53–65. (In Albanian) [Google Scholar]
- Keta, Z. Hydrogeology, Hydrodynamic and Groundwater Resources of the Tirana Quaternary Basin. Ph.D. Thesis, Faculty of Geology and Mining, Tirana University, Tirana, Albania, 1980. (In Albanian). [Google Scholar]
- Eftimi, R. Hydraulic Properties of the Intergranulary Aquifers of Western Lowland of Albania and Location of Wellfields. Ph.D. Thesis, Faculty of Geology and Mining, Tirana University, Tirana, Albania, 1983. (In Albanian). [Google Scholar]
- Eftimi, R.; Tafilaj, I.; Bisha, G. Hydrogeological regionalization of Albania. Bul. Shk. Gjeol. 1989, 4, 303–316. (In Albanian) [Google Scholar]
- Eftimi, R.; Kolaneci, M.; Tafilaj, I. Groundwater Resources Management of Erzeni and Ishmi Rivers Basins. J. Nat. Tech. Sci. 1999, 7, 131–147. (In Albanian) [Google Scholar]
- Vako, E. Groundwater Chemistry of the Tirana–Ishmi Aquifer (Albania). Ph.D. Thesis, Polytechnic University of Tirana, Faculty of Geology and Mining, Tirana, Albania, 2014. (In Albanian). [Google Scholar]
- Tartari, M.; Dakoli, H.; Melonashi, G.; Puca, N.; Spaho, R. Evaluation and Potential Increase of the Exploitable Groundwater Resources of the Tirana–Lezha Basin; Albanian Geological Survey: Tirana, Albania, 2001. (In Albanian) [Google Scholar]
- Vako, E.; Pambuku, A. Groundwater’s Geochemical Parameters of the Tirana–Ishmi Aquifer. Bull. Geol. Soc. 2019, 1, 69–77. (In Albanian) [Google Scholar]
- Eftimi, R.; Stichler, R.; Gourcy, L.W.; Amataj, S.; Zoto, J. Investigation About the Recharge Sources of Tirana Alluvial Basin in Albania by Means of Environmental Isotopes. In Proceedings of the Integrated Water Resources Management and Challenges of the Sustainable Development, Marrakech, Morocco, 23–25 May 2005. [Google Scholar]
- Eftimi, R. A Comparative Study of the Hydraulic Parameters and of Yields of Wells of Some Sedimentary Hard Rocks of Albania. In Groundwater in Fractured Rocks, IHP–VI, Series on Groundwater No 6, 1st ed.; Krasny, J., Hrkal, Z., Bruthans, J., Eds.; IAH/UNESCO: Prague, Czech Republic, 2003; Volume 6, pp. 55–60. ISBN 92 92-20-002-X. Available online: https://unesdoc.unesco.org/ark:/48223/pf0000134431 (accessed on 20 May 2024).
- Eftimi, R. Tirana—Mamurras Aquifer. In Hydraulic Properties of the Intergranulary Aquifers of the Albanian Western Lowland; ITA Consult: Tirana, Albania, 2018; pp. 85–94. (In Albanian) [Google Scholar]
- Aquaveo. Available online: https://www.aquaveo.com/software/gms (accessed on 1 March 2024).
- Dakoli, H. Groundwater Classification. In Hydrogeology, 1st ed.; Maluka: Tirana, Albania, 2007; pp. 63–110. (In Albanian) [Google Scholar]
- National Environment Agency (NEA). Environmental Monitoring Programme for the Year 2023; NEA: Tirana, Albania, 2022; pp. 47–48. Available online: https://akm.gov.al/ova_doc/programi-kombetar-i-monitorimit-te-mjedisit-per-vitin-2023/ (accessed on 21 January 2024). (In Albanian)
- National Environment Agency. State of Environment Report for 2016; NEA: Tirana, Albania, 2017; pp. 216–217. Available online: https://akm.gov.al/raporte-dhe-publikime/ (accessed on 20 March 2024). (In Albanian)
- National Environment Agency. State of Environment Report for 2021; NEA: Tirana, Albania, 2022; p. 35. Available online: https://akm.gov.al/raporte-dhe-publikime/ (accessed on 20 March 2024). (In Albanian)
- Vako, E. Statistical Analyses of the Physical–Chemical Parameters of the Tirana–Ishmi Area’s Groundwater. Bull. Geol. Soc. 2012, 2, 39–46. (In Albanian) [Google Scholar]
- Vako, E. Groundwater Hydrochemistry of the Alluvial Gravels of Tirana–Ishmi Quaternary Basin. J. Int. Environ. Appl. Sci. 2012, 1, 19–26. [Google Scholar]
- Dindi, E.; Shehu, A. Spatial and Temporal Variations of the Hydrochemical Parameters in the Gravelly Aquifer of the Lower Course of Vjosa River, Albania. Hydrology 2023, 10, 234. [Google Scholar] [CrossRef]
- Machiwal, D.; Kumar, M.; Singh, P.V.; Mohan, C. Assessment and Mapping of Groundwater Vulnerability to Pollution: Current status and challenges. Earth-Sci. Rev. 2018, 185, 901–927. [Google Scholar] [CrossRef]
- Moraru, C.; Hannigan, R. Overview of Groundwater Vulnerability Assessment Methods. In Analysis of Hydrogeochemical Vulnerability; Springer Hydrogeology; Springer: Cham, Switzerland, 2018; pp. 1–15. [Google Scholar]
- Barbulescu, A. Assessing Groundwater Vulnerability: DRASTIC and DRASTIC–Like Methods: A Review. Water 2020, 12, 1356. [Google Scholar] [CrossRef]
- Canora, F.; Muzzillo, R.; Sdao, F. Groundwater Vulnerability Assessment in the Metaponto Coastal Plain (Basilicata, Italy). Water 2022, 14, 1851. [Google Scholar] [CrossRef]
- Civita, M. The Combined Approach When Assessing and Mapping Groundwater Vulnerability to Contamination. J. Water Resour. Prot. 2010, 2, 14–28. [Google Scholar] [CrossRef]
- IAH. Guidebook on Mapping Groundwater Vulnerability, 1st ed.; Vrba, J., Zaporozec, A., Eds.; IAH, International Contributions to Hydrogeology, Verlag Heinz Heise: Hanover, Germany, 1994; Volume 16, 131p, ISBN 3-922705-97-9. [Google Scholar]
- Zaporozec, A.; Vrba, J. Classification and Review of Groundwater Vulnerability Maps. In Guidebook on Mapping Groundwater Vulnerability, 1st ed.; Vrba, J., Zaporozec, A., Eds.; IAH, International Contributions to Hydrogeology, Verlag Heinz Heise: Hanover, Germany, 1994; Volume 16, pp. 21–31. ISBN 3-922705-97-9. [Google Scholar]
- Zampetti, M. Informazioni e Dati Relativi alla Quantità ed alla Qualità delle Acque Sotterranee nella Comunità Europea. In Proceedings of the International Conference “Inquinamento delle Acque Sotterranee da Composti Organo–Clorurati di Origine Industriale”, Milano, Italy, 26–29 January 1983; Monduzzi: Bologna, Italy, 1983; pp. 197–204. (In Italian). [Google Scholar]
- Fried, J.J. Groundwater Contamination: Use of Models in Decision–Making. In Proceedings of the Seminar on Modelling for Water Management, European Institute for Water, Como, Italy, 21–22 May 1987; Springer: Dordrecht, The Netherlands, 1989. [Google Scholar]
- Marcolongo, B.; Pretto, L. Vulnerabilità degli Acquiferi nella Pianura a Nord di Vincenza (Italy); G.N.D.C.I.—C.N.R., Ed.; Grafiche Erredieci: Padova, Italy, 1987; Volume 28, 13p. (In Italian) [Google Scholar]
- Aller, L.; Thornhill, J. DRASTIC: A Standardized System for Evaluating Ground Water Pollution Potential Using Hydrogeologic Settings; Robert, S., Kerr Environmental Research Laboratory, Office of Research and Development, Eds.; EPA: Washington, DC, USA, 1987. [Google Scholar]
- Trojan, M.D.; Perry, J.A. Assessing Hydrogeologic Risk over Large Geographic Areas; Minnesota Agricultural Experiment Station, Ed.; University of Minnesota: Minneapolis, MN, USA, 1988; Bulletin 585; 65p, Available online: https://hdl.handle.net/11299/139535 (accessed on 12 January 2024).
- Civita, M.; De Regibus, C. Sperimentazione di Alcune Metodologie per la Valutazione della Vulnerabilita degli Aquiferi. Quad. Geol. Appl. 1995, 3, 63–72. (In Italian) [Google Scholar]
- Civita, M. Legenda Unificata per le Carte Della Vulnerabilita’ dei Corpi Idrici Sotterranei—Studi sulla Vulnerabilita’ degli Acquiferi, 1; Pitagora: Bologna, Italy, 1990. (In Italian) [Google Scholar]
- Kumar, P.; Bansod, B.K.; Debnath, S.; Thakur, P.K.; Ghanshyam, C. Index–Based Groundwater Vulnerability Mapping Models Using Hydrogeological Settings: A Critical Evaluation. Environ. Impact Assess. Rev. 2015, 51, 38–49. [Google Scholar] [CrossRef]
- Neshat, A.; Pradhan, B.; Pirastehm, S.; Shafri, H.Z.M. Estimating Groundwater Vulnerability to Pollution Using a Modified DRASTIC Model in Kerman Agricultural Area, Iran. Environ. Earth Sci. 2014, 71, 3119–3131. [Google Scholar] [CrossRef]
- Pacheco, F.A.L.; Pires, L.M.G.R.; Santos, R.M.B.; Sanches Fernandes, L.F. Factor Weighting in DRASTIC Modeling. Sci. Total Environ. 2015, 505, 474–486. [Google Scholar] [CrossRef] [PubMed]
- Pisciotta, A.; Cusimano, G.; Favara, R. Groundwater Nitrate Risk Assessment Using Intrinsic Vulnerability Methods: A Comparative Study of Environmental Impact by Intensive Farming in the Mediterranean Region of Sicily, Italy. J. Geochem. Explor. 2015, 156, 89–100. [Google Scholar] [CrossRef]
- Awawdeh, M.; Al–Kharabsheh, N.; Obeidat, M.; Awawdeh, M. Groundwater Vulnerability Assessment Using Modified SINTACS Model in Wadi Shueib, Jordan. Ann. GIS 2020, 26, 377–394. [Google Scholar] [CrossRef]
- Gogu, R.; Dassargues, A. Current Trends and Future Challenges in Groundwater Vulnerability Assessment Using Overlay and Index Methods. Environ. Geol. 2000, 39, 549–559. [Google Scholar] [CrossRef]
- Lodwick, W.A.; Monson, W.; Svoboda, L. Attribute Error and Sensitivity Analysis of Map Operations in Geographical Information Systems: Suitability Analysis. Int. J. Geograph. Inf. Syst. 1990, 4, 413–428. [Google Scholar] [CrossRef]
- Napolitano, P.; Fabbri, A.G. Single Parameter Sensitivity Analysis for Aquifer Vulnerability Assessment Using DRASTIC and SINTACS. In HydroGIS 96: Application of GIS in Hydrology and Water Resources Management; IAHS: Vienna, Austria, 1996; pp. 559–566. [Google Scholar]
- Stumpp, C.; Zurek, A.; Gargini, A.; Gemitzi, A.; Filippini, M.F.; Witczak, S. A Decision Tree Tool Supporting the Assessment of Groundwater Vulnerability. Environ. Earth Sci. 2016, 75, 1057. [Google Scholar] [CrossRef]
- Civita, M. Data Needs and Presentation. In Guidebook on Mapping Groundwater Vulnerability, 1st ed.; Vrba, J., Zaporozec, A., Eds.; IAH, Internat. Contributions to Hydrogeology, Heise: Hanover, Germany, 1994; Volume 16, pp. 57–75. ISBN 3-922705-97-9. [Google Scholar]
- De Maio, M.; Civita, M.; Farina, M.; Zavatti, A. Le Metodologie. In Linee–Guida per la Redazione e l’Uso delle Carte della Vulnerabilità degli Acquiferi all’Inquinamento; ANPA: Roma, Italia, 2001; pp. 15–49. Available online: https://www.isprambiente.gov.it/contentfiles/00003500/3532-manuali-2001-04.pdf/ (accessed on 27 March 2024). (In Italian)
- Civita, M.; De Maio, M. Il Modello SINTACS. In Un Sistema Parametrico per la Valutazione e la Cartografia della Vulnerabilità degli Acquiferi all’Inquinamento. Metodologia e Automazione, Quaderni di Tecniche di Protezione Ambientale; Pitagora: Bologna, Italy, 1997; pp. 7–43. ISBN 9788837108991. (In Italian) [Google Scholar]
- ESRI, Inc. Available online: https://www.esri.com/en-us/arcgis/about-arcgis (accessed on 21 March 2024).
- Devak, M.; Dhanya, C.T. Sensitivity Analysis of Hydrological Models: Review and Way Forward. J. Water Clim. Change 2017, 8, 557–575. [Google Scholar] [CrossRef]
- Said, S.; Bouri, S.; Ben Dhia, H. Sensitivity Analysis in Groundwater Vulnerability Assessment Based on GIS in the Mahdia–Ksour Essaf Aquifer, Tunisia: A Validation Study. Hydrol. Sci. J. 2011, 56, 288–304. [Google Scholar] [CrossRef]
- Majandang, J.; Sarapirome, S. Groundwater Vulnerability Assessment and Sensitivity Analysis in Nong Rua, Khon Kaen, Thailand, Using a GIS–based SINTACS Model. Environ. Earth Sci. 2013, 68, 2025–2039. [Google Scholar] [CrossRef]
- Männik, M.; Karro, E. Application of Modified DRASTIC Method for the Assessment and Validation of Confined Aquifer Vulnerability in Areas with Diverse Quaternary Deposits. Water 2023, 15, 3585. [Google Scholar] [CrossRef]
- Marsico, A.; Giuliano, G.; Pennetta, L.; Vurro, M. Intrinsic Vulnerability Assessment of the South–Eastern Murge (Apulia, Southern Italy). Nat. Hazards Earth Syst. Sci. 2004, 4, 769–774. [Google Scholar] [CrossRef]
- Berkhoff, K. Hydrology and Earth System Sciences Spatially Explicit Groundwater Vulnerability Assessment to Support the Implementation of the Water Framework Directive—A Practical Approach with Stakeholders. Hydrol. Earth Syst. 2008, 12, 111–122. [Google Scholar] [CrossRef]
- Dakoli, H. Hydro geochemistry. In Hydrogeology, 1st ed.; Maluka: Tirana, Albania, 2007; pp. 111–175. (In Albanian) [Google Scholar]
- Bancheri, M.; Basile, A.; Botta, M.; Langella, G.; Cavaliere, F.; Bonfante, A.; Ferraro, G.; Acutis, M.; Perego, A. The Nitrate Fate Tool: A Decision Support System for the Assessment of the Groundwater Vulnerability to Nitrate in Support of Sustainable Development Goals. Sustainability 2023, 15, 14164. [Google Scholar] [CrossRef]
- Gelaj, A.; Marku, S.; Puca, N. Evaluation and Monitoring of Groundwater in Albania. Bul. Shk. Gjeol. 2014, 2, 117–120. (In Albanian) [Google Scholar]
- Kurwadkar, S. Groundwater Pollution and Vulnerability Assessment. Water Environ. Res. 2017, 89, 1561–1577. [Google Scholar] [CrossRef]
- National Environment Agency. State of Environment Reports for 2015–2022 Years; NEA: Tirana, Albania, 2023. Available online: https://akm.gov.al/raporte-dhe-publikime/ (accessed on 20 March 2024). (In Albanian)
- Turc, L. Le bilan d’Eau des Sols: Relation Entre les Précipitations, l’Evaporation et l’Ecoulement. Journées L’hydraulique 1955, 3, 36–44. Available online: https://www.persee.fr/doc/jhydr_0000-0001_1955_act_3_1_3278 (accessed on 25 March 2024). (In French).
- Albanian Geological Survey. Hydrogeological Settings of the Albanian Territory. In Text of the Geotechnical Map of Albania, Scale 1:200,000; Albanian Geological Survey: Tirana, Albania, 2014; pp. 152–185. (In Albanian) [Google Scholar]
- Albanian Geological Survey (AGS). Geotechnical Map of Albania, Scale 1:200,000; AGS: Tirana, Albania, 2014. (In Albanian) [Google Scholar]
- Albanian Geological Survey. Geotechnical Conditions and Geological Risks of Tirana County Territory. In Georesources and Geological Risks of Tirana County; Albanian Geological Survey: Tirana, Albania, 2014; pp. 65–85. (In Albanian) [Google Scholar]
- Albanian Geological Survey. Geotechnical Map of Tirana County Territory. Scale 1:100,000. In Georesources and Geological Risks of Tirana County; Albanian Geological Survey: Tirana, Albania, 2014. (In Albanian) [Google Scholar]
- Albanian Geological Survey. Geotechnical Conditions and Geological Risks of Durres County Territory. In Georesources and Geological Risks of Durres County; Albanian Geological Survey: Tirana, Albania, 2014; pp. 58–75. (In Albanian) [Google Scholar]
- Albanian Geological Survey. Geotechnical Map of Durres County Territory. Scale 1:100,000. In Georesources and Geological Risks of Durres County; Albanian Geological Survey: Tirana, Albania, 2014. (In Albanian) [Google Scholar]
- European Soil Bureau. Geo–Referenced Soil Database for Europe. Manual of Procedures, Version 1.1. Report No. 5, EUR 18092; European Soil Bureau: Luxembourg, 2001; 184p. [Google Scholar]
- IUSS Working Group WRB. World Reference Base for Soil Resources 2014, Update 2015. International Soil Classification System for Naming Soils and Creating Legends for Soil Maps. World Soil Resources Reports No. 106, 3rd ed.; FAO: Rome, Italy, 2015; ISBN 978-92-5-108369-7. Available online: https://www.fao.org/3/i3794en/I3794en.pdf (accessed on 22 January 2024).
- IUSS Working Group WRB. Soil Particle-Size and Texture Classes. Annex 4. In World Reference Base for Soil Resources 2014, International Soil Classification System for Naming Soils and Creating Legends for Soil Maps; World Soil Resources Reports No. 106; FAO: Rome, Italy, 2015; p. 192. Available online: https://www.fao.org/3/i3794en/I3794en.pdf (accessed on 22 January 2024).
- Gjoka, F.; Cara, K. Soils of Albania, 1st ed.; Agrotext: Tirana, Albania, 2003; 136p, ISBN 99927-839-6-6. (In Albanian) [Google Scholar]
- Kovaçi, V.; Bardhi, A.; Begu, E.; Ymeti, I. Risk from Erosion Assessment on the Albanian Territory using GIS and Corine Land Cover Map; IGEO: Tirana, Albania, 2014; Available online: https://www.geo.edu.al (accessed on 23 February 2014). (In Albanian)
- Gjoka, F. Geography of Soils, 2nd ed.; Mediaprint: Tirana, Albania, 2021; ISBN 978-9928-08-501-6. (In Albanian) [Google Scholar]
- Zdruli, P.; Lushaj, S. The status of Soil Survey in Albania and Some of Its Major Environmental Findings. In Soil Resources of Southern and Eastern Mediterranean Countries; Zdruli, P., Steduto, P., Lacirignola, C., Montanarella, L., Eds.; CIHEAM: Bari, Italy, 2001; Volume 34, pp. 69–89. [Google Scholar]
- Zdruli, P.; Lushaj, S.; Pezzuto, A.; Fanelli, D.; D’Amico, O.; Filomeno, O.; De Santis, S.; Todorovic, M.; Nerilli, E.; Dedaj, K.; et al. Preparing a Georeferenced Soil Database for Albania at 1:250,000 Scale Using the European Soil Bureau Manual of Procedures 1.1. In Proceedings of the Selected Papers—7th International Meeting on Soils with Mediterranean Type of Climate, Valenzano, Italy, 23–28 September 2001; pp. 135–144. Available online: http://om.ciheam.org/om/pdf/a50/04002027.pdf (accessed on 19 April 2024).
- Zdruli, P.; Pezzuto, A.; Fanelli, D.; D’Amico, O.; Filomeno, O.; De Santis, S.; Dedaj, K.; Seferi, B. Soil Map of Albania at 1: 250,000 Scale; Mediterranean Agronomic Institute of Bari (Italy), Soil Science Institute (Albania), Eds.; CIHEAM: Bari, Italy, 2001. [Google Scholar]
- Zdruli, P.; Pezzuto, A.; Fanelli, D.; D’Amico, O.; Filomeno, O.; De Santis, S.; Dedaj, K.; Seferi, B. Soil Maps of Albania at 1: 50,000 Scale; Mediterranean Agronomic Instute of Bari (Italy), Soil Science Institute (Albania), Eds.; CIHEAM: Bari, Italy, 2003. [Google Scholar]
- Bonfanti, M.; Ducci, D.; Masetti, M.; Sellerino, M.; Stevenazzi, S. Using Statistical Analyses for Improving Rating Methods for Groundwater Vulnerability in Contamination Maps. Environ. Earth Sci. 2016, 75, 1003. [Google Scholar] [CrossRef]
- Hasiniaina, F.; Zhou, J.; Guoyi, L. Regional Assessment of Groundwater Vulnerability in Tamtsag Basin, Mongolia, Using Drastic Model. J. Am. Sci. 2010, 6, 65–78. [Google Scholar]
- Osmani, S.; Kotro, M.; Toromani, E.; Bode, A.; Bocari, A. A View on Stochastic Finite Element and Geostatistics for Resource Parameters Estimation. Open J. Mod. Hydrol. 2013, 3, 89–96. [Google Scholar] [CrossRef]
- Albanian Government. Government Decree 379/2016 on the Approval of the Drinking Water Quality Standards. Off. J. 2016, 95, 5374–5406. (In Albanian) [Google Scholar]
- European Union. EU Directive 98/83/EC on the Quality of Water Intended for Human Consumption; EU Council: Brussels, Belgium, 1998; Available online: http://data.europa.eu/eli/dir/1998/83/oj (accessed on 8 April 2024).
- European Union. EU Directive 2020/2184 on the Quality of Water Intended for Human Consumption; EU Council: Brussels, Belgium, 2020; Available online: http://data.europa.eu/eli/dir/2020/2184/oj (accessed on 8 April 2024).
- Zhang, Q.Q.; Sun, J.C.; Liu, J.T.; Huang, G.X.; Lu, C.; Zhang, Y. Driving Mechanism and Sources of Groundwater Nitrate Contamination in the Rapidly Urbanized Region of South China. J. Contam. Hydrol. 2015, 182, 221–230. [Google Scholar] [CrossRef]
- Yang, C.; Wang, L.; Chen, S.; Yuanyin, L.; Shuang, H.; Qinghong, Z.; Yanbing, C. Nitrate Transport Velocity Data in the Global Unsaturated Zones. Sci. Data 2022, 9, 613. [Google Scholar] [CrossRef]
- Sun, D.; Yang, H.; Guan, D.; Yang, M.; Wu, J.; Yuan, F.; Jin, C.; Wang, A.; Zhang, Y. The effects of land use change on soil infiltration capacity in China: A meta-analysis. Sci. Total Environ. 2018, 626, 1394–1401. [Google Scholar] [CrossRef] [PubMed]
- Amobichukwu, C.A.; Obarein, O.A.; Mossa, J.; Lanhai, L.; Shamusideen, S.; Ayeni, F.; Olalekan, B.; Abiola, O.; Friday, U.O. Groundwater system and climate change: Present status and future considerations. J. Hydrol. 2020, 589, 125163. [Google Scholar] [CrossRef]
- Davamani, V.; John, J.E.; Poornachandhra, C.; Gopalakrishnan, B.; Arulmani, S.; Parameswari, E.; Santhosh, A.; Srinivasulu, A.; Lal, A.; Naidu, R. A Critical Review of Climate Change Impacts on Groundwater Resources: A Focus on the Current Status, Future Possibilities, and Role of Simulation Models. Atmosphere 2024, 15, 122. [Google Scholar] [CrossRef]
- Albanian Ministry of Environment. Third National Communication on Climate Change; MoE: Tirana, Albania, 2016; Available online: https://www.undp.org/albania/publications/third-national-communication-united-nations-framework-convention-climate-change (accessed on 6 July 2024).
Disclaimer/Publisher’s Note: The statements, opinions and data contained in all publications are solely those of the individual author(s) and contributor(s) and not of MDPI and/or the editor(s). MDPI and/or the editor(s) disclaim responsibility for any injury to people or property resulting from any ideas, methods, instructions or products referred to in the content. |
© 2024 by the authors. Licensee MDPI, Basel, Switzerland. This article is an open access article distributed under the terms and conditions of the Creative Commons Attribution (CC BY) license (https://creativecommons.org/licenses/by/4.0/).