Article

Assessing the Efficiency of Rainstorm Drainage Networks Using Different Arrangements of Grate Inlets

1
Department of Water and Water Structures Engineering, Faculty of Engineering, Zagazig University, Zagazig 44519, Egypt
2
Ministry of Water Resources and Irrigation, Sharkia 44519, Egypt
3
Institute of Sustainable and Circular Construction, Faculty of Civil Engineering, Technical University of Kosice, 040 01 Košice, Slovakia
4
Department of Hydraulics and Hydro Informatics, Tashkent Institute of Irrigation and Agricultural Mechanization Engineers, National Research University, St. Kori Niyazov House 39, Tashkent 100000, Uzbekistan
5
Department of Environmental Engineering, Faculty of Civil Engineering, Technical University of Kosice, 042 00 Kosice, Slovakia
6
AdMaS Research Centre, Faculty of Civil Engineering, Brno University of Technology, 61200 Brno, Czech Republic
7
Coastal Research Institute, National Water Research Center, Alexandria 21527, Egypt
*
Author to whom correspondence should be addressed.
Hydrology 2024, 11(2), 18; https://doi.org/10.3390/hydrology11020018
Submission received: 9 December 2023 / Revised: 18 January 2024 / Accepted: 24 January 2024 / Published: 31 January 2024

Abstract

:
Urban flooding is a problem faced by most countries because of climate change. Without storm drainage systems, negative impacts may occur, such as traffic problems and increasing groundwater levels, especially in lowlands. The implementation of storm drainage networks and their fittings in poor countries is affecting their economic development. Therefore, improving the efficiency of the storm drainage network is an important issue that should be considered. This paper aims to study the most appropriate position or arrangements of grate inlets to upgrade drainage efficiency at less cost. Different arrangements of grates were studied and their efficiency was determined. A comparison between the total grate’s efficiency was conducted and the best arrangement was selected. Additionally, a dimensional analysis equation was developed to determine the total efficiency of the system. Finally, the FLOW-3D program was used to simulate the laboratory results using different discharges and numbers of inlets. The error of calculation ranged between 5% and 8%. Therefore, the results indicated that this program is a powerful tool for predicting the discharge efficiency and velocity direction for large discharges. A comparison was made between this study and previous studies. The results indicated that the same trend existed. A new equation was developed to correlate discharge efficiency (E) with relative total discharge Q and number of inlets. The equation can be used by planning engineers to conduct initial planning of storm drainage layout systems and achieve cost saving.

1. Introduction

The climatic change over the past century has resulted in increasing temperatures, intensity of rain, snow melting, and consequent flooding and torrents. The resulting runoff does not drain quickly and leads to flooding of roads and residential areas. Storm drain systems are designed to discharge the flow from rainfall events away from roadways. Problems associated with flooded roads include negative impacts on natural life, damage to roads, houses, and underground lines, water pollution, diseases resulting from stagnant water, increased maintenance and construction costs, and disruption of traffic movement.
Larson (1948) [1] investigated several grated inlets using hydraulic capacity tests and debris tests. He tested conventional grates with both parallel and transverse bars, and also examined grates with transverse bars angled at 45° to the curb. The intended purpose of the angled bars was to develop a component of velocity along the transverse bars to aid in removing debris from the bars. Debris tests performed as part of Larson’s work showed that the inclined bars were not particularly effective at removing debris from the grate or preventing the grate from capturing debris. Bob et al. (1971) [2] studied the effect of increasing the minimum rates of the pavement cross-section slope. They recommended the range of cross slopes (1/96 to 1/32) to be used on high-speed rural ways. A higher cross slope of 1/4 in/ft or more should be favored in areas with greater potential for wet weather because it reduces the water depth on pavements for a given rainfall intensity and helps in providing drainage of low areas and depressions, which tend to lower the effectiveness of the built-in cross slope. Steeper cross slopes will be more effective against ponding and subsequently long wet-pavement exposure times.
Govindaraju et al. (1990) [3] utilized the simplified shallow water wave equation to analytically examine the overland flow under a uniform rainfall event. Chezy’s roughness coefficient was used to determine the profile of water flow by considering separately the kinematic wave equation and the diffusion wave equation. Jiang (2007) [4] investigated the performance of inlets for lower values of longitudinal and cross-section slopes. He used numerical modeling simulation software (FLOW-3D) (Flow Science Inc. 2005) to examine the efficiency of the drainage inlets under different geometric settings of various longitudinal grades and cross slopes. He investigated a linear relationship between the cross slope of the channel and the intercepted flow at varying longitudinal slopes using a type of curb opening inlet. As a result, corresponding linear equations were developed by considering the results of the simulation model. Fang et al. (2010) [5] developed models to simulate unsteady free water surface shallow flow through curb-opening inlets by utilizing three-dimensional computational fluid dynamics (CFD) software, FLOW-3D. FLOW-3D simulations were extended to smaller cross slopes for which laboratory tests were not conducted but which can occur in a highway transition. Kurel et al. (2008) [6] proposed a runoff analysis method for land surface area based on morphological and geological properties. This method was applied to several urban catchments to evaluate the effects of urbanization on runoff. The results indicated that the concentration time of flood in the urban area is very short.
Abd-Elhamid et al. (2020) [7] assessed the effect of changing runoff coefficient due to urban growth on the design of storm water drainage system. Hydrological models, Hyfran, Storm CAD, and GIS were used to analyze different scenarios of runoff coefficient. The study was applied to three zones at Dammam, KSA. The results showed that increasing runoff coefficient due to urban growth increased outfall discharge, velocity of the storm water drainage system, and cost of construction, and decreased lag time. The cost increased by 2 to 3 times with increasing urbanization.
Gómez et al. (2010) [8] studied the modern planning of urban drainage systems, to satisfy the danger standard for walkers and vehicles. Mathematical models and experimental studies were used to advance an accurate description of the main characteristics of flow over roads. The surface hydraulic behavior of urban catchments during storm events was studied. According to this study, a numerical application for flood hazard assessment in a street of Barcelona was shown. Rubinato et al. (2011) [9] studied the drainage efficiency of six manholes that were connected to each other by five circular pipes with different sizes. The pipe diameter of the sewer system was 7.5 cm and the diameter pipe of the combined sewer overflow was 10 cm. The entrance discharge independently varied in each inlet in real time and this enabled the simulation of a variety of rainfall events. The measured data were used to gain awareness of the system status; for example, alarms may be raised when the water level in the manhole exceeds a certain threshold. The study concluded that manhole 2, manhole 5, and the central pipe are the most critical in terms of flooding.
Rokade et al. (2012) [10] concluded that the drainage design has been based on the flow of water through pavements and the drainage of pavement layers can be represented with saturated flow assumptions. He found that effects of water can be reduced by preventing the water from entering the pavement, providing suitable drainage to remove infiltration, or ensuring the pavement construction was strong enough to resist the effect of water. The pavement service life can be increased by 50% if the infiltrated water can be drained without delay. Similarly, pavement systems incorporating good drainage can be expected to have a design life of two to three times that of undrained pavement sections.
Ping-Cheng et al. (2012) [11] studied the problems of highways’ permeable pavements. The surface profiles of flow are related to the rainfall excess, cross slope and width of the road, and the material and structure of the pavement. The flow profiles were found via the continuity equation and, due to the water depth not being obtained, a numerical method was employed. The pavement permeability and critical permeability parameters were discussed. Another explanation of water depth safety was provided for vehicles running on a permeable pavement of a highway. The results need to be verified by experiment, but due to the high cost, this has not been executed yet. Haghighi (2013) [12] found that the steep areas designed based on the topography of the drainage networks are typically cost-effective. However, in flat areas such as cities (Chicago), there are not only efficient and optimized networks in terms of drainage time or construction cost, but also inefficient and highly sinuous networks.
Dipanjan (2014) [13] concluded that proper drainage is a very important consideration in the design of a highway, by studying the problems of water logging on a highway surface drainage system. The study also found that adverse roadway elements contributing to highway accidents were substandard roadway alignment or geometry, lack of shoulders and shoulder defects, serious allocation deficiencies along the route, haphazard bus stops, which were causes of the water logging problem in highways. Getachew et al. (2015) [14] studied the effect of urban road surface drainage using a case study of the town of Ginjo Guduru Kebele of Jimma, Ethiopia. The study found that the road surface drainage of the study area was inadequate due to insufficient road profile, insufficient drainage structure provision, improper maintenance, and lack of proper interconnection between the road and drainage infrastructures, thereby resulting in damages to road surfacing material and flooding problems in the area.
Magdi (2016) [15] studied the problem of road surface drainage in Khartoum state, Sudan. The study found that the drainage problem was highly compounded in Khartoum state because of an inadequate drainage system, thereby resulting in damage to pavements and leading to an unhealthy environment and poor drainage conditions, especially during rainy seasons, which forced the water to enter the pavement from the sides as well as from the top surface. The most common causes of road drainage problems were found to be related to improper road geometry, insufficient capacity of drainage structures, poor construction, and lack of proper maintenance.
Min-Cheng (2018) [16] used analysis of data and visual observations to study the effect of partial clogging in a distribution pipe system and partially submerging the entrance of the distribution pipe. He also examined the impact of partial clogging on orifice performance of the distribution pipe by plotting the flow rate vs. the mean driving head and the effective pipe length. The result indicated that the partial clogging did not have any detrimental effect on the overflow generating characteristics of this system. The study did not assess the grate distribution or density along the road length.
This study aims to investigate experimentally and numerically the hydraulic efficiency of storm drainage network systems due to rearrangement of inlets through road length. For laboratory work, the effect of increasing the number of inlets (inlet intensity along the flume) was studied via two scenarios to select the optimal arrangement of inlets by decreasing the number of inlets, with high efficiency and minimum cost. Different flow rates were used from 1.00 L/s to 6.00 L/s and the inlet number gradually increased from one to six. In the second step, the FLOW-3D program was used in the simulation for flow up to 10.00 L/S. In the final step, a comparison between the current study results and previous studies is discussed.

2. Materials and Methods

2.1. Dimensional Analysis

Dimensional analysis was used to correlate the system efficiency with other independent variables, using Buckingham theory. The variables involved in the phenomenon being studied are defined in Figure 1a,b. These variables are reduced to the dimensionless parameters defined by Equation (1) based on Buckingham theory.
E = ƒ(Lo, Wo, Ho, HI, Ao)
where
hI: Water depth at inlets upstream.Ho: relative flume water height = hd/hu,
hd: water depth at flume downstreamLo: relative grate length = LI/L,
I1, I2, I3, I4, I5, I6: refer to the inlet’s numberE: efficiency of discharge = qi/Q.
WI: the water spread width beside every inletg: gravitational acceleration
LI: the distance of each inlet’s position, measured from the start of the flumeW: the channel width,
L: the length of the flumeWo: relative inlet length = WI/W,
a I: area of inlet’s cross sectionHI: relative inlet water height = hI/hu,
Q: the total flume dischargeaf: area of flume
qi: flow intercepted by inletsAo: relative inlet area = aI/af,
hu: water depth at flume upstream.nI: number of inlets

2.2. Experimental Model

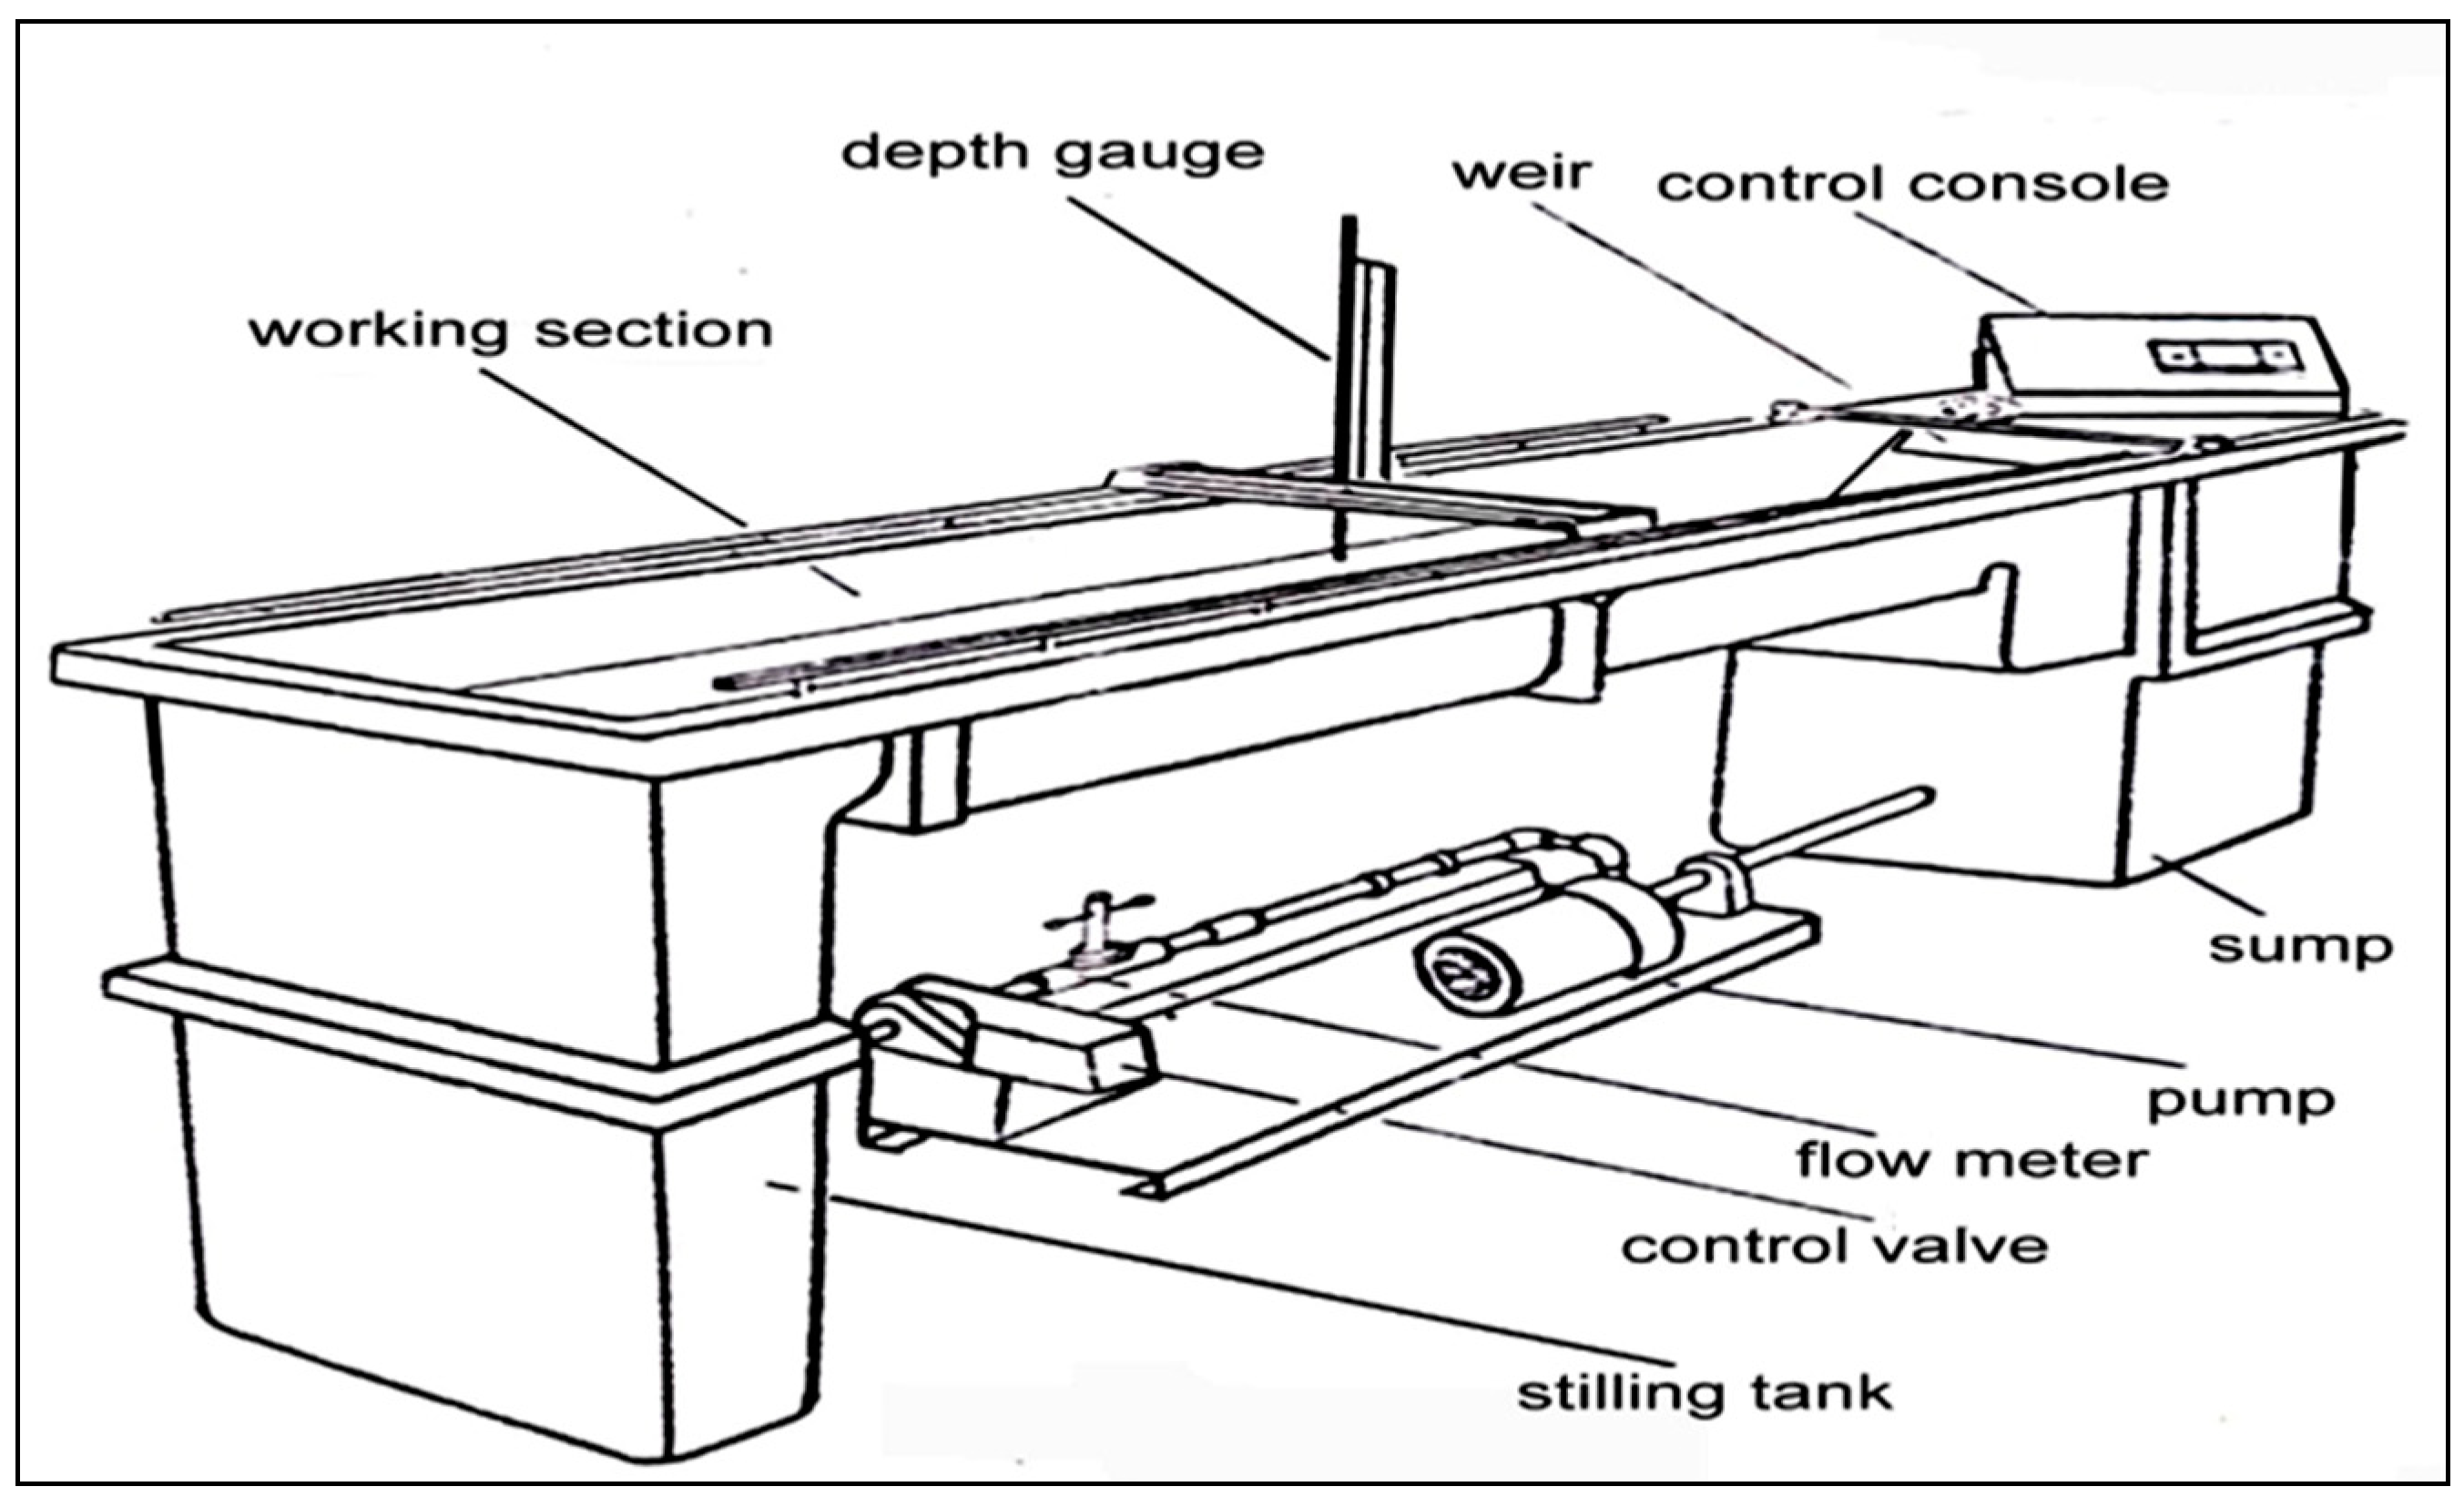
The experimental work was carried out in the hydraulics laboratory, Faculty of Engineering, Zagazig University. The experimental work was carried out in the period from April 2019 to August 2019. The definition sketch of the flume used in the current study can be seen in Figure 2.
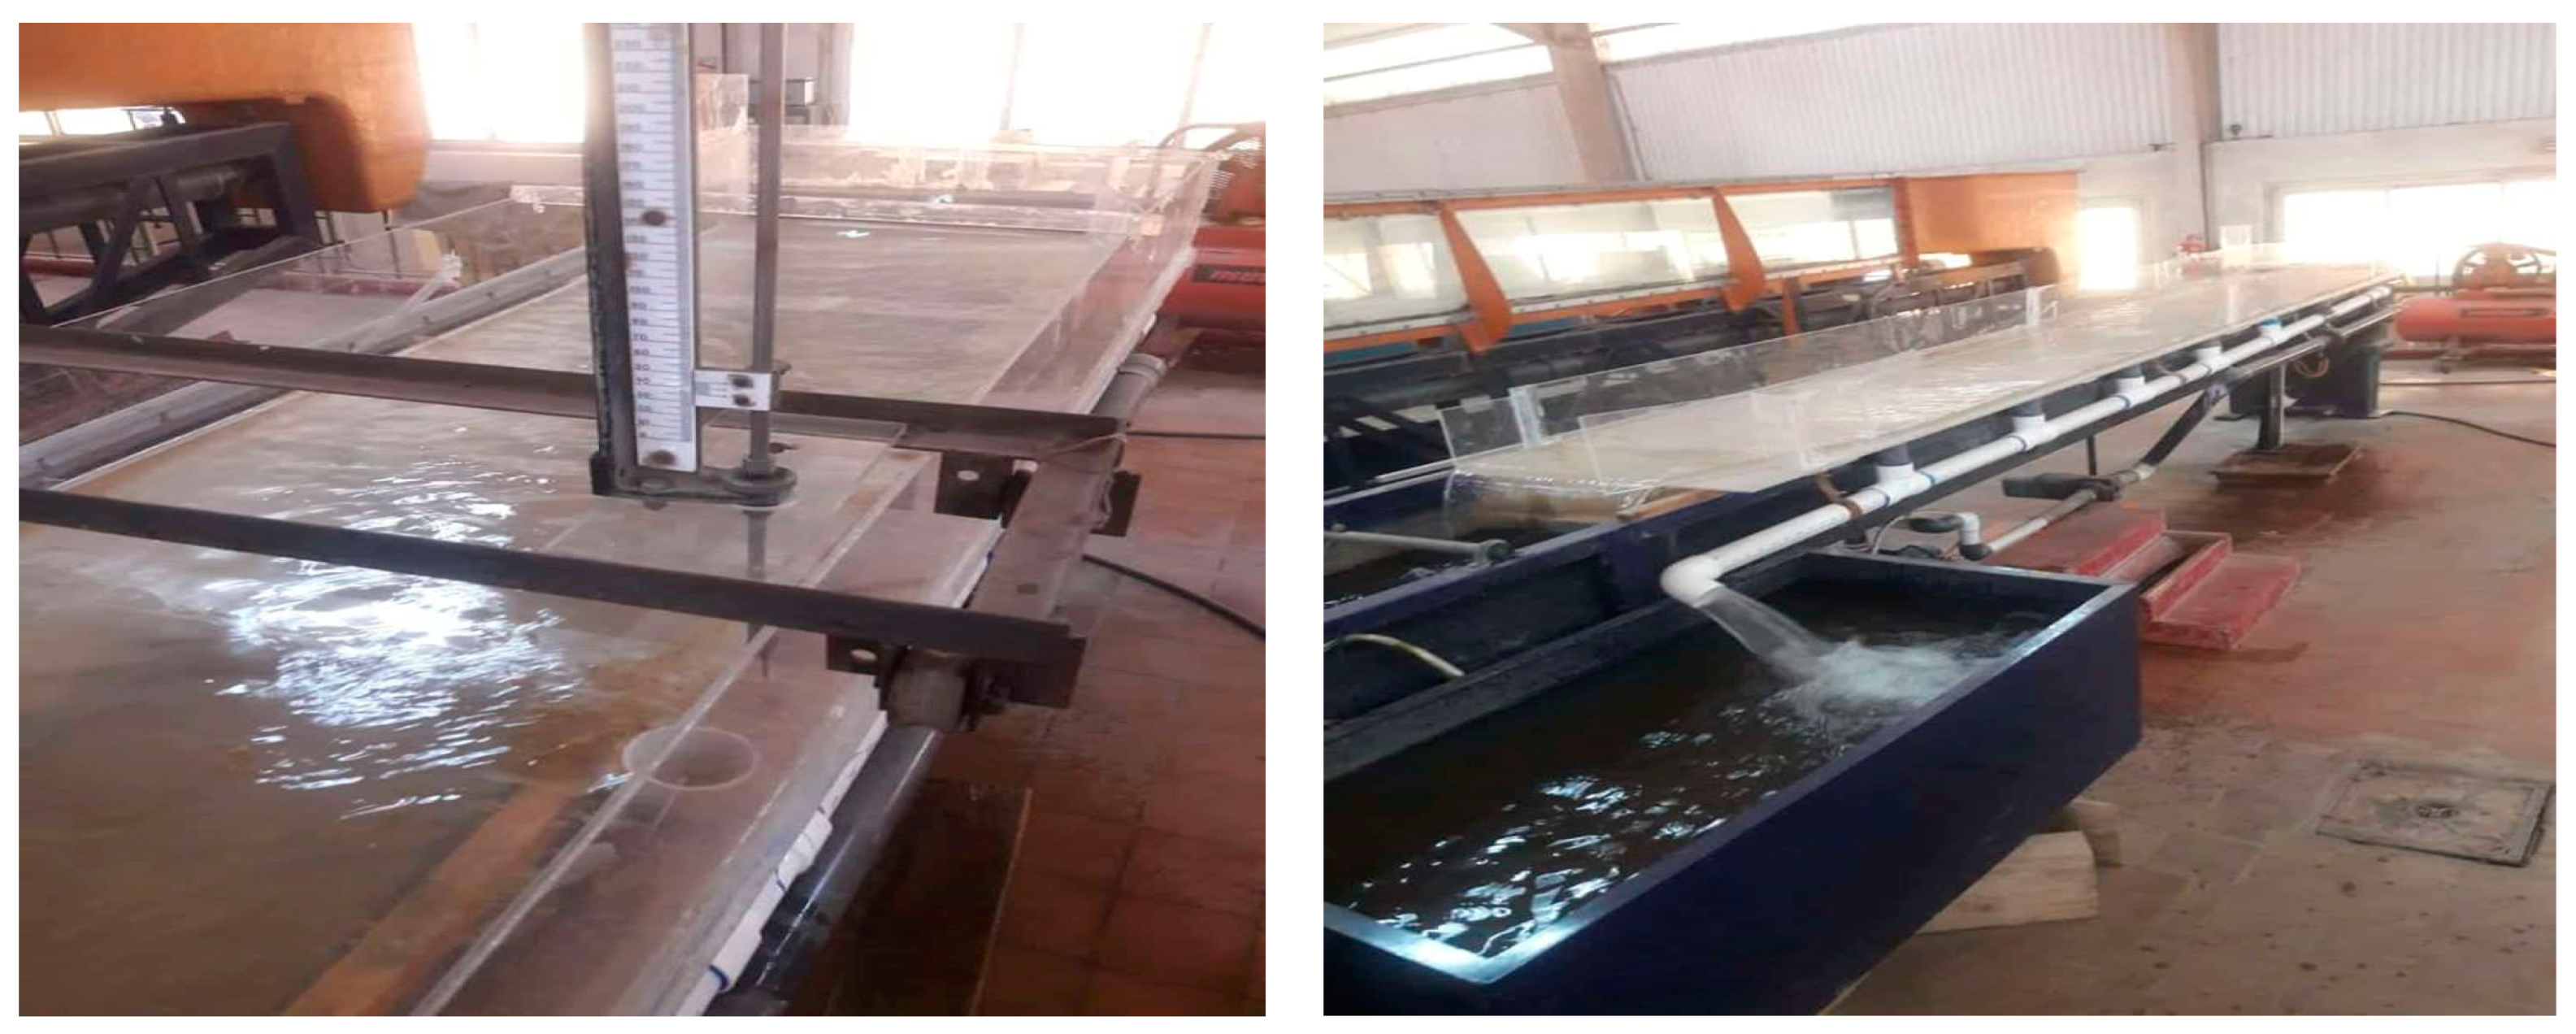
The flume is made from glass-reinforced plastic molding. The dimensions of this flume are 0.1 m depth, 6 m length, and 0.63 m width. The total discharge was measured using a pre-calibrated orifice meter. The point gauge was used for measuring the water levels as shown in Figure 3. There were six holes with a diameter of 5 cm at the bottom of the flume for a distance of 5.4 m. The holes are joined by a pipe with a 5 cm diameter through which discharge surface water is drained to a large tank with dimensions of 1.20 m, 0.60 m, and 0.60 m, as shown in Figure 3. Sixty runs were performed; each run took 30 min to adjust the total discharge through the flume. Experimental work was performed in three stages. The first stage measures the flume discharge and the discharge through the collecting pipe, and then calculates the efficiency of the network system. The second stage measures the upstream water depth of the flume and the water depth at each inlet, and then calculates the relative water depth. The final stage calculates the water spread width beside each inlet and the relative spread width by dividing it by the channel width.

2.3. Numerical Model (FLOW-3D)

The three-dimensional numerical model was developed using FLOW-3D. This program is used for numerous applications by incorporating a ‘Metaphysics’ environment (considering different types of fluids) especially suited for simulation of free surface flows. This program is a powerful tool that can be used for simulation of experimental work. Some of the data that are difficult to obtain from the practical work are obtained in terms of coordinates on the flume (x, y, z), as well as a representation of the direction of flow and velocity direction over the flume and inside the pipes.
The 3D Reynolds Averaged Navier Stokes (RANS) equations with a numerical scheme considering finite volumes were used to calculate the hydraulic properties. The flow domain was subdivided using Cartesian coordinates considering a 3D mesh composed of variable-sized hexahedral cells, with smaller dimensions in the inlet zone.
Several turbulence models, such as Prandtl mixing length, one equation, two equations (k–e), RNG, two equations (K–w), and LES (Large Eddy Simulation), were tested in order to achieve the best numerical accuracy. After a calibration between the physical and numerical model, the RNG model was chosen because it reached the steady flow in the tests. Additionally, the turbulence model RNG is recommended by [17,18,19].

3. Results and Discussion

The current study was conducted on three stages. In the first stage, the discharge efficiency of system was calculated using an experimental study in the laboratory for flow from 1.00 L/s to 6.00 L/s. In the second stage, the FLOW-3D program was used in the simulation for flow up to 10.00 L/S. In the final stage, a comparison between the current study results and previous studies is discussed.

3.1. Experimental Results

Rainfall discharge was studied above the road with a different number of inlets (from one to six inlets) at different discharge rates from 1.00 to 6.00 L/S. The different positions of inlets were studied to obtain the representative number and position of inlets with suitable distance and high efficiency.

3.1.1. Efficiency of the System

The effect of increasing the number of inlets (inlet intensity along the flume) was studied via two scenarios to select the optimal arrangement of inlets by decreasing the number of gates with high efficiency and minimum cost. Different flow rates were used from 1.00 to 6.00 L/s, and the inlets’ number of gates was gradually increased from one to six. In the first scenario, the inlet was arranged and increased sequentially with equal distance (54 cm) until it reached the end of the flume, as shown in Figure 4a. In the second scenario, the inlet was arranged and increased uniformly along the flume, as shown in Figure 4b.
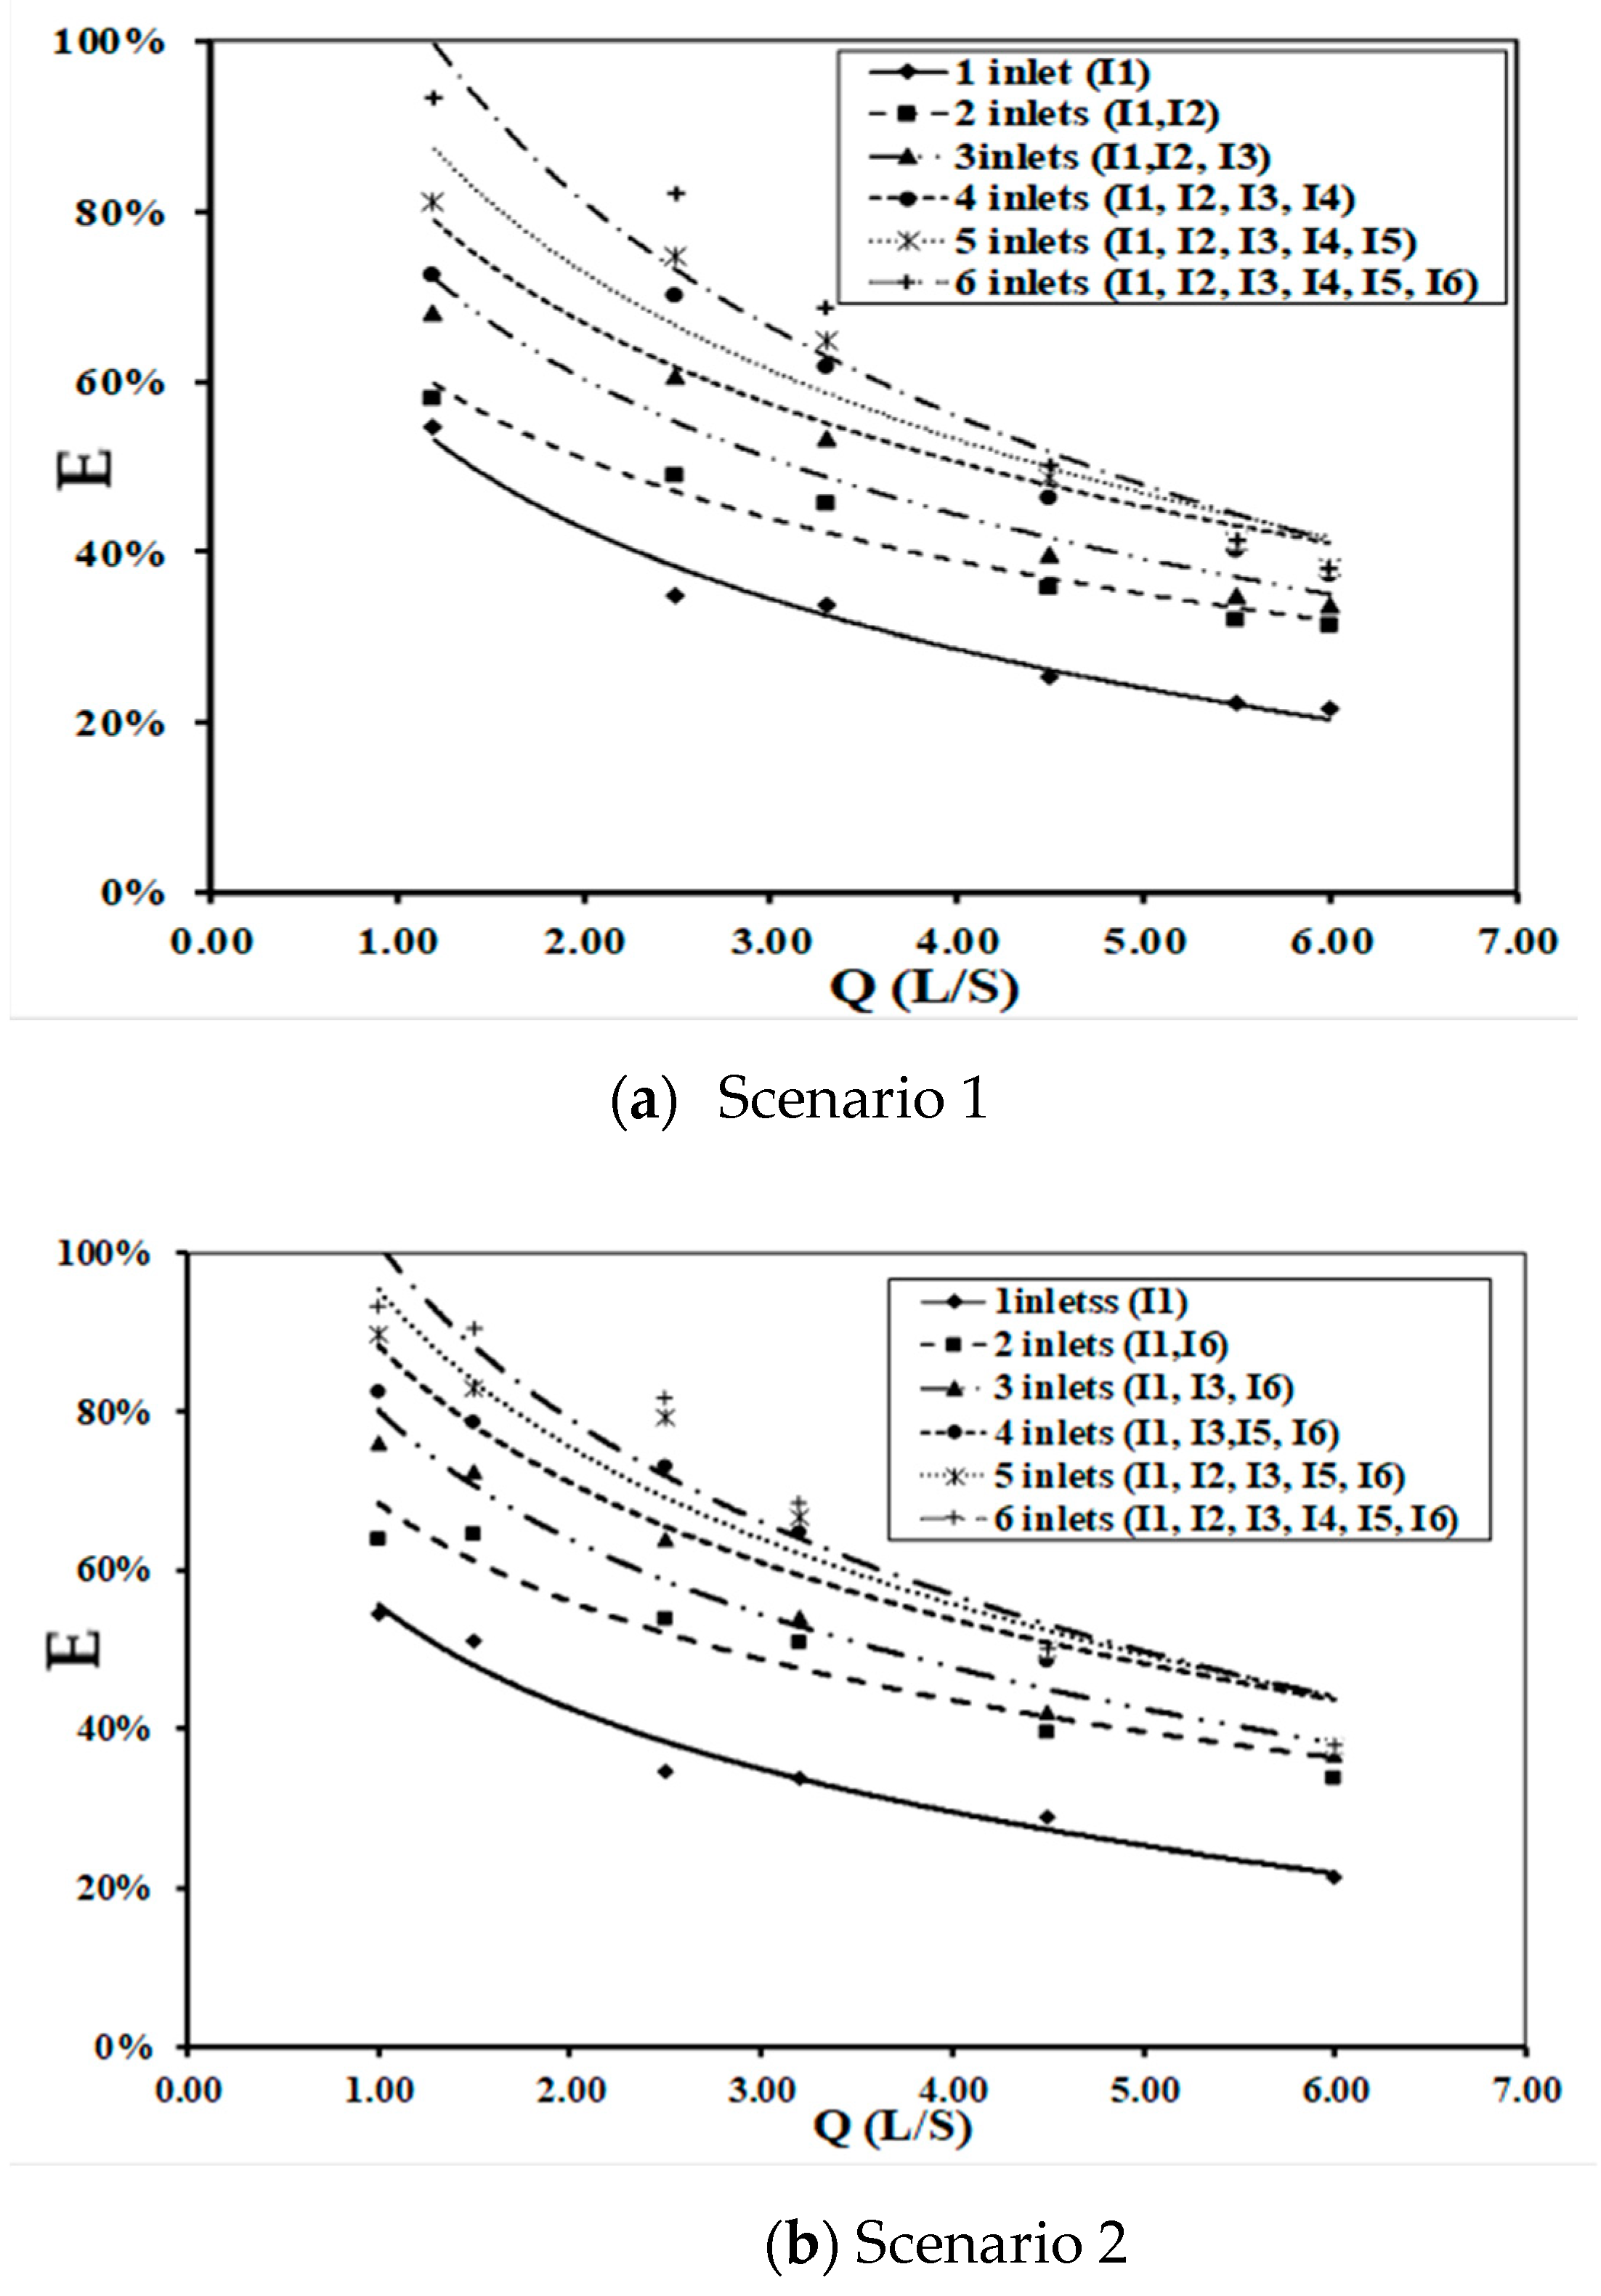
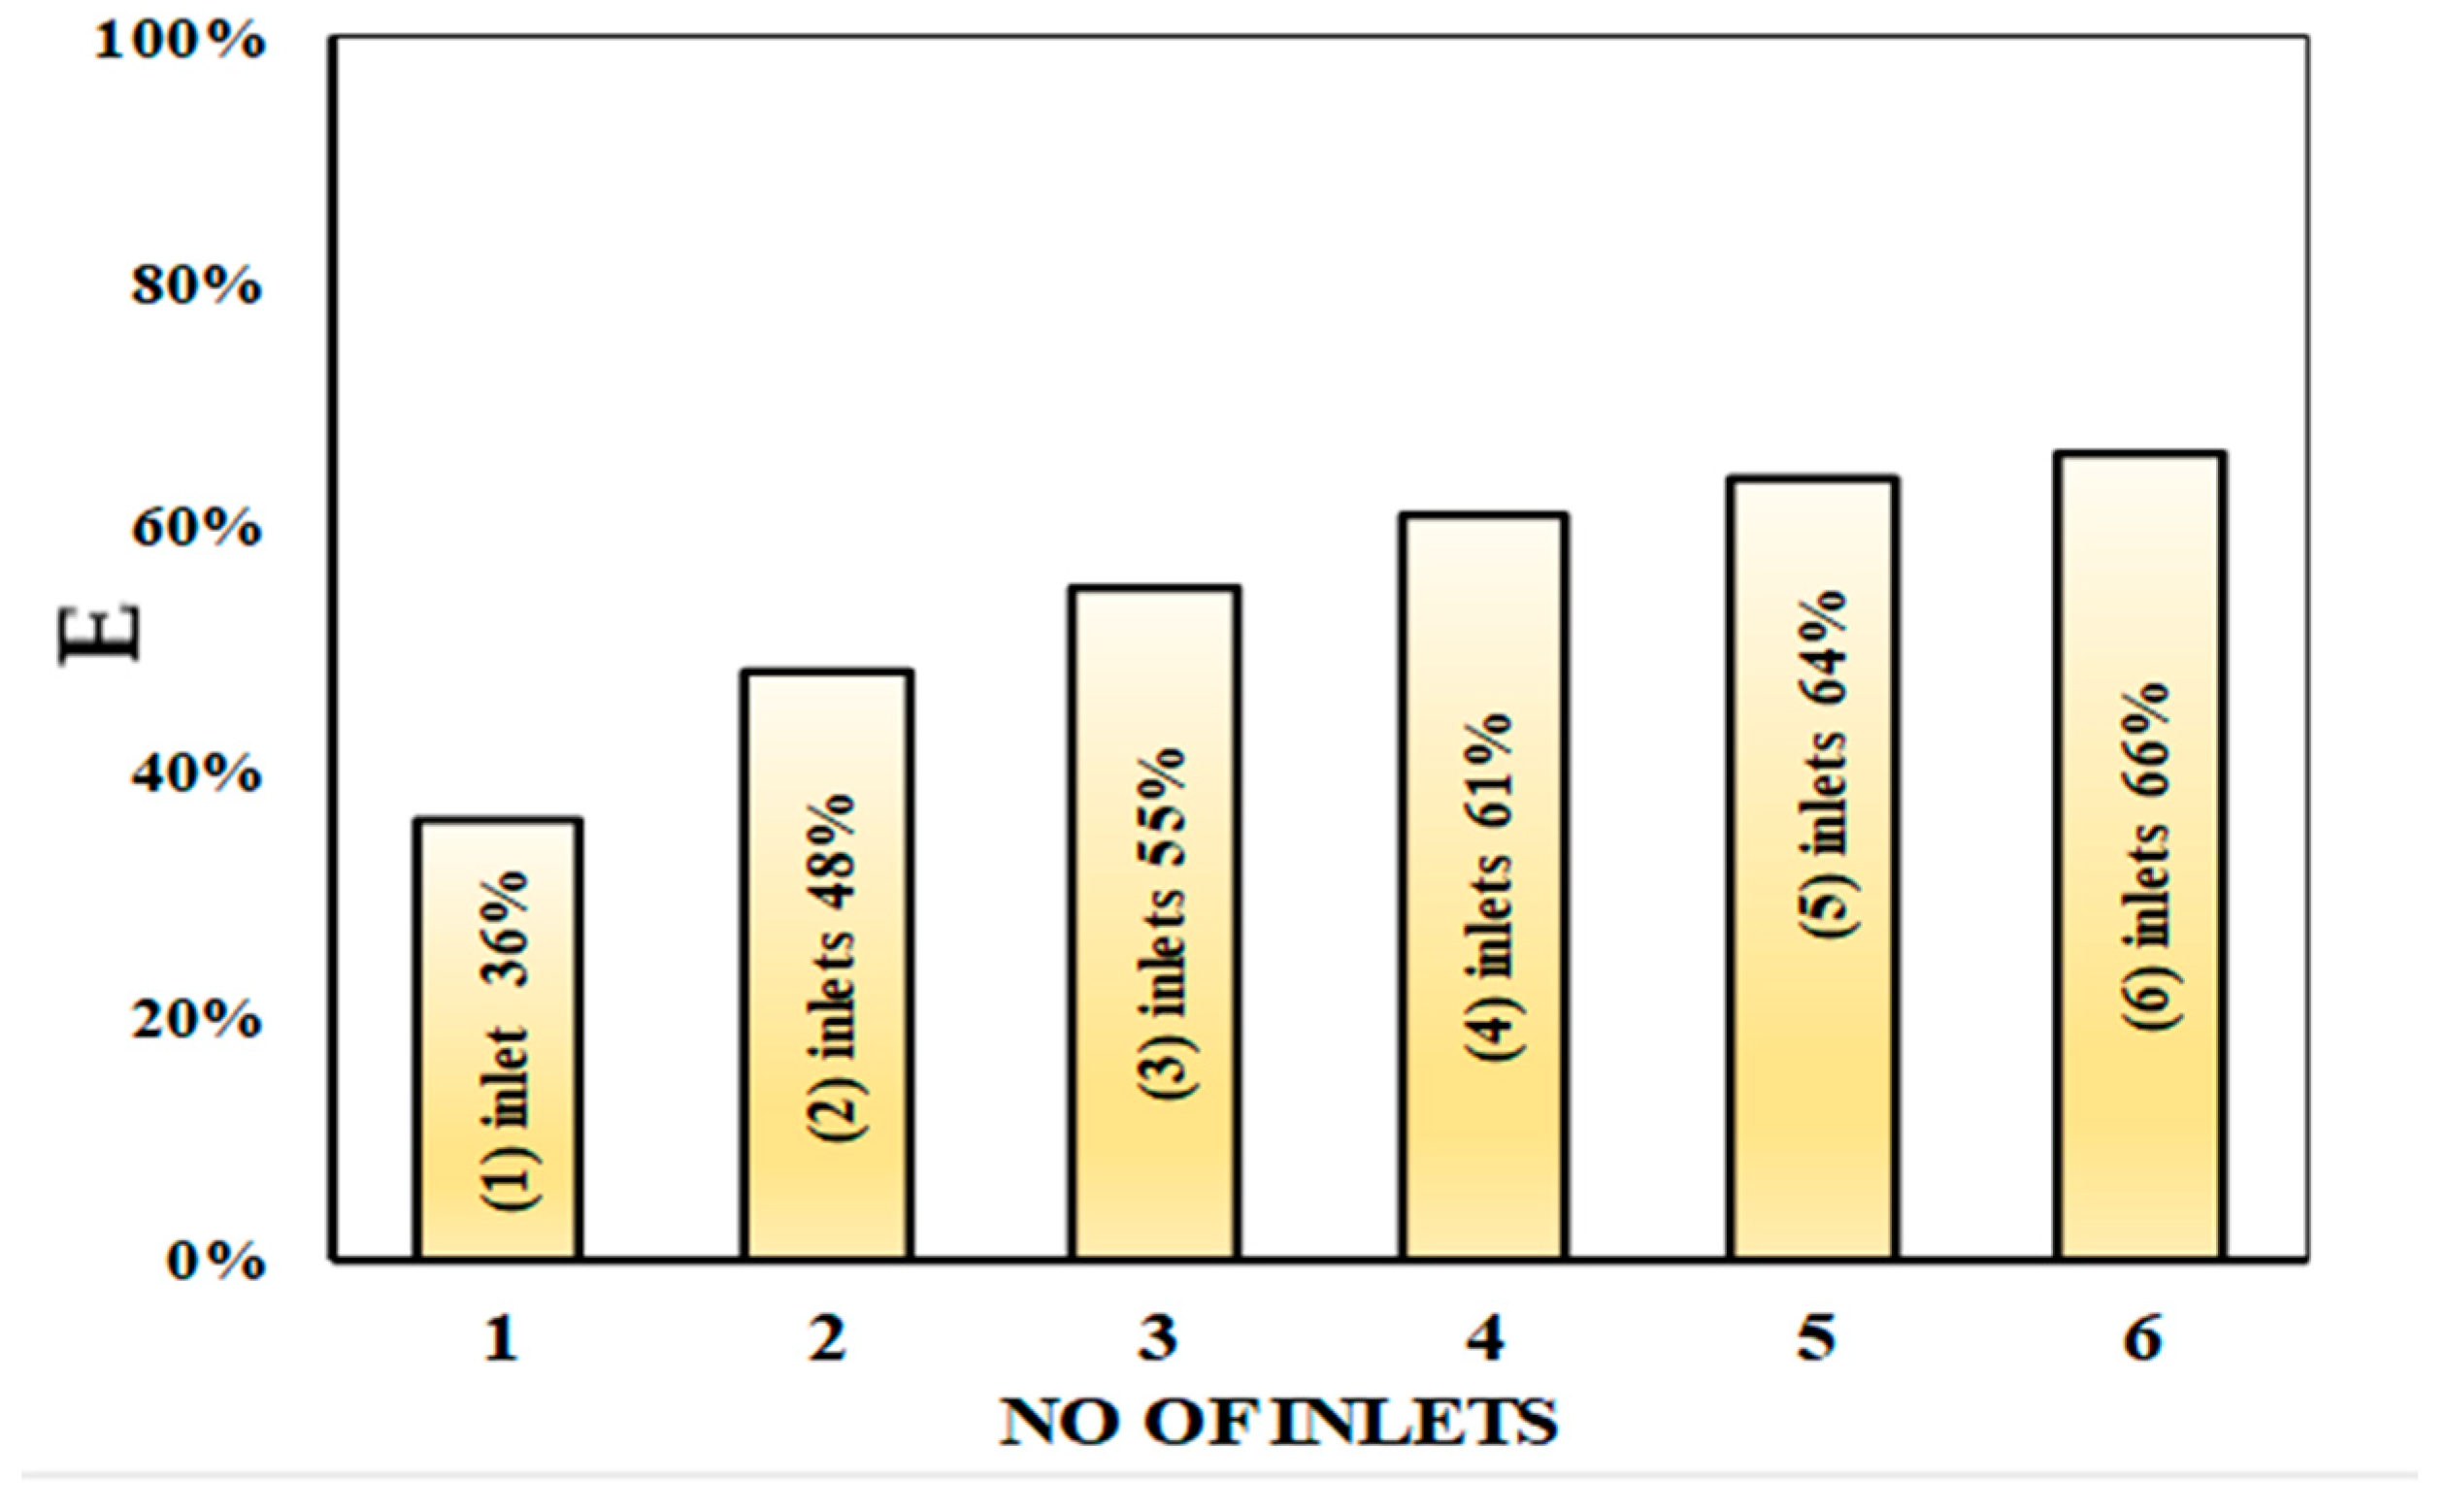
The results of discharge efficiency for different numbers of inlet gates with two different scenarios are shown in Figure 5a,b. It is noted that the efficiency of the system decreased as total discharge increased from 1.00 to 6.00 L/S. The efficiency increased by about 32.21% and 42.45% for the first and second scenarios, respectively. When the number of inlets increased from one to six, the efficiency of discharge increased by an average of 31%. Additionally, there was a slight increase in the efficiency when using four, five, and six inlets for discharge (4.50 L/S to 6.00 L/S) due to the flow exceeding the maximum ability of inlets’ harvesting. From the figure, it is noted that the efficiency of scenario two is better than the efficiency of scenario one by 4.5%, 4%, 3.6%, and 2.9% when using two, three, four, and five inlets respectively. Additionally, for scenario 2 the average efficiency of using six inlets is shown in Figure 6 and the efficiency difference between inlets is listed in Table 1. It can be noted that the efficiency of using six inlets is greater than the efficiency of using five and four inlets by 2.0 and 5.00, respectively, which is considered a minor increase. Therefore, we recommend using four inlets instead of six inlets to decrease the cost.

3.1.2. Effect of Inlet Arrangements on Water Surface Profile

Relative Water Depth

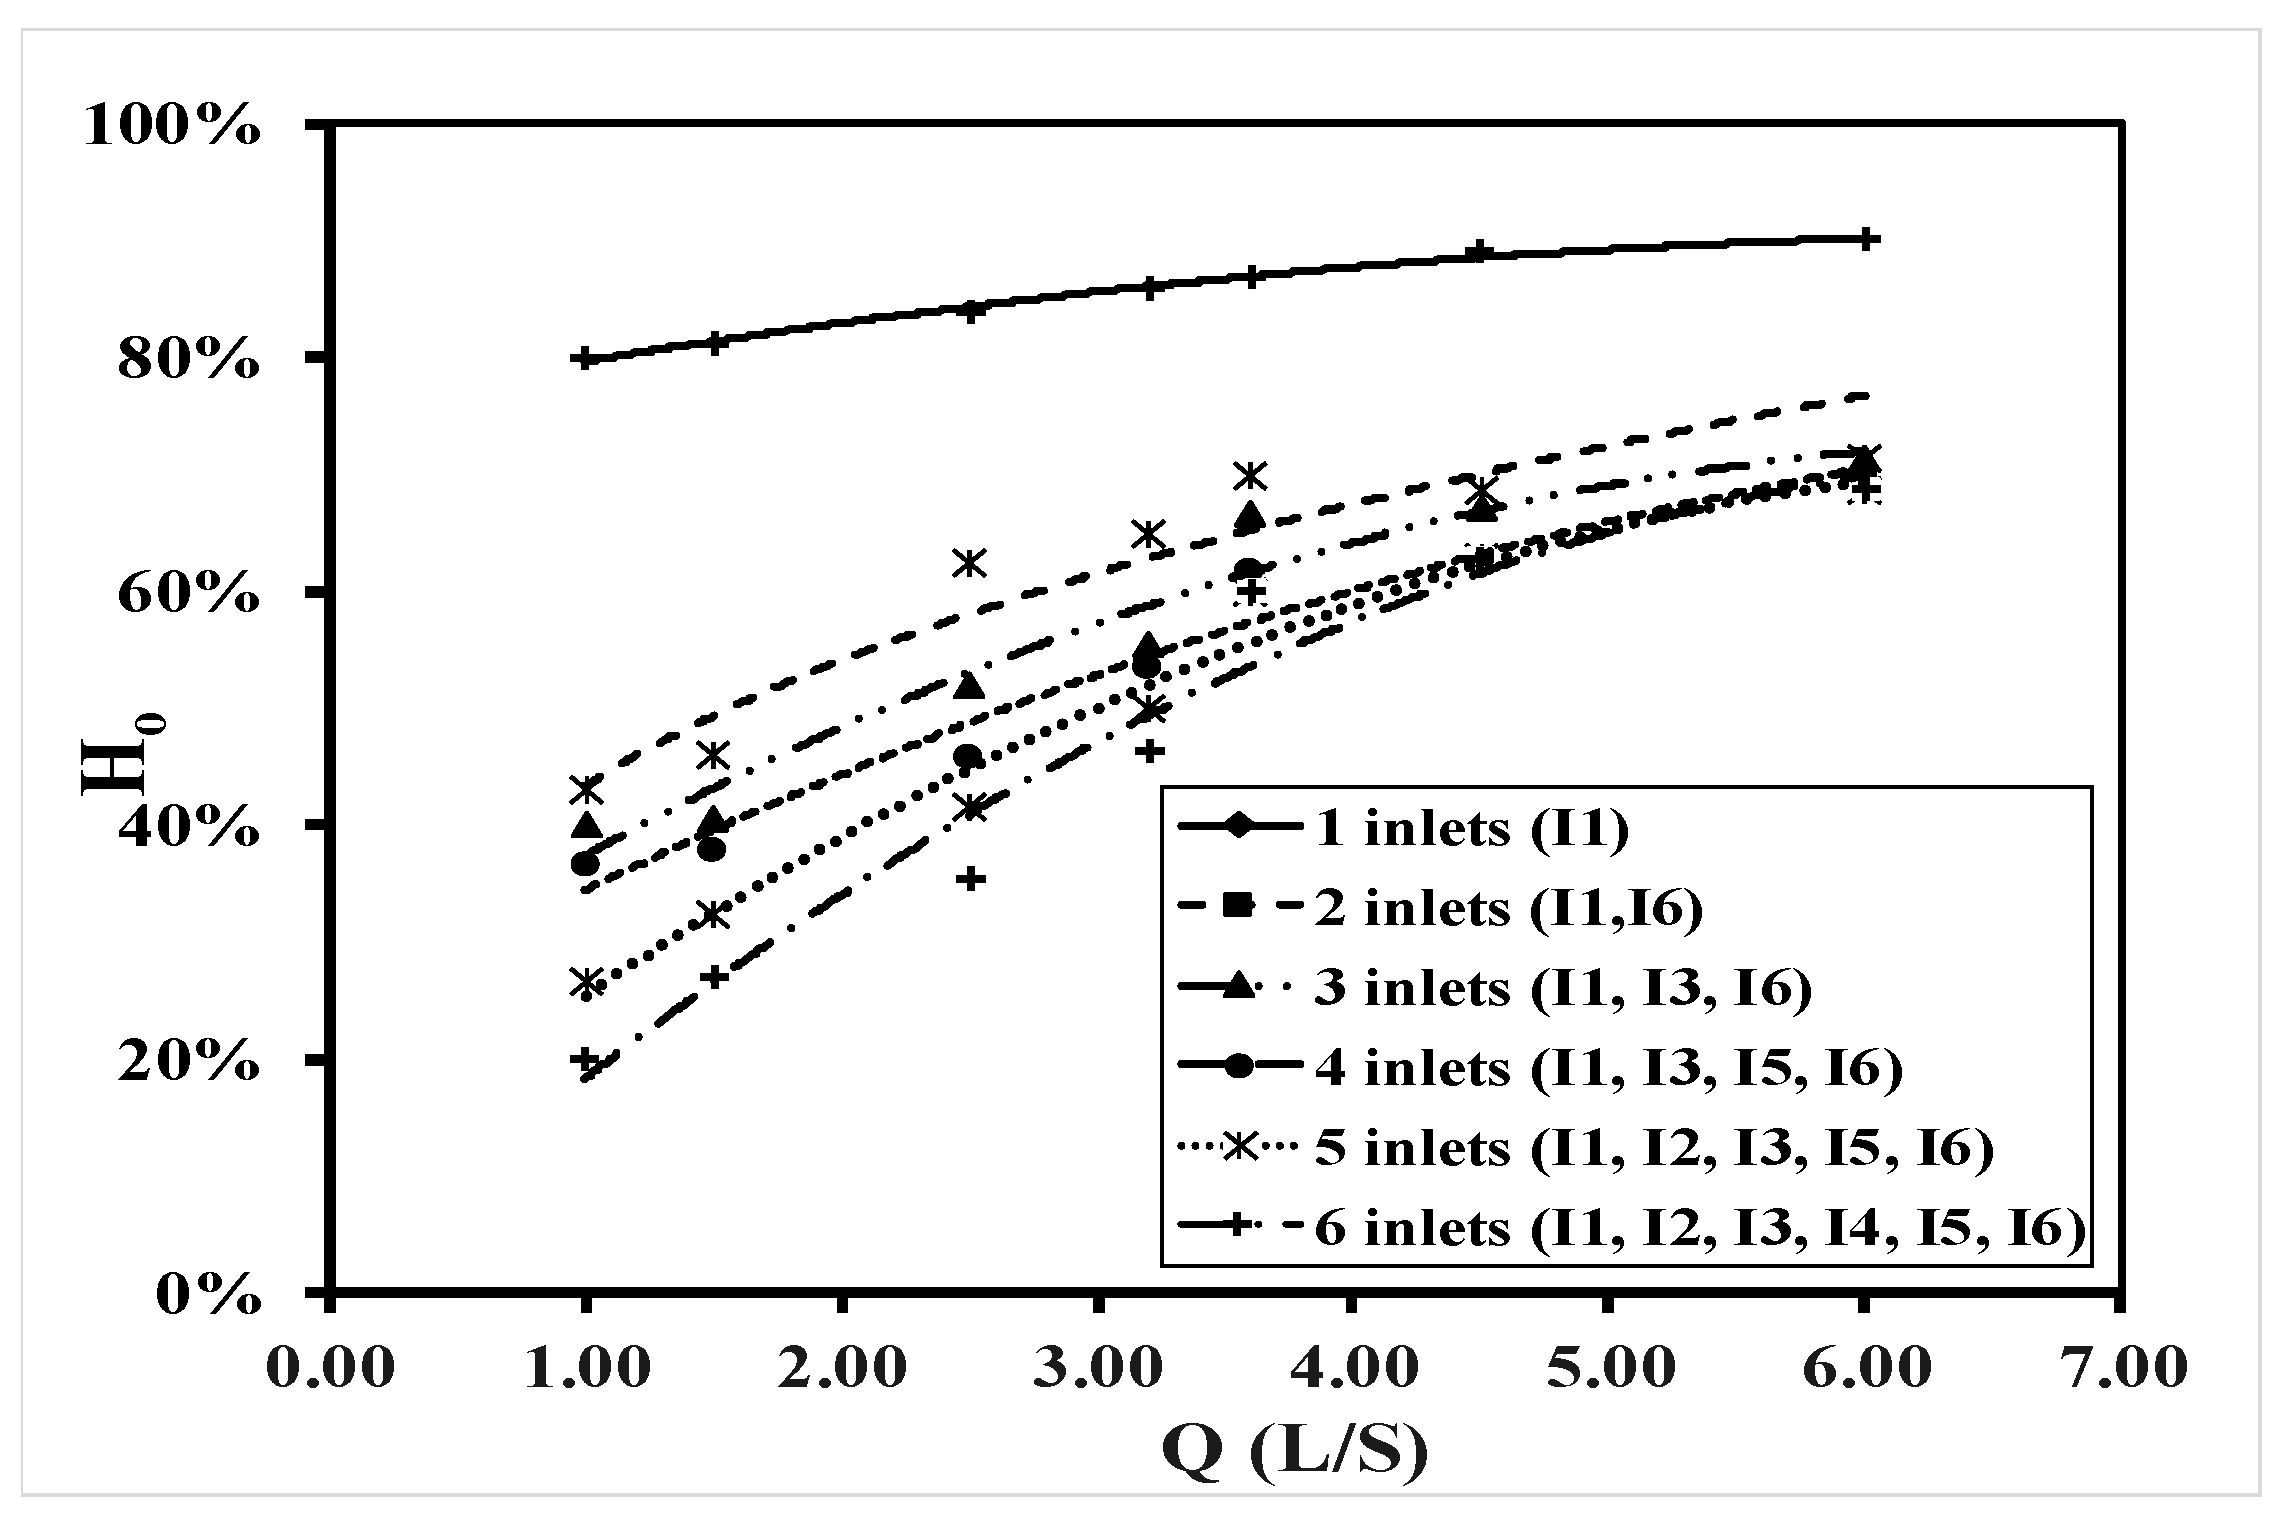
The water depth upstream and downstream of the flume was measured to assess the effect of increasing the number of inlets on the water surface profile. Figure 7 shows the relationship between relative water height (hd/hu) and total discharge for different numbers of inlets (one to six) distributed along the flume. The result indicates that when the number of inlets increased from one to six, the relative water height decreased by 40% due to the increase in the overall inlet capture capacity.

Water Surface Profile (WSP)

The water depth along the flume was measured using the six-inlet arrangement. About 42 points were measured to compare the water level at each change in the experiment. Figure 8 shows the water surface profile for different numbers of inlets and different discharge rates. When using six inlets, as the total discharge increased the WSP increased due to the increase in the amount of water on the flume. The WSP increased from 1.2 cm to 4.00 cm when discharge increased from 1.00 L/s to 6.00 L/s, which was increased four times.

Relative Inlet Water Height

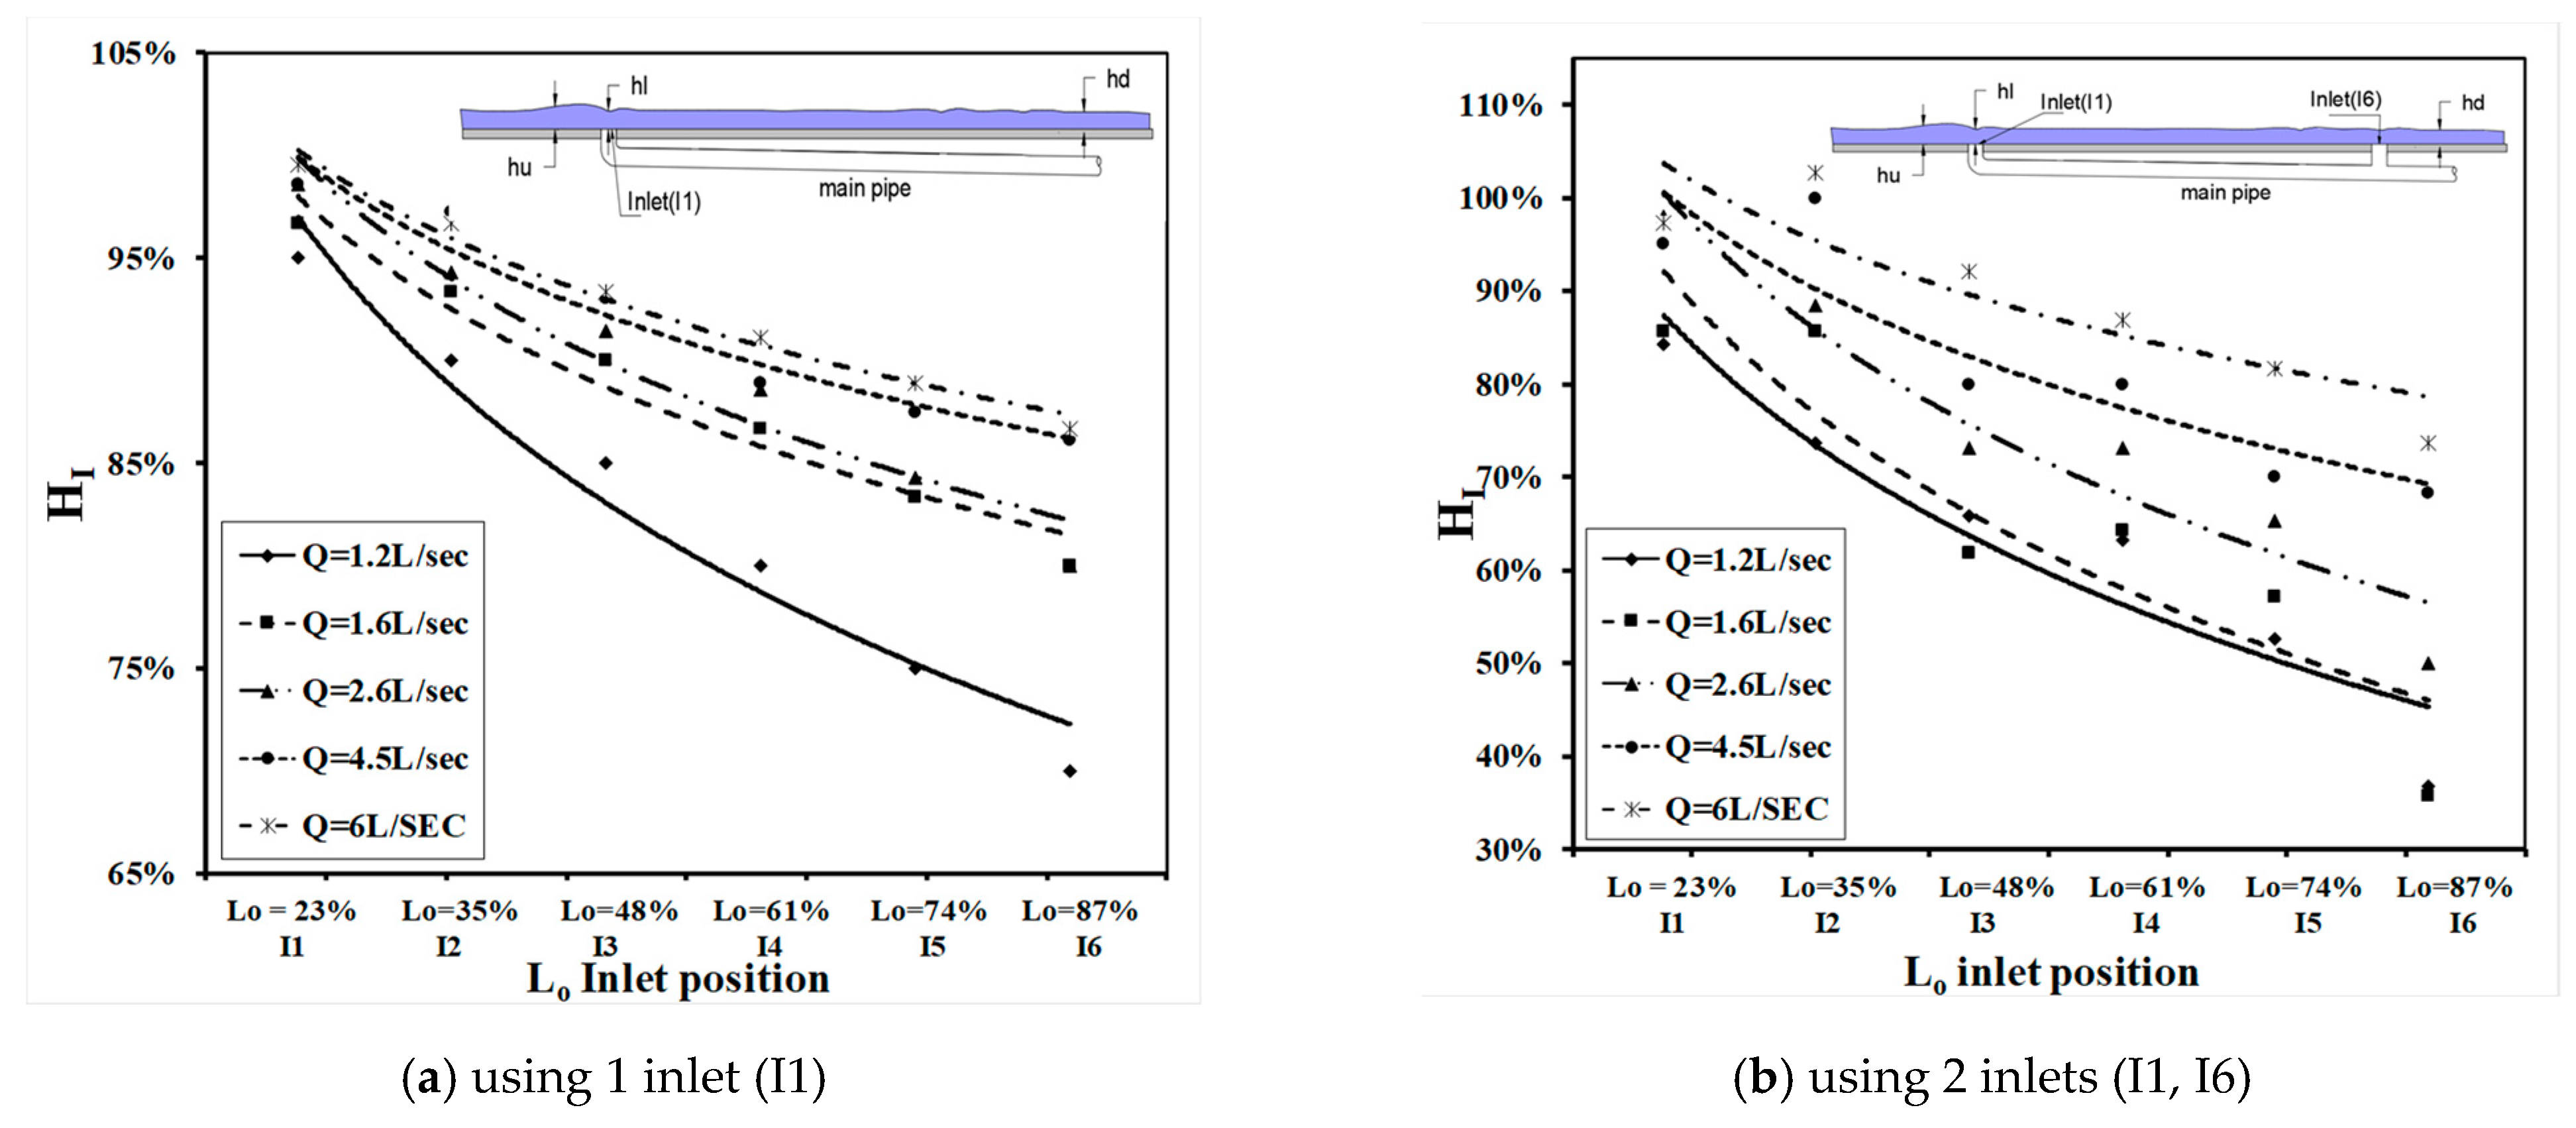
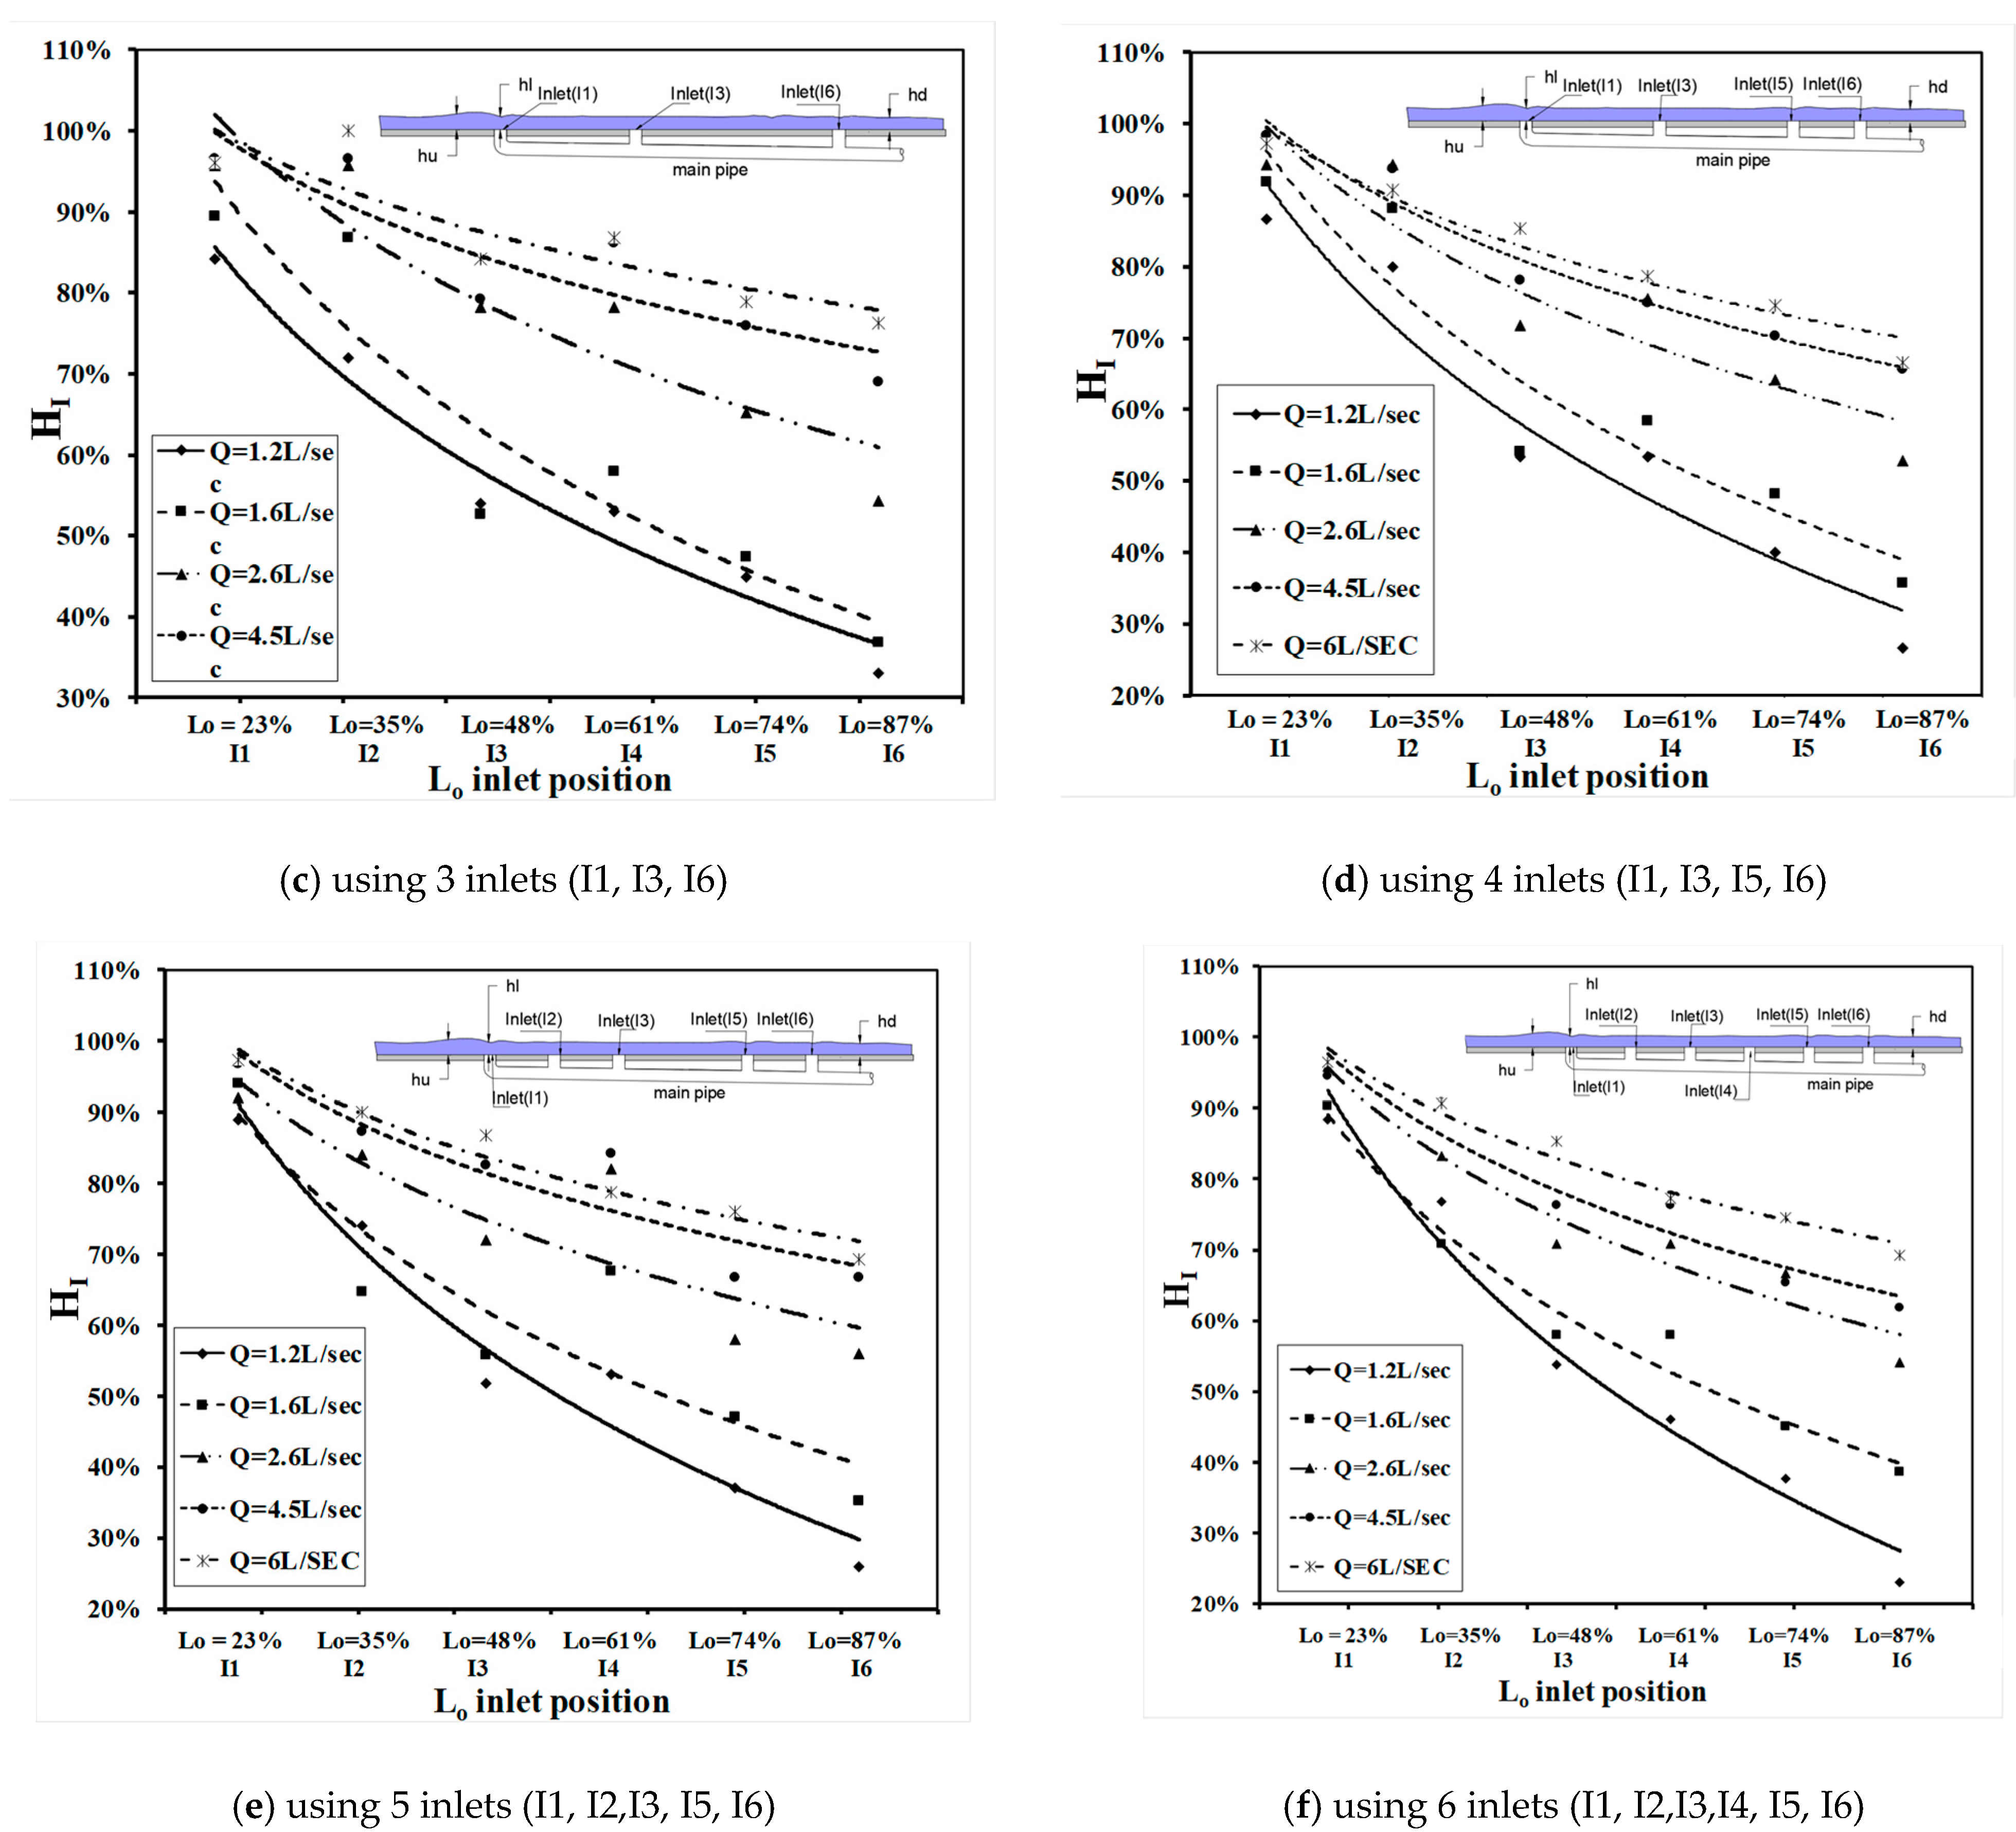
The water depth was measured upstream of the inlet for different numbers of inlets, and different discharges. Figure 9a to f show the relationship between relative inlet water height and relative inlet distance with different Q when using one to six inlets. From these figures it is noted that:
  • As Q increases, HI increased for all cases with different numbers of inlets.
  • HI decreased along the flume for different numbers of inlets (one, two, three, four, five, and six inlets) by 19%, 39%, 42.2%, 44.6%, 45%, and 45.2%, respectively.
  • For the small value of Q, increasing the number of inlets from one to six had a tangible impact on HI, which decreased by 49%.
  • For a large value of Q, increasing the number of inlets from one to six inlets HI by 26%; furthermore, when using four, five, and six inlets, the results of HI were similar.
The behavior of inlets for drained excess water was varied according to the discharges as well as the number of inlets. The Department of Transport and Main Roads (DTMR) (2015) [20] divides inlets into three groups as follows:
  • For the shape of the inlet at high discharge (high water level) and when the distance between inlets is bigger than 1.00 m, the inlet will become submerged and the inlet flow will behave as an orifice.
  • For the shape of the inlet at high discharge and when the distance between inlets is less than 1.00 m, the inlet will become submerged, and the flow will have a small spiral. This is because of the presence of air bubbles.
  • For the shape of the inlet at low discharge (shallow water depth), the flow will behave as a sharp crested weir.

Relative Inlet Water Spread Width

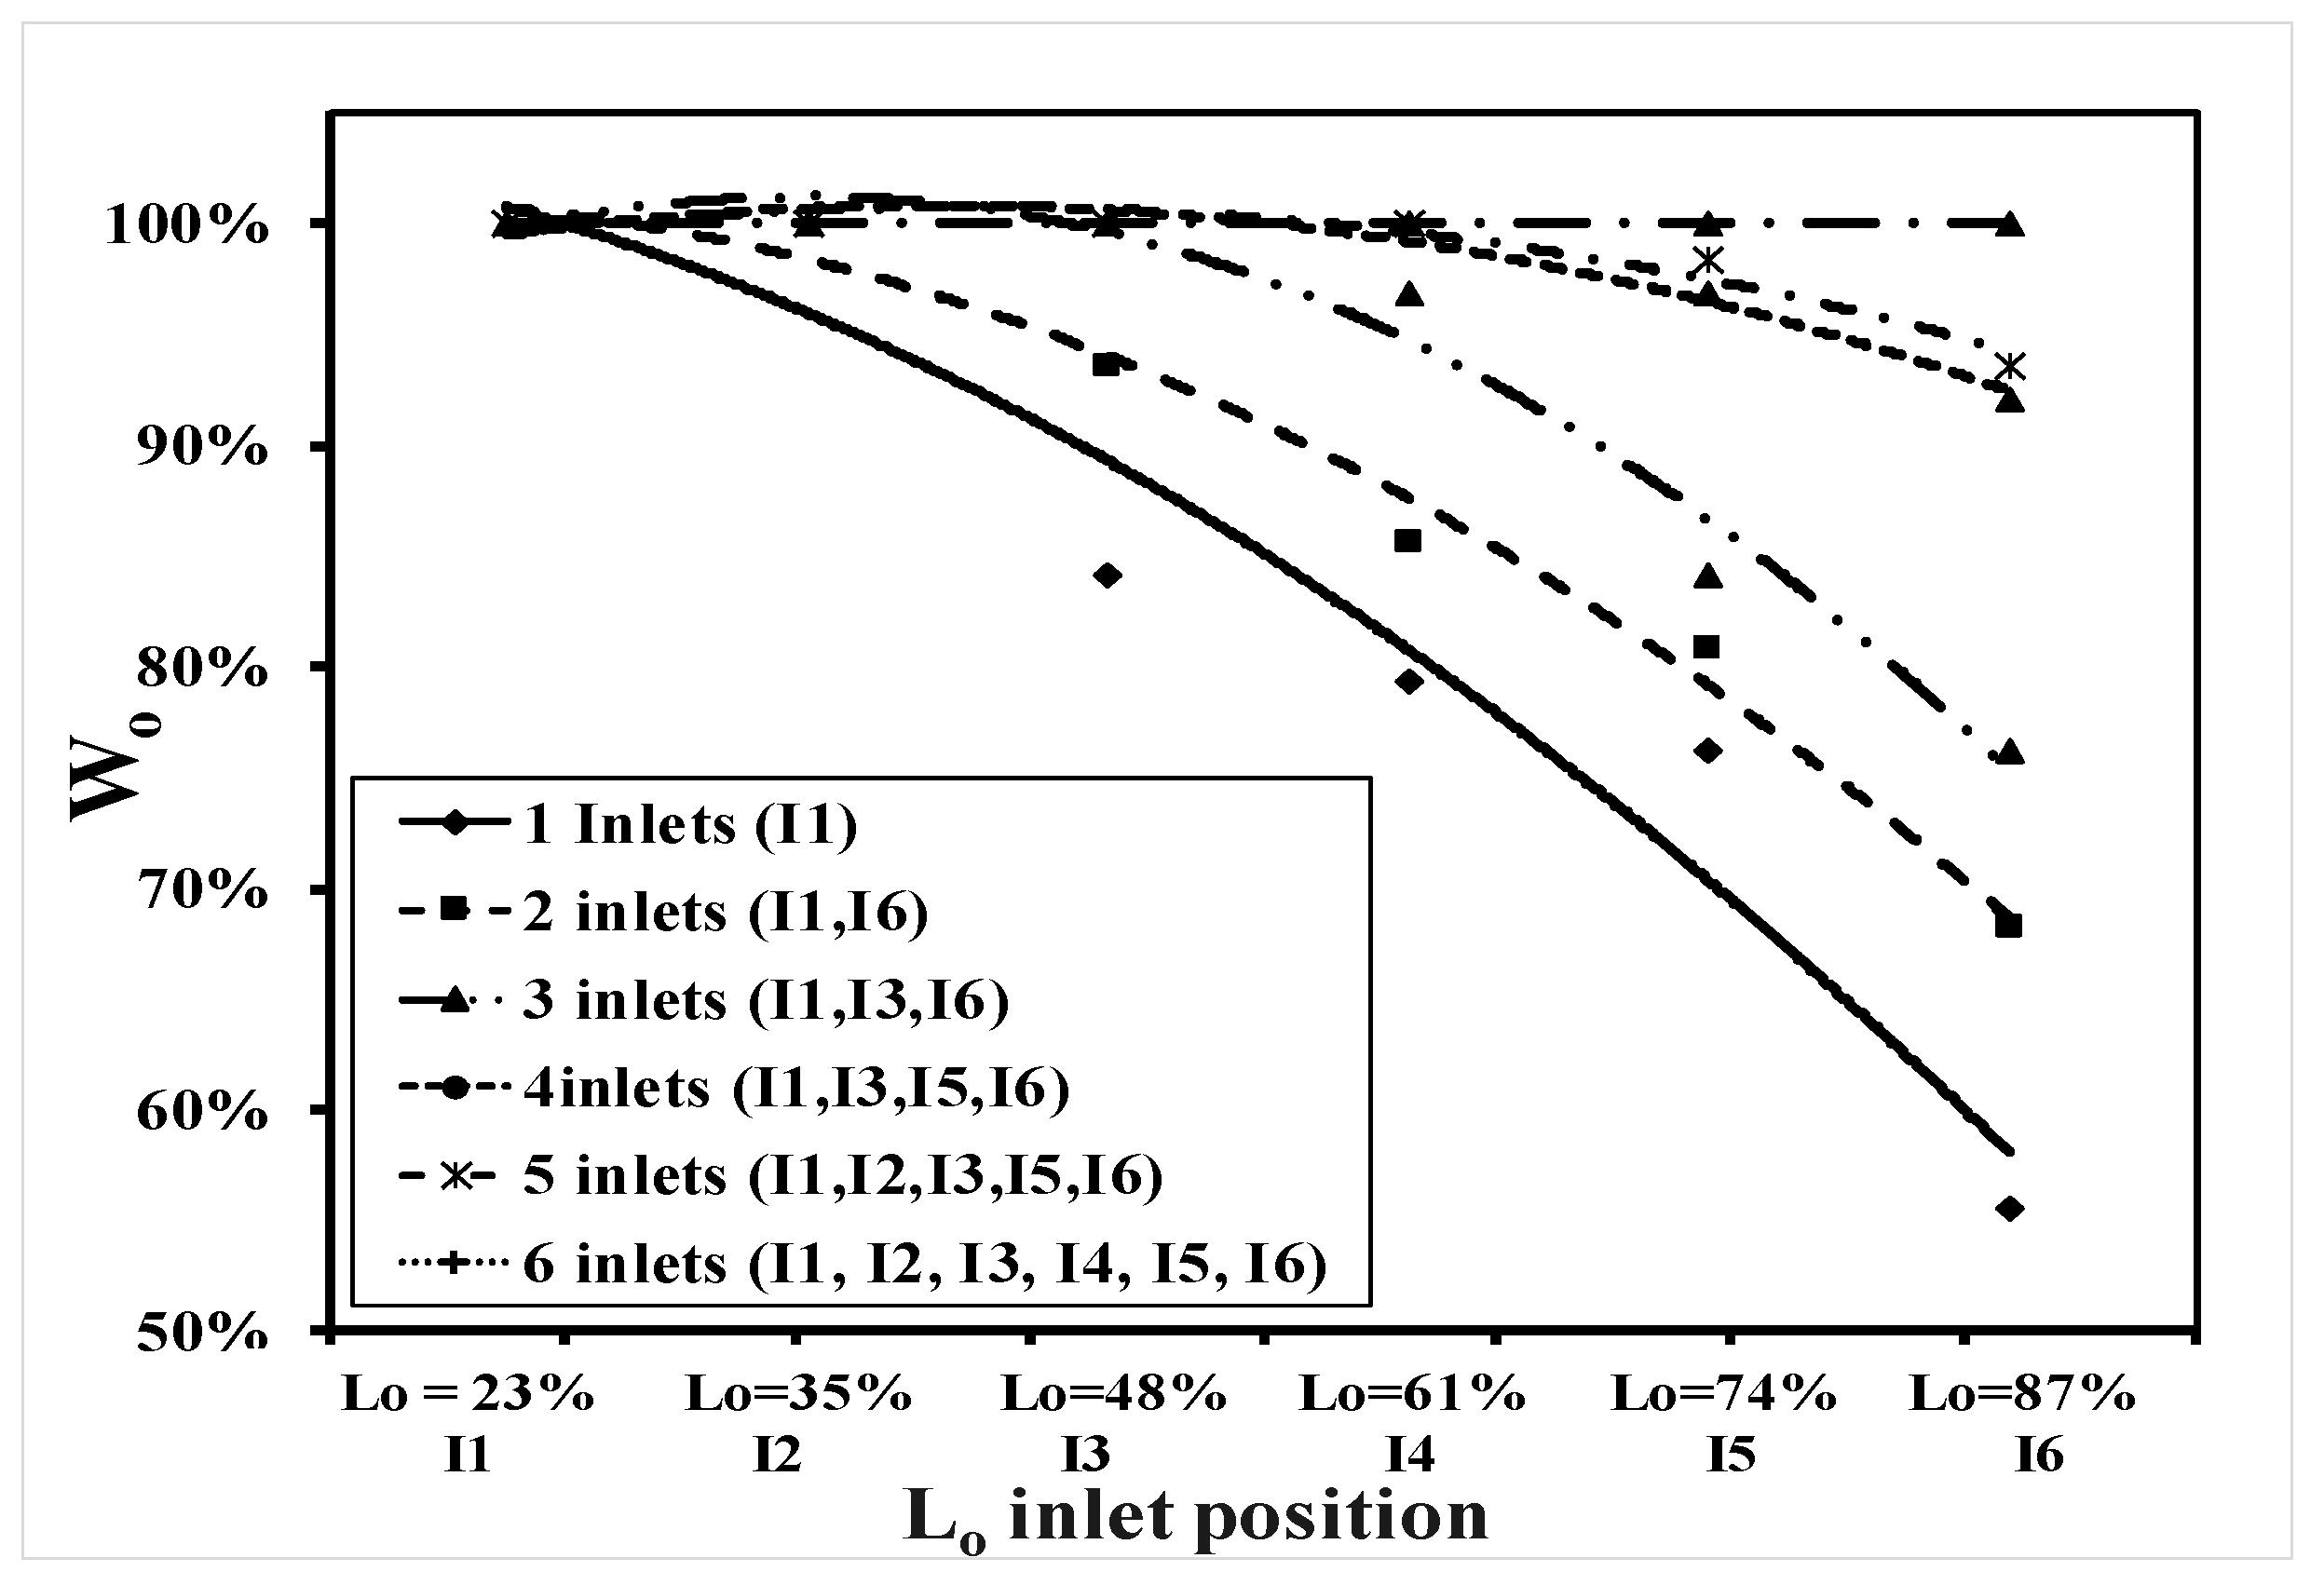
The water spread width was observed for different total discharges with an increasing number of inlets along the flume. The water spread width receded in the cross-section direction, indicating the efficiency of the grates in the disposal of excess water. The effect of this phase on the spread water depth was studied through a small Q up to 1.5 L/S, in which increasing the Q led to completely immersing the inlets with water. Figure 10 shows the relationship between LO and WO at each inlet for different numbers of inlets, which proved that the number of inlets increases the length of water in the cross-section direction within 17%.

3.2. Numerical Simulation

A three-dimensional model was drawn using AutoCAD and exported to the program, as shown in Figure 11a. Precision should be increased near the inlet, so mesh blocks were used with an element size of 1 cm for the main part of the flume, and mesh blocks with cells of 0.5 cm were used at the vicinity of the inlet, as shown in Figure 12b.
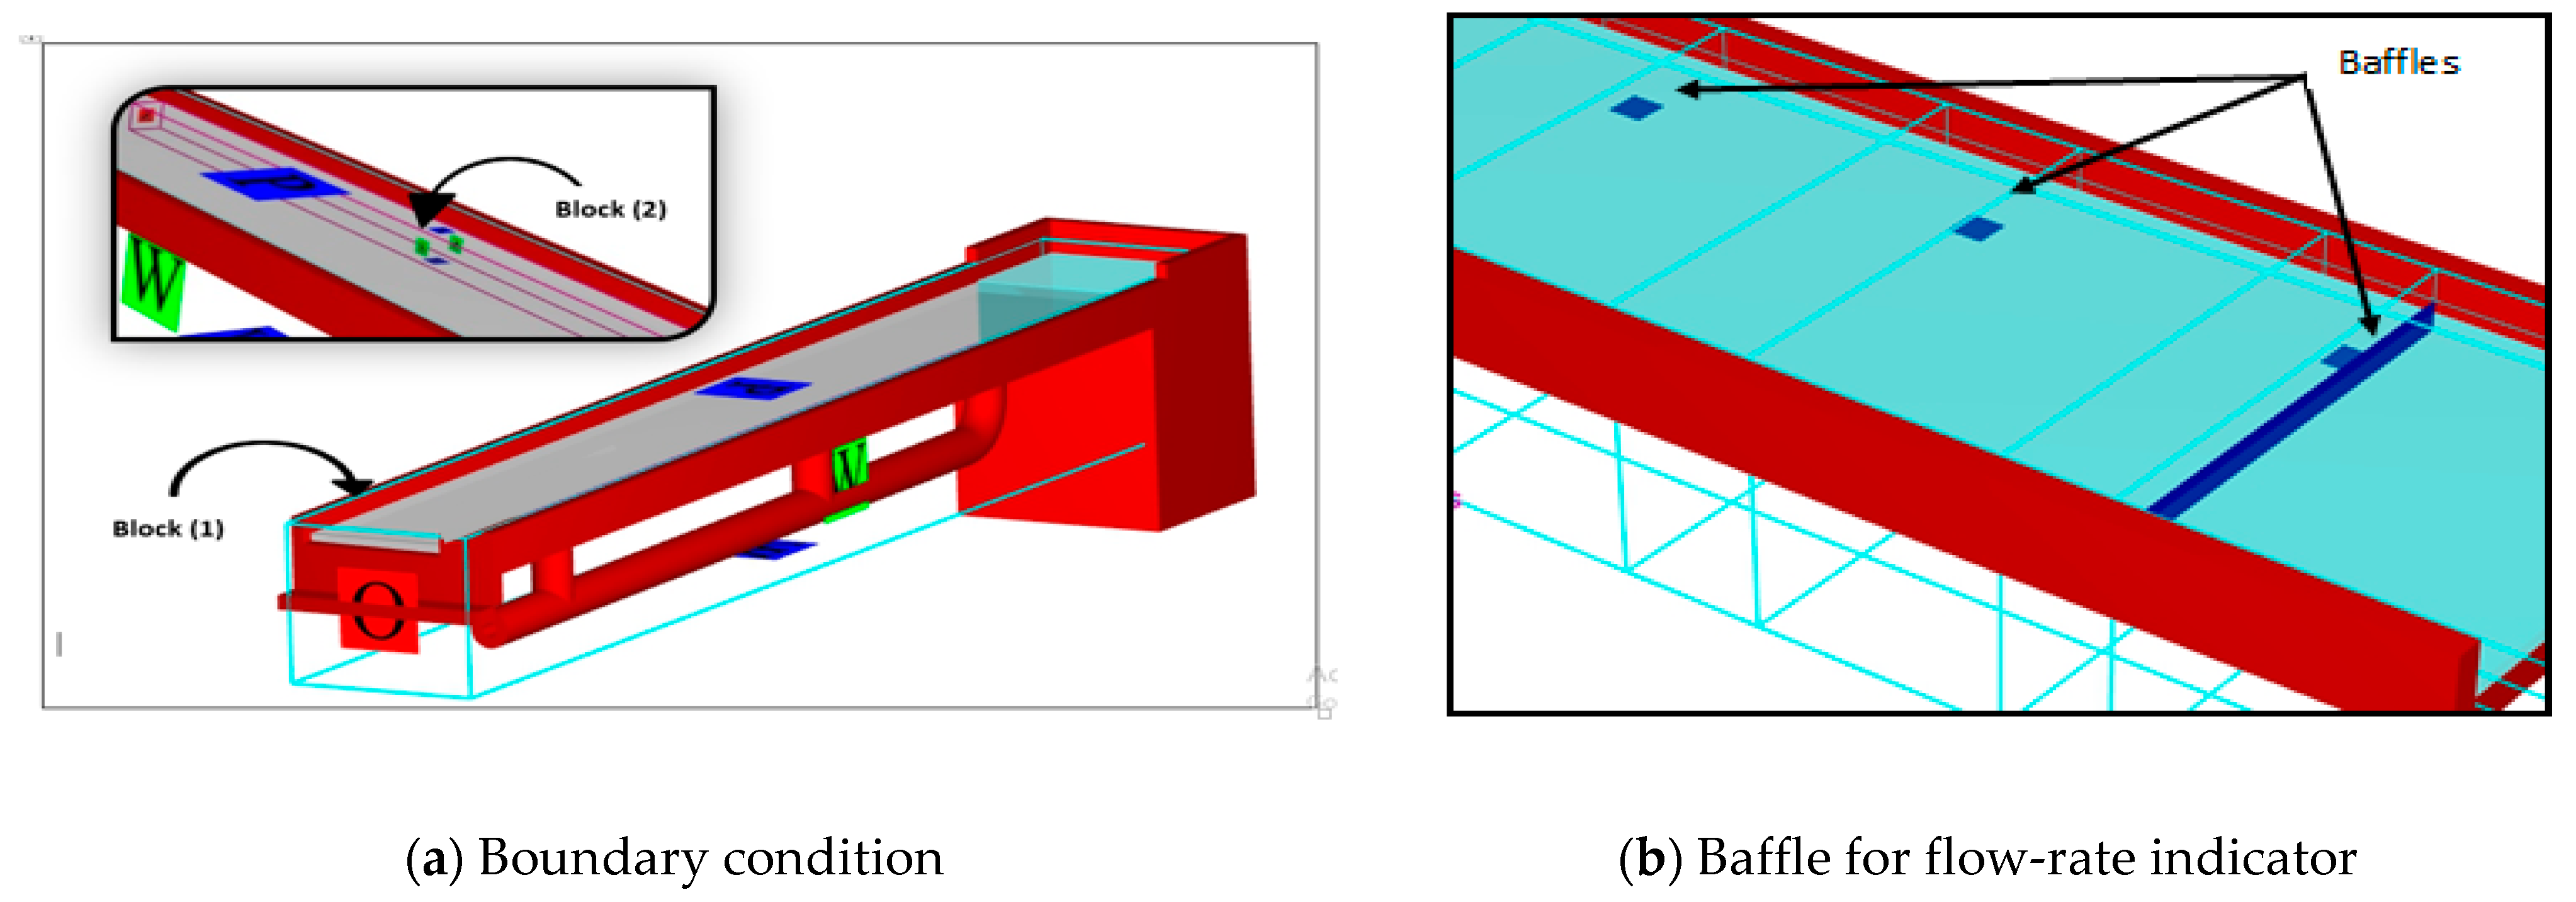
FLOW-3D software offers six boundary conditions for every mesh block. Hence, in this study, twelve boundary conditions were assigned for two mesh blocks. The first mesh block was very important for the calculation accuracy because boundaries of the model were assigned in that region, and the second mesh block was defined only for detailed investigation of the inlet result and to decrease the number of the cells, as illustrated in Figure 12a. Different boundary conditions were assigned to the system. The boundary condition at the minimum point on the x-axis is the volumetric flow rate and flow depth. The maximum point of the x-axis outflow boundary condition was assigned. Since minimum and maximum points of the y-axis represented the side walls of the model, the walls’ boundary conditions were assigned. Finally, the minimum point of the z-axis was the bottom of the model, so the wall type of boundary conditions was assigned and, at the top, the symmetry type of boundary conditions was used. For the second mesh block, the symmetry type of boundary conditions was assigned for all of the boundaries since the inlet system carried same properties and geometry at every point.
To calculate the flow passing at a certain place over the flume, eight baffle blocks with 100% porosity were added to calculate volumetric flow rate at different positions: two baffles upstream and downstream of the flume, and six baffles located under the six inlets to calculate the flow intercepted by the grates, as shown in Figure 12b.
Different numbers of inlets were considered in this study to analyze the discharge efficiency of the inlets over the flume with different values of Q from 1.00 to 10.00 L/S. The computer time is currently a limiting drawback of the numerical analysis. The time of the simulation was accepted as 25 s and implemented for all of the flow rates. Figure 13 shows the water surface profile and velocity vectors when using three inlets and total discharge (2.50 L/S). From the figure it is clear that the first inlet has a large amount of water and higher turbulence than the other inlets.
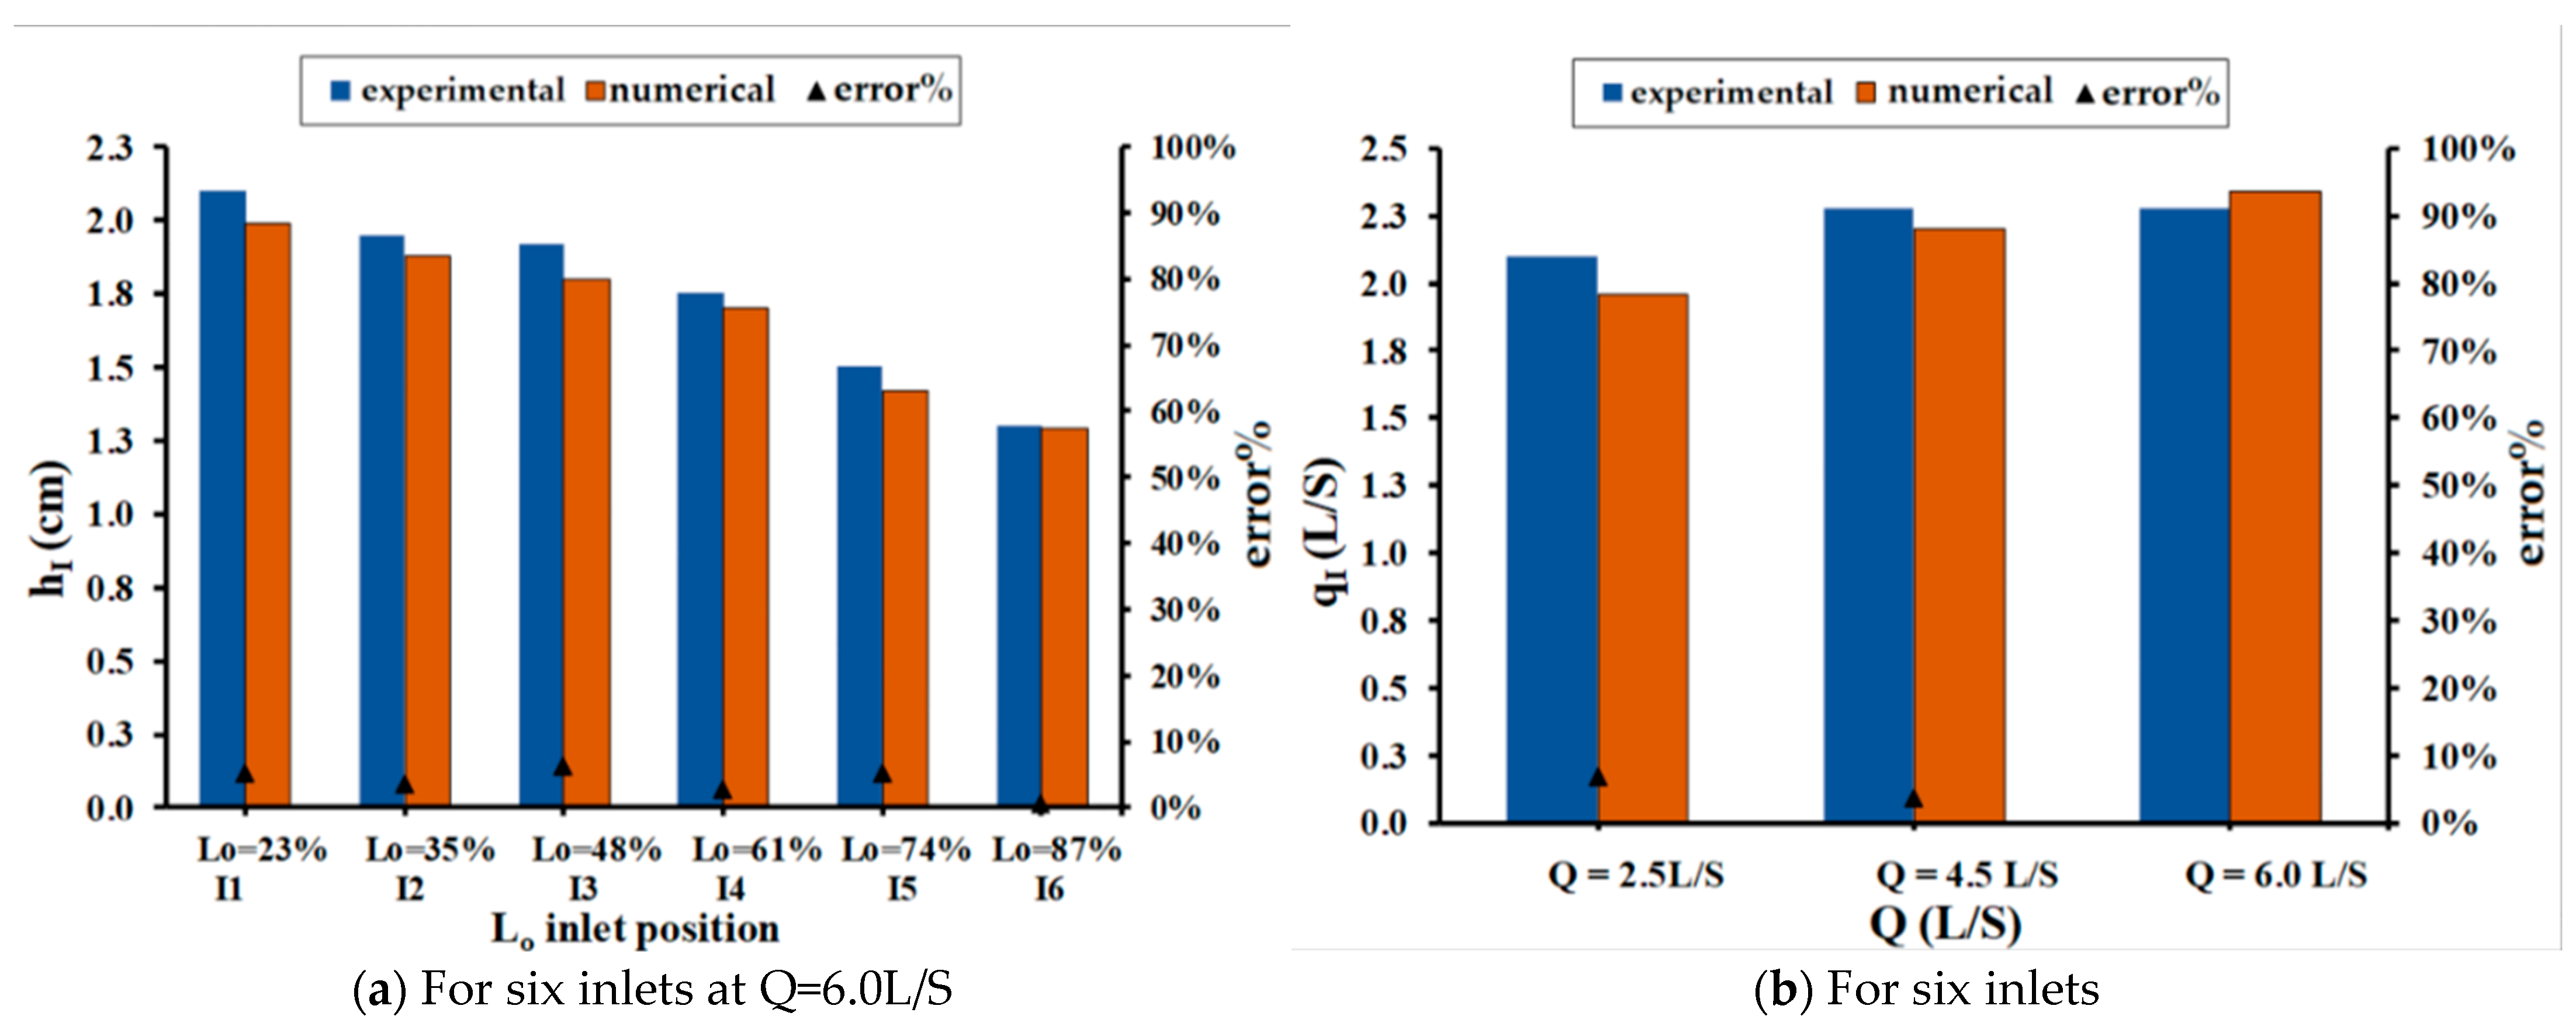
The effect of six inlets along the flume on the discharge efficiency and water height upstream of each inlet was examined. Figure 14 shows a comparison between numerical and experimental data observed and simulated at the upstream height for every inlet, for a slope of 1.5% in the transverse direction and 0.0% in the longitudinal direction with total discharge (6.00 L/S). All the results were in high agreement and the error rate was only 8%. Figure 14a,b show a comparison between numerical and experimental data that were observed and simulated for intercepted discharge with the number of inlets (6) for different inflows (6.00 L/s), respectively. The error rate was about 10%. This consideration could explain the relative error (8%, 10%). This could be due to the characteristics of the upstream tank. It is not large enough to dissipate all the energy introduced by the injection of high flow rates, and turbulence prevents the generation of a complete one-direction flow condition upstream of the inlet and thus distorts the accuracy of results.
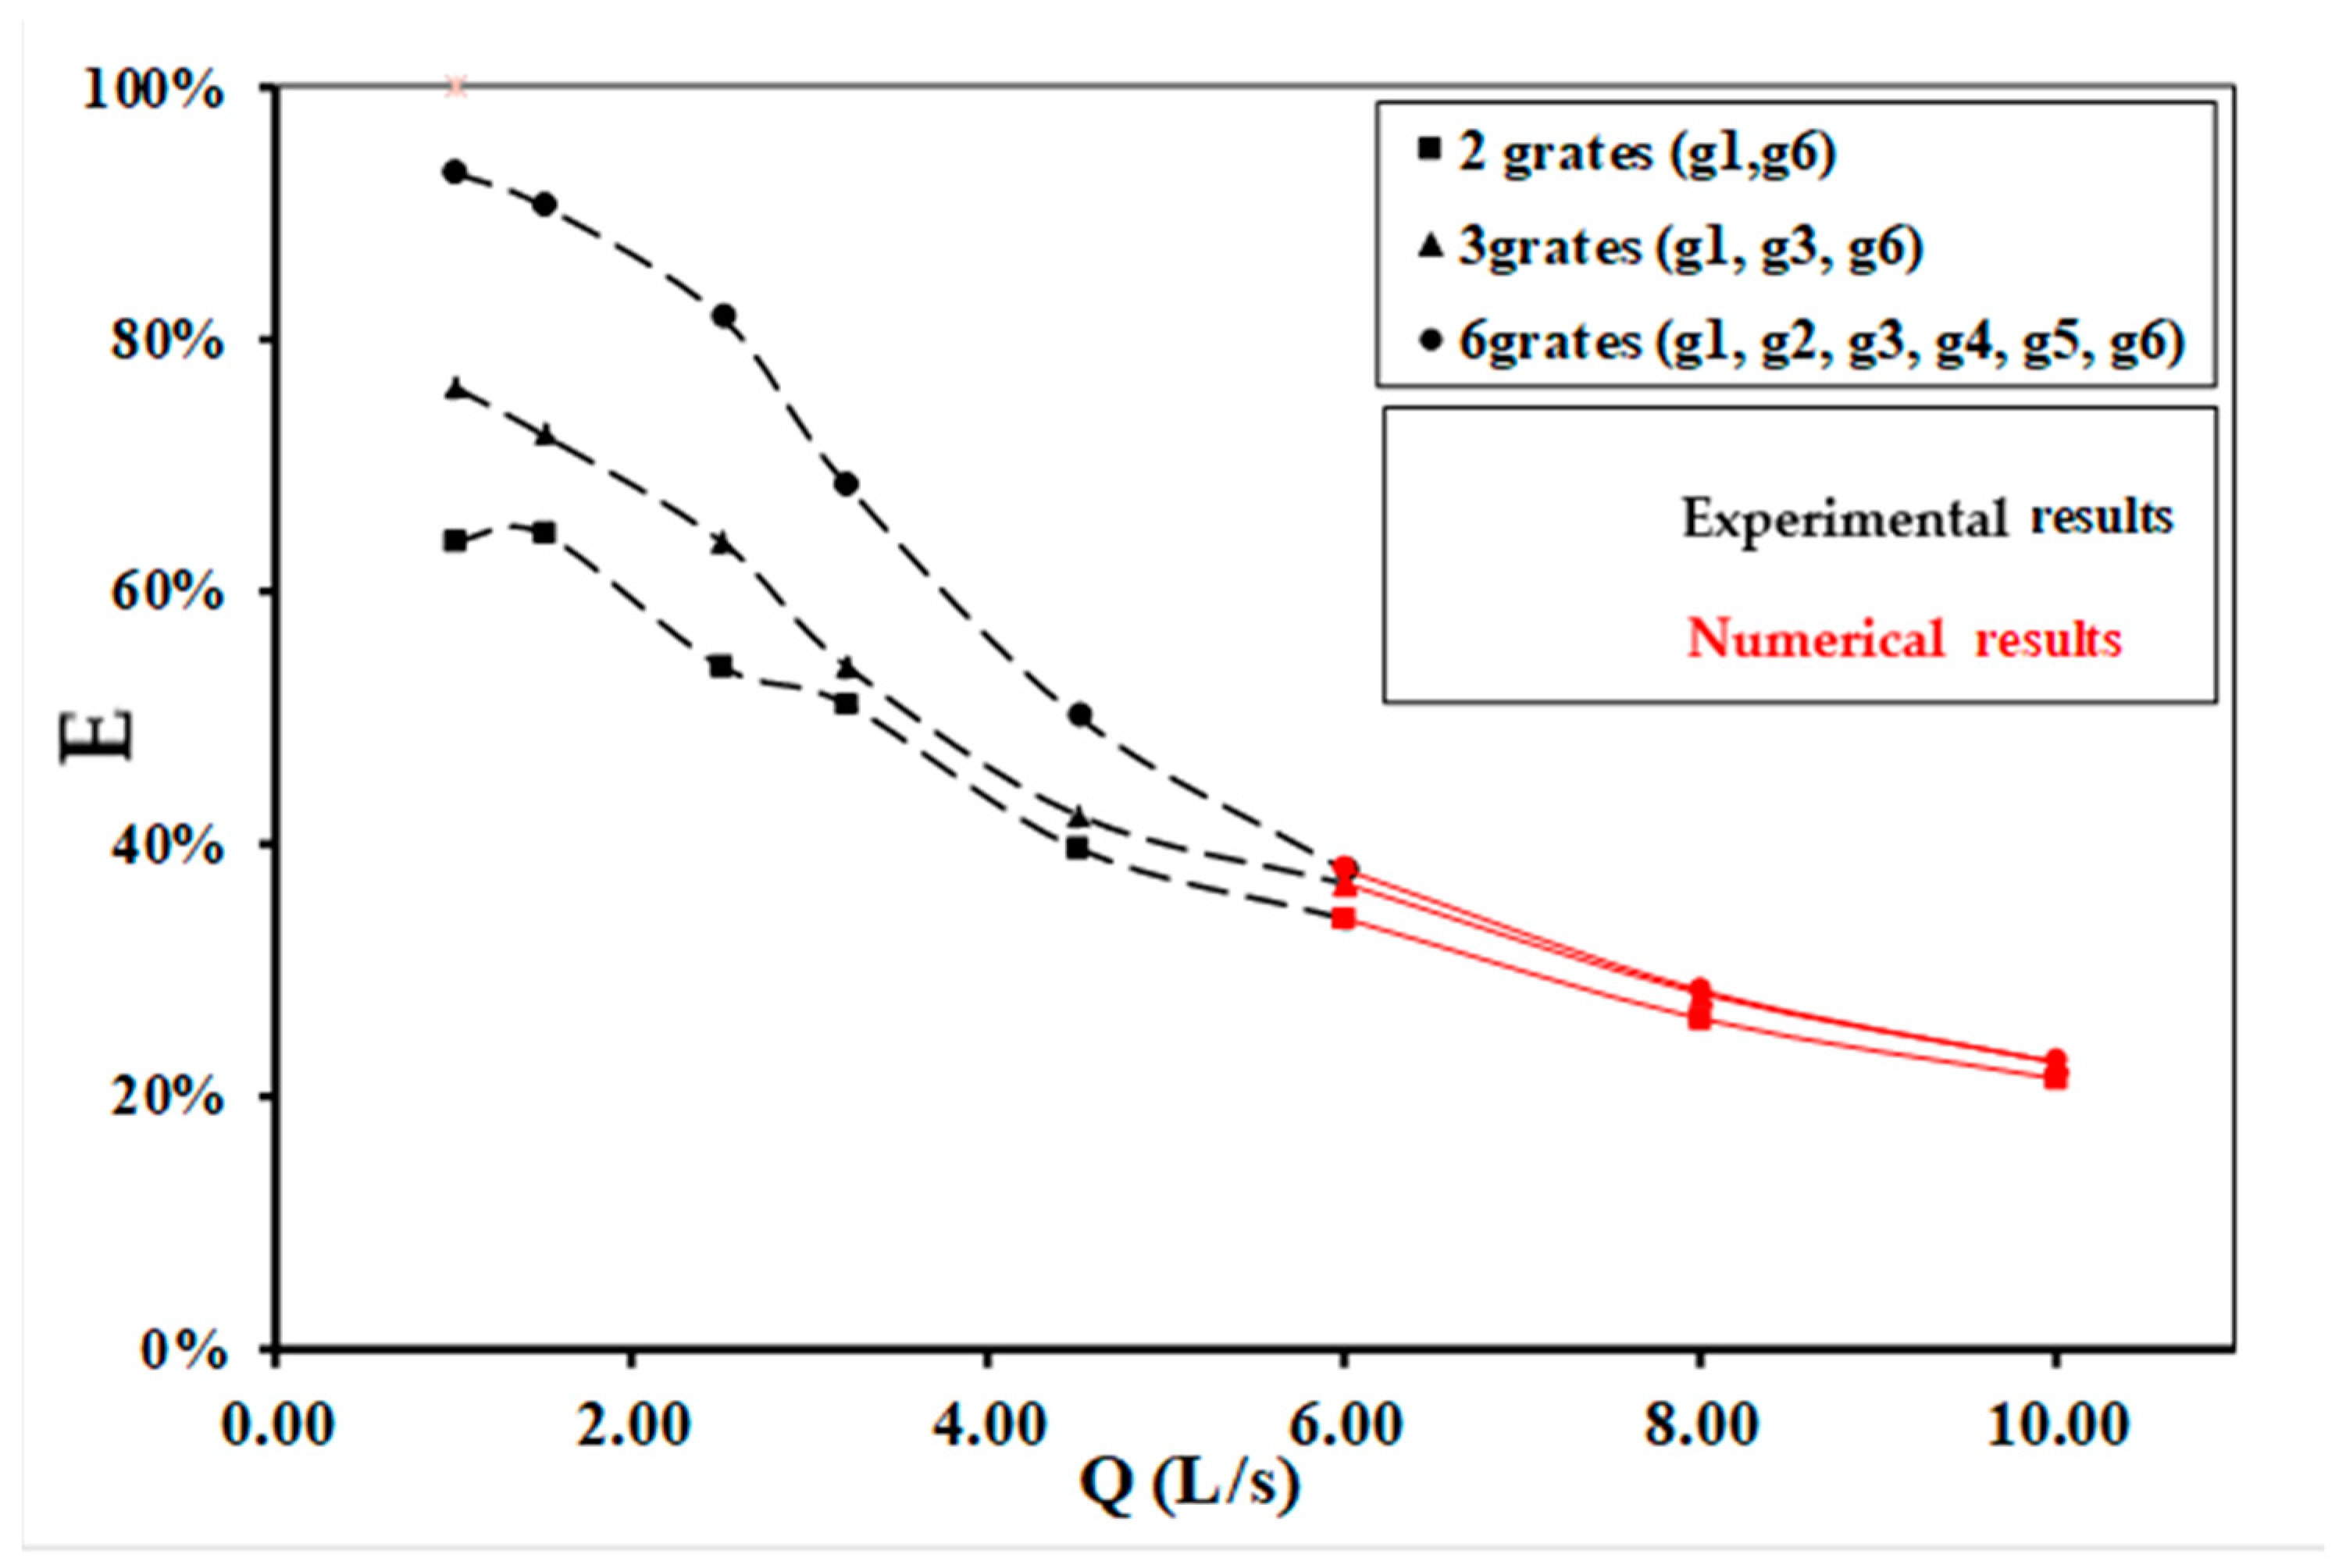
After comparing the experimental results and numerical model results and showing the error rate within the permissible limits, the FLOW-3D program was used to conduct tests with a higher discharge up to 10.00 L/S using a number of different inlets. Figure 15 represents the relationship between total discharge and efficiency for using two, three, and six inlets with different discharge rates, in which the intermittent line refers to the experimental results and the solid line refers to the numerical results. From this figure, it can be explained that, as the total discharge increased to 10.00 L/S, the efficiency of the system decreased to 20% and the overall efficiency of the inlets became the same because the total discharge become bigger than the inlet capture capacity.

4. Comparison between the Current Study and Previous Studies

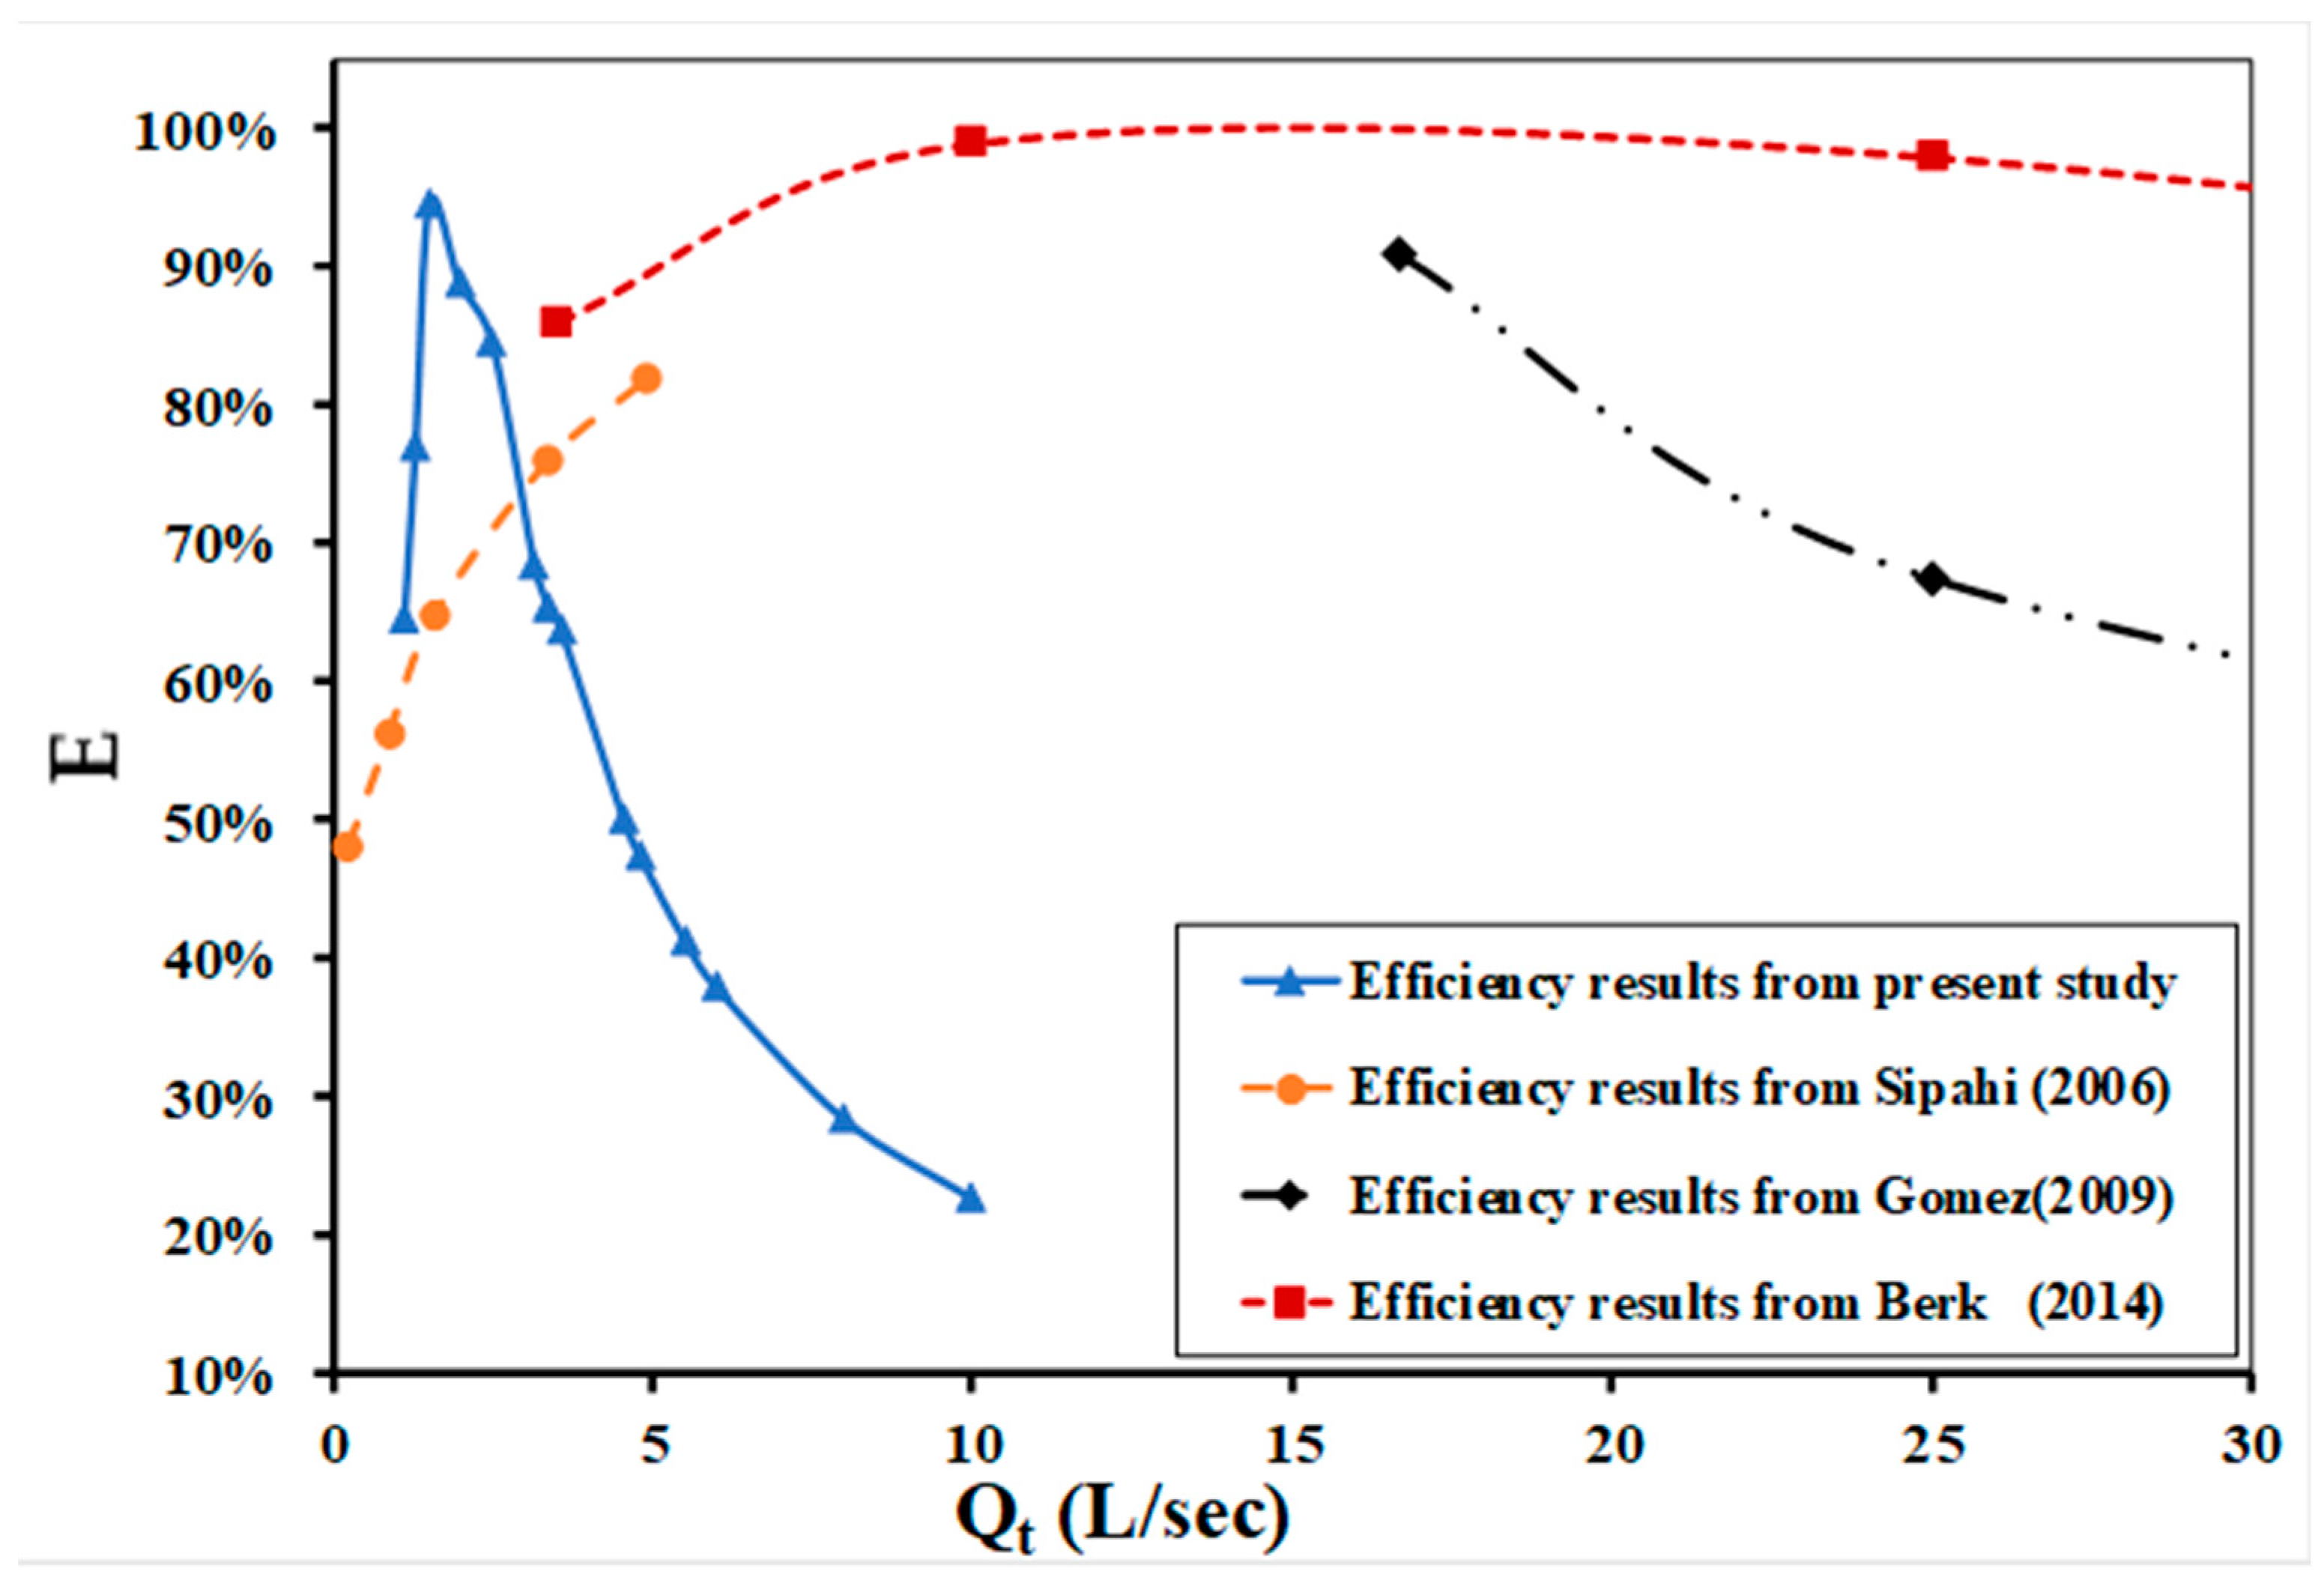
A simulation of the data from experimental work with previous studies was carried out, as shown in Figure 16. Sipahi (2006) [21] found that the total discharge is directly proportional to efficiency, but in this study the relationship is in reverse proportion with the same range of discharge. This is because the relative net area of the inlets used by Sipahi was AO = aI/af = 0.025, which means it is large enough to harvest the existing water for different total discharge rates available. However, in this study, the relative gate area of AO = 0.00445 is smaller than the available total discharge. The result of Gómez (2009) [22] is expected, since the inlet width of Gomez equaled 1.0 m and the flume width = 1.50, meaning the inlet does not cover the flume. For this reason, efficiencies were decreased. Sezenöz (2014) [23] studied a numerical model that looked like the experimental model of Sipahi (2006) [21] but with one grate and larger discharge. It can be noted that the relationship between Q and E is in reverse proportion, like in our study. This is because the area of the grate inlets is not large enough to collect the existing water over the flume. Moreover, it was noted that the grate inlet positions of the studies of Sipahi, S. O. and Sezenöz B. were along the width of flume, and these grate inlets intercepted the track of water flow and collected the excess water. However, in the Gómez M. study there were 0.50 m gaps between the side walls and inlets, so that the water could pass through the gaps at large total discharge rates (from 0 to 100 L/S). On the other hand, in the current study the inlets were spread on one side of flume, which depended on the cross-section slope to direct the flow of water towards the inlets, and the large bypass flow passed through the width of the flume. Table 2 presents a comparison between the current study and other studies.

5. Prediction of Efficiency

Statistical data analysis is a widely used method for scientific data analysis and interpretation. It assists us in identifying patterns in the data and making decisions based on those patterns. Most basic data analysis tasks can be completed with Microsoft Excel’s assistance. Excel can also be utilized to perform statistically reliable data analysis. In this article, we use the coefficient of determination between two sets of numbers (square of the correlation coefficient) to determine the strength of the developed equation. The correlate of system efficiency (E) with the relative total discharge (Q) and number of inlets was developed as shown in Equation (2).
E = 0.08635 Q + 0.05675 n I + 0.6482
where nI is the number of inlets, Q is the discharge (L/s), E is the system efficiency.
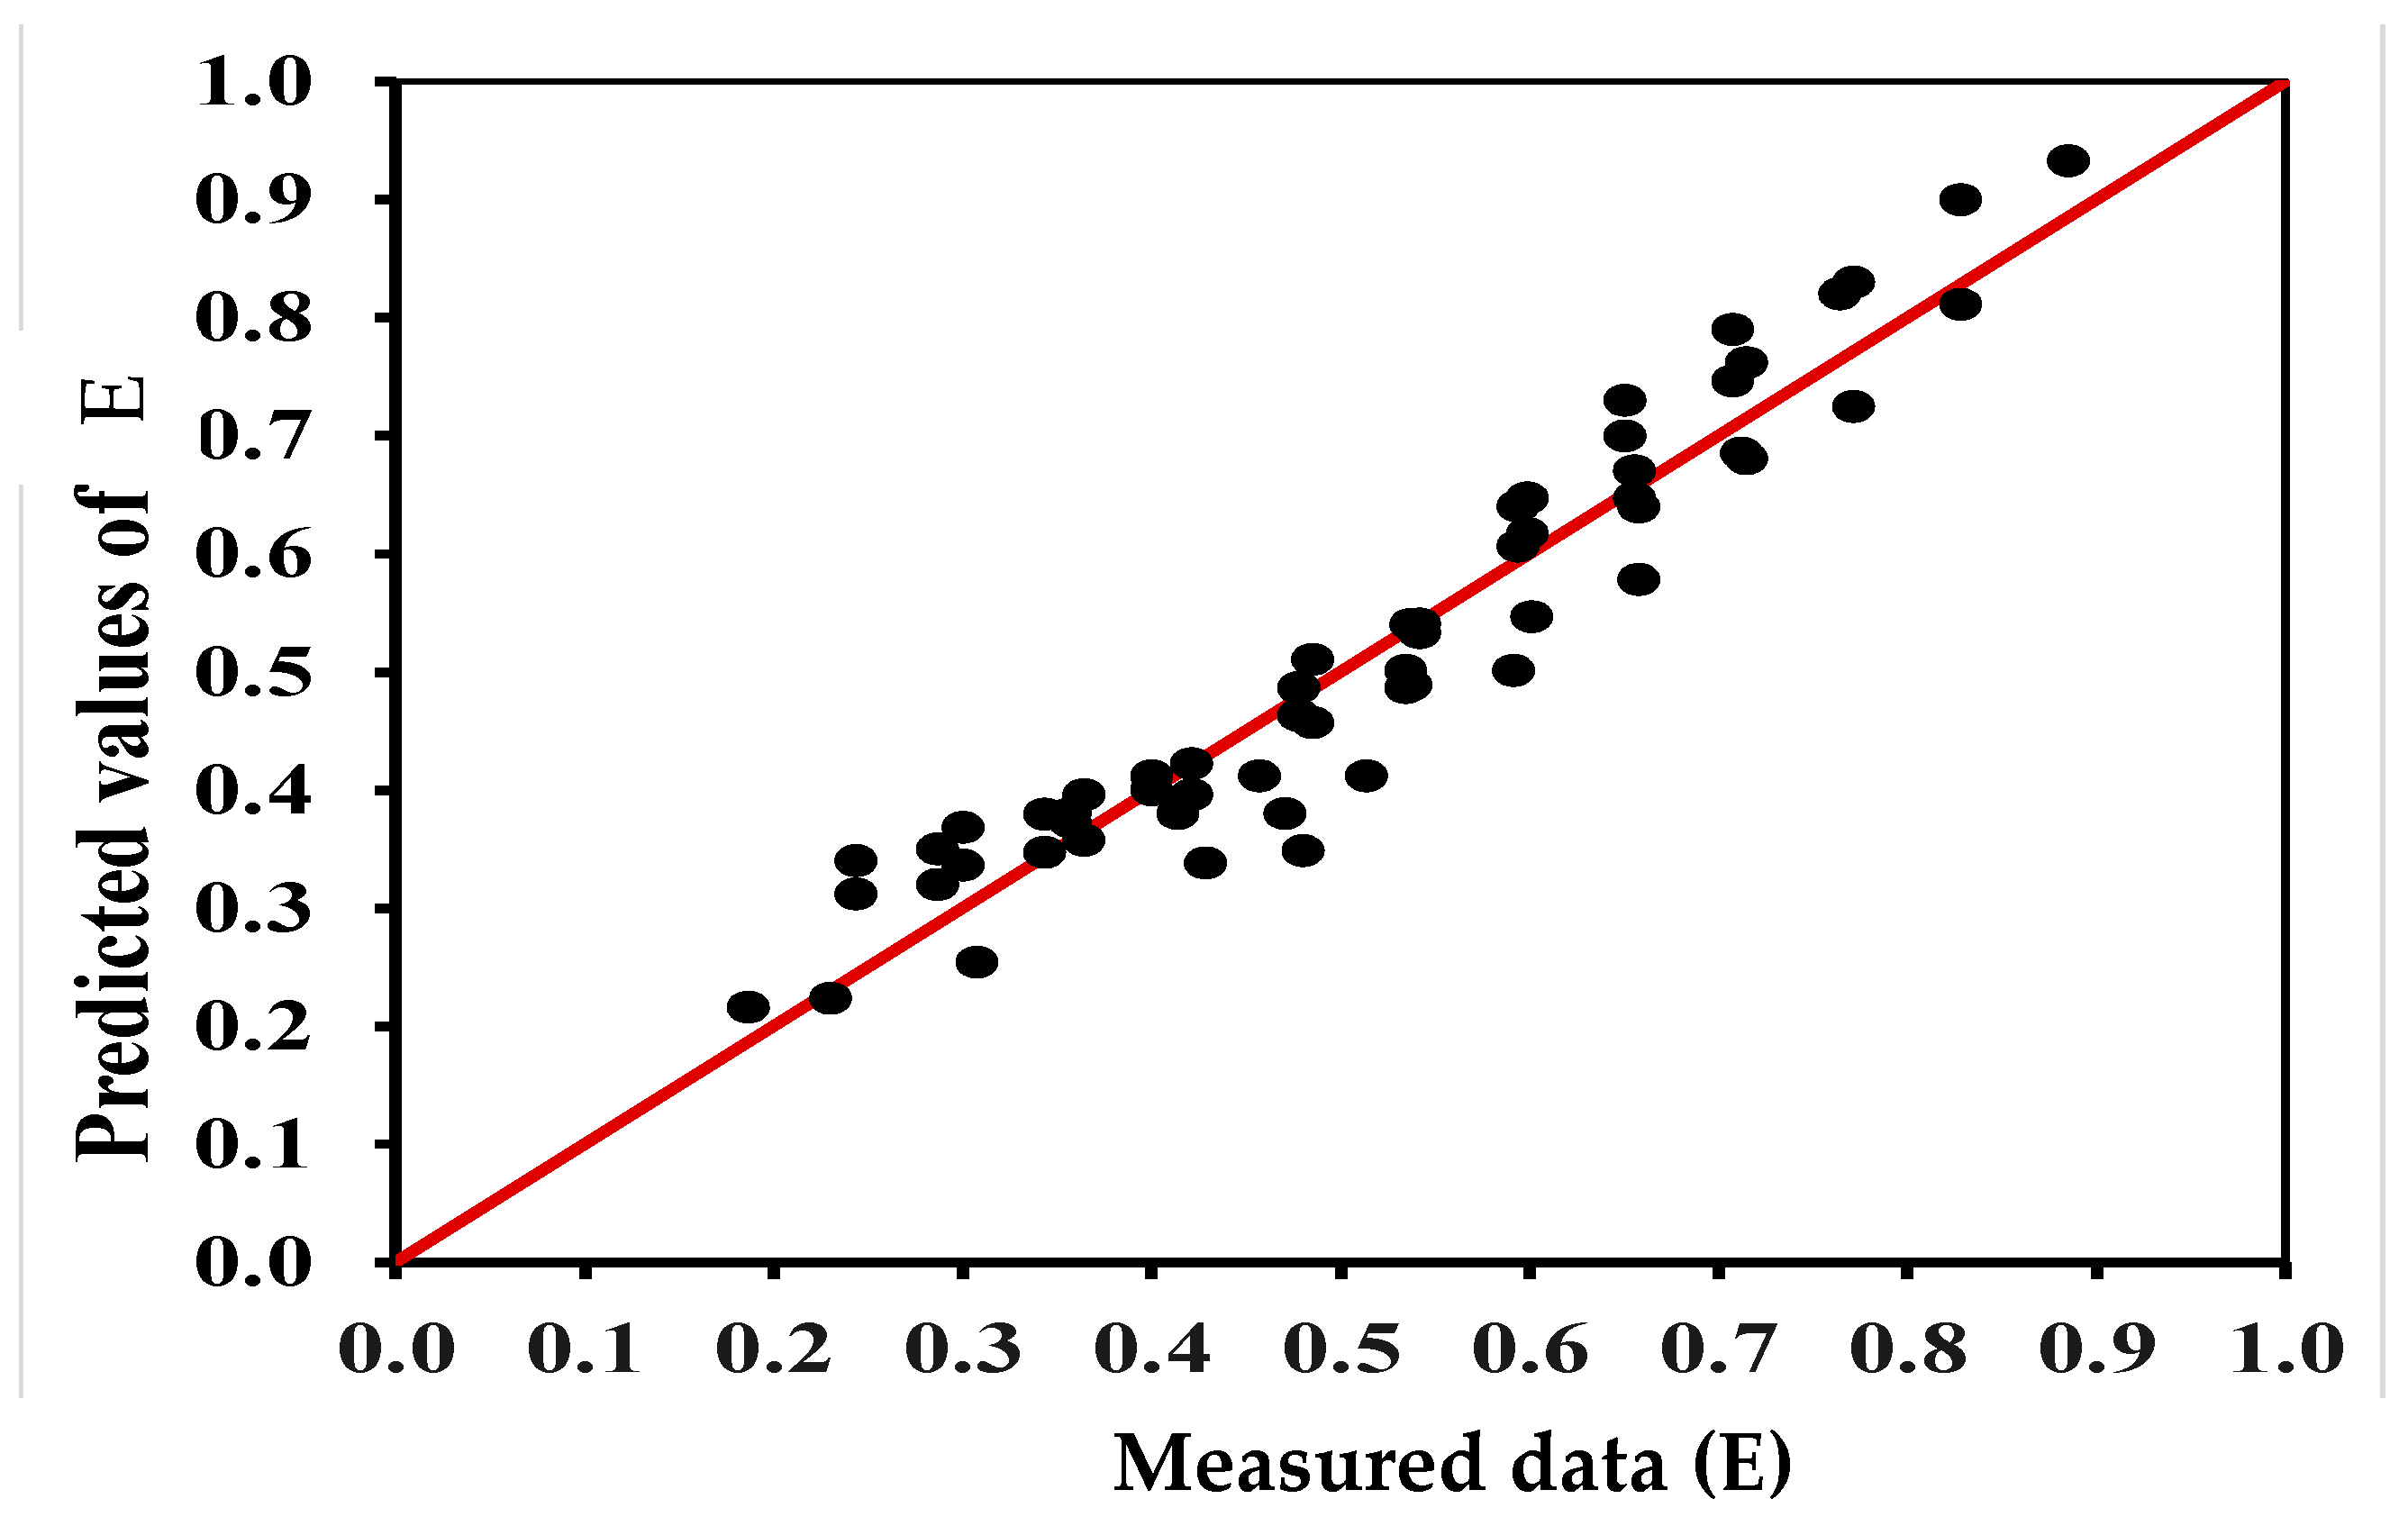
The correlation coefficient and the stranded error estimated for Equation (2) are 92% and 0.05, respectively. Figure 17 shows the correlation between the calculated values of E using Equation (2) and the measured values, while Figure 18 shows the scattering of the residuals around the line of zero error. Both figures indicate that Equation (2) represented the measured data very well and hence could be used to predict the efficiency for different numbers of grates at a total discharge from 1 to 6 L/S.

6. Conclusions

Different arrangements of grates were studied and their efficiency was determined. A comparison between the total grate’s efficiency was conducted and the best arrangement was selected. The discharge efficiency of the storm system increased with an increasing number of grates and could be observed with a small inlet discharge; however, with a large inlet discharge (4.5 to 6 L/S), the results were close. The discharge efficiency of the storm system decreased with an increased flow rate due to the increase in the water velocity and water depth, which enabled the fluid particles to easily splash over the grate, thereby decreasing the efficiency of the grate. The depth of the water in the upstream grate increased with the increase in the flow rate and was higher than that in each grate downstream along the flume. Water receded along the road by increasing the number of inlets. Four inlets resulted in overall efficiency that was similar to the efficiency of six inlets, so four inlets can be used to save the construction cost. Drainage efficiency when spreading grates along the flume, compared to using consecutive grates, was 4% higher. A FLOW-3D program was used to simulate the laboratory results using different discharges and numbers of inlets. The error of calculation ranged between 5% and 8%. Thus, the results indicated that this program is a powerful tool for predicting the discharge efficiency and velocity direction for large discharges. A comparison was made between this study and previous studies. The results indicated that the same trend existed. A new equation was developed to correlate discharge efficiency (E) with relative total discharge Q and the number of inlets. The equation can be used by planning engineers to make an initial planning of storm drainage layout system and achieve cost saving.

Author Contributions

Conceptualization, I.F. and A.F.; Data curation, G.M.A.-A., A.M.A.M., A.F. and M.R.F.; Formal analysis, H.F.A.-E., A.M.A.M. and M.Z.; Investigation, G.M.A.-A., M.R.F. and I.F.; Methodology, A.F. and I.F.; Project administration, G.M.A.-A. and M.Z.; Resources, G.M.A.-A., M.Z. and J.R.; Software, M.R.F., I.F. and A.M.A.M.; Supervision, G.M.A.-A., M.Z. and J.R.; Validation, M.R.F., H.F.A.-E. and J.R.; Visualization, M.R.F., H.F.A.-E. and M.Z.; Writing—original draft, I.F.; Writing—review and editing, I.F., G.M.A.-A., A.F., M.R.F., A.M.A.M., H.F.A.-E., M.Z. and J.R. All authors have read and agreed to the published version of the manuscript.

Funding

This research received no external funding.

Data Availability Statement

Not available.

Acknowledgments

This work was supported by the Slovak Research and Development Agency under the Contract no. APVV-20-0281. This article was created with co-financing by the Governments of Czechia, Hungary, Poland and Slovakia through Visegrad + Grants from International Visegrad Fund, project ID: 22220131.

Conflicts of Interest

The authors declare no conflicts of interest.

References

  1. Larson, C.L. Experiments on Flow Through Inlet Gratings for Street Gutters; Research Report No. 6-B; Highway Research Board: Washington, DC, USA, 1948; pp. 17–26. [Google Scholar]
  2. Bob, M.; Gallaway, E.; Schiller, J.; Jerry, G. The Effects of Rainfall Intensity, Pavement Cross Slope, Surface Texture, and Drainage Length on Pavement Water Depths; Research Report Number 138-5; Vehicle-Pavement Interaction Research Study Number 28-69-138; Texas Transportation Institute, University College Station: Houston, TX, USA, 1971. [Google Scholar]
  3. Govindaraju, R.S.; Kavvas, M.L. Approximate analytical solutions for overland flows. Water Resour. Res. 1990, 26, 2903–2912. [Google Scholar] [CrossRef]
  4. Jiang, S. Numerical Simulations of Shallow Flow through Curb-Opening Inlets at Various Longitudinal and Cross Slopes. Ph.D. Thesis, Lamar University, Beaumont, TX, USA, 2007. [Google Scholar]
  5. Fang, X.; Jiang, S.; Alam, R. Numerical simulations of efficiency of curb opening inlets. J. Hydraul. Eng. 2010, 136, 62–66. [Google Scholar] [CrossRef]
  6. Kurel, S.; Watanabe, A.; Akabane, Y.; Yamada, T. Field Observations of Discharge and Runoff Characteristics in Urban Catchments Area. In Proceedings of the 11th International Conference on Urban Drainage, Edinburgh, Scotland, UK, 31 August–5 September 2008. [Google Scholar]
  7. Abd-Elhamid, H.; Zelenakova, M.; Vranayova, Z.; Fathy, I. Evaluating the impact of urban growth on the design of storm water drainage system. Water 2020, 12, 1572. [Google Scholar] [CrossRef]
  8. Gómez, M.; Macchione, F.; Russo, B. Methodologies to study the surface hydraulic behaviour of urban catchments during storm events. Water Sci. Technol. 2010, 63, 2666–2673. [Google Scholar] [CrossRef] [PubMed]
  9. Rubinato, M.; Shucksmith, J.; Saul, A.J. Hydraulic performance of a scale model facility and optimization through the use of real time sensors. In Proceedings of the12th International Conference on Urban Drainage, Porto Alegre, Brazil, 11–16 September 2011; pp. 11–16. [Google Scholar]
  10. Rokade, S.; Agarwal, K.; Shrivastava, R. Study on Drainage Related Performance of Flexible Highway Pavements. Int. J. Adv. Eng. Technol. 2012, 3, 334–337. [Google Scholar]
  11. Hsieh, P.-C.; Chen, Y.-C. Surface water flow over a pervious pavement. Int. J. Numer. Anal. Methods Geomech. 2013, 37, 1095–1105. [Google Scholar] [CrossRef]
  12. Haghighi, A. Loop-by-loop cutting algorithm to generate layouts for urban drainage systems. J. Water Resour. Plan. Manag. 2013, 139, 693–703. [Google Scholar] [CrossRef]
  13. Dipanjan, M. Highway Surface Drainage System & Problems of Water Logging in Road Section. Int. J. Eng. Sci. (IJES) 2014, 3, 44–45. [Google Scholar]
  14. Getachew, W.; Tamene, D. Assessment of the Effect of Urban Road Surface Drainage, A Case Study at Ginjo Guduru Kebele of Jimma Town. Int. J. Sci. Technol. Soc. 2015, 3, 164–173. [Google Scholar]
  15. Magdi, E. Investigating Surface Drainage Problem of Roads in Khartoum State. Int. J. Civ. Eng. Technol. (IJCIET) 2016, 7, 91–103. [Google Scholar]
  16. Tu, M.-C.; Traver, R. Clogging Impacts on Distribution Pipe Delivery of Street Runoff to an Infiltration Bed. Water 2018, 10, 1045. [Google Scholar] [CrossRef]
  17. Yakhot, V.; Orsza, A. Renormalization group analysis of turbulence. I. Basic theory. J. Sci. Comput. 1986, 1, 3–51. [Google Scholar] [CrossRef]
  18. Yakhot, V.; Smith, M. The renormalization group, the expansion and derivation of turbulence models. J. Sci. Comput. 1992, 7, 35–61. [Google Scholar] [CrossRef]
  19. Smagorinsky, J. General circulation experiments with the primitive equations. Mon. Weather Rev. 1963, 91, 99–164. [Google Scholar] [CrossRef]
  20. Department of Transport and Main Roads (DTMR). (Road Surface and Subsurface Drainage Design), Road Drainage Manual; State of Queensland: Brisbane, Australia, 2015. [Google Scholar]
  21. Sipahi, O. Calibration of a Grate on a Sloping Channel. Master’s Thesis, Department of Civil Engineering, Middle East Technical University, Ankara, Turkey, 2006. [Google Scholar]
  22. Gómez, M.; Russo, B. Hydraulic Efficiency of Continuous Transverse Grates for Paved Areas. J. Irrig. Drain. Eng. 2009, 135, 225–230. [Google Scholar] [CrossRef]
  23. Sezenöz, B. Numerical Modeling of Continuous Transverse Grates for Hydraulic Efficiency. Master’s Thesis, Middle East Technical University, Ankara, Turkey, 2014. [Google Scholar]
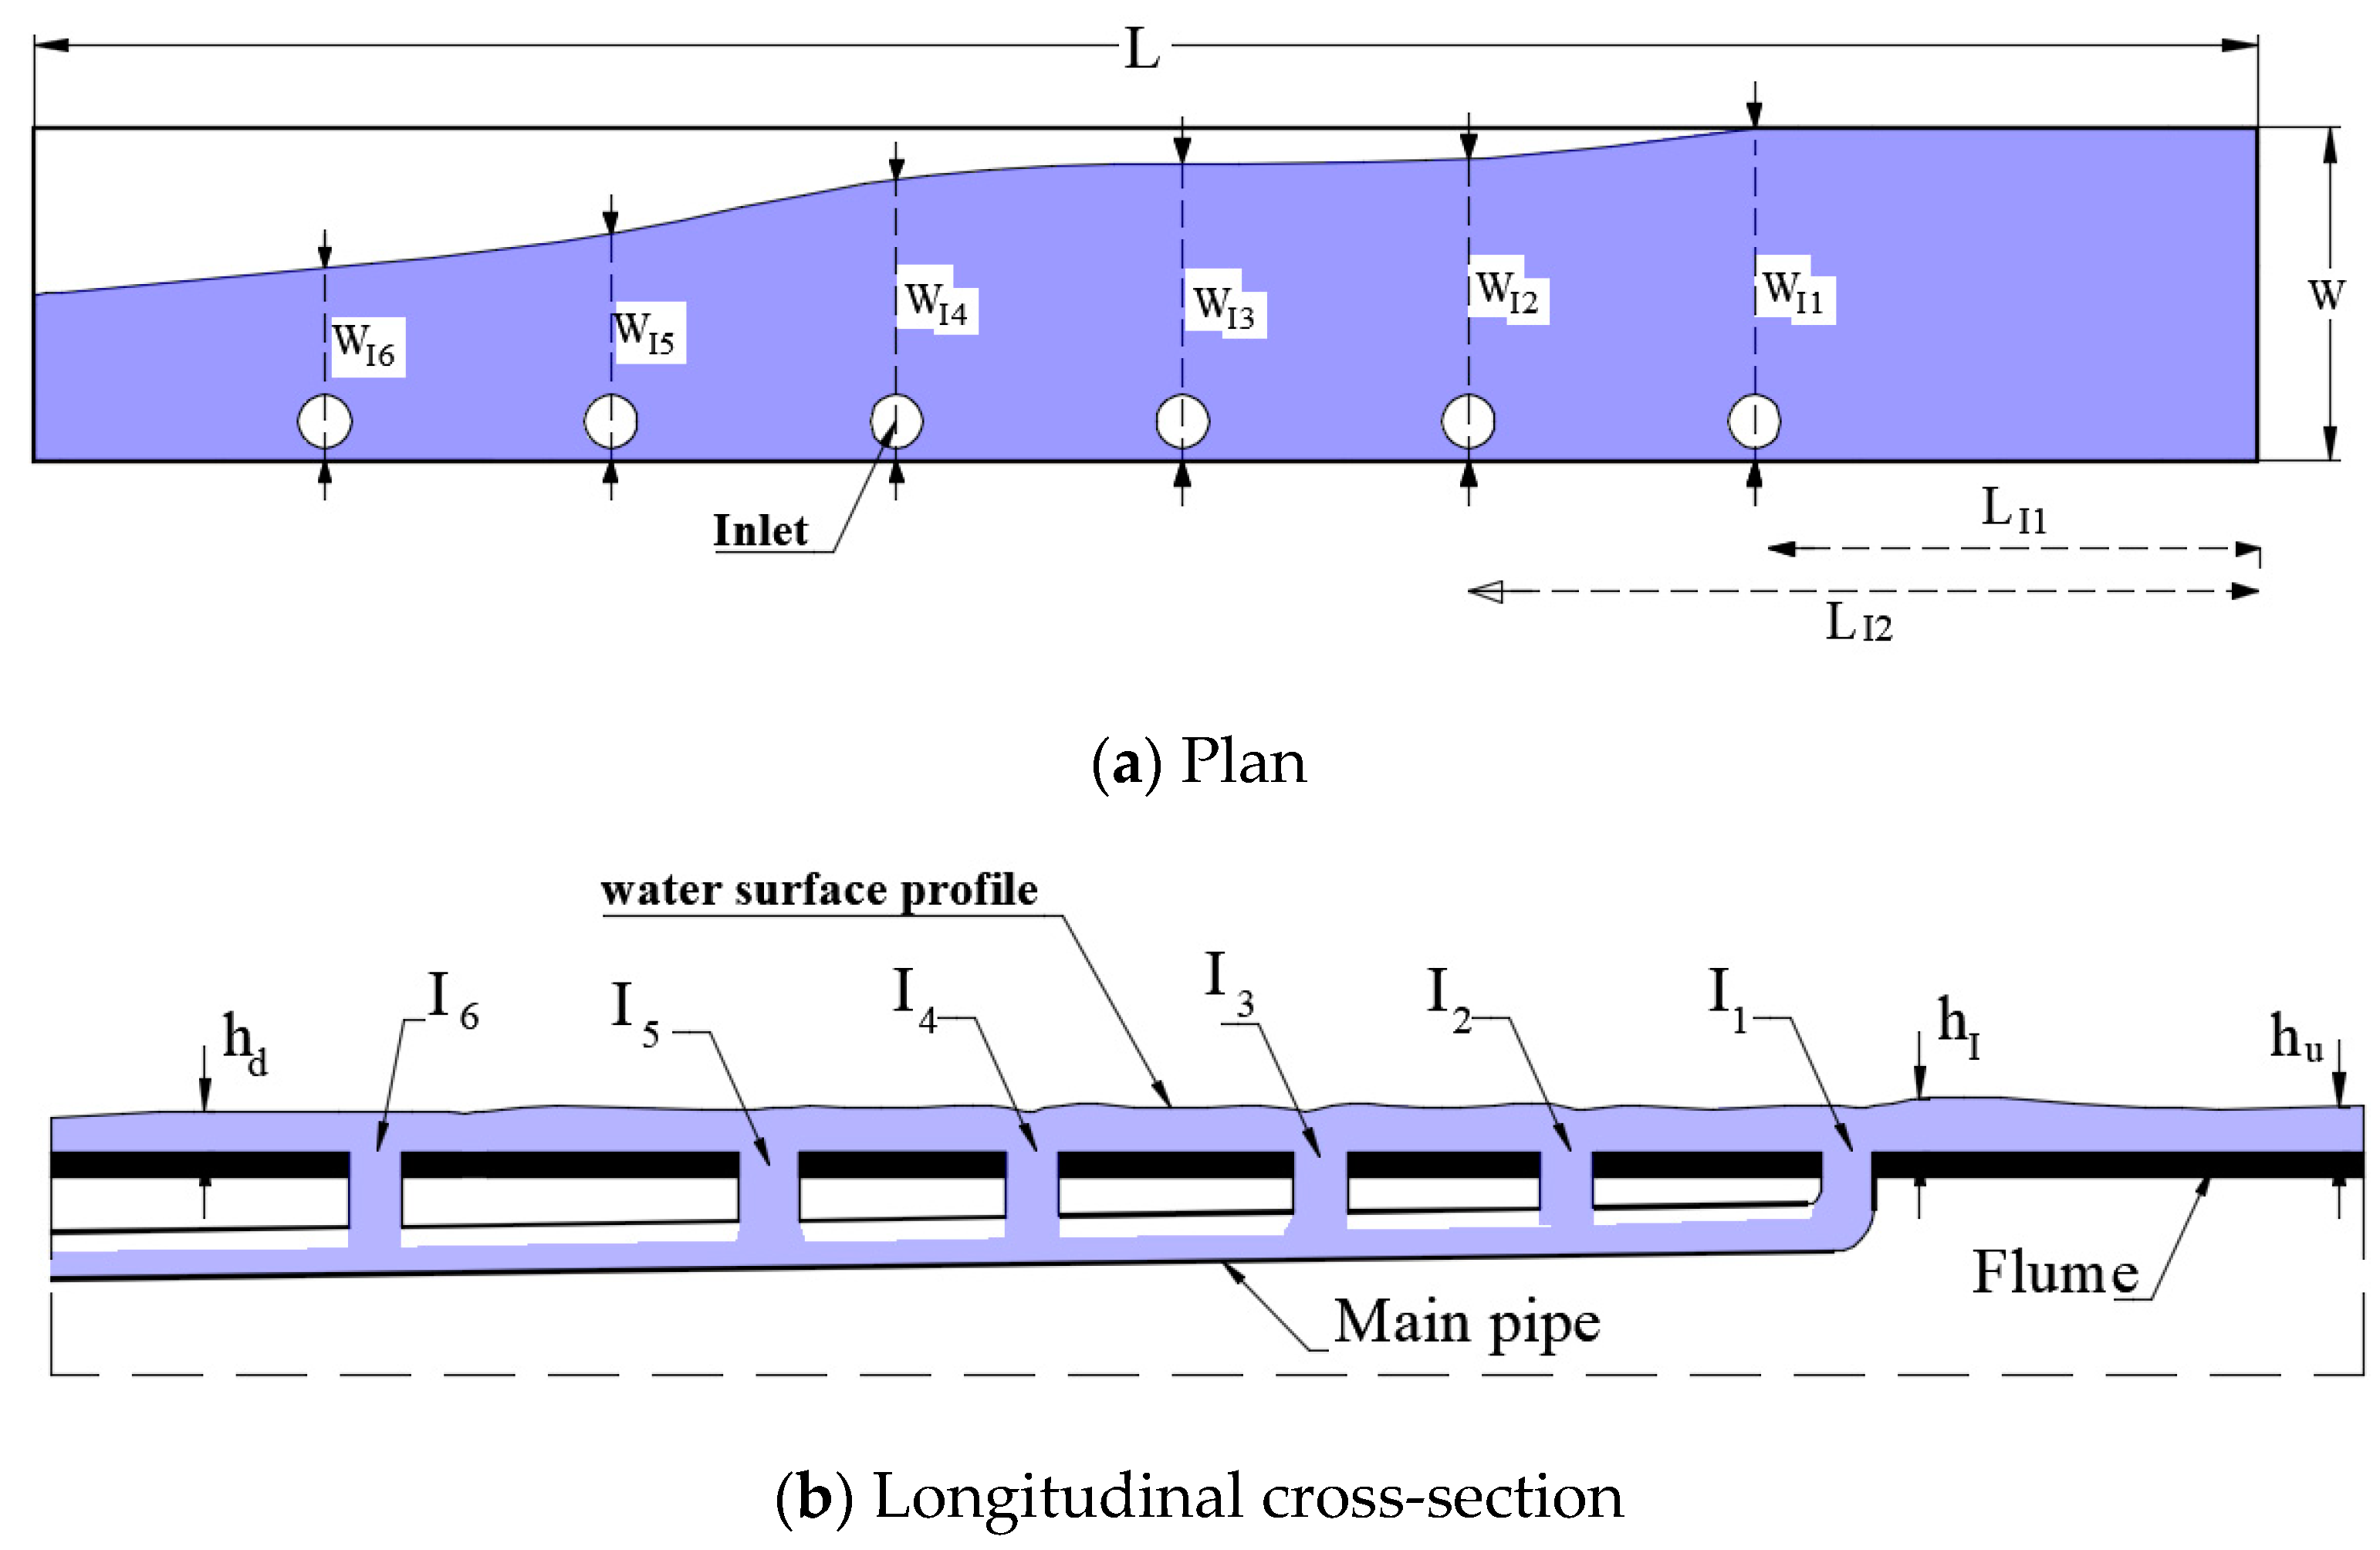
Figure 1. Plan and longitudinal cross section of the flume and main pipe system.
Hydrology 11 00018 g001
Figure 2. Definition sketch of the flume used in the current study.
Hydrology 11 00018 g002
Figure 3. The flume shape.
Hydrology 11 00018 g003
Figure 4. The different inlet intensities along the flume.
Hydrology 11 00018 g004
Figure 5. Relationship between system efficiency (E) and discharge (Q) for different numbers of inlets.
Hydrology 11 00018 g005
Figure 6. The average efficiency (E) for different numbers of inlets (1, 2, 3, 4, 5, 6).
Hydrology 11 00018 g006
Figure 7. Relationship between passing discharge and relative water height with different numbers of inlets.
Hydrology 11 00018 g007
Figure 8. Water surface profile at different inlet discharge rates with six inlets.
Hydrology 11 00018 g008
Figure 9. Relationship between HI and LO for different inlet discharge rates.
Hydrology 11 00018 g009aHydrology 11 00018 g009b
Figure 10. Relationship between relative water spread width and discharge for different numbers of inlets at Q = 1.20 L/S.
Hydrology 11 00018 g010
Figure 11. Mesh of 3D model and block.
Hydrology 11 00018 g011
Figure 12. Boundary conditions and baffle for flow-rate indicator.
Hydrology 11 00018 g012
Figure 13. Water surface and velocity vector for three grates at Q = 2.5L/S.
Hydrology 11 00018 g013
Figure 14. Comparison between experimental and numerical data.
Hydrology 11 00018 g014
Figure 15. Relationship between total discharge and efficiency when using two, three, and six inlets with different discharges.
Hydrology 11 00018 g015
Figure 16. Relationship between total discharge and efficiency for different studies [21,22,23].
Hydrology 11 00018 g016
Figure 17. Measured E versus predicted values from Equation (2).
Hydrology 11 00018 g017
Figure 18. Predicted E versus residuals from Equation (2).
Hydrology 11 00018 g018
Table 1. Efficiency difference of inlet arrangement.
No of GratesAverage Different Efficiency
1 inlet, 2 inlets12%
2 inlets, 3 inlets7%
3 inlets, 4 inlets6%
4 inlets, 5inlets3%
5 inlets, 6 inlets2%
Table 2. Comparison between the current study and other studies.
Items[21] [22] [23] Present Study
Q (L/S)0.25–4.910–1004–5001–10
Number of inlets3116
Area of flume (aF) m2128.258.252.65
Area of inlets (aI) m20.200.30.070.012
AO = aI/aF1.67%3.6%0.85%0.45%
AO/Q0.340.0360.0020.045
Efficiency (E)0.48:0.82%0.275:0.91%0.17:0.99%0.93%
Disclaimer/Publisher’s Note: The statements, opinions and data contained in all publications are solely those of the individual author(s) and contributor(s) and not of MDPI and/or the editor(s). MDPI and/or the editor(s) disclaim responsibility for any injury to people or property resulting from any ideas, methods, instructions or products referred to in the content.