Article

Forecasting Lake Nokoué Water Levels Using Long Short-Term Memory Network

by
Namwinwelbere Dabire
1,2,*,
Eugene C. Ezin
3 and
Adandedji M. Firmin
4
1
National Institute of Water (INE), African Center of Excellence for Water and Sanitation (C2EA), University of Abomey Calavi (UAC), Cotonou 01BP526, Benin
2
Doctoral School of Engineering Sciences (ED-SDI), University of Abomey Calavi (UAC), Cotonou 01BP526, Benin
3
Institute of Training and Research in Computer Science (IFRI), University of Abomey Calavi (UAC), Cotonou 01BP526, Benin
4
Laboratory of Applied Hydrology (LHA), University of Abomey Calavi (UAC), Cotonou 01BP526, Benin
*
Author to whom correspondence should be addressed.
Hydrology 2024, 11(10), 161; https://doi.org/10.3390/hydrology11100161
Submission received: 19 March 2024 / Revised: 6 May 2024 / Accepted: 9 May 2024 / Published: 2 October 2024

Abstract

:
The forecasting of hydrological flows (rainfall depth or rainfall discharge) is becoming increasingly important in the management of hydrological risks such as floods. In this study, the Long Short-Term Memory (LSTM) network, a state-of-the-art algorithm dedicated to time series, is applied to predict the daily water level of Lake Nokoué in Benin. This paper aims to provide an effective and reliable method to enable the reproduction of the future daily water level of Lake Nokoué, which is influenced by a combination of two phenomena: rainfall and river flow (runoff from the Ouémé River, the Sô River, the Porto-Novo lagoon, and the Atlantic Ocean). Performance analysis based on the forecasting horizon indicates that LSTM can predict the water level of Lake Nokoué up to a forecast horizon of t + 10 days. Performance metrics such as Root Mean Square Error (RMSE), coefficient of correlation (R2), Nash–Sutcliffe Efficiency (NSE), and Mean Absolute Error (MAE) agree on a forecast horizon of up to t + 3 days. The values of these metrics remain stable for forecast horizons of t + 1 day, t + 2 days, and t + 3 days. The values of R2 and NSE are greater than 0.97 during the training and testing phases in the Lake Nokoué basin. Based on the evaluation indices used to assess the model’s performance for the appropriate forecast horizon of water level in the Lake Nokoué basin, the forecast horizon of t + 3 days is chosen for predicting future daily water levels.

1. Introduction

Lake Nokoué is at the center of important Benin socio-economic and ecological issues. Hosting lacustrine villages and bordered by three major urban centers (Cotonou, Abomey-Calavi, and Sèmè Podji), the planning and implementation of flood management strategies require a deep understanding of the processes involved in the physical dynamics of Lake Nokoué, of which water level variation is a key parameter. This variation, which can occasionally lead to floods with dramatic repercussions on local populations, is primarily influenced by (i) ocean tides, (ii) hydrological variability of the watershed, and (iii) direct contributions from precipitation. These floods are linked to major river basin floods and the regular overflow of Lake Nokoué. Due to its complex hydrological configuration, hydrological modeling of Lake Nokoué is challenging for hydrodynamic conceptual models due to the non-linearity of explanatory variables [1]. A high water level is associated with a strong freshwater river flow from the Sô River and the Ouémé River, while a low water level is associated with periods when saltwater from the ocean enters Lake Nokoué. Hydrological forecasting models have long been devoted to forecasting river discharge for the proper management of water resource systems. As a result, there is a vast body of literature on the development and application of a wide range of methods for predicting river flow, primarily governed by rainfall. Two types of models can be identified [2,3]: (a) Physical models apply deterministic equations to a set of input variables (such as physiographic characteristics or precipitation) to obtain desired river flow values, while (b) stochastic (statistical) models probabilistically model hydrological phenomena, taking into account the uncertainty of observed data and non-linearity. However, the calculation of physical models is subject to considerable uncertainties, such as the lack of data related to the physical processes of the hydrological system and the limited level of scientific knowledge concerning natural systems like water bodies. These limitations of physical models negatively impact the quality of forecasts, especially as domain experts require accurate results associated with minimal computational time for optimal decision-making. According to [4], these techniques are limited by the understanding of flood dynamics (variations in flood wave propagation time in hydrographic networks) or by the different types of hydrological fluxes that influence water bodies.
Contrary to physical models, stochastic models function as black boxes on observational data without any consideration of the internal structure of the system [5,6,7,8,9,10]. Furthermore, stochastic models adapt to the non-linearity of hydrological processes and address uncertainties in parameter estimations [11,12]. On the other hand, stochastic models introduce various techniques for flood estimation, ranging from simple regression of discharge to detailed modeling of hydrological processes. However, stochastic models are criticized for being more data-intensive, requiring in-situ observation data to ensure reliable forecasting [13,14]. A variety of stochastic models have been proposed for hydrological flow forecasting. Two major categories can be distinguished: time series models and regression models. The former is primarily based on modeling the autocorrelation structure of hydrological flows (water level or discharge), while the latter focuses on the correlation between input and output variables regardless of the temporal structure [15,16]. Therefore, according to [17], typical input variables such as precipitation forecasts are used to predict the output variable (future water levels of water bodies or future streamflow). Some regression models, such as linear regression, principal component regression, partial least squares regression, and wavelet regression, are commonly used for univariate time series forecasts that present linear characteristics [18]. Moreover, classic time series models such as ARIMA (Auto Regressive Integrated Moving Average) models are not suited for long-term dependencies. This does not provide information about the shape of the water level curve during these long periods, lacking precision on when the water level will reach a critical level that could lead to disasters. There are also a number of regression models such as highly non-linear recurrent neural networks represented by Long Short-Term Memory (LSTM), generic recurrent cell or standard Recurrent Neural Networks (RNNs), and Gated Recurrent Units (GRUs) that are widely used to predict hydrological flows [19,20,21]. However, these models can only model and predict a few days (or data points) at a time, which is useful for detecting future extremes but not for forecasting the overall trends of the water level evolution process. In particular, the application of LSTM in several domains has proven powerful for achieving hydrological forecasts, which is beneficial for managing hydrological extremes such as floods [22]. LSTMs belong to the category of stochastic models that learn features to extract useful information from sequential data for future forecasting of hydrological behavior, but without any understanding of the internal structure of the hydrographic basin. This technique has been successfully applied in hydrological modeling and has shown significant computational power in several studies of hydrological flow modeling, such as streamflow forecasting, yielding more accurate results [23,24,25]. Despite the importance of monitoring the water level of Lake Nokoué and the use of conceptual models to explain its fluctuations, the inefficiency of these conceptual models in accounting for the non-linearity of variables coupled with the complexity of this water body remain major challenges in implementing appropriate flood management measures.
To address the challenges posed by the non-linearity of variables coupled with the complexity of Lake Nokoué and guide decision-making in the implementation of prevention plans, the study aims to apply LSTM for Lake Nokoué water level forecasting. LSTM belongs to the category of recurrent neural network methods that not only solve the gradient instability problem but also address the issue of preserving information over long sequences in time series data. Gradient instability in time series with recurrent neural networks is a common issue that can arise during the training of these models. It occurs when the gradients used to update the network weights become too large or too small, leading to convergence or divergence problems during training. To mitigate gradient instability in RNNs, several techniques can be used, including the utilization of LSTM layers. This model will be performed at different time horizons to identify the suitable horizon for predicting the water level of Lake Nokoué.
The contributions of this study are the following:
-
It is the first attempt to apply artificial intelligence models to a complex water body in order to assess the performance of these models in establishing the nonlinear relationship between input variables and output.
-
We also propose and implement a recurrent neural network model to leverage the set of input variables for forecasting the water level of Lake Nokoué.

2. Materials and Methods

2.1. Study Area

Lake Nokoué, (Figure 1), is located in the southeast of Benin, between 6°25′ N and 2°36′ E, covering an area that varies between 150 km2 and 170 km2, respectively, during the low-water period and high-water period, respectively [26,27,28,29]. It stretches for approximately 20 km from east to west along the coast and 11 km from south to north, as confirmed by multiple authors such as [27,28]. The average and maximum depths of the Lake Nokoué are approximately 1.3 m and 2.9 m, respectively. Towards the Cotonou channel, the Lake Nokoué deepens, and the average and maximum depths reach around 3 m and 8 m, respectively. Two rivers flow into Lake Nokoué: on its northern bank is the Sô-Ava River, which drains a watershed area of approximately 10,000 km2, and the Ouémé River, the largest river in Benin, which drains a watershed area of approximately 50,000 square kilometers [26,28]. The Djonou River, with a smaller extent and flow, also contributes to the freshwater input in the southwestern part of Lake Nokoué. In the southern part, Lake Nokoué is connected to the Atlantic Ocean through the Cotonou channel, which is 280 m wide and approximately 4 km long [26,29]. Through this canal, constructed in 1885, exchanges of freshwater and saltwater occur in accordance with the tides and hydrological regime [1]. The canal of Tochè, approximately 4 km long, connects the Porto Novo lagoon, with an area of approximately 35 km2, to Lake Nokoué on the eastern side, with little effect on the dynamics of Lake Nokoué. At a seasonal scale, the hydrological regime of Lake Nokoué is determined by the West African summer monsoon, resulting in two rainy seasons and two dry seasons [1]. These seasons are linked to the north-south movement of the intertropical convergence zone and the associated belt of intense tropical rainfall. The main rainy season extends from April-May to the end of July when the intertropical convergence zone moves northward from its southern position near the equator. The second rainy season, shorter and less intense, occurs from late September to November when the intertropical convergence zone migrates southward from its northernmost position. However, this dual rainy season, along with local precipitation, has only a weak influence on the water level of Lake Nokoué. Lake Nokoué is more influenced by the hydrology of the central part of Benin, where the main basin of the Ouémé River is located [29]. This region is characterized by a single rainy season with peak precipitation occurring between July and October [29,30]. The period from September to October is when the maximum flow enters Lake Nokoué.

2.2. Data Acquisition

The data used in this study include a times series of daily water level observations expressing flood-recession events, a series of rainfall observations, and a series of discharge observations provided by the National Meteorological Agency of Benin (METEO-Benin) and the General Directorate of Water of Benin (DGEau).

2.3. Data Preprocessing

Preprocessing of the variables is necessary to account for the full range of values (both low and high) and to avoid sigmoid saturation with the high values in the database [31]. Indeed, the direct application of the sigmoid function to the weighted sums of rainfall-discharge inputs results in the neglect of information from low numerical values (rainfall and water levels) compared to high numerical values (discharge). This preprocessing step involves normalizing all values in the database between −1 and 1. This is performed through the following Equation (1):
X n o r m a l i z e d = X i X m e a n std
where Xi is the actual value to be normalized, Xmean is its mean, and Xnormalized is the normalized value. This transformation scales the input data between [−1, 1].

2.4. Structure of the Long Short Term Memory Model

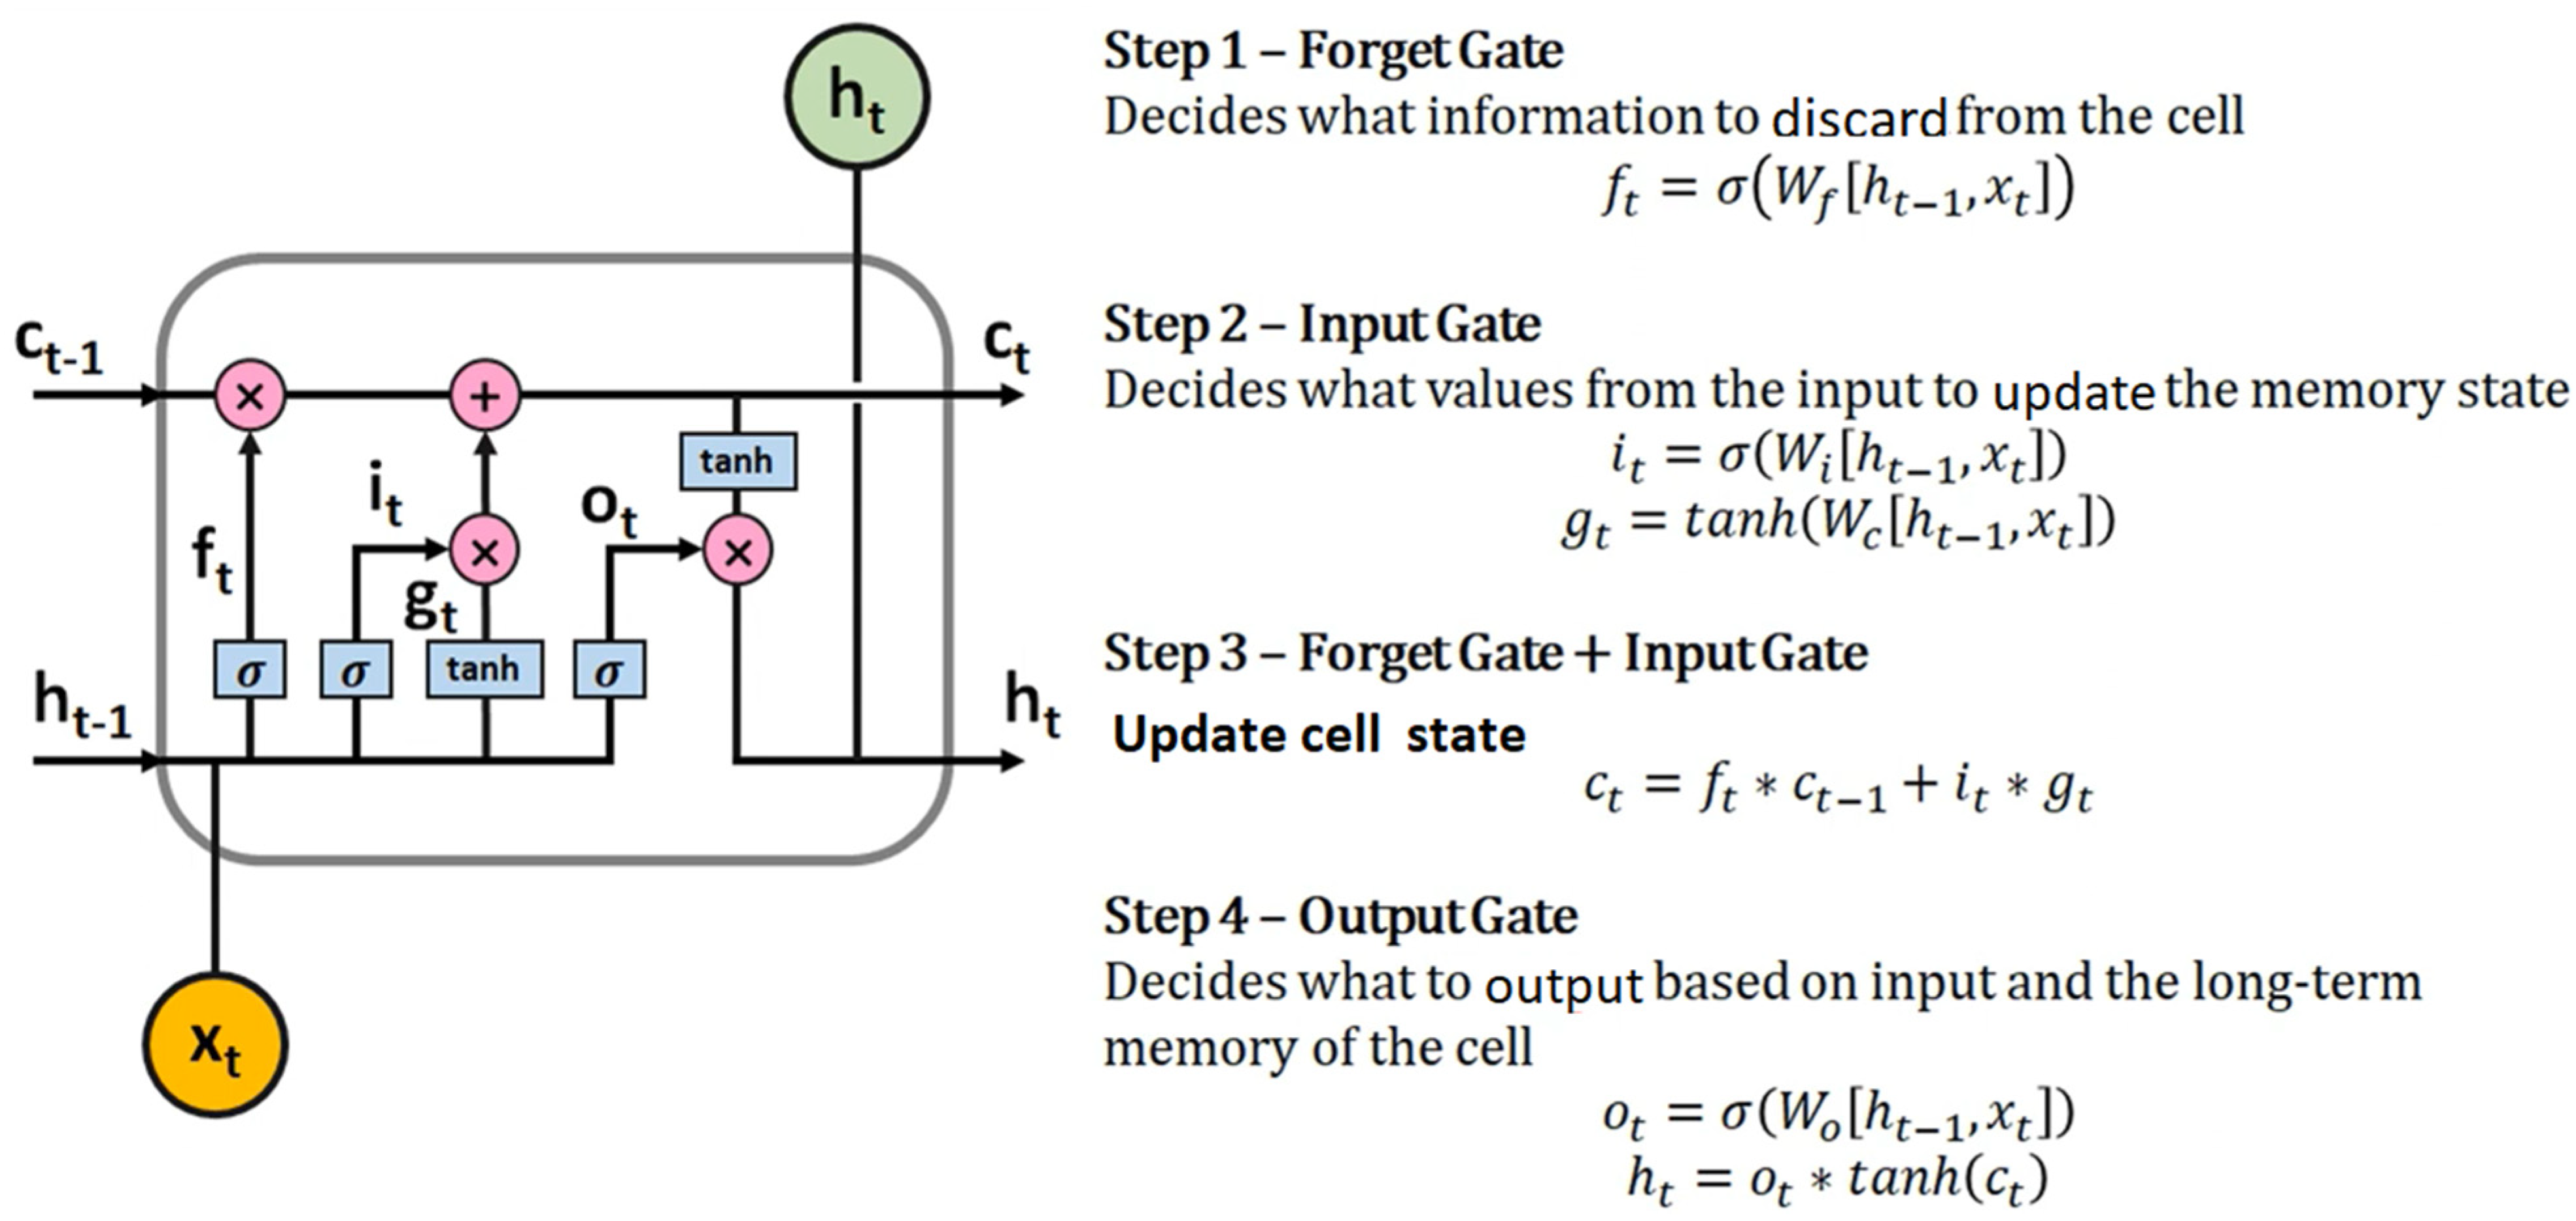
The Long Short-Term Memory (LSTM) cell is an enhancement of the optimization proposed in [32]. Considered a black box, the LSTM cell, widely used in time series forecasting, is an impressive architecture of an artificial recurrent neural network (RNN) capable of memorizing the temporal order of data. Furthermore, the LSTM overcomes the issues of gradient instability and insufficient memory capacity through the state of its cells and gates [33]. The two main problems of the RNN architecture are gradient instability and its inability to retain information from long sequences of temporal data. In contrast, the LSTM cell, as a deep learning predictive model, receives the latent states from the previous step and has a self-evaluation mechanism that offers better performance in time series forecasting. The internal structure of the LSTM consists of three main gates that control the flow of information: (i) forgetting unwanted information in the current cell state through the forget gate (ft), (ii) adding additional data to the current cell state through the input gate, also known as the temporal attention module (It), and (iii) producing an output from the current cell state through the output gate (Ot). These gates serve specific operations on the cell states. The state of the LSTM network is divided into two states: ht and ct. The hidden state ht of the LSTM network is considered as short-term memory, while the cell state ct is considered as long-term memory of the network. The operations performed within the LSTM cells help the model retain information from sequential data. The LSTM network uses cells as memory units for the model. The gates, as shown in Figure 2 and illustrated in Equations (1) and (4)–(6), determine the data to be carried.
(a)
Step 1: the forget gate
The forget gate represented by F t in Figure 2 plays a very important role in LSTM model training. In fact, it is the essence of LSTM design. LSTM can selectively memorize important information, which is mainly realized by the forget gate. The hidden layer output result h t 1 of the previous time t − 1 is transferred to the cell at time t, and the input value x t at time t enters the forget gate along with it. The responsibility of the forget gate is to control the extent to which h t 1 and x t are forgotten; the calculation method is as follows in Equation (2):
F t = σ ω f h t 1 , x t
where:
-
Ft is the value of forget gate at time step t, and the range of Ft is 0–1;
-
σ is the sigmoid activation function;
-
ω f represent the weight of the forget gate, respectively;
-
h t 1 is the hidden layer output result of the previous time t − 1; and
-
x t is the Current input value at time t.
Furthermore, the forget gate measures its value by each input. If the input is not beneficial to the whole sequence information, it will be discarded as unimportant. If the value of F t is close to 1, the input value x t at time t will be forgotten, and vice versa, in which case F t will be calculated and passed to the cell state. LSTM uses selective forgetting to store effective information to ensure long-term memory, rather than the total absorption nature of the RNN method.
(b)
Step 2: the input gate
The input gate represented by Equations (4) and (5) controls which important information will be updated and stored in the memory unit.
I t = σ ω i h t 1 , x t
G t = tan h σ ω c h t 1 , x t
where:
-
I t is the value of input gate at time step t, and it is also calculated by the activation function sigmoid, with a value range of 0–1;
-
ω i and bi represent the weight and deviation of the input gate, respectively;
-
G t is the cell update candidate; tan h means the hyperbolic tangent function; and
-
ω c and bc represent the weight and deviations of the cell, respectively. The purpose of introducing the cell update candidate C t is to multiply its calculation results by I t and pass to the cell state as the output of the input gate.
(c)
Step 3: Update cell state
The cell state is used in combination with the forget gate layer to store information. By comparing the value of the input result at time t and the output result of the forget gate, it can be determined whether to pass more previous output results to the output gate or add more current input information to the sequence. This step is to ensure that important information is saved and redundant or unimportant information is discarded. Updating calculation of Ct is shown in Equation (3):
C t = F t × c t 1 + I t × G t
where:
-
C t is current cell state at time step t;
-
c t 1 is previous cell output the value of cell state of the previous time t − 1; and
-
the updated C t at time t + 1 will be passed to the next cell as the input.
(d)
Step 4: the output gate
The output gate controls how the information flow of the cell state at time t enters the hidden layer at time t + 1. The output gate also uses its defined weight ω o to calculate O t . The calculation formulas are as follows in Equations (6) and (7):
O t = σ ω o h t 1 , x t
H t = O t × tan   h C t
where:
-
O t is the value of output gate at time step t;
-
ω o represent the weight of the output gate, respectively; and
-
H t is the output result of the hidden layer at time t.
Each gate of LSTM has its own unique parameter group weight term ω . Additionally, there is a weighted sum of the new input and the output of the previous hidden layer in each cell, which shows significant long-term memory characteristics and is easier to train. The most important facet is to make up for the shortcomings of the traditional RNN model. The activation function endows neural networks with nonlinear characteristics. Therefore, the correct selection of activation function can improve the data processing ability of these networks and make the simulation results closer to the observation values. It can also improve the computational efficiency of the networks. The initialization of weights is affected by random starting values, which leads to the uncertainty of LSTM in training. In this study, we selected Adam as the stochastic optimization method [34].

2.5. Long Short-Term Memory Model Configuration

In this work, optimizing the performance of the LSTM model involves selecting the input variables, determining the appropriate network architecture, optimizing network learning, and using a reliable validation methodology. The LSTM network, as explained earlier, consists of an input layer, a single hidden layer, and an output layer with sigmoid activation functions for the artificial neurons and a hyperbolic tangent for the hidden states. The optimal initialization of the model’s learning algorithm parameters, such as the number of hidden neurons, the optimization function, the number of iterations, and the batch size for performance estimation is performed using the random search cross-validation method (random SearchCV) to determine the appropriate parameters and hyperparameters of the model. To fit the model, we used adam as an optimizer function with ten epochs. The best parameters of the architecture in this paper were composed of three layers (one input layer, one hidden layer and one output layer). The length of sequence input was 14 observed data of all features. The number of neurons for the hidden layer was 50 with hyperbolic tangent as the activate function and sigmoid was used as the recurrent activate function. The best time horizon for forecast was t + 3. The preprocessed database is divided into two parts:
-
the part intended for training to recognize the system’s dynamics, which is the most important part (80%);
-
the testing part (20%) which prevents overfitting by checking and testing the loss function evolution during training and validation. After the training is stopped and the weights of the interconnections of the most performing model are saved. The validation dataset allows for confirmation of the LSTM model’s performance.

2.6. Model Performance Assessment

To ensure synchronization between the observed flood and the one estimated by the LSTM model, we rely on a qualitative evaluation of the LSTM model using various evaluation criteria. There is a wide range of performance evaluation criteria for hydrological models proposed by the World Meteorological Organization and other authors [9,31,32,34]. To ensure the reliability of the LSTM model results in this study, we used the four most relevant metrics (Equations (8)–(11)). These criteria include the Nash criterion, the Root Mean Square Error (RMSE), the Mean Absolute Error (MAE), and the coefficient of determination (R2).
NASH = 1 i = 1 N Q i Q i 2 i = 1 N Q i Q ¯ 2
RMSE = i = 1 n Q o b s i Q s i m i 2 n
MAE = 1 n i = 1 n Q o b s i Q ¯ s i m i
R 2 = 1 i = 1 n Q o b s i Q s i m i 2 i = 1 n Q o b s i Q ¯ o b s 2

3. Results and Discussion

3.1. Variable Selection and Statistics

3.1.1. Selection of the Variables

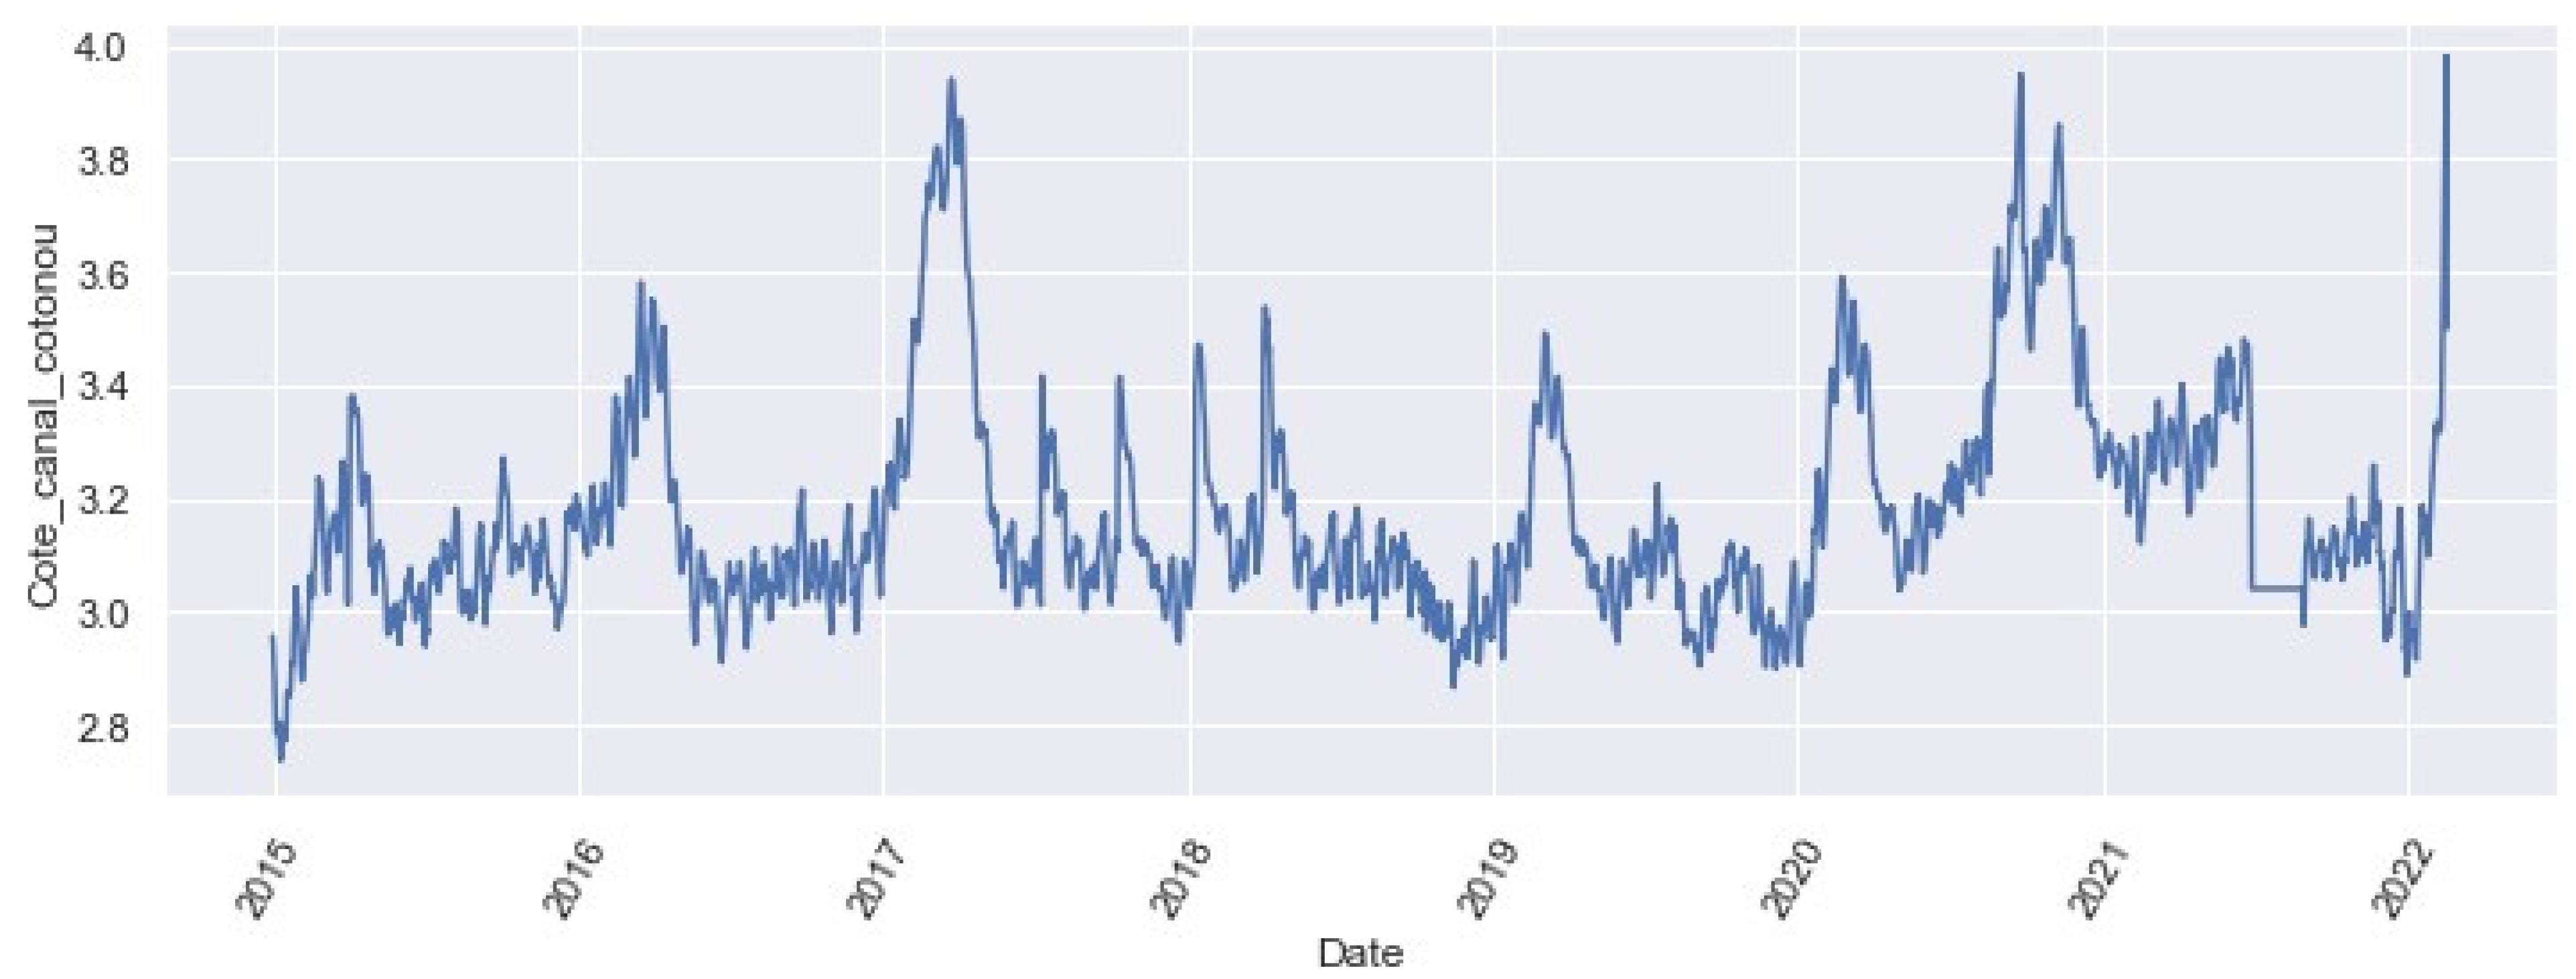
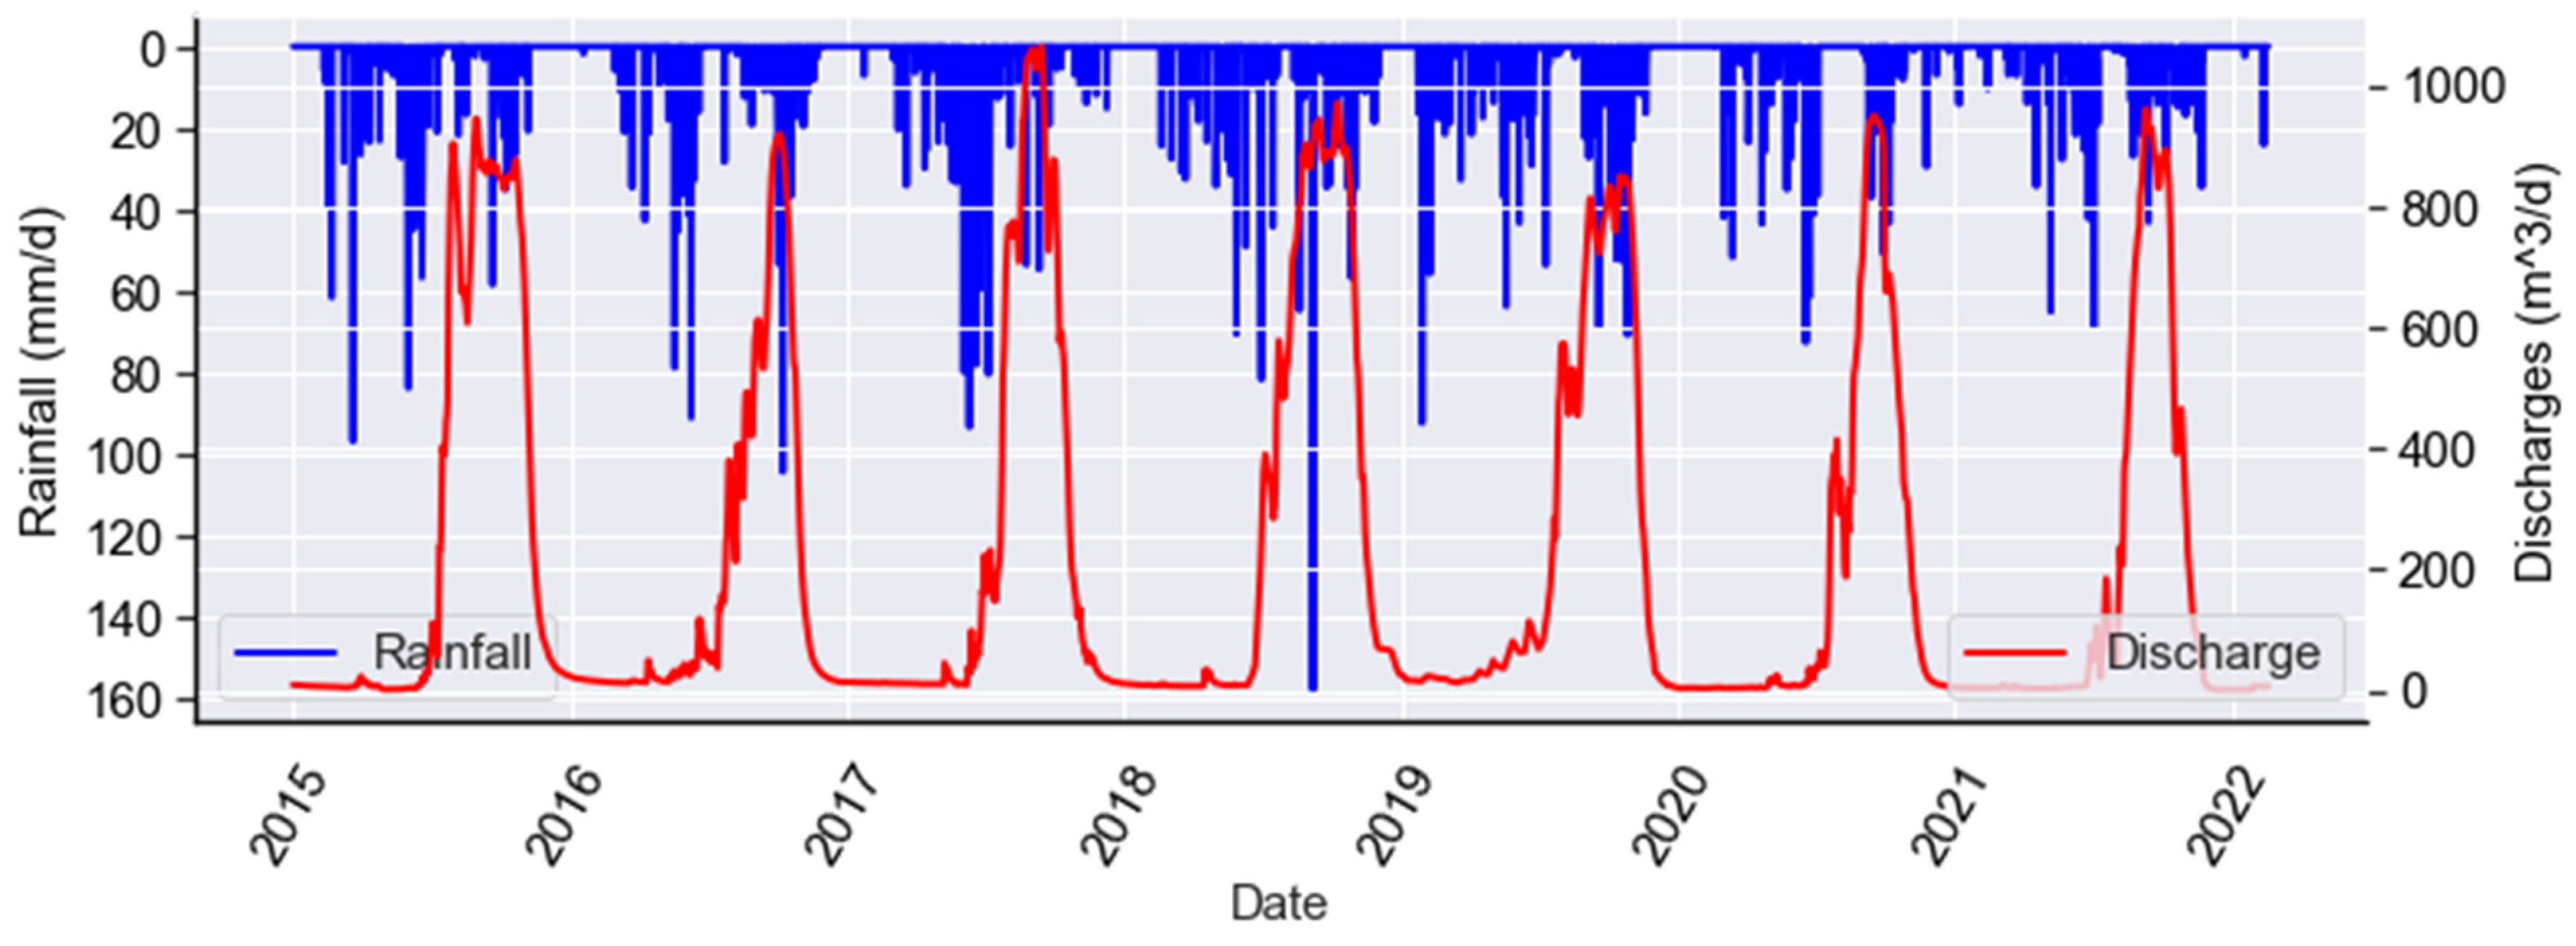
The variables selected for the model following forward feature selection are presented in Figure 3 and Figure 4. Rainfall, discharge of the Ouémé River and water level in Lake Nokoué were the predominant predisposing factors in the Lake Nokoué. Rainfall and discharge were selected as input for the model and the output was the water level of Lake Nokoué.

3.1.2. Statistics of the Variable

The statistical results of the variables are explained in Table 1. These values of the discharge variable were the among values, presenting mean and max values above 219.113 and 1064.000, respectively. The variation in the water level of Lake Nokoué is strongly influenced by rainfall [35,36,37,38].

3.2. Model Performance Analysis

The evaluation of a model’s performance is an integral step in modeling. In this study, the RMSE, NSE, R2 and MAE were used to assess model accuracy. The resulting RMSE, NSE, R2 and MAE scores for the LSTM model are shown in Table 2 for different forecast horizons. Depending on the forecasting horizon from t + 1 day to t + 10 days, the values of all performance criteria show a nearly stable pattern during both phases. The values of all performance criteria remain constant for the forecast horizons of t + 1 day, t + 2 days, and t + 3 days (Table 2). Additionally, the R2 value is greater than 0.97 in the calibration phase and greater than 0.96 in the validation phase. These satisfactory results demonstrate that the LSTM model performs well in both periods (the calibration phase, also known as the learning phase, and the validation phase, also known as the testing phase). It is capable of reliably reproducing the observed water levels in the Lake Nokoué basin up to a forecast horizon of t + 10 days. This enables significant proactive anticipation of flood events.
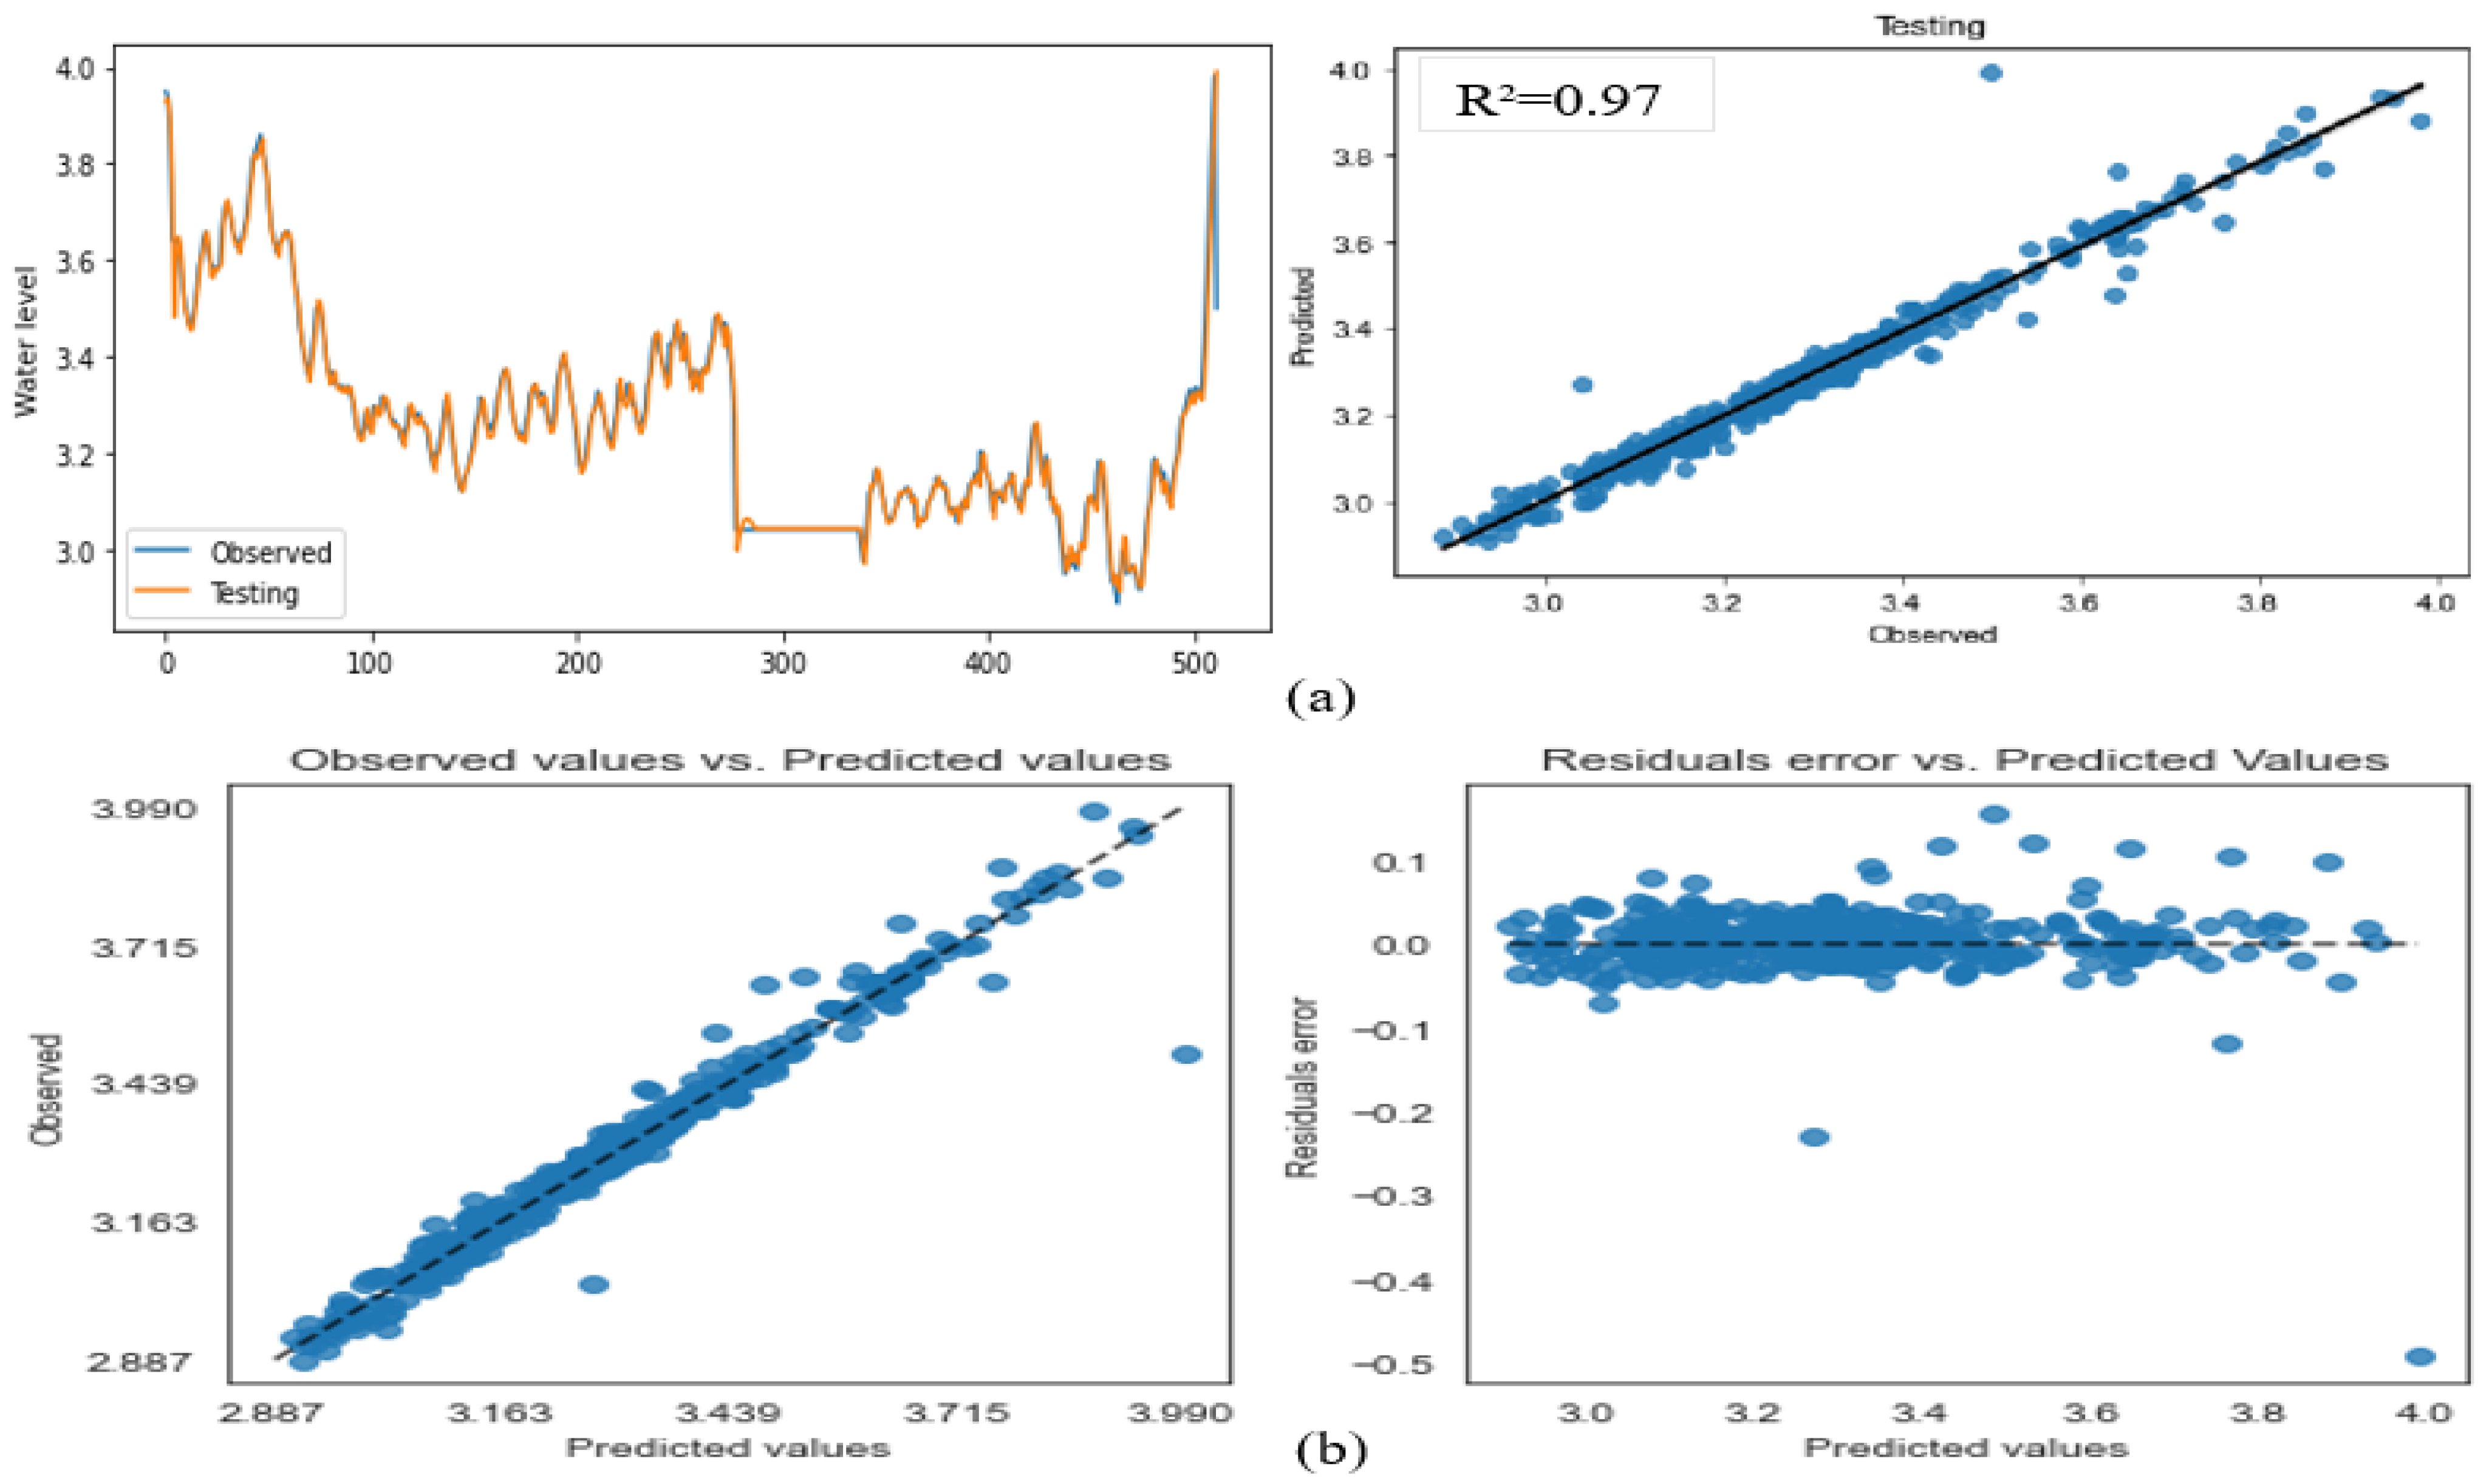
The adaptability of LSTM to the Lake Nokoué basin during the calibration and validation periods is also supported by the convergence of the loss function evolution during both phases, as shown in Figure 5. Correspondingly, the results from Ling et al. [39] showed that the method proposed in this article was more effective than other methods of artificial recurrent neural networks. The loss function values decrease with the number of iterations, stabilizing below 0.1, indicating maximum optimization of the model’s performance during the calibration and validation phases. Given the architecture of the LSTM model, it was noted in the study by Hu et al. [40] a tendency of the LSTM model towards a local optimum. The hydrographs of observed and predicted water levels by the LSTM model during the calibration and validation phases are depicted in Figure 6a,b. It is evident that the observed and predicted floods and recessions are nearly identical. This synchronization between observed and estimated floods demonstrates the LSTM model’s ability to reproduce critical water levels that could lead to flooding. Recently, a number of existing literature studies have considered the classification of streamflow forecasting using recurrent neural network models. Thapa et al. [41] developed a deep learning long-short-term memory (LSTM)-based model in the Himalayan basin for snowmelt-based discharge modeling. Ni et al. [42] applied the deep learning method for daily flow simulation and used data from previous years for flow forecasting. The model was carried out according to several perspectives. At the end of the study, it was found that the LSTM model was advantageous in processing constant flow data in the dry season and gave satisfying results in capturing data features in rapidly fluctuating flow data in rainy seasons. Luo et al. [43] built a new hybrid model based on the long-short-term memory approach for predicting streamflow. In this study, the linear regression model, which is one of the classical methods, was used to show how successful the performance between the benchmark model and the hybrid model was. The satisfactory forecasting results are further evident in Figure 7a,b and Figure 8a,b, which present scatter plots of predicted (estimated) water levels against observed water levels. The linear trend line of the scatter plots during the training (calibration) and testing (validation) phases highlights the strong correlation between observed and predicted water levels, with a correlation coefficient of 0.98 during calibration and 0.97 during validation (Table 2). This linear alignment, particularly for water levels between 3.5 m and 3.9 m, indicates that the LSTM model accurately predicts extreme water levels in Lake Nokoué that could lead to flooding. Figure 7b and Figure 8b illustrate a good distribution of the LSTM model’s residual errors, with values ranging from −0.1 to 0.4 during the training phase and −0.5 to 0.1 during the testing phase. Negative residual errors indicate an overestimation of water levels, while positive residual errors indicate an underestimation of water levels in Lake Nokoué by the LSTM model. These underestimations and overestimations remain acceptable for predicting extreme water levels in Lake Nokoué.

4. Conclusions

Our approach offers a tool for water level assessment at the Lake Nokoué scale. This can help decision-makers in implementing appropriate preventive and adaptive measures, thereby contributing to more effective flood management. It is important to note that forecasting models based on LSTM are not infallible because the LSTM model does not consider the initial hydrological conditions. They rely on available training data and underlying assumptions. Therefore, it is essential to continuously monitor the model’s performance and update the training data if necessary. Additionally, the expertise of forecasters, combined with the analysis of the model’s results, is crucial for interpreting and properly utilizing the generated forecasting. In terms of future prospects, the study suggests applying the forecasting method based on LSTM to other lakes and rivers to improve water level forecasting. Additionally, exploring hybrid model machine learning-based forecasting methods is recommended to improve the accuracy of forecasts. Furthermore, it is important to continue collecting data on water levels, precipitation, and river flow rates to enhance the quality of forecasts.

Author Contributions

Conceptualization, N.D. and E.C.E.; methodology, N.D.; software, N.D.; validation, N.D., E.C.E. and A.M.F.; formal analysis, A.M.F.; investigation, E.C.E.; data curation, N.D.; writing—original draft preparation, N.D.; writing—review and editing, N.D., E.C.E. and A.M.F.; visualization, N.D.; supervision, E.C.E. and A.M.F.; project administration, E.C.E.; All authors have read and agreed to the published version of the manuscript.

Funding

The research was funded by, World Bank and French Development Agency grant number [272] and The APC was funded by [272].

Data Availability Statement

The data presented in this study are available on request from the corresponding author via email at [email protected].

Acknowledgments

This work is supported in part by the World Bank and the French Development Agency through “Centre d’Excellence pour l’Eau et l’Assainissement en Afrique (C2EA)” of University of Abomey-Calavi in Benin. The authors would like to thank the reviewers for their constructive comments, which have certainly improved the quality and readability of the article.

Conflicts of Interest

The authors declare that there are no conflicts of interest.

References

  1. Chaigneau, A.; Okpeitcha, O.V.; Morel, Y.; Stieglitz, T.; Assogba, A.; Morgane, B.; Allamel, P.; Honfos, J.; Thierry Derol Awoulmbang, S.; Retif, F.; et al. From seasonal flood pulse to seiche: Multi-frequency water-level fluctuations in a large shallow tropical lagoon (Nokoue Lagoon, Benin). Estuar. Coast. Shelf Sci. 2022, 267, 107–767. [Google Scholar] [CrossRef]
  2. Ngoc, D.V. Deterministic Hydrological Modeling for Flood Risk Assessment and Climate Change in Large Catchment: Application to Vu Gia Thu Bon Catchment, Vietnam. Ph.D. Thesis, Université Nice Sophia Antipolis, Valbonne, France, 2015. [Google Scholar]
  3. Rebolho, C. Modélisation conceptuelle de l’aléa inondation à l’échelle du bassin versant. Hydrologie. Ph.D. Thesis, AgroParisTech, Paris, France, 2018. [Google Scholar]
  4. Golob, R.; Štokelj, T.; Grgič, D. Neural-network-based water inflow forecasting. Control. Eng. Pract. 1998, 6, 37–98. [Google Scholar] [CrossRef]
  5. Ancona, M.; Corradi, N.; Dellacasa, A.; Delzanno, G.; Dugelay, J.-L.; Federici, B.; Gourbesville, P.; Guerrini, G.; La Caméra, A.; Rosso, P.; et al. On the Design of an Intelligent Sensor Network for Flash Flood Monitoring, Diagnosis and Management in Urban Areas Position Paper. Procedia Comput. Sci. 2014, 32, 941–946. [Google Scholar] [CrossRef]
  6. Chen, L.; Singh, V.P. Flood forecasting and error simulation using copula entropy method. In Advances in Streamflow Forecasting; Sharma, P., Machiwal, D., Eds.; Elsevier: Amsterdam, The Netherlands, 2021; Volume 6, pp. 331–368. [Google Scholar]
  7. Chu, H.; Wu, W.; Wang, Q.J.; Nathan, R.; Wei, J. An ANN-based emulation modeling framework for flood inundation modeling: Application, challenges and future direction. Environ. Model. Softw. 2019, 19, 104–587. [Google Scholar]
  8. Bornancin Plantier, A. Conception de Modèles de Prévision des Crues Eclair par Apprentissage Artificiel. Ph.D. Thesis, Université Pierre et Marie Curie, Paris, France, 2013. [Google Scholar]
  9. Kharroubi, O.; Blanpain, O.; Masson, E.; Lallahem, S. Application du réseau des neurones artificiels à la prévision des débits horaires: Cas du bassin versant de l’Eure, France. Hydrol. Sci. J. 2016, 61, 541–550. [Google Scholar] [CrossRef]
  10. Peredo, D.; Ramos, M.-H.; Andréassian, V.; Oudin, L. Investigating hydrological model versatility to simulate extreme flood events. Hydrol. Sci. J. 2022, 67, 628–645. [Google Scholar] [CrossRef]
  11. Meliho, M.; Khattabi, A.; Driss, Z.; Orlando, C.A. Spatial forecasting of flood susceptible zones in the Ourika watershed of Morocco using machine learning algorithms. Appl. Comput. Inform. 2022, 9. [Google Scholar]
  12. Noor, F.; Haq, S.; Rakib, M.; Ahmed, T.; Jamal, Z.; Siam, Z.S.; Hasan, R.T.; Adnan, M.S.G.; Dewan, A.; Rahman, R.M. Water Level Forecasting Using Spatiotemporal Attention-Based Long Short-Term Memory Network. Water 2022, 14, 612. [Google Scholar] [CrossRef]
  13. Alliau, D.; De Saint Seine, J.; Lang, M.; Sauquet, E.; Renard, B. Étude du risque d’inondation d’un site industriel par des crues extrêmes: De l’évaluation des valeurs extrêmes aux incertitudes hydrologiques et hydrauliques. La Houille Blanche 2015, 101, 67–74. [Google Scholar] [CrossRef]
  14. Morel, Y.; Chaigneau, A.; Okpeitcha, V.O.; Stieglitz, T.; Assogba, A.; Duhaut, T.; Rétif, F.; Peugeot, C.; Sohou, Z. Terrestrial or oceanic forcing ? Water level variations in coastal lagoons constrained by river inflow and ocean tides. Adv. Water Resour. 2022, 169, 104–309. [Google Scholar] [CrossRef]
  15. Fathian, F. Introduction of multiple/multivariate linear and nonlinear time series models in forecasting streamflow process. In Advances in Streamflow Forecasting; Sharma, P., Machiwal, D., Eds.; Elsevier: Amsterdam, The Netherlands, 2021; Chapter 3; pp. 87–113. [Google Scholar]
  16. Wang, L.; Dong, H.; Cao, Y.; Hou, D.; Zhang, G. Real-time water quality detection based on fluctuation feature analysis with the LSTM model. J. Hydroinformatics 2023, 5, 127–305. [Google Scholar] [CrossRef]
  17. Masselot, P.; Dabo-Niang, S.; Chebana, F.; Ouarda, T.B.M.J. Streamflow forecasting using functional regression. J. Hydrol. 2016, 538, 754–766. [Google Scholar] [CrossRef]
  18. Luo, X.; Yuan, X.; Zhu, S.; Xu, Z.; Meng, L.; Peng, J. A hybrid support vector regression framework for streamflow forecast. J. Hydrol. 2019, 568, 184–193. [Google Scholar] [CrossRef]
  19. Douvinet, J.; Serra-Llobet, A.; Radke, J.; Kondolf, M. Quels enseignements tirer des coulées de débris post-incendie survenues le 9 janvier 2018 à Montecito (Californie, USA)? La Houille Blanche 2020, 106, 25–35. [Google Scholar] [CrossRef]
  20. Lang, M.; Arnaud, P.; Carreau, J.; Deaux, N.; Dezileau, L.; Garavaglia, F.; Latapie, A.; Neppel, L.; Paquet, E.; Renard, B.; et al. Résultats du projet ExtraFlo (ANR 2009-2013) sur l’estimation des pluies et crues extrêmes. La Houille Blanche 2014, 2, 5–13. [Google Scholar] [CrossRef]
  21. Viatgé, J.; Berthet, L.; Marty, R.; Bourgin, F.; Piotte, O.; Ramos, M.-H.; Perrin, C. Vers une production en temps réel d’intervalles prédictifs associés aux prévisions de crue dans Vigicrues en France. La Houille Blanche 2019, 105, 63–71. [Google Scholar] [CrossRef]
  22. Hosseiny, H. A deep learning model for predicting river flood depth and extent. Environ. Model. Softw. 2021, 145, 105–186. [Google Scholar] [CrossRef]
  23. Ji, H.; Chen, Y.; Fang, G.; Li, Z.; Duan, W.; Zhang, Q. Adaptability of machine learning methods and hydrological models to discharge simulations in data-sparse glaciated watersheds. J. Arid Land 2021, 13, 549–567. [Google Scholar] [CrossRef]
  24. Maier, H.R.; Dandy, G.C. Neural networks for the forecasting and forecasting of water resources variables: A review of modeling issues and applications. Environ. Model. Softw. 2000, 15, 101–124. [Google Scholar] [CrossRef]
  25. Malik, A.; Kumar, A.; Tikhamarine, Y.; Souag-Gamane, D.; Kişi, Ö. Hybrid artificial intelligence models for predicting daily runoff. In Advances in Streamflow Forecasting; Sharma, P., Machiwal, D., Eds.; Elsevier: Amsterdam, The Netherlands, 2021; Chapter 12; pp. 305–309. [Google Scholar]
  26. Le Barbé, L.; Alé, G.; Millet, B.; Texier, H.; Borel, Y.; Gualde, R. Les Ressources en eaux Superficielles de la République du Bénin; Orstom: Paris, France, 1993; p. 540. [Google Scholar]
  27. Mama, D.; Deluchat, V.; Bowen, J.; Chouti, W.; Yao, B.; Gnon, B.; Baudu, M. Caractérisation d’un Système Lagunaire en Zone Tropicale: Cas du lac Nokoué (Bénin). Eur. J. Sci. Res. 2011, 56, 516–528. [Google Scholar]
  28. Djihouessi, M.B.; Aina, M.P. A review of hydrodynamics and water quality of Lake Nokoué: Current state of knowledge and prospects for further research. Reg. Stud. Mar. Sci. 2018, 17, 2352–4855. [Google Scholar] [CrossRef]
  29. Texier, H.; Colleuil, B.; Profizi, J.P.; Dossou, C. Le lac Nokoué, Environnement du Domaine Margino-Littoral Sud-Béninois: Bathymétrie, Lithofaciès, Salinité, Mollusque et Peuplements Végétaux; No. 28; 1980; pp. 115–142. [Google Scholar]
  30. Tore, D.B.; Alamou, A.E.; Obada, E.; Biao, E.I.; Zandagba, E.B.J. Assessment of Intra-Seasonal Variability and Trends of Precipitations in a Climate Change Framework in West Africa. Atmos. Clim. Sci. 2022, 12, 150–171. [Google Scholar] [CrossRef]
  31. Sedai, A.; Dhakal, R.; Gautam, S.; Dhamala, A.; Bilbao, A.; Wang, Q.; Wigington, A.; Pol, S. Performance Analysis of Statistical, Machine Learning and Deep Learning Models in Long-Term Forecasting of Solar Power Production. Forecasting 2023, 5, 256–284. [Google Scholar] [CrossRef]
  32. Murray, K.; Rossi, A.; Carraro, D.; Visentin, A. On Forecasting Cryptocurrency Prices: A Comparison of Machine Learning, Deep Learning, and Ensembles. Forecasting 2023, 5, 196–209. [Google Scholar] [CrossRef]
  33. Zhu, X.; Guo, H.; Huang, J.J.; Tian, S.; Xu, W.; Mai, Y. An ensemble machine learning model for water quality estimation in coastal areas based on remote sensing imagery. J. Environ. Manag. 2022, 323, 116–187. [Google Scholar] [CrossRef]
  34. Wood, M.; Ogliari, E.; Nespoli, A.; Simpkins, T.; Leva, S. Day Ahead Electric Load Forecast: A Comprehensive LSTM-EMD Methodology and Several Diverse Case Studies. Forecasting 2023, 5, 297–314. [Google Scholar] [CrossRef]
  35. Ömer Faruk, D. A hybrid neural network and ARIMA model for water quality time series forecasting. Eng. Appl. Artif. Intell. 2010, 23, 586–594. [Google Scholar] [CrossRef]
  36. Sharma, P.; Machiwal, D. Streamflow forecasting: Overview of advances in data-driven techniques. In Advances in Streamflow Forecasting; Sharma, P., Machiwal, D., Eds.; Elsevier: Amsterdam, The Netherlands, 2021; Chapter 1; pp. 1–50. [Google Scholar]
  37. Avahouin, C.N.N.; Vodounon, H.S.T.; Amoussou, E. Variabilité climatique et production halieutique du lac Nokoué dans les Aguégués au Bénin. Ann. UP, Série Sci. Nat. Agron. 2018, 8, 51–61. [Google Scholar]
  38. Gildas, K.A.; Bernard, A.; Amédée, C.; Abraham, A.; Firminn, A.; Expédit, V. Variabilité Pluvio-Hydrologique et Incidences sur les Eaux de Surface dans la Basse Vallée de l’Ouémé au Sud-Est Bénin. Int. J. Progress. Sci. Technol. (IJPSAT) 2020, 23, 52–65. [Google Scholar]
  39. Siou, L.K.A.; Johannet, A.; Borrell, V.; Pistre, S. Complexity selection of a neural network model for karst flood forecasting: The case of the Lez Basin (southern France). J. Hydrol. 2011, 403, 367–380. [Google Scholar] [CrossRef]
  40. Hu, C.; Wu, Q.; Li, H.; Jian, S.; Li, N.; Lou, Z. Deep learning with a long short-term memory networks approach for rainfall-runoff simulation. Water 2018, 10, 1543. [Google Scholar] [CrossRef]
  41. Thapa, S.; Zhao, Z.; Li, B.; Lu, L.; Fu, D.; Shi, X.; Qi, H. Snowmelt-driven streamflow forecasting using machine learning techniques (LSTM, NARX, GPR, and SVR). Water 2020, 12, 1734. [Google Scholar] [CrossRef]
  42. Ni, L.; Wang, D.; Singh, V.P.; Wu, J.; Wang, Y.; Tao, Y.; Zhang, J. Streamflow and rainfall forecasting by two long short-term memory-based models. J. Hydrol. 2020, 583, 124296. [Google Scholar] [CrossRef]
  43. Luo, B.; Fang, Y.; Wang, H.; Zang, D. Reservoir Inflow Forecasting Using a Hybrid Model based on Deep Learning. In Proceedings of the IOP Conference Series: Materials Science and Engineering, Shanghai, China, 26–28 April 2019; Volume 715, p. 012044. [Google Scholar]
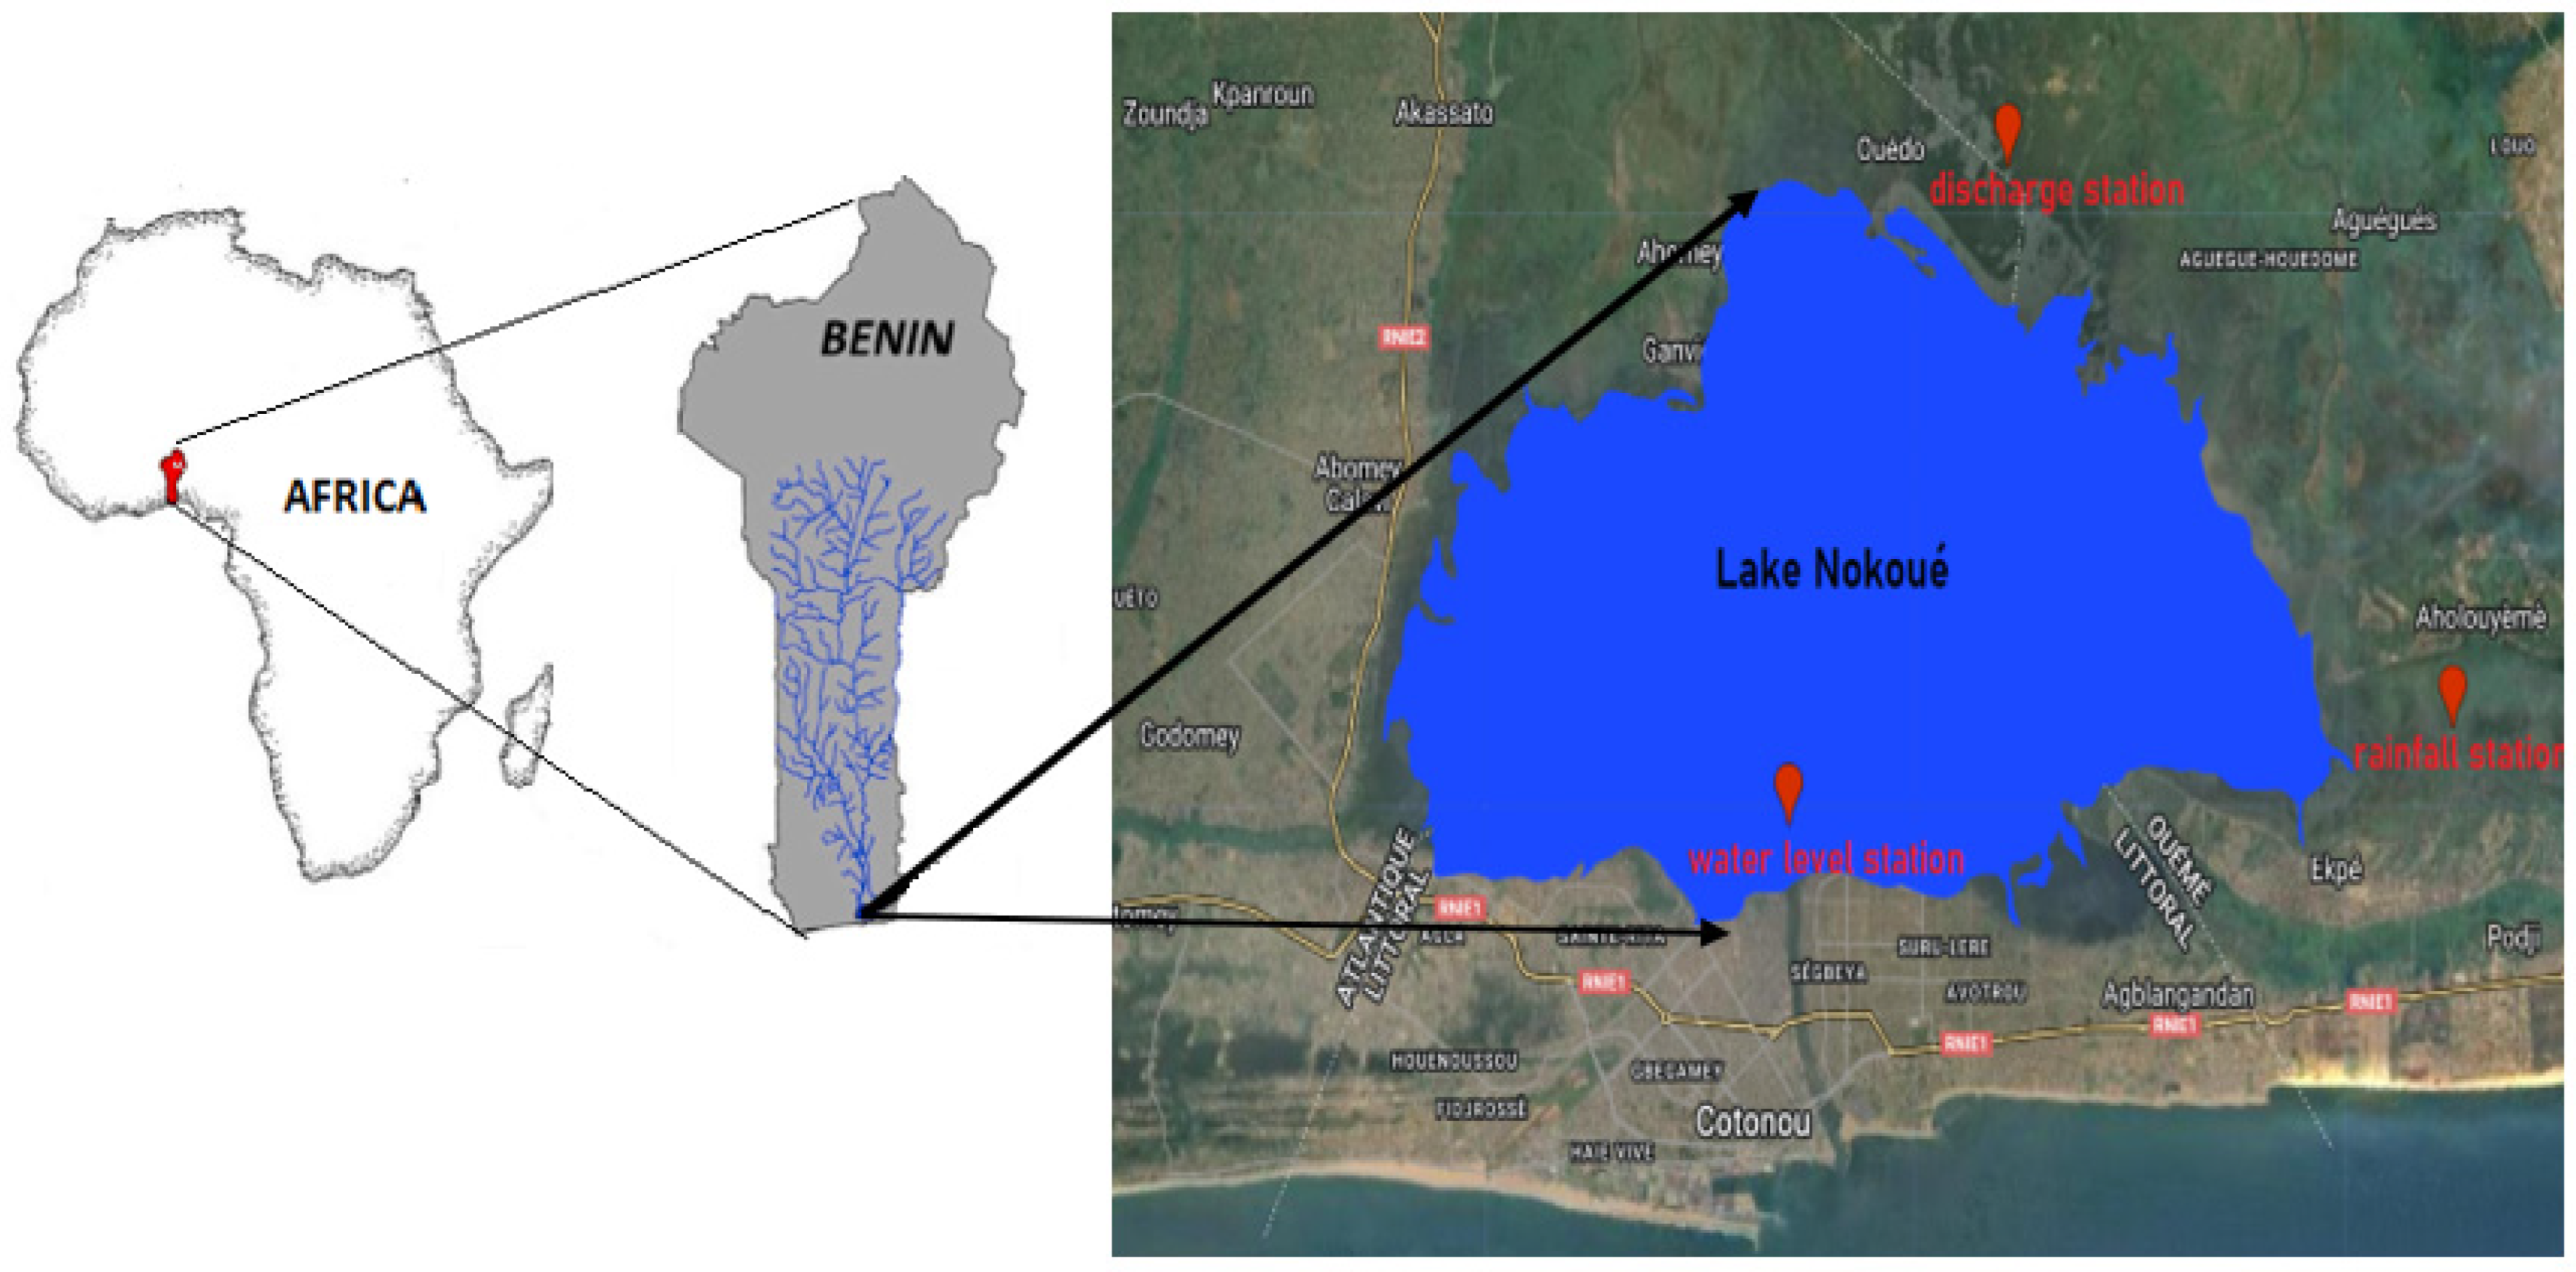
Figure 1. Location map of the Lake Nokoué.
Hydrology 11 00161 g001
Figure 2. Internal architecture of an LSTM cell (fully connected layer).
Hydrology 11 00161 g002
Figure 3. Water level of Lake Nokoué (Output variable).
Hydrology 11 00161 g003
Figure 4. Rainfall and discharge (selected input variables).
Hydrology 11 00161 g004
Figure 5. Comparison of the loss function during the calibration and validation phase.
Hydrology 11 00161 g005
Figure 6. (a) Combined training and testing phase of the LSTM model; (b) Separated training and testing phase of the LSTM model.
Hydrology 11 00161 g006
Figure 7. (a) Comparison between observed water levels and water levels predicted by the LSTM model during the calibration phase; (b) correlation and residual error during the calibration phase.
Hydrology 11 00161 g007
Figure 8. (a) Comparison between observed water levels and water levels predicted by the LSTM model during the validation phase; (b) correlation and residual error during the validation phase.
Hydrology 11 00161 g008
Table 1. Statistics of all variables.
StatisticsRainfallDischargeWater Level
mean3.392219.1133.173
std10.852318.6700.195
min0.0000.6102.736
25%0.0008.2253.045
50%0.00025.5903.115
75%0.200376.9003.257
max158.2001064.0003.981
Table 2. Performance metrics values for different Forecasting Horizons.
Forecast Horizon Training Step Testing Step
RMSENSER2MAERMSENSER2MAE
t + 1 day0.030.980.980.020.040.970.970.03
t + 2 days0.030.980.980.020.040.970.970.03
t + 3 days0.030.980.980.020.040.970.970.02
t + 4 days0.030.940.980.020.030.960.970.02
t + 5 days0.030.980.980.020.03 0.970.970.02
t + 10 days0.030.920.970.020.040.900.960.03
Disclaimer/Publisher’s Note: The statements, opinions and data contained in all publications are solely those of the individual author(s) and contributor(s) and not of MDPI and/or the editor(s). MDPI and/or the editor(s) disclaim responsibility for any injury to people or property resulting from any ideas, methods, instructions or products referred to in the content.